
95% of researchers rate our articles as excellent or good
Learn more about the work of our research integrity team to safeguard the quality of each article we publish.
Find out more
ORIGINAL RESEARCH article
Front. For. Glob. Change , 08 January 2024
Sec. Forest Growth
Volume 6 - 2023 | https://doi.org/10.3389/ffgc.2023.1339726
This article is part of the Research Topic Response of Plant Functional Traits to Environments and Their Roles in Ecosystem Processes View all 8 articles
 Minghui Wang1,2,3
 Wande Liu1,2,3*
 Zhaoquan Chen1,2,3
 Shuaifeng Li1,2,3
 Xiaobo Huang1,2,3
 Zihan Hu1,2,3Ruiguang Shang1,2,3*
Introduction: Revealing the spatial distribution pattern and formation mechanism of species in a community can provide important clues for community renewal, succession, and diversity maintenance mechanisms.
Methods: In this study, we employed spatial point process modeling to identify and quantify the processes contributing to the spatial distribution of species. Simultaneously, we explored the relationship between functional traits and species spatial distribution characteristics in conjunction with phylogenetic studies.
Results: The results revealed that the LGCP model effectively described all species, indicating that the spatial pattern of species may be influenced by a combination of environmental filtering and dispersal limitation. Disparities in species spatial distribution were elucidated by characterizing functional traits, such as body size and resource conservation. Incorporating phylogenetic information enhanced the predictive capacity of functional traits in explaining species spatial distribution.
Discussion: This study underscores the significance of the joint effects of environmental filtering and dispersal limitation in generating species spatial distribution patterns. Integrating spatial point process models with considerations of functional traits and phylogeny proves to be an effective approach for comprehending the mechanisms governing species combinations.
In forest ecosystems, the majority of woody plant species exhibit spatially aggregated distribution patterns (Condit et al., 2000; Plotkin et al., 2002). Understanding the mechanisms underlying this aggregation is essential for gaining insights into the structure and function of plant communities (Li et al., 2009). It is generally believed that environmental filtering and dispersal limitation jointly contribute the aggregation of trees (Li et al., 2009; Kraft et al., 2015; Asefa et al., 2020). Environmental filtering is a niche-based process that can shape the aggregation and distribution of species by selectively influencing their distribution and survival (Lin et al., 2011). Dispersal limitation is considered a neutral process that can cause aggregation of trees in space by limiting their propagules dispersal distance (Lin et al., 2011).
In any forest community, the joint impact of environmental filtering and dispersal limitation strongly influences the spatial distribution pattern of species. Consequently, checking and quantifying the effects of multiple ecological processes, on species spatial distribution remains a complex challenge (Bagchi et al., 2011). Although numerous functions have been employed to describe the spatial structure of point patterns in ecology, facilitating the understanding of underlying ecological processes, they often fall short in characterizing the spatial distribution of single species or multi-species combinations (Brown et al., 2013). Spatial point process models offer a novel method to analyze the spatial distribution of individuals through a single process or multiple processes, providing more accurate estimates of the combined effects of environmental filtering and dispersal limitation (Brown et al., 2013; Shen et al., 2013; Wiegand and Moloney, 2013; Wiegand et al., 2013).
Functional traits of species are crucial factors influencing the spatial distribution pattern and dynamics of species (Lin et al., 2011; McFadden et al., 2019; Beyns et al., 2021). Understanding how functional traits regulate the strength of the connection between species and habitat and the degree of dispersal limitation is another pivotal aspect of species spatial distribution (McFadden et al., 2019). Some spatial distribution characteristics, particularly those related to seed dispersal syndrome, are influenced by functional traits (Beyns et al., 2021). For instance, species dispersed by wind typically exhibit stronger spatial aggregation than those dispersed by animals. Seed mass represents aspects of dispersal ability, seed yield, seed longevity, and partial competition ability of species at the seedling stage (Seidler and Plotkin, 2006; Ramon et al., 2018; Beyns et al., 2021). Greater seed mass correlates with shorter dispersal distances, leading to increased aggregation intensity (Thomson et al., 2011). Plant height and leaf area reflect a species' ability to intercept light and dominate the vegetation layer. Taller plants with larger leaf areas have advantages in resource acquisition, especially light resources, promoting their reproduction and inhibiting the growth of low light-loving plants (King, 1990). Additionally, taller plants can avoid competition with parent plants through long-distance seed dispersal mechanisms, resulting in lower aggregation intensity (Janzen, 1970). Wood density's influence on species spatial distribution patterns is subject to two opposing explanations. One theory posits that species with low wood density, characterized by fast growth rates, can quickly occupy gaps in the forest, resulting in aggregation distribution. Conversely, another theory suggests that species with high wood density, growing slowly and primarily in the sapling stage, exhibit strong germination abilities, leading to aggregation (Enquist et al., 1999; Muller-Landau et al., 2008; Flügge et al., 2012). Therefore, the combination of spatial distribution characteristics and functional traits can more comprehensively understand the driving factors of spatial aggregation distribution of community.
Seed mass, specific leaf area, and wood density are recognized as phylogenetically conservative species traits (Judd et al., 1999; Seri and Shnerb, 2015). The conservation theory of ecological niche system development suggests that species with close phylogenetic relationships usually have similar functional traits (Seri and Shnerb, 2015). In addition, species with distant relationships also exhibit distant similarity when facing similar environmental selection pressures or having similar ecological niches, and these populations tend to exhibit more similar spatial distribution patterns (Valiente-Banuet, 2007). Moreover, phylogenetic information contains additional nuances beyond the few measured functional traits, potentially yielding divergent results (Ackerly, 2003; Parker et al., 2012; Gerhold et al., 2015). This underscores the importance of considering phylogenetics even when functional traits exhibit a strong predictive effect. Recent studies have emphasized the necessity of considering phylogenetic relationships when evaluating the contribution of species functional characteristics to population spatial distribution patterns (Parker et al., 2012; Chen et al., 2017; Li et al., 2017). However, it has been demonstrated that incorporating species phylogenetic relationships enhances our understanding of the ecological relevance of functional traits and the mechanisms of community construction from an evolutionary perspective (Li and Ives, 2017).
Here, we focused on a 30ha subtropical monsoon evergreen broad-leaved forest dynamic monitoring sample plot to investigate how environmental filtration and dispersal limitation drive species spatial distribution, considering the perspectives of functional traits and phylogeny. Initially, spatial point process models were employed to detect and quantify the impact of environmental filtering and dispersal limitations on the spatial distribution pattern of species. Subsequently, phylogenetic analyses were integrated to assess whether functional traits correlated with changes in process intensity inferred from spatial models. The study addressed three specific questions: (1) Do environmental filtration and dispersal limitation interact to influence the spatial distribution pattern of species? (2) Do specific functional traits contribute to the spatial distribution of species? (3) Can phylogeny, to some extent, explain the changes in key characteristics of species spatial structure? Additionally, does the consideration of phylogenetic information enhance the predictive ability of functional traits on species spatial distribution?
The study was carried in the Taiyanghe Provincial Nature Reserve (22°30′–22°38′N, 101°7′–101°15′E) in the southern part of Simao District, Pu'er City, Yunnan Province. This region has an extremely rich species composition, with the ecological appearance of tropical forests and significant tropical Asian phylogenetic relationships. But the increasing agriculture activities are leading to a gradual decrease in the distribution area of forests (Li et al., 2020). The climate in this region is obviously affected by the warm and wet air of the southwest monsoon of the Indian Ocean, and the subtropical plateau monsoon climate is obvious, with distinct dry and wet seasons. The annual average temperature is 17.7°C and the annual precipitation is 1,547.6 mm, mainly concentrated in the rainy season from May to October (Wang et al., 2020).
The monsoon evergreen broad-leaved forest is one of the most complex, productive, and species rich zonal vegetations in China. The most conspicuous tree species in the region include Castanopsis echidnocarpa and Lithocarpus fenestratus (Fagaceae), as well as Machilus rufipes and Litsea rubescens (Lauraceae). The topography in the study plot is relatively complex, including two valleys and a ridge that runs southwest. Altitude varies between 1,467 to 1,586 m, with an average of 1,523 m. The primary soil types are coarse lateritic red earth, purplish lateritic red earth, and yellow lateritic red earth (Wang et al., 2020). Although we have not yet studied the seed spreaders in the community, the plot hosts many mammals and birds, some of which are potential seed dispersers (Li et al., 2020).
To investigate the ecological aspects of the monsoon evergreen broad-leaved forest, our research team established a 30 ha forest dynamics plot within the experimental zone of the reserve in 2019, following the standard guidelines of the Center for Tropical Forest Science (CTFS) (Wang et al., 2020). The plot was divided into 750 contiguous quadrats of 20 m × 20 m, where all stems with DBH≥1cm were mapped using GPS, measure each tree, and hang tags for long-term monitoring, recording their identification number, species name, diameter at breast height, tree height and coordinates. According to the 2018–2019 census, the plot contained 154,372 individuals belonging to 78 families, 178 genera, and 271 species (Li et al., 2020). Based on stem number, the plot is dominated by C. echidnocarpa (Fagaceae, 20.6%) and L. fenestratus (Fagaceae, 11.8%). Other important species include M. rufipes (Lauraceae, 5.35%), Castanopsis calathiformis (Fagaceae, 4.92%), Lithocarpus truncates (Fagaceae, 4.4%), and L. rubescens (Lauraceae, 4.07%).
To meet the sample size requirements of point-pattern analyses, we focused on the 97 species with 70 or more individuals in the 30 ha forest dynamics plot, collectively accounting for over 95% of stems (McFadden et al., 2019).
Evaluate the impact of environmental filtering and dispersal limitation on species distribution patterns using Topographical and soil variables. Collect soil samples using the five point sampling method for each subplot (Wang et al., 2022). A total of 750 soil samples were taken, measuring soil organic carbon, soil total nitrogen, soil total phosphorus, soil total potassium, soil hydrolysable nitrogen, soil available phosphorus, and soil available potassium. Details can be found in Wang et al. (2022). Mean elevation and slope for each 20 m × 20 m quadrat in our forest dynamics plots were calculated as topographic variables (Li et al., 2015).
We gathered data on 10 plant functional traits essential to the plant strategy scheme: leaf area, maximum DBH, potential maximum tree height, specific leaf area, wood density, seed mass, leaf total phosphorus content, leaf total nitrogen content, leaf total carbon content, and dry matter content. These functional traits can influence the spatial distribution of species through their involvement in seed dispersal, tree establishment, and persistence (Condit et al., 2000). We sampled all species distributed in the region and collected trait data from at least 20 individuals of each species. We determined the trait values by calculating the median across all individuals of each species (for SLA and seed mass, etc.) and using the maximum recorded value for height and DBH. Fully expanded, undamaged leaves from canopies exposed to direct sunlight were collected, and these functional traits were measured in the laboratory following the method outlined by Perez-Harguindeguy et al. (2016). For specific measurement steps, please refer to Wang et al. (2022). For certain species that did not produce fruit during field surveys, we obtained data from various databases and literature reviews (Wang et al., 2018; Wolf et al., 2022).
According to the life form classification system (Cai and Song, 2000), all species were categorized into trees, shrubs, and lianas. Dispersal syndromes of the species were determined based on the morphological size of seeds and fruits obtained from field surveys and published descriptions of plant communities (Chen et al., 2014) (see Supplementary Table S1). The dispersal syndromes were classified as gravity-ballistic dispersal, wind dispersal, and animal dispersal (see Supplementary Table S2). Berries are typically spread by birds during feeding and subsequent excretion, while nuts are commonly transported and dispersed by small mammals. Among the species preyed upon by animals, we classified them according to fruit diameter (Hubbell, 1979): A1 (< 6 mm diameter, n = 14 species), A2 (6–12 mm diameter, n = 25 species), and A3 (>12 mm diameter, n = 19 species). Differences in the spatial distribution of species with different life forms and dispersal syndromes were compared using analysis of variance.
All statistical analyses in this study were conducted in R 4.2 (R Core Team, 2023). Prior to further analysis, normalization was performed on the environmental variables and functional trait values. Simultaneously, to evaluate the impact of environmental factors on species distribution, topographic and soil attributes plotted at a resolution of 20 m × 20 m were used (see Supplementary Figure S1). Specifically, we performed principal component analyses for these soil variables and found that the first two principal components captured 53.9% variation of the eight soil variables. The first two PCA axes were selected to represent the soil variables that representing total storage in soil (axis 1) and nutrients that can be directly utilized by plants (axis 2, see Supplementary Figure S1).
We used Completely Random Processes and Logistic Gaussian-Cox Processes to model all tree in the plot. The pair correlation function, the L function, and the empty space function are recommended for spatial summary statistics to identify specific scales of deviation from a null model. The pair correlation function g(r) is used to measure the correlation between different locations in geographic space that describes the degree of similarity in attribute values between two positions within a certain distance range; the L-function describes the relationship between the average distance between points in a point pattern within a certain distance range and the expected average distance under random distribution, and the empty space function reveals spatial heterogeneity and clustering degree in geospatial data by measuring the number and size of blank areas within different distance ranges, The specific characteristics of these functions can be seen in Wiegand et al. (2013) and Baddeley et al. (2015). We applied the Benjamini-Hochberg correction for multiple comparisons when determining the significance of differences (McFadden et al., 2019).
Initially, we employed the complete random process (CSR) model to assess nonrandom spatial structure across various scales in species distribution. The CSR model assumes no interaction between points and does not consider potential biological processes influencing the spatial distribution of species, indicating complete randomness in species dispersion. For further details of the CSR model and its applications, refer to Wiegand et al. (2013). If a species did not significantly differ from the CSR null model, we did not estimate habitat associations or clustering parameters. For species showing significant non-random spatial structures, we employed the following logarithmic Gaussian-Cox process model with random intensity functions (Shen et al., 2013) Equation (1):
In the LGCP model, μ represents the intercept, βi(x) is the vector of correlation coefficient, Hi(x) signifies the vector of habitat variables at the spatial location u, and D(x) is employed as the “residual effect” to account for additional clustering independent of habitat association (Minasny and McBratney, 2005). The LGCP model integrates the effects of habitat heterogeneity and other clustering processes simultaneously, allowing the consideration of one term when estimating the effect of the other (Shen et al., 2013). The LGCP model employs a Matern covariance function (MCF) to estimate average cluster size and clustering intensity, while updating association coefficients for environmental attributes based on pair correlation or additional clustering (Waagepetersen and Guan, 2009). Among them, the model's goodness of fit was assessed using paired correlation functions. To delve into the specifics of the LGCP model, consult the works of Waagepetersen and Guan (2009) and Shen et al. (2013).
The phylogenetic tree of the 97 species in this study was constructed using the latest seed plant tree by Smith and Brown (2018). This tree combines genetic data from a public repository (GenBank) with phylogenetic data (Open Tree of Life Project) to create the latest phylogenetic tree for seed plants (Smith and Brown, 2018). To assess the similarity of functional traits among closely related species, the Binomberg's statistic K was used to evaluate the phylogenetic signal, with significance assessed by comparing the K observations with the results of 1,000 tip-shuffling randomizations (Blomberg et al., 2003).
A pairwise correlation analysis between the functional trait dataset and six spatial parameters in the Spatial Point Process Model was conducted to determine whether functional traits could predict the spatial distribution characteristics of different species. To incorporate phylogenetic information into the association between functional traits and species spatial distribution characteristics, phylogenetic generalized linear models (PGLMs) were employed. This model combines the generalized linear model with the phylogenetic tree, capturing the genetic relationship between species by introducing the topology and branch length of the phylogenetic tree. The topology of the phylogenetic tree was used as an additional explanatory variable to consider the impact of phylogenetic relationships between species on species spatial distribution characteristics, providing control group residuals without phylogenetic information in the results (Freckleton et al., 2002). The BIC model was used to screen variables to find the most suitable functional trait combination, followed by maximum likelihood comparison when adjusting the branch length of the phylogenetic tree, and selecting the optimal branch length.
We observed significant differences between all selected species and the CSR zero model, suggesting that all species exhibited non-random spatial structures. Three spatial parameters were obtained for all species in the LGCP model: β, α, and σ2 (see Supplementary Data S1). The environmental association coefficient in the LGCP model represents the environmental filtering effect, reflecting the species' responsiveness to environmental factors. All species showed significant correlations with one or more of the four environmental attributes (see Figure 1). The average cluster size and average aggregation intensity are parameters describing the diffusion limiting effect in the LGCP model. The average cluster size reflects the average distribution density of species without the influence of environmental factors and spatial correlations, while the average aggregation intensity reflects the degree of aggregation or dispersion of species in space. The average aggregation intensity (σ2) ranged from 2.33 × 10⁻⁸ (Lithocarpus annamensis) to 7.57 (Illicium micranthum), and the average cluster size (α) ranged from 0.4 m (L. fenestratus) to 138.9 m (Maesa permollis), indicating a wide range of dispersal ability between species.
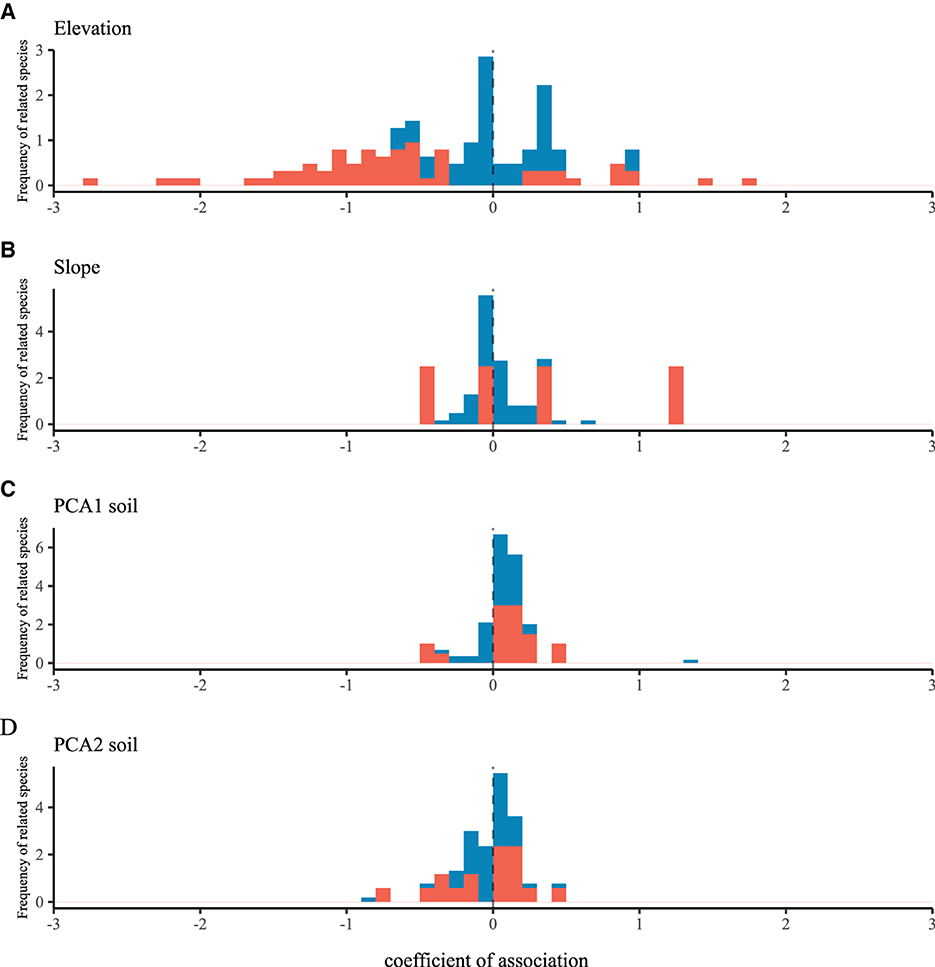
Figure 1. The frequency distribution graph of species-habitat associations for four environmental attributes [labeled as (A–D)] is shown. Species with a significant positive or negative association (95% confidence interval does not overlap with zero) are highlighted in red, while species with no significant association (confidence interval overlaps with zero) are shown in blue. Please refer to see Supplementary Figure S3 for the complete confidence interval plot.
In our analysis, the spatial characteristics of species distribution did not consistently show significant differences between species life history traits (life form and dispersal syndrome; see Figure 2). There was a significant difference in mean aggregation intensity among different life forms (p = 0.033), with tree species (mean = 2.30, SE = 1.44) having a lower mean aggregation intensity than shrub species (mean = 3.26, SE = 1.86) and liana species (mean = 3.23, SE = 1.43), but no significant difference in mean cluster size among different life forms (p = 0.49). There were no significant differences in mean aggregation intensity and mean cluster size among different dispersal syndromes (p = 0.88, p = 0.81). Furthermore, there were no significant differences in environmental correlation coefficients among different life forms and different dispersal syndromes.
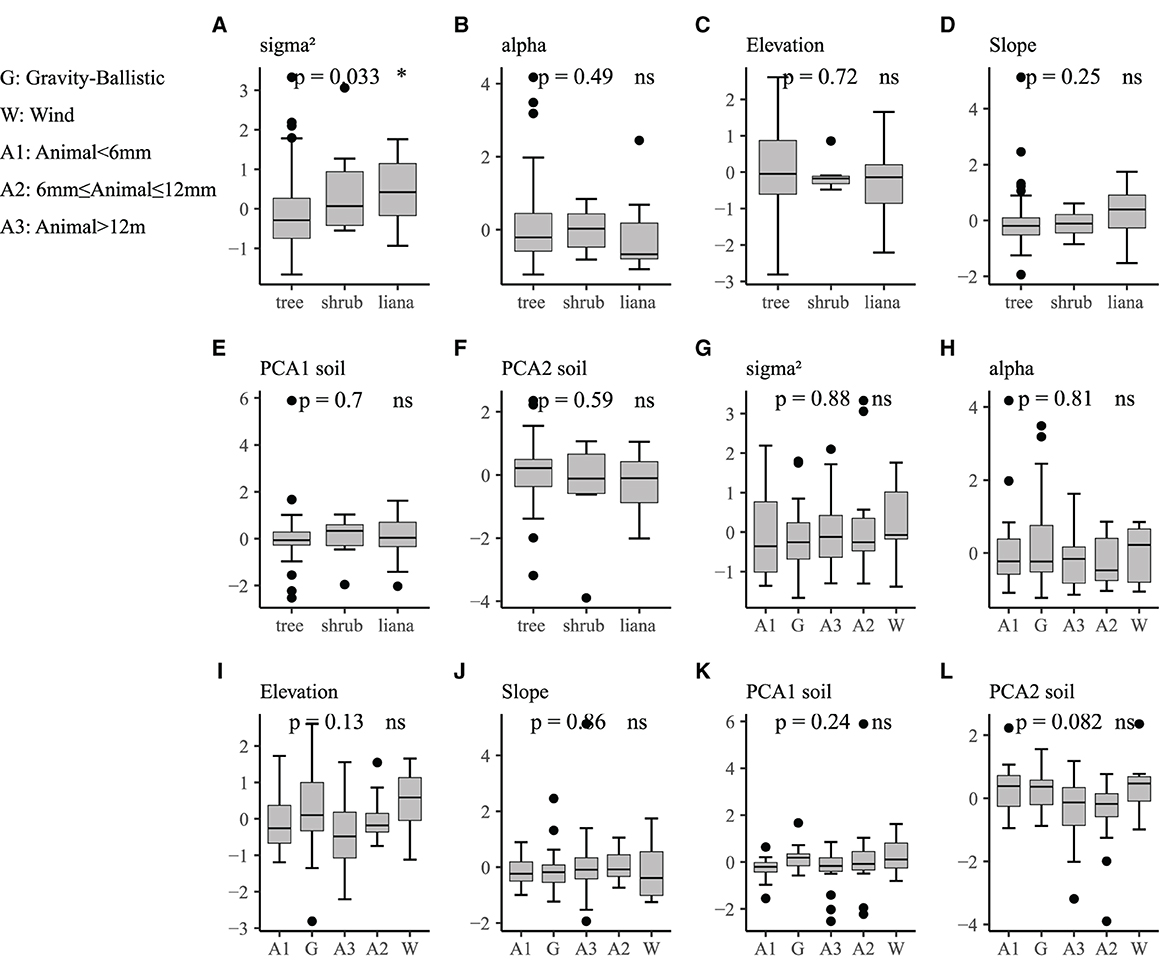
Figure 2. Boxplots comparing spatial characteristics of species across the dispersal syndrome and life form. (A–F) The impact of different life forms on spatial characteristics, with a significant transition from trees to shrubs and then to climbers in terms of average aggregation intensity. (G–L) The effects of different dispersal syndrome on spatial characteristics, but no significant differences were observed. ns represents non-significant results. The bold horizontal lines indicate the median, and the boxes represent the interquartile range (IQR).
The pairwise correlations between individual functional traits and model parameters related to environmental filtering and diffusion constraints were weak (see Table 1), and only potential maximum height and maximum diameter at breast height were significantly negatively correlated with average aggregate intensity (see Figure 3). Potential maximum height, maximum diameter at breast height, leaf area, and leaf nutrient content are significantly correlated with certain environmental correlation coefficients.
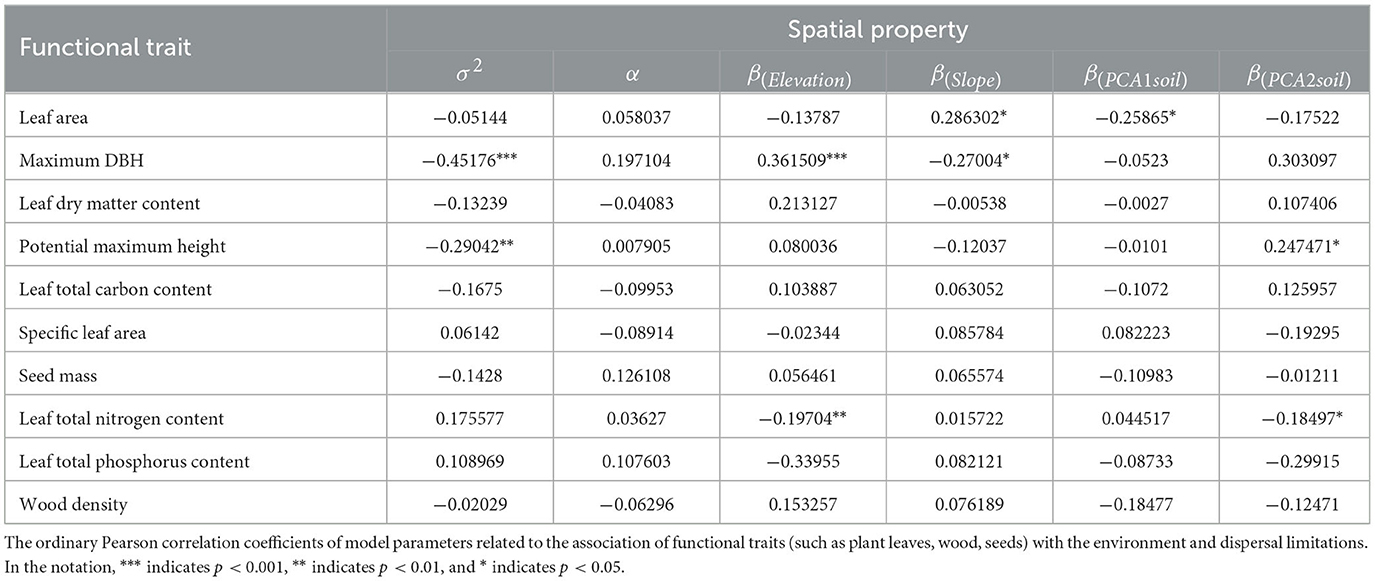
Table 1. The relationship between functional traits and spatial attributes.
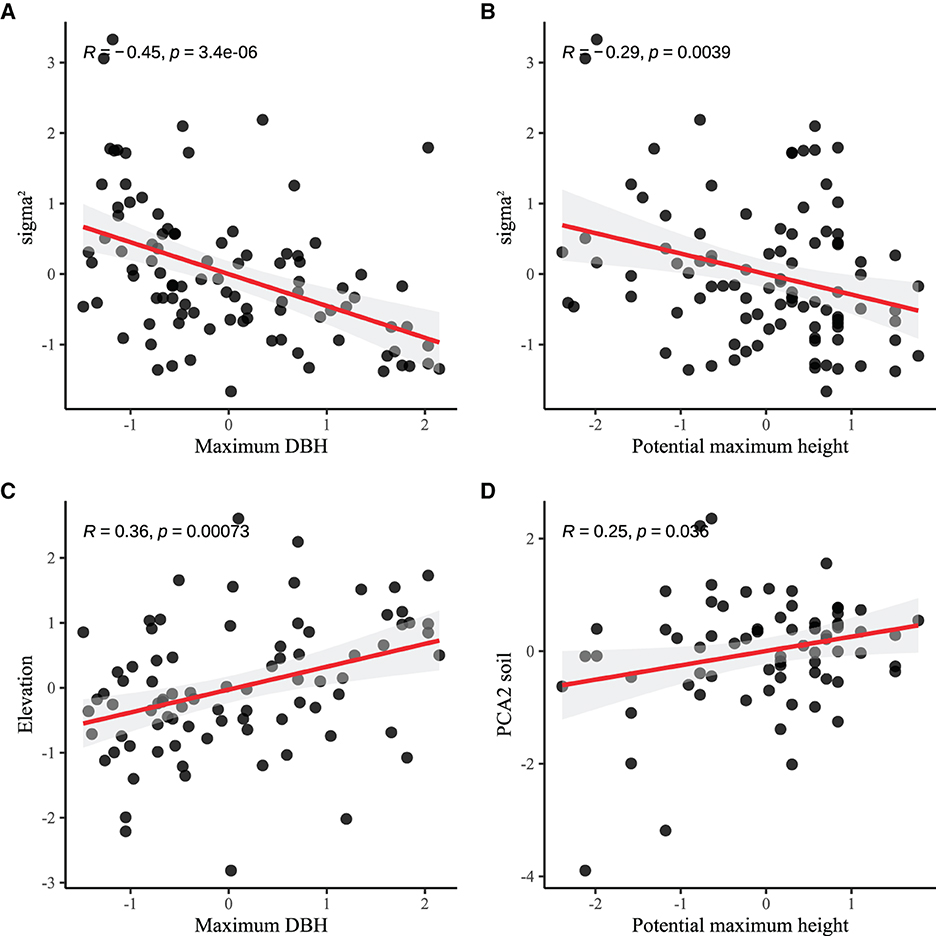
Figure 3. Functional traits are related to the spatial attributes among species. (A, B) Maximum DBH and potential maximum height are negatively correlated with σ2, indicating that larger-sized species have lower aggregation intensity. (C, D) Species positively correlated with elevation and soil nutrients, that is, species in high-altitude areas or areas with abundant soil nutrients have larger body sizes. The red line represents the ordinary linear regression fit, and the gray transparent area indicates the 95% confidence interval.
Phylogenetic signals analysis showed that the phylogenetic signals of the selected 10 functional traits were weak, but most of them still had a certain degree of significance (see Supplementary Figure S4, Supplementary Table S3). The K values ranged from 0.10 to 0.24, indicating that the phylogenetic signals were higher than the expected signals by chance but lower than the expected signals under the Brownian motion evolution model (Blomberg et al., 2003).
The phylogenetic generalized linear model with multiple trait combinations improved its predictive ability to some extent (see Table 2). For example, species with more resource-conservative traits (lower specific leaf area and leaf dry matter content) often exhibited stronger clustering strength (R2 = 0.34). Additionally, the residual of systematic development was smaller than that of non-systematic development, suggesting that the model's fitting effect is better when considering the phylogenetic correlation between species. This indicates that phylogenetic correlations significantly impact explaining differences in species spatial distribution.
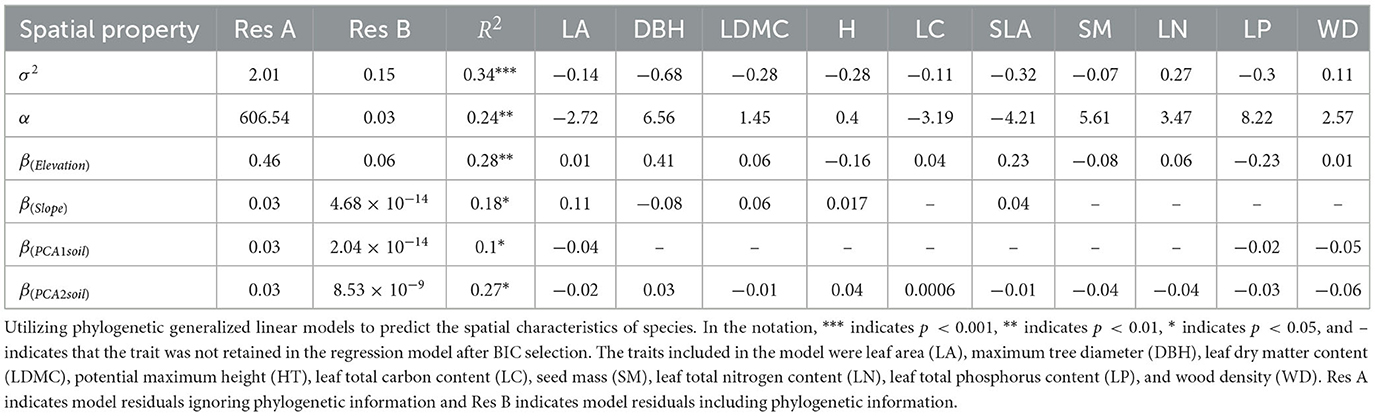
Table 2. Coefficients of multivariate regression model.
All species were well described by the LGCP model, indicating that both environmental filtering and dispersal limitation influenced the spatial distribution pattern of species in the current forest. This joint effect has been demonstrated in many forests. Research in subtropical forests in China and tropical forests in Panama has emphasized the significance of the combined impact of environmental filtering and dispersal limitation on the species-area curve (Shen et al., 2009). Likewise, indications of environmental filtering and dispersal limitation have been observed in a natural temperate forest in Belgium (Beyns et al., 2021). The significant role of dispersal limitation in this forest may be partly attributed to the presence of numerous young trees in the community. Pioneer species like Betula alnoides and Wendlandia tinctoria coexist with late-successional species such as Anneslea fragrans, nearly half of the individuals in the plot are juveniles, indicating that dispersal limitation influences the initial spatial clustering of species, while environmental filtering may require time to visibly impact species distribution (Shen et al., 2013; Yang et al., 2016; Beyns et al., 2021).
Our finding that functional traits are correlated with spatial properties of species is noteworthy. For example, the aggregation intensity of species attributed to dispersal limitation was related to the maximum potential height. This could be due to tree height limiting the dispersal distance of seeds; tree height was linearly correlated with seed diffusion distance (Thomson et al., 2011). A lower release height will lead to a decrease in seed diffusion distance, resulting in the formation of smaller clusters. Alternatively, lower tree heights may lead to weaker competition for light and nutrient resources, making it easier for species to gather in specific areas. Clark et al. (2018) and McFadden et al. (2019) have shown that the maximum potential tree height is an important functional trait that can predict the average number of individuals in each cluster, and species with smaller body sizes have stronger aggregation intensity. Specific leaf area and leaf dry matter were good predictors for species aggregation intensity; species with lower specific leaf area and leaf dry matter content exhibit stronger aggregation intensity. This may be related to the acquisition and utilization of resources by species, which can more effectively utilize limited resources and thus have a certain advantage in competition (Li et al., 2009; Réjou-Méchain et al., 2011; Clark et al., 2018). This makes them more suitable for gathering in resource-scarce environments to obtain more resources and reduce the intensity of competition. The differences in spatial characteristic parameters among different life forms could be related to trait syndromes (McFadden et al., 2019; Arnell et al., 2021), with shrubs exhibiting a more clustered spatial distribution compared to trees. Shrubs usually have a relatively short growth height and branching structure, allowing them to grow and reproduce in a relatively small space. Additionally, shrubs typically prefer to grow in humid and nutrient-rich environments, which are usually limited (Gunatilleke et al., 2006; Clark et al., 2018). When such an environment arises, shrubs tend to compete for resources and form clusters within the area. These results support that the spatial distribution characteristics of species may be regulated by traits that represent body size and resource conservation.
Species dispersal syndrome is considered an important trait in predicting species spatial distribution (Seidler and Plotkin, 2006; Ramon et al., 2018; Arnell et al., 2021), but no correlation between the two was found in our study. The reasons for this difference are that we used different classification criteria for dispersal syndrome, and the number of species studied was far smaller than in other studies (Seidler and Plotkin, 2006). Furthermore, secondary dispersal due to predators, heavy rain events, and other factors after fruit falling (Guo et al., 2013) could be another reason, but we ignored it in this study. For example, some gravity-dispersed nuts and the pulp of berries that are not preyed upon by birds will be dispersed by mammals after falling. The monsoon evergreen broad-leaved forest studied in this paper has a large amount of rainfall, and the secondary dispersal of seeds caused by the erosion of a large amount of rainwater will have a great impact on the average concentration intensity of species.
Our study's findings indicate that phylogenetic relationships between species may explain differences among species' spatial distribution. A study by Martins et al. (2018) in the Atlantic rainforest of Brazil also confirmed that phylogenetic relationships between species can account for a high proportion (up to 95%) when explaining the degree of population overdispersion or aggregation. The phylogenetic relationship not only reflects the co-evolutionary history and differentiation process of functional traits but also provides a lot of additional information, which is not included in the few functional traits we have measured (Judd et al., 1999; Gerhold et al., 2015). This can increase the model's ability to explain species distribution and improve the accuracy of predictions. In fact, environmental filtering results in phylogenetic clustering, and competition and other negative density-dependent interactions result in phylogenetic overdispersion (Molleman et al., 2023). Even without pinpointing the exact traits or species interactions at a given location,we can still infer the assembly process of a community by observing how coexisting species are dispersed phylogenetically within the community (Gerhold et al., 2015).
The premise that taxonomic or phylogenetic distance may better explain differences between species is based on the assumption that functional traits show phylogenetic signals (Réjou-Méchain et al., 2011; Chhaya et al., 2021; Etienne et al., 2023). However, the phylogenetic signals for most of the functional traits in our analysis were weak. We speculate that due to the small number of species in the same genus in the study, the phylogenetic signal results actually show excessive dispersion or aggregation of functional traits between phylogenetically close genera, rather than species. For example, species belonging to the family Theaceae, such as Anneslea fragrans and Schima wallichii, exhibit very similar spatial distributions. As found by Réjou-Méchain et al. (2011), species with similar phylogenetic development may have similar functional traits, thus exhibiting more similar spatial distribution patterns, which are more significant at taxonomic levels above the species level.
Although the combination of functional traits and phylogenetic information can indicate the relationship between species' functional traits and phylogenetic information and specific ecological processes, further research is still needed on other functional traits that affect the spatial distribution and phylogenetic relationships of species. New functional traits should emphasize resource acquisition and usage, including photosynthesis, respiration rate, and leaf turgor loss point (McFadden et al., 2019), which have been proven to limit the distribution of individuals. At the same time, phylogenetic similarity can be used as a proxy for ecological similarity, uncovering variations in species' spatial distribution and aiding our comprehension of the ecological mechanisms that uphold diverse species communities (Martins et al., 2018).
Spatial point process models can incorporate both environmental filtering and dispersal limitation processes and estimate their effects accurately. When coupled with functional traits, they can reveal indicate which species' functional traits mediate these processes, especially those characterizing size and resource conservatism, which can better reflect the changes in species' spatial distribution. Our results also highlight the importance of phylogenetics to species adaptability and distribution patterns. By considering phylogenetic information, we can better understand the effects of functional traits on species' spatial distribution characteristics. This is helpful for revealing the niche differentiation of species, comparing the validity of different phylogenetic hypotheses, and understanding the impact of geographical environmental factors on species distribution.
The original contributions presented in the study are included in the article/Supplementary material, further inquiries can be directed to the corresponding authors.
MW: Software, Writing – original draft, Writing – review & editing, Investigation, Methodology. WL: Formal analysis, Methodology, Project administration, Writing – review & editing. ZC: Investigation, Writing – review & editing. SL: Investigation, Writing – review & editing. XH: Investigation, Writing – review & editing. ZH: Investigation, Writing – review & editing. RS: Investigation, Project administration, Writing – review & editing.
The author(s) declare financial support was received for the research, authorship, and/or publication of this article. This work was supported by Yunnan Fundamental Research Projects (grant no. 202001AS070005).
We sincerely thank the staff of Taiyanghe Provincial Nature Reserve for their help in the fieldwork. We would like to thank Dr. Welsch Jeremy at the University of Cornell for his assistance with English language.
The authors declare that the research was conducted in the absence of any commercial or financial relationships that could be construed as a potential conflict of interest.
All claims expressed in this article are solely those of the authors and do not necessarily represent those of their affiliated organizations, or those of the publisher, the editors and the reviewers. Any product that may be evaluated in this article, or claim that may be made by its manufacturer, is not guaranteed or endorsed by the publisher.
The Supplementary Material for this article can be found online at: https://www.frontiersin.org/articles/10.3389/ffgc.2023.1339726/full#supplementary-material
Ackerly, D. D. (2003). Community assembly, niche conservatism, and adaptive evolution in changing environments. Int. J. Plant Sci. 164, S165–S184. doi: 10.1086/368401
Arnell, M., Ehrlén, J., and Eriksson, O. (2021). Local distribution patterns of fleshy-fruited woody plants-testing the orchard hypothesis. Ecography 44, 481–492. doi: 10.1111/ecog.05359
Asefa, M., Wen, H.-D., Brown, C., Cao, M., Xu, K., Hu, Y.-H., et al. (2020). Ecological drivers of tree assemblage in tropical, subtropical and subalpine forests. J. Veg. Sci. 31, 107–117. doi: 10.1111/jvs.12819
Baddeley, A., Rubak, E., and Turner, R. (2015). Spatial Point Patterns: Methodology and Applications with R. Boca Raton, FL: CRC press. doi: 10.1201/b19708
Bagchi, R., Henrys, P. A., Brown, P. E., Burslem, D. F. P., Diggle, P. J., Gunatilleke, C. S., et al. (2011). Spatial patterns reveal negative density dependence and habitat associations in tropical trees. Ecology 92, 1723–1729. doi: 10.1890/11-0335.1
Beyns, R., Bauman, D., and Drouet, T. (2021). Fine-scale tree spatial patterns are shaped by dispersal limitation which correlates with functional traits in a natural temperate forest. J. Veg. Sci. 32, e13070. doi: 10.1111/jvs.13070
Blomberg, S. P., Garland Jr, T., and Ives, A. R. (2003). Testing for phylogenetic signal in comparative data: behavioral traits are more labile. Evolution 57, 717–745. doi: 10.1111/j.0014-3820.2003.tb00285.x
Brown, C., Burslem, D., Illian, J., Bao, L., Brockelman, W., Cao, M., et al. (2013). Multispecies coexistence of trees in tropical forests: spatial signals of topographic niche differentiation increase with environmental heterogeneity. Proc. R. Soc. B Biol. Sci. 280, 20130502. doi: 10.1098/rspb.2013.0502
Cai, Y.-L., and Song, Y.-C. (2000). The revision of vine life-form system and analysis of it in the subtropical zone of east china. Acta Ecol. Sin. 20, 7. Available online at: http://europepmc.org/abstract/CBA/533681
Chen, L., Wang, L., Baiketuerhan, Y., Zhang, C., Zhao, X., von Gadow, K., et al. (2014). Seed dispersal and seedling recruitment of trees at different successional stages in a temperate forest in northeastern china. J. Plant Ecol. 7, 337–346. doi: 10.1093/jpe/rtt024
Chen, S.-C., Cornwell, W. K., Zhang, H.-X., and Moles, A. T. (2017). Plants show more flesh in the tropics: variation in fruit type along latitudinal and climatic gradients. Ecography 40, 531–538. doi: 10.1111/ecog.02010
Chhaya, V., Lahiri, S., Jagan, M. A., Mohan, R., Pathaw, N. A., Krishnan, A., et al. (2021). Community bioacoustics: studying acoustic community structure for ecological and conservation insights. Front. Ecol. Evol. 9, 706445. doi: 10.3389/fevo.2021.706445
Clark, A. T., Detto, M., Muller-Landau, H. C., Schnitzer, S. A., Wright, S. J., Condit, R., et al. (2018). Functional traits of tropical trees and lianas explain spatial structure across multiple scales. J. Ecol. 106, 795–806. doi: 10.1111/1365-2745.12804
Condit, R., Ashton, P. S., Baker, P., Bunyavejchewin, S., Gunatilleke, S., Gunatilleke, N., et al. (2000). Spatial patterns in the distribution of tropical tree species. Science 288, 1414–1418. doi: 10.1126/science.288.5470.1414
Enquist, B., West, G. B., Charnov, E. L., and Brown, J. (1999). Allometric scaling of production and life history variation in vascular plants. Nature 401, 907–911. doi: 10.1038/44819
Etienne, R. S., Haegeman, B., Dugo-Cota, Á., Vilà, C., Gonzalez-Voyer, A., and Valente, L. (2023). The phylogenetic limits to diversity-dependent diversification. Syst. Biol. 72, 433–445. doi: 10.1093/sysbio/syac074
Flügge, A. J., Olhede, S. C., and Murrell, D. J. (2012). The memory of spatial patterns: changes in local abundance and aggregation in a tropical forest. Ecology 93, 1540–1549. doi: 10.1890/11-1004.1
Freckleton, R. P., Harvey, P. H., and Pagel, M. (2002). Phylogenetic analysis and comparative data: a test and review of evidence. Am. Nat. 160, 712–726. doi: 10.1086/343873
Gerhold, P., Cahill Jr, J. F., Winter, M., Bartish, I. V., and Prinzing, A. (2015). Phylogenetic patterns are not proxies of community assembly mechanisms (they are far better). Funct. Ecol. 29, 600–614. doi: 10.1111/1365-2435.12425
Gunatilleke, C., Gunatilleke, I., Esufali, S., Harms, K. E., Ashton, P., Burslem, D. F., et al. (2006). Species-habitat associations in a sri lankan dipterocarp forest. J. Trop. Ecol. 22, 371–384. doi: 10.1017/S0266467406003282
Guo, Y., Lu, J., Franklin, S. B., Wang, Q., Xu, Y., Zhang, K., et al. (2013). Spatial distribution of tree species in a species-rich subtropical mountain forest in central china. Can. J. For. Res. 43, 826–835. doi: 10.1139/cjfr-2013-0084
Hubbell, S. P. (1979). Tree dispersion, abundance, and diversity in a tropical dry forest: that tropical trees are clumped, not spaced, alters conceptions of the organization and dynamics. Science 203, 1299–1309. doi: 10.1126/science.203.4387.1299
Janzen, D. H. (1970). Herbivores and the number of tree species in tropical forests. Am. Nat. 104, 501–528. doi: 10.1086/282687
Judd, W. S., Campbell, C. S., Kellogg, E. A., and Stevens, P. F. (1999). Plant systematics: a phylogenetic approach. Taxon 49. doi: 10.2307/1223950
King, D. A. (1990). Allometry of saplings and understorey trees of a panamanian forest. Funct. Ecol. 4, 27. doi: 10.2307/2389648
Kraft, N. J., Adler, P. B., Godoy, O., James, E. C., Fuller, S., Levine, J. M., et al. (2015). Community assembly, coexistence and the environmental filtering metaphor. Funct. Ecol. 29, 592–599. doi: 10.1111/1365-2435.12345
Li, D., and Ives, A. R. (2017). The statistical need to include phylogeny in trait-based analyses of community composition. Methods Ecol. Evol. 8, 1192–1199. doi: 10.1111/2041-210X.12767
Li, D., Ives, A. R., and Waller, D. M. (2017). Can functional traits account for phylogenetic signal in community composition? New Phytol. 214, 607–618. doi: 10.1111/nph.14397
Li, L., Huang, Z., Ye, W., Cao, H., Wei, S., Wang, Z., et al. (2009). Spatial distributions of tree species in a subtropical forest of china. Oikos 118, 495–502. doi: 10.1111/j.1600-0706.2009.16753.x
Li, S.-F., Lang, X.-D., Huang, X.-B., Wang, Y.-H., Liu, W.-D., Xu, C.-H., et al. (2020). Association classification of a 30 hm2 dynamics plot in the monsoon broad-leaved evergreen forest in puer, yunnan, china. Chin. J. Plant Ecol. 44, 236. doi: 10.17521/cjpe.2019.0268
Li, Z., Xu, C., Liu, W., Wang, Y., Mao, G., et al. (2015). Spatial distribution of dominant species in monsoon evergreen broad-leaved forest of different restoration stages. Acta Bot. Boreal. -Occid. Sin. 35, 389–396.
Lin, Y.-C., Chang, L.-W., Yang, K.-C., Wang, H.-H., and Sun, I.-F. (2011). Point patterns of tree distribution determined by habitat heterogeneity and dispersal limitation. Oecologia 165, 175–184. doi: 10.1007/s00442-010-1718-x
Martins, V. F., Seger, G. D. S., Wiegand, T., and Santos, F. A. M. (2018). Phylogeny contributes more than site characteristics and traits to the spatial distribution pattern of tropical tree populations. Oikos 127, 1368–1379. doi: 10.1111/oik.05142
McFadden, I. R., Bartlett, M. K., Wiegand, T., Turner, B. L., Sack, L., Valencia, R., et al. (2019). Disentangling the functional trait correlates of spatial aggregation in tropical forest trees. Ecology 100, e02591. doi: 10.1002/ecy.2591
Minasny, B., and McBratney, A. B. (2005). The matérn function as a general model for soil variograms. Geoderma 128, 192–207. doi: 10.1016/j.geoderma.2005.04.003
Molleman, F., Rossignol, N., Ponge, J.-F., Pérès, G., Cluzeau, D., Ruiz-Camacho, N., et al. (2023). Why phylogenetic signal of traits is important in ecosystems: uniformity of a plant trait increases soil fauna, but only in a phylogenetically uniform vegetation. Oecologia 202, 175–191. doi: 10.1007/s00442-023-05384-z
Muller-Landau, H. C., Joseph, W. S., Osvaldo, C., Richard, C., and Hubbell, S. P. (2008). Interspecific variation in primary seed dispersal in a tropical forest. J. Ecol. 96, 96. doi: 10.1111/j.1365-2745.2008.01399.x
Parker, J. D., Burkepile, D. E., Lajeunesse, M. J., and Lind, E. M. (2012). Phylogenetic isolation increases plant success despite increasing susceptibility to generalist herbivores. Divers. Distrib. 18, 1–9. doi: 10.1111/j.1472-4642.2011.00806.x
Perez-Harguindeguy, N., DíAz, S., Garnier, E., Lavorel, S., Poorter, H., Jaureguiberry, P., et al. (2016). Corrigendum to: New handbook for standardised measurement of plant functional traits worldwide. Aust. J. Bot. 64, 715. doi: 10.1071/BT12225_CO
Plotkin, J. B., Chave, J., and Ashton, P. S. (2002). Cluster analysis of spatial patterns in malaysian tree species. Am. Nat. 160, 629–644. doi: 10.1086/342823
R Core Team (2023). R: A Language and Environment for Statistical Computing. Vienna: R Foundation for Statistical Computing.
Ramon, P., Velazquez, E., Escudero, A., and de la Cruz, M. (2018). Environmental heterogeneity blurs the signature of dispersal syndromes on spatial patterns of woody species in a moist tropical forest. PLoS ONE 13, e0192341. doi: 10.1371/journal.pone.0192341
Réjou-Méchain, M., Flores, O., Bourland, N., Doucet, J.-L., Feteke, R. F., Pasquier, A., et al. (2011). Spatial aggregation of tropical trees at multiple spatial scales. J. Ecol. 99, 1373–1381. doi: 10.1111/j.1365-2745.2011.01873.x
Seidler, T. G., and Plotkin, J. B. (2006). Seed dispersal and spatial pattern in tropical trees. PLoS Biol. 4, e344. doi: 10.1371/journal.pbio.0040344
Seri, E., and Shnerb, N. (2015). Spatial patterns in the tropical forest reveal connections between negative feedback, aggregation and abundance. J. Theor. Biol. 380, 247–255. doi: 10.1016/j.jtbi.2015.05.035
Shen, G., He, F., Waagepetersen, R., Sun, I.-F., Hao, Z., Chen, Z.-S., et al. (2013). Quantifying effects of habitat heterogeneity and other clustering processes on spatial distributions of tree species. Ecology 94, 2436–2443. doi: 10.1890/12-1983.1
Shen, G., Yu, M., Hu, X.-S., Mi, X., Ren, H., Sun, I.-F., et al. (2009). Species-area relationships explained by the joint effects of dispersal limitation and habitat heterogeneity. Ecology 90, 3033–3041. doi: 10.1890/08-1646.1
Smith, S. A., and Brown, J. W. (2018). Constructing a broadly inclusive seed plant phylogeny. Am. J. Bot. 105, 302–314. doi: 10.1002/ajb2.1019
Thomson, F. J., Moles, A. T., Auld, T. D., and Kingsford, R. T. (2011). Seed dispersal distance is more strongly correlated with plant height than with seed mass. J. Ecol. 99, 1299–1307. doi: 10.1111/j.1365-2745.2011.01867.x
Valiente-Banuet, A. V. M. (2007). Facilitation can increase the phylogenetic diversity of plant communities. Ecol. Lett. 10, 1029–1036. doi: 10.1111/j.1461-0248.2007.01100.x
Waagepetersen, R., and Guan, Y. (2009). Two-step estimation for inhomogeneous spatial point processes. J. R. Stat. Soc. B: Stat. Methodol. 71, 685–702. doi: 10.1111/j.1467-9868.2008.00702.x
Wang, H., Harrison, S. P., Prentice, I. C., Yang, Y., Bai, F., Togashi, H. F., et al. (2018). The china plant trait database: toward a comprehensive regional compilation of functional traits for land plants. Ecology 99. doi: 10.1002/ecy.2091
Wang, Y., Li, S., Lang, X., Huang, X., and Su, J. (2022). Effects of microtopography on soil fungal community diversity, composition, and assembly in a subtropical monsoon evergreen broadleaf forest of southwest china. Catena 211, 106025. doi: 10.1016/j.catena.2022.106025
Wang, Y.-H., Li, S.-F., Lang, X.-D., Huang, X.-B., Liu, W.-D., Xu, C.-H., et al. (2020). Effects of topographic heterogeneity on species diversity in a monsoon evergreen broad-leaved forest in puer, yunnan, china. Chin. J. Plant Ecol. 44, 1015. doi: 10.17521/cjpe.2020.0148
Wiegand, T., He, F., and Hubbell, S. P. (2013). A systematic comparison of summary characteristics for quantifying point patterns in ecology. Ecography 36, 92–103. doi: 10.1111/j.1600-0587.2012.07361.x
Wiegand, T., and Moloney, K. A. (2013). Handbook of Spatial Point-Pattern Analysis in Ecology. Boca Raton, FL: CRC press. doi: 10.1201/b16195
Wolf, S., Mahecha, M. D., Sabatini, F. M., Wirth, C., Bruelheide, H., Kattge, J., et al. (2022). Citizen science plant observations encode global trait patterns. Nat. Ecol. Evol. 6, 1850–1859. doi: 10.1038/s41559-022-01904-x
Keywords: environment filtering, dispersal limitation, functional traits, spatial point process modeling, phylogeny
Citation: Wang M, Liu W, Chen Z, Li S, Huang X, Hu Z and Shang R (2024) Functional traits and phylogeny jointly regulate the effects of environmental filtering and dispersal limitation on species spatial distribution. Front. For. Glob. Change 6:1339726. doi: 10.3389/ffgc.2023.1339726
Received: 16 November 2023; Accepted: 18 December 2023;
Published: 08 January 2024.
Edited by:
Wensheng Bu, Jiangxi Agricultural University, ChinaReviewed by:
Miguel Ángel Munguía-Rosas, Center for Research and Advanced Studies, National Polytechnic Institute of Mexico (CINVESTAV), MexicoCopyright © 2024 Wang, Liu, Chen, Li, Huang, Hu and Shang. This is an open-access article distributed under the terms of the Creative Commons Attribution License (CC BY). The use, distribution or reproduction in other forums is permitted, provided the original author(s) and the copyright owner(s) are credited and that the original publication in this journal is cited, in accordance with accepted academic practice. No use, distribution or reproduction is permitted which does not comply with these terms.
*Correspondence: Wande Liu, bGl1d2FuZGVAMTI2LmNvbQ==; Ruiguang Shang, c2hhbmdyZzg2QDEyNi5jb20=
Disclaimer: All claims expressed in this article are solely those of the authors and do not necessarily represent those of their affiliated organizations, or those of the publisher, the editors and the reviewers. Any product that may be evaluated in this article or claim that may be made by its manufacturer is not guaranteed or endorsed by the publisher.
Research integrity at Frontiers
Learn more about the work of our research integrity team to safeguard the quality of each article we publish.