 Ji Zheng
 Yujie Han2,3
 Ningxiao Sun
 Jingli Yan
 Shan Yin
- 1School of Agriculture and Biology, Shanghai Jiao Tong University, Shanghai, China
- 2Shanghai Urban Forest Ecosystem Research Station, National Forestry and Grassland Administration, Shanghai, China
- 3Shanghai Forestry Station, Shanghai, China
- 4Shanghai Yangtze River Delta Eco-Environmental Change and Management Observation and Research Station, Ministry of Science and Technology, Ministry of Education, Shanghai, China
- 5College of Forestry, Shenyang Agricultural University, Shenyang, China
Understanding the carbon budget within cities is crucial in the context of carbon peaking and carbon neutrality. This study investigates the carbon source-sink dynamics of urban forest ecosystems using carbon flux observations from the Chongming Island Ecological Observatory in Shanghai. The study aims to reveal the intra-annual variations of carbon fluxes and explore the changes in resource use efficiency of urban forest ecosystems within the framework of the big-leaf model. The results reveal distinct patterns in temperature (Tair), relative humidity (RH), radiation, and vapor pressure deficit (VPD). Diurnal cycles of net ecosystem exchange (NEE), gross primary production (GPP), and ecosystem respiration (Reco) exhibit seasonal variations, with higher amplitudes observed from April to September. The observed forest ecosystem acts as a moderate carbon sink (318.47 gC m−2 year−1), with the highest carbon uptake occurring in May and the highest carbon emission in February. During the growing season, the total carbon sink was 225.37 gC m−2, composed of GPP 1337.01 gC m−2 and Reco 1111.64 gC m−2. Water-use efficiency (WUE) and light-use efficiency (LUE) exhibit seasonal variations, while carbon-use efficiency (CUE) declines after May. These findings contribute to our understanding of urban forest carbon dynamics and their potential role in carbon management strategies.
1 Introduction
Enhancing the carbon sink of forest ecosystems is paramount in attaining carbon neutrality targets (Pan et al., 2011; Yang et al., 2022). Over the past two decades, global forests have emerged as a crucial net carbon sink, highlighting their vital importance in mitigating anthropogenic carbon emissions and their invaluable contribution toward combating climate change (Harris et al., 2021). In China, terrestrial carbon sink estimates in recent decades have ranged from 0.20 to 0.25 Pg C yr.−1, with the primary carbon sinks concentrated in mid- to high-latitudes, predominantly in forested regions (Yang et al., 2022). The continued increase in forest biomass carbon sequestration is anticipated due to afforestation efforts and the youthfulness of planted forests (Zhao et al., 2021). Meanwhile, a carbon sequestration model calibrated with field data showed that the carbon sequestration rate of Chinese forests from 2010 to 2060 was 0.358 ± 0.016 Pg C yr.−1, with a decline after 2035 (Cai et al., 2022). In fact, there is still a degree of uncertainty in the quantification of carbon sinks in terrestrial ecosystems. These uncertainties will have an impact on the formulation of effective carbon neutrality policies, posing challenges to achieving carbon neutrality goals in the future (Feng et al., 2023; Wang et al., 2023).
Urban forests represent a crucial component of urban ecosystems, bestowing manifold benefits upon humans and the environment (Fan et al., 2023). Among these advantages lies their noteworthy contribution to carbon sequestration and storage, which exerts a vital influence on global carbon dynamics (Wang et al., 2013; Pregitzer et al., 2022; Delgado-Baquerizo et al., 2023; Liu et al., 2023). Comprehending the carbon dynamics of urban forests assumes significance in evaluating their potential as a tool for climate change mitigation and assessing their impact on human health and well-being (Wang et al., 2013; Pregitzer et al., 2022). The carbon dynamics within urban forests are subject to the influence of diverse factors, including tree species composition (Esperon-Rodriguez et al., 2023), environmental conditions (Liu et al., 2023; Zheng et al., 2023), and the impact of urbanization (Bae and Ryu, 2021; Zhang et al., 2022). High-temporal-resolution data on urban forest carbon dynamics offers multiple benefits. Firstly, it aids in unveiling the complex mechanisms of carbon sequestration in urban forest ecosystems. Secondly, this data plays a crucial role in guiding urban forestry practices, ensuring they are optimized to enhance carbon sequestration levels. Furthermore, when combined with high-precision urban carbon emission data, it paves the way for the formulation of more effective, targeted strategies to reduce city-wide carbon emissions. Urban forest has undergone rapid development in China over the last three decades because of the acceleration of urbanization (Wang et al., 2013; Shen, 2023). Nonetheless, studies assessing the magnitude and variations of carbon sinks within urban forests in China are scarce (Xie et al., 2015; Liu et al., 2023).
Two broad categories of methods are available for estimating the carbon budget of regional terrestrial ecosystems: the “bottom-up” and the “top-down” approaches (Piao et al., 2022). The “bottom-up” approach commonly integrates ground-level observations derived from field inventories (Fang et al., 2001), eddy covariance measurements (Baldocchi et al., 2001; Soloway et al., 2017), and/or simulation results from ecosystem models (Piao et al., 2009; Fleischer et al., 2019). In contrast, the “top-down” approach primarily involves the inversion of terrestrial ecosystem carbon sink based on atmospheric CO2 concentration (Wang et al., 2020; Wang Y. et al., 2022). Presently, the “bottom-up” approach is commonly employed in assessing urban forest carbon storage and carbon sink (Wang et al., 2013; Zheng J. et al., 2018; Pregitzer et al., 2022; Liu et al., 2023). In comparison to inventory and modeling methods, the eddy covariance technology enables long-term, continuous, and finely resolved observations of carbon fluxes within urban forest ecosystems (Piao et al., 2022).
Chongming Island in Shanghai stands as the nation’s pioneering carbon-neutral zone, boasting a forest coverage of 30.5% and a wetland preservation rate of 59%, continuously elevating its ecological carbon sequestration capacity. Over the past three decades, Chongming Island has progressively established extensive coniferous forests. Nevertheless, the dynamic changes in its carbon sources and sinks, along with their influencing factors, remain relatively unexplored. In addition, evaluating the resource use efficiency of forest ecosystem could extend beyond assessing trees adaptability to different environments, providing a scientific basis for ecosystem management and conservation efforts. Within the context of carbon peaking and carbon neutrality, comprehending the carbon budget within cities becomes imperative. Therefore, the primary objectives of this study are as follows: (i) to investigate the carbon source-sink situation of urban forest ecosystems based on carbon flux observation data from the Chongming Island Ecological Observatory, (ii) to reveal the temporal variations of carbon fluxes, and (iii) to explore the changes in resource use efficiency of urban forest ecosystems within the framework of the big-leaf model.
2 Materials and methods
2.1 Study site
The study site, located in the Chong Ming (CM) station in the rural area of east Shanghai (31°42′5′′ N, 121°21′26′′ E) (Figure 1), is part of Shanghai’s urban forest observation network comprising 12 long-term positioning observation stations distributed in four ecological areas (Han, 2022). The site has an average altitude of approximately 5.0 m a.s.l (above sea level). The frost-free season lasts around 228 days, with the mean annual temperature (MAT) of approximately 15.7 ~ 16.9°C, and January and July, respectively, represent the coldest and warmest months of the year. The mean annual precipitation (MAP) ranges from 936 to 1,268 mm, mainly falling between April and September. Annual sunshine duration ranges from 1,495 to 2,042 h. The site is nestled within planted forests spanning an area of 366.7 hectares, of which the actual woodland constitutes 213.2 hectares. This includes a core landscape region of 70.8 hectares, a generally beneficial ecological forest extending over 142.4 hectares, and 86.7 hectares encompassing various water bodies and roads. Therefore, this research area is a typical urban forest ecosystem with significant urban attributes. The site is dominated by mixed plantation, and the main tree species include Taxodium. distichum var. imbricatum, Metasequoia glyptostroboides, Cinnamomum camphora, Liquidambar formosana, Magnolia grandiflora, Sapindus mukurosi, Ligustrum lucidum, etc. The stand density is approximately 2,141 stems/hm2, with an estimated stand age of 24 years, canopy closure ranging from 0.7 to 1, an average DBH of approximately 16.4 cm, and an average tree height of approximately 13 m. The soil is classified as Fluvo-aquic soil, with a pH of approximately 7.5, bulk density ranging from 1.18 to 1.54 g/cm3, organic matter content ranging from 28.77 to 38.38 g/kg, total nitrogen content ranging from 2.47 to 3.26 g/kg, total phosphorus content ranging from 0.68 to 0.85 g/kg, litter layer thickness ranging from 7 to 42 mm, and litter amount ranging from 2.56 to 15.25 t/hm2.
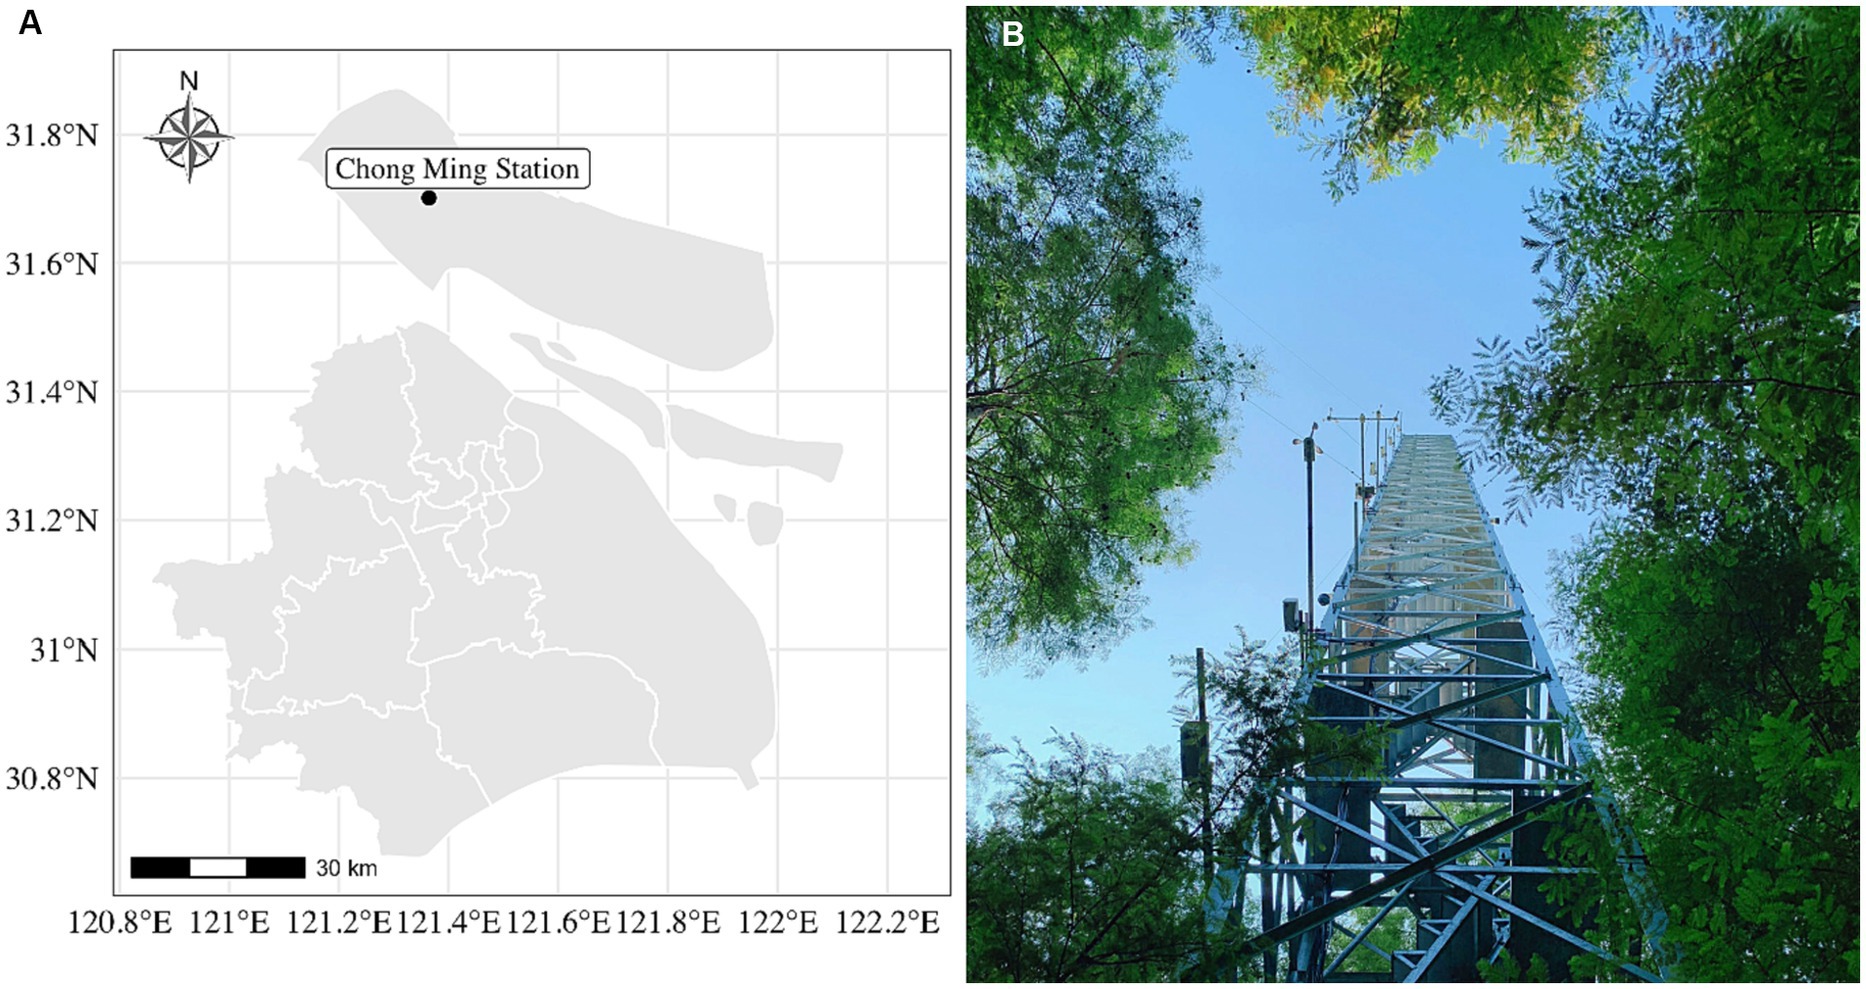
Figure 1. The location of the Chong Ming Station (A), and the illustration of flux tower (B). The study site is in the Chong Ming (CM) station, rural area of east Shanghai (31°42′5′′ N, 121°21′26′′ E). The CM station is part of Shanghai’s urban forest observation network. The average altitude is approximately 5.0 m a.s.l (above sea level). The height of the flux tower is 40 m. The CO2 flux, latent heat flux (LE) and sensible heat flux (H) are monitored using Campbell Scientific open-path Eddy-Covariance (EC) system EC3000.
2.2 Meteorological measurements
The meteorological observation system utilized in this study consists of the gradient meteorological station (Foshan Yunchuang Meteorological Service Technology Co., Ltd., China). The data collected from the meteorological observation system was automatically recorded every 30 min by a data collector (CR1000X, Campbell Inc., United States). The recorded meteorological variables during the study period included air temperature (Tair) (°C), relative humidity (RH) (%), precipitation (mm), atmospheric pressure (AP) (kPa), wind speed (m/s), solar radiation (Rg) (W/m2) and net radiation (Rn) (W/m2). The vapor pressure deficit (VPD) (kPa) was subsequently calculated based on the RH and Tair (Campbell and Norman, 1998). The photosynthetic photon flux density (PPFD) (umol m−2 s−1) was calculated from the Rg using a conversion factor of 2.3 (Knauer et al., 2018).
2.3 Flux observation and quality control
The flux tower stands at a height of 40 m and is equipped with a Campbell Scientific open-path Eddy-Covariance (EC) system EC3000, which measures CO2 flux, latent heat flux (LE), and sensible heat flux (H) at a height of 38 m. The raw time series data acquired at a high frequency of 10 Hz was processed using the proprietary software EasyFlux DL,1 following the standard FLUXNET methodology, to obtain corrected flux data. To ensure data quality, flux data belonging to ranked Classes 7–9 were excluded prior to further analysis, and 24-h data following a precipitation event (≥0.1 mm) were also removed. Finally, the high-frequency data was aggregated into half-hourly intervals for ease of analysis.
2.4 Post-processing of CO2 flux data
The post-processing follows a three-step workflow (Wutzler et al., 2018). The first step in the post-processing of EC data is to identify period with low friction velocity (u*), where the net ecosystem exchange (NEE) is biased. In this study, the seasonal u* thresholds have been estimated and used. Second, the gaps in the observed half-hourly NEE were filled based on the marginal distribution sampling method with the estimated seasonal friction velocity u* thresholds. After these two steps, 73.97% of the missing data was filled completely. Third, the nighttime-based NEE partitioning method was used to calculate gross primary productivity (GPP) and ecosystem respiration (Reco). These standard and extensible EC data post-processing was conducted using R package REddyProc (Wutzler et al., 2018).
2.5 Computation of the ecosystem properties
In the big-leaf framework, the entire ecosystem is thought to function as a single leaf when it comes to exchanging carbon, water, and energy fluxes with the atmosphere. Here, we estimated four indexes called carbon-use efficiency (CUE), light-use efficiency (LUE), water-use efficiency (WUE), and underlying water-use efficiency (uWUE) during the growing season under the big leaf framework using the R package bigleaf (Knauer et al., 2018). The CUE index quantifies the ratio of net ecosystem production (NEP, i.e., NEP = -NEE) to GPP (i.e., CUE = sum(NEP)/sum(GPP)). The LUE quantifies the amount of GPP per incoming light (i.e., LUE = sum(GPP)/sum(PPFD)). Compared with the WUE (i.e., WUE = GPP/ET), the uWUE describes the carbon-water coupling relationship accounting for the nonlinear effect of VPD (i.e., uWUE = GPP * VPD0.5/ET) (Zhou et al., 2014). The growing season was quantified by using the GPP-based growing season filter function in the R package bigleaf. The GPP threshold value was set as 0.6 (fraction of 95th percentile of the daily GPP time series). The original daily GPP time series were smoothed first with a 15 days’ moving window. The minimum length of the growing season was set as 30 days. Finally, the growing season was quantified as the period between April and September (from 25th April to 28th September).
In this study, the data was collected at CM station during 1st January 2021 to 31st December 2021. After the quality assessment of the EC data, all the variables whose QC flag larger than 1 would be set to NAs to filter out gap-fillings with poor confidence using the R package bigleaf (Knauer et al., 2018). Finally, the energy balance closure (EBC) was quantified based on Rn, LE and H, ignoring the ground heat and energy storage fluxes. The EBC was evaluated by the slope of the LE + H ~ Rn (SLOPE) and energy balance ratio (EBR) (Knauer et al., 2018). For the whole year, the gap in the energy balance was around 30% (SLOPE = 0.689, and EBR = 1.288). Analyses and plots were made with R 4.0.2 (R Core Team, 2020). The computations in this paper were run on the π 2.0 cluster supported by the Center for High Performance Computing at Shanghai Jiao Tong University.
3 Results
3.1 Meteorological variations
The results presented in Figure 2 revealed a distinct unimodal pattern for Tair. The 95% distribution range for Tair was found to be within a maximum of 36.07°C and a minimum of −8.58°C. The annual median value of Tair was 17.63°C, with the coldest month being January (median = 5.41°C) and the warmest month being July (median = 27.5°C). The changing trend of relative humidity mirrored that of Tair. The annual median value of RH was 50.88%, with higher values occurring in July and August (median RH = 71.4 and 74.1%, respectively). Rg and Rn had average values of 121.45 W/m2 and 64.29 W/m2, respectively. Unlike the peak period of Tair, the peak of Rg and Rn occurred in May and March, respectively (Figures 2A–C). This discrepancy may be attributed to the study area’s precipitation pattern, which primarily occurred from May to August (Figure 2E). Although Tair and RH were shown to affect VPD, their regular change patterns did not reflect in the change of VPD. Within the 95% distribution range, the maximum VPD was 3.82 kPa, while the minimum VPD was 0.31 kPa. The annual median value of VPD was 0.89 kPa, with the driest month being September.
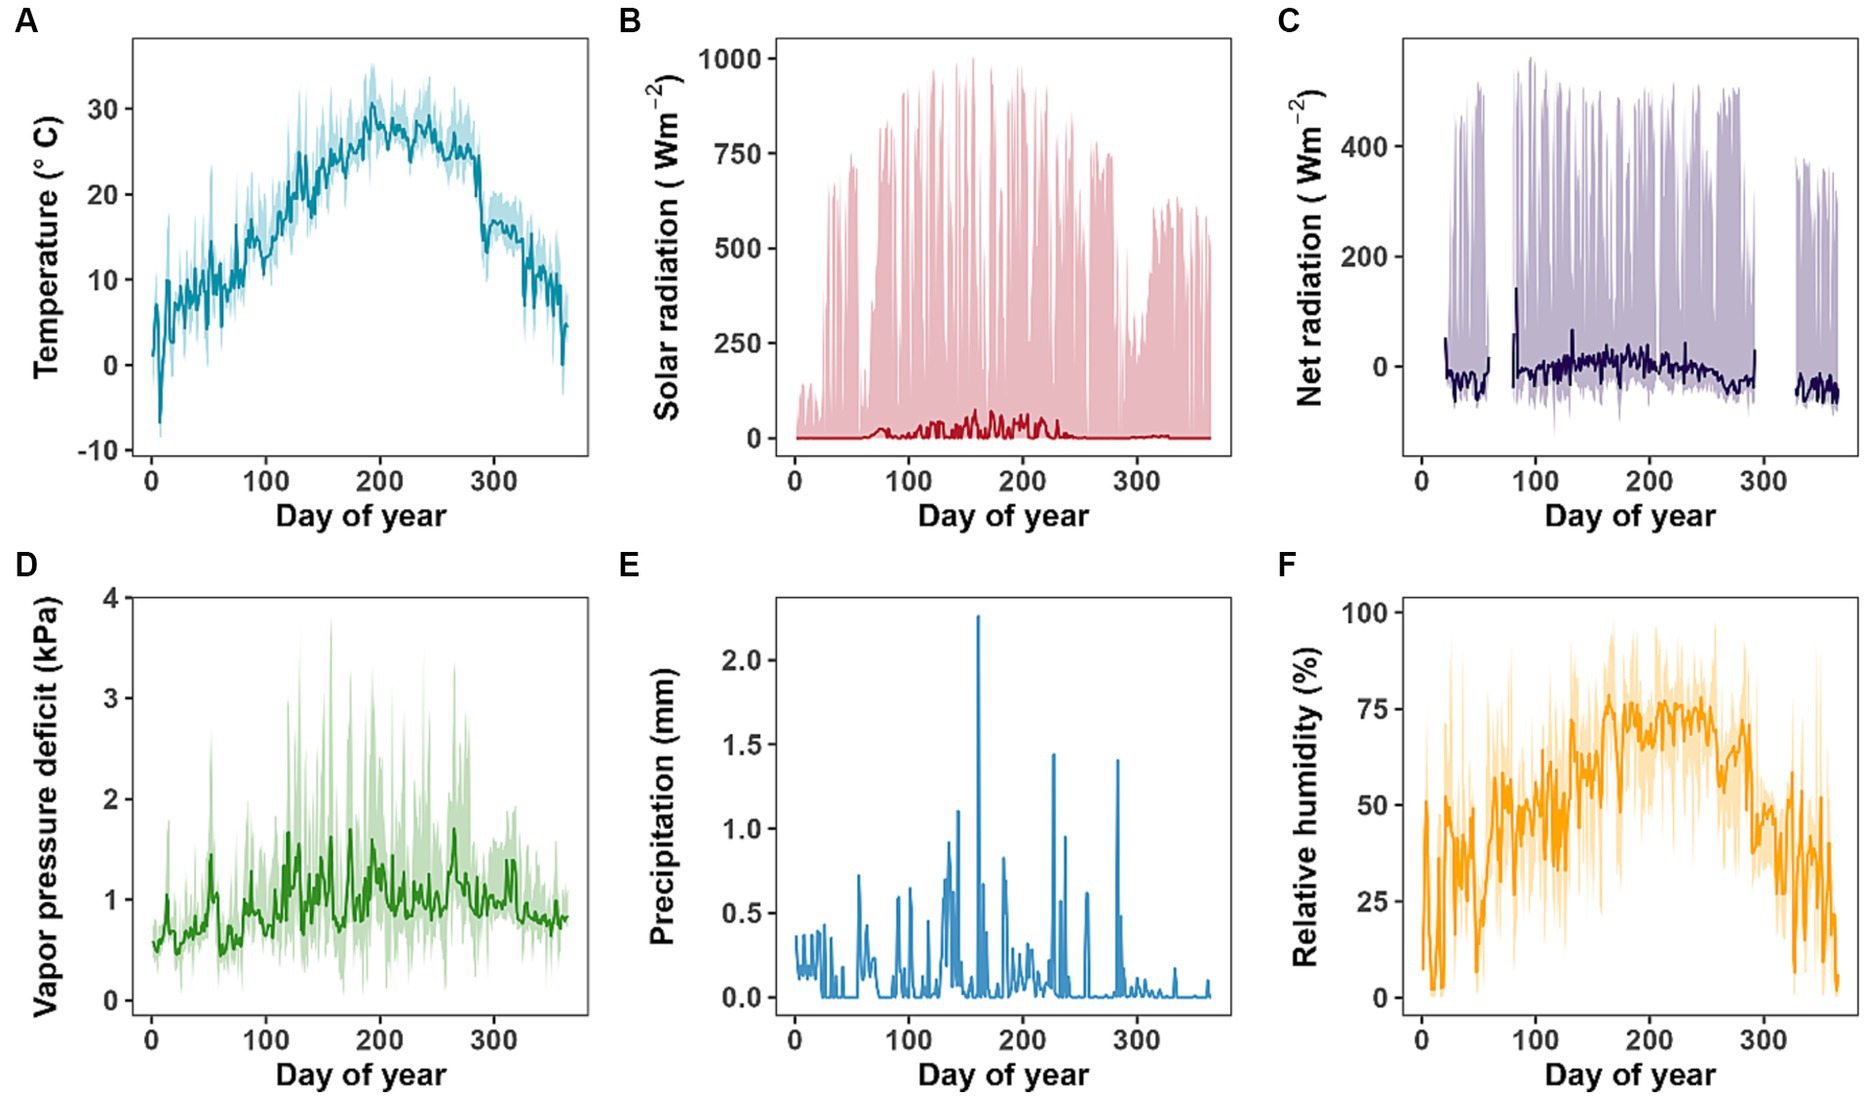
Figure 2. The daily changes of environmental conditions during the study period. (A) air temperature (Tair) (°C), (B) solar radiation (Rg) (W/m2), (C) net radiation (Rn) (W/m2), (D) vapor pressure deficit (VPD) (kPa), (E) precipitation (mm), and (F) relative humidity (RH) (%). The VPD was then calculated based on the RH and Tair. The solid lines represent the median values, and the upper and lower shallow areas represent the 97.5 and 2.5% quantiles of the values. The variable Rn whose QC flag larger than 1 would be set to NAs to filter out gap-fillings with poor confidence.
3.2 Variations of Nee, GPP, and Reco
Figures 3, 4 showed that the diurnal patterns of NEE and GPP exhibited higher daily amplitudes from April to September. Simultaneously, Reco also showed an obvious increase with rising Tair (Figure 4). Asymmetric diurnal cycles of NEE was observed, characterized by a peak before noon and a decline afterward. The average daily NEE was −0.87 gC m−2 day−1, with a maximum daily net carbon uptake of 7.65 gC m−2 day−1, and the largest daily net carbon emission of 7.26 gC m−2 day−1. The observed NEE showed a peak of net carbon uptake in May (−82.29 gC m−2 month−1), while a peak of net carbon emission in February (34.74 gC m−2 month−1). Reco exhibited a unimodal pattern with peaks in August (256.36 gC m−2 month−1), while GPP exhibited a bimodal pattern with peaks in May and August (283.27 and 274.3 gC m−2 month−1, respectively). Over the year, the observed forest ecosystem acted as a moderate carbon sink (318.47 gC m−2 year−1). During the growing season, the total carbon sink was 225.37 gC m−2, composed of GPP 1337.01 gC m−2 and Reco 1111.64 gC m−2. Furthermore, Reco/GPP ratio was 0.83 during the growing season, with peak in September (ratio = 0.95).
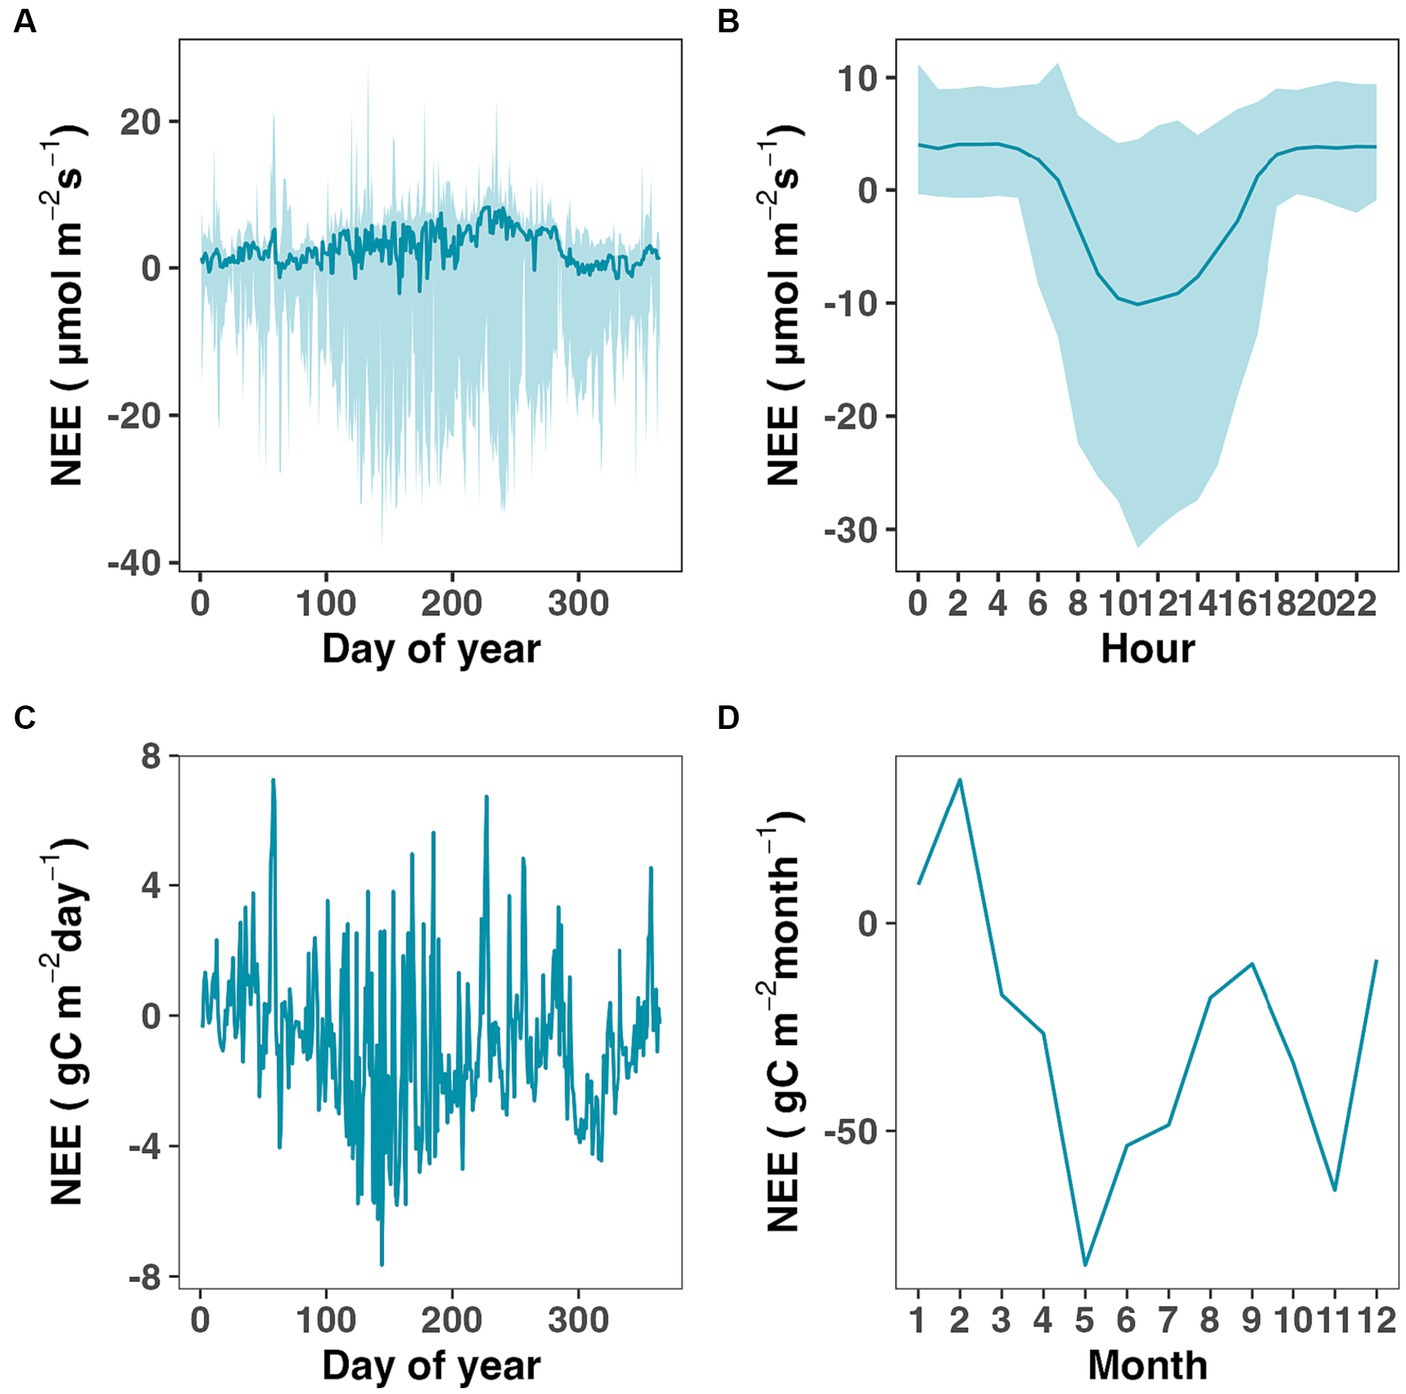
Figure 3. The variations of net ecosystem exchange (NEE) during the study period at different time scales (A-D). The solid lines represent the median values, and the upper and lower shallow areas represent the 97.5 and 2.5% quantiles of the values.
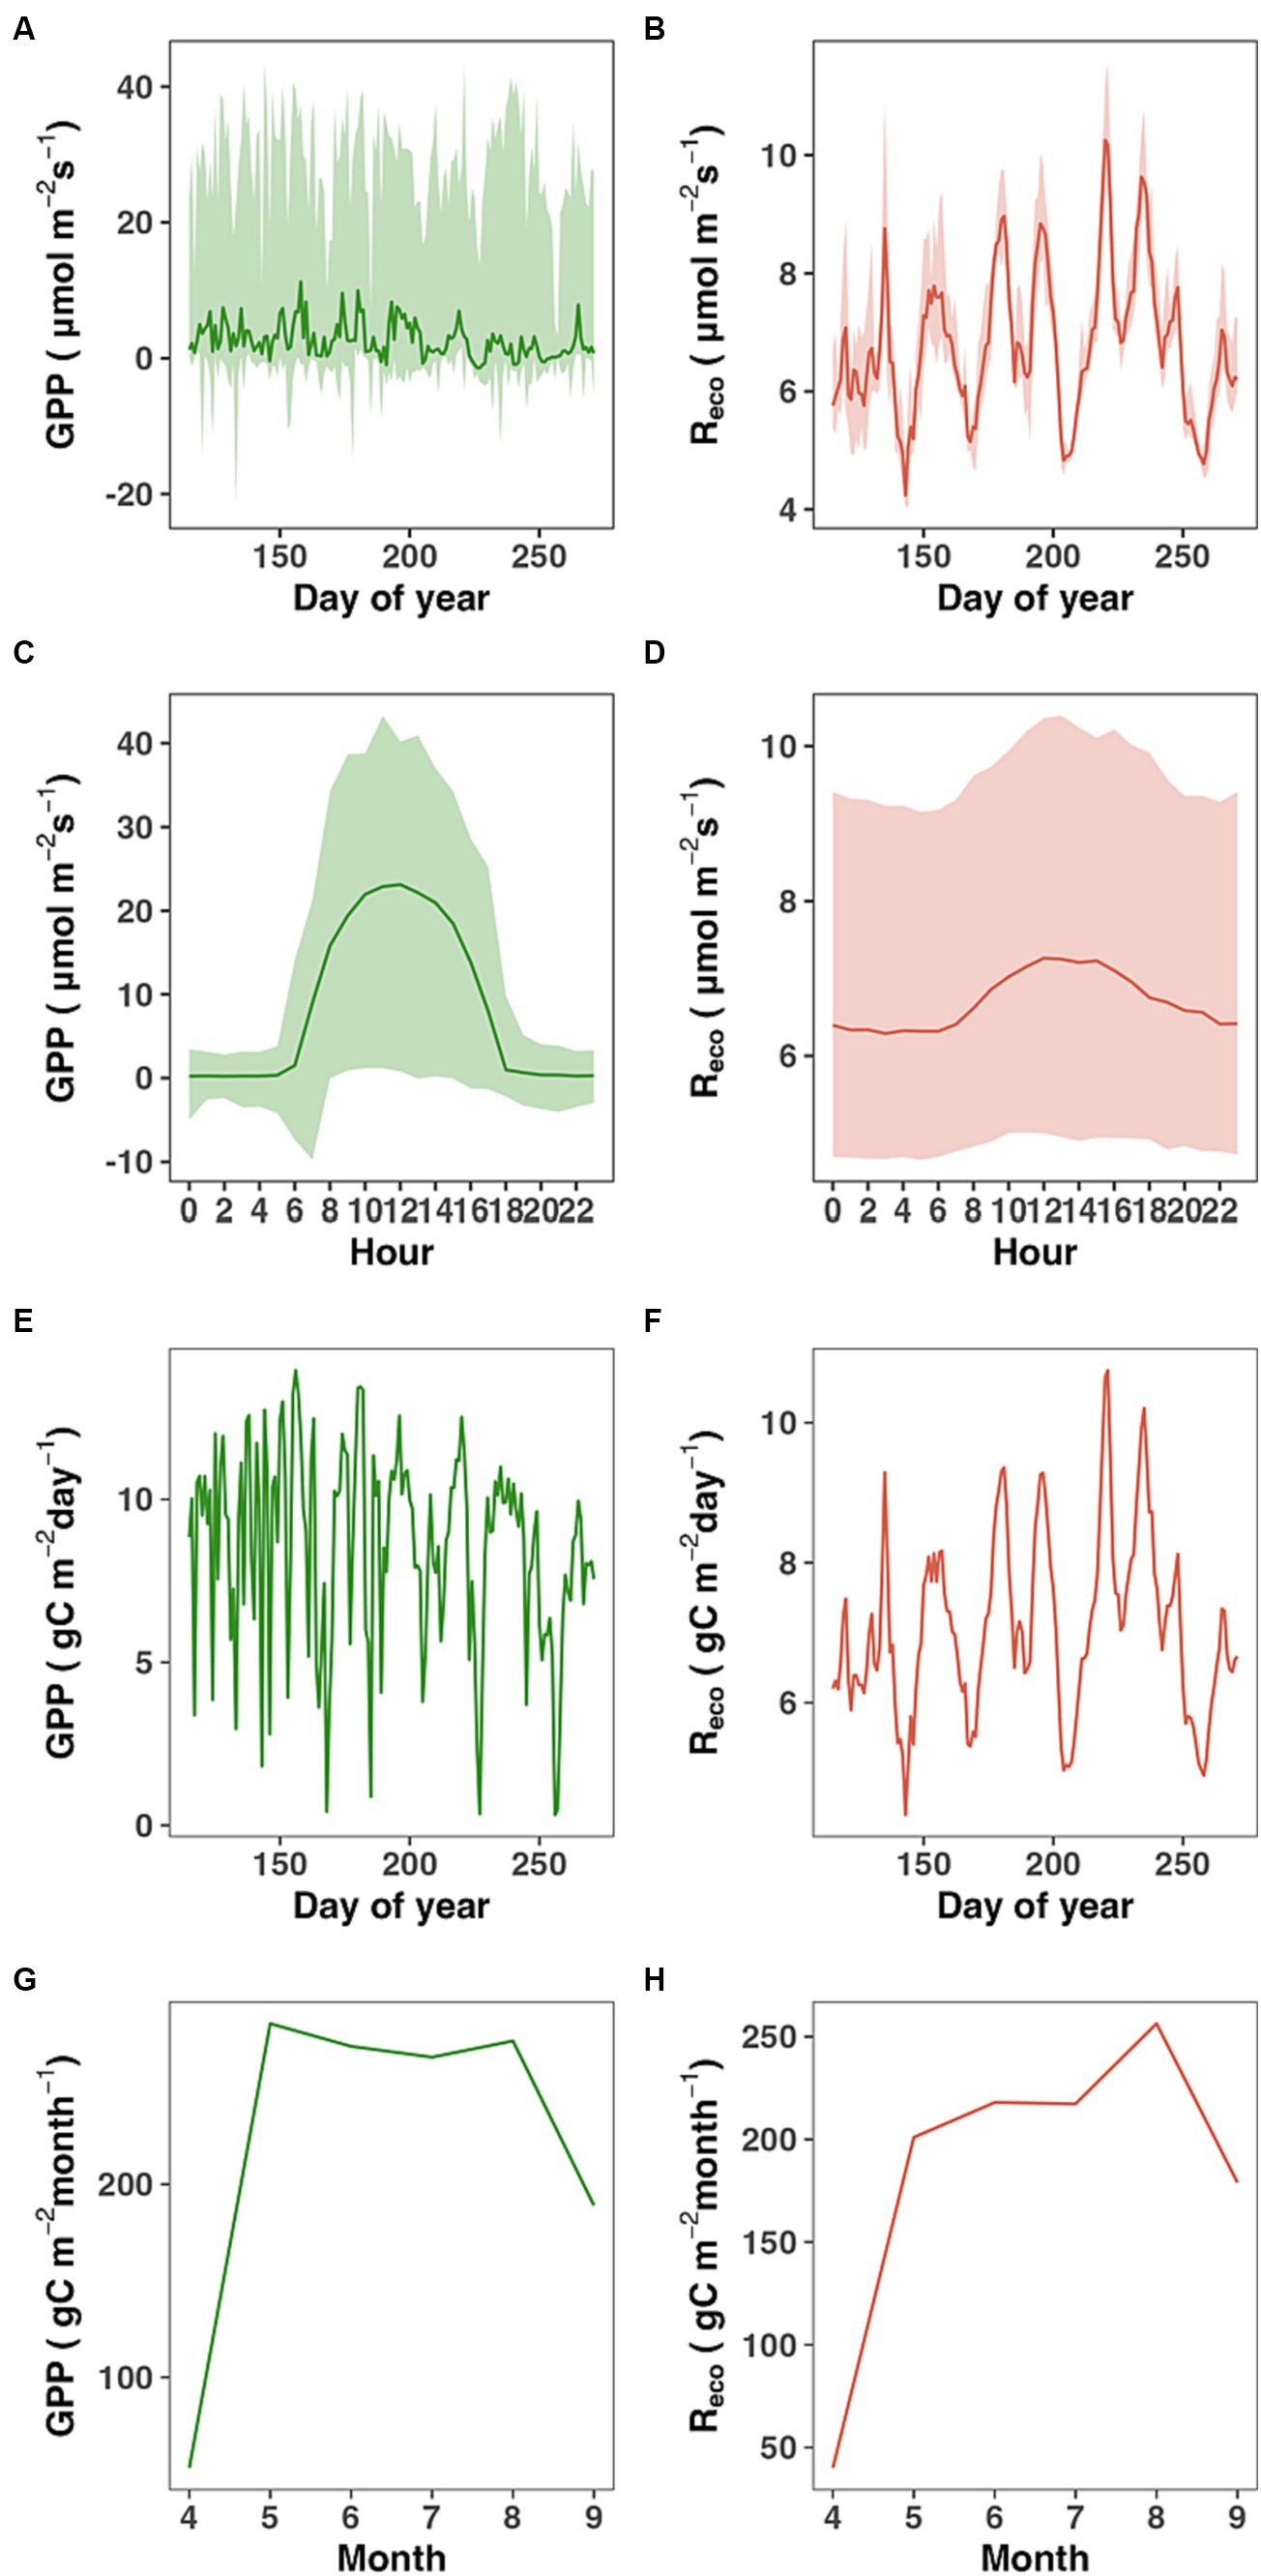
Figure 4. The variations of gross primary productivity (GPP) and ecosystem respiration (Reco) during growing season at different time scales (A-H). The solid lines represent the median values, and the upper and lower shallow areas represent the 97.5 and 2.5% quantiles of the values.
3.3 Ecosystem WUE, uWUE, LUE, and CUE
Throughout the growing season (Figure 5), the ecosystem exhibited a higher water-use efficiency in March, April and May. The lowest monthly average value of WUE and uWUE was both observed in September. LUE maintained at a high level from May to August, with a similar change pattern owing to their radiation-dependent quantification. LUE peaked in June with the monthly average value of 0.03 (μmol CO2 μmol−1 quanta). The average CUE was 0.17 with a peak in May (0.29). Furthermore, CUE revealed a decrease trend in the carbon utilization capacity after May.
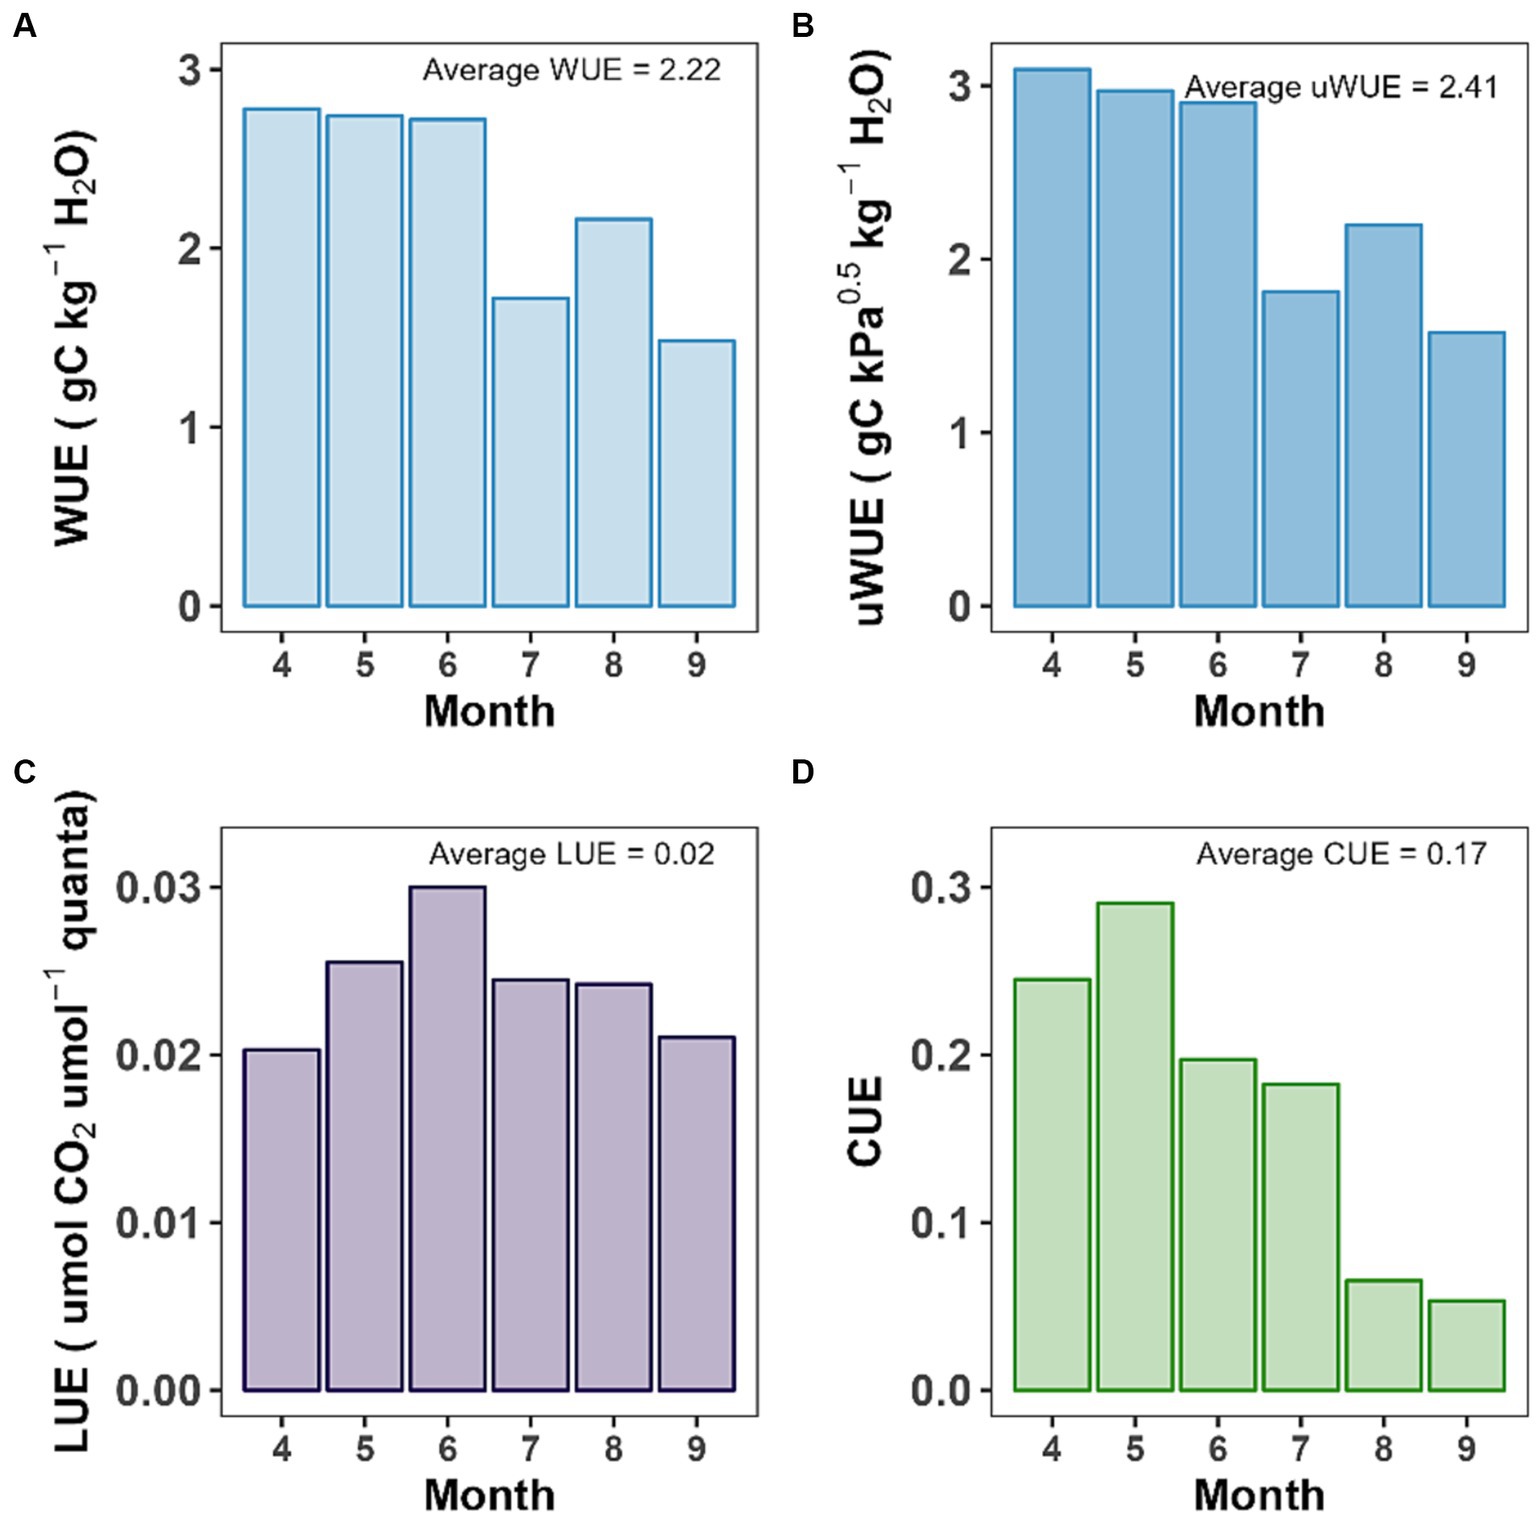
Figure 5. The variations of the monthly average ecosystem properties. (A) Water-use efficiency (WUE). (B) Underlying water-use efficiency (uWUE), describing the carbon-water coupling relationship accounting for the nonlinear effect of vapor pressure deficit. (C) Light-use efficiency (LUE), quantifying the amount of GPP per incoming light. (D) Carbon-use efficiency (CUE), quantifying the fraction ratio of net ecosystem production (NEP) to GPP.
4 Discussion
Afforestation efforts have thrived in urban China, but there is limited understanding of urban forests’ carbon sequestration capabilities. A study using data from 2012 to 2020 from a Beijing urban forest showed it functioned primarily as a C sink, with an average NEE of −195 ± 98 gC m−2 year−1. Our observations on carbon flux indicate that the forest plantations on Chongming Island possess a remarkable capacity for carbon sequestration. This finding presents the most direct empirical evidence for carbon sinks in coastal city forests and lays a theoretical foundation for Chongming Eco-Island to achieve carbon neutrality. A comprehensive dataset on ecosystem carbon fluxes, collected from the literatures published in China’s regions from 2000 to 2015, encompassed data for approximately 20 typical forests and urban forests sites (Chen et al., 2018). This dataset includes actual measurements of NEE, GPP and Reco. Regarding ecosystem production, forest sites demonstrate lower NEE with a mean value of −456.5 gC m−2 year−1, whereas urban forests sites have a higher mean NEE of −146.39 gC m−2 year−1 (Chen et al., 2018). This suggests that forest sites are more effective in sequestering carbon. GPP also shows a difference between the two ecosystems. Urban forests sites have a mean GPP of 1327.99 gC m−2 year−1, while forest sites have a mean GPP of 1680.37 gC m−2 year−1. When considering Reco, urban forests sites exhibit slightly lower values, with a mean Reco of 1181.6 gC m−2 year−1, in comparison to forest sites, which have a mean Reco of 1218.97 gC m−2 year−1 (Chen et al., 2018). When focusing on subtropical ecosystems where coniferous species predominate, the carbon sequestration capability of the Chongming Island observation site lies between that of Qianyanzhou (487.52 gC m−2 year−1) and Huitong (268.5 gC m−2 year−1) sites (Chen et al., 2018). In contrast, another study focusing on the carbon sequestration of subtropical coniferous forests (KKM site) indicates that this ecosystem maintains a consistently strong carbon sink (from −635 to −900 gC m−2 year−1) (Deb Burman et al., 2021). These specific results provide valuable insights into the ecological characteristics of the studied sites, highlighting the variations between urban forests and natural forest ecosystems.
According to the available dataset from 1997 to 2017, the average annual carbon emissions on Chongming Island amount to 97.55 tons of CO2 per hectare (Chen et al., 2020). This indicates a significant level of carbon emissions generated by urban activities within the area. Our measurements show that the urban forest on Chongming Island has a carbon sequestration capacity of 11.66 tons of CO2 per hectare per year. This demonstrates the evident carbon sink function of Chongming forest. Specifically, this carbon sequestration accounts for approximately 12% of the total emissions, highlighting the important role that Chongming forest plays in mitigating carbon emissions in the urban environment.
In addition to carbon fluxes, we explored the changes in resource use efficiency within the framework of the big-leaf model (Knauer et al., 2018). Water-use efficiency (WUE), representing the productivity-to-water use ratio, gages forest carbon and water cycle interactions and assists in managing their trade-offs under varying conditions (Zhang et al., 2023). Our observations reveal that the forest plantations at the CM site had an average WUE of 2.22 gC kg−1 H2O during its growing season, aligning closely with the findings from both the Qianyanzhou (average value of 2.29 gC kg−1 H2O during the years 2003 ~ 2008) and Huitong (2.36 gC kg−1 H2O in the year 2009) sites (Zheng H. et al., 2018). Our results also underscore that the underlying WUE (uWUE) during the growing season, characterizing the carbon-water coupling relationship accounting for the nonlinear effect of VPD, resonates well with the findings from the KKM site (Deb Burman et al., 2021). Unlike the methods employed in previous studies to compute CUE (DeLucia et al., 2007; Bradford and Crowther, 2013; Collalti and Prentice, 2019), our investigation quantified CUE through the proportion of the ecosystem’s NEP to its GPP, capturing the ecosystem’s proficiency in sequestering atmospheric carbon (Fernández-Martínez et al., 2014). Analogous to the WUE findings, CUE exhibited a discernible decline in both August and September. The average CUE during the growing season at the CM site is closely aligned with the average CUE of the Huitong site (0.18), yet remains below the multi-year average CUE of the Qianyanzhou site (0.27) (Chen et al., 2018).
The VPD, as a metric of atmospheric dryness, profoundly impacts the greenhouse gas exchange between forests and the atmosphere (Ficklin and Novick, 2017; Yuan et al., 2019; Grossiord et al., 2020; Shekhar et al., 2023a). Our observations of VPD suggest that September could be the driest month atmospherically (Figure 2), and this moisture deficit might lead to varying degrees of decline in both net carbon uptake and GPP within this month. However, overall, net carbon uptake experiences a more pronounced reduction. A study from the tropics revealed that drought led to a 23% decrease in CUE in natural secondary forests, manifested as a significant constraint on GPP across multiple seasons. Conversely, the GPP of rubber plantations in the study area showed significant reductions only during the warm, dry seasons, culminating in an overall 17% decline in CUE (Wang X. et al., 2022). However, the dominant role of soil or atmospheric dryness in constraining GPP during drought was not consistent among these sites (Wang X. et al., 2022). Additionally, Zhao et al. emphasized that the decline in forest productivity during the compound drought-heatwave event in China’s summer of 2022 was primarily driven by soil aridity rather than atmospheric dryness (Zhao et al., 2023). Moreover, extreme dryness events, both in soil and atmosphere, have increased in frequency and intensity in the past, and are projected to escalate across Europe and United States in the future (Ficklin and Novick, 2017; Shekhar et al., 2023b). A study suggested that incorporating soil moisture and VPD variables into ecosystem models and optimizing the stomatal conductance sub-module can enhance the accuracy of forest ecosystem water flux predictions. Furthermore, the research underscores the importance of considering drought stress when estimating carbon-water coupling (Sun et al., 2023).
Urbanization not only intensifies the Urban Heat Island effect but also induces the phenomenon known as the Urban Dry Island (Huang et al., 2022). Such persistent moisture deficiencies within cities amplify environmental stress risks for urban vegetation, subsequently affecting carbon cycling processes (Zheng et al., 2023). A study showed that in 65 cities across 56 nations, 64 and 78% of species currently exceed their geographical limits concerning temperature and precipitation conditions. Alarmingly, these risks are poised to become more pronounced in future low-latitude regions (Esperon-Rodriguez et al., 2022). Model simulations that discern the spatial and temporal characteristics of environmental constraints for tree growth are instrumental for forest managers, facilitating the creation of precise risk maps for specific species, especially in areas expected to face intensified drought stress in the imminent future (Trotsiuk et al., 2021). Against the backdrop of urbanization and climate change, accurately predicting the fate of urban forests, and proactively mitigating or reducing risks of diminished ecosystem services or even tree mortality becomes crucial. Hence, incorporating ecosystem process models into urban forest management is imperative. However, while there have been preliminary endeavors in this domain, research is still notably sparse, underscoring an urgent need to develop models adeptly suited to urban forest development (Zheng J. et al., 2018; Blanco and Lo, 2023).
5 Conclusion
The study provides an examination of carbon dynamics within urban forest ecosystems on Chongming Island, Shanghai. By examining carbon flux data, the research unveils intra-annual variations and seasonal patterns of key carbon components such as NEE, GPP, and Reco. The forest on the island emerges as a moderate carbon sink (318.47 gC m−2 year−1), with the highest carbon uptake occurring in May and the highest carbon emission in February. During the growing season, the total carbon sink was 225.37 gC m−2, composed of GPP 1337.01 gC m−2 and Reco 1111.64 gC m−2. These findings provide empirical evidence for the carbon sequestration potential of coastal urban forests, emphasizing their significance in achieving carbon neutrality.
Data availability statement
The original contributions presented in the study are included in the article/supplementary material, further inquiries can be directed to the corresponding author.
Author contributions
JZ: Formal analysis, Methodology, Visualization, Writing – original draft. YH: Conceptualization, Resources, Supervision, Writing – review & editing. NS: Data curation, Investigation, Writing – review & editing. YY: Writing – review & editing. JY: Writing – review & editing. WZ: Writing – review & editing. SY: Conceptualization, Data curation, Funding acquisition, Investigation, Project administration, Resources, Supervision, Writing – review & editing.
Funding
The author(s) declare financial support was received for the research, authorship, and/or publication of this article. This work was financially supported by the Special Project on National Science and Technology Basic Resources Investigation of China (2021FY100703), the Key Scientific and Technological Project of Shanghai Landscape & City Appearance Administrative Bureau (G231208), and Science and Technology Commission of Shanghai Municipality project (22dz1208202).
Acknowledgments
The computations in this paper were mainly run on the π 2.0 cluster supported by the Center for High Performance Computing at Shanghai Jiao Tong University.
Conflict of interest
The authors declare that the research was conducted in the absence of any commercial or financial relationships that could be construed as a potential conflict of interest.
Publisher’s note
All claims expressed in this article are solely those of the authors and do not necessarily represent those of their affiliated organizations, or those of the publisher, the editors and the reviewers. Any product that may be evaluated in this article, or claim that may be made by its manufacturer, is not guaranteed or endorsed by the publisher.
Footnotes
References
Bae, J., and Ryu, Y. (2021). The magnitude and causes of edge effects on soil organic carbon stocks within and across urban to rural forest patches. Landsc. Urban Plan. 215:104223. doi: 10.1016/j.landurbplan.2021.104223
Baldocchi, D., Falge, E., Gu, L. H., Olson, R., Hollinger, D., Running, S., et al. (2001). FLUXNET: a new tool to study the temporal and spatial variability of ecosystem-scale carbon dioxide, water vapor, and energy flux densities. Bull. Am. Meteorol. Soc. 82, 2415–2434. doi: 10.1175/1520-0477(2001)082<2415:fantts>2.3.co;2
Blanco, J., and Lo, Y.-H. (2023). Latest trends in modelling Forest ecosystems: new approaches or just new methods? Curr. Forest. Rep. 9, 219–229. doi: 10.1007/s40725-023-00189-y
Bradford, M. A., and Crowther, T. W. (2013). Carbon use efficiency and storage in terrestrial ecosystems. New Phytol. 199, 7–9. doi: 10.1111/nph.12334
Cai, W., He, N., Li, M., Xu, L., Wang, L., Zhu, J., et al. (2022). Carbon sequestration of Chinese forests from 2010 to 2060: spatiotemporal dynamics and its regulatory strategies. Sci. Bull. 67, 836–843. doi: 10.1016/j.scib.2021.12.012
Campbell, G.S., and Norman, J.M. (1998). An introduction to environmental biophysics. Springer New York, NY.
Chen, J., Gao, M., Cheng, S., Hou, W., Song, M., Liu, X., et al. (2020). County-level CO2 emissions and sequestration in China during 1997–2017. Sci. Data 7:391. doi: 10.1038/s41597-020-00736-3
Chen, Z., Yu, G., Zhu, X., Zhang, L., Wang, Q., and Jiao, C. (2018). A dataset of primary production, respiration and net production in typical Chinese ecosystems based on literature integration. Sci. Data Bank. doi: 10.11922/sciencedb.599
Collalti, A., and Prentice, I. C. (2019). Is NPP proportional to GPP? Waring’s hypothesis 20 years on. Tree Physiol. 39, 1473–1483. doi: 10.1093/treephys/tpz034
Deb Burman, P. K., Launiainen, S., Mukherjee, S., Chakraborty, S., Gogoi, N., Murkute, C., et al. (2021). Ecosystem-atmosphere carbon and water exchanges of subtropical evergreen and deciduous forests in India. For. Ecol. Manag. 495:119371. doi: 10.1016/j.foreco.2021.119371
Delgado-Baquerizo, M., García-Palacios, P., Bradford, M. A., Eldridge, D. J., Berdugo, M., Sáez-Sandino, T., et al. (2023). Biogenic factors explain soil carbon in paired urban and natural ecosystems worldwide. Nat. Clim. Chang. 13, 450–455. doi: 10.1038/s41558-023-01646-z
DeLucia, E. H., Drake, J. E., Thomas, R. B., and Gonzalez-Meler, M. (2007). Forest carbon use efficiency: is respiration a constant fraction of gross primary production? Glob. Chang. Biol. 13, 1157–1167. doi: 10.1111/j.1365-2486.2007.01365.x
Esperon-Rodriguez, M., Quintans, D., and Rymer, P. D. (2023). Urban tree inventories as a tool to assess tree growth and failure: the case for Australian cities. Landsc. Urban Plan. 233:104705. doi: 10.1016/j.landurbplan.2023.104705
Esperon-Rodriguez, M., Tjoelker, M. G., Lenoir, J., Baumgartner, J. B., Beaumont, L. J., Nipperess, D. A., et al. (2022). Climate change increases global risk to urban forests. Nat. Clim. Chang. 12, 950–955. doi: 10.1038/s41558-022-01465-8
Fan, K., Chu, H., Eldridge, D. J., Gaitan, J. J., Liu, Y.-R., Sokoya, B., et al. (2023). Soil biodiversity supports the delivery of multiple ecosystem functions in urban greenspaces. Nat. Ecol. Evol. 7, 113–126. doi: 10.1038/s41559-022-01935-4
Fang, J., Chen, A., Peng, C., Zhao, S., and Ci, L. (2001). Changes in Forest biomass carbon storage in China between 1949 and 1998. Science 292, 2320–2322. doi: 10.1126/science.1058629
Feng, R., Hu, L., Hu, X., and Fang, X. (2023). Knowledge gaps are making it harder to formulate national climate policies. Proc. Natl. Acad. Sci. 120:e2218563120. doi: 10.1073/pnas.2218563120
Fernández-Martínez, M., Vicca, S., Janssens, I. A., Sardans, J., Luyssaert, S., Campioli, M., et al. (2014). Nutrient availability as the key regulator of global forest carbon balance. Nat. Clim. Chang. 4, 471–476. doi: 10.1038/nclimate2177
Ficklin, D. L., and Novick, K. A. (2017). Historic and projected changes in vapor pressure deficit suggest a continental-scale drying of the United States atmosphere. J. Geophys. Res. Atmos. 122, 2061–2079. doi: 10.1002/2016JD025855
Fleischer, K., Rammig, A., De Kauwe, M. G., Walker, A. P., Domingues, T. F., Fuchslueger, L., et al. (2019). Amazon forest response to CO2 fertilization dependent on plant phosphorus acquisition. Nat. Geosci. 12, 736–741. doi: 10.1038/s41561-019-0404-9
Grossiord, C., Buckley, T. N., Cernusak, L. A., Novick, K. A., Poulter, B., Siegwolf, R. T. W., et al. (2020). Plant responses to rising vapor pressure deficit. New Phytol. 226, 1550–1566. doi: 10.1111/nph.16485
Han, Y. (2022). Long-term positioning observation network layout for Shanghai's urban Forest based on layer overlay analysis. J. Chin. Urban Forest. 20, 85–90. doi: 10.12169/zgcsly.2021.10.09.0002
Harris, N. L., Gibbs, D. A., Baccini, A., Birdsey, R. A., de Bruin, S., Farina, M., et al. (2021). Global maps of twenty-first century forest carbon fluxes. Nat. Clim. Chang. 11, 234–240. doi: 10.1038/s41558-020-00976-6
Huang, X., Hao, L., Sun, G., Yang, Z.-L., Li, W., and Chen, D. (2022). Urbanization aggravates effects of global warming on local atmospheric drying. Geophys. Res. Lett. 49:e2021GL095709. doi: 10.1029/2021GL095709
Knauer, J., El-Madany, T. S., Zaehle, S., and Migliavacca, M. (2018). Bigleaf—an R package for the calculation of physical and physiological ecosystem properties from eddy covariance data. PLoS One 13:e0201114. doi: 10.1371/journal.pone.0201114
Liu, P., Zha, T., Zhang, F., Jia, X., Bourque, C. P. A., Tian, Y., et al. (2023). Environmental controls on carbon fluxes in an urban forest in the megalopolis of Beijing, 2012-2020. Agric. For. Meteorol. 333:109412. doi: 10.1016/j.agrformet.2023.109412
Pan, Y., Birdsey, R. A., Fang, J., Houghton, R., Kauppi, P. E., Kurz, W. A., et al. (2011). A large and persistent carbon sink in the world's forests. Science 333, 988–993. doi: 10.1126/science.1201609
Piao, S., Fang, J., Ciais, P., Peylin, P., Huang, Y., Sitch, S., et al. (2009). The carbon balance of terrestrial ecosystems in China. Nature 458, 1009–1013. doi: 10.1038/nature07944
Piao, S., He, Y., Wang, X., and Chen, F. (2022). Estimation of China’s terrestrial ecosystem carbon sink: methods, progress and prospects. Sci. China Earth Sci. 65, 641–651. doi: 10.1007/s11430-021-9892-6
Pregitzer, C. C., Hanna, C., Charlop-Powers, S., and Bradford, M. A. (2022). Estimating carbon storage in urban forests of new York City. Urban Ecosyst. 25, 617–631. doi: 10.1007/s11252-021-01173-9
R Core Team (2020). R: A language and environment for statistical computing. Austria, Vienna: R Core Team.
Shekhar, A., Hörtnagl, L., Buchmann, N., and Gharun, M. (2023a). Long-term changes in forest response to extreme atmospheric dryness. Glob. Chang. Biol. 29, 5379–5396. doi: 10.1111/gcb.16846
Shekhar, A., Humphrey, V., Buchmann, N., and Gharun, M. (2023b). More than three-fold increase of compound soil and air dryness across Europe by end of 21st century. Res. Square. doi: 10.21203/rs.3.rs-3143908/v2
Shen, G. (2023). Three decades of urban forestry in China. Urban For. Urban Green. 82:127877. doi: 10.1016/j.ufug.2023.127877
Soloway, A. D., Amiro, B. D., Dunn, A. L., and Wofsy, S. C. (2017). Carbon neutral or a sink? Uncertainty caused by gap-filling long-term flux measurements for an old-growth boreal black spruce forest. Agric. For. Meteorol. 233, 110–121. doi: 10.1016/j.agrformet.2016.11.005
Sun, S., Ouyang, S., Hu, Y., Zhao, Z., Liu, M., Chen, L., et al. (2023). rTRIPLEXCWFlux: an R package for carbon–water coupling model to simulate net ecosystem productivity and evapotranspiration in forests. Environ. Model Softw. 162:105661. doi: 10.1016/j.envsoft.2023.105661
Trotsiuk, V., Babst, F., Grossiord, C., Gessler, A., Forrester, D. I., Buchmann, N., et al. (2021). Tree growth in Switzerland is increasingly constrained by rising evaporative demand. J. Ecol. 109, 2981–2990. doi: 10.1111/1365-2745.13712
Wang, X., Blanken, P. D., Kasemsap, P., Petchprayoon, P., Thaler, P., Nouvellon, Y., et al. (2022). Carbon and water cycling in two rubber plantations and a natural Forest in mainland Southeast Asia. J. Geophys. Res. Biogeo. 127:e2022JG006840. doi: 10.1029/2022JG006840
Wang, Z., Cui, X., Yin, S., Shen, G., Han, Y., and Liu, C. (2013). Characteristics of carbon storage in Shanghai's urban forest. Chin. Sci. Bull. 58, 1130–1138. doi: 10.1007/s11434-012-5443-1
Wang, J., Feng, L., Palmer, P. I., Liu, Y., Fang, S., Bösch, H., et al. (2020). Large Chinese land carbon sink estimated from atmospheric carbon dioxide data. Nature 586, 720–723. doi: 10.1038/s41586-020-2849-9
Wang, Y., Tian, X., Duan, M., Zhu, D., Liu, D., Zhang, H., et al. (2023). Optimal design of surface CO2 observation network to constrain China’s land carbon sink. Sci. Bull. 68, 1678–1686. doi: 10.1016/j.scib.2023.07.010
Wang, Y., Wang, X., Wang, K., Chevallier, F., Zhu, D., Lian, J., et al. (2022). The size of the land carbon sink in China. Nature 603, E7–E9. doi: 10.1038/s41586-021-04255-y
Wutzler, T., Lucas-Moffat, A., Migliavacca, M., Knauer, J., Sickel, K., Šigut, L., et al. (2018). Basic and extensible post-processing of eddy covariance flux data with REddyProc. Biogeosciences 15, 5015–5030. doi: 10.5194/bg-15-5015-2018
Xie, J., Jia, X., He, G., Zhou, C., Yu, H., Wu, Y., et al. (2015). Environmental control over seasonal variation in carbon fluxes of an urban temperate forest ecosystem. Landsc. Urban Plan. 142, 63–70. doi: 10.1016/j.landurbplan.2015.04.011
Yang, Y., Shi, Y., Sun, W., Chang, J., Zhu, J., Chen, L., et al. (2022). Terrestrial carbon sinks in China and around the world and their contribution to carbon neutrality. Sci. China Life Sci. 65, 861–895. doi: 10.1007/s11427-021-2045-5
Yuan, W., Zheng, Y., Piao, S., Ciais, P., Lombardozzi, D., Wang, Y., et al. (2019). Increased atmospheric vapor pressure deficit reduces global vegetation growth. Sci. Adv. 5:eaax1396. doi: 10.1126/sciadv.aax1396
Zhang, X., Brandt, M., Tong, X., Ciais, P., Yue, Y., Xiao, X., et al. (2022). A large but transient carbon sink from urbanization and rural depopulation in China. Nat. Sustain. 5, 321–328. doi: 10.1038/s41893-021-00843-y
Zhang, Z., Zhang, L., Xu, H., Creed, I. F., Blanco, J. A., Wei, X., et al. (2023). Forest water-use efficiency: effects of climate change and management on the coupling of carbon and water processes. For. Ecol. Manag. 534:120853. doi: 10.1016/j.foreco.2023.120853
Zhao, M., Yang, J., Zhao, N., Xiao, X., Yue, T., and Wilson, J. P. (2021). Estimation of the relative contributions of forest areal expansion and growth to China's forest stand biomass carbon sequestration from 1977 to 2018. J. Environ. Manag. 300:113757. doi: 10.1016/j.jenvman.2021.113757
Zhao, D., Zhang, Z., and Zhang, Y. (2023). Soil moisture dominates the Forest productivity decline during the 2022 China compound drought-heatwave event. Geophys. Res. Lett. 50:e104539. doi: 10.1029/2023GL104539
Zheng, J., Blanco, J. A., Wei, X., and Liu, C. (2018). Sustainable management of Metasequoia glyptostroboides plantation forests in Shanghai. Forests 9. doi: 10.3390/f9020064
Zheng, J., Sun, N., Yan, J., Liu, C., and Yin, S. (2023). Decoupling between carbon source and sink induced by responses of daily stem growth to water availability in subtropical urban forests. Sci. Total Environ. 877:162802. doi: 10.1016/j.scitotenv.2023.162802
Zheng, H., Yu, G., Zhu, X., Wang, Q., Zhang, L., Chen, Z., et al. (2018). A dataset of actual evapotranspiration and water use efficiency of typical terrestrial ecosystems in China (2000–2010). Sci. Data Bank. doi: 10.11922/sciencedb.610
Keywords: intra-annual variations, carbon fluxes, urban forests, resource-use efficiency, growing season
Citation: Zheng J, Han Y, Sun N, Ye Y, Yan J, Zhang W and Yin S (2023) Intra-annual carbon fluxes and resource use efficiency of subtropical urban forests: insights from Chongming Island ecological observatory. Front. For. Glob. Change. 6:1294249. doi: 10.3389/ffgc.2023.1294249
Edited by:
Lisu Chen, Shanghai Maritime University, ChinaReviewed by:
Min Liu, East China Normal University, ChinaHongtao Xie, Zhejiang Agriculture and Forestry University, China
Copyright © 2023 Zheng, Han, Sun, Ye, Yan, Zhang and Yin. This is an open-access article distributed under the terms of the Creative Commons Attribution License (CC BY). The use, distribution or reproduction in other forums is permitted, provided the original author(s) and the copyright owner(s) are credited and that the original publication in this journal is cited, in accordance with accepted academic practice. No use, distribution or reproduction is permitted which does not comply with these terms.
*Correspondence: Shan Yin, eWluc2hhbkBzanR1LmVkdS5jbg==