 Madeleine Udahogora
 Yang Zhaoping1,2*
94% of researchers rate our articles as excellent or good
Learn more about the work of our research integrity team to safeguard the quality of each article we publish.
Find out more
ORIGINAL RESEARCH article
Front. For. Glob. Change , 22 January 2024
Sec. Forest Disturbance
Volume 6 - 2023 | https://doi.org/10.3389/ffgc.2023.1292364
This article is part of the Research Topic Global Excellence in Forest Science: Africa View all articles
Introduction and aim: Ensuring the protection and restoration of forest ecosystems is vital to maintaining and restoring ecological balance in deforested or degraded landscapes. However, sustainable development faces challenges from high human impacts on natural forest ecosystems, insufficient advanced conservation measures, and limited engagement of local communities in developing nations. The aim of this study was to explore the utility of spatial remote sensing datasets in examining the landscape pattern changes within the transboundary Nyungwe-Kibira Forest from 2000 to 2019. This aimed to emphasize the necessity of understanding the intricate dynamics of this ecosystem and its susceptibility to human activities in order to bolster diverse restoration initiatives throughout the region.
Methods: The landscape pattern change in the Nyungwe-Kibira between 2000 and 2019 was analysed using high-resolution Landsat data. This analysis encompassed an evaluation of the dynamics of changes in built-up, cropland, and forest areas within the region. Especially, primary data derived from the Landsat dataset and secondary data from reports such as the Outlook Report were employed to elucidate the ongoing landscape transformation within and surrounding the transboundary forest.
Results and discussion: The analysis revealed a net change of +62.3% and +18.07% in built-up and cropland areas, resulting in a gross change of 14,133 ha and 6,322 ha in built-up and cropland areas, respectively. Furthermore, the forest experienced an overall gain of 9.11%, corresponding to a net loss of 6.92% due to deforestation, estimated at -14,764 ha. The analysis also indicated that built-up areas accounted for approximately 33.02% of the net forest loss, primarily affecting the northern edge of the Rwanda region, while cropland expansion contributed to a net loss of forest (-9.48%), predominantly impacting the southeast portion of the forest in Burundi. Additionally, the forest is predicted to decrease by 0.74% by 2030, with current findings showing aggregated forest and cropland at 66% and 7%, dissected rangeland at 24%, and created built-up areas at 3%. The findings indicate that the Nyungwe-Kibira Forest is undergoing notable transformations, highlighting the necessity of land-based projects and mitigation plans to facilitate the restoration of the forest from its historical changes. Without proactive measures, an ongoing decrease in forest area by 2030 is anticipated.
As one of the most prevalent natural resources worldwide, forests cover almost 4 × 10⁷ km2, equivalent to 31% of the worldwide terrestrial surface (Danjon et al., 2013; Zhao et al., 2022). Forest ecosystems provide society with important functions from ecological, social, and economic perspectives (Çakir et al., 2008). More crucially, these ecosystems play an irreplaceable role in maintaining the balance of the Earth’s living systems and environment. Unfortunately, one of the earliest and still ongoing anthropogenic impacts on the biosphere is the clearing out of the original forest vegetation coverage and its substitution by other different human-induced structures or activities (Bogaert et al., 2008, 2011). The latter directly affects the ecosystem structure and function of the regions and is taken as the most prevalent influence on ecosystem degradation (Cui et al., 2022). Several observations highlight that forest ecosystems have been significantly degraded or endangered in many places around the world. The ecologically most substantial impact of this sort is deforestation, and this has been an ongoing, persistent forest loss in the world. For instance, all over the tropical and subtropical areas of the world, the mangroves were subjected to highly remarkable levels of deforestation of up to 3.6% per annum (Bryan-Brown et al., 2020). The majority of present mangrove forest loss takes place in southeast Asia, where about half of the remaining mangrove forest is situated, with countries such as Myanmar, Indonesia, and Malaysia showing losses of 0.70%, 0.26%, and 0.41% annually, respectively (Hamilton and Casey, 2016).
In Africa, especially in its central-eastern part, deforestation has been reported to increase in several forests, such as in the Democratic Republic of the Congo (DRC), where several hectares of forest have been stripped for mining activities, agricultural activities, and charcoal production (Tegegne et al., 2016). In Uganda, the Kibale National Park and the park located around Bwindi in the southwest of the country experienced great forest loss in the last half century, and this was attributed to the production of charcoal and agricultural expansion (Sassen and Sheil, 2013; Sassen et al., 2015). Moreover, Rwanda and Burundi faced a decline in forest size, mostly owed to anthropogenic disturbances, most especially agricultural extension (Gebauer and Doevenspeck, 2015). The above-mentioned situation is currently blamed for being responsible for carbon emissions, the shrinkage of ecosystem services, and the loss of biodiversity, among others (Montibeller et al., 2020). These environmental havocs have also increased due to forest fragmentation (Chaplin-Kramer et al., 2015) as a result of either natural or anthropogenic disturbances such as the construction of roads, logging, conversion to agriculture, wildfire, pollution of air, water, and soil, and losses of productive lands and biodiversity degradation. All these are responsible for the landscape pattern changes that are increasingly threatening ecosystem productivity and health on a local, regional, and global scale. However, forest fragmentation is among the main drivers of landscape pattern change. The human origin of this problem is currently at an elevated risk of further fragmentation than forests fragmented by natural sources. The associated changes in landscape patterns are closely related to disturbances and ecological processes at different scales within ecosystems. Thus, assessing the level of landscape pattern change caused by these sources might be an essential tool for policy and decision makers permitting for improved risk assessments and excellent targeting of zones for protection and regeneration (Bogaert et al., 2008). The forest landscape decrease is the major factor explaining and describing forest fragmentation. Owing to the above, landscape pattern change has been a source of considerable scientific debate since the early application of biogeography theory (Ewers et al., 2011) and the design of nature reserves (Diamond, 1975; Simberloff and Abele, 1976). These debates have led to different visionary experiments that have probably had the greatest impact on the general understanding of the ecological impact of forest fragmentation, depending on the patterns or spatial configuration imposed on a landscape and how it varies both temporally and spatially (Laurance et al., 2002; Gardner et al., 2009). Therefore, the level of forest fragmentation status could be assessed to provide critical information for future planning of forest management and conservation.
Understanding landscape patterns and their changes over time involves the use of statistical measures, also called metrics or indices, that describe the landscape composition and configuration (Reddy et al., 2013). The quantification and comparison of landscape indices have been recognized as the most effective way to assess landscape pattern change by various researchers (Abdullah and Nakagoshi, 2007; Long et al., 2010; Reddy et al., 2013; Uezu and Metzger, 2016; Sharma et al., 2017; Wickham and Riitters, 2019; Da Ponte et al., 2021; Devi and Shimrah, 2021; Pyngrope et al., 2021). The assessment of landscape pattern change has been completed for many countries using the previously mentioned techniques. For instance, Rudel and Roper (1997) conducted a cross-national analysis for the assessment of forest fragmentation and reported that West Africa and Central America are the most fragmented in the world. At the global level, India showed a moderate level of forest fragmentation. The review of Rudel and Roper (1997) also emphasized the temporal evaluation of forest change by assessing the level of fragmentation. The process of forest fragmentation results in an increase in the number of patches, a decrease in patch sizes, and increased patch isolation, which together address the quantitative measures of fragmentation. The study conducted by Wulder et al. (2008) on fragmentation analysis in Canada’s forest revealed an increasing trend of fragmentation.
On the other hand, remote sensing-based tools have proven their ability and appropriateness in quantifying the level of forest cover changes, as they can cover large-scale areas and transcend country borders when the study is carried out on a transboundary scale. Furthermore, it provides an unprecedented perspective on changing forest cover, allowing continuous maps to be constructed and spatio-temporal patterns of fragmentation to be analyzed (Taubert et al., 2018). To this end, previous studies have highlighted the importance of integrating the spatio-temporal distribution pattern (Martensen et al., 2017) and historical land use change (Vellend et al., 2007; Krauss et al., 2010) into studies of forest fragmentation. The increased availability of maps showing changes in land use and land cover (LULC) over time, particularly those generated from earth observation satellites (Hansen et al., 2013) and light detection and ranging technology (LiDAR) (Nunes et al., 2022), is making it easier to integrate fragmentation-trend maps into biodiversity studies.
Transboundary regions are geographical areas near or crossing national borders that often coincide with biodiversity hotspots (Cui et al., 2022). These areas face challenges when conservation policies clash with political boundaries. Globalization contributes to transforming border areas into urban centers with dense populations and heightened trade, causing detrimental effects on ecosystems. Additionally, weak governance in remote border regions exacerbates habitat changes, species invasions, pollution, and illegal resource use (Gurung et al., 2019). Therefore, space–time changes of landscape pattern changes in transboundary areas and their assessment considering different models with their detailed methodological approach are urgently required. Although effectual programs to conserve forest biodiversity in fragmented areas necessitate a clear knowledge of the evolution and spatial distribution of the forest fragments’ size over time (Carranza et al., 2015), these issues remain nearly unknown for the Southern Albertine Rift landscape, especially in the transboundary Nyungwe-Kibira Forest (wealthy in biodiversity). The forest has been reported to be constrained by illegal and legal timber collection, an inappropriate system of land tenure, and the conversion into agricultural extension (Rutebuka et al., 2017). This set up high preeminence on the agenda of the local government in drawing up scientifically driven forest protection and restoration policies and land use planning. Previous broader-scale assessments of deforestation trends in the Albertine Rift (Hartter et al., 2011; Twongyirwe et al., 2015; Akinyemi, 2017; Ryan et al., 2017) provide useful regional context but do not examine forest fragmentation processes at the local level. Moreover, while previous assessments have analyzed Nyungwe and Kibira as separate protected areas, the transboundary nature of this interconnected forest landscape has been rarely considered in fragmentation studies. For instance, the Nyungwe national park has only previously been considered to evaluate the relationship between national park management and local communities perceptions based on Survey (Nyirarwasa et al., 2020), study climatology and potential climate change impacts (Seimon, 2012), assess the privatization of the park buffer zone and its implications for adjacent communities (Gross-Camp et al., 2015), analyze the contribution of community conservation and ecotourism projects on improving livelihoods and sustainable biodiversity conservation in and around the Park (Imanishimwe et al., 2018), examine the quality and performance nexus of the community-based ecotourism enterprises (Munanura et al., 2018), assess forest dependency and its implications for protected areas management (Masozera and Alavalapati, 2004), and evaluate the conservation efforts of multi-projects using remote sensing and Light Use Efficiency Model (Rutebuka et al., 2017).
On the other hand, previous studies considered Kibira National Park to assess local community views on its ecosystem services (Ndayizeye et al., 2020), evaluate its structure and floristic composition (Hakizimana et al., 2016), and analyze the morphometry of the park using geospatial techniques (Sibomana et al., 2018). Unfortunately, very limited studies have considered these parks as transboundary forests between Rwanda and Burundi, also known as the transboundary Nyungwe-Kibira (NY-K) forest. Considering the two parks, Kayiranga et al. (2016) monitored the forest cover change and fragmentation using remote sensing and landscape metrics in Nyungwe-Kibira Park confined to outdated periods (1986–2015), whereas Ochanda (2012) analyzed the potential impacts of climate change on birds in the Albertine Rift as a baseline study of Nyungwe and Kibira forests. Based on the above-provided background, it is clear that the spatio-temporal dynamics of forest loss and fragmentation, specifically in the interconnecting corridors between the parks, remain understudied and poorly characterized. Similarly, the aforementioned studies have been conducted with less attention and emphasis on communicating the most current level of forest cover change within the Nyungwe-Kibira parks. Doing so in this study presents the worthiness and originality of this research, serving as a complementary work, providing a contribution to the existing few studies within the same scope, and contributing a new insight to improve the understanding of transboundary forest dynamics.
Given the numerous significant ecological changes affecting this particular transcend forest, we suggest exploring the change in levels within the forest and its surrounding landscape as a means to monitor the deterioration of this ecosystem. Notwithstanding the urbanization explosion that amplifies the land use dynamics, informing and discussing where land-based projects will fundamentally cut down the magnitude of disturbance drivers may be significant in land use mitigation plans to allow restoration from forest historical changes. In line with the above, the study hypothesized that land use changes driven by expanding human activities are significantly contributing to deforestation and fragmentation within the Nyungwe-Kibira transboundary forest ecosystem over time. Therefore, it is urgently required to have well-considered, relevant policies to mitigate the effects of change or adapt to the consequences. The current study seeks to: (1) address the forest landscape cover dynamics under temporal land use change events (current and future); (2) assess the spatio-temporal forest cover transformations/fragmentation; and (3) discuss the driving forces influencing the forest changes in the region.
The Belgian colonial authority gazetted the first forest reserve, Nyungwe-Kibira Forest, in 1933, uniting Nyungwe woodland and Kibira forest. It is located within the border in the southwest of Rwanda and stretches to the Kibira National Park in the northwest of Burundi, and it is one of the East-African tropical mountain rainforests (Figure 1).
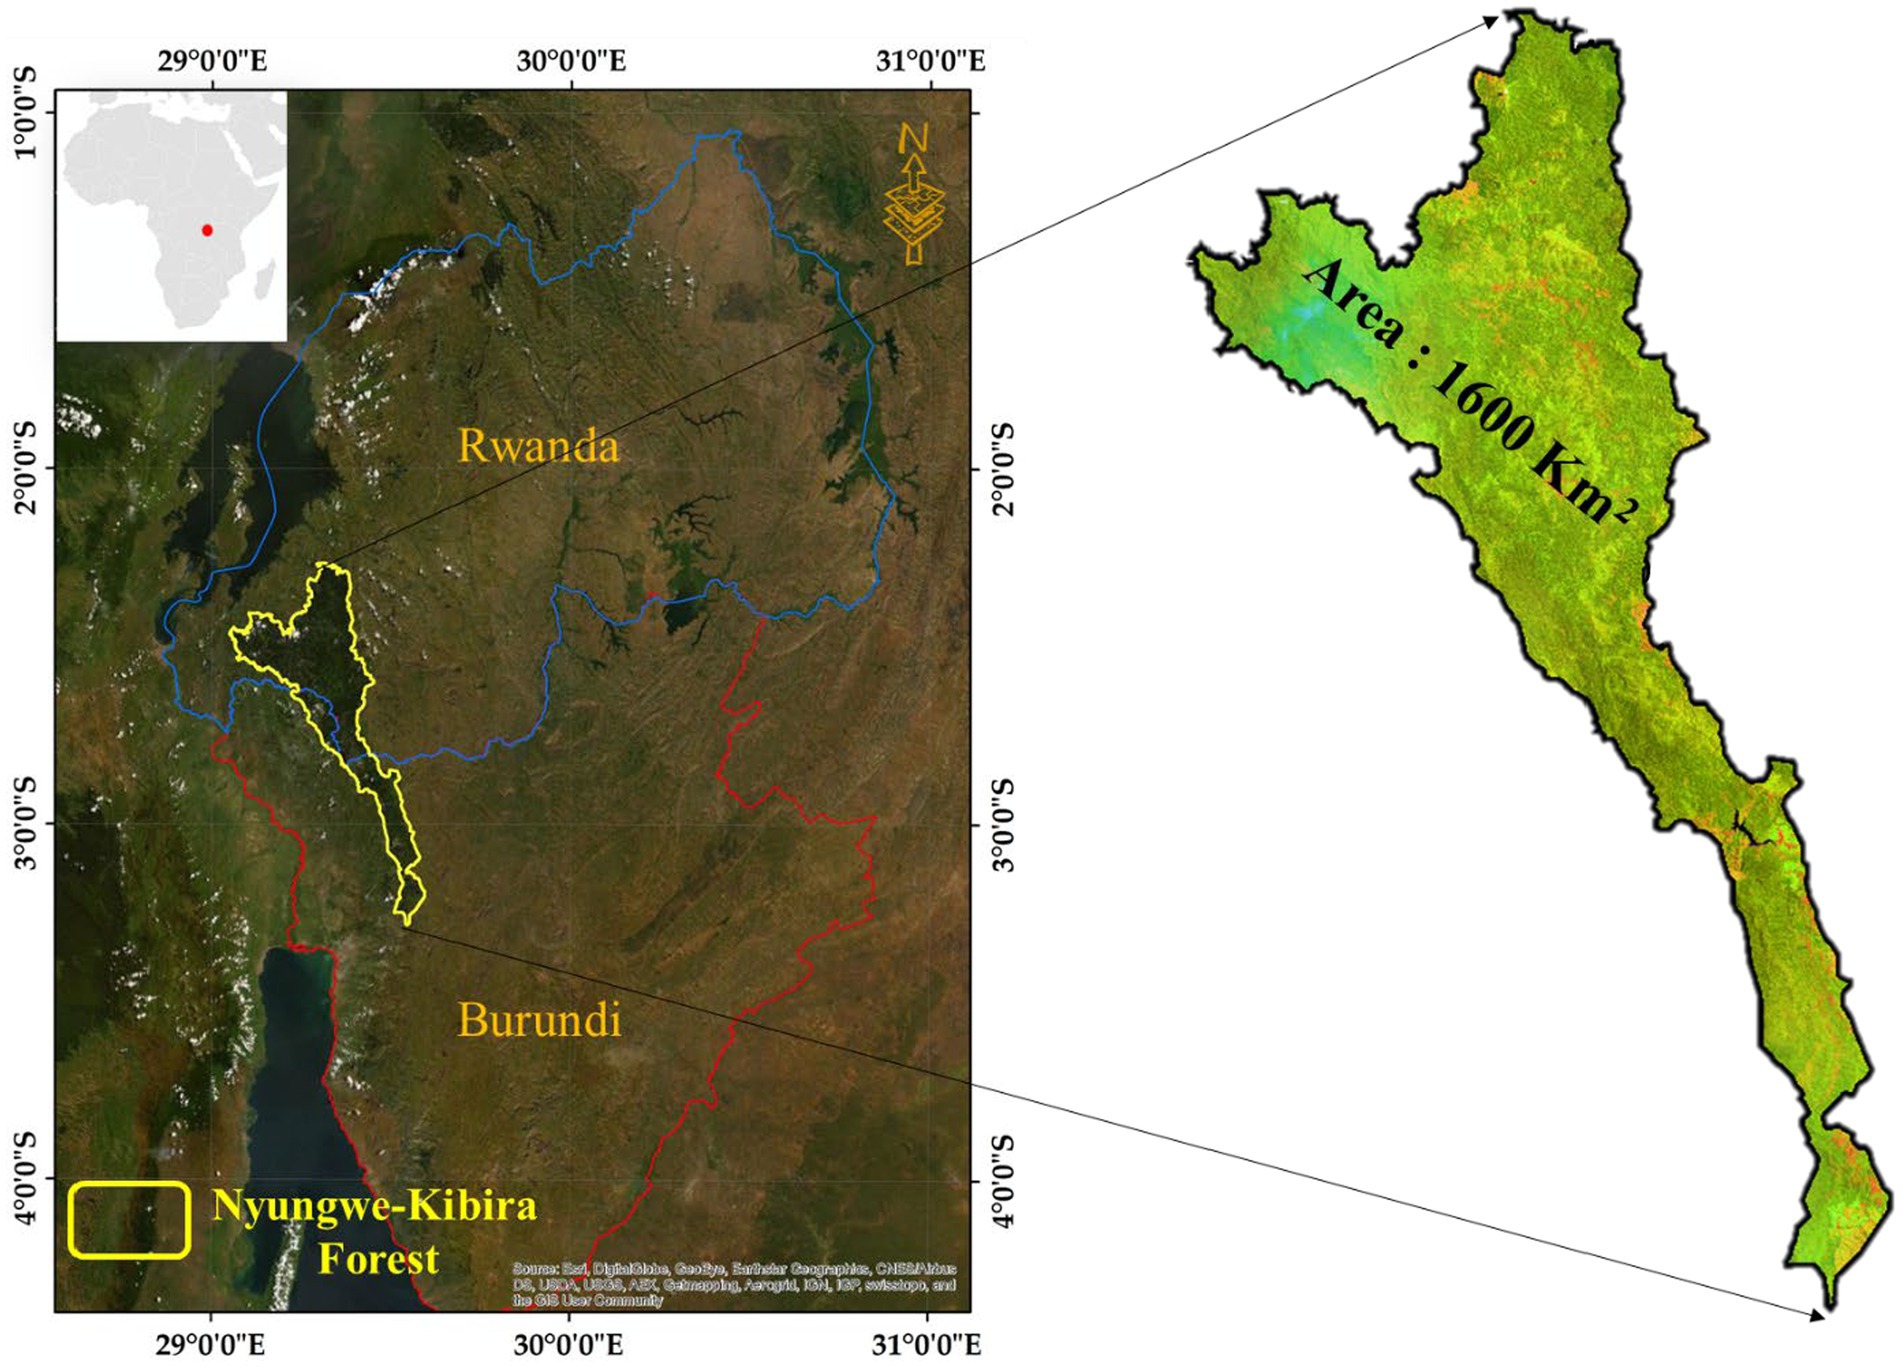
Figure 1. Location of the Nyungwe-Kibira transboundary forest.
The Nyungwe-Kibira Forest, designated as the intersection of the Nile and Congo River Basins between 1962 and 1988, holds great significance as the primary source of water for Rwanda and northwestern Burundi. Nyungwe and Kibira were subsequently designated as national parks in 2005 and 1996, respectively. The forest, spanning approximately 1,600 km2, experiences a tropical climate with distinct dry and rainy seasons, characterized by daily temperatures ranging from 14.4°C to 19.9°C and a mean annual rainfall of 1744 mm. As outlined by the United Nations Food and Agriculture Organization (UNFAO), the Nyungwe-Kibira Forest is a biodiversity hotspot, boasting over 200 species of trees and 644 plant species, along with 98 animal species, 43 bird groups, and 98 different bird species. The study site is positioned within an elevation range of 1,012–2,944 m above sea level, adding to the diverse ecological makeup of the area.
With remote sensing, the current study makes use of geospatial and statistical data to address the NK park landscape dynamics. To extract data on the NK landscape from 2000 to 2019, 30-m resolution Landsat images were downloaded from the USGS EROS data center. Landsat’s 30-m spatial resolution captures subtle forest cover changes like deforestation, reforestation, and structural alterations within forests and at edges and patches. Its 16-day revisit time also enables regular monitoring of land cover dynamics. This level of spatial and temporal detail suits our study area extent, enabling precise analyzes and reliable interpretation of land cover changes both inside and outside forests over time. These images were terrain-corrected for radio-geometric accuracy using ArcGIS and TerrSet, after which the area of interest was extracted for land use classification. The land cover types of the research area were classified using a hybrid maximum likelihood classification (MLC) technique (unsupervised and supervised classification). This technique, which is regarded as one of the most effective classification algorithms in remote sensing, involves assigning a raster pixel to the class with the highest posterior probability. The theory and formulation of the hybrid MLC algorithm have been well developed and extensively documented (Ahmad and Quegan, 2012).
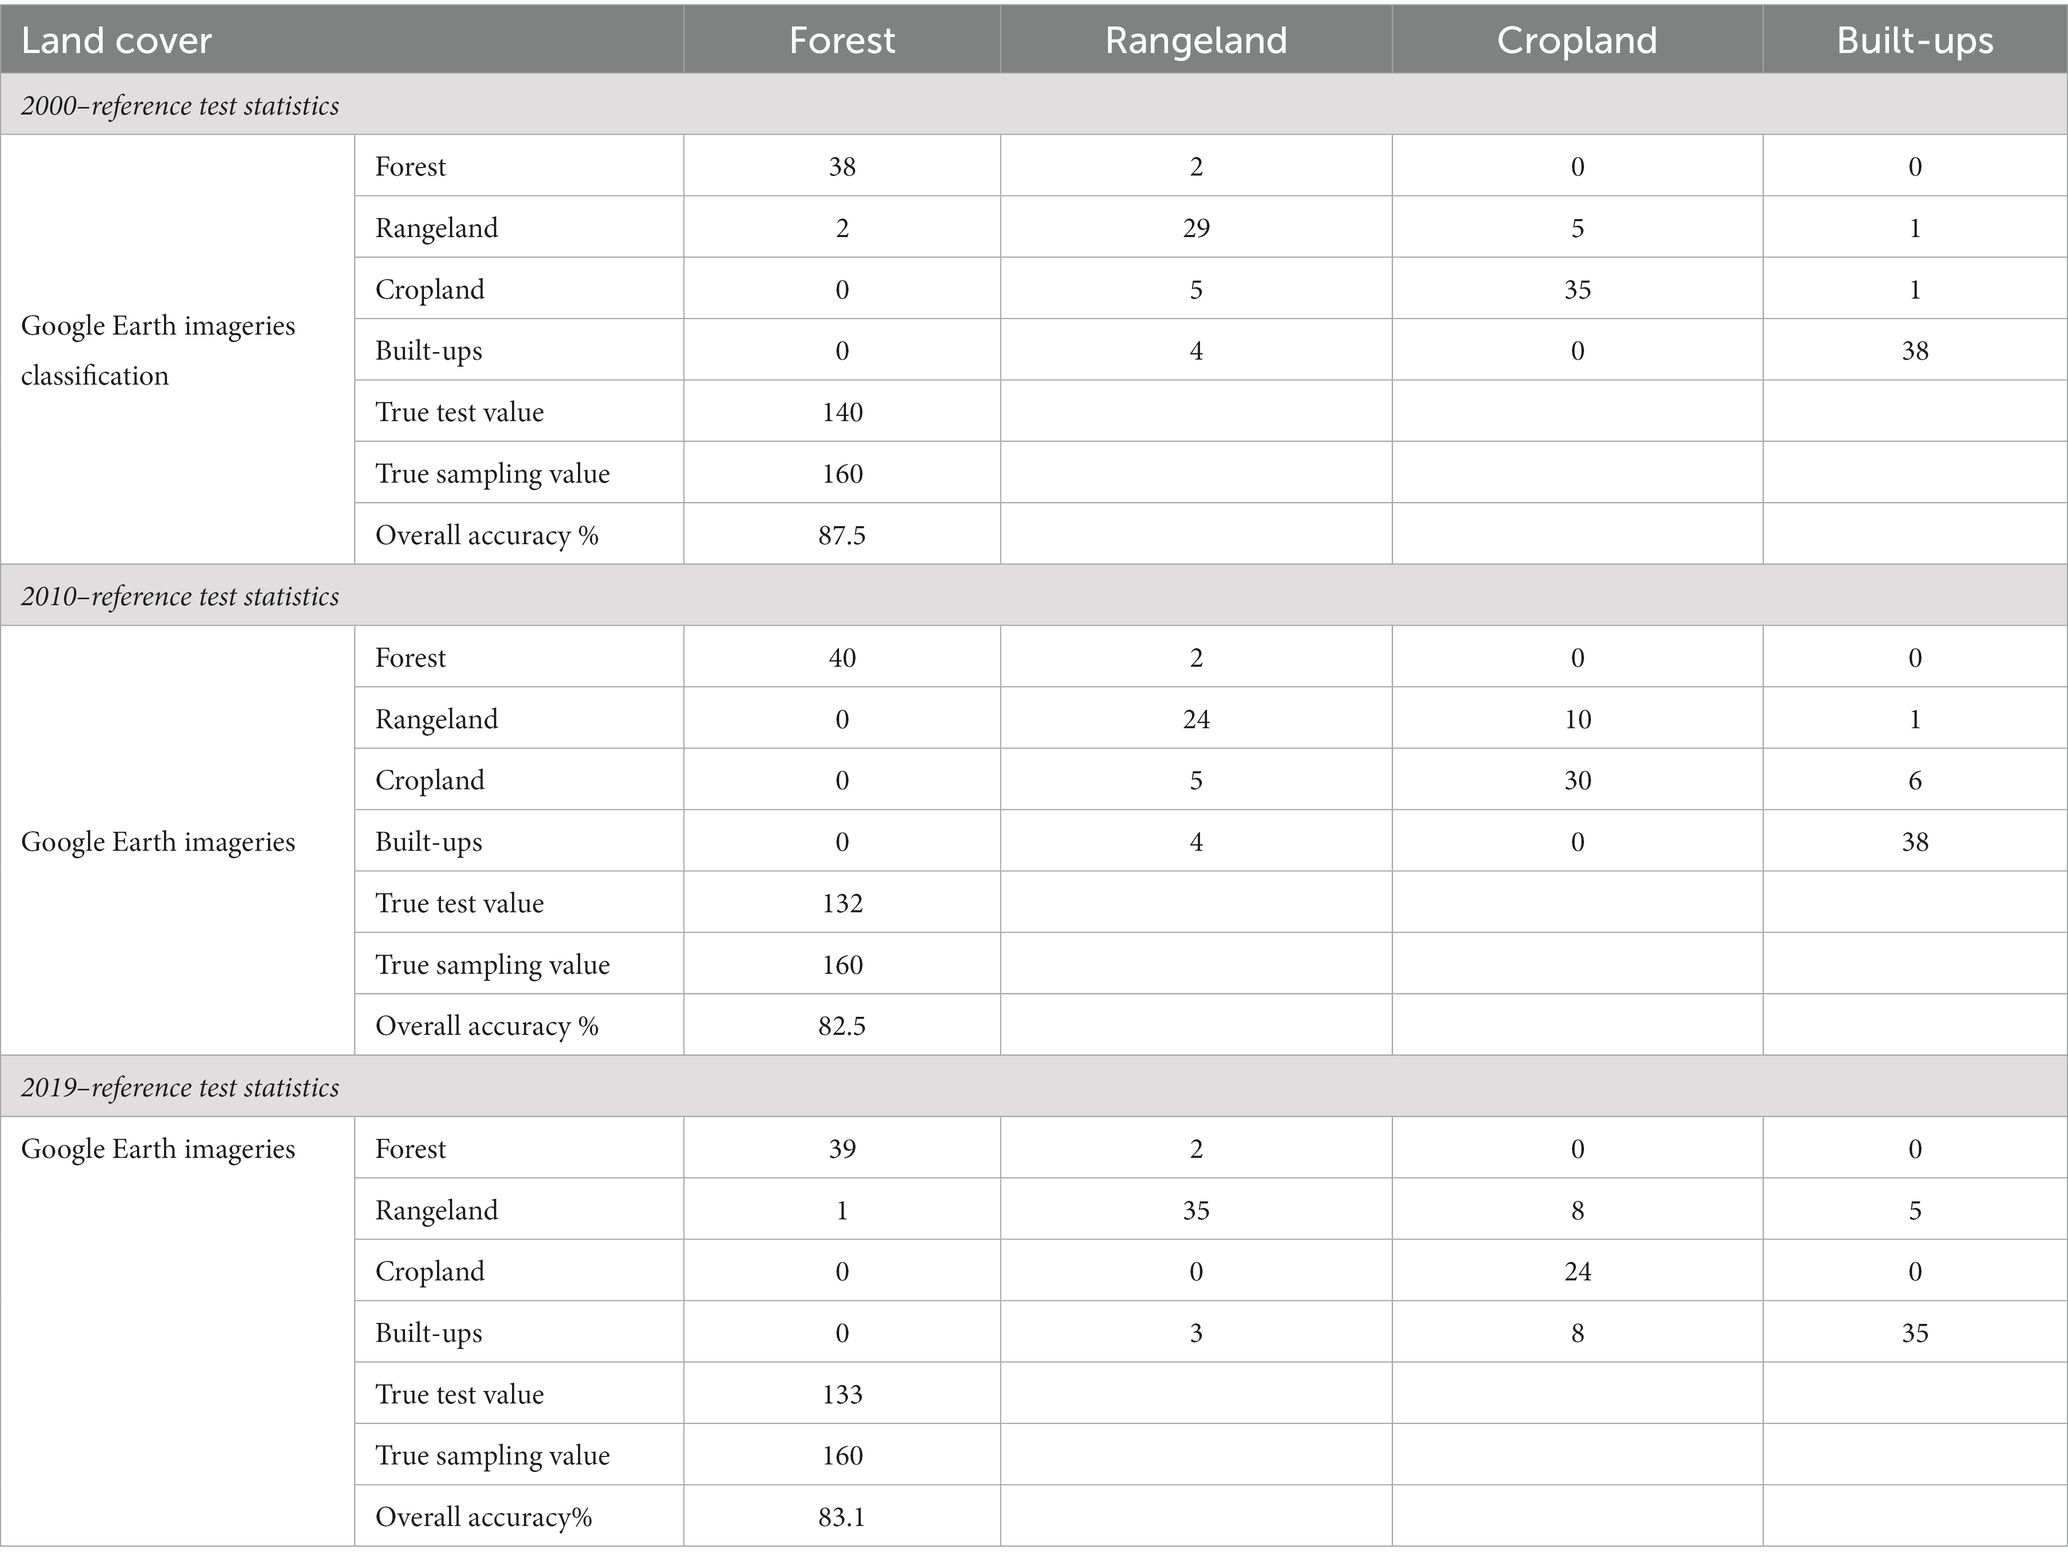
Table 1. Accuracy from confusion error matrix of main land cover classification of Nyungwe-Kibira Forest (2000, 2010, 2019).
Based on the historically derived land cover dataset, we applied the multi-layer perceptron (MLP) neural network approach under the land change model (LCM) to retrieve the potential land use transitions from which land use change events were derived. Land use change events refer to changes from one land cover type to another, such as transitions from forest to cropland (Rudel et al., 2005; Long et al., 2021). Some examples include cropland expansion, deforestation, urbanization, and wetland loss or gain. Explicitly, a transition from forest to cropland represents the land use change event of cropland expansion, while any type of transition to forest is referred to as afforestation. By modeling the transitions between all land cover types, the LCM allows us to identify land use change events across the landscape. In addition, the MLP has been extensively elaborated to provide an automatic mode that does not require any user intervention (Eastman, 2012) and can gather multiple substitutions into a single group while also providing valuable information on multiple transitions that share the same explanatory variables (Figure 2).
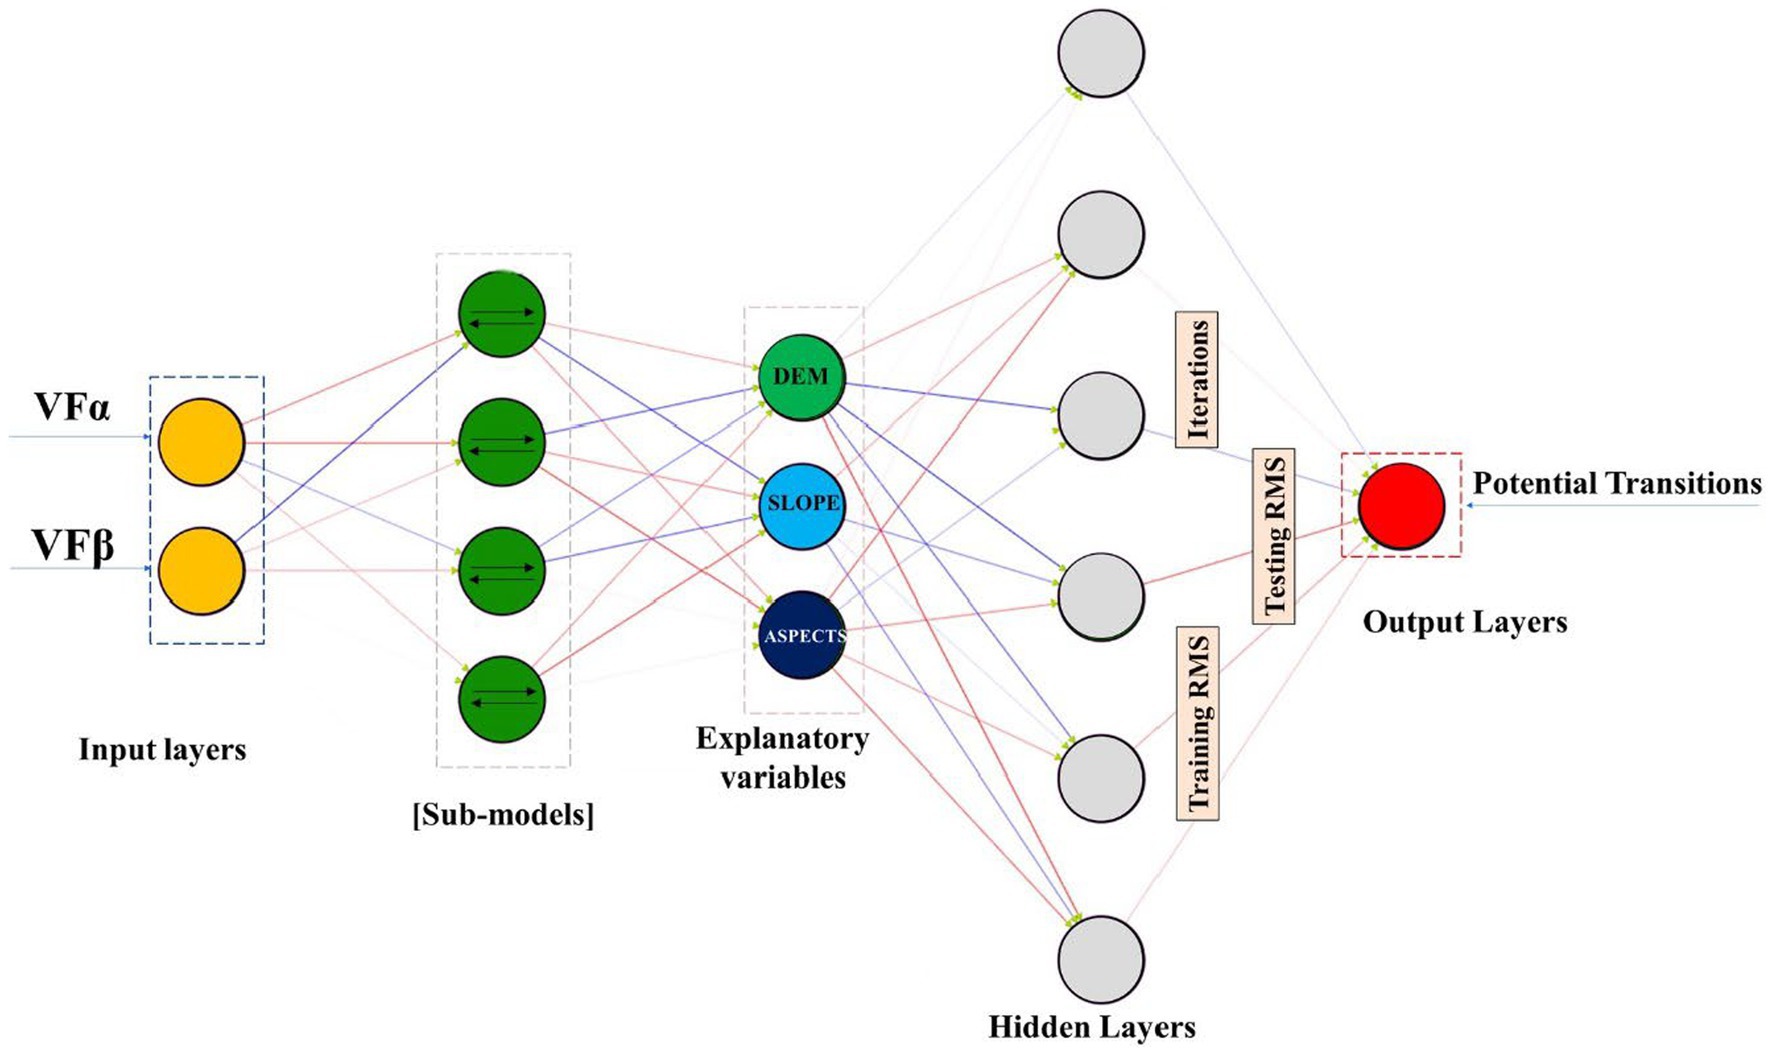
Figure 2. MLP artificial neural network for potential changes (net change assessment).
To retrieve the land cover transitions or land use change events (output layers), a supervised training algorithm (back propagation [BP]) was applied considering the temporal land cover fractions (VFα: beginning year, VFβ: land cover of the study ending year) that were introduced as input layers in the network. In addition, elevation, slope, and aspects were introduced as explanatory variables. Here, the input layers comprised the neurons ro, which gathered a normalized set of input variables of ji (i = 1, 2, 3, … r0), whereas the hidden layers contained the neurons r1 and received a set of variables of ki (i = 1, 2, 3, … r1). These were connected to the explanatory variables layers that contain the neurons r3 and receive a set of variables of li (i = 1, 2, 3, … r2). To generate weights of neurons in each layer for each output of neurons of the input, a continuous non-linear mapping is performed in the ro neurons of ji variables toward the ki variables and then to the li variables (Taud and Mas, 2018). Overall, the MLP is fed by samples taken from pixels that went through the transition under modeling, or those from persistence. The gathered cells are further disjointed into two clusters, where 50% are used for training (training RMS) and the remaining proportion for validation (testing RMS) of the potential transition to generate the nexus between transition probability and explanatory variables. The obtained weights are significant in reducing accuracy-prone errors. Therefore, once the accuracy reaches the maximum repetition, the probability of transition maps of the sub-model attains the suitability of LCLU categories over the simulated time. Still, the MLP provides the report with the aggregate accuracy and skill measure scores, which are expressed as follows (Eastman, 2012):
And the most common MLP neural network (NN) approach training is the BP, which is defined by reducing the cost function as:
To predict the forest cover change, the study employed the CA-Markov chain model, which combines cellular automata and the Markov chain model (Singh et al., 2015). This model was chosen because of its capacity to accurately reflect non-linear, spatial, and scholastic processes (Wang et al., 2012). Furthermore, both approaches take into account the geographical and temporal mechanisms of landscape cover dynamics, and both analyzes are suitable for landscape cover change detection and simulations (Hyandye and Martz, 2017). The CA-Markov model’s advantages over other models for the same purpose, such as GEOMOD or CLUE (Conversion of Land Use and its Effect at Small Regional Extent), are based on its high efficiency, ease of calibration, and capacity to predict multiple land cover and complicated patterns (Behera et al., 2012). Apart from that, CA-Markov also provides and facilitates more detailed simulations (Memarian et al., 2012). The model is explained by the following expressions (Equations 1–3) and extensively documented (Eastman, 2012; Gidey et al., 2017):
Calibration and validation of the model for future change prediction is a significant step in the modeling process (Singh et al., 2015). In addition, modeling landscape changes without validating or testing them to see how well they work and can anticipate the specific changes under consideration is scientifically meaningless (Gruhl, 1979; Aboud et al., 2009; Sargent, 2013). One of the best approaches for evaluating the prediction power of the CA-Markov chain model was utilized in the current investigation to match the model: kappa statistics. It is based on using K statistics, such as kappa for location (Klocation), kappa for quantity (Kquantity), and kappa for no information or no ability (Kno), to compare simulation results to current-day changes, and then using the model to predict future changes once the model is optimized with reasonable performances. The overall correctness of the simulation run is indicated by Kno, which is a version of the standard kappa index of agreement. The Klocation validates simulations’ ability to simulate location, whereas the Kquantity simulates the quantity (Carletta, 1996). When all three Kno, Klocation, and Kquantity indices are equal to “1,” the simulation is regarded as flawless; if they are all equal to “0,” the simulation is considered defective (Kraemer et al., 2002; Mandrekar, 2011; McHugh, 2012). Therefore, the predictive power of the CA-Markov chain model is greater; when the efficiency is 80% for the initial year image (2019), it will be reasonably good to generate reasonable future projections. The kappa accuracy index was used to determine the precision of the simulation or classification image findings pixel-by-pixel. This metric assesses the goodness of fit between simulations and reality (Mukherjee et al., 2009). The kappa variations and arithmetic languages used for the summary statistics are as follows:
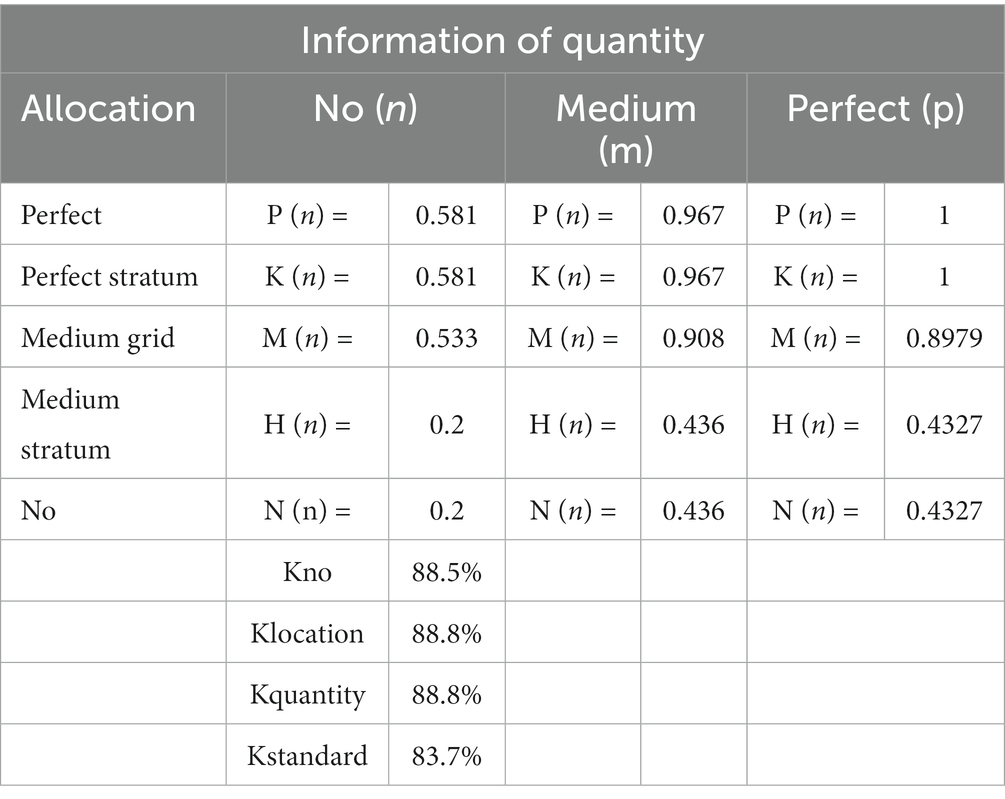
Table 2. Classification agreement/disagreement according to the ability to specify accurate quantity and allocation (kappa validation on CA-Markov chain model).
To analyze the temporal forest transformations and regime shifts among vegetation types, we employed a two-layered feed-forward model active in the TerrSet Geospatial Modeling Software, namely Land Change Modeler (LCM) for patch transition analysis and Habitat–Biodiversity Modeler (HBM) for landscape pattern analysis and change process (LCPA). A landscape change process analysis (LCPA) technique was adopted to measure the land cover change underway within the landscape classes to characterize the nature of vegetation transformation. The technique models the process by employing a decision tree algorithm (Figure 3) that compares the n land cover patches in each class between periods to vary in their areas and distributions. The input variables into the tree include patch size (s), length of the edge (e), and the number of patches (n) of the target area. These variables are the most promising elements in the landscape change process since they include noticeable changes in the landscape (Chen and Pontius, 2010). At this stage, earlier and late datasets were compared, and 3 of 10 landscape transformations were detected, as presented in the Results section. Table 3 presents their description, whereas Figure 3 illustrates the landscape change process and the assigned landscape transformation types that are being experienced.
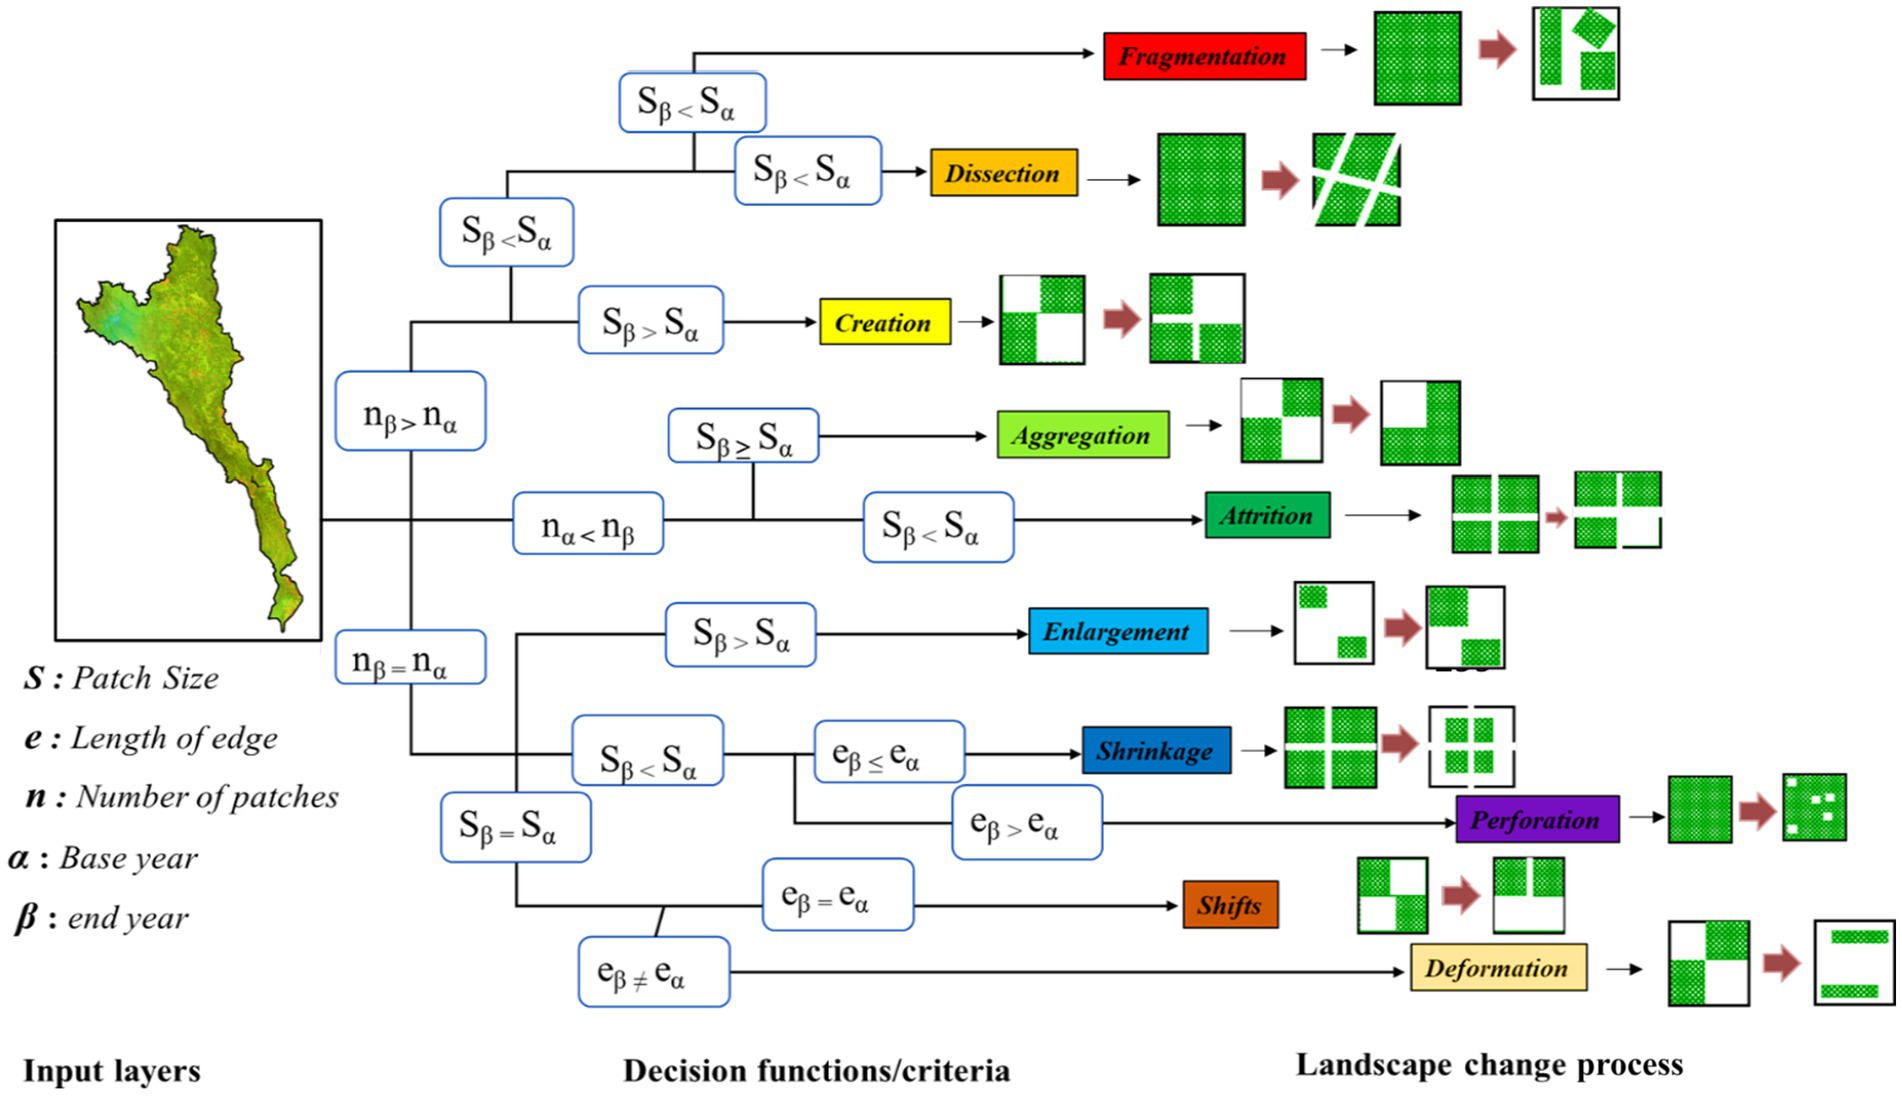
Figure 3. Decision tree of the Nyungwe-Kibira Forest landscape change process and assigned landscape transformation types that are being experienced.
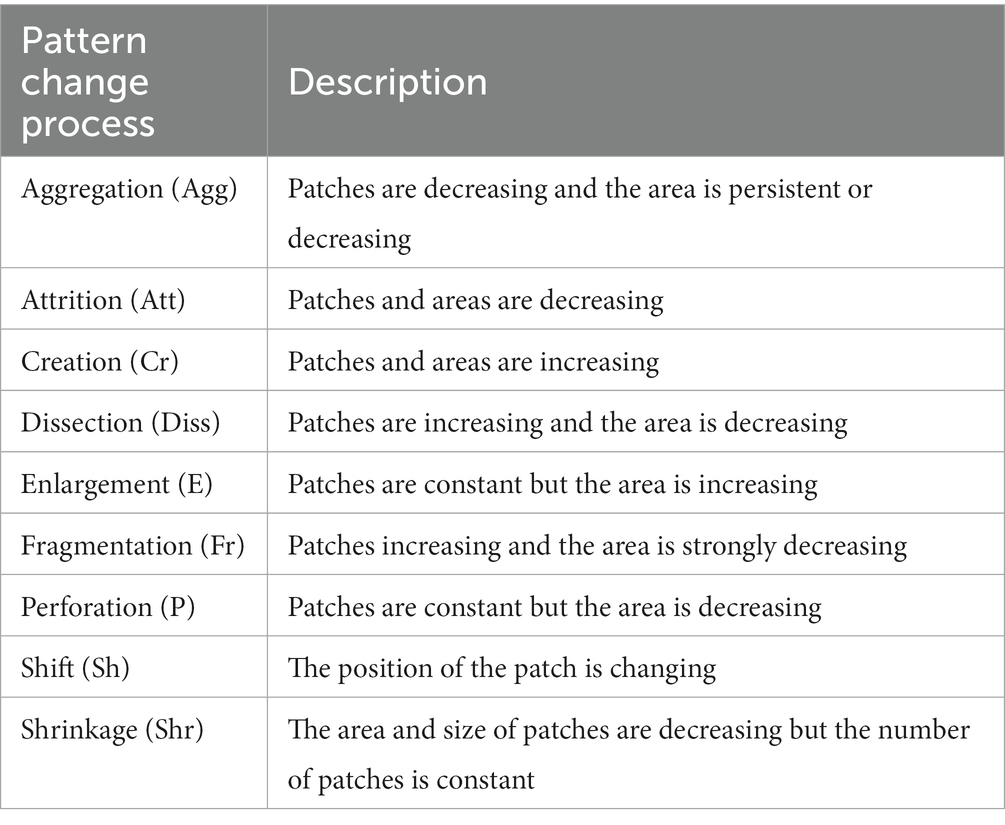
Table 3. Description of landscape transformation types to be assessed.
Rwanda and Burundi’s forest cover areas have been decreasing over the years due to unceasing demands on land for agriculture-induced activities, which are the main source of subsistence (van Soesbergen et al., 2017). With limited land area, demographics, and urbanization explosion, the land use pressures on forest ecosystems are critical (Laurance et al., 2006). As the first objective of our study was to explore the forest landscape change dynamics under potential land use change events, Figures 4–6 show the spatial land use change extent across the study area of interest, including gross, net change, and net contributions to forest change with a decade interval of difference.
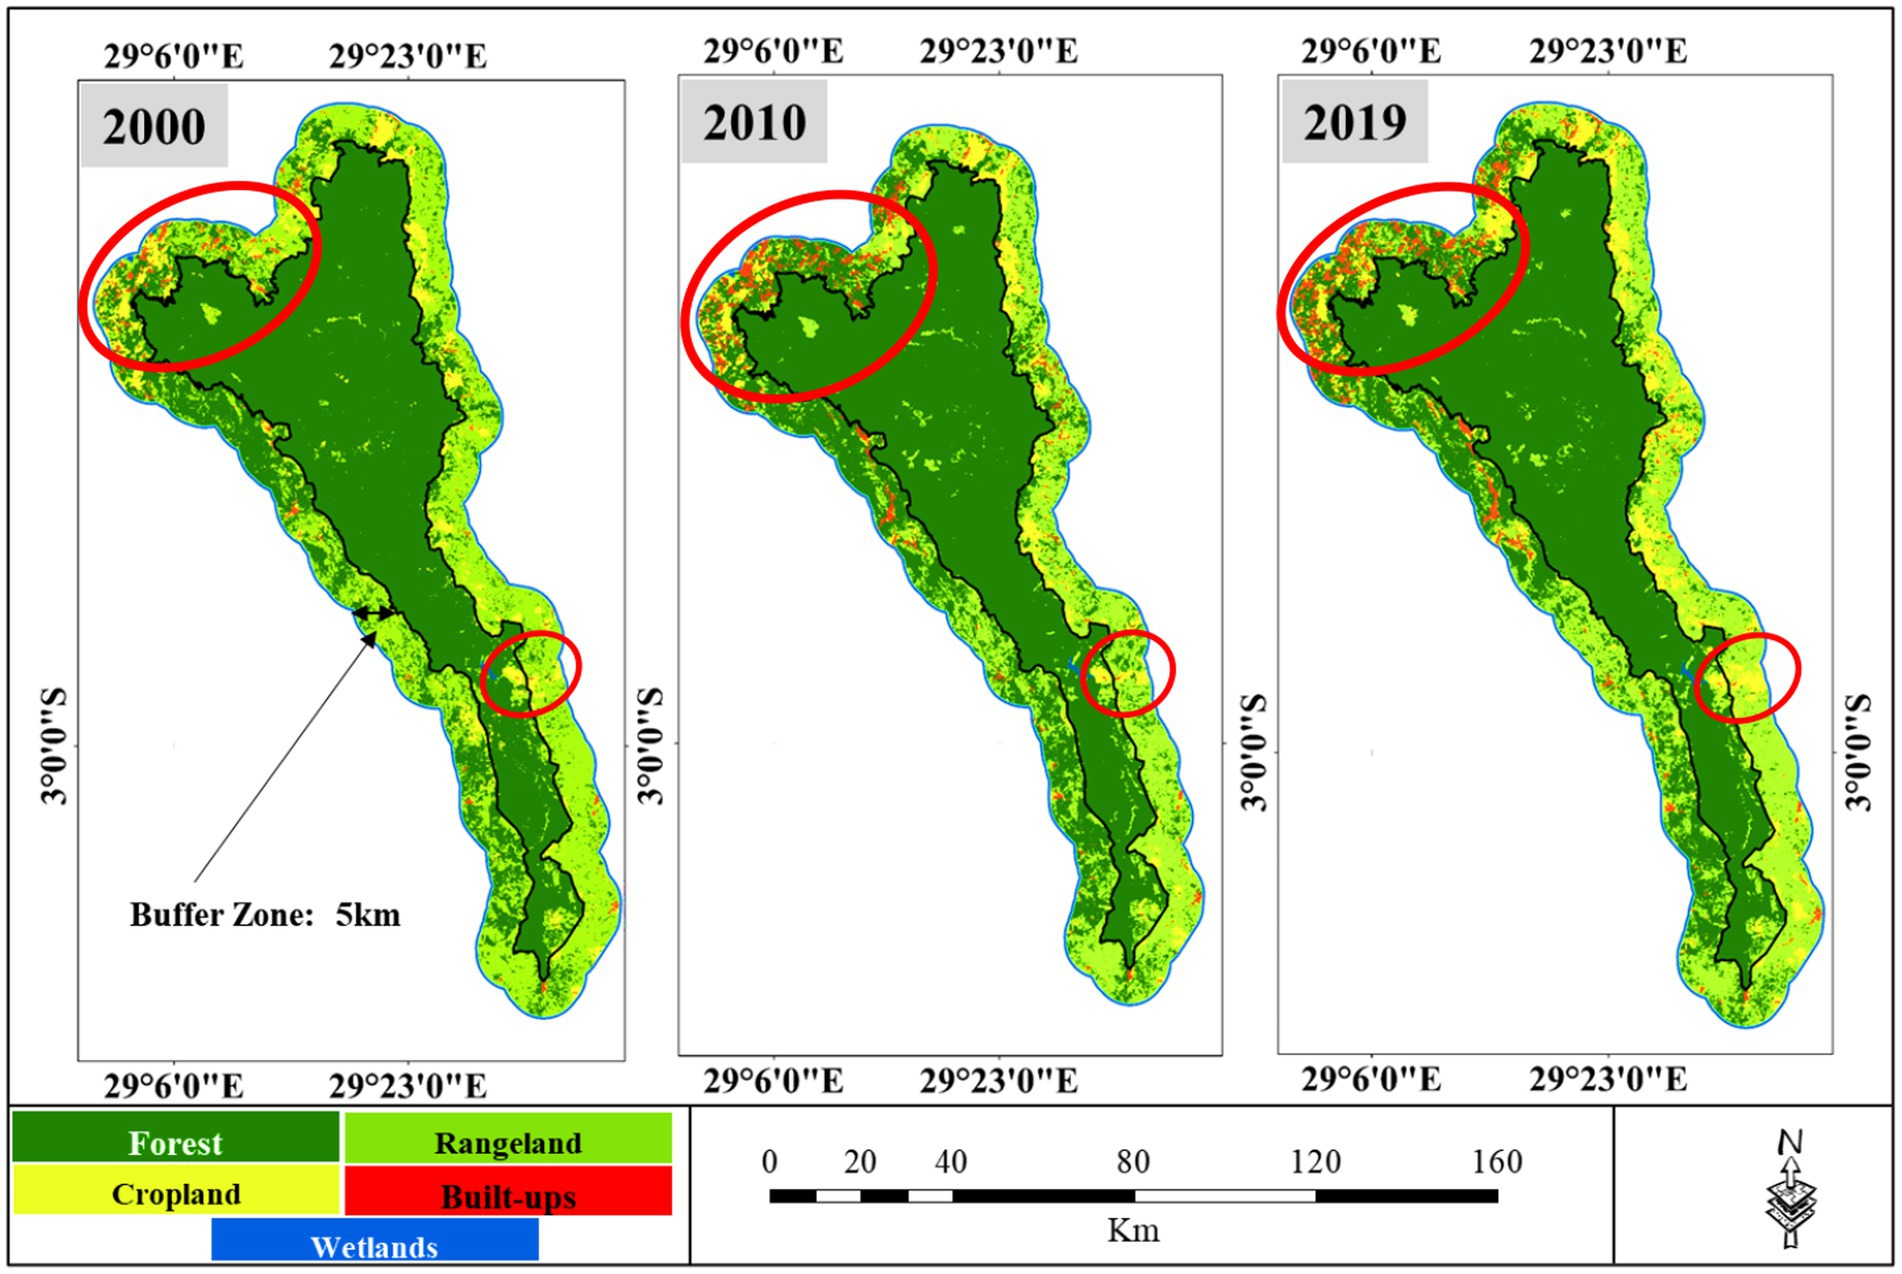
Figure 4. Spatial land cover dynamics across the Nyungwe-Kibira Forest (in and out) from 2000 to 2019 (decade interval).
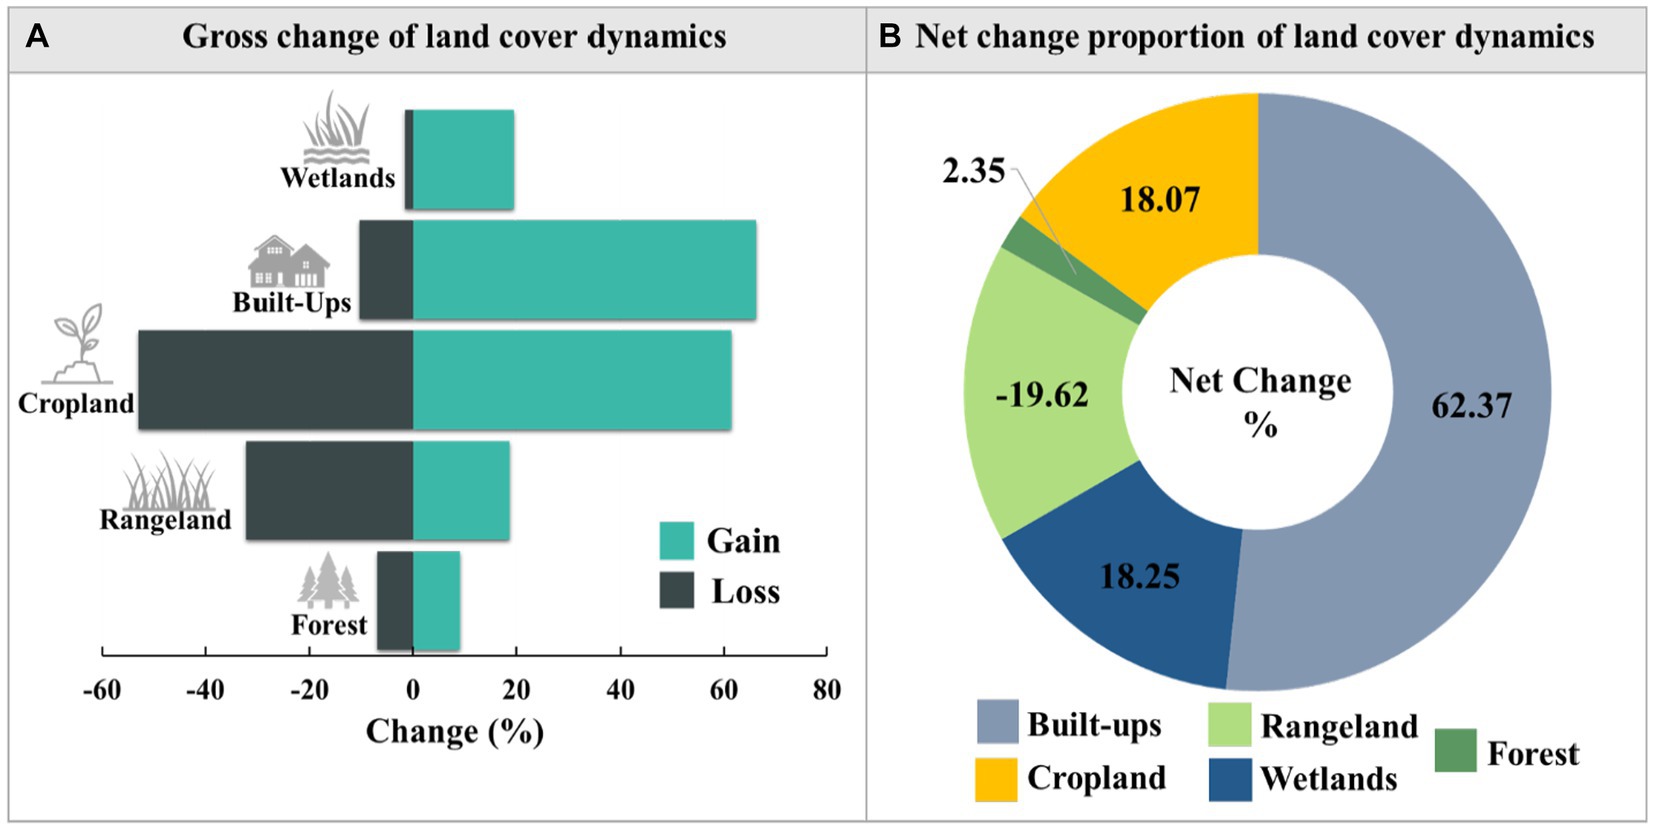
Figure 5. The land cover change dynamics within and around the Nyungwe Forest between 2000 and 2019, with (A) representing the gross change and (B) the net change proportion of land cover dynamics.
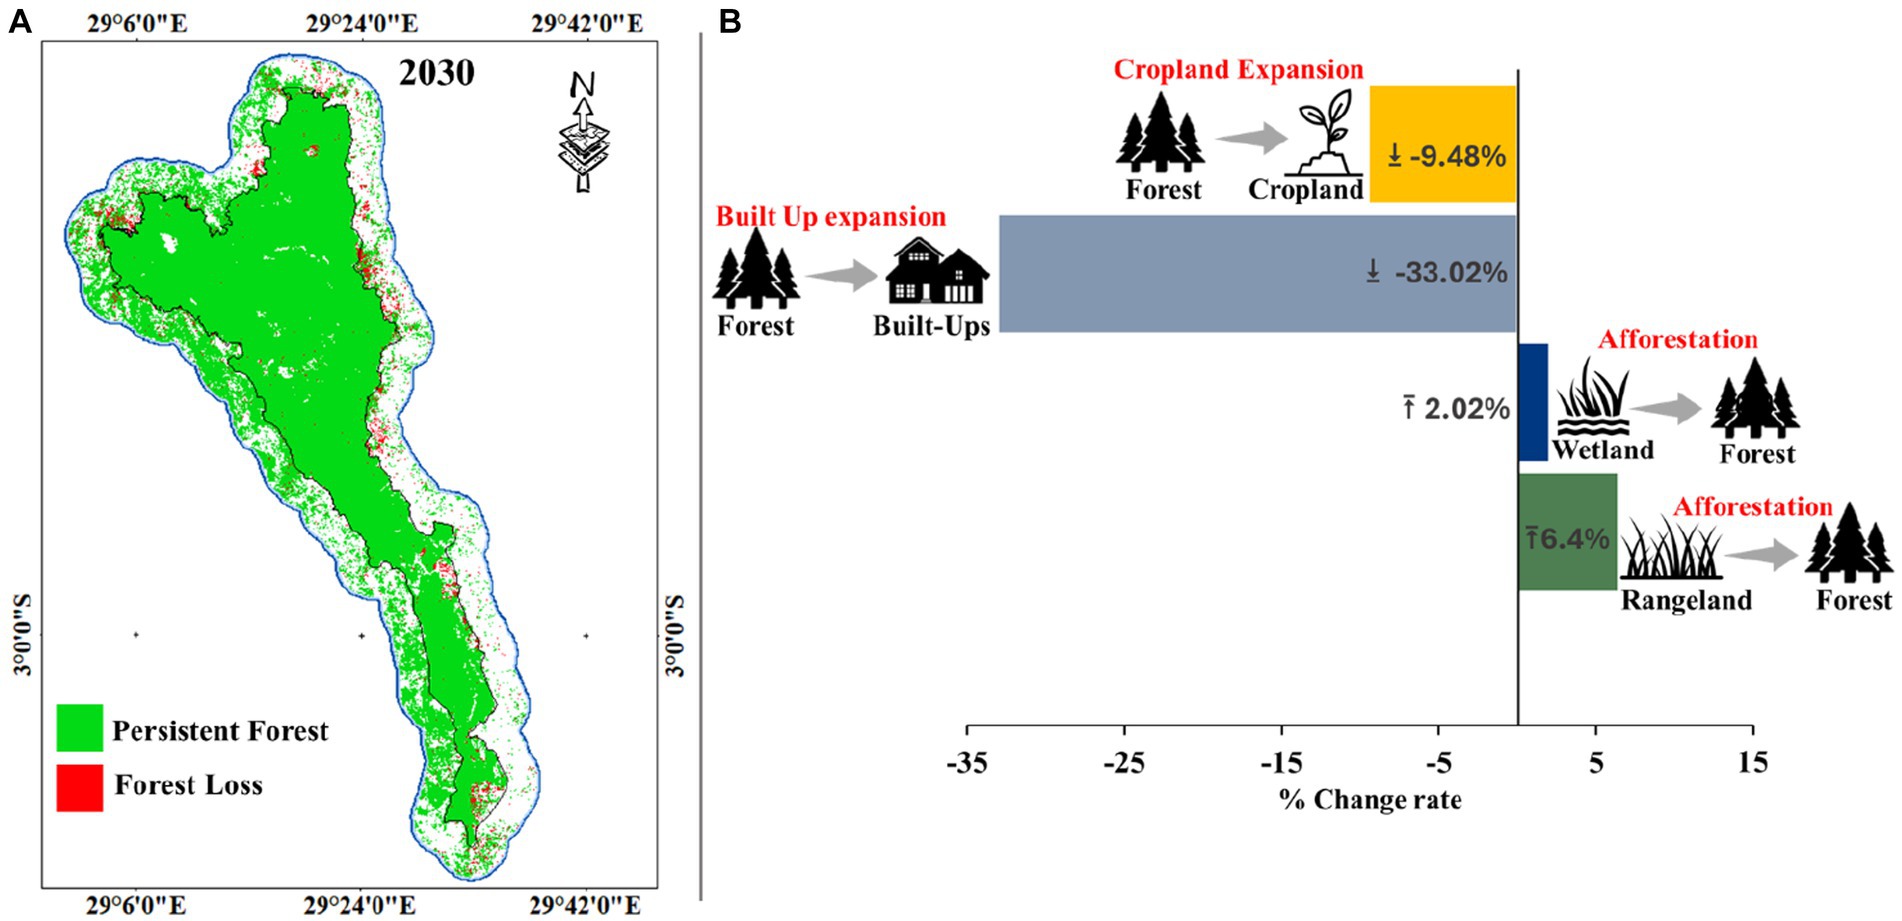
Figure 6. (A) Predicted forest change in the Nyungwe-Kibira transboundary area by 2030; and (B) its net contribution to the cover change. The upward arrow indicates a positive contribution, whereas the downward arrow indicates a negative contribution to forest change. The words in red represent the land use change event derived from specific land use transition.
Generally, the land cover classification revealed several changes inside the forest and the surrounding terrain, in which changes were high in the primary land cover classes (i.e., forest cover, cropland, and rangeland) (Figure 4). Considering both gross and net changes, the land use in and out of the Nyungwe Forest since the last two decades is in a state of flux, where some regions experienced gains and others experienced losses (Figures 5A,B). To put this into perspective, statistics disclosed a great gain in both built-ups and cropland areas at a rate of 66.2 and 61.4% of change, respectively. This tends to mean that the region is experiencing cropland and built-up expansion equivalent to a gross change of 14,133 ha and 6,322 ha, respectively, with a net change of +62.3% and + 18.07%, respectively. More specifically, the expansion of built-up areas into the buffer zone and edges of Nyungwe Forest Reserve is indicative of larger trends of deforestation driven by agricultural expansion and urbanization in Rwanda (Figure 7C).
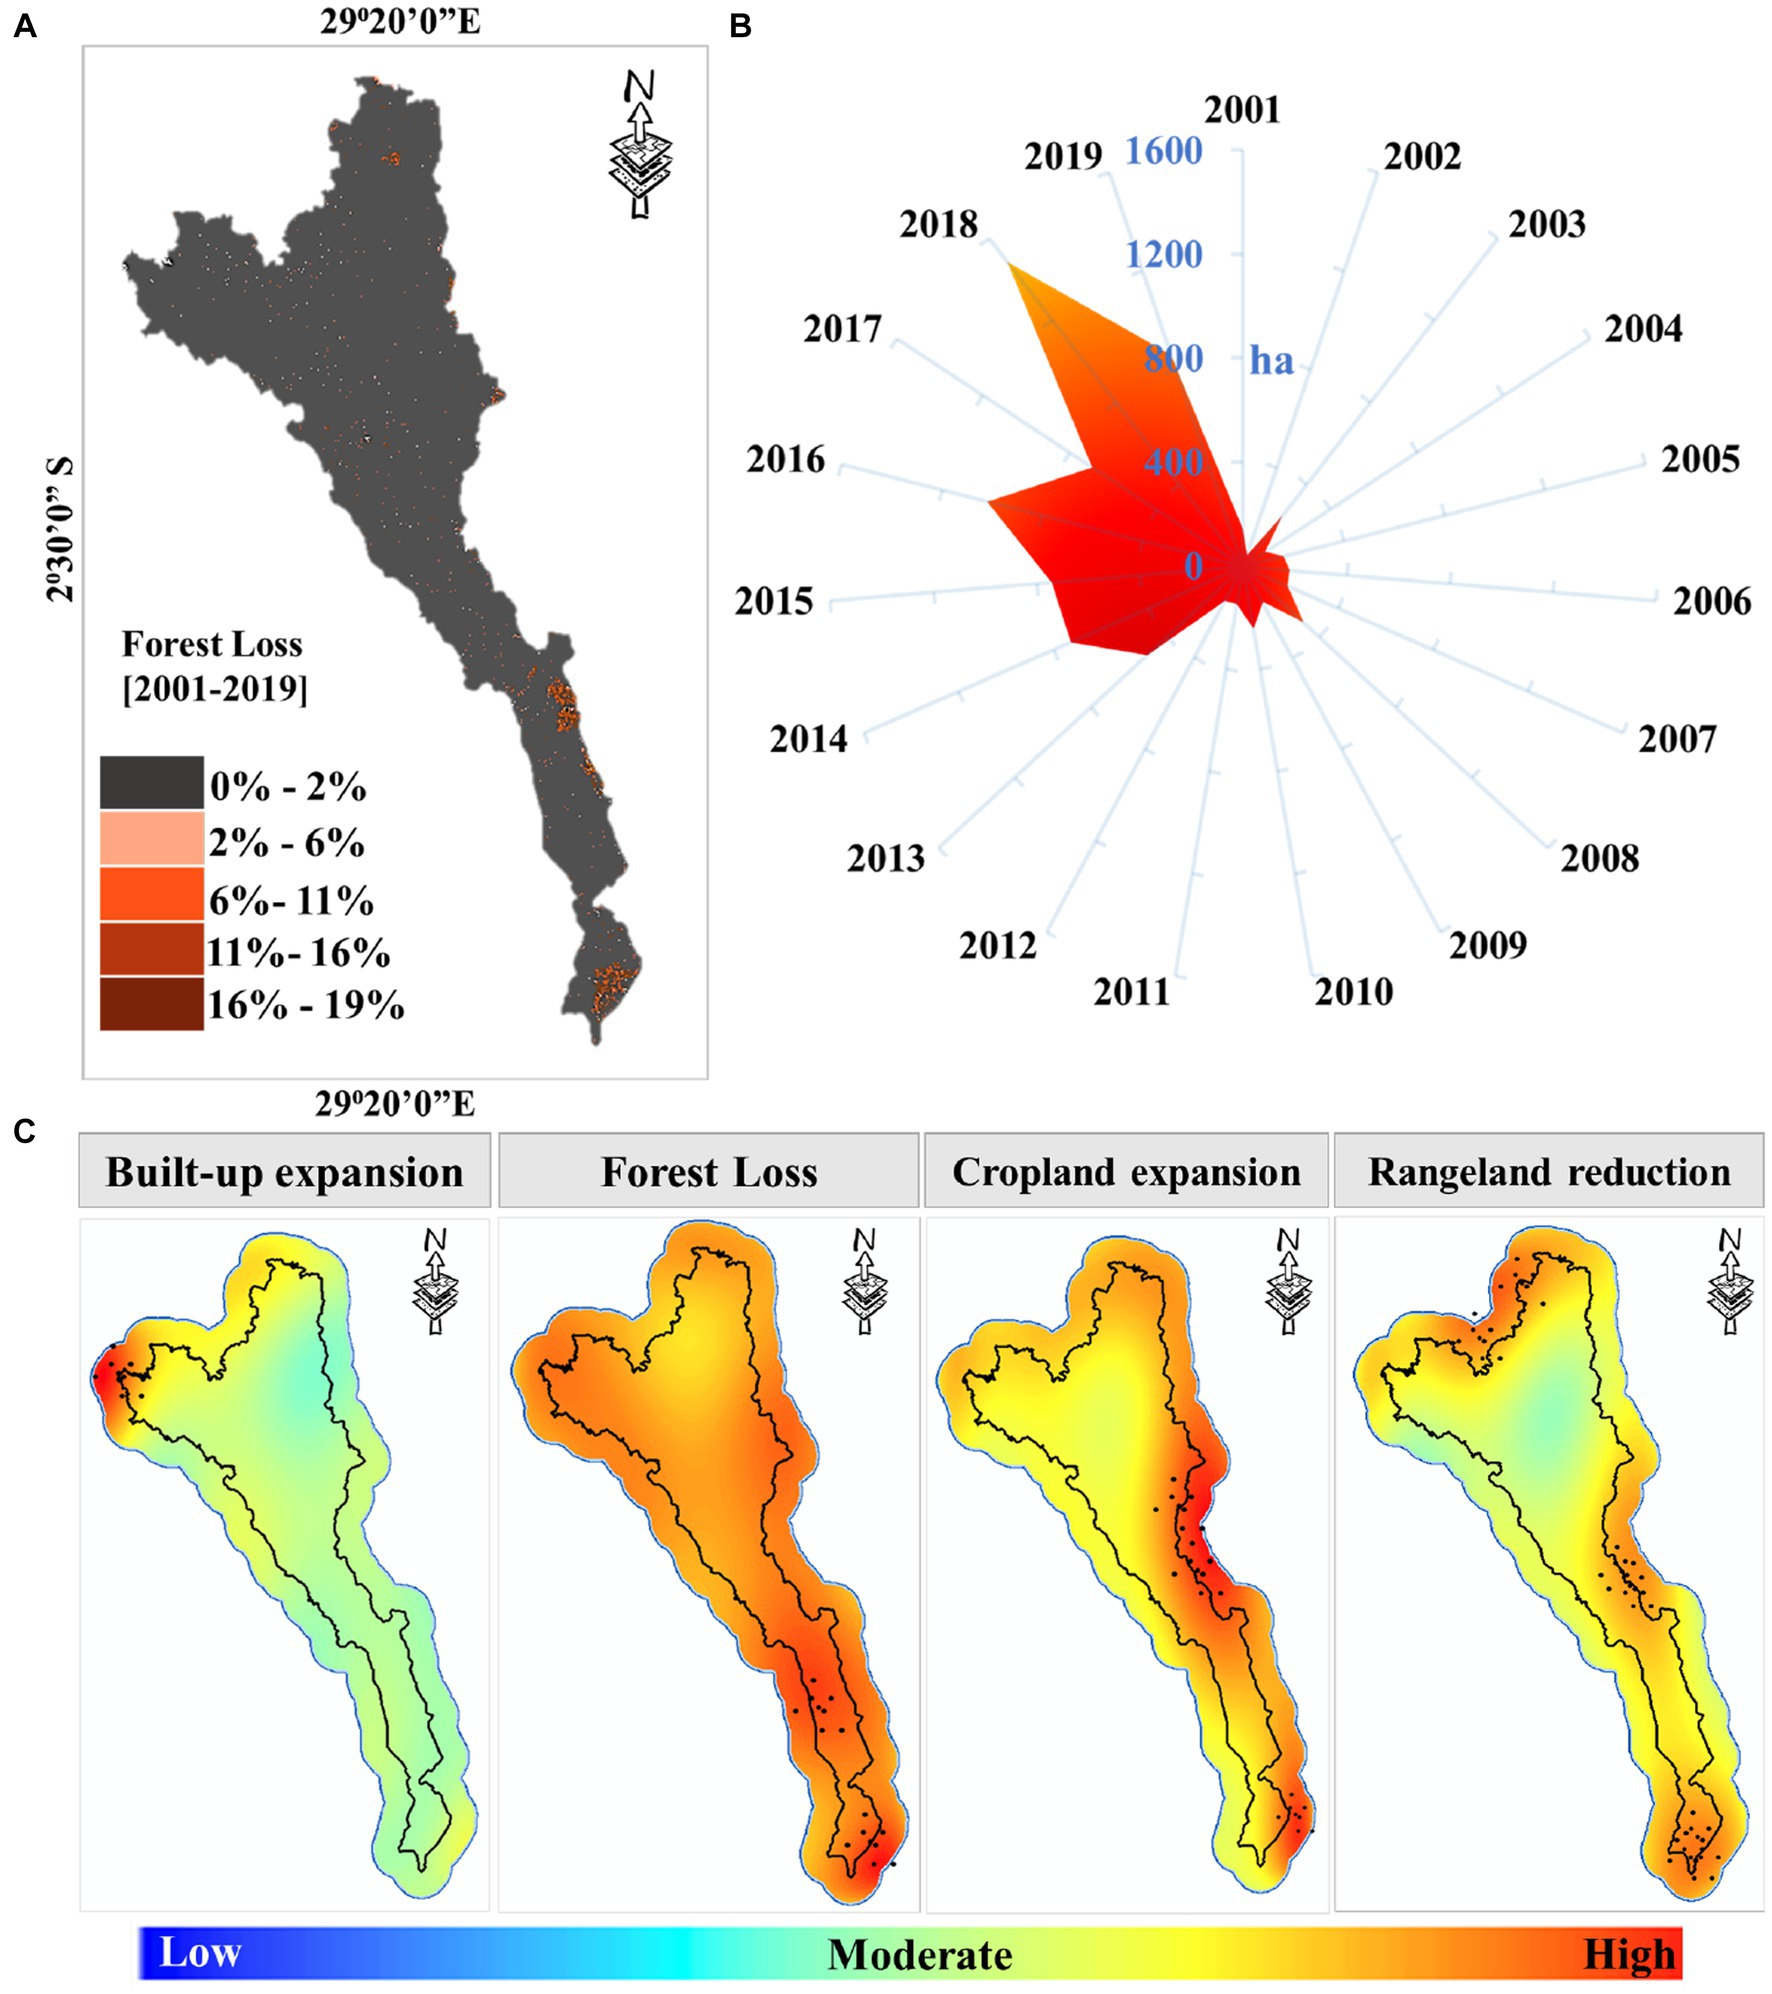
Figure 7. (A,B) The Nyungwe-Kibira inside forest loss spatio-temporal trend from 2000 to 2019 (Hansen et al., 2013). (C) The spatial trend of prevailing main land use change events within the massive Nyungwe-Kibira Forest (in and out), with dots indicating areas of high change intensity.
This is consistent with the Forest Investment Plan for Rwanda report (Water and Lead, 2017) stating that agriculture, which accounts for 95% of households’ traditional subsistence activities and urbanization, especially the rise of built-up land, which rose by more than 300% throughout the period (1990–2016), are the main causes of deforestation and forest degradation. In addition, a study by Gross-Camp et al. (2015) also found extensive encroachment along the eastern boundary of Nyungwe Forest Reserve, fueled by population growth and agricultural land needs. They note that the population density around the reserve increased by over 150% from 2002 to 2012. Other analyzes of deforestation patterns in Rwanda point to road development, expansion of tea plantations, and illegal logging as additional threats to protected forest areas (Crawford, 2012; Niyonsaba and Ndokoye, 2023; Nkurunziza et al., 2023).
In addition, notable land use changes that warrant attention include substantial forest loss and cropland growth detected in the central and southern regions. These changes stretch from the buffer zone into the main forest area (Figure 7C) on the Burundi side. Although there was 9.11% forest regrowth, our results revealed that the forest cover has experienced a close loss of 6.92%, corresponding to −14,764 ha of deforested area (Figure 5). This forest loss is consistent with findings by Kayiranga et al. (2016) and Tuyisingize et al. (2023), who reported high engagement in illegal activities like deforestation, poaching, and wood collection by local populations along the border districts in both Rwanda and Burundi. The authors note the substantial contributions of these activities across the border to forest cover loss within the reserve. Illegal encroachment driven by communities from adjacent areas in Rwanda and Burundi remains a key challenge for the conservation of the integrity and connectivity of Nyungwe Forest. Additionally, while addressing conflict-sensitive conservation in Nyungwe National Park, Crawford (2012) outlined the primary challenges to maintaining Nyungwe ecosystems and protecting biodiversity, including pressures from artisanal and industrial mining, high rates of poverty, high reliance on natural resources in the communities surrounding the park, forest fires (fires in 1997 consumed 5–8% of the park due to traditional beekeeping), hunting pressures (particularly for large mammals), and deforestation for firewood and building materials. Notwithstanding the loss that was reported in this study, a considerable rate of 9.1% of forest gain was also revealed during this period (2000–2019), thanks to Rwanda’s foresight and progressive laws and regulations that embraced the Bonn Challenge, a global initiative to restore 150 million hectares of degraded and deforested land by 2020 and 350 million hectares by 2030 without compromising the surrounding community’s livelihood (Dave et al., 2018; van Oosten et al., 2018). In this regard, the GoR offers all 5% of the revenue from the major national parks (Akagera, Volcanoes, and Nyungwe). As a result, this income is distributed to the surrounding people of the park to motivate and involve them in nature-based solutions to protect the Rwandan portion of Nyungwe Park (Nyungwe Forest National Park, 2022). Given the concerning trends of declining forest coverage revealed in our analysis, projecting future forest cover change in the Nyungwe-Kibira Forest becomes imperative. We employed a CA-Markov model to simulate future changes based on recent trajectories. Results predict the Nyungwe-Kibira Forest will continue to degrade at a rate of −0.74% per time period, equivalent to an estimated −1,615 ha of forest loss in each modeled iteration (Figure 6). Finally, it is worth noting that the wetland areas in the study region also experienced a gain of 19.52%, corresponding to a net change of 18.25%, equivalent to only 66 ha, whereas rangeland decreased by −32.11% of gross change but −19.62 of net change.
Nevertheless, since the coverage of forests is the key land cover of our study region of interest, we arrived at the realization that the expansion of human-made land uses like roads and farms, all of which are expanding quickly as a result of the region’s increasing human population, is the primary cause of changes in the region’s forests (Jha, 2023; Nkurunziza et al., 2023; Sudarmanto et al., 2023). To contextualize the drivers of net forest loss, we analyzed the relative contributions of different land use transitions. Built-up area expansion accounted for the highest proportion, at approximately 33.02% of the total net forest cover reduction observed (Figure 6), with an impact greatly pronounced in the northern edge of the study region (Rwanda) (Figure 7C). Meanwhile, cropland expansion-induced activities contribute to a net forest change of (−9.48%), greatly pronounced in the southeast portion of the forest (in Burundi). In summary, the portion of the forest in Rwanda is under pressure from rapid built-up area expansion, while the Burundi section is experiencing significant cropland expansion. To emphasize, the International Institute of Sustainable Development (IISD; Crawford, 2012) filtered the current potential conflict identified for the Nyungwe-Kibira Forest, which includes resource access, crop raiding by wild animals, buffer zone management and transboundary issues, infrastructure development, equitable sharing of benefits, the increased population inside the park, and regional security. Table 4 details the conflict prioritization according to the human and conservation impacts as reported by IISD 2012.
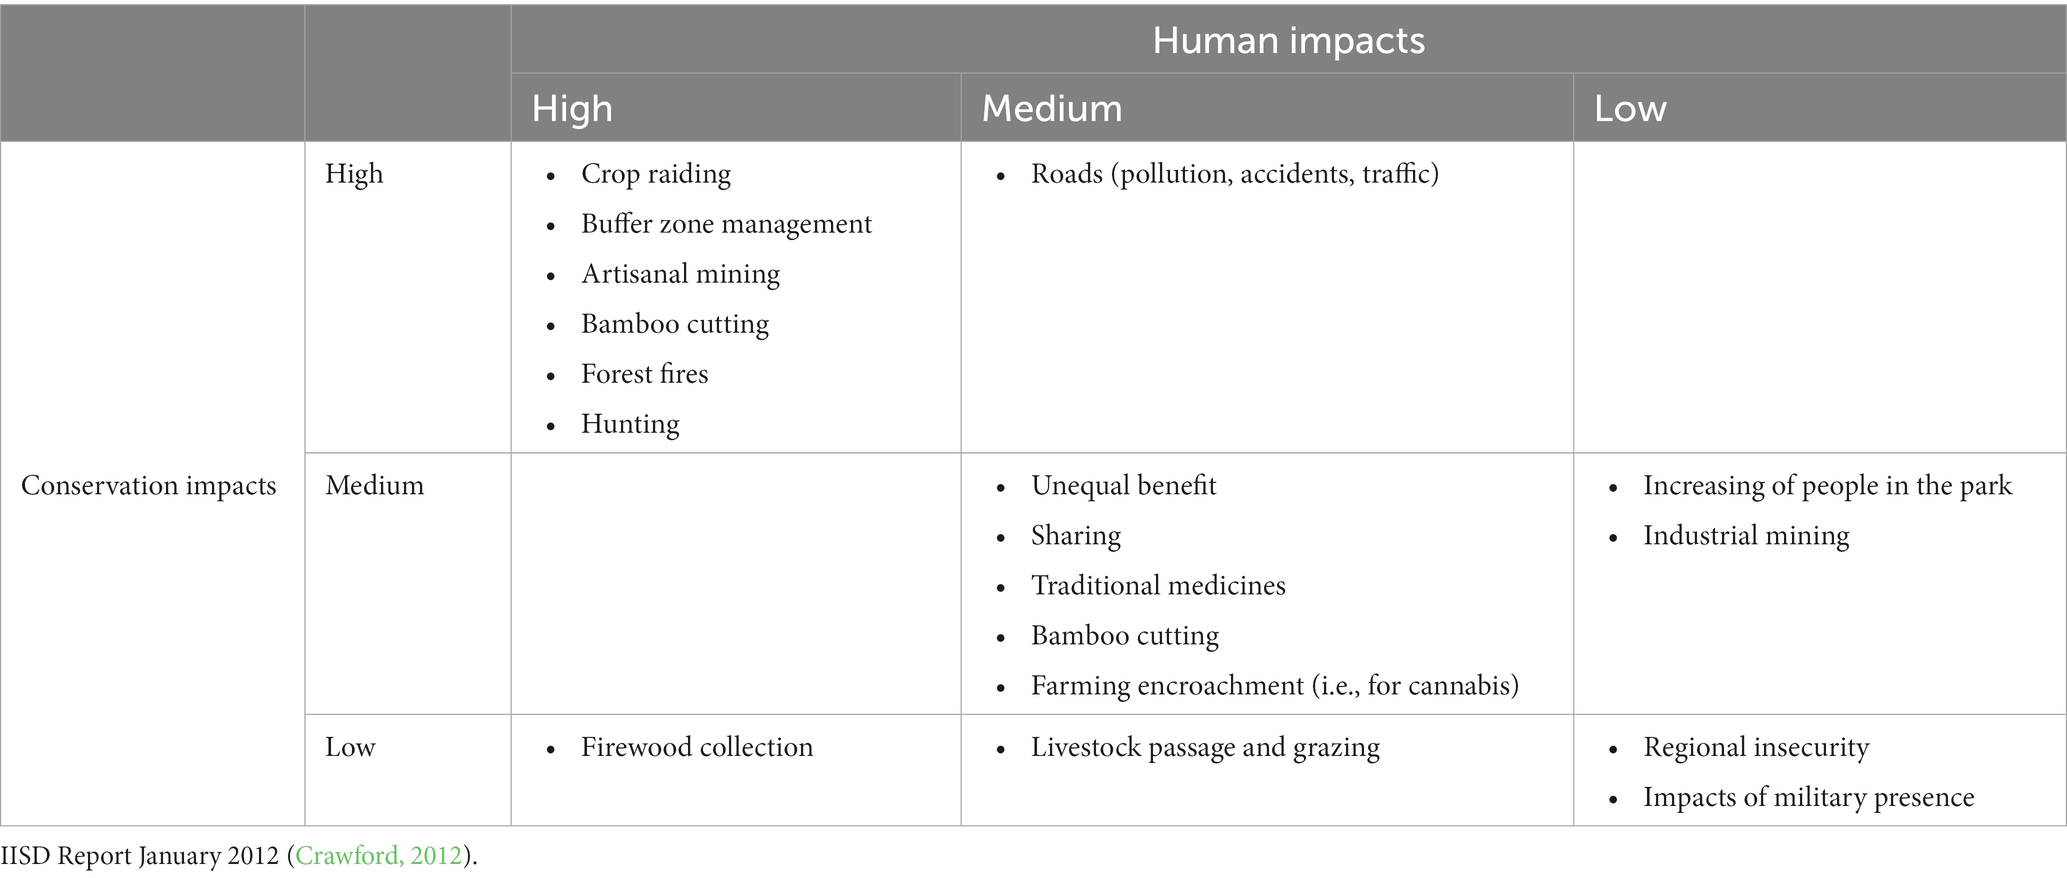
Table 4. Conflict prioritization according to the human and conservation impacts of identified conflicts across Nyungwe-Kibira National Park.
In addition, Figure 8 exhibits the landscape change underway within the landscape cover categories to characterize the nature of landscape transformation across the massive Nyungwe-Kibira Forest. Among 10 possible transformations, the Nyungwe-Kibira Forest patches were categorized into three based on their nature of change. These are aggregation, dissection, and creation. These transformations are extensively documented (Eastman, 2003). Explicitly, the analysis uncovered that 73%, or 241,000 hectares, of the vast forest area, are in a state of aggregation. This type of landscape transformation involves the merging of small patches, the filling of empty spaces, and the creation of larger, more integrated patches. The findings were predominantly attributed to forest and cropland areas, with 66 and 7%, respectively. The dominant portion of forested areas, combined with the expansion of cropland at the expense of forest loss, highlights the conflicting priorities between individual interests and the natural environment of the forest. This contrast is underscored by the changing landscape, which reflects the emergence of new patches and the alteration of existing ones.
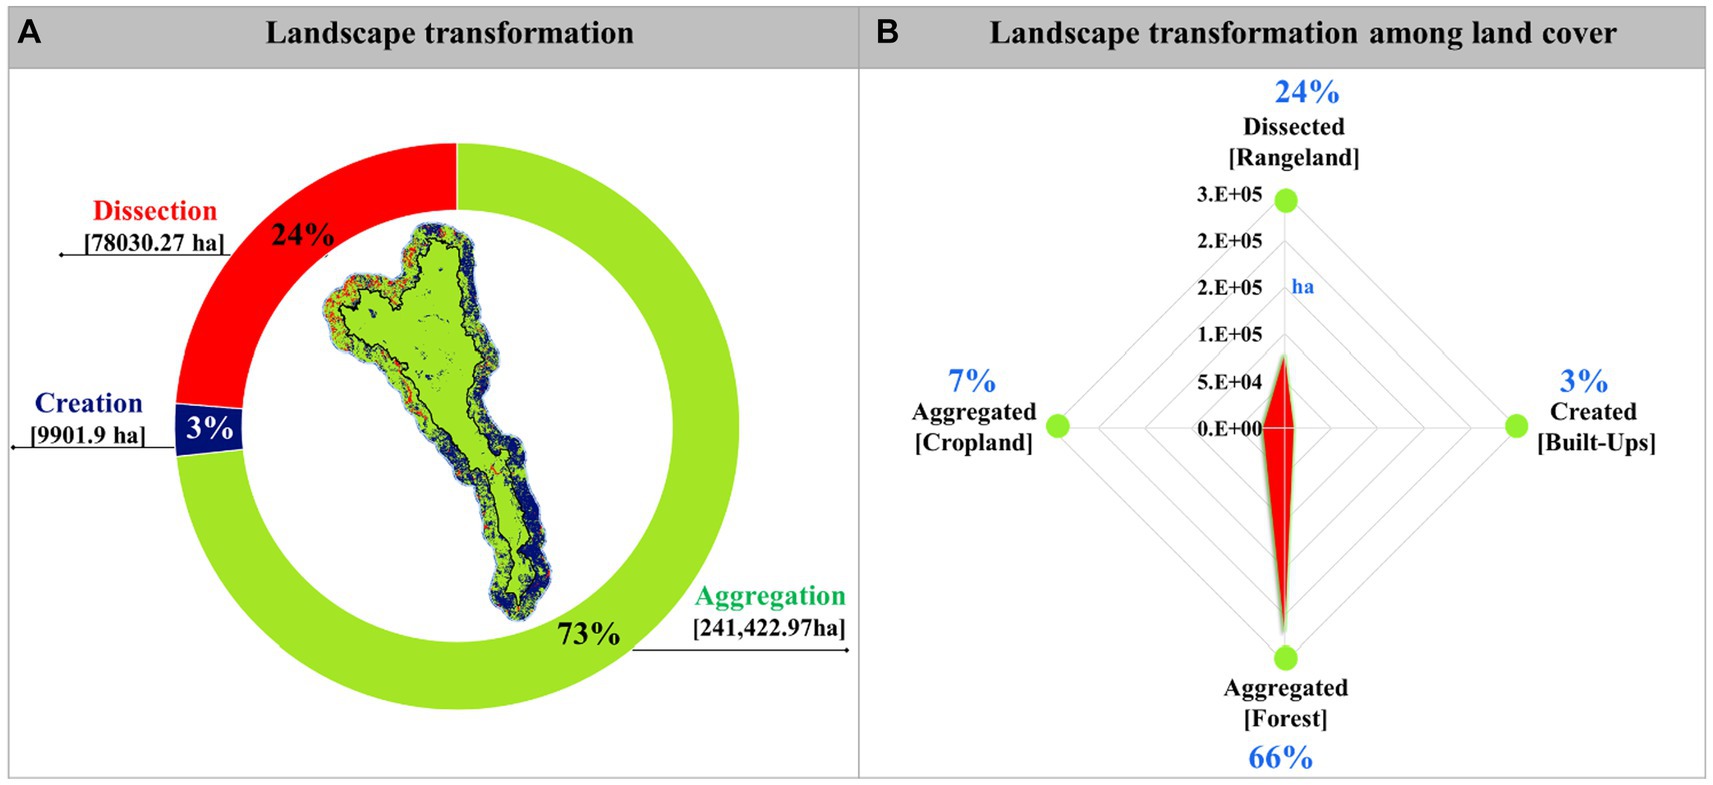
Figure 8. (A) The potential underway within the landscape classes to characterize the nature of landscape transformation across the expansive Nyungwe-Kibira. (B) The corresponding main land cover types from 2000 to 2019.
Generally speaking, some farmers in the Burundi region are constantly attempting to expand the area of their farmed grounds, as already reported in several studies (Evenden and Region, 2022; Kanyamibwa and Vande, 2022; Rurangwa et al., 2022). In certain regions, the conversion of land use can lead to the transformation of natural patches within cultivated areas, eventually converting them into cultivated fields as a result of the aggregation process. Humans and agriculture are inextricably linked, and as such, human activities have long been associated with environmental degradation (Nienhuis et al., 2020; Pinto et al., 2021), and the existence of aggregation processes in agricultural patches is not a positive indicator of Nyungwe-Kibira Forest. In addition to the aggregate transformation types that were prominent in the region, 24% of the territory was in the dissection process (Figure 8A). This process occurs as a result of a patch being split, which lengthens the edges and raises edge density. This process frequently occurs as a consequence of the splitting of patches caused by linear features like roadways in the terrain. The findings demonstrate that one of the most common processes in the research area, dissection, frequently occurs in both naturally occurring patches, like forests and rangelands, and human-made patches, like agricultural lands, as a result of road building. The sectioning of natural habitats can result in the loss of biodiversity, the fragmentation of ecosystems, and the reduction of ecological services (de Lima Filho et al., 2021; Popescu et al., 2022). Moreover, the dissection process in agricultural lands can lead to soil erosion and nutrient depletion, which can have long-term consequences for soil health and fertility (Sasmal and Sasmal, 2016; Chaudhari et al., 2020). The loss of vegetation cover and the increase in impervious surfaces can also contribute to the degradation of water quality and quantity in the surrounding ecosystems (Chithra et al., 2015; Zhang et al., 2023). Bogaert et al. (2004) characterized dissection as a process that reflects landscape fragmentation. The presence of this process results in longer edge lengths, smaller patch sizes, increased patch numbers, and increased human penetration within patches, all of which contribute to the degradation of the landscape.
The analysis of landscape pattern changes across the Nyungwe-Kibira Forest is significant for understanding the dynamic relationship between human activities and the integrity of these critical ecosystems. By examining how land use changes over time and the landscape pattern changes, we can better comprehend the impact of deforestation, agriculture, and infrastructure development on the ecological functions of this transboundary ecosystem. Figure 8 illustrates the potential for characterizing landscape transformation within the transboundary Nyungwe-Kibira Forest and its corresponding land cover types between 2000 and 2019.
The findings indicate a significant impact on the landscape within the study area, particularly in terms of rangeland cover, with a considerable disturbance totaling 78,030.27 hectares. It is noteworthy that the creation type was observed at rates of 7% in farmland and 3% in built-up areas, leading to a substantial gross transformation of 9901.9 hectares, as shown in Figures 8A,B. These observations underscore a growing concern for the Nyungwe Forest in Rwanda, where the expansion of built-up areas poses a threat to the existing forest patches. Similarly, in Kibira National Park, Burundi, the expansion of cropland is also a cause for concern. The implications of these landscape transformations include potential habitat loss for wildlife, fragmentation of forest ecosystems, disruption of ecological processes, and potential consequences for biodiversity conservation. Additionally, the encroachment of built-up areas and the expansion of cropland can lead to increased human–wildlife conflict and have long-term effects on the ecological balance of the region. The global environment facility (GEF) reports (GEF, 2015) corroborate our findings by stating that, despite the Kibira being a national park, the 1993 Burundian civil war significantly damaged the forest, where residents sought refuge. More specifically, after the war, refugees and local populations degraded the ecosystem by heavily clear-cutting land for agriculture, on which they heavily depended for survival (Kanyamibwa, 1998). According to GEF, the region continues to face threats from deforestation, poaching, and unsustainable farming practices, which supports our findings that forest coverage in the buffer is being lost due to agricultural activities and built-up expansion areas (Figure 6B). To this end, as the Kibira Forest continues to deteriorate due to various human activities such as deforestation, poaching, bushfires, unsustainable harvesting of medicinal plants, and overgrazing, the impacts of climate change are becoming more severe in the region, affecting food security and sources of income for local communities (Ndayizeye et al., 2020; Kabanyegeye et al., 2023). While Kibira National Park provides opportunities for improving food security and reducing poverty in the region, effective co-governance and structuring sustainable revenue streams are essential for managing the park to achieve long-term, regenerative social and environmental impacts. And, to address these issues, policymakers should implement programs that economically strengthen community engagement-based approaches, which can help alleviate poverty and improve conservation outcomes.
This study utilized spatial analysis to assess landscape pattern changes in the vital transboundary Nyungwe-Kibira Forest ecosystem spanning two countries (Rwanda and Burundi) from 2000 to 2019. The findings reveal that this transboundary forest is facing ongoing deforestation and fragmentation, driven mainly by expanding built-up areas, croplands, and other human-driven land uses associated with population growth and development pressures. Our analysis reveals a significant increase in both built-up and cropland areas, with a net change of +62.3% and + 18.07%, respectively, resulting in a gross change of 14,133 ha and 6,322 ha in built-up and cropland areas. This expansion is particularly pronounced in the region, as the built-up area has expanded from the buffer zone toward the Nyungwe Forest in the northwestern edge of Rwanda. Additionally, forest loss is most prominent in the central and southern regions, extending from the buffer zone toward the main forest in the Burundi region. Despite an overall forest gain of 9.11%, there is a corresponding deforested area of −14,764 ha, indicating a net loss of 6.92%. The rapid expansion of human-made land uses, particularly built-up areas, is the primary cause of these forest changes. Our analysis indicates that built-up areas account for the majority of the net forest loss, affecting approximately 33.02% of the forest, especially in the northern edge of the Rwanda region. On the other hand, cropland expansion contributes to a net loss of forest (−9.48%), with the most significant impact observed in the southeast portion of the forest in Burundi. Finally, the forest is predicted to decrease by 0.74% by 2030. Current analysis shows that the Nyungwe-Kibira Forest is undergoing transformations, with an aggregation of forest and cropland (66 and 7%), dissection of rangeland (24%), and creation of built-up areas (3%). This study emphasizes the growing vulnerability of vital transboundary forest ecosystems, such as Nyungwe-Kibira Forest, due to relentless agriculture development pressures and population growth. The analysis reveals alarming ecosystem fragmentation and degradation in less than two decades. However, addressing these challenges is feasible through commitments from governments and stakeholders at all levels to adopt integrated conservation and sustainable development planning. Based on the obtained findings, it is imperative to prioritize specific interventions to address the observed land use impacts. Given the pronounced expansion of built-up and cropland areas, particularly in the northwestern edge of Rwanda and the southeast portion of the forest in Burundi, urgent measures are necessary to mitigate the resulting forest loss. Specific actions should involve targeted protective and restoration efforts in the heavily impacted zones, focusing on the rejuvenation of the deforested areas, sustainable agricultural practices, and land use management. Collaborative measures between stakeholders and authorities of the two countries are essential to regulating and minimizing further expansion of human-made land uses and cropland toward the forest area. This can include the delineation of protective buffer zones, the integration of sustainable land use policies, and the promotion of alternative and sustainable livelihood options for local communities. These efforts will ensure the preservation of essential ecosystem services and biodiversity within the Nyungwe-Kibira Forest. More importantly, it is crucial to implement policy and regulatory measures that restrict unsustainable clearing while incentivizing conservation-friendly actions, as well as community capacity building, alternative livelihood programs, and transboundary cooperation. These efforts are essential to alleviate resource dependencies and strengthen conservation outcomes. Last but not least, a holistic, targeted strategy, considering local livelihoods and development needs while emphasizing protection, restoration efforts, and cooperative governance across borders, provides the best pathway for preserving the integrity of the Nyungwe-Kibira Forest ecosystem. This approach requires sustained commitments from stakeholders and authorities to achieve lasting, positive outcomes. To this end, future studies are recommended to consider integrating land change modeling to develop spatially explicit projections of deforestation, ecological risk, and ecosystem service degradation under climate change scenarios. If such coordinated commitments supported by research can come to fruition, some of the most precious natural heritage, like the Nyungwe-Kibira Forest, still stands a chance despite escalating anthropogenic threats.
The raw data supporting the conclusions of this article will be made available by the authors, without undue reservation.
MU: Conceptualization, Data curation, Formal analysis, Methodology, Writing – original draft. YZ: Funding acquisition, Supervision, Writing – review & editing. HF: Investigation, Visualization, Writing – review & editing. PK: Software, Validation, Visualization, Writing – review & editing. RM’j: Investigation, Validation, Visualization, Writing – review & editing.
The author(s) declare financial support was received for the research, authorship, and/or publication of this article. This research was funded by the Third Xinjiang Comprehensive Scientific Expedition Program [grant No. 2022xjkk0805].
The authors express their sincere gratitude to the Chinese Government Scholarship (CSC) under the Chinese Academy of Sciences (CAS) for the scholarship award to conduct the doctoral studies (PhD) of which this study is a part.
The authors declare that the research was conducted in the absence of any commercial or financial relationships that could be construed as a potential conflict of interest.
All claims expressed in this article are solely those of the authors and do not necessarily represent those of their affiliated organizations, or those of the publisher, the editors and the reviewers. Any product that may be evaluated in this article, or claim that may be made by its manufacturer, is not guaranteed or endorsed by the publisher.
Abdullah, S. A., and Nakagoshi, N. (2007). Forest fragmentation and its correlation to human land use change in the state of Selangor, peninsular Malaysia. For. Ecol. Manag. 241, 39–48. doi: 10.1016/j.foreco.2006.12.016
Aboud, S. J., Al Fayoumi, M., and Alnuaimi, M. (2009). “Verification and validation of simulation models,” in Handbook of Research on Discrete Event Simulation Environments: Technologies and Applications.
Ahmad, A., and Quegan, S. (2012). Analysis of maximum likelihood classification on multispectral data. Appl. Math. Sci. 6, 6425–6436.
Akinyemi, F. O. (2017). Land change in the central Albertine rift: insights from analysis and mapping of land use-land cover change in North-Western Rwanda. Appl. Geogr. 87, 127–138. doi: 10.1016/j.apgeog.2017.07.016
Behera, D., Borate, S. N., Panda, S. N., Behera, P. R., and Roy, P. S. (2012). Modelling and analyzing the watershed dynamics using cellular automata (CA)–Markov model–a geo-information based approach. J. Earth Syst. Sci. 121, 1011–1024. doi: 10.1007/s12040-012-0207-5
Bogaert, J., Bamba, I., Koffi, K. J., Sibomana, S., Djibu, J.-P. K., Champluvier, D., et al. (2008). Fragmentation of forest landscapes in Central Africa: Causes, consequences and management. Patterns and processes in forest landscapes, Springer. Berlin.
Bogaert, J., Barima, Y. S., Iyongo, W., Bamba, I., Mama, A., Toyi, M., et al. (2011). “Forest fragmentation: causes, ecological impacts and implications for landscape management” in Landscape ecology in forest management and conservation. eds. C. Li, R. Lafortezza, and J. Chen (Berlin: Springer).
Bogaert, J., Ceulemans, R., and Eysenrode, S.-V. (2004). Decision tree algorithm for detection of spatial processes in landscape transformation. Environ. Manag. 33, 62–73. doi: 10.1007/s00267-003-0027-0
Bryan-Brown, D. N., Connolly, R. M., Richards, D. R., Adame, F., Friess, D. A., and Brown, C. J. (2020). Global trends in mangrove forest fragmentation. Sci. Rep. 10, 1–8. doi: 10.1038/s41598-020-63880-1
Çakir, G., Sivrikaya, F., and Keleş, S. (2008). Forest cover change and fragmentation using Landsat data in Maçka state Forest Enterprise in Turkey. Environ. Monit. Assess. 137, 51–66. doi: 10.1007/s10661-007-9728-9
Carletta, J. (1996). Assessing Agreement on Classification Tasks: The Kappa Statistic. Computational Linguistics.
Carranza, M. L., Hoyos, L., Frate, L., Acosta, A. T., and Cabido, M. (2015). Measuring forest fragmentation using multitemporal forest cover maps: forest loss and spatial pattern analysis in the Gran Chaco, Central Argentina. Landsc. Urban Plan. 143, 238–247. doi: 10.1016/j.landurbplan.2015.08.006
Chaplin-Kramer, R., Ramler, I., Sharp, R., Haddad, N. M., Gerber, J. S., West, P. C., et al. (2015). Degradation in carbon stocks near tropical forest edges. Nat. Commun. 6, 1–6. doi: 10.1038/ncomms10158
Chaudhari, S. K., Biswas, P., and Kapil, H. (2020). “Soil health and fertility” in The Soils of India. ed. B. B. Mishra (Cham: Springer).
Chen, H., and Pontius, R. G. (2010). Diagnostic tools to evaluate a spatial land change projection along a gradient of an explanatory variable. Landsc. Ecol. 25, 1319–1331. doi: 10.1007/s10980-010-9519-5
Chithra, S., Nair, M. H., Amarnath, A., and Anjana, N. (2015). Impacts of impervious surfaces on the environment. Int. J. Eng. Sci. Invention Res. Dev. 4, 27–31.
Crawford, A. (2012). "Conflict-sensitive conservation in Nyungwe National Park: Conflict analysis." International Institute for Sustainable Development. Winnipeg.
Cui, B., Zhang, Y., Wang, Z., Gu, C., Liu, L., Wei, B., et al. (2022). Ecological risk assessment of transboundary region based on land-cover change: a case study of Gandaki river basin, Himalayas. Land 11:638. doi: 10.3390/land11050638
Da Ponte, E., García-Calabrese, M., Kriese, J., Cabral, N., Perez de Molas, L., Alvarenga, M., et al. (2021). Understanding 34 years of Forest cover dynamics across the Paraguayan Chaco: characterizing annual changes and Forest fragmentation levels between 1987 and 2020. Forests 13:25. doi: 10.3390/f13010025
Danjon, F., Stokes, A., and Bakker, M. R. (2013). Root systems of woody plants, CRC Press. Boca Raton, FL.
Dave, R., Saint-Laurent, C., Murray, L., Antunes Daldegan, G., Brouwer, R., de Mattos Scaramuzza, C. A., et al. (2018). "Second Bonn challenge progress report. Application of the Barometer." Gland: IUCN.
de Lima Filho, J. A., Vieira, R. J., de Souza, C. A., Ferreira, F. F., and de Oliveira, V. M. (2021). Effects of habitat fragmentation on biodiversity patterns of ecosystems with resource competition. Phys. A: Stat. Mech. 564:125497. doi: 10.1016/j.physa.2020.125497
Devi, A., and Shimrah, T. (2021). Assessment of land use and land cover and forest fragmentation in traditional landscape in Manipur, Northeast India. Int. J. Environ. Sci. Technol. 19, 10291–10306. doi: 10.1007/s13762-021-03712-5
Diamond, J. M. (1975). The island dilemma: lessons of modern biogeographic studies for the design of natural reserves. Biol. Conserv. 7, 129–146. doi: 10.1016/0006-3207(75)90052-X
Eastman, J. R. (2003). "IDRISI Kilimanjaro: Guide to GIS and image processing." Worcester, MA: Clark University.
Evenden, J., and Region, I. "US Forest Service international programs, Department of Agriculture Republic of Burundi. (2022) University of Maryland College Park, MD.
Ewers, R. M., Didham, R. K., Fahrig, L., Ferraz, G., Hector, A., Holt, R. D., et al. (2011). A large-scale forest fragmentation experiment: the stability of altered Forest ecosystems project. Philos. Trans. R. Soc. Lond., B, Biol. Sci. 366, 3292–3302. doi: 10.1098/rstb.2011.0049
Gardner, T. A., Barlow, J., Chazdon, R., Ewers, R. M., Harvey, C. A., Peres, C. A., et al. (2009). Prospects for tropical forest biodiversity in a human-modified world. Ecol. Lett. 12, 561–582. doi: 10.1111/j.1461-0248.2009.01294.x
Gebauer, C., and Doevenspeck, M. (2015). Adaptation to climate change and resettlement in R wanda. Area 47, 97–104. doi: 10.1111/area.12168
GEF (2015). The road to resilience: Communities in Burundi share solutions for sustainability. Global Environmental Facility. Washington, DC.
Gidey, E., Dikinya, O., Sebego, R., Segosebe, E., and Zenebe, A.Environment (2017). Cellular automata and Markov chain (CA_Markov) model-based predictions of future land use and land cover scenarios (2015–2033) in Raya, northern Ethiopia. Model. Earth Syst. 3, 1245–1262. doi: 10.1007/s40808-017-0397-6
Gross-Camp, N. D., Martin, A., McGuire, S., and Kebede, B. (2015). The privatization of the Nyungwe National Park buffer zone and implications for adjacent communities. Soc. Nat. Resour. 28, 296–311. doi: 10.1080/08941920.2014.948246
Gruhl, J. (1979). “Model Validation.” In Proceedings of the International Conference on Cybernetics and Society.
Gurung, J., Chettri, N., Sharma, E., Ning, W., Chaudhary, R. P., Badola, H. K., et al. (2019). Evolution of a transboundary landscape approach in the Hindu Kush Himalaya: key learnings from the Kangchenjunga landscape. Glob. Ecol. Conserv. 17:e00599. doi: 10.1016/j.gecco.2019.e00599
Hakizimana, D., Huynen, M.-C., and Hambuckers, A. (2016). Structure and floristic composition of Kibira rainforest, Burundi. Trop. Ecol. 57, 739–749.
Hamilton, S. E., and Casey, D. (2016). Creation of a high spatio-temporal resolution global database of continuous mangrove forest cover for the 21st century (CGMFC-21). Glob. Ecol. Biogeogr. 25, 729–738. doi: 10.1111/geb.12449
Hansen, M. C., Potapov, P. V., Moore, R., Hancher, M., Turubanova, S. A., Tyukavina, A., et al. (2013). High-resolution global maps of 21st-century forest cover change. Science 342, 850–853. doi: 10.1126/science.1244693
Hartter, J., Ryan, S. J., Southworth, J., and Chapman, C. A. (2011). Landscapes as continuous entities: forest disturbance and recovery in the Albertine rift landscape. Landsc. Ecol. 26, 877–890. doi: 10.1007/s10980-011-9616-0
Hyandye, C., and Martz, L. W. (2017). A Markovian and cellular automata land-use change predictive model of the Usangu catchment. Int. J. Remote Sens. 38, 64–81. doi: 10.1080/01431161.2016.1259675
Imanishimwe, A., Niyonzima, T., and Nsabimana, D. (2018). Contribution of community conservation and ecotourism projects on improving livelihoods and sustainable biodiversity conservation in and around Nyungwe national park (NNP). J. Hosp. Tour. 7:2167. doi: 10.4172/2167-0269.1000363
Jha, N. (2023). Determinants of climate change adaptation strategies among smallholder farmers in nine African Mountains, Norwegian University of Life Sciences. As, Norway.
Kabanyegeye, H., Sikuzani, Y. U., Sambieni, K. R., Mbarushimana, D., Masharabu, T., and Bogaert, J. (2023). Analysis of anthropogenic disturbances of green spaces along an urban–rural gradient of the City of Bujumbura (Burundi). Land 12:465. doi: 10.3390/land12020465
Kanyamibwa, S. (1998). Impact of war on conservation: Rwandan environment and wildlife in agony. Biodivers. Conserv. 7, 1399–1406. doi: 10.1023/A:1008880113990
Kanyamibwa, S., and Vande, J. -P. (2022). s BURUNDI. Philadelphia, Pennsylvania, United States: Springer.
Kayiranga, A., Kurban, A., Ndayisaba, F., Nahayo, L., Karamage, F., Ablekim, A., et al. (2016). Monitoring forest cover change and fragmentation using remote sensing and landscape metrics in Nyungwe-Kibira park. J. Geosci. Environ. Prot. 4, 13–33. doi: 10.4236/gep.2016.411003
Kraemer, H. C., Periyakoil, V. S., and Noda, A. (2002). Kappa coefficients in medical research. Stat. Med. 21, 2109–2129. doi: 10.1002/sim.1180
Krauss, J., Bommarco, R., Guardiola, M., Heikkinen, R. K., Helm, A., Kuussaari, M., et al. (2010). Habitat fragmentation causes immediate and time-delayed biodiversity loss at different trophic levels. Ecol. Lett. 13, 597–605. doi: 10.1111/j.1461-0248.2010.01457.x
Laurance, W. F., Alonso, A., Lee, M., and Campbell, P. (2006). Challenges for forest conservation in Gabon, Central Africa. Futures 38, 454–470. doi: 10.1016/j.futures.2005.07.012
Laurance, W. F., Lovejoy, T. E., Vasconcelos, H. L., Bruna, E. M., Didham, R. K., Stouffer, P. C., et al. (2002). Ecosystem decay of Amazonian forest fragments: a 22-year investigation. Conserv. Biol. 16, 605–618. doi: 10.1046/j.1523-1739.2002.01025.x
Long, J. A., Nelson, T. A., and Wulder, M. A. (2010). Characterizing forest fragmentation: distinguishing change in composition from configuration. Appl. Geogr. 30, 426–435. doi: 10.1016/j.apgeog.2009.12.002
Long, H., Zhang, Y., Ma, L., and Tu, S. (2021). Land use transitions: Progress, challenges and prospects. Land 10:903. doi: 10.3390/land10090903
Mandrekar, J. N. (2011). Measures of interrater agreement. J. Thorac. Oncol. 6, 6–7. doi: 10.1097/JTO.0b013e318200f983
Martensen, A. C., Saura, S., and Fortin, M. J. (2017). Spatio-temporal connectivity: assessing the amount of reachable habitat in dynamic landscapes. Methods Ecol. Evol. 8, 1253–1264. doi: 10.1111/2041-210X.12799
Masozera, M. K., and Alavalapati, J. R. (2004). Forest dependency and its implications for protected areas management: a case study from the Nyungwe Forest reserve, Rwanda. Scand. J. For. Res. 19, 85–92. doi: 10.1080/14004080410034164
Memarian, H., Balasundram, S. K., Talib, J. B., Sung, C. T. B., Sood, A. M., and Abbaspour, K. (2012). Validation of CA-Markov for simulation of land use and cover change in the Langat Basin, Malaysia. Sci. Res. 4, 542–554. doi: 10.4236/jgis.2012.46059
McHugh, M. L. (2012). Interrater reliability: The kappa statistic. Biochem. Med. 22, 276–282. doi: 10.11613/bm.2012.031
Montibeller, B., Kmoch, A., Virro, H., Mander, Ü., and Uuemaa, E. (2020). Increasing fragmentation of forest cover in Brazil’s legal Amazon from 2001 to 2017. Biochem. Med. 22, 276–282. doi: 10.1038/s41598-020-62591-x
Mukherjee, S., Shashtri, S., Singh, C. K., Srivastava, P. K., and Gupta, M. (2009). Effect of canal on land use/land cover using remote sensing and GIS. J. Indian Soc. Remote Sens. 37, 527–537. doi: 10.1007/s12524-009-0042-6
Munanura, I. E., Tumwesigye, B., Sabuhoro, E., Mariza, D., and Rugerinyange, L. (2018). The quality and performance nexus of the community-based ecotourism enterprises at Nyungwe National Park, Rwanda: a total quality management perspective. J. Ecotour. 17, 160–183. doi: 10.1080/14724049.2017.1304945
Ndayizeye, G., Imani, G., Nkengurutse, J., Irampagarikiye, R., Ndihokubwayo, N., Niyongabo, F., et al. (2020). Ecosystem services from mountain forests: local communities’ views in Kibira National Park, Burundi. Ecosyst. Serv. 45:101171. doi: 10.1016/j.ecoser.2020.101171
Nienhuis, J. H., Ashton, A. D., Edmonds, D. A., Hoitink, A., Kettner, A. J., Rowland, J. C., et al. (2020). Global-scale human impact on delta morphology has led to net land area gain. Nature 577, 514–518. doi: 10.1038/s41586-019-1905-9
Niyonsaba, D., and Ndokoye, P. (2023). Analysis of human-driven extinction of elephants in Nyungwe national park, Rwanda. J Wildl. Biodivers. 7, 183–198.
Nkurunziza, A., Intwarinkase Mutaganzwa, D., Ndayitwayeko, W. M., Nkengurutse, J., Kaplin, B. A., Teixidor Toneu, I., et al. (2023). Local observations of climate change and adaptation responses: a case study in the mountain Region of Burundi-Rwanda. Land 12:329. doi: 10.3390/land12020329
Nunes, M. H., Camargo, J. L. C., Vincent, G., Calders, K., Oliveira, R. S., Huete, A., et al. (2022). Forest fragmentation impacts the seasonality of Amazonian evergreen canopies. Nat. Commun. 13, 1–10. doi: 10.1038/s41467-022-28490-7
Nyirarwasa, A., Han, F., Pan, X., Mind’je, R., Maniraho, A. P., Gasirabo, A., et al. (2020). Evaluating the relationship between National Park Management and local communities’ perceptions based on survey, a case of Nyungwe National Park, Rwanda. J. Geosci. Environ. Prot. 8, 108–126. doi: 10.4236/gep.2020.812007
Ochanda, D. (2012). Potential impacts of climate change on birds in the Albertine rift: A baseline study of Bwindi, Echuya, Nyungwe and Kibira forests, Kampala, Makerere University.
Nyungwe Forest National Park (2022). Local communities around Nyungwe national park. Nyungwe National Park, Rwanda.
Pinto, N. G. M., Rossato, V. P., Müller, A. P., and Coronel, D. A. (2021). Environmental degradation and agriculture: an approach in countries by middle of indexes. Ciência Rural 52:2022. doi: 10.1590/0103-8478cr20201067
Popescu, O.-C., Tache, A.-V., and Petrișor, A.-I. (2022). Methodology for identifying ecological corridors: a spatial planning perspective. Land 11:1013. doi: 10.3390/land11071013
Pyngrope, O. R., Kumar, M., Pebam, R., Singh, S. K., Kundu, A., and Lal, D. (2021). Investigating forest fragmentation through earth observation datasets and metric analysis in the tropical rainforest area. SN Appl. Sci. 3, 1–17. doi: 10.1007/s42452-021-04683-5
Reddy, C. S., Sreelekshmi, S., Jha, C., and Dadhwal, V. (2013). National assessment of forest fragmentation in India: landscape indices as measures of the effects of fragmentation and forest cover change. Ecol. Eng. 60, 453–464. doi: 10.1016/j.ecoleng.2013.09.064
Rudel, T. K., Coomes, O. T., Moran, E., Achard, F., Angelsen, A., Xu, J., et al. (2005). Forest transitions: towards a global understanding of land use change. Glob. Environ. Chang. 15, 23–31. doi: 10.1016/j.gloenvcha.2004.11.001
Rudel, T., and Roper, J. (1997). Forest fragmentation in the humid tropics: a cross–national analysis. Singap. J. Trop. Geogr. 18, 99–109. doi: 10.1111/1467-9493.00007
Rurangwa, M. L., Niyigaba, P., Tobias, J. A., and Whittaker, R. J. (2022). Functional and phylogenetic diversity of an agricultural matrix avifauna: the role of habitat heterogeneity in Afrotropical farmland. Ecol. Evol. 12:e9024. doi: 10.1002/ece3.9024
Rutebuka, E., Zhang, L., Asamoah, E. F., Rukundo, E., and William, A. (2017). Evaluating the conservation efforts of multi-projects using remote sensing and light use efficiency model: a case of Nyungwe Forest National Park, Rwanda. Open J. For. 8, 68–86. doi: 10.4236/ojf.2018.81006
Ryan, S. J., Palace, M. W., Hartter, J., Diem, J. E., Chapman, C. A., and Southworth, J. (2017). Population pressure and global markets drive a decade of forest cover change in Africa's Albertine rift. Appl. Geogr. 81, 52–59. doi: 10.1016/j.apgeog.2017.02.009
Sargent, R. G. (2013). Verification and validation of simulation models. J. Simul. 7, 12–24. doi: 10.1057/jos.2012.20
Sasmal, J., and Sasmal, J. (2016). “Soil health and sustainable growth in agriculture” in Resources, technology and sustainability: An analytical perspective on Indian agriculture. ed. J. Sasmal (Berlin: Springer), 141–179.
Sassen, M., and Sheil, D. (2013). Human impacts on forest structure and species richness on the edges of a protected mountain forest in Uganda. For. Ecol. Manag. 307, 206–218. doi: 10.1016/j.foreco.2013.07.010
Sassen, M., Sheil, D., and Giller, K. E. (2015). Fuelwood collection and its impacts on a protected tropical mountain forest in Uganda. For. Ecol. Manag. 354, 56–67. doi: 10.1016/j.foreco.2015.06.037
Seimon, A. (2012). "Climatology and potential climate change impacts in the Nyungwe Forest National Park, Rwanda." New York: Wildlife Conservation Society.
Sharma, K., Robeson, S. M., Thapa, P., and Saikia, A. (2017). Land-use/land-cover change and forest fragmentation in the Jigme Dorji National Park, Bhutan. Phys. Geogr. 38, 18–35. doi: 10.1080/02723646.2016.1248212
Sibomana, A., Gangadhara Bhatt, H., and Havyarimana, V. (2018). Morphometric analysis of Kagunuzi sub-basin in Kibira national park north-western part of Burundi using geospatial techniques. Int. J. Dev. Res. 8, 19165–19173.
Simberloff, D. S., and Abele, L. G. (1976). Island biogeography theory and conservation practice. Science 191, 285–286. doi: 10.1126/science.191.4224.285
Singh, S. K., Mustak, S., Srivastava, P. K., Szabó, S., and Islam, T. (2015). Predicting spatial and decadal LULC changes through cellular automata Markov chain models using earth observation datasets and geo-information. Environ. Process. 2, 61–78. doi: 10.1007/s40710-015-0062-x
Sudarmanto, B., Suranto, S., Suntoro, S., and Sutrisno, J. (2023). Measuring climate action readiness in maintaining ecological resilience using satellite imagery and field research to assess the effectiveness of climate action in maintaining vegetation structure in Garang watershed, Central Java, Indonesia. Biodiversitas J Biol. Diversity 24:5. doi: 10.13057/biodiv/d240551
Taubert, F., Fischer, R., Groeneveld, J., Lehmann, S., Müller, M. S., Rödig, E., et al. (2018). Global patterns of tropical forest fragmentation. Nature 554, 519–522. doi: 10.1038/nature25508
Taud, H., and Mas, J. (2018). Multilayer perceptron (MLP). Geomatic approaches for Modeling land change scenarios, Springer: Berlin.
Tegegne, Y. T., Lindner, M., Fobissie, K., and Kanninen, M. (2016). Evolution of drivers of deforestation and forest degradation in the Congo Basin forests: exploring possible policy options to address forest loss. Land Use Policy 51, 312–324. doi: 10.1016/j.landusepol.2015.11.024
Tuyisingize, D., Cipolletta, C., Eckardt, W., Caillaud, D., Musana, A., Muvunyi, R., et al. (2023). Regional golden monkey (Cercopithecus mitis kandti) conservation action plan 2023–2028. IUCN Gland.
Twongyirwe, R., Bithell, M., Richards, K. S., and Rees, W. (2015). Three decades of forest cover change in Uganda’s northern Albertine rift landscape. Land Use Policy 49, 236–251. doi: 10.1016/j.landusepol.2015.07.013
Uezu, A., and Metzger, J. P. (2016). Time-lag in responses of birds to Atlantic forest fragmentation: restoration opportunity and urgency. PLoS One 11:e0147909. doi: 10.1371/journal.pone.0147909
van Oosten, C., Uzamukunda, A., and Runhaar, H. (2018). Strategies for achieving environmental policy integration at the landscape level. A framework illustrated with an analysis of landscape governance in Rwanda. Environ. Sci. Policy 83, 63–70. doi: 10.1016/j.envsci.2018.02.002
van Soesbergen, A., Arnell, A. P., Sassen, M., Stuch, B., Schaldach, R., Göpel, J., et al. (2017). Exploring future agricultural development and biodiversity in Uganda, Rwanda and Burundi: a spatially explicit scenario-based assessment. Reg. Environ. Chang. 17, 1409–1420. doi: 10.1007/s10113-016-0983-6
Vellend, M., Verheyen, K., Flinn, K. M., Jacquemyn, H., Kolb, A., Van Calster, H., et al. (2007). Homogenization of forest plant communities and weakening of species–environment relationships via agricultural land use. J. Ecol. 95, 565–573. doi: 10.1111/j.1365-2745.2007.01233.x
Wang, S. Q., Zheng, X., and Zang, X. (2012). Accuracy assessments of land use change simulation based on Markov-cellular automata model. Procedia Environ. Sci. 13, 1238–1245. doi: 10.1016/j.proenv.2012.01.117
Wickham, J., and Riitters, K. (2019). Influence of high-resolution data on the assessment of forest fragmentation. Landsc. Ecol. 34, 2169–2182. doi: 10.1007/s10980-019-00820-z
Wulder, M. A., White, J. C., Han, T., Coops, N. C., Cardille, J. A., Holland, T., et al. (2008). Monitoring Canada’s forests. Part 2: national forest fragmentation and pattern. Can. J. Remote. Sens. 34, 563–584. doi: 10.5589/m08-081
Zhang, Y., Su, K., Jiang, X., You, Y., Zhou, X., Yu, Z., et al. (2023). Response of ecosystem services to impervious surface changes and their scaling effects in loess plateau ecological screen, China. Ecol. Indic. 147:109997. doi: 10.1016/j.ecolind.2023.109997
Keywords: Nyungwe-Kibira Forest, remote sensing, landscape pattern, land use land cover, transboundary forest
Citation: Udahogora M, Zhaoping Y, Fang H, Kayumba PM and Mind’je R (2024) Exploring the landscape pattern change analysis for the transboundary Nyungwe-Kibira Forest (2000–2019): a spatially explicit assessment. Front. For. Glob. Change. 6:1292364. doi: 10.3389/ffgc.2023.1292364
Edited by:
Shalom D. Addo-Danso, Forest Research Institute of Ghana, GhanaReviewed by:
Kwadwo Kyenkyehene Kusi, Forest Research Institute of Ghana, GhanaCopyright © 2024 Udahogora, Zhaoping, Fang, Kayumba and Mind’je. This is an open-access article distributed under the terms of the Creative Commons Attribution License (CC BY). The use, distribution or reproduction in other forums is permitted, provided the original author(s) and the copyright owner(s) are credited and that the original publication in this journal is cited, in accordance with accepted academic practice. No use, distribution or reproduction is permitted which does not comply with these terms.
*Correspondence: Yang Zhaoping, eWFuZ3pwQG1zLnhqYi5hYy5jbg==
Disclaimer: All claims expressed in this article are solely those of the authors and do not necessarily represent those of their affiliated organizations, or those of the publisher, the editors and the reviewers. Any product that may be evaluated in this article or claim that may be made by its manufacturer is not guaranteed or endorsed by the publisher.
Research integrity at Frontiers
Learn more about the work of our research integrity team to safeguard the quality of each article we publish.