 Xiao Feng
 Qingbin Fan2*
 Jianjun Qu
95% of researchers rate our articles as excellent or good
Learn more about the work of our research integrity team to safeguard the quality of each article we publish.
Find out more
ORIGINAL RESEARCH article
Front. For. Glob. Change , 09 November 2023
Sec. Forest Disturbance
Volume 6 - 2023 | https://doi.org/10.3389/ffgc.2023.1288449
This article is part of the Research Topic Assessment of Anthropogenic Pollution as a Cause of Forest Disturbance View all 5 articles
Research on carbon sources/sinks in desert ecosystems is of great importance to understand the carbon cycle and its response to climate change. Net primary productivity (NPP) and net ecosystem productivity (NEP) are the two most important indictors for quantitatively evaluating carbon storage and can be used to indicate the response of terrestrial ecosystems to climate change. In this study, we used remote sensing data, meteorological data and vegetation type data to estimate the NPP and NEP using CASA model and soil respiration model from 2000 to 2020 in the region of Yulin, which is a typical desertification reversal region in the Mu Us Sandy Land. The spatial and temporal features of the NPP and NEP and their relationships with temperature and precipitation were determined. The results showed that both the annual NPP and NEP showed an increasing trend from 2000 to 2020 in the region of Yulin, where the terrestrial ecosystem acted as a carbon source until 2001 but turned into a sink thereafter. The carbon storage showed an increasing trend with a rate of 0.50 Tg C·a−1 from 2000 to 2020. Both the mean annual NPP and the total NEP increased from the west to the east of the region in spatial distribution. The total NEP indicated that the area with a carbon sink accounted for 89.22% of the total area, showing a carbon accumulation of 103.0 Tg C, and the carbon source area accounted for 10.78% of the total area with a carbon emission of 4.40 Tg C. The net carbon sequestration was 99.44 Tg C in the region of Yulin during the period from 2000 to 2020. Temperature had no significant effects on NPP and NEP for most areas of the region, while precipitation had a positive effect on the increasing NPP in 75.3% of areas and NEP in 30.07% of areas of the region. These results indicated that it is of utmost significance to protect terrestrial ecosystems from degradation, and ecological restoration projects are essential in combating desertification, which would be helpful for soil water conservation and could effectively increase carbon storage in desert ecosystems.
The carbon cycle, one of the most important surface processes in terrestrial ecosystems, has an association with climate change (Cox et al., 2000; Lu et al., 2018). Studies on the carbon cycle, including carbon sources and sinks, the effect of greenhouse gas emissions and carbon neutrality, have long been a focus of research in the field of global change (Piao et al., 2009; Wang et al., 2015; Fang et al., 2018). According to the United Nations Framework Convention on Climate Change, a carbon source or sink is defined as the process, activity or mechanism that releases or removes greenhouse gases, aerosols or their precursors into or from the atmosphere (Dai et al., 2016) and is significantly affected by the restored or degraded vegetation in terrestrial ecosystems (Feng et al., 2013; Crowther et al., 2016; Chuai et al., 2018). Although carbon can be sequestrated in terrestrial ecosystems, it can be released into the atmosphere when ecosystems are degraded (Tong et al., 2018; Piao et al., 2019; Luo and Xia, 2020). For instance, serious land degradation has led to the considerable loss of biomass and soil carbon stocks due to unreasonable human activities and climate change (Houghton and Hackler, 2003; Liu and Tian, 2010). Therefore, it is of utmost importance to protect the ecosystems from degradation, in order to reduce the carbon loss.
Natural environmental factors, such as climate factors, soil properties and ecosystem types, and human activities including fossil-fuel burning, land-use changes as well as management practices are considered as the main factors influencing the carbon sources and sinks (Liu et al., 2022). Precipitation and temperature are two of the most important climate factors affecting the distribution patterns of carbon sources and sinks, as they play a critical role in the growth of vegetation, thus affecting the input of organic matters, meanwhile, precipitation and temperature also contribute to carbon consumption through microbial activities (Sun and Du, 2017; Du et al., 2021; Liu et al., 2022; Yang et al., 2022). However, the effects of precipitation and temperature on carbon fluxes varied in different climate regions. For example, precipitation is an important control of the carbon cycle in arid and semiarid regions, as the NPP is limited by the water scarcity (Lal, 2019). The influence of temperature on carbon accumulation was more significant than that of precipitation in high altitude regions, because low temperature is the most important factor in limiting plant growth in cold regions (Sun and Du, 2017). Therefore, research on carbon sources and sinks is of great importance regarding the carbon cycle in terrestrial ecosystems, and understanding their response to climate change is essential to evaluate the effects of global change on terrestrial ecosystems.
In recent years, there have been many reports on carbon sinks and sources in China’s terrestrial ecosystems, however, these studies mainly concentrated on forest, farmland, grassland or scrub ecosystems (Pan et al., 2011; Fang et al., 2014; Dai et al., 2016; Tang et al., 2018; Liu et al., 2022). Desert ecosystems are one of the most important components of terrestrial ecosystems in China, playing an important role in carbon sequestration and emission (Noy-Meir, 1973; Schlesinger et al., 2009; Lal, 2019; Wei et al., 2023). However, there are relatively few studies on the carbon sources and sinks in desert ecosystems in China, especially in the process of desertification reversal.
China is one of the most seriously decertified countries in the world, and its desertification area reached 3.86 × 10⁵ km2 in 2000 (Wang, 2014). To control desertification, a series of ecological protection measures have been implemented and have significantly improved desert ecosystem services (Wang et al., 2013; Wang, 2014; Zhang and Huisingh, 2018). Studies have shown that the implementation of national ecological restoration projects, such as the Three-North Shelterbelt Program, the Yangtze River and Pearl River Shelterbelt Program, the natural forest protection project, the return of farmland to forest project, the Beijing-Tianjin sand source management project, the return of grazing land to grassland project and other national key ecological restoration projects, have addressed 44.8% of China’s forests and 23.2% of grasslands (Lu et al., 2018). These ecological restoration projects have significantly increased the carbon stock of China’s terrestrial ecosystems and made a great contribution to China’s carbon dioxide emission reduction (Feng et al., 2013; Fang et al., 2014; Ouyang et al., 2016; Lu et al., 2018). Therefore, understanding the dynamics of carbon sources and sinks during the desertification reversal process is helpful to evaluate the benefits of desertification control in carbon cycle in arid and semiarid regions.
Mu Us Sandy Land is one of the four typical sandy lands in China and is located at the junction of the southern part of the Ordos Plateau and the northern part of the Loess Plateau, accounting for approximately 4.7% of the total desert area in China. Mu Us Sandy Land was once a seriously decertified area in China, and it is also an area where desertification control is remarkable (Hao and Wu, 2006; Han et al., 2020; Lin et al., 2022). With the implementation of a series of ecological protection measures, such as the Three-North Shelterbelt Project and the national return of farmland to forest and grassland in Shaanxi Province, the ecological environment of Mu Us Sandy Land in Shaanxi has greatly improved, the vegetation coverage of sandy land has increased significantly (Qiu et al., 2017; Wang et al., 2021), and the desertification area has shown an obvious reduction. However, the carbon sources and sinks in the desertification reversal process of the Mu Us Sandy Land in Shaanxi have not yet been systematically evaluated, and their spatiotemporal characteristics as well as their relationships with climate change have been poorly understood.
Net primary productivity (NPP) and net ecosystem productivity (NEP) are two important indicators for evaluating carbon sources and sinks quantitatively and can be used to indicate the response of the carbon cycle to climate change (Cramer et al., 1999; Ruimy et al., 1999; Catovsky et al., 2002; Verlinden et al., 2013). NPP is defined as the amount of organic matter produced by plants in a certain period, which is the difference between the total photosynthetic uptake of CO2 by the ecosystem and the carbon released by plant respiration, playing an important role in the carbon flux between the atmosphere and the terrestrial ecosystems (Shao et al., 2016). NEP is the difference between NPP and heterotrophic ecosystem respiration. A positive value for NEP indicates an area is a carbon sink, where carbon enters the ecosystem from the atmosphere, whereas a negative value denotes a carbon source, where carbon releases from the ecosystem into the atmosphere (Verlinden et al., 2013; Wang B. et al., 2017).
In this study, we took the city of Yulin in Shaanxi Province, a typical region of desertification reversal in Mu Us Sandy Land, as the study area. We used remote sensing data, meteorological data and vegetation type data to estimate the NPP and NEP in the region of Yulin from 2000 to 2020 using CASA model improved by Zhu et al. (2006, 2007) and soil respiration model. The spatial and temporal features of NPP and NEP and their relationships with climate factors were determined. The results of this study may be helpful for understanding carbon sequestration in the desertification reversal process and its response to regional climate change and could be beneficial for policy-makers to conduct effective measures to increase carbon storage and decrease carbon emissions in desert ecosystems.
The region of Yulin (36°57 ‘~39°35’ N, 107°28 ‘~111°15’ E) in Shaanxi Province is located at the Northeastern Mu Us Sandy Land (Figure 1A). It is one of the most important regions where a series of national ecological projects have been conducted. The land area was 43,816 km2, and the permanent population was 3.625 million in 2020 in this region. The terrain of Yulin is complex and diverse, showing a spatial pattern of high in the west and low in the east with an average elevation of 1,218 m (Figure 1B). Sandy land with a flat terrain is distributed in the northwest of Yulin. Southern Yulin is the hinterland of the Loess Plateau, with broken terrain and ravines. The southwest of the region has a distribution of beam-shaped low hills, with a high terrain and broad beam tableland as well as staggered Liangjian. Yulin is a semiarid area in Shaanxi Province, with an annual average temperature of 9.3°C and an annual average precipitation of 438 mm. The Mu Us Sandy Land in western Yulin is located on the southeastern edge of the Mu Us Sandy Land and includes five counties: Shenmu, Yuyang, Hengshan, Jingbian and Dingbian (Figure 1C).
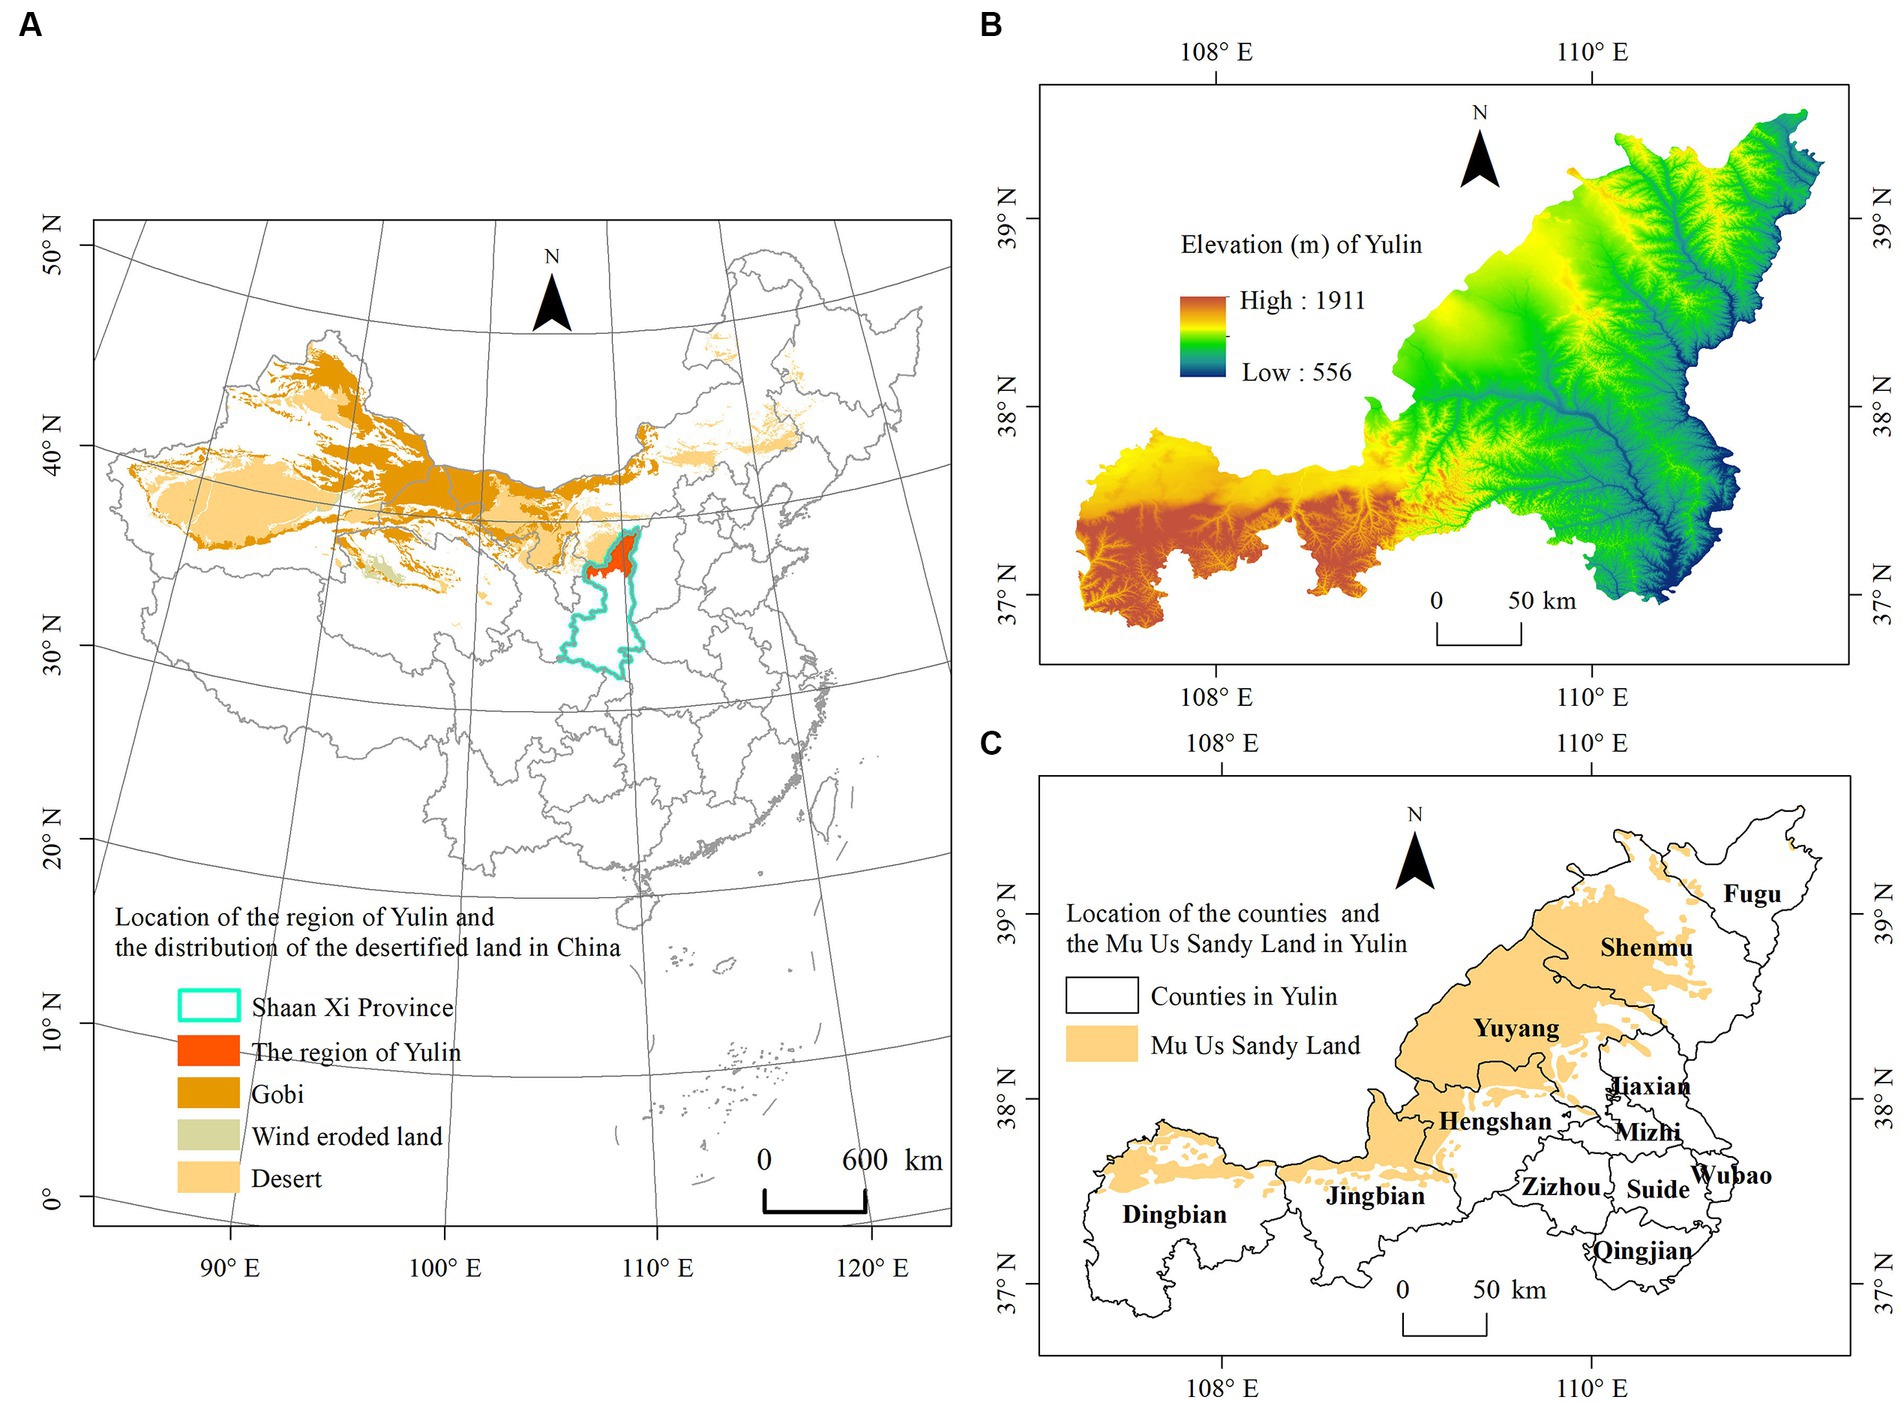
Figure 1. Location of the study area in China (A) and the elevation (B) and location of the counties and the Mu Us Sandy Land in the study area (C).
We used remote sensing images, meteorological data and vegetation type data to estimate the NPP and NEP and analyze their relationships with climatic factors in the process of desertification reversal in the region of Yulin, Shaan Xi Province.
The remote sensing images were EOS/MODIS vegetation products MOD13Q1-NDVI from 2000 to 2020 provided by NASA,1 with a spatial resolution of 250 m × 250 m and a temporal resolution of 16 days. These images were processed after the transformation of projection, clip, maximum value synthesis and outlier elimination by using MRT and ArcGIS, and then monthly MODIS NDVI images from 2000 to 2020 in the region of Yulin were obtained.
Meteorological data, including monthly temperature and precipitation data from 2000 to 2020, were obtained from the National Tibetan Plateau Scientific Data Center in China.2 The data format of temperature and precipitation was NETCDF, and the spatial resolution was 1 km × 1 km. Monthly solar radiation data from 2000 to 2020 were from the geographic remote sensing ecological network,3 with a raster data format and a spatial resolution of 1 km × 1 km.
Rasterized meteorological data are needed to estimate NPP to be spatially matched with remote sensing data. In this paper, the precipitation and temperature data in the format of NetCDF were converted into raster data by ArcGIS. In the ArcMap, we selected “Make NetCDF Raster Layer” in the Multidimension Tools from the Arc Toolbox, then the related data and parameters were input in the dialog box, and finally the related raster layers were obtained. The rasterized precipitation, temperature and solar radiation data were processed by projection conversion, pruning and resampling, etc., to obtain the raster data of meteorological elements with the same pixel size, row number and projection as NDVI data.
Vegetation type data were obtained from the Environmental and Ecological Science Data Center in Western China of the National Natural Science Fund Committee.4 The vegetation type data were obtained from the 1:100,000 vegetation atlas of China, and the data format was vector. Using ArcGIS software, the vector data were processed by clipping, raster conversion, reclassification, projection, resampling, etc., to obtain rasterized data with the same pixel size, row number and projection as NDVI data. The main vegetation types in Yulin are cultivated vegetation, grassland, meadow, shrub, coniferous forest, grassland, desert, broadleaf forest and swamp.
Carnegie-Ames-Stanford Approach (CASA) is a widely recognized model for regional and global NPP estimation based on light utilization efficiency using data of remote sensing, precipitation, temperature, solar radiation, vegetation indexes and soil types. The CASA model can effectively reflect the changes in terrestrial ecosystems due to climate change and human activities; therefore, it is widely used in the study of vegetation ecosystem dynamics (Cramer et al., 1999; Piao et al., 2001). In this paper, the CACA model improved by Zhu et al. (2007) is used to estimate the NPP, and there are three advantages: (1) the classification of vegetation cover and the classification accuracy are considered when using the CASA model; (2) the maximum light utilization efficiencies for vegetation types in China are simulated based on field observed data in order to minimize the error in the estimation of NPP, making the model more suitable to China; (3) the regional evapotranspiration method is applied to computerize the water stress factor by using climate data.
The improved model to estimate NPP is based on Eq. (1):
where NPP (x, t) represents the net primary productivity of vegetation (g C/m2) of pixel x in month t; APAR(x, t) represents the photosynthetically active radiation (MJ·m−2) of pixel x in month t; and ε (x, t) represents the conversion rate of light energy (g C·MJ−1) of pixel x in month t. The relevant parameters used in the model include monthly average temperature, monthly precipitation, monthly total solar radiation, NDVI time-series data, vegetation type map and static parameter documents (Zhu et al., 2006).
NEP is an important index used to measure regional vegetation carbon sources and sinks. It is equal to the difference between NPP and carbon consumption by soil heterotrophic respiration RH. If NEP > 0, the ecosystem functions as a carbon sink; otherwise, it is a carbon source. The calculation of NEP is shown in Eq. (2).
Where NEP (x, t) represents the net ecosystem productivity of vegetation (g C/m2) of pixel x in month t and RH (x, t) represents the soil heterotrophic respiration (g C/m2) of pixel x in month t.
Soil heterotrophic respiration RH (x, t) was estimated using a consumption model based on soil respiration as Eq. (3) shows.
where Rs (x, t) represents the soil respiration rate (g C/m2) of pixel x in month t.
The soil respiration rate Rs (x, t) was estimated by Eq. (4).
where b is the temperature sensitivity coefficient (b = 0.05452); Ta is the monthly mean temperature (°C); P is the monthly precipitation (cm), and both f and k are constants (f = 1.250, k = 4.259).
The univariate linear regression analysis method was used to analyze the interannual variations in NPP (or NEP) during the desertification reversal process. The slope of the trend line, as shown in Eq. (5) was used to indicate the interannual variation trend of NPP (or NEP), and the T-test was performed to determine the significance of the variation trend (Feng et al., 2024).
where Slope is the slope of the trend line. Yi is the NPP (NEP) value of a pixel in year i, and n is the number of years during the monitoring period. Slope > 0 indicates that NPP (NEP) presents an increasing trend in a certain period, while Slope < 0 indicates that NPP (NEP) presents a decreasing trend.
According to the significance level, three situations were analyzed, which were extremely significant (p < 0.01), significant (0.01 < p < 0.05) and not significant (p > 0.05).
The correlation analysis method was used to analyze the correlation between NPP (or NEP) and climate factors, including temperature and precipitation. The correlation coefficients were calculated as Eq. (6).
where Rx, y is the correlation coefficient between x and y, xi is the value of NPP (or NEP) in year i, and yi is the precipitation or mean temperature in year i. xp and yp are average values of x and y for years, respectively, and n is the number of years. Rx, y > 0 indicates that NPP (or NEP) is positively correlated with climate factors, and Rx, y < 0 indicates that NPP (or NEP) is negatively correlated with climate factors (Feng et al., 2024).
T-test was used to test the significance of the correlation coefficients. According to the results of the significance test, the significance level was divided into three situations: extremely significant (p < 0.01), significant (0.01 < p < 0.05), and not significant (p > 0.05).
The interannual variations in carbon sources/sinks in the region of Yulin from 2000 to 2020 are shown in Figure 2. As seen, the annual NPP in the region of Yulin varied from 171.41 to 458.26 g C·m−2·a−1 with an average annual value of 336.57 g C·m−2·a−1 from 2000 to 2020, showing an increasing trend with a rate of 12.39 g C·m−2·a−1. The NEP ranged from −27.02 to 216.03 g C·m−2·a−1 from 2000 to 2020 in this region, showing an increasing trend with a rate of 11.39 g C·m−2·a−1. The total NEP over the past 21 years was 2269.55 g C·m−2, and the mean annual NEP was 108.07 g C·m−2 during this period.
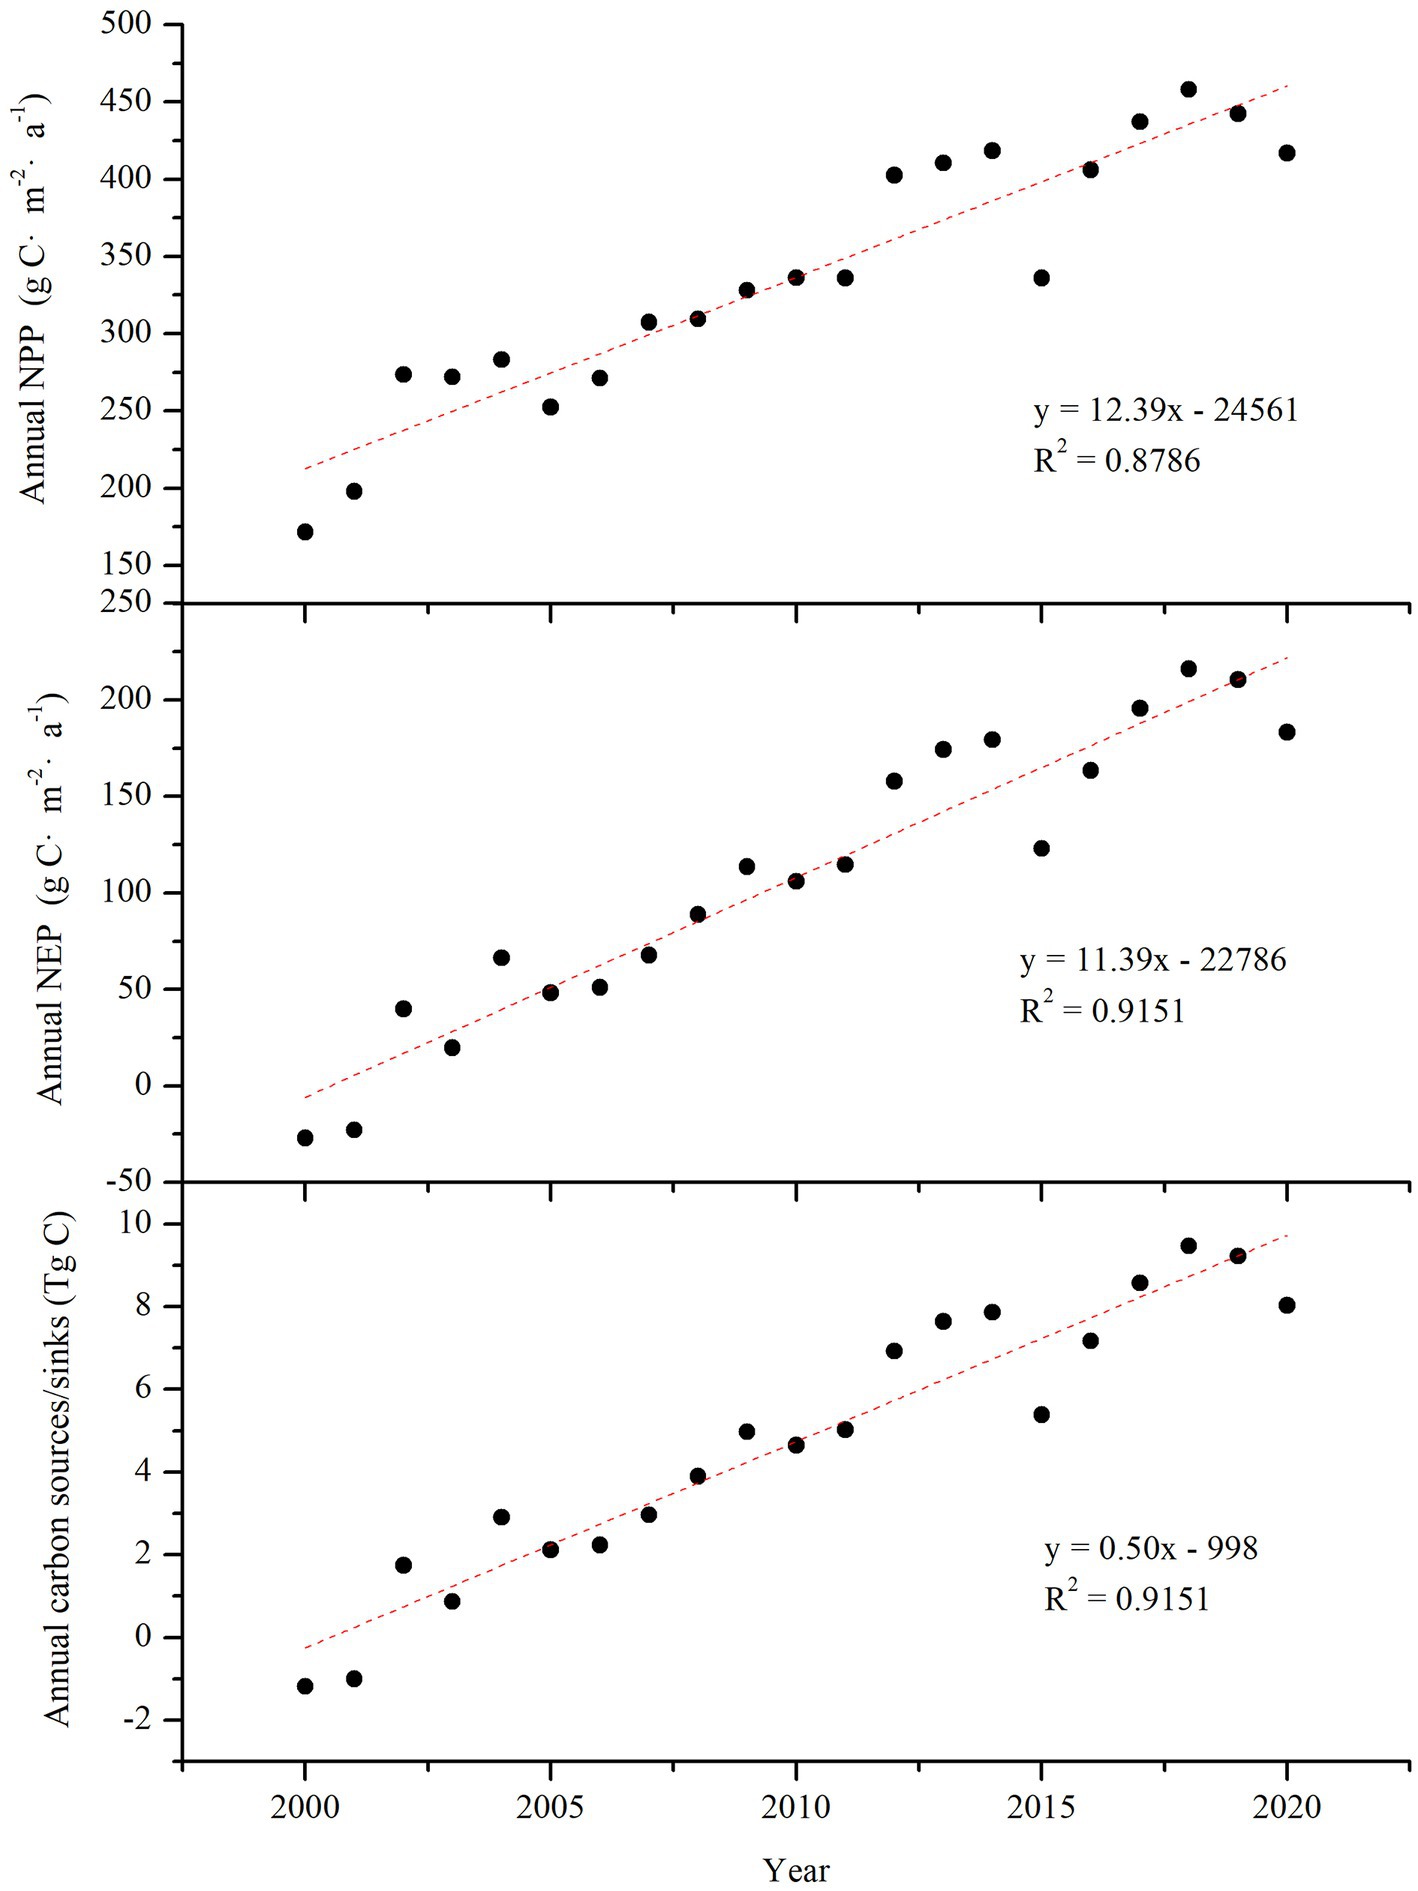
Figure 2. Interannual variations in carbon sources/sinks in the region of Yulin from 2000 to 2020. 1 Tg C = 1 × 10¹² g C.
Values of the NEP indicated a carbon source in 2000 and 2001 and a carbon sink from 2002 to 2020 in Yulin. The annual carbon sources were 1.18 Tg C in 2000 and 1.00 Tg C in 2001 in the region of Yulin, where the desertification was very serious and the ecological protection measures were at the beginning stage during the period from 2000 to 2001. The carbon storage showed an increasing trend with a rate of 0.50 Tg C·a−1 from 2000 to 2020 as vegetation was gradually recovered. The carbon sink in 2020 was 3.59 times higher than that in 2002.
The spatial distribution of the average annual NPP in the region of Yulin from 2000 to 2020 is shown in Figure 3. As can be seen, the average annual NPP in Yulin showed a spatial distribution pattern of lower values in the west and higher values in the east during each period from 2000 to 2020. During the period from 2000 to 2020, the area with NPP ranging from 0 to 300 g C·m−2·a−1 accounted for 33.8% of the total area and was mainly in western Yulin. The area with NPP of 300 ~ 400 g C·m−2·a−1 accounted for 40.4% and was mainly distributed in the middle part of Yulin. The area with NPP greater than 400 g C·m−2·a−1 accounted for 25.8% and was mainly distributed in the eastern part of Yulin. Similar spatial distributions of the NPP were found during the period of 2000 ~ 2005, 2006 ~ 2010, 2011 ~ 2015 and 2016 ~ 2020, respectively. The average annual NPP of Yulin was 250.28, 339.30, 418.94 and 466.83 g C·m−2 during the period of 2000 ~ 2005, 2006 ~ 2010, 2011 ~ 2015 and 2016 ~ 2020, respectively, indicating that vegetation recovered gradually and the accumulation of carbon increased from 2000 to 2020.
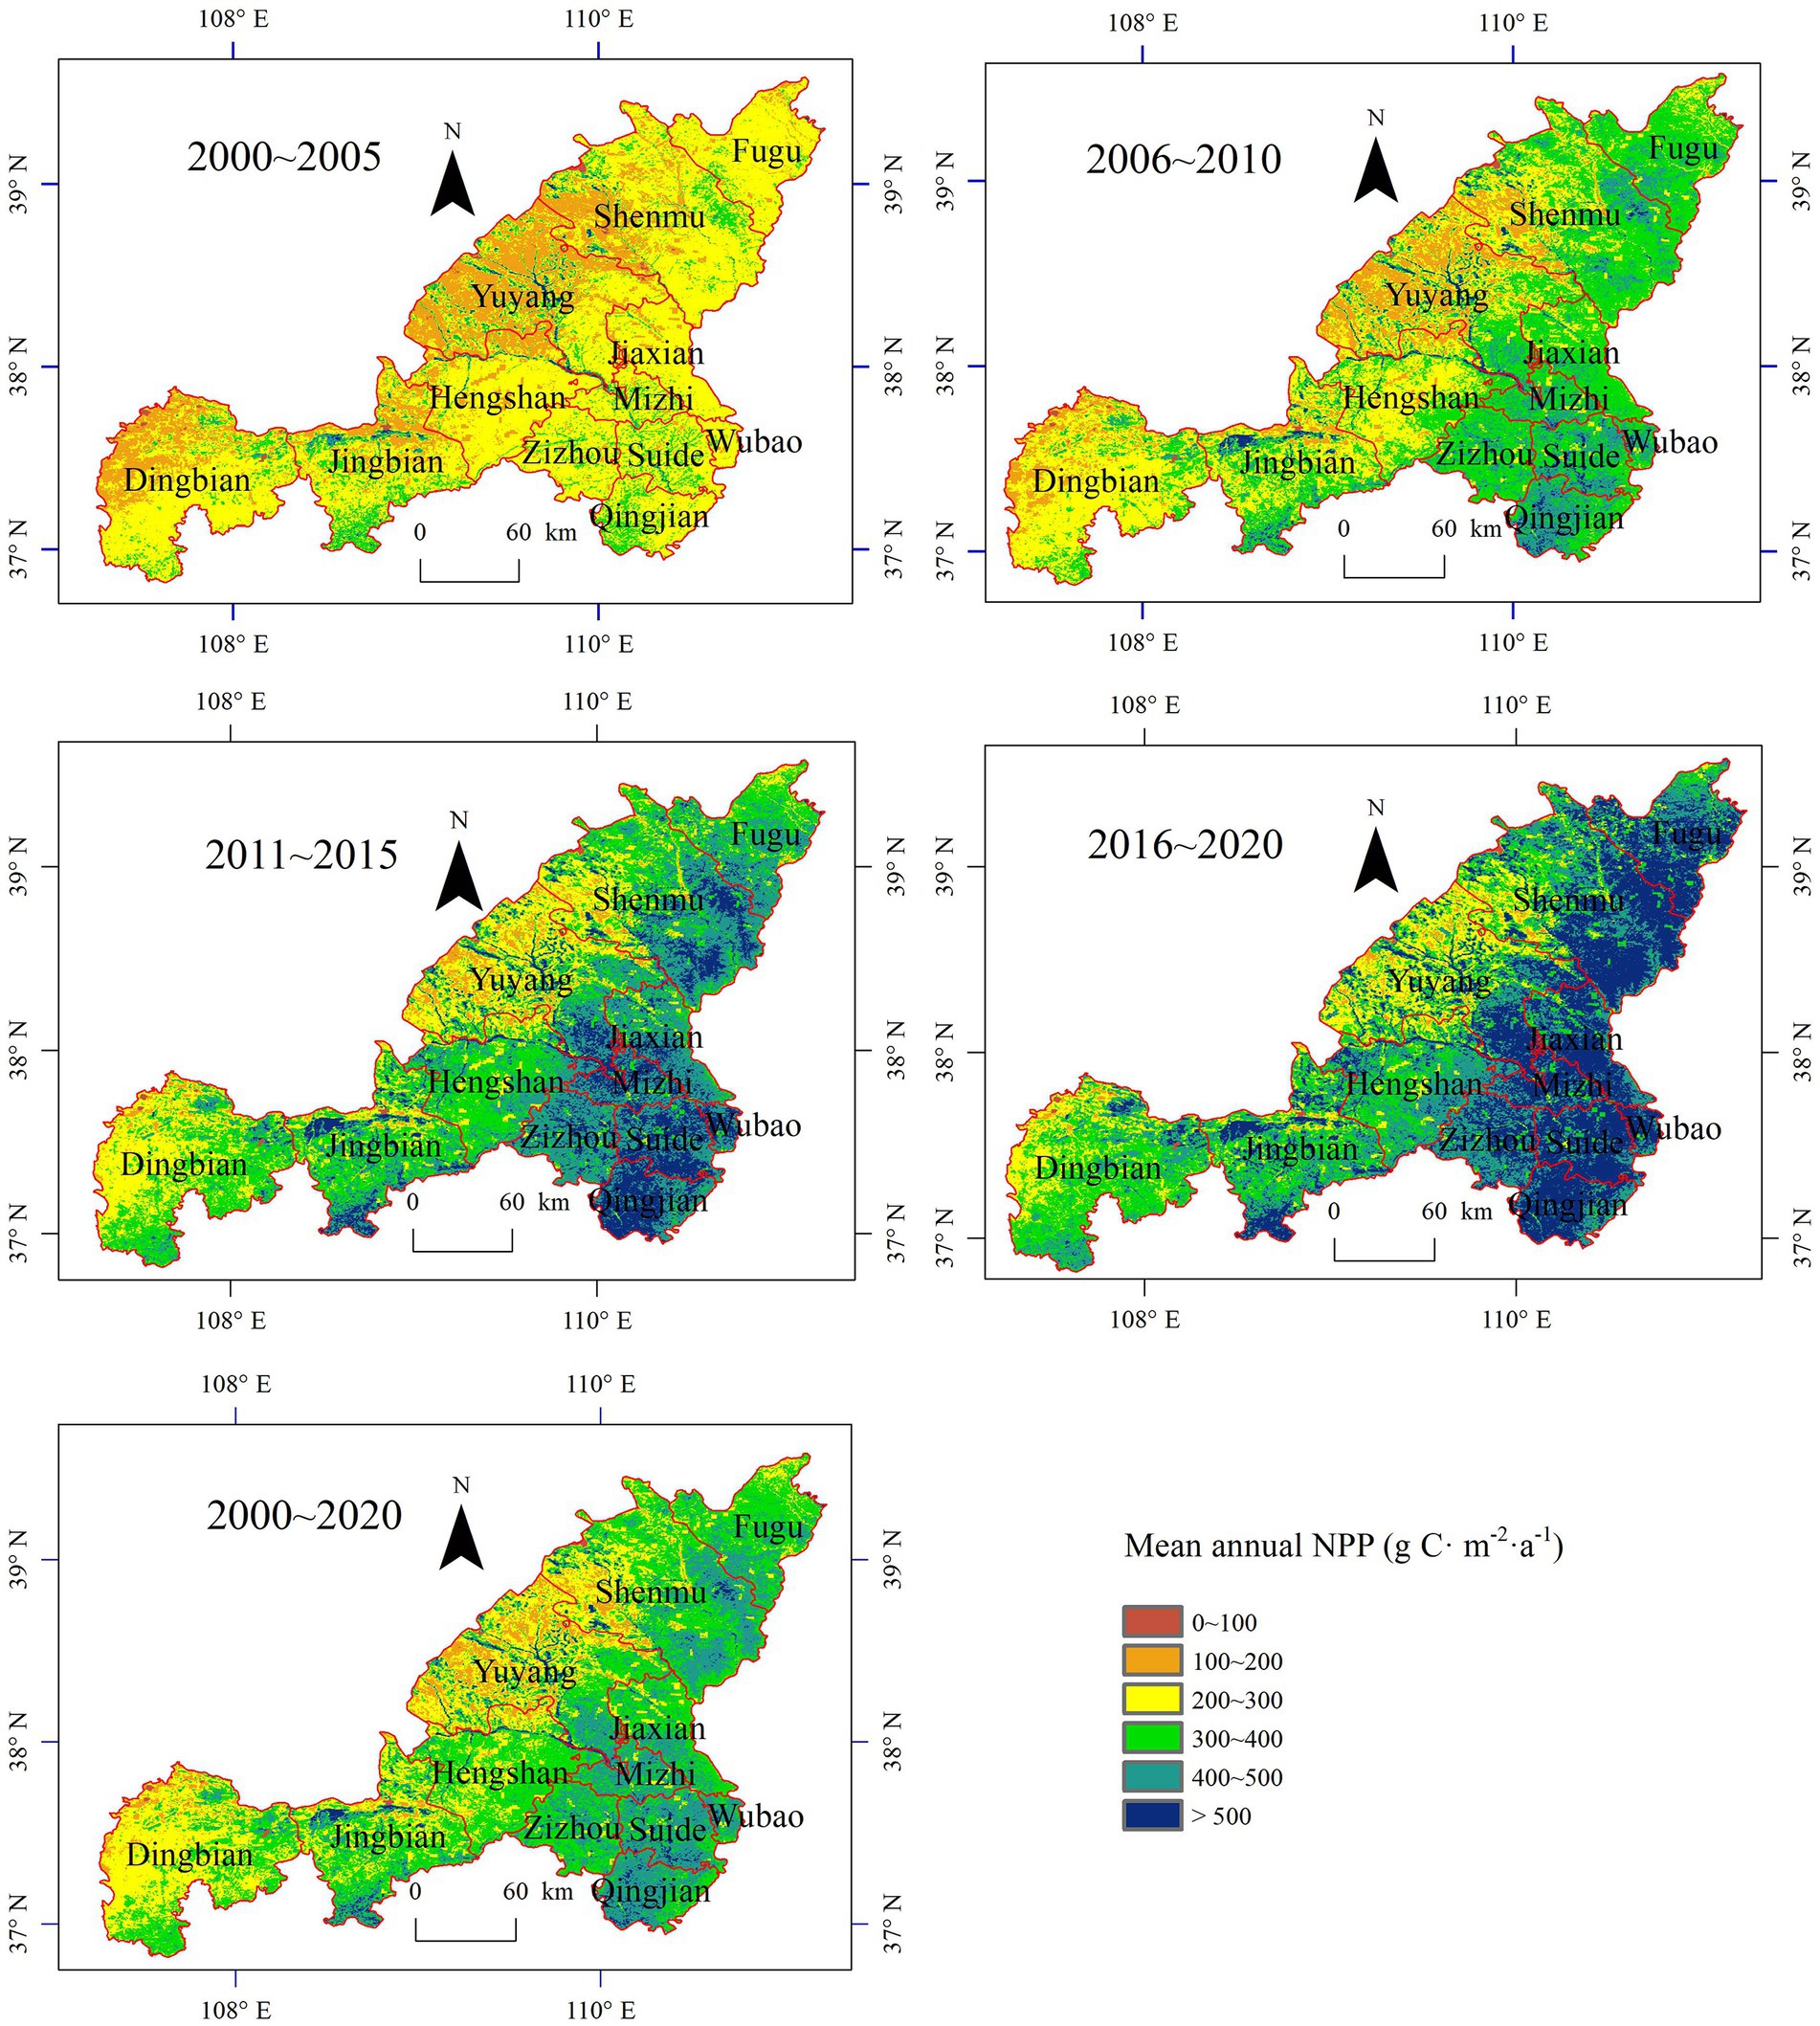
Figure 3. Spatial distribution of average annual NPP in the region of Yulin from 2000 to 2020.
The average annual NPP in the counties of Yulin from 2000 to 2020 is shown in Figure 4. As seen, the average annual NPP in each county increased from 2000 to 2020, and values of the NPP during the periods of 2000 ~ 2005 and 2006 ~ 2010 were below the average level of 2000 ~ 2020, whereas the values during the periods of 2011 ~ 2015 and 2016 ~ 2020 were higher than the average values from 2000 to 2020. The average annual NPP in the counties of Dingbian, Yuyang, Hengshan, Jingbian and Shenmu which are located in the western Yulin were lower than those in the counties of Wubao, Suide and Qingjian which are located in the eastern Yulin, indicating a spatial distribution pattern of lower NPP in the west and higher values in the east of Yulin.

Figure 4. The average annual NPP during each period in the counties of Yulin from 2000 to 2020.
The spatial distribution of the total NEP in Yulin from 2000 to 2020 is shown in Figure 5. The total NEP increased from the west to the east gradually in spatial distributions during each period of 2000 ~ 2005, 2006 ~ 2010, 2011 ~ 2015 and 2016 ~ 2020. Counties of Yuyang, Dingbian, Hengshan, Jingbian and Shenmu are located in western Yulin, and the total NEP of these counties showed lower values than those located in eastern Yulin, as shown in Figure 6. Counties of Fugu, Zizhou, Mizhi, Qingjian and Suide are distributed from the west to the east of Yulin successively, and the corresponding total NEP were 2,794, 2,998, 3,502, 3,593 and 3,639 g C·m−2 from 2000 to 2020, respectively.
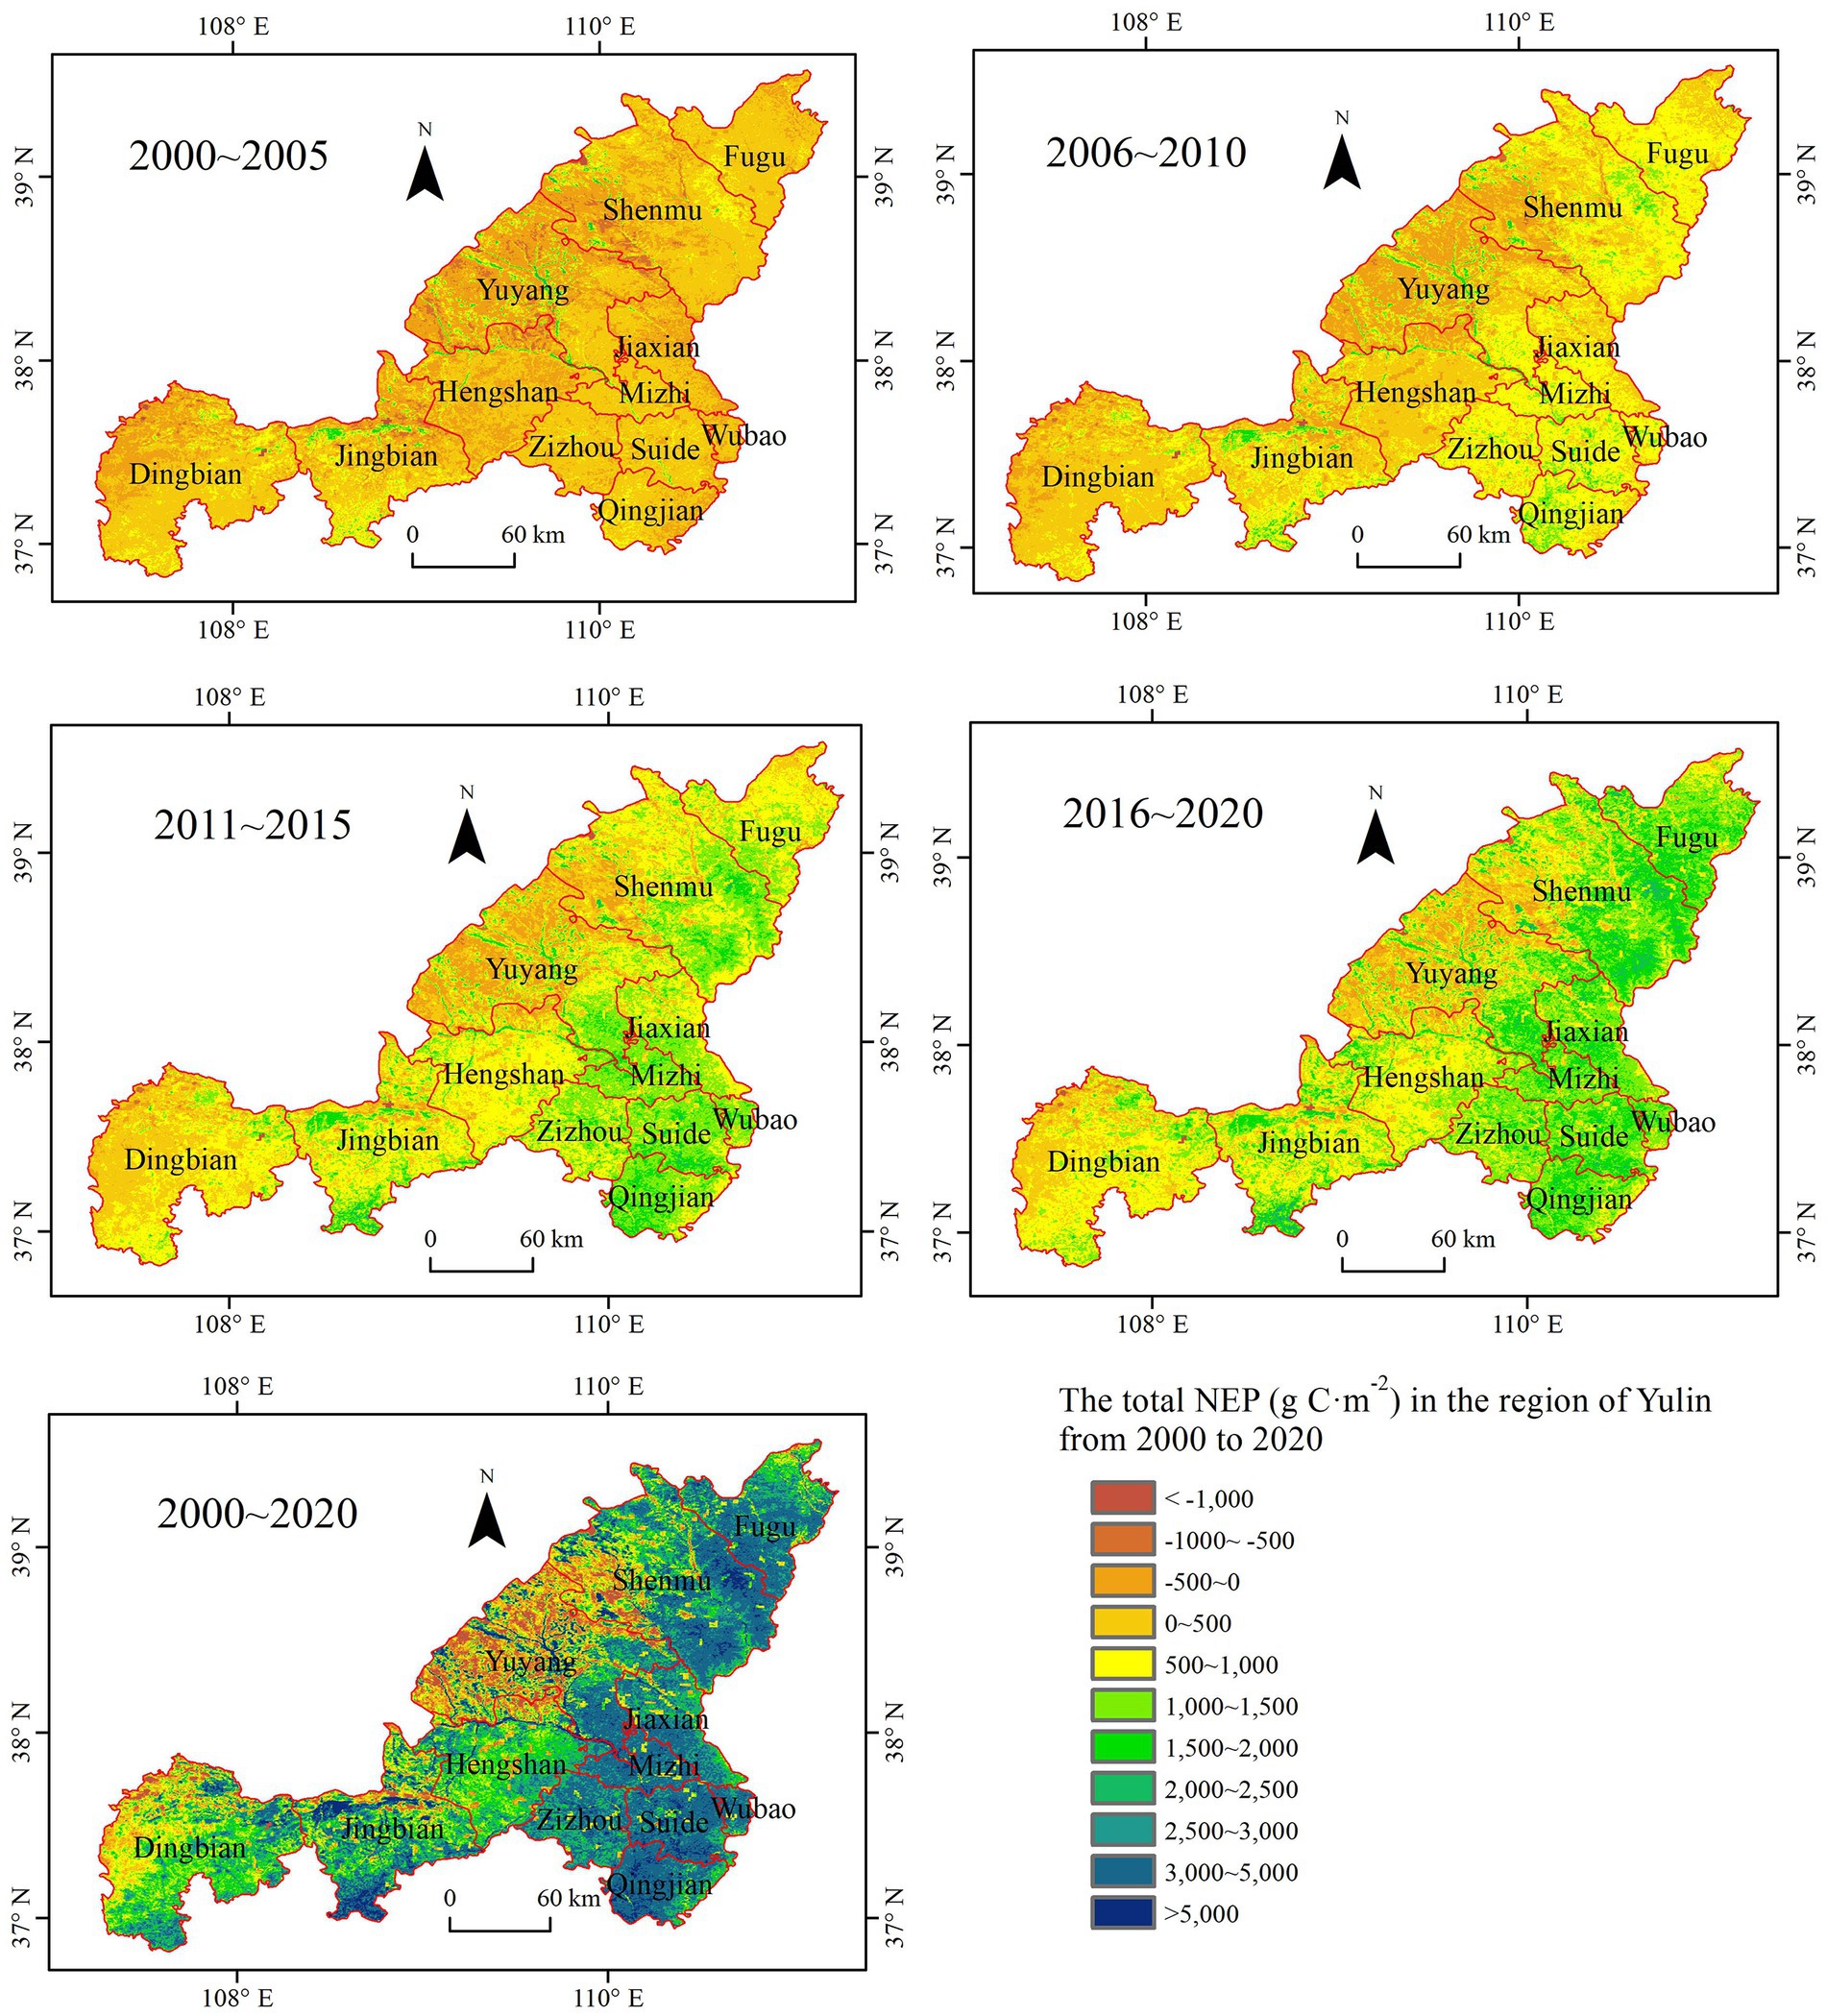
Figure 5. Spatial distribution of the total NEP in the region of Yulin from 2000 to 2020.
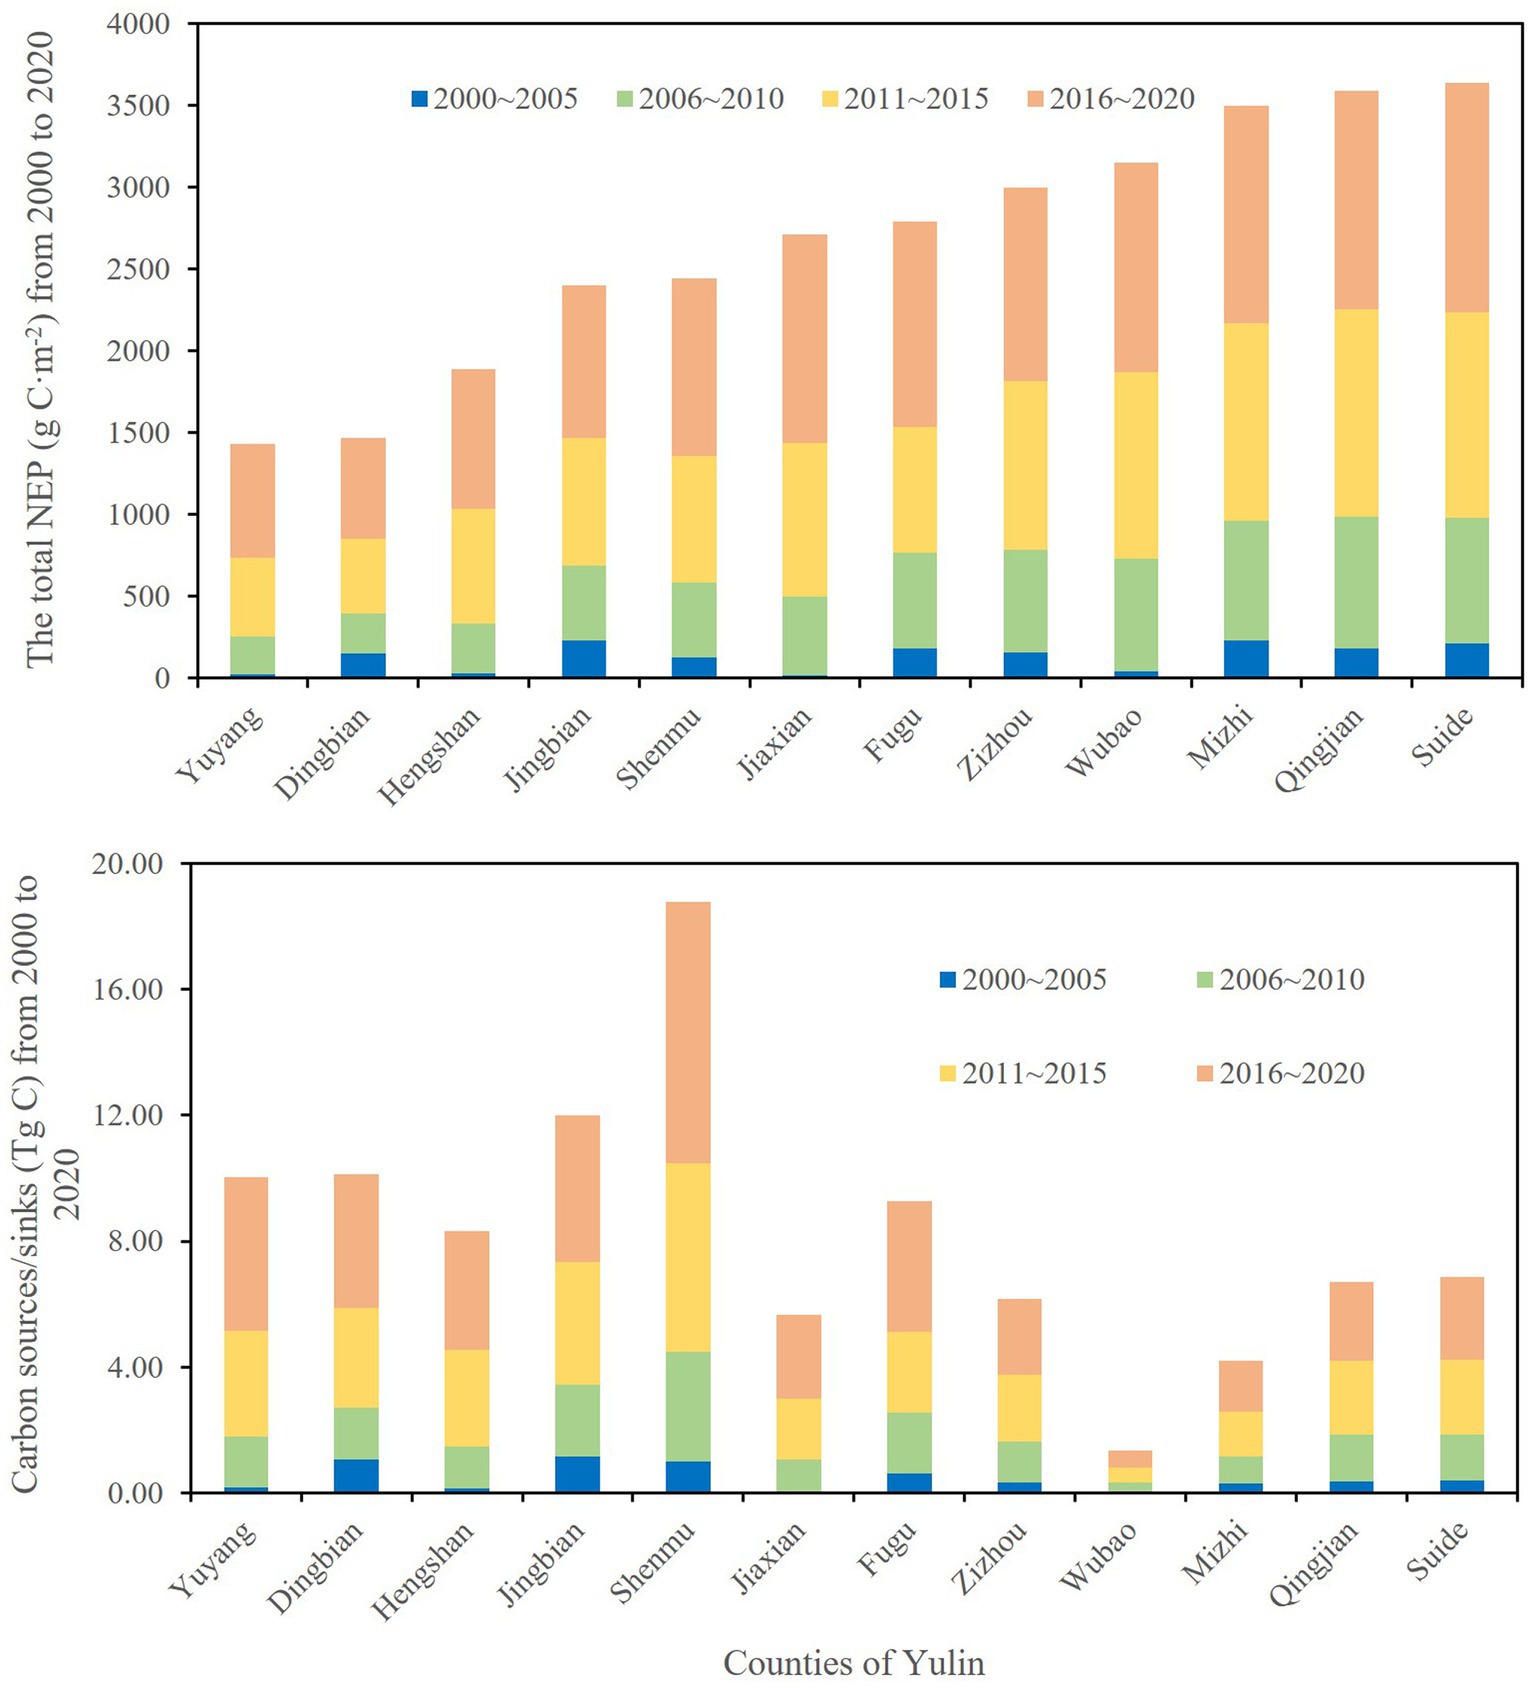
Figure 6. The total NEP and carbon sources/sinks in the counties of Yulin from 2000 to 2020.
According to the spatial analysis, the carbon source area (NEP < 0) was 4,723 km2, accounting for 10.78% of the total area of Yulin, mainly distributed in the western sandy area of the region, while the area with a carbon sink (NEP > 0) was 39,093 km2, accounting for 89.22% of the total area during the period from 2000 to 2020. According to the calculation results based on the total NEP and the related area, the carbon sink was 103.00 Tg C from 2000 to 2020 in areas where NEP > 0 (carbon sink areas) with a total NEP of 2634.8 g C·m−2 and an area of 39,093 km2. The carbon source was 4.40 Tg C from 2000 to 2020 in areas where NEP < 0 (carbon source areas) with a total NEP of −931.2 g C·m−2 and an area of 4,723 km2. The total NEP was 2269.55 g C·m−2 in the entire study area with a total carbon sequestration of 99.44 Tg C from 2000 to 2020.
The total NEP in the region of Yulin showed an increasing trend from 2000 to 2020, as shown in Figure 5. The total NEP was 124.55, 427.00, 749.13 and 968.87 g C·m−2 during the period of 2000 ~ 2005, 2006 ~ 2010, 2011 ~ 2015 and 2016 ~ 2020, respectively. Both the carbon source areas and carbon emissions decreased, while the carbon sink areas and carbon sequestrations increased from 2000 to 2020. The carbon source areas accounted for 33.32, 15.75, 8.08 and 5.02% during the period of 2000 ~ 2005, 2006 ~ 2010, 2011 ~ 2015 and 2016 ~ 2020, respectively. Accordingly, the carbon sink areas accounted for 66.68, 84.25, 91.92 and 94.98% during the corresponding period. The carbon emissions were 3.58, 1.49, 0.87 and 0.65 Tg C, whereas the carbon sequestrations were 9.04, 20.19, 33.69 and 43.10 Tg C during the period of 2000 ~ 2005, 2006 ~ 2010, 2011 ~ 2015 and 2016 ~ 2020, respectively.
Although the counties in the western sandy land of Yulin, including Yuyang, Dingbian, Hengshan, Jingbian and Shenmu, showed lower values of the total NEP, they still showed larger carbon sinks due to their larger areas than those in eastern Yulin, as shown in Figure 6. The carbon sink in these five counties in western Yulin was 59.23 Tg C, accounting for 59.6% of the total carbon sink of Yulin from 2000 to 2020, playing an important role in carbon sequestration. Therefore, it is very important for the counties in the western parts of Yulin to recovery the vegetation and ecosystem.
The change rate of NPP and the spatial–temporal trend with its significance in the region of Yulin from 2000 to 2020 are shown in Figure 7. As shown, the area with a decreasing trend of NPP only accounted for 1.6% of the total area of Yulin and was mainly scattered in the west of the region, of which the area with an extremely significant decreasing trend (slope < 0, p < 0.01) accounted for 1.1%. The area with an increasing trend of NPP accounted for 98.4% of the total area, of which the area with an extremely significant increasing trend (slope > 0, p < 0.01) accounted for 94.7%, and the area with a significant increasing trend (slope > 0, 0.01 < p < 0.05) accounted for 2.1% of the total area. As we can see from the change rate of NPP in Figure 7, the areas with a change rate of 5 ~ 15 g C·m−2·a−1 accounted for 57.0% of the total area and was mainly distributed in the western part of the region. The average change rate of NPP in the counties of Dingbian, Yuyang, Jingbian, Hengshan, Shenmu and Fugu in western Yulin was lower than 15 g C·m−2·a−1, and was more than 16 g C·m−2·a−1 in the counties of Mizhi, Qingjian, Wubao, Suide and Jiaxian in eastern Yulin, as shown in Table 1. The NPP in western Yulin was growing more slowly than that in the eastern parts.
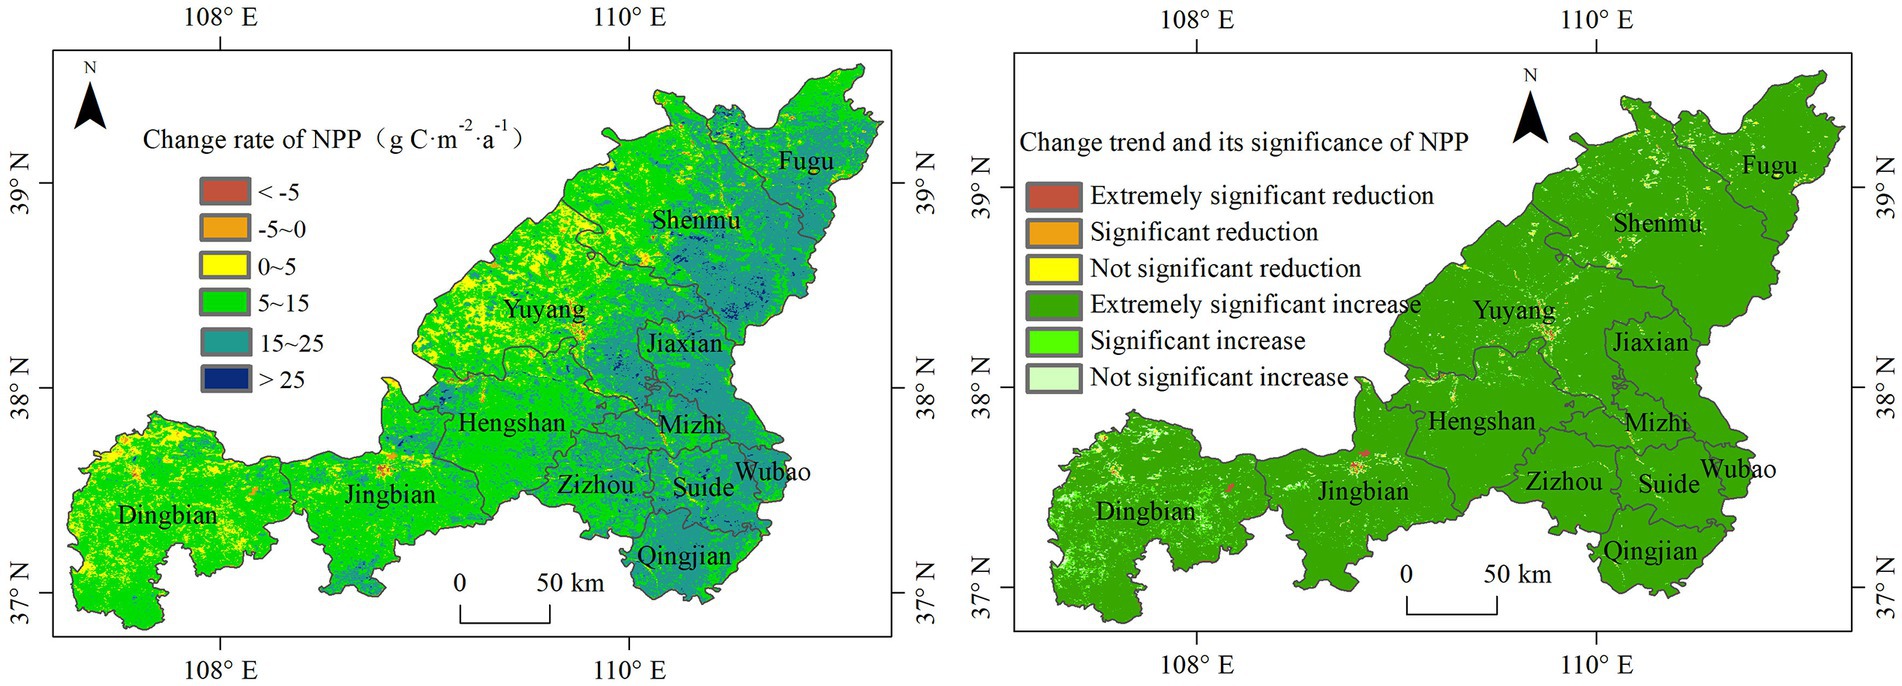
Figure 7. Change rate of NPP and spatial–temporal trend with its significance in the region of Yulin from 2000 to 2020.
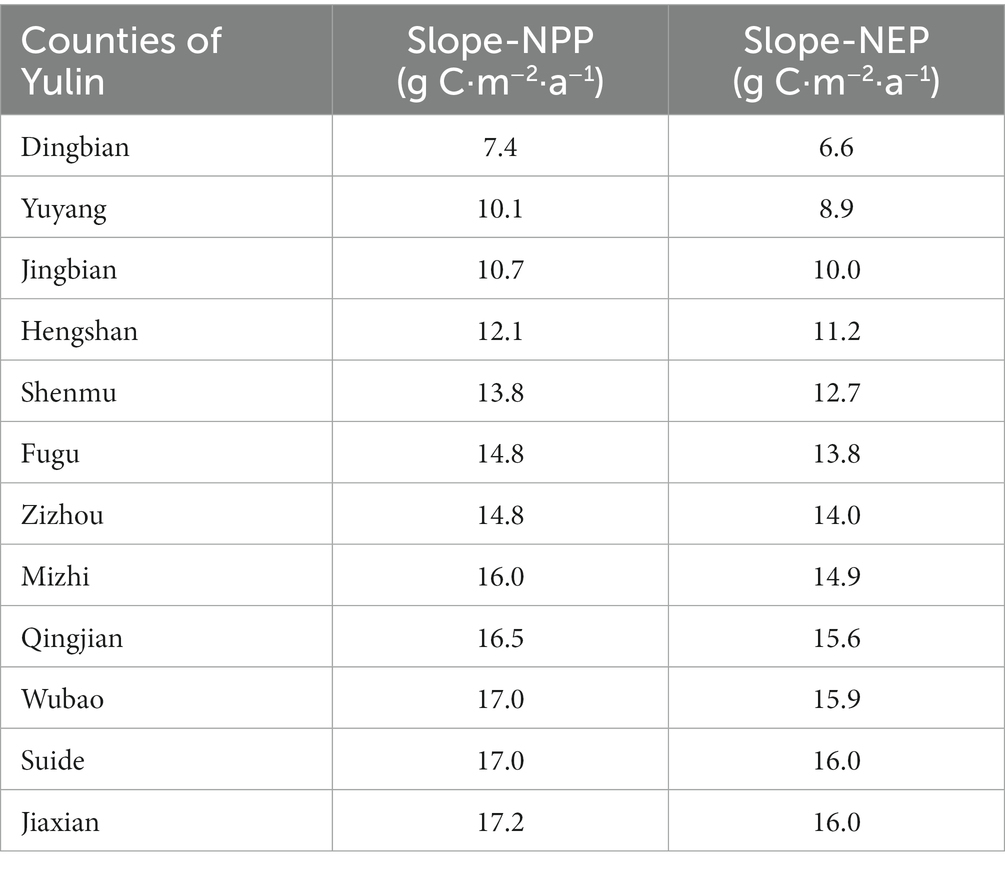
Table 1. Change rates of NPP and NEP in the counties of Yulin from 2000 to 2020.
The change rate of NEP and spatial–temporal change trend with its significance in the region of Yulin from 2000 to 2020 are shown in Figure 8. The area with a decreasing NEP only accounted for 1.94% of the total area, mainly scattered in the western sandy area of Yulin, and the area with an increasing trend of NEP accounted for 98.06% of the total area, indicating an increasing trend of carbon accumulation in most parts of Yulin. The decrease in NEP mainly showed no significance, and the related areas only accounted for 1.09% of the total area. The area with an extremely significant increasing trend of NEP accounted for 93.89% of the total area, and 2.08% showed a significant increasing trend.
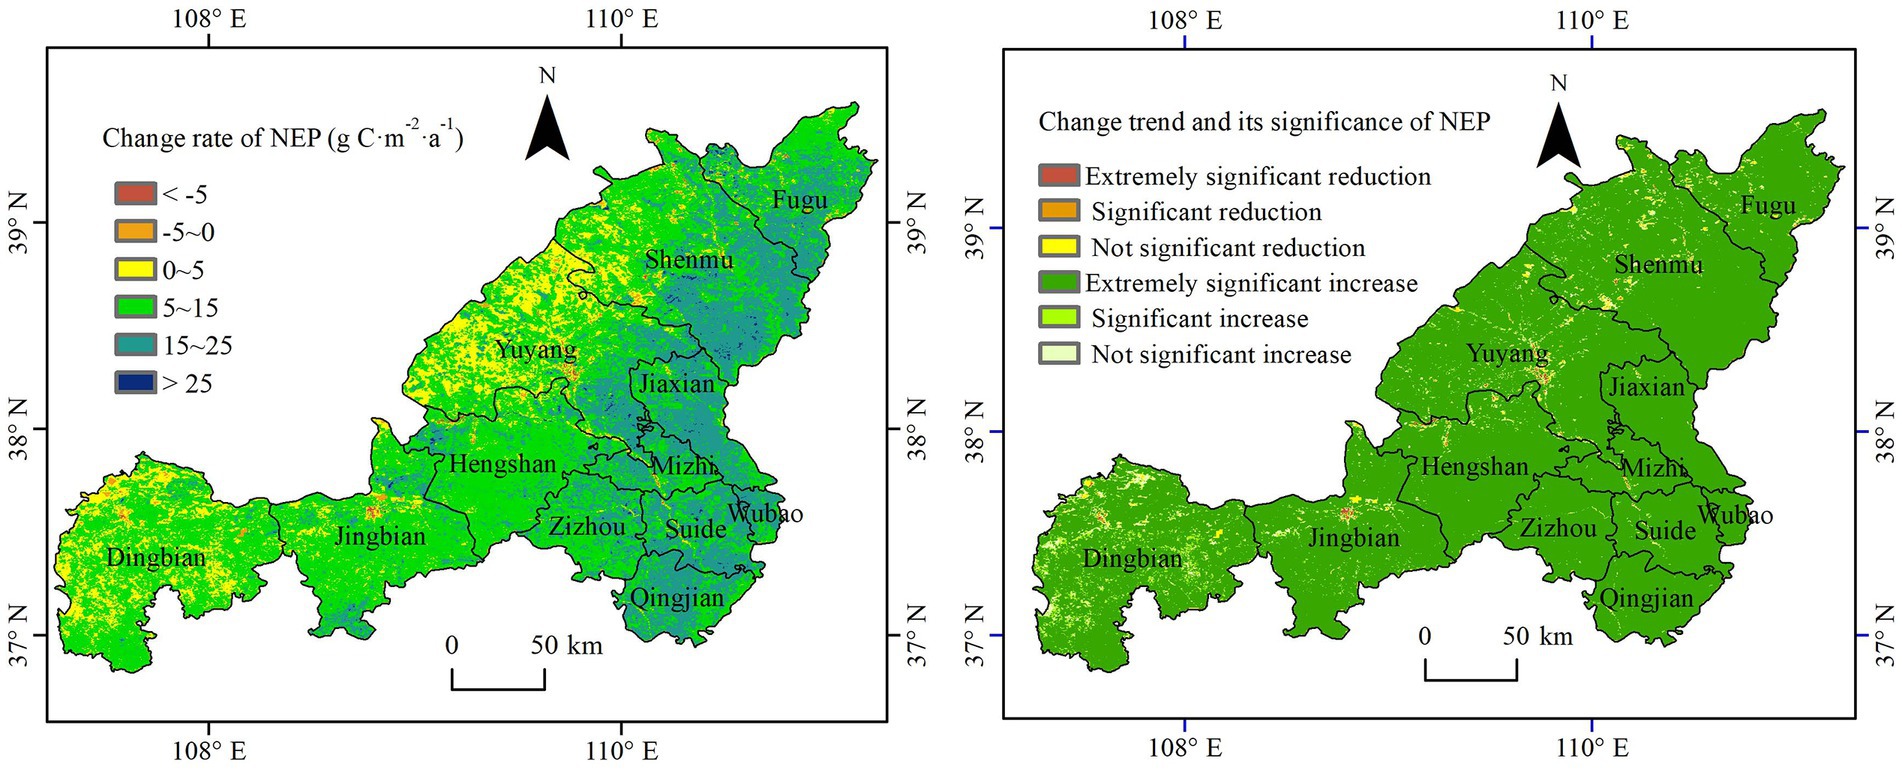
Figure 8. Change rate of NEP and spatial–temporal change trend with its significance in the region of Yulin from 2000 to 2020.
According to the spatial analysis from the change rate of NEP (Figure 8), the area with an NEP change rate of 0 ~ 5 g C·m−2·a−1 was mainly distributed in the sandy area in western Yulin, and the other areas in western Yulin had an NEP change rate of 5 ~ 15 g C·m−2·a−1, while the eastern part of Yulin had an NEP change rate of 15 ~ 25 g C·m−2·a−1. The counties in the western parts of Yulin, including Dingbian, Yuyang, Jingbian, Hengshan, Shenmu and Fugu, showed average change rates of NEP less than 14 g C·m−2·a−1, while the counties of Qingjian, Wubao, Suide and Jiaxian in eastern Yulin showed average values more than 15 g C·m−2·a−1, as shown in Table 1. As can be seen, the change rate of NEP increased from the west to the east of Yulin, indicating a lower growing rate of carbon accumulation in the western parts than that in the eastern parts of Yulin.
Interannual variations of temperature and precipitation in Yulin from 2000 to 2020 are shown in Figure 9. As seen, the temperature in the region of Yulin varied from 8.68 to 9.81°C from 2000 to 2020, and the average temperature was 9.33°C. The precipitation in the region of Yulin varied from 301.8 to 550.1 mm from 2000 to 2020, and the average value was 438.91 mm. Both the temperature and precipitation showed a very slow increasing trend. As can be seen, the climate presented a certain degree of humid trend in Yulin from 2000 to 2020, while the temperature showed a fluctuation change with no obvious increase.
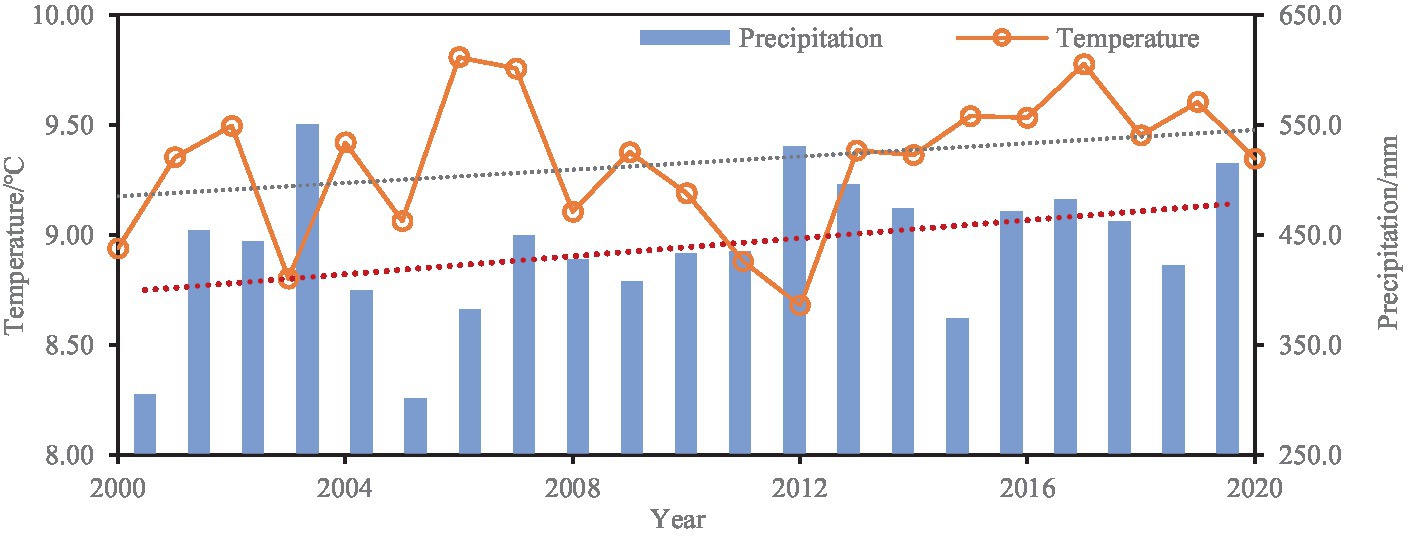
Figure 9. Interannual variations of temperature and precipitation in Yulin from 2000 to 2020.
The spatial distribution of the mean annual temperature and precipitation in the region of Yulin from 2000 to 2020 is shown in Figure 10. The spatial distribution of temperature and precipitation showed an increasing trend from the west to the east. The average annual temperature of Yulin ranges from 7.1 to 12.2°C, and the average annual precipitation is 318.6 ~ 529.2 mm. The western part of Yulin is sandy land and has a cold and dry climate, while the eastern part of the region has a warm and semihumid climate.
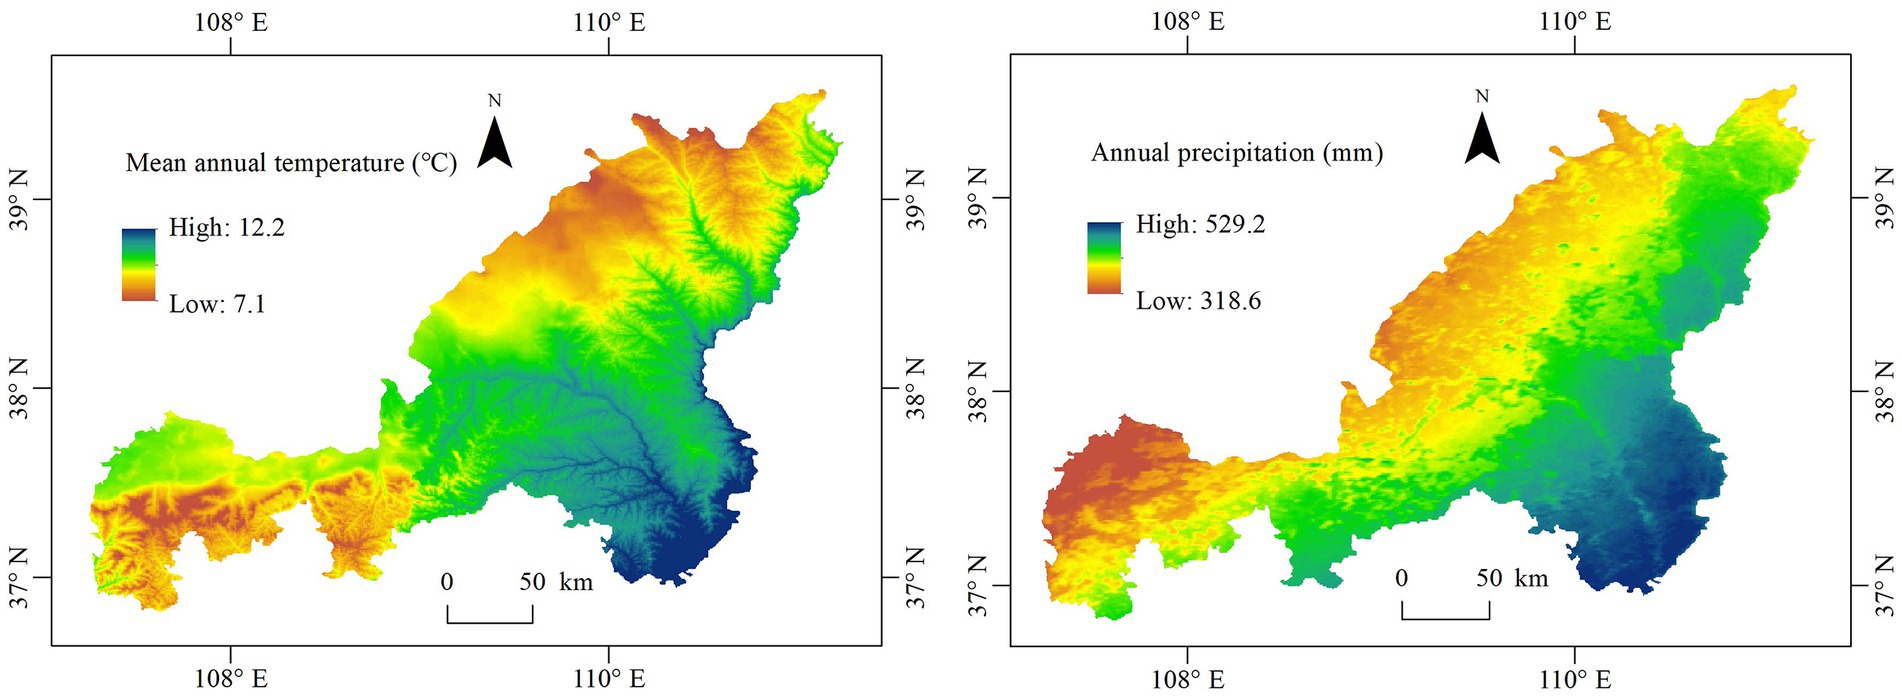
Figure 10. Spatial distribution of mean annual temperature and precipitation in the region of Yulin from 2000 to 2020.
The correlation between NPP and temperature (precipitation) in the region of Yulin is shown in Figure 11. According to the spatial statistics, the area with a negative correlation between NPP and temperature accounted for 15.8% of the total area of Yulin, of which the area with no significant correlation accounted for 14.7%, mainly distributed in Jingbian. The area with a positive correlation between NPP and temperature accounted for 84.3% of the total area, of which the area with no significant correlation accounted for 78.8%.
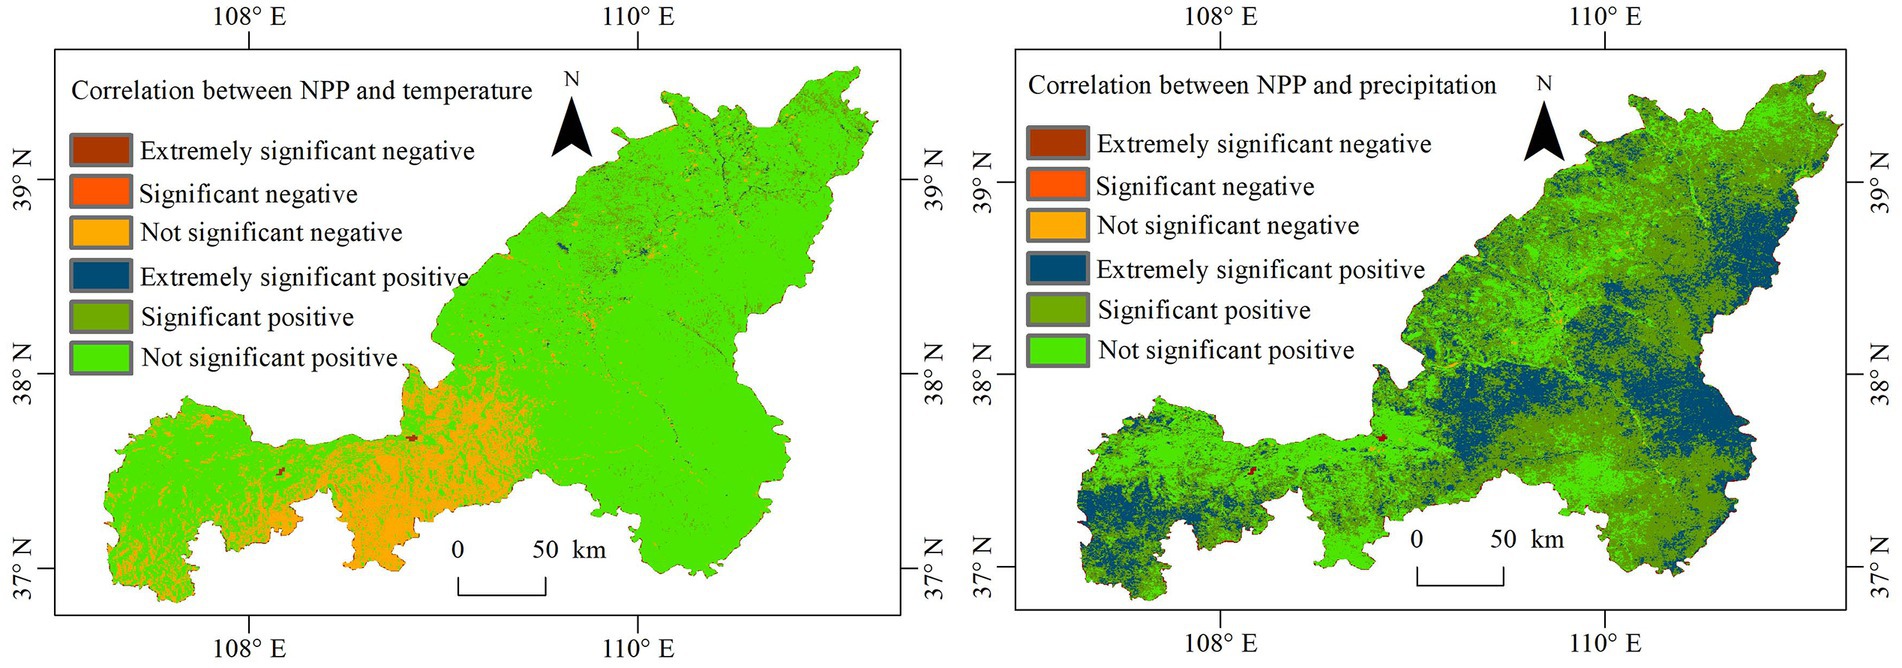
Figure 11. Correlation between NPP and temperature (precipitation) in the region of Yulin.
The area with a negative correlation between NPP and precipitation accounted for 1.3% of the total area and was distributed sporadically in the Mu Us Sandy Land in western Yulin. The area with a positive correlation accounted for 98.7% of the total area, of which the area with no significant correlation accounted for 23.3%, mainly distributed in the southwest of Yulin. The areas with an extremely significant positive correlation and significant positive correlation accounted for 24.3 and 51.0%, respectively. They were mainly distributed in the central and eastern parts of Yulin, as well as in the western part of the region.
As can be seen, the correlation between NPP and temperature was not significant in 93.5% of the area of the region, indicating that temperature was not a decisive factor for NPP change in most areas in the region of Yulin. However, NPP was mainly positively correlated with precipitation and showed an extremely significant and significant positive correlation in 75.3% of the areas of the region, indicating that NPP was more sensitive to precipitation changes than temperature changes.
The correlations between NEP and temperature and between NEP and precipitation in the region of Yulin are shown in Figure 12. The area with a positive correlation between NEP and temperature accounted for 82.20% of the total area of Yulin, of which the area with no significant positive correlation accounted for 74.71%, and the area with extremely significant and significant positive correlations accounted for 0.62 and 6.88%, respectively, mainly scattered in the north of Yulin. The area with a negative correlation between NEP and temperature accounted for 17.80% of the total area, of which the area with no significant negative correlation accounted for 17.25%. The correlation between NEP and temperature was not significant in 91.96% of the areas of Yulin, indicating that temperature was not a limiting factor for NEP change in most areas of Yulin. Temperature significantly promoted the increase in NEP in only 7.50% of the area of Yulin, which was mainly distributed in northern Yulin.

Figure 12. Correlation between NEP and temperature (precipitation) in the region of Yulin.
According to the correlation between NEP and precipitation, the area with a positive correlation between NEP and precipitation accounted for 95.17% of the total area, of which the area with no significant positive correlation accounted for 65.10%, mainly distributed in the western and southern parts of Yulin, including most areas in the western sandy land. Areas with extremely significant and significant positive correlations accounted for 2.05 and 28.02%, respectively, and were mainly distributed in the central and eastern parts of Yulin. The area with a negative correlation between NEP and precipitation accounted for 4.83% of the total area, of which the area with no significant negative correlation accounted for 3.57%, mainly scattered in the western sandy area of Yulin. Precipitation in 68.67% of the areas of Yulin had no significant influence on NEP change and was mainly distributed in the west and south of Yulin. Precipitation significantly promoted the increase in NEP in 30.07% of the area of Yulin, which was mainly distributed in the central and eastern parts of Yulin.
We compared the NPP and NEP estimations in this study with those in previous studies to evaluate the accuracy of NPP and NEP estimations indirectly, as it is difficult to obtain NPP and NEP values measured in the field and there are few related studies about the estimations of NPP and NEP in the Mu Us Sandy Land, especially in the region of Yulin. The NPP in our study was estimated based on the CASA model improved by Zhu et al. (2006, 2007). This improved CASA model was widely used in estimating NPP and proved to be effective (Dai et al., 2016; Wang et al., 2018). The estimated results in our study show that the NPP of Yulin from 2000 to 2020 was 100 ~ 500 g C·m−2·a−1, and the annual average value was 336.57 g C·m−2·a−1. Compared with the estimation by Shi et al. (2016) (100 ~ 300 g C·m−2 a−1 from 2003 to 2012 in Yulin) and Li (2019) (100 ~ 400 g C·m−2 a−1 from 2000 to 2016 in Yulin) using the CASA model, the simulated values in our study are slightly larger, as shown in Table 2. Wang and Li (2018) (100 ~ 200 g C·m−2·a−1 from 2000 to 2015 in Yulin) and Zhu et al. (2019) (an average value of 379.74 g C·m−2·a−1 in Shaanxi province during 2000 ~ 2014) analyzed the NPP using MOD17A3-NPP data, compared with which, the simulated value in our study is also slightly larger.
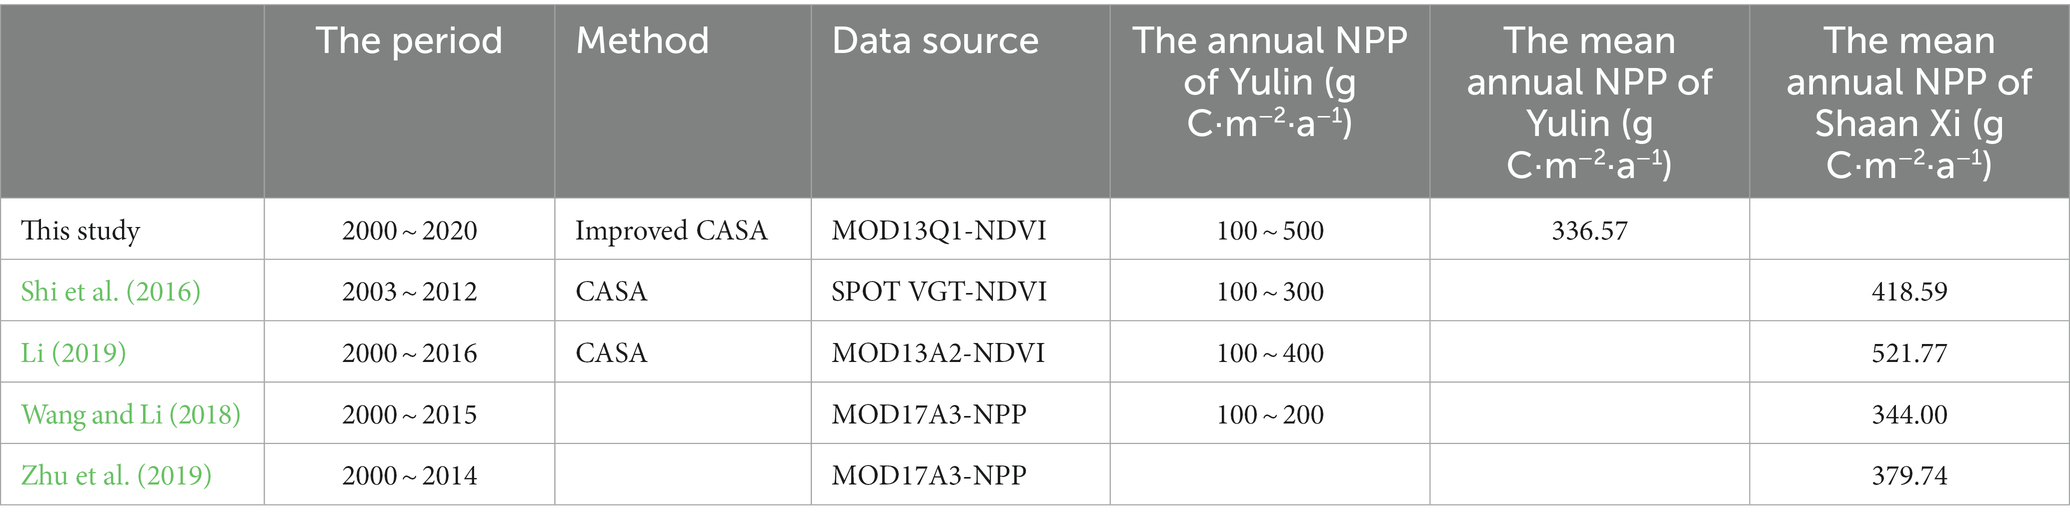
Table 2. Comparisons of simulated NPP values.
The annual NEP of Yulin in our study was −27.02 g C·m−2·a−1 in 2000 and 88.88 g C·m−2·a−1 in 2008, while on the Loess Plateau, it was −17.19 g C·m−2·a−1 in 2000 and 168.75 g C·m−2·a−1 in 2008 in a previous study (Feng et al., 2013), as shown in Table 3. The mean annual NEP in this study was 108.07 g C·m−2·a−1 with an increasing rate of 11.50 g C·m−2·a−1 from 2000 to 2020, while the value was 105.83 g C·m−2·a−1 with an increasing rate of 11.39 g C·m−2·a−1 from 2000 to 2008 in Zone grass, an area including the region of Yulin on the Loess Plateau in a previous study (Feng et al., 2013). As seen, the estimation of NEP in our study is close to that in the previous study, suggesting a reasonable and reliable result in this study. The differences in the estimated results by different models are mainly due to the differences in the research period, data sources, model parameters, data processing methods, etc., reflecting the uncertainties of the model methods in estimating NPP and NEP.
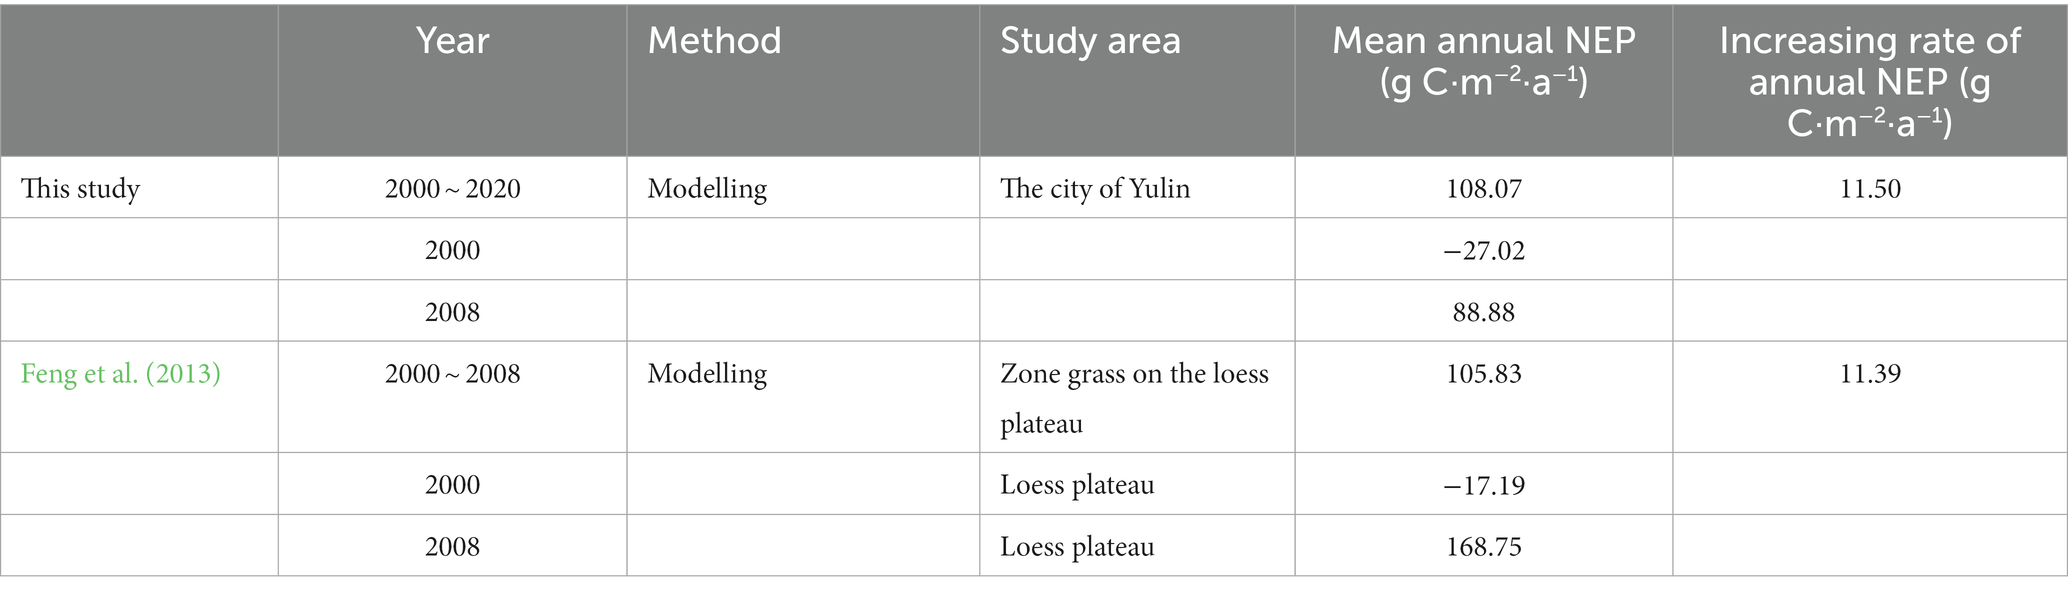
Table 3. Comparisons of simulated NEP values.
In this study, the annual NPP and NEP both showed an increasing trend from 2000 to 2020 in the region of Yulin, and the increasing rates were 12.39 and 11.39 g C·m−2·a−1, respectively. The annual NEP indicated a carbon source in 2000 and 2001 and a carbon sink from 2002 to 2020 in the study area, and the carbon sequestration was 99.44 Tg C during the period from 2000 to 2020. The area with an increasing trend of NPP accounted for 98.4% of the total area of Yulin, of which 96.8% showed a significant increasing trend. The area with an increasing NEP accounted for 98.06% of the total area, of which 95.97% was significantly increased, indicating a carbon accumulation in most parts of Yulin. The implementation of a series of ecological restoration projects since 1999, including the sand control project in the Mu Us Sandy land in western Yulin and the project of returning farmland to forest in the central and eastern parts of the region, has made the vegetation gradually recover and caused soil organic carbon to accumulate (Song et al., 2014; Wang X. et al., 2017). The restored vegetation positively increased the NPP and NEP and resulted in the accumulation of carbon during the desertification reversal process in Yulin. A related study showed that a total of 96.1 Tg C of additional carbon was sequestered during the period from 2000 to 2008 on the Loess Plateau since China’s Grain to Green Program (a national ecological restoration program) was launched in 1999 (Feng et al., 2013). Another estimation showed that the total annual carbon sink was 132 Tg C per year between 2001 and 2010 in the project regions where six key national ecological restoration projects have been implemented, and the results demonstrate that these restoration projects have substantially contributed to CO2 mitigation in China (Lu et al., 2018).
The mean annual NPP and total NEP both increased from the west to the east in the region of Yulin. As shown in Figure 10, the annual precipitation increased from the west to the east of Yulin and ranged between 318.6 and 529.2 mm, indicating a semiarid climate in the west and a semihumid climate in the east. The spatial distributions of NPP and NEP were consistent with that of annual precipitation, indicating that precipitation has effects on variations in NPP and NEP.
Climate changes, especially temperature and precipitation, are the main factors influencing terrestrial ecosystems (Field et al., 2007; Nolan et al., 2018). Our results showed that the correlation between temperature and NPP was not significant in 93.5% of the areas of Yulin, while NPP was significantly positively correlated with precipitation (p < 0.05) in 75.3% of the areas of the region, implying that temperature had little effect on NPP change, while precipitation was beneficial to the increase in NPP in most areas of Yulin. Most likely because soil water is a limiting factor for vegetation growth in arid and semiarid areas due to the low precipitation (Liu et al., 2016; Xu and Wang, 2016), meanwhile, a higher temperature may lead to stronger evaporation, resulting in a more serious shortage of water resources, leading to the degradation of vegetation (Goyal, 2004; Yu et al., 2019; Shayanmehr et al., 2022), which is not conducive to carbon accumulation. Many previous studies have reported similar conclusions about correlations between climate change and NPP. For instance, Wang et al. (2018) found that there is a weak correlation between NPP and temperature, while NPP is positively correlated with precipitation in northern and central China from 2001 to 2013. Precipitation played a decisive role in vegetation growth in arid and semiarid regions, while increasing temperature inhibited vegetation growth in these regions (Jiang et al., 2020; Ge et al., 2021).
The correlation between NEP and temperature was not significant in 91.96% of the areas of Yulin, while precipitation in 68.67% of the areas of Yulin had no significant influence on NEP change in the western and southern parts of the region but significantly promoted the increase in NEP in 30.07% of the areas of Yulin in the central and eastern parts of the region. Generally, the effect of temperature on NPP was more obvious in cold regions than in warm regions (Sun and Du, 2017). A higher temperature can promote the growth of vegetation and increase the carbon accumulation in a cold region, but can limit the plant growth and carbon accumulation in warm and dry regions due to higher evaporation and respiration. Zhou et al. (2019) also found that there was no significant relationship between NEP and temperature, while NEP and precipitation were positively correlated in grassland ecosystems in China from 1979 to 2008. Tang et al. (2017) found that the biogeographical patterns of each carbon pool in forests, shrublands, and grasslands coincide with the distribution patterns of temperature and precipitation, indicating that climate plays a critical role in shaping the distribution of carbon stocks. However, Feng et al. (2013) found that climate change had no noticeable effects on the increase in NPP and NEP over the Loess Plateau, while the implemented ecological restoration program probably contributed to these increases. These differences were mostly due to the varied effects of climate change on NPP and NEP in different climate regions.
The NPP and NEP in the region of Yulin were more significantly correlated with precipitation than with temperature; thus, it is important to improve soil water conservation to promote the growth of vegetation and carbon accumulation. Desertification leads to the loss of carbon from terrestrial ecosystems. In contrast, the implemented ecological restoration programs would significantly facilitate carbon accumulation and improve the function of the carbon sink (Lal, 2001). Therefore, it is of utmost significance to protect terrestrial ecosystems from degradation and formulate corresponding ecological restoration projects to control desertification, which would be helpful for soil water conservation and could effectively increase carbon storage in desert ecosystems.
We should note that there are still some limitations in our study. First, the remote sensing images used in this study may be affected by atmosphere, cloud and other factors, thus affect the results of the study (Shen et al., 2021, 2022; Ma et al., 2022). The spatial resolution of the meteorological data in this study is not high enough, which may not reflect the real and accurate situation in a certain area, thus may lead to some deviations for the results. Secondly, the estimated NPP and NEP in our study were compared with those in other studies indirectly, due to the lack of field observed data, so the accuracy of the estimations in our study still has some uncertainties. Therefore, there are many limitations in the estimations of carbon sources and sinks. Thirdly, our study only analyzed the effects of temperature and precipitation on NPP and NEP. There are other climate factors including solar radiation, which may affect the variations of NPP and NEP. Human activities have significant impacts on vegetation growth and carbon cycle. Although we discussed the effects of ecological restoration programs on carbon accumulation in the introduction and discussion sections, we did not analyze the quantified contribution of human activities to the variations of carbon emission or accumulation. Further studies will be concentrated on more accurate and efficient methods to estimate the carbon sources and sinks. And we will take human activities into consideration when analyzing the influencing factors of carbon sources/sink changes.
The region of Yulin has experienced a continuous increase in carbon storage during the desertification reversal process. The annual NPP and NEP both showed an obvious increase in most areas of Yulin, and the spatial distributions showed a pattern of lower values in the west and higher values in the east from 2000 to 2020. The carbon sources decreased, whereas the carbon sinks showed an increasing trend with a rate of 0.50 Tg C·a−1 from 2000 to 2020. Although the counties in the western sandy areas of Yulin showed lower values of the total NEP, they still showed larger carbon sinks due to their larger areas than those in eastern Yulin. Therefore, it is very important for the counties in the western parts of Yulin to recover the vegetation and restore the ecosystem. There was a very weak relationship between NPP (NEP) and temperature in most areas of Yulin, while precipitation had a positive impact on the NPP and NEP change. Our results highlight that it is of utmost important to conserve soil water and promote the recovery of vegetation during the desertification reversal process, which could effectively increase carbon storage in desert ecosystems.
The datasets presented in this study can be found in online repositories. The names of the repository/repositories and accession number(s) can be found in the article/supplementary material.
XF: Conceptualization, Data curation, Funding acquisition, Methodology, Software, Writing – original draft. QF: Conceptualization, Methodology, Software, Visualization, Writing – review & editing. JQ: Resources, Supervision, Writing – review & editing. XD: Data curation, Investigation, Writing – review & editing. ZN: Data curation, Funding acquisition, Project administration, Writing – review & editing.
The author(s) declare financial support was received for the research, authorship, and/or publication of this article. This study was funded by Shaan Xi Provincial Natural Science Basic Research Program (grant no, 2022JQ-176), National Natural Science Foundation of China (grant nos, 42201080, U2243210, and 32001133), and Qin Chuangyuan Introduced High-level Innovation and Entrepreneurship Talent Project (grant no, QCYRCXM-2022-299).
The authors declare that the research was conducted in the absence of any commercial or financial relationships that could be construed as a potential conflict of interest.
All claims expressed in this article are solely those of the authors and do not necessarily represent those of their affiliated organizations, or those of the publisher, the editors and the reviewers. Any product that may be evaluated in this article, or claim that may be made by its manufacturer, is not guaranteed or endorsed by the publisher.
Catovsky, S., Bradford, M. A., and Hector, A. (2002). Biodiversity and ecosystem productivity: implications for carbon storage. Oikos 97, 443–448. doi: 10.1034/j.1600-0706.2002.970315.x
Chuai, X. W., Qi, X. X., Zhang, X. Y., Li, J., Yuan, Y., Guo, X., et al. (2018). Land degradation monitoring using terrestrial ecosystem carbon sinks/sources and their response to climate change in China. Land Degrad. Dev. 29, 3489–3502. doi: 10.1002/ldr.3117
Cox, P. M., Betts, R. A., Jones, C. D., Spall, S. A., and Totterdell, I. J. (2000). Acceleration of global warming due to carbon-cycle feedbacks in a coupled climate model. Nature 408, 184–187. doi: 10.1038/35041539
Cramer, W., Kicklighter, D. W., Bondeau, A., Iii, B. M., Churkina, G., Nemry, B., et al. (1999). Comparing global models of terrestrial net primary productivity (NPP): overview and key results. Glob. Chang. Biol. 5, 1–15. doi: 10.1046/j.1365-2486.1999.00009.x
Crowther, T. W., Todd-Brown, K. E., Rowe, C. W., Wieder, W. R., Carey, J. C., Machmuller, M. B., et al. (2016). Quantifying global soil carbon losses in response to warming. Nature 540, 104–108. doi: 10.1038/nature20150
Dai, E., Huang, Y., Wu, Z., and Zhao, D. (2016). Analysis of spatio-temporal features of a carbon source/sink and its relationship to climatic factors in the Inner Mongolia grassland ecosystem. J. Geogr. Sci. 26, 297–312. doi: 10.1007/s11442-016-1269-0
Du, L., Zeng, Y., Ma, L., Qiao, C., Wu, H., Su, Z., et al. (2021). Effects of anthropogenic revegetation on the water and carbon cycles of a desert steppe ecosystem. Agric. For. Meteorol. 300:108339. doi: 10.1016/j.agrformet.2021.108339
Fang, J. Y., Guo, Z., Hu, H., Kato, T., Muraoka, H., and Son, Y. (2014). Forest biomass carbon sinks in East Asia, with special reference to the relative contributions of forest expansion and forest growth. Glob. Chang. Biol. 20, 2019–2030. doi: 10.1111/gcb.12512
Fang, J. Y., Yu, G. R., Liu, L. L., Hu, S., and Chapin, F. S. (2018). Climate change, human impacts, and carbon sequestration in China. Proc. Natl. Acad. Sci. 115, 4015–4020. doi: 10.1073/pnas.1700304115
Feng, X., Fu, B., Lu, N., Zeng, Y., and Wu, B. (2013). How ecological restoration alters ecosystem services: an analysis of carbon sequestration in China's loess plateau. Sci. Rep. 3, 1–5. doi: 10.1038/srep02846
Feng, X., Qu, J. J., Ding, X. H., Tian, Q., and Fan, Q. B. (2024). Temporal and spatial pattern of NPP in Yulin and its influencing factors during the desertification reversal. J. Desert Res. 1, 1–11. doi: 10.7522/j.issn.1000-694X.2023.00066
Field, C. B., Lobell, D. B., Peters, H. A., and Chiariello, N. R. (2007). Feedbacks of terrestrial ecosystems to climate change. Annu. Rev. Environ. Resour. 32, 1–29. doi: 10.1146/annurev.energy.32.053006.141119
Ge, W., Deng, L., Wang, F., and Han, J. (2021). Quantifying the contributions of human activities and climate change to vegetation net primary productivity dynamics in China from 2001 to 2016. Sci. Total Environ. 773:145648. doi: 10.1016/j.scitotenv.2021.145648
Goyal, R. K. (2004). Sensitivity of evapotranspiration to global warming: a case study of arid zone of Rajasthan (India). Agric. Water Manag. 69, 1–11. doi: 10.1016/j.agwat.2004.03.014
Han, X., Jia, G., Yang, G., Wang, N., Liu, F., Chen, H., et al. (2020). Spatiotemporal dynamic evolution and driving factors of desertification in the mu us Sandy land in 30 years. Sci. Rep. 10:21734. doi: 10.1038/s41598-020-78665-9
Hao, C. Y., and Wu, S. H. (2006). The effects of land-use types and conversions on desertification in mu us Sandy land of China. J. Geogr. Sci. 16, 57–68. doi: 10.1007/s11442-006-0106-2
Houghton, R. A., and Hackler, J. L. (2003). Sources and sinks of carbon from land-use change in China. Glob. Biogeochem. Cycles 17:1034. doi: 10.1029/2002GB001970
Jiang, H., Xu, X., Guan, M., Wang, L., Huang, Y., and Jiang, Y. (2020). Determining the contributions of climate change and human activities to vegetation dynamics in agro-pastural transitional zone of northern China from 2000 to 2015. Sci. Total Environ. 718:134871. doi: 10.1016/j.scitotenv.2019.134871
Lal, R. (2001). Potential of desertification control to sequester carbon and mitigate the greenhouse effect. Clim. Chang. 51, 35–72. doi: 10.1023/A:1017529816140
Lal, R. (2019). Carbon cycling in global drylands. Curr. Clim. Change Rep. 5, 221–232. doi: 10.1007/s40641-019-00132-z
Li, L. Effects of Climate Change and Human Activities on NPP Changes in Northwest China. Shaanxi: Shaanxi Normal University, (2019).
Lin, M., Hou, L., Qi, Z., and Wan, L. (2022). Impacts of climate change and human activities on vegetation NDVI in China’s mu us Sandy land during 2000–2019. Ecol. Indic. 142:109164. doi: 10.1016/j.ecolind.2022.109164
Liu, R., Cieraad, E., Li, Y., and Ma, J. (2016). Precipitation pattern determines the inter-annual variation of herbaceous layer and carbon fluxes in a phreatophyte-dominated desert ecosystem. Ecosystems 19, 601–614. doi: 10.1007/s10021-015-9954-x
Liu, M., and Tian, H. (2010). China's land cover and land use change from 1700 to 2005: estimations from high-resolution satellite data and historical archives. Glob. Biogeochem. Cycles 24:GB3003. doi: 10.1029/2009GB003687
Liu, X., Wang, S., Zhuang, Q., Jin, X., Bian, Z., Zhou, M., et al. (2022). A review on carbon source and sink in arable land ecosystems. Land 11:580. doi: 10.3390/land11040580
Lu, F., Hu, H., Sun, W., Zhu, J., Liu, G., Zhou, W., et al. (2018). Effects of national ecological restoration projects on carbon sequestration in China from 2001 to 2010. Proc. Natl. Acad. Sci. 115, 4039–4044. doi: 10.1073/pnas.1700294115
Luo, Y. Q., and Xia, J. Y. (2020). A dynamic disequilibrium hypothesis for terrestrial carbon cycle. Biodivers. Sci. 28, 1405–1416. doi: 10.17520/biods.2020262
Ma, R., Shen, X., Zhang, J., Xia, C., Liu, Y., Wu, L., et al. (2022). Variation of vegetation autumn phenology and its climatic drivers in temperate grasslands of China. Int. J. Appl. Earth Obs. Geoinf. 114:103064. doi: 10.1016/j.jag.2022.103064
Nolan, C., Overpeck, J. T., Allen, J. R., Anderson, P. M., Betancourt, J. L., Binney, H. A., et al. (2018). Past and future global transformation of terrestrial ecosystems under climate change. Science 361, 920–923. doi: 10.1126/science.aan5360
Noy-Meir, I. (1973). Desert ecosystems: environment and producers. Annu. Rev. Ecol. Syst. 4, 25–51. doi: 10.1146/annurev.es.04.110173.000325
Ouyang, Z., Zheng, H., Xiao, Y., Polasky, S., Liu, J., Xu, W., et al. (2016). Improvements in ecosystem services from investments in natural capital. Science 352, 1455–1459. doi: 10.1126/science.aaf2295
Pan, Y., Birdsey, R. A., Fang, J., Houghton, R., Kauppi, P. E., Kurz, W. A., et al. (2011). A large and persistent carbon sink in the world’s forests. Science 333, 988–993. doi: 10.1126/science.1201609
Piao, S. L., Fang, J. Y., Ciais, P., Peylin, P., Huang, Y., Sitch, S., et al. (2009). The carbon balance of terrestrial ecosystems in China. Nature 458, 1009–1013. doi: 10.1038/nature07944
Piao, S. L., Fang, J. Y., and Guo, Q. H. (2001). Application of CASA model to the estimation of Chinese terrestrial net primary productivity. Chin. J. Plant Ecol. 25:603.
Piao, S. L., Zhang, X. P., Chen, A. P., Liu, Q., Lian, X., Wang, X., et al. (2019). The impacts of climate extremes on the terrestrial carbon cycle: a review. China Earth Sci 62, 1551–1563. doi: 10.1007/s11430-018-9363-5
Qiu, B. W., Chen, G., Tang, Z. H., Lu, D., Wang, Z., and Chen, C. (2017). Assessing the three-north shelter forest program in China by a novel framework for characterizing vegetation changes. ISPRS J. Photogramm. Remote Sens. 133, 75–88. doi: 10.1016/j.isprsjprs.2017.10.003
Ruimy, A., Kergoat, L., and Bondeau, A., ThE. Participants OF. ThE. Potsdam NpP. Model Intercomparison (1999). Comparing global models of terrestrial net primary productivity (NPP): analysis of differences in light absorption and light-use efficiency. Glob. Chang. Biol. 5, 56–64. doi: 10.1046/j.1365-2486.1999.00007.x
Schlesinger, W. H., Belnap, J., and Marion, G. (2009). On carbon sequestration in desert ecosystems. Glob. Chang. Biol. 15, 1488–1490. doi: 10.1111/j.1365-2486.2008.01763.x
Shao, J. J., Zhou, X. H., Luo, Y. Q., Zhang, G., Yan, W., Li, J., et al. (2016). Uncertainty analysis of terrestrial net primary productivity and net biome productivity in China during 1901–2005. J. Geophys. Res. Biogeo. 121, 1372–1393. doi: 10.1002/2015JG003062
Shayanmehr, S., Porhajašová, J. I., Babošová, M., Sabouhi Sabouni, M., Mohammadi, H., Rastegari Henneberry, S., et al. (2022). The impacts of climate change on water resources and crop production in an arid region. Agriculture 12:1056. doi: 10.3390/agriculture12071056
Shen, X., Liu, B., Henderson, M., Wang, L., Jiang, M., and Lu, X. (2022). Vegetation greening, extended growing seasons, and temperature feedbacks in warming temperate grasslands of China. J. Clim. 35, 5103–5117. doi: 10.1175/JCLI-D-21-0325.1
Shen, X., Liu, B., Jiang, M., Wang, Y., Wang, L., Zhang, J., et al. (2021). Spatiotemporal change of marsh vegetation and its response to climate change in China from 2000 to 2019. Journal of geophysical research. Biogeosciences 126:e2020JG006154. doi: 10.1029/2020JG006154
Shi, Z. H., Liu, M. Y., Wu, J. L., Chang, Q. R., Xie, B. N., and Wen, Y. (2016). Spatial—temporal analysis of vegetation net primary productivity in Shaanxi Province based on CASA model. Bull. Soil Water Conserv. 36, 206–211. doi: 10.13961/J.cnki.Stbctb.2016.01.037
Song, X., Peng, C., Zhou, G., Jiang, H., and Wang, W. (2014). Chinese grain for green program led to highly increased soil organic carbon levels: a meta-analysis. Sci. Rep. 4, 1–7. doi: 10.1038/srep04460
Sun, J., and Du, W. (2017). Effects of precipitation and temperature on net primary productivity and precipitation use efficiency across China’s grasslands. GISci. Remote Sens. 54, 881–897. doi: 10.1080/15481603.2017.1351147
Tang, Z., Ma, J., Peng, H., Wang, S., and Wei, J. (2017). Spatiotemporal changes of vegetation and their responses to temperature and precipitation in upper Shiyang river basin. Adv. Space Res. 60, 969–979. doi: 10.1016/j.asr.2017.05.033
Tang, X., Zhao, X., Bai, Y., Tang, Z., Wang, W., Zhao, Y., et al. (2018). Carbon pools in China’s terrestrial ecosystems: new estimates based on an intensive field survey. Proc. Natl. Acad. Sci. 115, 4021–4026. doi: 10.1073/pnas.1700291115
Tong, X., Brandt, M., Yue, Y., Horion, S., Wang, K., Keersmaecker, W. D., et al. (2018). Increased vegetation growth and carbon stock in China karst via ecological engineering. Nat. Sustain. 1, 44–50. doi: 10.1038/s41893-017-0004-x
Verlinden, M. S., Broeckx, L. S., Zona, D., Berhongaray, G., de Groote, T., Camino Serrano, M., et al. (2013). Net ecosystem production and carbon balance of an SRC poplar plantation during its first rotation. Biomass Bioenergy 56, 412–422. doi: 10.1016/j.biombioe.2013.05.033
Wang, T. (2014). Aeolian desertification and its control in northern China. Int. Soil Water Conserv. Res. 2, 34–41. doi: 10.1016/S2095-6339(15)30056-3
Wang, X., Du, Y., Wang, Z., and Zhang, Y. (2021). Dynamic changes of the mu us Sandy land and relevant causes. Pol. J. Environ. Stud. 30, 3815–3827. doi: 10.15244/pjoes/130973
Wang, B., Gao, P., Niu, X., and Sun, J. (2017). Policy-driven China’s grain to green program: implications for ecosystem services. Ecosyst. Serv. 27, 38–47. doi: 10.1016/j.ecoser.2017.07.014
Wang, Z., and Li, D. K. (2018). Spatial-temporal distribution of vegetation net primary productivity and its driving factors from 2000 to 2015 in Shaanxi in China. Chin. J. Appl. Ecol. 29, 1876–1884. doi: 10.13287/j.1001-9332.201806.029
Wang, F., Pan, X., Wang, D., Shen, C., and Lu, Q. (2013). Combating desertification in China: past, present and future. Land Use Policy 31, 311–313. doi: 10.1016/j.landusepol.2012.07.010
Wang, X., Tan, K., Chen, B., and Du, P. (2017). Assessing the spatiotemporal variation and impact factors of net primary productivity in China. Sci. Rep. 7:44415. doi: 10.1038/srep44415
Wang, Q., Zeng, J., Leng, S., Fan, B., Tang, J., Jiang, C., et al. (2018). The effects of air temperature and precipitation on the net primary productivity in China during the early 21st century. Front. Earth Sci. 12, 818–833. doi: 10.1007/s11707-018-0697-9
Wang, Q., Zheng, H., Zhu, X., and Yu, G. (2015). Primary estimation of Chinese terrestrial carbon sequestration during 2001–2010. Sci. Bull. 60, 577–590. doi: 10.1007/s11434-015-0736-9
Wei, G., Zhang, C., Li, Q., Wang, H., Wang, R., Zhang, Y., et al. (2023). An evaluation of topsoil carbon storage in Chinese deserts. Sci. Total Environ. 872:162284. doi: 10.1016/j.scitotenv.2023.162284
Xu, H. J., and Wang, X. P. (2016). Effects of altered precipitation regimes on plant productivity in the arid region of northern China. Eco. Inform. 31, 137–146. doi: 10.1016/j.ecoinf.2015.12.003
Yang, P., Wang, N. A., Zhao, L., Su, B., Niu, Z., and Zhao, H. (2022). Responses of grassland ecosystem carbon fluxes to precipitation and their environmental factors in the Badain Jaran Desert. Environ. Sci. Pollut. Res. 29, 75805–75821. doi: 10.1007/s11356-022-21098-w
Yu, Y., Pi, Y., Yu, X., Ta, Z., Sun, L., Disse, M., et al. (2019). Climate change, water resources and sustainable development in the arid and semi-arid lands of Central Asia in the past 30 years. J. Arid. Land 11, 1–14. doi: 10.1007/s40333-018-0073-3
Zhang, Z., and Huisingh, D. (2018). Combating desertification in China: monitoring, control, management and revegetation. J. Clean. Prod. 182, 765–775. doi: 10.1016/j.jclepro.2018.01.233
Zhou, W., Huang, L., Yang, H., Ju, W., and Yue, T. (2019). Inter-annual variation in grassland net ecosystem productivity and its coupling relation to climatic factors in China. Environ. Geochem. Health 41, 1583–1597. doi: 10.1007/s10653-018-0236-3
Zhu, Y. Y., Han, L., Zhao, Y. H., Ao, Y., Li, J., Xu, K., et al. (2019). Simulation and spatio-temporal pattern of vegetation NPP in Northwest China. Chin. J. Ecol. 38, 1861–1871.
Zhu, W. Q., Pan, Y. Z., He, H., Yu, D., and Hu, H. (2006). Simulation of maximum light use efficiency for some typical vegetation types in China. Chin. Sci. Bull. 51, 457–463. doi: 10.1007/s11434-006-0457-1
Keywords: carbon sources/sinks, climate change, desertification reversal, ecological restoration, CASA
Citation: Feng X, Fan Q, Qu J, Ding X and Niu Z (2023) Characteristics of carbon sources and sinks and their relationships with climate factors during the desertification reversal process in Yulin, China. Front. For. Glob. Change. 6:1288449. doi: 10.3389/ffgc.2023.1288449
Edited by:
Yan Li, Nanjing Forestry University, ChinaReviewed by:
Xiangjin Shen, Chinese Academy of Sciences (CAS), ChinaCopyright © 2023 Feng, Fan, Qu, Ding and Niu. This is an open-access article distributed under the terms of the Creative Commons Attribution License (CC BY). The use, distribution or reproduction in other forums is permitted, provided the original author(s) and the copyright owner(s) are credited and that the original publication in this journal is cited, in accordance with accepted academic practice. No use, distribution or reproduction is permitted which does not comply with these terms.
*Correspondence: Xiao Feng, ZmVuZ194aWFvaGFwcHlAMTYzLmNvbQ==; Qingbin Fan, ZmFucWluZ2JpbkBsemIuYWMuY24=
Disclaimer: All claims expressed in this article are solely those of the authors and do not necessarily represent those of their affiliated organizations, or those of the publisher, the editors and the reviewers. Any product that may be evaluated in this article or claim that may be made by its manufacturer is not guaranteed or endorsed by the publisher.
Research integrity at Frontiers
Learn more about the work of our research integrity team to safeguard the quality of each article we publish.