 Petr Prochazka1
 Josef Abrham2*
 Jaroslav Cerveny1Lukas Kobera1
 Petra Sanova2Daniel Benes1Julia-Maria Fink1Eliska Jiraskova1Simona Primasova1Jana Soukupova2
 Lubos Smutka2
- 1Department of Economics, Czech University of Life Science, Prague, Czechia
- 2Department of Trade and Finance, Czech University of Life Science, Prague, Czechia
Introduction: This paper investigates the links between deforestation and key economic, social, environmental, and geographical variables. We focus on per capita GDP, total forest cover, and the population across a diverse sample of countries from five continents for the last three decades.
Methods: This study utilizes a regression model using panel data to show the impact of key economic, and social variables on deforestation. Also, set of dummy variables is introduced in the paper. To enable the investigation, we use a set of dummies to capture their influence. The random effect specifications are used in this investigation. The research focuses on a period ranging from 1990 to 2020.
Results: Results show how different socio-economic variables influence deforestation. For example, disruptive events like the COVID-19 pandemic and the financial crisis had a negative effect on forest area development across all models. GDP per capita has different impact depending on the size of a country. Former colonies seem to have more deforestation.
Conclusions: The global environmental challenges posed by human activities and their impact on the state of forest have become increasingly evident. It is necessary to undertake policy and governance reforms to establish a solid legal framework, strengthen enforcement mechanisms, and foster transparency and accountability. The promotion of sustainable agriculture and agroforestry practices can substantially alleviate pressure on forests. Furthermore, it is necessary to mitigate disruptive events like pandemics by establishing specific strategies and creating contingency plans.
1. Introduction
Deforestation is raising concerns because of its negative consequences for example climate change, decrease in biodiversity, soil degradation, reduction of timber supply, floods, and siltation. Therefore it is a complex process that has impacts on both the environment and the economy (Van Khuc et al., 2018). Any change in forest cover has both positive and negative effects on the local ecosystem and on the global environment (Silva Junior et al., 2021). Destroying and degrading natural ecosystems lead to a decline in global biodiversity (Angelsen and Kaimowitz, 1999). The problem of (a)deforestation is an example of a global externality (Lawrence et al., 2022). Current research claims that it is needed to identify the specific economic factors that drive deforestation and develop effective policies and tools to mitigate its impacts at the global and national level (Bhatia and Cumming, 2020; Ahmed et al., 2023).
Figures 1, 2 offer a depiction of deforestation and afforestation trends. Through a comprehensive examination of global land cover changes for the years 1990 and 2020, the analysis brings to light the diverse and intricate shifts in forest cover. This exploration unveils distinct spatial and temporal fluctuations across various geographical regions. The Figures 1, 2 effectively underscore the changing rates at which these transformations have emerged, highlighting the cases of rapid deforestation in certain regions juxtaposed with a rejuvenation of forested areas in others. This paper’s primary aim is to identify the underlying drivers that give rise to these contrasting trends.
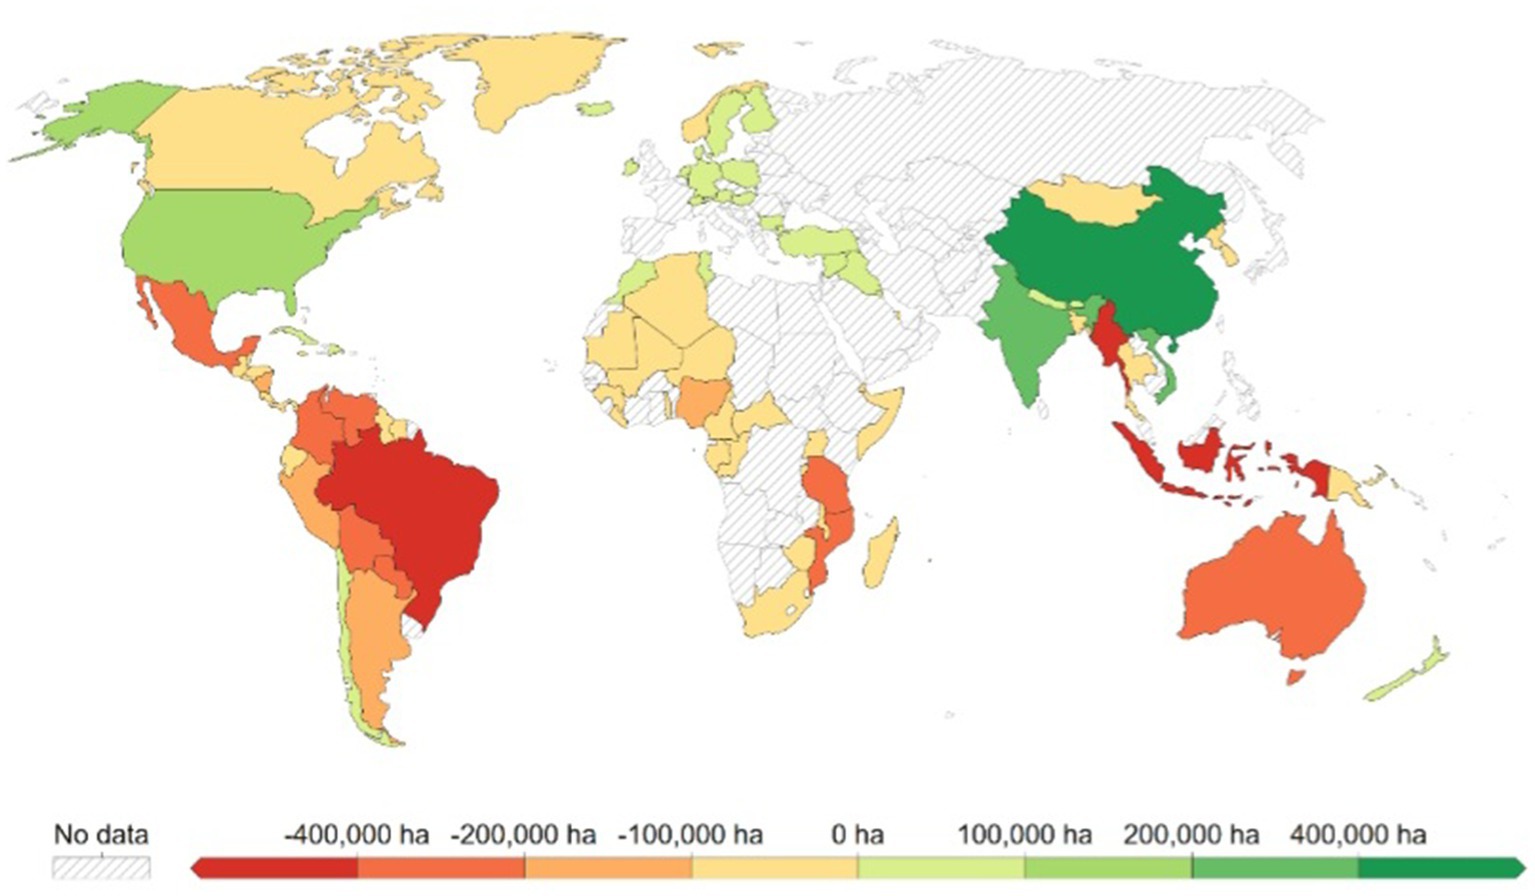
Figure 1. Annual change in forest area (1995). Source: FAO (2020) and Our World in Data (2021).
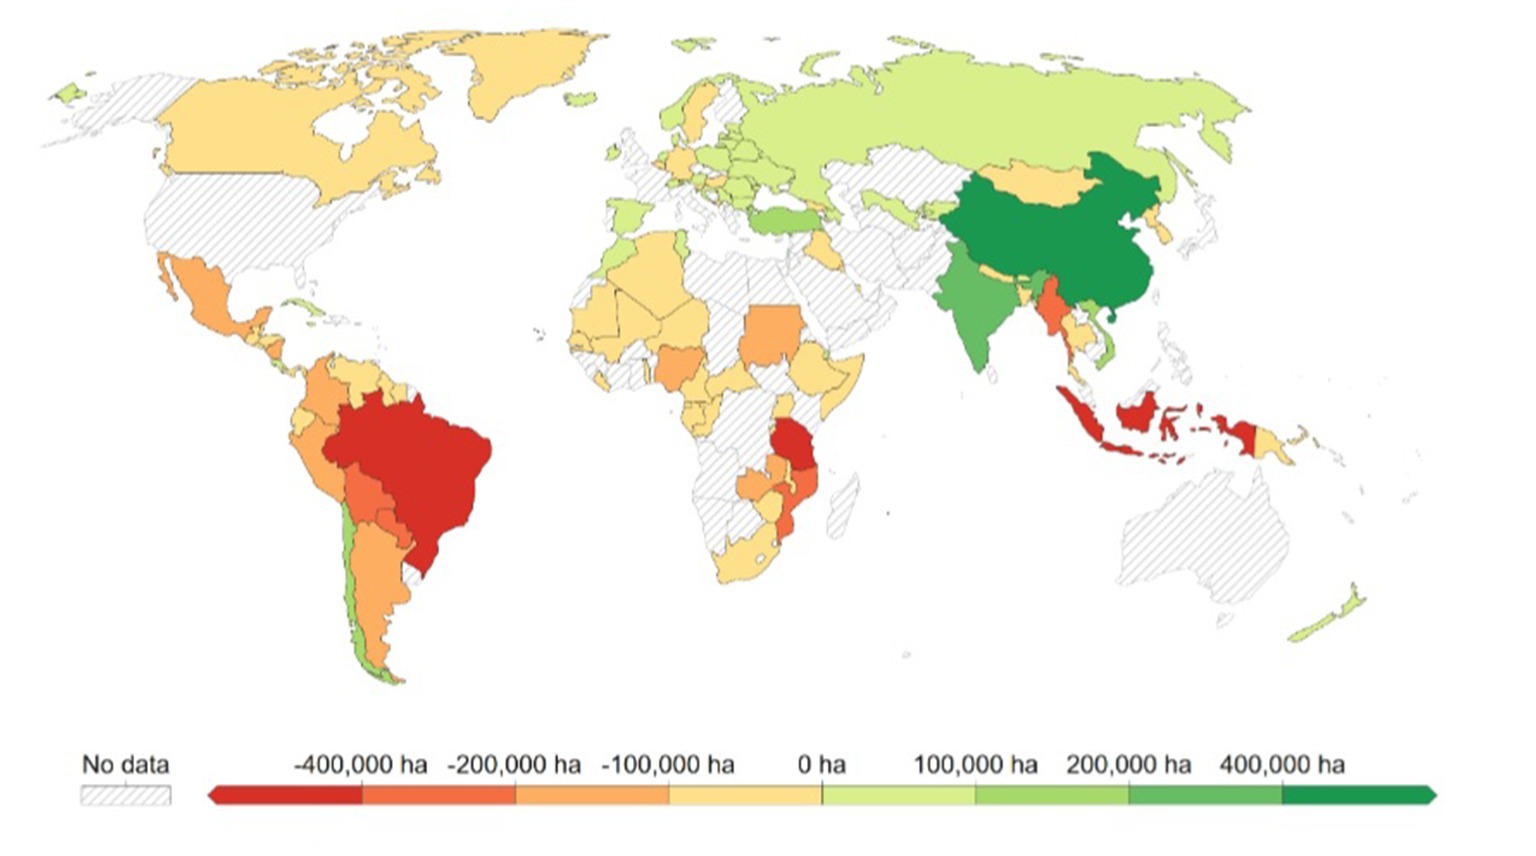
Figure 2. Annual change in forest area (2020). Source: FAO (2020) and Our World in Data (2021).
Various studies have raised arguments and hypotheses on the causes of deforestation. Studies are, however, often focused on smaller regions (Maretto et al., 2020), individual states (Zeb et al., 2019), or entire continents (Leisher et al., 2013). The heterogeneity of countries and regions limits the significance and global impact of the results. As opposed to these studies, our study aims to contribute to the literature by systematic globally oriented research of the socio-economic drivers of deforestation. Previously published global studies are somewhat dated or do not include such a range of investigated variables (Ehrhardt-Martinez, 1998; Ewers, 2006; Damette and Delacote, 2012; Nguyen et al., 2023).
Therefore, this paper aims to investigate the links between deforestation and various economic, social, environmental, and geographical factors, such as per capita GDP, total forest cover, and population. We look at these aspects across multiple countries from five continents over the past 30 years. We carefully select several countries to delve into these connections. We ensured a relatively even distribution of examples across Europe, Africa, Asia, and North America is present. Additionally, we include two instances from South America, chosen based on relevance and available data. The goal was to have a mix of both larger and smaller countries to achieve a diverse range of results.
Also, several major global events are incorporated in the investigation such as COVID-19 pandemic and financial crisis. To account for the impacts of these events on the variables being analysed, various dummy variables were included in the model. In addition to standard environmental and economic indicators, we also utilized dummy variables to account for factors such as a country’s location, EU membership, geographical position, continent, and landlock, in order to examine their potential impacts on deforestation rates. Data sources and the importance of the investigated factors are justified in the Data and Methodology section of this article. By incorporating these additional variables, our analysis seeks to provide a more comprehensive understanding of the complex factors contributing to deforestation in these selected countries and to help inform policy and decision-making aimed at reducing its impacts. Based on existing research gaps, we established the following research questions: (1) Which distinct factors wield the potential to mold the growth of forested regions? (2) Do relationships exist between deforestation and economic indicators, including their driving forces? and (3) Did significant global occurrences like the 2008–2010 financial crisis and the advent of the COVID-19 pandemic exert influence on variables tied to deforestation?
2. Literature review
The review of existing literature demonstrates that the reasons and catalysts behind deforestation have been extensively explored in the preceding decades. A consensus among numerous contemporary and historical studies is that the primary causes driving deforestation and forest deterioration encompass population upsurge, agricultural expansion, urban proliferation, and intensified fuelwood gathering, particularly within developing nations (Jallat et al., 2021; Ahmed et al., 2023). Nonetheless, comprehending the root causes of deforestation is a more intricate undertaking. The distinct characteristics of continents, the varying levels of economic advancement, demographic shifts, and other indicators all contribute to a multifaceted picture.
According to Derouin (2019), deforestation refers to the deliberate clearing of extensive tree-covered areas, primarily driven by human actions. Derouin (2019) identifies the following as factors contributing to deforestation: (1) Conversion of land for oil palm, soybeans, and other agricultural cultivation; (2) Expansion of farming areas in response to heightened worldwide requests for livestock-based commodities; (3) Advancement of urban zones, the establishment of new transportation networks, and housing projects; and (4) Generation of wood pulp intended for the paper sector, ultimately transformed into paper and cardboard goods.
In a study by Jayathilake et al. (2021), commercial agriculture emerged as the primary force propelling deforestation in tropical nations, trailed by the expansion of infrastructure and settlement areas. Similarly, Curtis et al. (2018) highlighted land utilization for commodity production, agriculture, and forest fires as the foremost drivers behind worldwide deforestation. To combat this issue, Curtis proposes a solution to extract five million hectares of conversion annually from supply-customer chains, aiming to eliminate deforestation.
Amelung and Diehl (1992) assert that increasing cultivation stands as the primary catalyst for deforestation. These authors also underscore the role of a growing population in this dynamic. The notion that an expanding population contributes to deforestation is supported by various authors (e. g., Allen and Barnes, 1985; Cropper and Griffiths, 1994; Ehrhardt-Martinez, 1998; Mather and Needle, 2005). Martínez and Poveda (2021) emphasize that global attainment of economic and societal advancement has often come at the cost of environmental degradation.
Shafron (2019) examines the interplay between deforestation and social aspects of forest management. As highlighted by Ferrer Velasco et al. (2020), deforestation frequently intertwines with human actions and can wield consequences on vital forest ecosystem services, encompassing carbon sequestration, biodiversity preservation, and water regulation.
Damette and Delacote (2012) found positive correlations between economic development, timber harvesting, demography, prices with deforestation. However, institutional quality was not found to significantly impact deforestation (Damette and Delacote, 2012). In a distinct examination of deforestation’s causes in Vietnam, the authors proposed enhancements to the institutional framework. Their recommendations encompass poverty alleviation, conservation of existing forests, enhanced governance at the provincial level, and effective management of population growth (Van Khuc et al., 2018). McCallister et al. (2022) suggest that institutional and economic factors of deforestation pose greater challenges for identification and control compared to conventional factors like livestock production, agricultural land expansion, and the mining industry.
The theoretical foundation underpinning the link between per capita income and deforestation is encapsulated by the U-shaped Kuznets Curve. This framework posits that in less developed nations, economic growth initially exerts a negative impact on the environment (evidenced by deforestation). However, at a certain threshold of GDP per capita, environmental degradation (including deforestation) reaches a point of saturation, ceasing to escalate with further economic expansion. This phenomenon may even lead to afforestation in more advanced economies (Culas, 2007; Adila et al., 2021; Caravaggio, 2022).
Destiartono and Ekananda (2023) assessed GDP per capita in relation to deforestation across Southeast Asia, identifying a pivotal break-even point at $26,785. This juncture signifies the transition to an advanced stage of economic development and theoretically affirms the fundamental premise of the U-shaped curve. Interestingly, the study designates Brunei Darussalam as the sole Southeast Asian nation to have achieved a higher level of deforestation. Meanwhile, Ajanaku and Collins (2021) validated the Environmental Kuznets Curve hypothesis within Africa during the period spanning 1990 to 2016. Their analysis positioned the break-even point at $3,000.
Nguyen et al. (2023) conducted a study assessing the influence of tourism on forested areas across a diverse collection of 140 economies worldwide. Their findings indicate a favorable short-term impact of tourism, which, however, turns detrimental in the long run. Notably adverse consequences of tourism were particularly pronounced in Africa, Latin America, and the Caribbean. Another intriguing factor was explored by Nguyen and Nguyen (2023). Their examination of a global sample spanning 148 countries from 1991 to 2017 revealed an asymmetrical long-term correlation between the shadow economy and deforestation. Brown and Pearce (2023) in their book examine different causes for tropical areas deforestation albeit most of the data is relatively old. Additionally, González-Eguino (2015) underscores the significance of illicit mining within the informal economy. These unauthorized activities often intertwine with poverty and a malfunctioning labor market (Santos de Lima et al., 2018; Zeb et al., 2019).
3. Data and methodology
This study explores a regression model using panel data to show the impact of key economic, and social variables on deforestation. To enable the investigation, we use a set of dummies to capture their influence. The random effect specifications are used in this investigation.
3.1. Countries specification
The characteristics of deforestation trends and causes vary across continents and countries, as outlined in recent studies (Antonarakis et al., 2022; Ma et al., 2023). In North America, deforestation rates have generally remained lower compared to other continents, especially in recent years. This can be attributed partially to effective forest management practices, the transition toward a more service-oriented economy, and dedicated reforestation efforts. Localized deforestation in this region can arise from urban expansion, wildfires, and insect infestations (Zerriffi et al., 2023).
On the other hand, South America, which hosts the Amazon rainforest, experiences some of the highest deforestation rates worldwide. This is primarily fueled by agricultural expansion, notably for beef and soy production, alongside mining and infrastructure growth. Deforestation in this context is also influenced by governance issues and insufficient enforcement of environmental regulations (Silva Junior et al., 2021; Stabile et al., 2022).
Deforestation rates across Asia are shaped by a diverse array of influences. For instance, in Southeast Asia, the expansion of palm oil plantations stands out as a prominent cause of deforestation (Miettinen et al., 2014; Van Khuc et al., 2018). In various other Asian regions, the noteworthy drivers encompass urban sprawl, infrastructure advancement, and timber extraction (Khalid et al., 2019).
Meanwhile, Europe has generally witnessed a growth in its forest cover over recent decades, largely attributable to sustainable forest management practices and concerted reforestation initiatives. While issues like urban expansion and, in certain areas, heightened demand for bioenergy can lead to localized deforestation, the predominant forces behind deforestation in this context include agricultural expansion, urbanization, and timber logging (Belušić et al., 2019; Strandberg and Kjellström, 2019).
To comprehensively address the matter and ensure a well-rounded representation, we have selected a minimum of five countries from each continent. This selection process was purposefully designed to encompass nations of varying sizes, thus revealing the inclusion of both substantial and smaller countries. The overarching objective was to achieve a comprehensive cross-section of human development levels across the global spectrum.
Our approach also prioritized the incorporation of both developed and developing countries, along with nations exhibiting a broad range of economic and social development statuses. The guiding principle behind our country selection was based on the purpose to assemble a sample that authentically reflects the complex set of factors influencing economic and social development across different parts of the world, in line with the directives provided by the World Bank (2023). A detailed list of the countries chosen for our analysis is in Table 1.
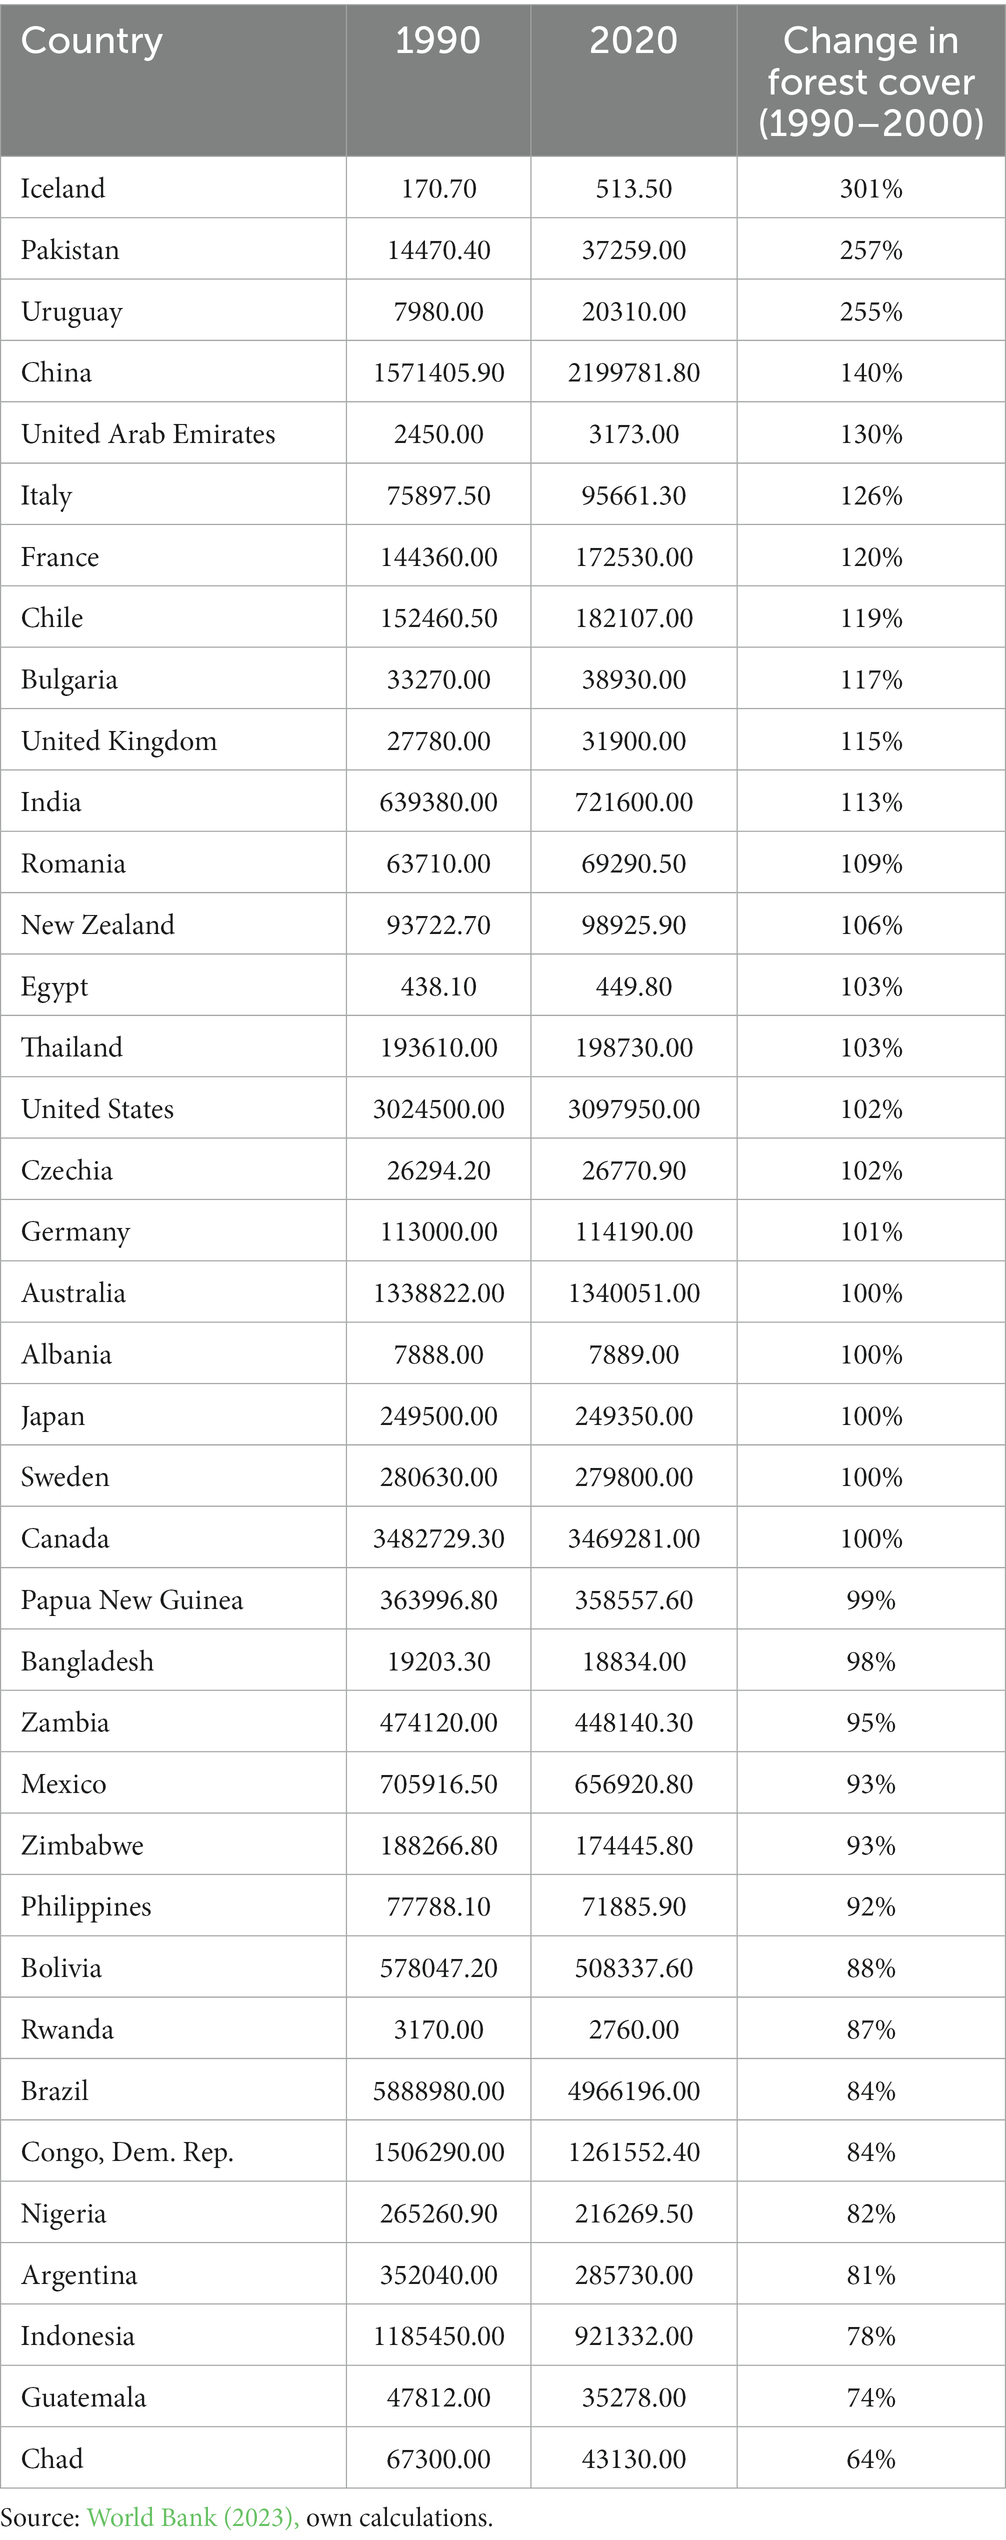
Table 1. Countries selected for analysis ranked by change in forest cover.
In our research, we introduced colonial countries as a dummy variable to assess their potential influence on deforestation rates within the chosen nations. This inclusion was motivated by the recognition that colonialism has been associated with enduring ramifications on a country’s economic and political structures. Colonialism was potentially influencing subordinate countries’ approaches to managing natural resources.
Drawing from the definition that designates a nation as landlocked if it is surrounded by other countries without direct sea access or if its coastline is located within a closed drainage basin, our team engaged in deliberations regarding the specific landlocked status of a particular country. Upon thorough consideration, we collectively arrived at a consensus and determined the countries that fit the landlocked classification. Currently, the global count stands at 44 landlocked countries, accompanied by 5 partially recognized landlocked territories (The Fact File, 2022). The distribution between landlocked and non-landlocked nations intertwines with trade, economic, climatic, and environmental factors.
Non-landlocked countries, possessing unhindered access to maritime trade routes, enjoy the potential to exploit and export timber and other forest resources, possibly leading to heightened rates of deforestation driven by economic motives. Conversely, landlocked countries, constrained by the absence of direct sea route access, might exhibit reduced incentives for large-scale logging intended for export purposes and increased deforestation.
Nations without direct sea access frequently encounter distinct economic obstacles, such as escalated transportation expenses and increased trade overheads. In response, these countries may resort to the exploitation of natural assets, including forests, as a strategy for economic advancement. Landlocked countries could potentially rely more significantly on land-based resources, notably forests, as integral components of their sustenance. Consequently, this reliance might contribute to elevated deforestation rates, driven by the inhabitant’s utilization of forest resources for necessities like fuel, sustenance, and construction materials.
3.2. Socio-economic indicators
3.2.1. GDP per capita in PPP
The economic metric of GDP per capita at purchasing power parity (PPP) serves as an indicator of a nation’s level of development. Often, countries with elevated GDP per capita possess more resources that can be allocated toward sustainable practices and the preservation of forests (Ewers, 2006). Nonetheless, it’s plausible that countries achieving higher GDP per capita levels might have experienced industrialization processes that could entail deforestation (Martínez and Poveda, 2021). The correlation between GDP per capita and deforestation finds its theoretical framework within the Kuznets curve (Ajanaku and Collins, 2021). This concept was thoroughly explored in our literature review.
The data utilized in this paper pertains to GDP per capita measured through purchasing power parity (PPP), which is converted into international dollars using purchasing power parity rates. This approach considers the fact that equivalent monetary amounts can yield different purchasing capabilities for goods and services in different countries. The dataset originates from the International Comparison Program (ICP) administered by the World Bank and the Eurostat-OECD PPP Program.
This data is gathered on an annual basis and reported in terms of international dollars. The methodology for aggregation involves a weighted average. Specifically, the data’s definition underscores that Gross Domestic Product (GDP) at purchaser’s rates comprises the total value added by all domestic producers within the country, along with any taxes on products, while subtracting any subsidies not included in the product’s value. However, this computation does not include the depreciation of manufactured assets or the depletion and deterioration of natural resources. In essence, this dataset yields invaluable insights into the economic welfare of nations, adjusting disparities in prices and expenses across different countries (World Bank, 2023).
3.2.2. Population
Population size plays a pivotal role in both forestation and deforestation dynamics. Larger populations often induce a higher pressure on forest resources, thereby contributing to deforestation. Nonetheless, there are instances where population growth induces reforestation activities, as societies increasingly recognize the significance of forests and implement measures to safeguard and expand them (Carr et al., 2005; Oyetunji et al., 2020).
The provided data offers an approximation of the overall population, encompassing all residents within a country, irrespective of their citizenship or legal status. This dataset is sourced from diverse resources, including census records, statistical publications, and demographic modeling undertaken by the United Nations Population Division and the U.S. Census Bureau. The aggregation process involves summing up population estimates across all l.
Fluctuations in population size can wield substantial influences over natural resources and social infrastructure. At the same time, population growth can trigger significant impacts while a reduction in population size may affect governmental services and infrastructure provisioning.
Gender disaggregation of Gender-specific breakdown of population data aids countries in forecasting the demand for social services with a focus on gender-related aspects. The total population data predominantly relies on national population censuses, supplemented by estimates for years preceding and following these censuses, obtained through demographic modeling. The accuracy and reliability of demographic insights are subject to diverse influences, including public confidence in the government, the government’s commitment to thorough and accurate enumeration, and the availability of supplementary data from surveys or registration systems.
Ensuring comparability among population indicators has some limitations due to disparities in concepts, definitions, and estimation methodologies used by different organizations. The intricate matter of international migration significantly contributes to population growth; however, estimating migration proves challenging due to differences in standards and the absence of comprehensive data.
Population projections until 2050 are constructed based on assumptions due to mortality, fertility, and migration, stratified by age and gender. These assumptions draw from the UN Population Division’s World Population Prospects database medium variant (World Bank, 2023).
3.2.3. COVID-19 impact and the financial crisis
Profound global events have a substantial influence over economic activities and, consequently, reverberate through the domains of forestation and deforestation (Elliott, 2011). As an illustration, economic downturns can spur heightened logging activities as nations strive to fortify their economies. During the analysis timeframe, noteworthy global occurrences unfolded, including the 2008–2010 financial crisis and the onset of the COVID-19 pandemic in 2020 (Uğurlu and Jindřichovská, 2022). In order to factor in the repercussions of these events on the variables under examination, the model incorporated dummy variables.
COVID-19 Crisis: The far-reaching impact of the COVID-19 pandemic extends to all forms of existence, including environmental stewardship. This crisis potentially triggered reduced human presence within forested areas, leading to a deceleration in deforestation rates (Antonarakis et al., 2022). Conversely, the economic strains caused by the pandemic might have propelled certain individuals or entities to intensify logging endeavors (Vale et al., 2021; Céspedes et al., 2022).
The financial crisis, originating in the United States and spreading across nations, had significant repercussions on the worldwide economy, initiating declines in economic growth, employment levels, and financial stability. To encompass the crisis’s effects, a dummy variable was introduced to encapsulate the years 2008 through 2010, coinciding with the crisis’s most severe impact.
Likewise, the COVID-19 pandemic had a profound influence globally, prompting governments to adopt diverse measures to curb its transmission and alleviate its impact on both the economy and society (Jindřichovská and Uğurlu, 2021). To accommodate these effects, a dummy variable was established to denote the year 2020, which marked the period when the pandemic most significantly influenced the variables under scrutiny (Our World in Data, 2023).
3.3. Forest cover
Ewers (2006) discovered that nations with limited forests and lower income levels exhibit higher deforestation rates, while conversely, higher-income countries tend to maintain their forest coverage and may even plant new forested areas. Notably, the deforestation patterns of countries with substantial forest resources appear to be less influenced by their GDP per capita.
The chosen dataset for this research, representing the environmental condition, focuses on forest land cover. The time span encompasses the years from 1990 to 2020, with measurements in square kilometers. This information is sourced from the World Bank’s online repository. According to the dataset specifications provided by the World Bank, the forest cover under consideration encompasses natural or planted stands of at least 5 meters in height, whether in productive use or not. This definition excludes stands within agricultural production systems like orchards and agroforestry setups, as well as urban parks and gardens.
For our study, deforestation data from the Food and Agriculture Organization (FAO) was utilized, sourced through their global Forest Resources Assessment (FRA) program, an initiative operational since 1946. The FAO periodically assembles and assesses forest cover details at various levels: subregional, regional, and global. The dataset furnishes information regarding forested areas and their temporal changes, albeit without accounting for areas subject to logging, degradation due to fuelwood collection, acid precipitation, or forest fires.
The FAO employs a consistent forest definition, necessitating the presence of trees and the exclusion of dominant land uses, with a minimum tree height of 5 meters. It is important to note that the data might not precisely reflect the actual rate of deforestation in certain countries, as it does not differentiate between natural forests and plantations (World Bank, 2023).
3.4. Methodology
For the purposes of this paper, the authors employ panel regression analysis as the chosen method. The method of panel regression is used for the following reasons. Panel regression offers the capability to manage unobserved variables that exhibit temporal variation but remain consistent across different entities, or those that display entity-specific variation without temporal changes. This proves particularly advantageous in the context of studying deforestation trends across various countries and time periods, considering the potential influence of unobserved factors unique to specific countries or periods. Furthermore, panel regression effectively accommodates individual heterogeneity, a vital consideration when dealing with data from diverse countries, each with distinct characteristics. Unlike linear regression, panel regression yields more informative data, heightened variability, reduced collinearity among variables, increased degrees of freedom, and enhanced efficiency. Scrieciu (2007) endorses panel regression as a suitable tool for examining deforestation factors in international comparisons.
Panel regression constitutes a modeling technique suitable for panel data, also referred to as longitudinal or cross-sectional data. It finds common usage in tracking the behavior of statistical entities (termed panel units) over a temporal trajectory, with these entities corresponding to the countries outlined in Table 1. This approach allows for the control of both panel unit and time effects while estimating regression coefficients (Torres-Reyna, 2007). In the context of regression analysis involving cross-sectional data, parameter estimation is typically conducted using the Ordinary Least Squares (OLS) method. The Best Linear Unbiased Estimation (BLUE) provides an optimal linear and unbiased estimation. In this paper, panel data encompasses information about a group of countries observed concurrently. The dataset spans T time periods (t = 1, 2…, T) from 1990 to 2020 and includes N units (I = 1, 2…, N), representing 38 countries across 5 continents. This results in a total of N × T observation units within the panel data.
The data used are summarized in the Table 2.
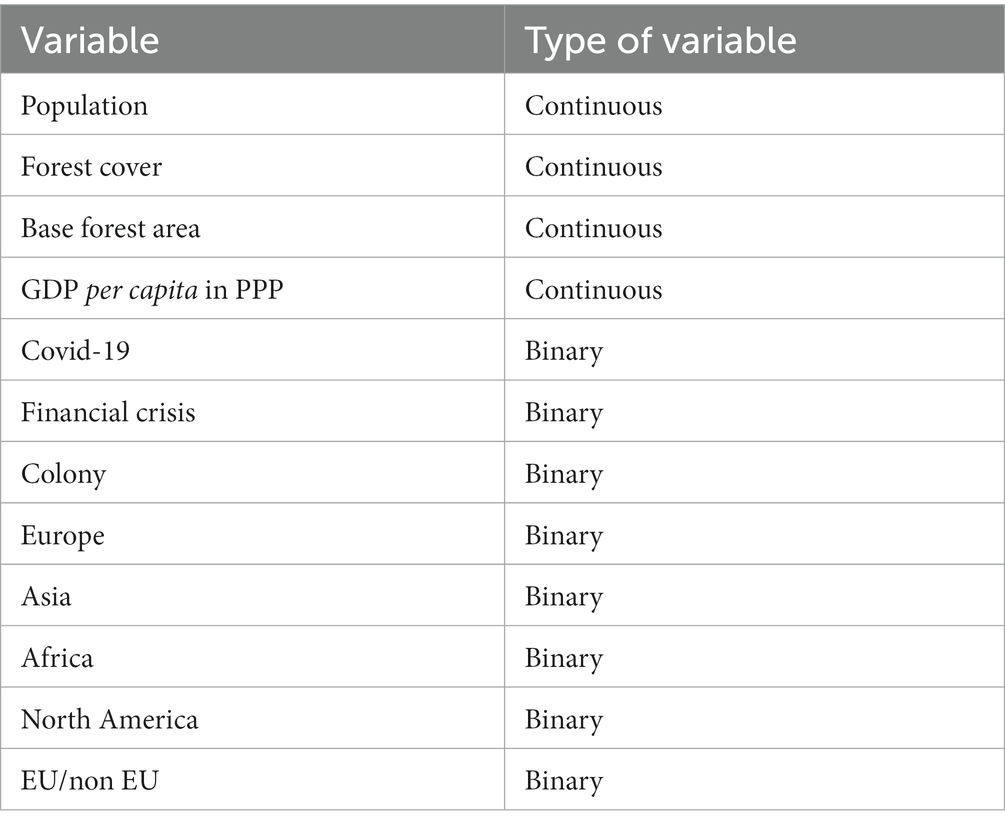
Table 2. Variables used in the model.
The Table 2 shows which variables are continuous in nature. These were taken from publicly available sources such as World Bank (2023) or FAO (2020). Binary variables take the value 1 if it is true or 0 otherwise.
For the analysis, the random effects model was chosen. The rationale behind random effects models is that, unlike fixed effects models, the variation among entities is assumed to be random and unrelated to the predictor or independent variables included in the model.
The random effects model is specified as:
where uit is the inter-entity error, eit presents the intra-entity error, and all remaining variables retain their previous definitions. To determine the most suitable model, the authors performed a series of tests including the F test, the Breusch-Pagan test, and the Hausman test.
4. Results
As already discussed, this research paper explores the Forest Area variable as the dependent variable, seeking to elucidate the precise factors influencing its development. Firstly, Hausman test was performed, validating the random effects model’s applicability (p = 0.157078, Chi-square(12) = 16.8051).
Panel regression findings are detailed in the ensuing tables, with Table 3 presenting the first model (referred as Model 1) encompassing all variables within the complete dataset. The model includes 1,178 observations. During model compilation, certain chosen variables emerged as statistically insignificant, termed superfluous variables, and were consequently removed. These variables include EU/non-EU, Landlocked, Southern Hemisphere, and Africa.
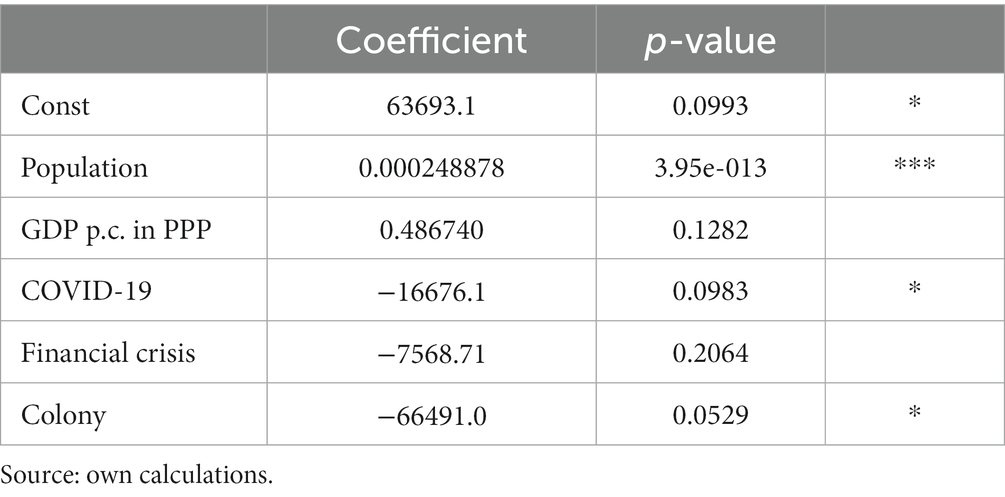
Table 3. Deforestation: complete data (Model 1).
In the Gretl program-generated model, statistically significant relationships are denoted by stars. One star represents a 10% significance level, two stars signify a 5% level, and three stars indicate a 1% level. The selection of significance level (p-value) for model evaluation corresponds to the test’s conservativeness – the lower the chosen significance, the more conservative the test. Population totals exhibit statistical significance at the 1% level. As indicated by Model 1, it appears that an increase in population totals is accompanied by a corresponding growth in forest area. Specifically, according to this model, a one-unit rise in population leads to a forest area expansion of 248 m2. Similarly, should GDP per Capita in PPP experience a one-unit increase, the forest coverage is projected to expand by 486.740 m2. However, it’s worth noting that these variable exhibits statistical significance at the 13% level, which raises concerns about its reliability. Another variable lacking significance in the model is the financial crisis spanning from 2008 to 2010. Furthermore, the COVID-19 crisis, represented by its dummy variable accounting for 2020, is found to have a negative impact significant at the 10% level. This would imply that during COVID-19, deforestation was happening. The historical colonization status of a country appears to exert a noteworthy influence, significant at the 10% level. Colonized nations exhibit a comparatively reduced forest area, measuring 66.491 km2, in contrast to countries not subjected to colonization, as defined in the preceding “Data” chapter. To establish the appropriateness of tested models, the Akaike criterion and Hannan-Quinn were employed for model comparisons. The analysis determined that the current model is the most suitable one, and no further refinements could enhance its performance level.
The characteristics and results of the second and third models are depicted in Tables 4, 5. Table 4 specifically presents countries with a forest area exceeding 1 million square kilometers. Model 2 includes 186 observations (6 countries), exclusively tied to the development of nations possessing over 1 million km2 of forest area. Given the relatively modest sample size, certain variables had to be omitted, including EU/non-EU, Colony, Landlocked, Southern hemisphere, as well as Asia, Europe, North America, Africa, and the 2008 Financial crisis.
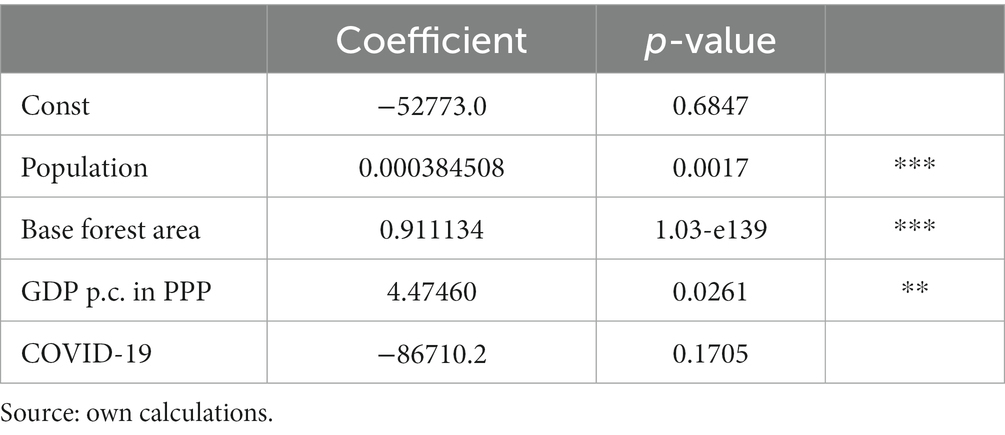
Table 4. Estimation for countries with forest area greater than 1 million km2 (Model 2).
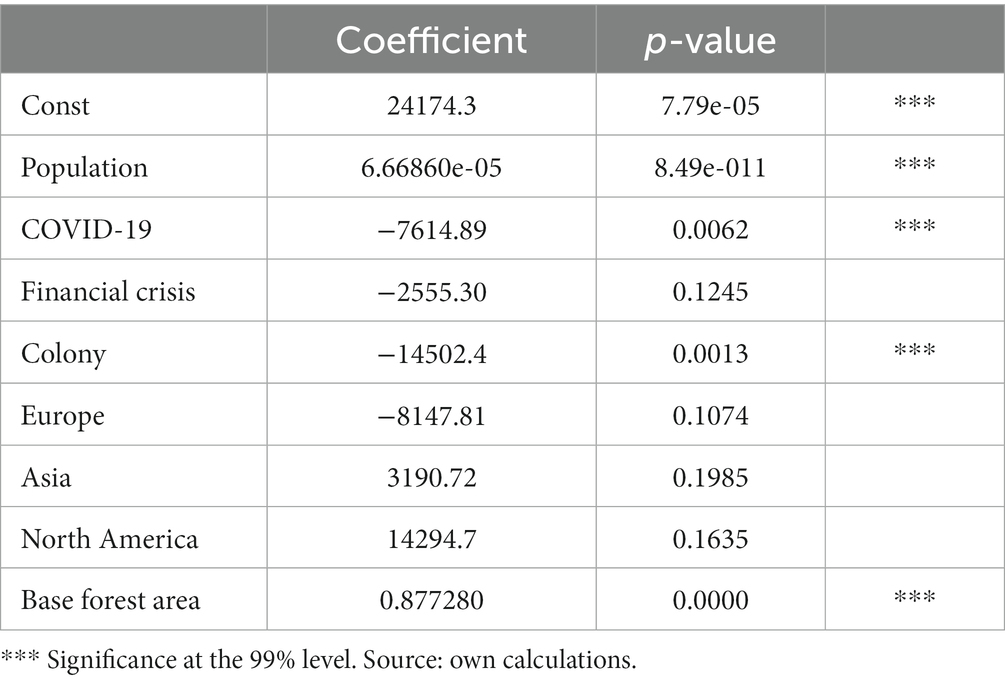
Table 5. Deforestation of countries with less than 1 million km2 of forest area (Model 3).
Indonesia stands as the sole country included in both models – encompassing nations with forest areas surpassing 1 million km2 (Model 2) and those with less than 1 million km2 (Model 3). The choice to include Indonesia derives from its fluctuating forest cover, spanning from 1,185,450 km2 in 1990 to 921,332 km2 in 2020.
The magnitude of forest area in countries with forest covers exceeding 1 million km2 appears notably influenced by the variables Population and GDP per capita. At a significance level of 1%, the population demonstrates a substantial influence on forest area in countries boasting more than 1 million km2 of forest coverage. A population increase of 1 unit corresponds to a forest area expansion of 384 m2, a value surpassing that observed in Model 1. Counterintuitively, despite expectations of a negative correlation between larger populations and reduced forest areas, these models propose a contrary relationship. This phenomenon is primarily attributed to the pronounced influence of China and India, both marked by substantial populations and extensive forest areas. The Base Forest area variable (shows area in 1990) depicts that since the first measurement, the forest area grew by 911,134 m2 yearly on average in countries with more than 1 million km2 of forest area.
At a 5% significance level, the model indicates that an increase in GDP per capita in PPP is associated with a forest area expansion of 44,746 km2. Notably, the variable GDP per capita displayed insignificance in the preceding Model 1. Over the course of the global COVID-19 pandemic, which the models incorporate as a dummy variable capturing its effects in 2020, deforestation ensued. Nevertheless, this variable emerges as statistically insignificant. These outcomes may substantially stem from the outsized influence of each country’s data within the dataset, given the inclusion of only 6 countries. This influence is underscored by instances such as Brazil, which experienced an annual change of 11,789 km2 in 2019/20.
For reasons elucidated in the preceding section, Model 3 is a result of categorizing the chosen countries into two extensive groups based on their forest cover extents. Model 3 is based on the 992 observations bound solemnly to the figures connected to the deforestation of countries with less than 1 million km2 of forest area. This model estimation results are depicted the Table 5. The following variables have proven to be statistically largely insignificant (superfluous), so they were not included in the model: GDP per Capita in PPP, EU/non-EU, Landlocked, Southern hemisphere, and Africa.
For the reasons mentioned in the previous section describing Model 2: Indonesia is the only country, which was included in both models – Model 2 and Model 3. According to the model’s results, population, the impact of COVID-19, whether it has been a colony or not and the base forest area are all significant variables on the level of significance 1%. In these countries, the coefficient denoting the positive influence of population on forest area is notably smaller compared to the model involving countries with forest areas exceeding 1 million km2. A unit increase in population is associated with a mere 66.6 m2 growth in the forest area.
The COVID-19 pandemic exhibited an adverse effect on forest area figures. However, it becomes evident that within the comprehensive Model 1, the pronounced coefficient was driven by countries endowed with expansive forest regions. This observation is supported by the coefficient in Model 3 (−7,614.89), which is approximately half that of the global dataset in the Model 1 (−16,676.1), and roughly one-tenth of the coefficient in Model 2 (−86,710.2). In the context of countries with forest areas less than 1 million km2, the variable “colony” emerges as significant. Colonized countries, on average, exhibit a smaller forest area per km2 compared to their non-colonized counterparts. Divergence is evident in the outcomes related to the core forest area variable when compared to the expansive country Model 2. This discrepancy suggests that the pace of forest area growth is more gradual, averaging 877.280 m2 to 911.134 m2 annually, in countries with forest areas exceeding 1 million km2.
In the formulation of Model 4, 403 observations were employed for countries that experienced deforestation of 5% or more between 1990 and 2020. Results of model estimated are depicted in the Table 6.
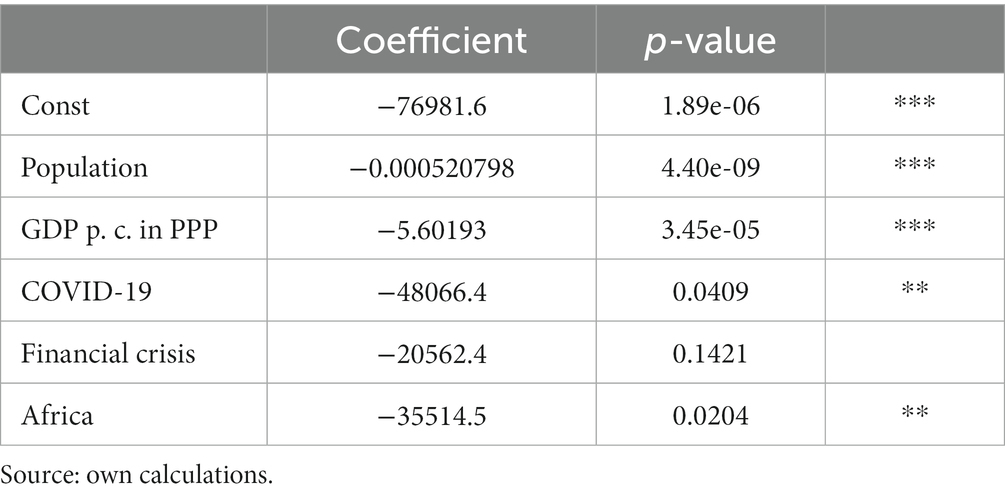
Table 6. Deforestation of countries that deforested 5% and more from 1990 compared to 2020 (Model 4).
Several variables exhibited large statistical insignificance, prompting their removal from the model: EU/non-EU, Landlocked, Asia, and Europe. The variables Colony and Southern Hemisphere were automatically excluded from the model due to precise collinearity. Several variables have demonstrated significance at the 1% level: Population, GDP per capita in PPP, Africa, and COVID-19. This particular model, among the four incorporated within this study, presents the sole instance suggesting a negative relationship between forest area and GDP per capita in PPP and population. An increase in a country’s population by 1 unit is associated with a forest area reduction of 0.000520798 km2 (equivalent to 520.8 m2). Similarly, a 1-unit growth in GDP per capita leads to a forest area contraction of approximately 5.6 km2. The COVID-19 pandemic also manifests a detrimental influence on forest areas, substantiated at a 5% significance level. Although a discernible effect is observable concerning the 2008 financial crisis variable, it seems to hold limited significance.
From the selected variables, North America and base forest area stand as the sole contributors to a positive impact on a country’s forest area. Notably, North America underscores that countries situated within the region tend to exhibit substantial forest coverage. This phenomenon is driven by the inclusion of the USA and Canada within North America, both of which are sizable countries, thereby fostering larger forest areas in comparison to other nations.
5. Discussion, conclusions, and recommendations
Addressing the central research inquiry regarding the influence of selected socio-economic developmental indicators on deforestation across the chosen countries is not straightforward, given observed variations between smaller and larger nations concerning forest reserves. The impact of GDP remains ambiguous. Nevertheless, estimation outcomes for countries experiencing substantial forest loss align with prevailing literature, quantifying the contrast between economic development and environmental well-being.
Disruptive events like the COVID-19 pandemic and the 2008 financial crisis resoundingly reverberated, yielding a marked negative effect on forest area development across all models. It’s noteworthy to emphasize that, particularly within countries encompassing forest areas surpassing 1 million km2, the impact of the COVID-19 crisis was notably more pronounced than in nations with forest areas below 1 million km2.
In the temporal context spanning from 1990 to 2020 on a global scale, our model underscores the statistical significance of the population variable. The initial three models incorporated within this study suggest a positive association between population and forest area, indicating that an increase in one is accompanied by a rise in the other. However, divergent perspectives emerge from other scholars. Amelung and Diehl (1992) identified a negative impact of population growth on forest area. This observation aligns with multiple studies, including Allen and Barnes (1985), Cropper and Griffiths (1994), Ehrhardt-Martinez (1998), and Mather and Needle (2005). Such findings are also echoed in the conclusive model of countries that experienced deforestation of 5% or more over the preceding three decades. Discrepancies in outcomes might arise from the specific set of countries under examination. Additionally, Brown and Pearce (2023) claim that forest cover is negatively correlated with population.
Throughout the investigation, the authors encountered various studies concentrating on similar topics but confined to narrower geographical contexts. Austin et al. (2019) explored Indonesia, while Barbier and Burgess (2008) focused on tropical regions, and Silva Junior et al. (2021) delved into Amazon deforestation.
GDP per capita has demonstrated its relevance as a significant variable within countries having forest areas exceeding 1 million km2. These findings imply that the economic expansion of a nation is associated with a favorable effect on its forest area. However, contrasting findings are presented by Martínez and Poveda (2021), who contend that global economic and social advancement has been achieved at the expense of environmental well-being. Conversely, divergent outcomes arise from the model exclusively encompassing countries that have experienced deforestation at a scale of 5% or more from 1990 to 2020. Within this context, the results unequivocally assert a negative influence of GDP per capita growth in PPP on the forest area.
In contrast to the conclusions drawn by Antonarakis et al. (2022), the COVID-19 pandemic has yielded adverse effects on forest cover as evidenced by the models formulated in this study. These observations correspond to the findings of Vale et al. (2021). As posited by Céspedes et al. (2022), while numerous studies conducted in 2020 have predominantly concentrated on the immediate repercussions of the COVID-19 pandemic and its implications for deforestation rates, the focus should now shift toward the recuperation strategies employed by economies and the potential short- to long-term repercussions they may impact on forest cover.
The relevance of whether a country has undergone colonization emerges primarily in the context of countries with forest areas of less than 1 million km2. This distinction is rational considering that our dataset primarily encompasses these smaller colonized nations. Consequently, this variable attains significance. In an investigative endeavor, Marchand (2016) explores not only the influence of a colonial legacy on a country’s deforestation patterns but also the variations that exist in the inherited legacies.
This study has yielded a series of recommendations aimed at effectively addressing deforestation and promoting sustainable land management practices. It is imperative to undertake policy and governance reforms to establish a solid legal framework, strengthen enforcement mechanisms, and foster transparency and accountability. Engaging local communities and stakeholders in decision-making processes is pivotal to ensuring sustained success. The promotion of sustainable agriculture and agroforestry practices can substantially alleviate pressure on forests. Disciplines like agroecology, organic farming, integrated pest management, as well as the adoption of diversified cropping systems and agroforestry, can enhance productivity while concurrently safeguarding forests. Notably, the implementation of large-scale forest restoration and reforestation initiatives, utilizing indigenous tree species and involving local communities, as seen in instances such as China and India based on our dataset, is advisable. Collaborative efforts with non-governmental organizations (NGOs) and international entities can strengthen and amplify the impact of these initiatives. Based on this study, it is recommendable that adaptive policies for varied country sizes are developed. These policies should account for the varying impact of socio-economic indicators on deforestation between smaller and larger nations due to differences in forest reserves. Furthermore, it is necessary to mitigate disruptive events like pandemics by establishing specific strategies and creating contingency plans. This will ensure the resilience of forest ecosystems, and promote sustainable resource management during and after crises. Additionally, it is advisable to prioritize post-crisis recovery plans that integrate forest protection and restoration as part of broader economic recovery efforts. These recommendations address the complexity of factors influencing deforestation, including country size, disruptive events, and the need for adaptable policies to balance economic development with environmental conservation. However, this study does acknowledge certain limitations and suggests potential directions for future research. While the current paper has centered on economic, social, environmental, and geographical variables, further investigations could delve into the institutional and political determinants driving deforestation and afforestation. Additionally, the inclusion of qualitative insights from guided interviews with pertinent stakeholders from public, non-profit, and corporate sectors could enrich the analysis.
Data availability statement
The original contributions presented in the study are included in the article/supplementary material, further inquiries can be directed to the corresponding author.
Author contributions
PP: Conceptualization, Formal analysis, Investigation, Methodology, Resources, Supervision, Validation, Writing – original draft, Writing – review & editing, Data curation. JA: Conceptualization, Formal analysis, Funding acquisition, Investigation, Methodology, Project administration, Resources, Supervision, Validation, Visualization, Writing – original draft, Writing – review & editing. JC: Data curation, Formal analysis, Investigation, Methodology, Validation, Writing – original draft, Writing – review & editing. LK: Data curation, Formal analysis, Writing – original draft, Writing – review & editing. PS: Data curation, Formal analysis, Writing – original draft, Writing – review & editing. DB: Data curation, Formal analysis, Writing – original draft, Writing – review & editing. J-MF: Data curation, Formal analysis, Writing – original draft, Writing – review & editing. EJ: Data curation, Formal analysis, Writing – original draft, Writing – review & editing. SP: Data curation, Formal analysis, Writing – original draft, Writing – review & editing. JS: Data curation, Formal analysis, Investigation, Methodology, Validation, Visualization, Writing – original draft, Writing – review & editing. LS: Conceptualization, Funding acquisition, Investigation, Methodology, Project administration, Resources, Supervision, Validation, Writing – original draft, Writing – review & editing.
Funding
The author(s) declare financial support was received for the research, authorship, and/or publication of this article. This article was supported by the Czech Universtity of Life Science (Faculty of Economics and Management) Internal Grant Agency, project number: 2022B0005.
Conflict of interest
The authors declare that the research was conducted in the absence of any commercial or financial relationships that could be construed as a potential conflict of interest.
Publisher’s note
All claims expressed in this article are solely those of the authors and do not necessarily represent those of their affiliated organizations, or those of the publisher, the editors and the reviewers. Any product that may be evaluated in this article, or claim that may be made by its manufacturer, is not guaranteed or endorsed by the publisher.
References
Adila, D., Nuryartono, N., and Oak, M. (2021). The environmental Kuznets curve for deforestation in Indonesia. Econ. Financ. Indones. 67:195. doi: 10.47291/efi.v67i2.671
Ahmed, H., Jallat, H., Hussain, E., Saqib, N. U., Saqib, Z., Khokhar, M. F., et al. (2023). Quantitative assessment of deforestation and forest degradation in Margalla Hills National Park (MHNP): employing landsat data and socio-economic survey. Forests 14:201. doi: 10.3390/f14020201
Ajanaku, B. A., and Collins, A. R. (2021). Economic growth and deforestation in African countries: is the environmental Kuznets curve hypothesis applicable? Forest Policy Econ. 129:102488. doi: 10.1016/j.forpol.2021.102488
Allen, J. C., and Barnes, D. F. (1985). The causes of deforestation in developing countries. Ann. Assoc. Am. Geogr. 75, 163–184. doi: 10.1111/j.1467-8306.1985.tb00079x
Amelung, T., and Diehl, M. (1992). Deforestation of tropical rainforests: economic causes and impact on development. Kiel, Tübingen: Institut für Weltwirtschaft, JCB Mohr.
Angelsen, A., and Kaimowitz, D. (1999). Rethinking the causes of deforestation: lessons from economic models. World Bank Res. Obs. 14, 73–98. doi: 10.1093/wbro/14.1.73
Antonarakis, A. S., Pacca, L., and Antoniades, A. (2022). The effect of financial crises on deforestation: a global and regional panel data analysis. Sustain. Sci. 17, 1037–1057. doi: 10.1007/s11625-021-01086-8
Austin, K. G., Schwantes, A., Gu, Y., and Kasibhatla, P. S. (2019). What causes deforestation in Indonesia? Environ. Res. Lett. 14:024007. doi: 10.1088/1748-9326/aaf6db
Barbier, E. B., and Burgess, J. C. (2008). The economics of tropical deforestation. J. Econ. Surv. 15, 413–433. doi: 10.1111/1467-6419.00144
Belušić, D., Fuentes-Franco, R., Strandberg, G., and Jukimenko, A. (2019). Afforestation reduces cyclone intensity and precipitation extremes over Europe. Environ. Res. Lett. 14, 1–11. doi: 10.1088/1748-9326/ab23b2
Bhatia, N., and Cumming, G. S. (2020). Deforestation and economic growth trends on oceanic islands highlight the need for meso-scale analysis and improved mid-range theory in conservation. Ecol. Soc. 25, 1–14. doi: 10.5751/ES-11713-250310
Brown, K., and Pearce, D. W. (Eds.) (2023). The causes of tropical deforestation: the economic and statistical analysis of factors giving rise to the loss of the tropical forests. London: Routledge.
Caravaggio, N. (2022). Economic growth and forest transition in Latin America. Forest Policy Econ. 135:102667. doi: 10.1016/j.forpol.2021.102667
Carr, D. L., Suter, L., and Barbieri, A. (2005). Population dynamics and tropical deforestation: state of the debate and conceptual challenges. Popul. Environ. 27, 89–113. doi: 10.1007/s11111-005-0014-x
Céspedes, J., Sylvester, J. M., Pérez-Marulanda, L., Paz-Garcia, P., Reymondin, L., Khodadadi, M., et al. (2022). Has global deforestation accelerated due to the COVID-19 pandemic? J. For. Res. 34, 1153–1165. doi: 10.1007/s11676-022-01561-7
Cropper, M., and Griffiths, C. (1994). The interaction of population growth and environmental quality. Am. Econ. Rev. 84, 250–254.
Culas, R. J. (2007). Deforestation and the environmental Kuznets curve: an institutional perspective. Ecol. Econ. 61, 429–437. doi: 10.1016/j.ecolecon.2006.03.014
Curtis, P. G., Slay, C. M., Harris, N. L., Tyukavina, A., and Hansen, M. C. (2018). Classifying drivers of global forest loss. Science 361, 1108–1111. doi: 10.1126/science.aau3445
Damette, O., and Delacote, P. (2012). On the economic factors of deforestation: what can we learn from quantile analysis? Econ. Model. 29, 2427–2434. doi: 10.1016/j.econmod.2012.06.015
Derouin, S.. (2019). Deforestation: Facts, Causes & Effects. Available at: https://www.livescience.com/27692-deforestation.html (Accessed March 25, 2023).
Destiartono, M. E., and Ekananda, M. (2023). Deforestation-induced the EKC framework: the role of corruption control and trade openness in Southeast Asia. Jurnal Ekonomi & Studi Pembangunan 24, 81–99. doi: 10.18196/jesp.v24i1.16798
Ehrhardt-Martinez, K. (1998). Social determinants of deforestation in developing countries: a cross-national study. Soc. Forces 77, 567–586. doi: 10.1093/sf/77.2.567
Elliott, L. (2011). Shades of green in East Asia: the impact of financial crises on the environment. Contemp. Polit. 17, 167–183. doi: 10.1080/13569775.2011.565985
Ewers, R. M. (2006). Interaction effects between economic development and forest cover determine deforestation rates. Glob. Environ. Chang. 16, 161–169. doi: 10.1016/j.gloenvcha.2005.12.001
FAO. (2020). Global Forest Resources Assessment 2020. Available at: https://fra-data.fao.org/assessments/fra/2020 (Accessed April 4, 2023).
Ferrer Velasco, R., Köthke, M., Lippe, M., and Günter, S. (2020). Scale and context dependency of deforestation drivers: insights from spatial econometrics in the tropics. PLoS One 15:e0226830. doi: 10.1371/journal.pone.0226830
González-Eguino, M. (2015). Energy poverty: an overview. Renew. Sust. Energ. Rev. 47, 377–385. doi: 10.1016/j.rser.2015.03.013
Jallat, H., Khokhar, M. F., Kudus, K. A., Nazre, M., Saqib, N. U., Tahir, U., et al. (2021). Monitoring carbon stock and land-use change in 5000-year-old juniper forest stand of Ziarat, Balochistan, through a synergistic approach. Forests 12, 1–15. doi: 10.3390/f12010051
Jayathilake, H. M., Prescott, G. W., Carrasco, L. R., Rao, M., and Symes, W. S. (2021). Drivers of deforestation and degradation for 28 tropical conservation landscapes. Ambio 50, 215–228. doi: 10.1007/s13280-020-01325-9
Jindřichovská, I., and Uğurlu, E. (2021). EU and China trends in trade in challenging times. J. Risk Financ. Manag. 14, 1–19. doi: 10.3390/jrfm14020071
Khalid, N., Ullah, S., Ahmad, S. S., Ali, A., and Chishtie, F. (2019). A remotely sensed tracking of forest cover and associated temperature change in Margalla hills. Int. J. Digit. Earth 12, 1133–1150. doi: 10.1080/17538947.2018.1448008
Lawrence, D., Coe, M., Walker, W., Verchot, L., and Vandecar, K. (2022). The unseen effects of deforestation: biophysical effects on climate. Front. For. Glob. Change 5:49. doi: 10.3389/ffgc.2022.756115
Leisher, C., Touval, J., Hess, S. M., Boucher, T. M., and Reymondin, L. (2013). Land and forest degradation inside protected areas in Latin America. Diversity 5, 779–795. doi: 10.3390/d5040779
Ma, J., Li, J., Wu, W., and Liu, J. (2023). Global forest fragmentation change from 2000 to 2020. Nat. Commun. 14, 3752–3710. doi: 10.1038/s41467-023-39221-x
Marchand, S. (2016). The colonial origins of deforestation: an institutional analysis. Environ. Dev. Econ. 21, 318–349. doi: 10.1017/S1355770X1500025X
Maretto, R. V., Fonseca, L. M., Jacobs, N., Körting, T. S., Bendini, H. N., and Parente, L. L. (2020). Spatio-temporal deep learning approach to map deforestation in amazon rainforest. IEEE Geosci. Remote Sens. Lett. 18, 771–775. doi: 10.1109/LGRS.2020.2986407
Martínez, C. I. P., and Poveda, A. C. (2021). The importance of science, technology and innovation in the green growth and sustainable development goals of Colombia. Environ. Clim. Technol. 25, 29–41. doi: 10.2478/rtuect-2021-0003
Mather, A. S., and Needle, C. L. (2005). The relationships of population and forest trends. Geogr. J. 166, 2–13. doi: 10.1111/j.1475-4959.2000.tb00002.x
McCallister, M., Krasovskiy, A., Platov, A., Pietracci, B., Golub, A., Lubowski, R., et al. (2022). Forest protection and permanence of reduced emissions. Front. For. Glob. Change 5:928518. doi: 10.3389/ffgc.2022.928518
Miettinen, J., Stibig, H. J., and Achard, F. (2014). Remote sensing of forest degradation in Southeast Asia—aiming for a regional view through 5–30 m satellite data. Glob. Ecol. Conserv. 2, 24–36. doi: 10.1016/j.gecco.2014.07.007
Nguyen, C. P., and Nguyen, B. Q. (2023). Environmental foe or friend: the influence of the shadow economy on forest land. Land Use Policy 124:106456. doi: 10.1016/j.landusepol.2022.106456
Nguyen, C. P., Nguyen, B. Q., and Tran, D. T. L. (2023). Over two decades of severe deforestation: an economic perspective of tourism development. J. Environ. Stud. Sci. 13, 83–104. doi: 10.1007/s13412-022-00802-9
Our World in Data. (2021). Forests and Deforestation. Available at: https://ourworldindata.org/forests-and-deforestation (Accessed June 11, 2023).
Our World in Data. (2023). Coronavirus Pandemic (COVID-19). Available at: https://ourworldindata.org/coronavirus (Accessed April 22, 2023).
Oyetunji, P. O., Ibitoye, O. S., Akinyemi, G. O., Fadele, O. A., and Oyediji, O. T. (2020). The effects of population growth on deforestation in Nigeria: 1991–2016. J. Appl. Sci. Environ. Manag. 24, 1329–1334. doi: 10.4314/jasem.v24i8.4
Santos de Lima, L., Merry, F., Soares-Filho, B., Oliveira Rodrigues, H., dos Santos Damaceno, C., and Bauch, M. A. (2018). Illegal logging as a disincentive to the establishment of a sustainable forest sector in the Amazon. PLoS One 13, e0207855–e0207821. doi: 10.1371/journal.pone.0207855
Scrieciu, S. S. (2007). Can economic causes of tropical deforestation be identified at a global level? Ecol. Econ. 62, 603–612. doi: 10.1016/j.ecolecon.2006.07.028
Shafron, E. S. (2019). Examining connections between gendered dimensions of inequality and deforestation in Nepal. Available at: https://scholarworks.uvm.edu/cgi/viewcontent.cgi?article=1067&context=envstheses (Accessed May 20, 2023).
Silva Junior, C. H., Pessôa, A. C., Carvalho, N. S., Reis, J. B., Anderson, L. O., and Aragão, L. E. (2021). The Brazilian Amazon deforestation rate in 2020 is the greatest of the decade. Nat. Ecol. Evol. 5, 144–145. doi: 10.1038/s41559-020-01368-x
Stabile, M. C., Garcia, A. S., Salomão, C. S., Bush, G., Guimarães, A. L., and Moutinho, P. (2022). Slowing deforestation in the Brazilian Amazon: avoiding legal deforestation by compensating farmers and ranchers. Front. For. Glob. Change 4:635638. doi: 10.3389/ffgc.2021.635638
Strandberg, G., and Kjellström, E. (2019). Climate impacts from afforestation and deforestation in Europe. Earth Interact. 23, 1–27. doi: 10.1175/EI-D-17-0033.1
The Fact File. (2022) Landlocked Countries in the World Listed. Available at: https://thefactfile.org/landlocked-countries-list/ (Accessed March 20, 2023).
Torres-Reyna, O. (2007). Panel data analysis fixed and random effects using Stata (v. 4.2) Data & Statistical Services New Jersey: Priceton University, 112.
Uğurlu, E., and Jindřichovská, I. (2022). Effect of COVID-19 on international trade among the Visegrad countries. J. Risk Financ. Manag. 15, 1–20. doi: 10.3390/jrfm15020041
Vale, M. M., Berenguer, E., de Menezes, M. A., de Castro, E. B. V., de Siqueira, L. P., and Rita de Cássia, Q. P. (2021). The COVID-19 pandemic as an opportunity to weaken environmental protection in Brazil. Biol. Conserv. 255, 108994–108995. doi: 10.1016/j.biocon.2021.108994
Van Khuc, Q., Tran, B. Q., Meyfroidt, P., and Paschke, M. W. (2018). Drivers of deforestation and forest degradation in Vietnam: an exploratory analysis at the national level. Forest Policy Econ. 90, 128–141. doi: 10.1016/j.forpol.2018.02.004
World Bank. (2023). World Bank Open Data. Available at: https://data.worldbank.org/indicator (Accessed May 22, 2023).
Zeb, A., Hamann, A., Armstrong, G. W., and Acuna-Castellanos, D. (2019). Identifying local actors of deforestation and forest degradation in the Kalasha valleys of Pakistan. Forest Policy Econ. 104, 56–64. doi: 10.1016/j.forpol.2019.04.005
Keywords: deforestation, afforestation, economic development, social development, forest area, GDP
Citation: Prochazka P, Abrham J, Cerveny J, Kobera L, Sanova P, Benes D, Fink J-M, Jiraskova E, Primasova S, Soukupova J and Smutka L (2023) Understanding the socio-economic causes of deforestation: a global perspective. Front. For. Glob. Change. 6:1288365. doi: 10.3389/ffgc.2023.1288365
Edited by:
Petra Pártlová, Institute of Technology and Business, CzechiaCopyright © 2023 Prochazka, Abrham, Cerveny, Kobera, Sanova, Benes, Fink, Jiraskova, Primasova, Soukupova and Smutka. This is an open-access article distributed under the terms of the Creative Commons Attribution License (CC BY). The use, distribution or reproduction in other forums is permitted, provided the original author(s) and the copyright owner(s) are credited and that the original publication in this journal is cited, in accordance with accepted academic practice. No use, distribution or reproduction is permitted which does not comply with these terms.
*Correspondence: Josef Abrham, YWJyaGFtakBwZWYuY3p1LmN6