 Yanlin Zhen1
 Xiuying Zhang2,3*Congguo Zhang1*Qian Gao2Jiaqi Dong2Liuzhen Zhang2Xuehe Lu4Yingying Wang5
- 1Spatial Planning Center, Yangtze Delta Region Institute of Tsinghua University, Zhejiang, Jiaxing, China
- 2International Institute for Earth System Science, Nanjing University, Nanjing, China
- 3Jiangsu Center for Collaborative Innovation in Geographical Information Resource Development and Application, Nanjing, China
- 4School of Geography Science and Geomatics Engineering, Suzhou University of Science and Technology, Suzhou, China
- 5Jiaxing City Land Space Planning Research Co., Ltd., Jiaxing, China
Introduction: Climate change and land use/cover changes (LUCC) greatly influenced terrestrial carbon sequestration.
Methods: This study evaluated the effects of climate change and LUCC on the carbon sequestration of forest ecosystems from 1991 to 2020 in the coastal area of China using a process-based global vegetation dynamic model (IBIS).
Results and discussion: The results showed that temperature had an increasing trend, with a rate of 0.02 °C yr−1; 20.00% of the forest coverage shifted spatially but there was only a 0.31% increase in total area. The carbon sequestration amounts by plants (net primary productivity, NPP) and the net carbon budget (net ecosystem productivity, NEP) in the coastal area of China in 2020 were 666.49 and 58.45 Tg C yr−1, respectively, which increased by 18.31% and 2509.30%, respectively, compared to the values in 1991. The increased forest ecosystem NPP and NEP were mainly due to climate change, while forest cover changes increased NPP by only 0.06% and NEP by 9.75% with a strong regional difference. The NPP showed a significant increasing trend, with a rate of 3.01 Tg C yr−1, which was positively correlated with temperature (0.43, p < 0.01) and precipitation (0.42, p < 0.01). However, the NEP largely varied during 1991-2020 and did not show a significant correlation with precipitation or temperature. These results provide scientific guidance for the government to enact environmental protection and low-carbon land use planning policies.
1. Introduction
Climate change has become one of the most serious environmental issues, primarily due to the large amount of carbon emissions from human activities released into the atmosphere (IPCC et al., 2021). Forest ecosystems comprise the largest terrestrial carbon pool and can take up approximately one-third of the anthropogenic carbon emissions (Pan et al., 2011; Friedlingstein et al., 2020). Forests play an important role in mitigating global changes by absorbing carbon from the atmosphere (Rumpel et al., 2018). However, the carbon sequestration of forest ecosystems is greatly influenced by climate factors and land use/cover changes (LUCCs), and the carbon sequestration of forest ecosystems presents strong spatial and temporal variations on a regional scale. Therefore, accurately quantifying the carbon sequestration of forest ecosystems is critical to enact effective measures to mitigate global warming.
Climate change strongly regulates the carbon sequestration of terrestrial ecosystems by affecting photosynthesis and respiration processes (Besnard et al., 2021). Previous studies have found that increasing temperatures extend the vegetation growth period, promote vegetation productivity, and strengthen carbon sequestration (Post et al., 2018; Cheng et al., 2021). However, heatwaves and droughts frequently occur, accompanied by increases in temperature. These factors are expected to have adverse effects on vegetation productivity and even change the role of forest ecosystems from carbon sequestration areas to emission sources (Reichstein et al., 2013; Verbesselt et al., 2016). Thus, the influences of climate change on the carbon sequestration of terrestrial ecosystems should be fully considered.
LUCCs are some of the main factors that influence the carbon cycle of terrestrial ecosystems. LUCC can directly influence carbon fluxes due to the different capacities of photosynthesis and respiration processes between different terrestrial ecosystems (Lai et al., 2016). Additionally, LUCC affects the amount of vegetation residue returned to the soil, which then affects the carbon capacity of the soil (Post and Kwon, 2000). In particular, if the vegetation cover is converted to built-up lands, carbon sequestration would decrease to zero (Chuai et al., 2015; Liu et al., 2019). China has experienced rapid urbanization and industrialization in recent years, and the conversion from forest and grasslands to built-up land accounted for 24–28% of the total expanded area during 2010–2020 in China (Ning et al., 2018; Kuang et al., 2022). The large area of LUCC during 1990–2010 decreased biomass carbon storage by 13.22 Tg C yr−1 and soil carbon storage by 11.50 Tg C yr−1 (Lai et al., 2016), built-up land expansion caused a 2.47 Tg C yr−1 carbon loss from vegetation in 1995–2010 (Chuai et al., 2015), urban expansion in 2000–2010 decreased the terrestrial carbon storage by 8.72 Tg C yr−1 (Liu et al., 2019), and built-up land expansion in 2000–2020 decreased the carbon sink fluxes by 4.95 Tg C yr−1 (Shi et al., 2023). These results indicated that LUCC, particularly the land use types that changed from vegetated cover to non-vegetated cover, decreased the carbon storage and carbon sinks in these terrestrial ecosystems.
On the other hand, forestland expanded in some areas, as China enacted a series of laws and regulations to reinforce forest protection and management in the 1990s. Since then, several ecological construction projects have been initiated to restore forests from farmlands (Feng et al., 2005; Wang et al., 2012). The effectiveness of these policies was confirmed by satellite observations. For example, 25% of the global net increase in leaf area during 2000–2017 was from China, and this increase was mainly from forest ecosystem expansion (Chen et al., 2019); forests and shrubs revealed obvious improvements in net primary production (NPP) in 2000–2021 in China (Yang C. et al., 2023). The expansion of forests enhanced the carbon sequestration in forest ecosystems.
Terrestrial carbon storages or sinks can be assessed by field surveys, ecosystem process modeling, remote-sensing techniques, inventories, and atmospheric inversion methods (Wang et al., 2012; Fu et al., 2022; Piao et al., 2022). Each method has its own advantages and limitations (Piao et al., 2022; Shi et al., 2023). For example, process-modeling methods are often used since this method can simulate carbon cycles under different climate condition scenarios, when examining the influences of climate change on carbon sinks of terrestrial ecosystems (Yang et al., 2016; Lu et al., 2019). Inventories are often used when detecting the influences of LUCC on carbon storages or sinks in terrestrial ecosystems (Liu et al., 2019; Fu et al., 2022). However, the fixed levels of carbon fluxes for each land use type in the inventory method often result in large uncertainties on a regional scale.
Coastal forests are in the marine–terrestrial transitional region, which has superior resources and environmental conditions for human living. The land use/cover in coastal regions has undergone tremendous changes since these areas have experienced rapid urbanization and industrialization in China. Moreover, coastal zones are experiencing prominent climate changes (Xu et al., 2020). The carbon sequestration of forest ecosystems in the coastal zone of China is influenced by the combined effects of climate change, deforestation, and afforestation. Most previous studies have focused on the influences of one or two factors on the carbon sinks of forest ecosystems (Lai et al., 2016; Xu et al., 2020). However, few studies have considered the combined effects of LUCC (particularly the location changes of forest ecosystems) and climate change on the carbon sinks of forest ecosystems in the coastal zone of China.
This study aimed to evaluate the combined effects of climate change and LUCC on the carbon sequestration of forest ecosystems during 1991–2020 in the coastal area of China. The spatial distribution of the carbon sink by plants and the net carbon sequestration of the forest ecosystem under three scenarios were simulated by a process-based model, the Integrated Biosphere Simulator (IBIS). The three scenarios were as follows: (a) only LUCC was considered, (b) only climate change was considered, and (c) both LUCC and climate change were considered. Then, the influences of climate change and LUCC on carbon emissions and sinks were determined in the study area. Detecting the long-term variations in carbon sequestration in forest ecosystems in coastal zones and understanding its driving factors are essential for developing efficient measures to optimize land use/cover planning, as low-carbon territorial and spatial planning have been recognized as the most efficient and low-cost ways to mitigate climate change (Lu et al., 2018).
2. Study area and methods
2.1. Coastal area in China
The 14 administrative regions located along the coastline in China were selected as the study area (Figure 1). Liaoning Province is located in Northeast China (NEC); Beijing, Tianjin, and Hebei Provinces are in North China (NC); Shandong, Jiangsu, Zhejiang, Fujian, and Taiwan are in East China (EC); and Guangdong Province, Guangxi Zhuang Autonomous Region, Hainan Province, Hong Kong, and Macao are in Southeast China (SEC). The study area was characterized by a monsoon climate, with temperate, subtropical, and tropical monsoon climates from north to south. Accordingly, the climate factors presented strong spatial variations. The temperature and precipitation increased from 8.6°C to 21.5°C and from 537.7 mm to 1660.7 mm, respectively, while the sunshine duration decreased from 2,600 h to 1,800 h from north to south (Wang et al., 2017).
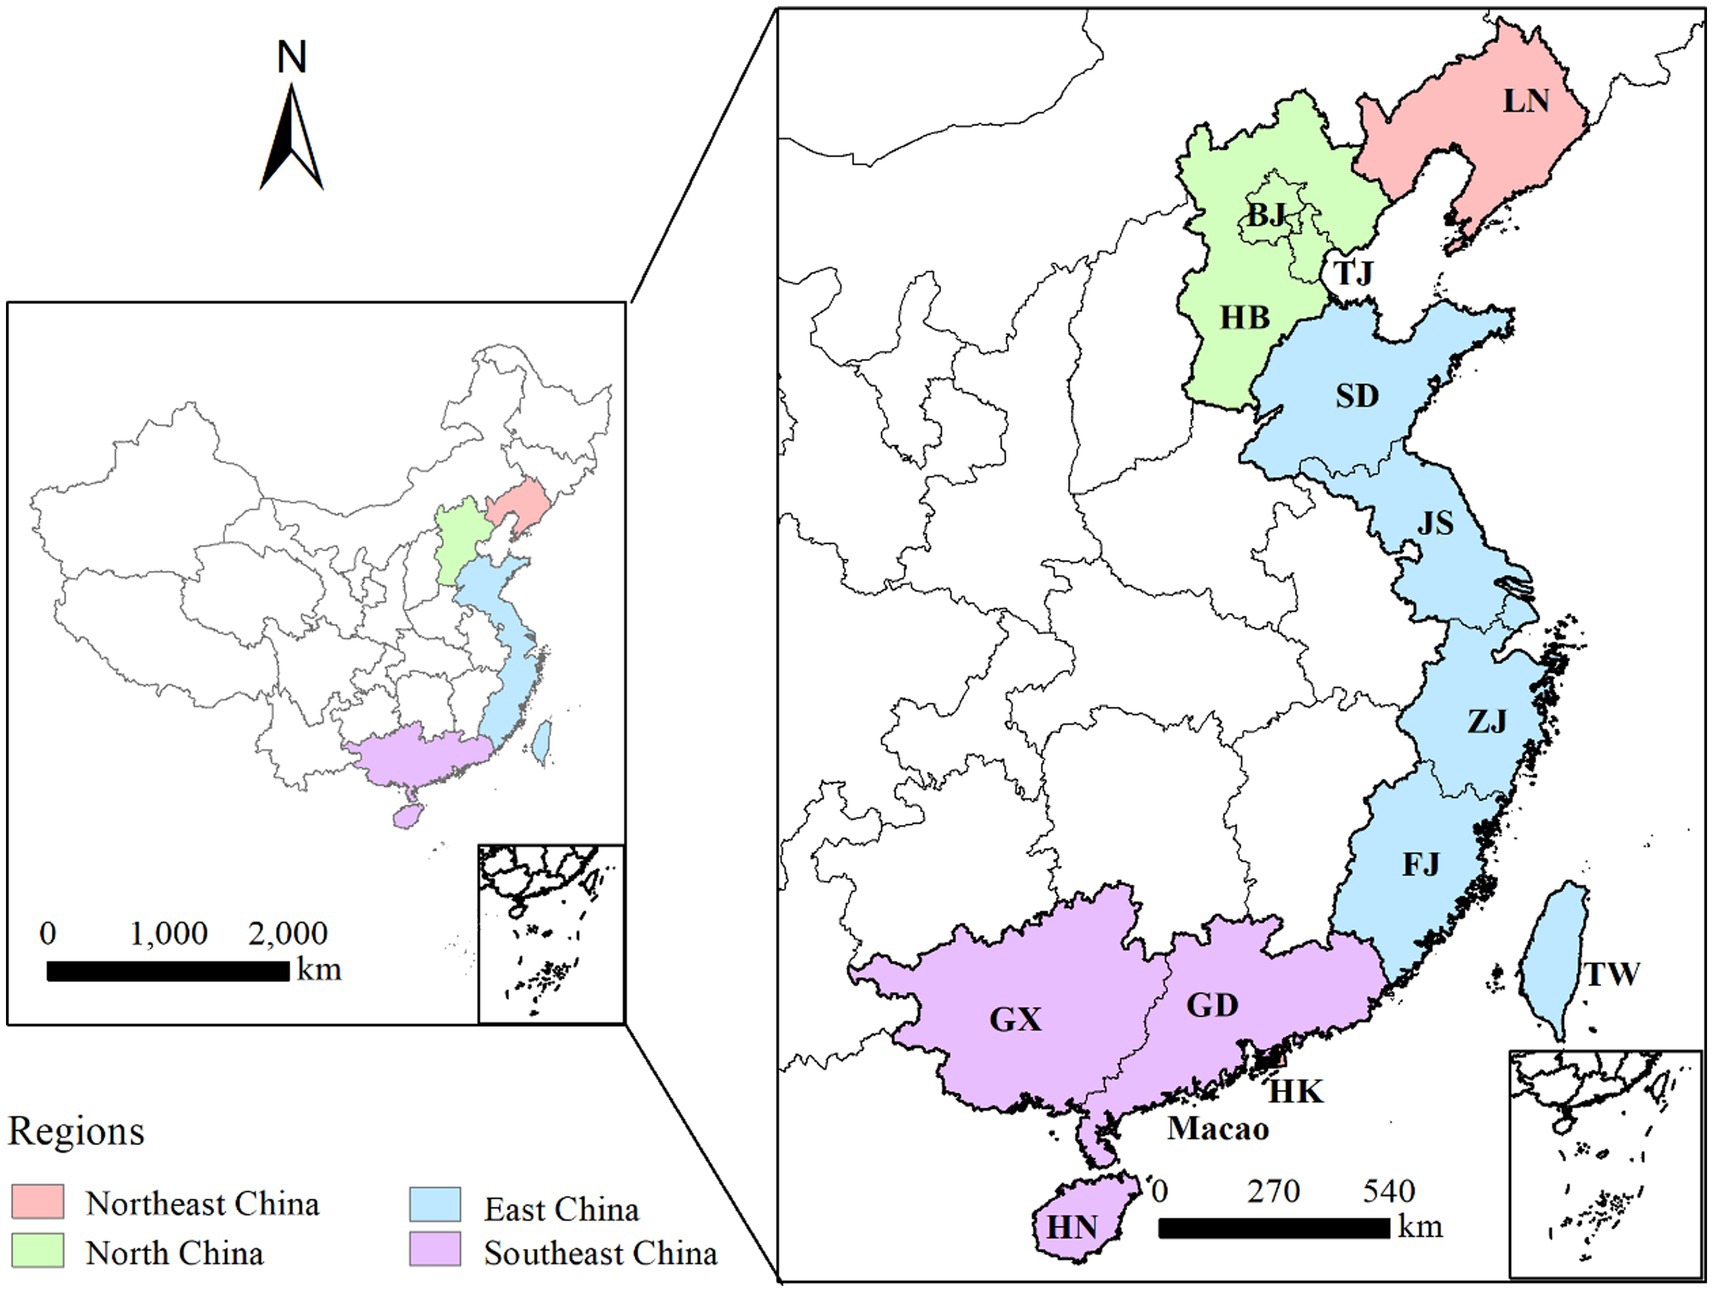
Figure 1. Coastal area in China. *LN, Liaoning Province; BJ, Beijing; TJ, Tianjin; HB, Hebei Province; SD, Shandong Province; JS, Jiangsu Province; ZJ, Zhejiang Province; FJ, Fujian Province; TW, Taiwan Province; GD, Guangdong Province; GX, Guangxi Zhuang Autonomous Region; HN, Hainan Province; HK, Hong Kong.
The coastal zone in China has an area of 132.7 × 10⁴ km2, accounting for about 14% of the national territory. However, the study area hosts 42% of the population in China and produces more than 60% of the national gross domestic product (GDP) (Xu, 2011). Due to rapid urbanization and industrialization, the land use/cover in these coastal regions has undergone tremendous changes. During 1996–2000 and 2000–2008, the woodland increased by 39,600 and 267,400 ha, respectively; on the other hand, it decreased by 314,000 during 2009–2015 in eight coastal provinces in China (Zhang et al., 2020). These data revealed that the forest cover greatly changed in location but might not have changed in total area.
2.2. Land use and land cover data
Land use and land cover data covering the coastal zone of China in 2000 and 2020 were used in this study to evaluate the effects of LUCC on the carbon sequestration of forest ecosystems. These data have a spatial resolution of 1 km × 1 km and were obtained from the Chinese Academy of Sciences Geography Science and Resource Institute.1 The land use/cover maps were obtained by expert knowledge-assisted human-computer interpretation methods based on the remote sensing images of Landsat TM/ETM/OLI, HJ-1 A + B, CBERS, and GF-2 (Xu et al., 2017; Ning et al., 2018; Kuang et al., 2022). The national territory was classified into 6 categories of land use at the first level and 25 subcategories at the second level. The dataset had a greater than 90% accuracy for the second-level land use maps, indicating that the land use/cover was reliable enough to be used for further analysis.
For the land use/cover dataset, the forest ecosystem is related to the woodland. Woodland is the first level of land use/cover and includes the four subcategories of forestland, shrubbery land, sparse forestland, and other forestland. Forestland refers to natural forest or planted forest with a canopy density (CD) greater than 30%; shrubbery land refers to shrub forests with a CD > 40% and a plant height < 2 m; sparse forestland refers to forestland with 10% < CD < 30%; and other forestland refers to early-successional forestland, slashes, nurseries, and various types of gardens (Xu et al., 2018). In this study, we considered the entire woodland category as the forest ecosystem.
2.3. Carbon budgets simulated for forest ecosystems
The process-based global vegetation dynamic model, IBIS, is used to simulate the carbon cycle processes for forest ecosystems. The IBIS model was developed by Foley et al. (1996). Considering the influences of atmospheric nitrogen depositions on the carbon cycle in the forest ecosystem, the modified version of this model (IBIS-CN) was used in this study (Liu et al., 2005). The input data were related to (a) historical metrological data, including monthly precipitation, temperature, cloud fraction, wind speed, number of wet days, and relative humidity; (b) soils, including the soil carbon content and texture; (c) vegetation types and cover fractions; and (d) terrain characteristics. Detailed information on the input data, simulation process, and output data has been described in our previous studies (Lu et al., 2016; Huang et al., 2021).
The IBIS simulations ranged from 1851 to 2020, from the pre-heating stage to the actual carbon budget simulation stage. The accuracy assessment of carbon budgets at regional and global scales has been fully conducted in previous studies, and they showed that IBIS could obtain reliable simulation results (Zhang et al., 2013; Lu et al., 2016, 2019). The simulated GPP, NPP, and NEP presented close relationships to ground observations or other model simulations (Lu et al., 2016).
Three different scenarios of LUCC and climate change conditions were used to drive the IBIS to evaluate the effects of climate change and LUCC on carbon sequestration in the forest ecosystems in the coastal area of China. In the first case, only the effect of climate change was considered and the land use/cover remained stable; in the second case, only the effect of LUCC was considered and the climate properties remained stable; in the third case, the effects of both LUCC and climate change were considered. The carbon budgets of the climate properties and forest cover in 1991 were considered the base levels.
The net primary productivity (NPP) and net ecosystem productivity (NEP) were used to indicate the carbon budgets of the forest ecosystems. NPP represents the carbon sink by plants, and NEP represents the annual change in carbon stored in the ecosystem. An NEP value higher than 0 indicates that the ecosystem functions as a carbon sink, while an NEP lower than 0 indicates that the forest ecosystem is a carbon source. The effects of climate change ( ), LUCC ( ), and both climate change and LUCC ( ) on carbon sequestration were evaluated by the following equations:
where is the simulation result of NPP or NEP under the land use/cover and climate properties in 1991; is the simulation result of NPP or NEP with forest cover remaining stable in 1991 and the actual climate properties; is the simulation result of NPP or NEP under the climate properties of 1991 and the actual land use/cover situation; and is the simulation result of NPP or NEP under the actual situations of land use/cover and climate properties.
3. Results and discussion
3.1. Impact of climate change on carbon sinks in forest ecosystems
Based on the woodland cover in 1991, the long-term variations in NPP and NEP in the coastal area of China over the last 30 years are shown in Figure 2. NPP had an increasing trend, with a rate of 3.0 Tg C yr−1. Similar results were obtained for the NPP of the terrestrial ecosystem, which increased during 1986–2015; and the normalized difference vegetation index (NDVI) showed greening during 1982–2019 in the coastal area of China (Xu et al., 2020; Jin et al., 2023). The NPP was positively correlated with precipitation (R = 0.42, p < 0.01) and temperature (R = 0.43, p < 0.01), indicating that the high temperature and precipitation amount increased carbon sequestration by plants.
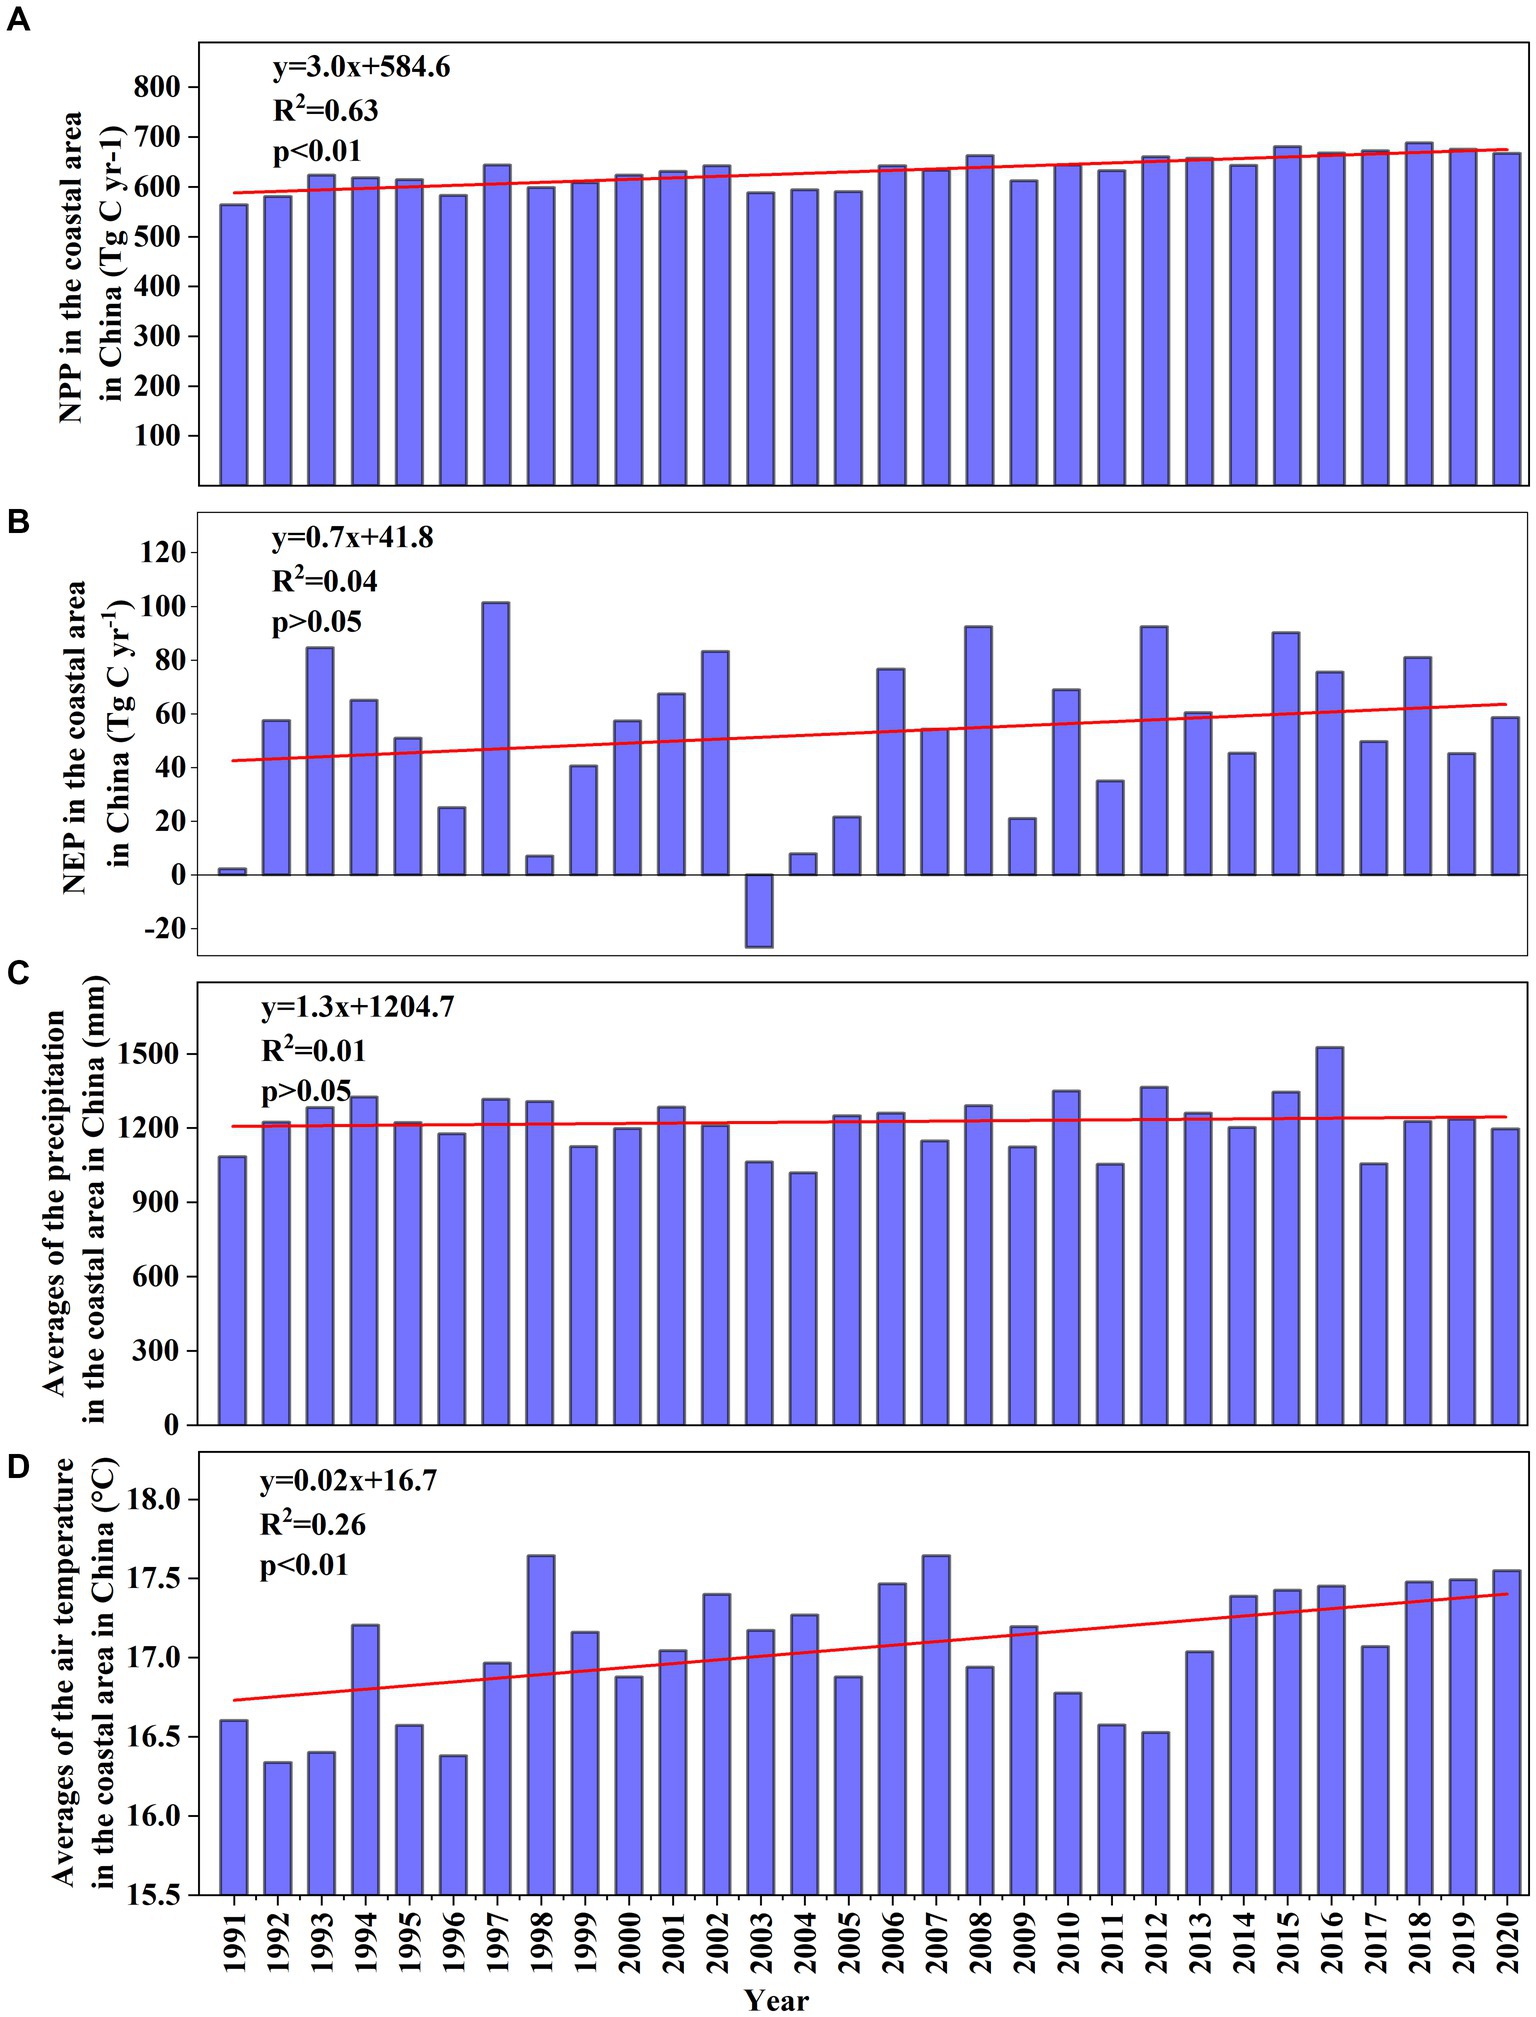
Figure 2. Long-term variations in NPP, NEP, temperature, and precipitation from 1991 to 2020 in the coastal area of China.
The yearly NEP was positively correlated with NPP, with a correlation coefficient of 0.68 (p < 0.01). The years with high NPP values also had high NEP values, and vice versa. The NEP was higher than 90 Tg C yr−1 in 1997, 2008, 2012, and 2015, when the NPP was higher than 640 Tg C yr−1. These years with high NEP values were characterized by high precipitation and relatively high temperatures. Low NEP values occurred in 1991, 1998, 2003, and 2004, and in these years, the NPP values were also low. These years with low NEP values had precipitation levels below 1,150 mm yr−1 and relatively high temperatures. The low precipitation limited the availability of water for forest growth (Yang et al., 2016; Calvo-Rodriguez et al., 2020). Furthermore, relatively dry and hot climate properties increased the soil respiration rate and then increased CO2 emissions (Yang et al., 2020), and the combined results of low precipitation and high temperature increased atmospheric dryness, which decreased plant growth (Shekhar et al., 2023). Therefore, low precipitation and high temperature were the main driving factors that decreased NEP in these years.
In particular, the NEP was negative in 2003 in the coastal zone, indicating that the forest ecosystems changed from carbon sinks to carbon sources (Grant et al., 2012). We compared the spatial distribution of NEP in 2003 with those in 1991, 2001, and 2011 (Supplementary Figure S1). The spatial pattern of NEP was very different in different years but was generally higher in the north than in the south. In particular, many southern coastal areas had negative NEP values. Great differences in the NEPs existed in ZJ and FJ Provinces. Most of the NEPs of the forest ecosystem in these two provinces were negative, and some of the NEPs in these regions were negative in 1991, but almost all of the NEPs were positive and high in 2011 and 2001. The lowest NEP in 2003 might have been because the precipitation (1034.1 mm) in 2003 in these two provinces was much lower than the average (1555.1 mm) in 1991–2020, and the temperature (19.3°C) was higher than the average (19.0°C) (Supplementary Figure S2). Dry and relatively hot climate conditions were the main drivers of NEP values below 0. These differences in NEPs in ZJ and FJ and almost all of the negative NEPs in SC resulted in the lowest NEP value in 2003 for the coastal area of China.
The NPP was generally relatively higher in the southern areas of SEC and SC than in NEC and NC in 1991 (Supplementary Figure S1 and Figure 3C). Increasing/decreasing trends (p < 0.05) of NPP covered most of the woodland in the study area and mainly presented increasing trends from 1991 to 2020 (Figure 3A). The increasing rates of NPP ranged from 0 to 11.8 g C m−2 yr−1, and the average was 5.7 g C m−2 yr−1. This rate of increase was lower than that of all terrestrial ecosystems in the coastal area during 1986–2015, which had an increasing rate of 1.67 g m−2 yr−1 (Xu et al., 2020). The regional characteristics of the NPP trends were in accordance with those of the NPP in 1991, indicating that the areas with high NPP values had a high potential for greening. SEC had the highest NPP increase rates, followed by EC, NEC, and NC (Figure 3C).
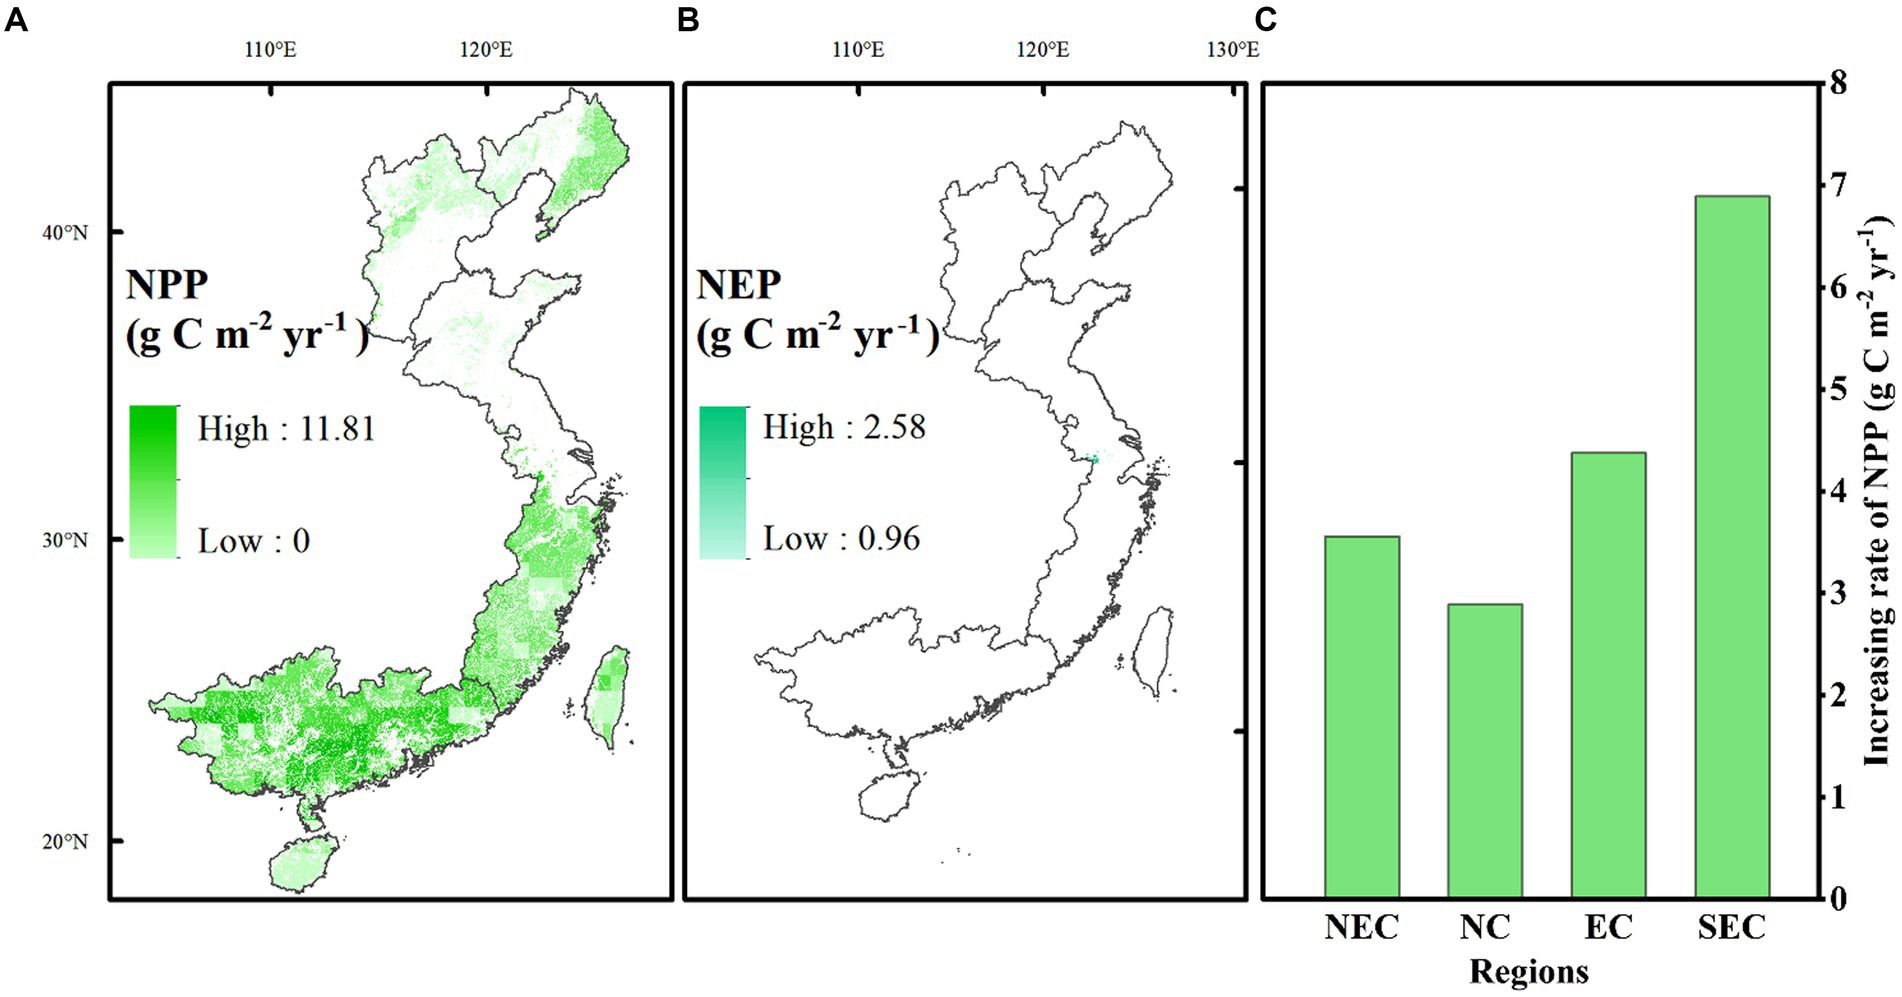
Figure 3. Changes in NPP and NEP between 1990 and 2020 in the coastal area of China. (A) indicates the spatial distribution of the change rates of NPP at the significance level of 0.05, (B) indicates the spatial distribution of the change rates of NEP at the significance level of 0.05, and (C) indicates the average NPP change rate in the four regions.
In contrast to the spatial distribution of the NPP, the NEP showed great differences in different years (Supplementary Figure S1), which was mainly determined by different climate conditions. Moreover, the NEP of the forest ecosystem did not show significant decreasing or increasing trends in most of the study area (Figure 3B). Only a small area in EC had an increasing NEP trend during 1991–2020. This pattern was mainly observed because the climate factors did not affect the carbon sink by plants but affected the CO2 emissions through soil respiration. Increasing temperature could increase both soil microbial respiration and carbon sinks by plants (Yang et al., 2020; Yang L. et al., 2023), and the variations in NEP were determined by the balance of these two factors.
3.2. Impact of land use/cover changes on carbon sinks in forest ecosystems
During 1991–2020, some woodland areas were converted to other land uses, and other land use types were converted from woodlands. Woodland expanded by 113,114 km2 from 1991 to 2020 due to ecological construction projects designed for the afforestation and restoration of forests (Zhang et al., 2020). However, woodland decreased by 111,388 km2, mainly driven by the rapid development of industrialization and urbanization. The reduced and increased forestland accounted for 20.00 and 19.70% of the total area of forestland in 1991, respectively. Specifically, the areas of forestland and other forestland increased, while the areas of shrubbery land and other forestland decreased (Figure 4). In total, woodland increased by 1726 km2 in 2020, accounting for 0.31% of the area of woodland in 1991. This result indicated that the woodland spatially changed in location, while the total area changed only slightly in the coastal zone of China.
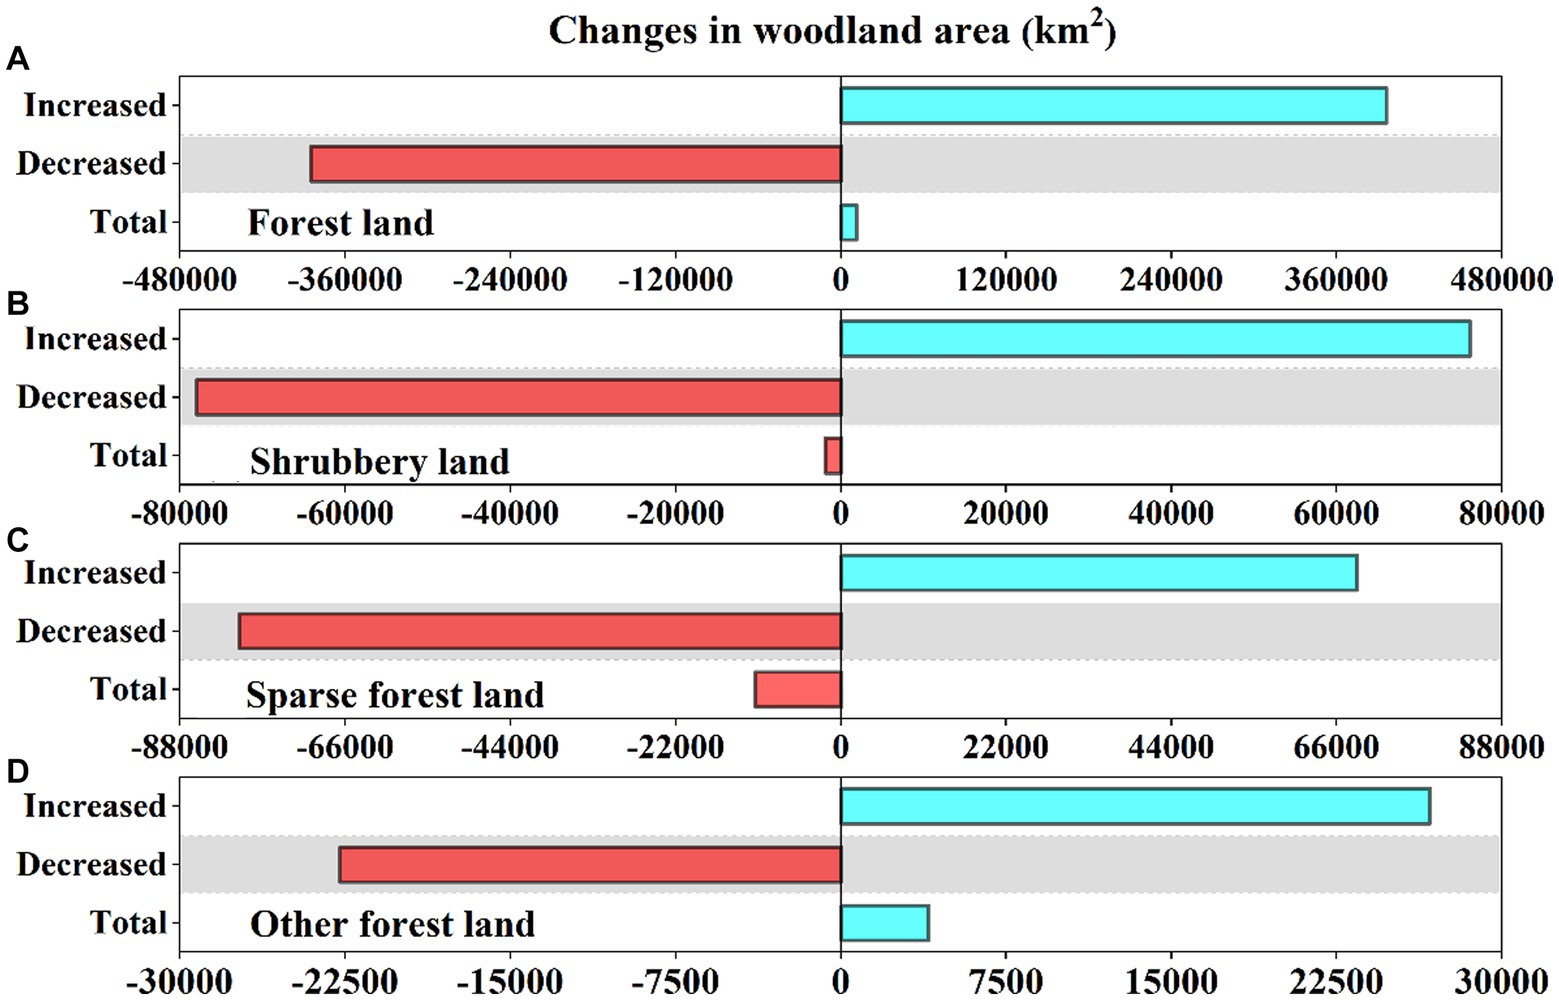
Figure 4. Changes in the woodland areas between 1991 and 2020 in the coastal area of China.
Of the reduced woodlands, approximately 85.02% were converted to farmland and grassland, approximately 9.61% were used for built-up land expansion, and the rest were mainly converted to water surfaces (Supplementary Table S1). Similarly, the increased woodland coverages were mainly converted from farmland and grassland, which accounted for 92.19% of the increased woodland. The large area of farmland converted to woodland was mainly driven by the “Grain for Green” project that began in 1999 (Feng et al., 2005). Notably, approximately 3.38% of the increased woodlands were from built-up lands, and were mainly reclaimed abandoned industrial and mining land or reconstructed rural settlements (Li et al., 2021).
Using the climate conditions in 1991 as the basis and the different spatial distributions of woodlands in 1991 and 2020, the NPP and NEP were mapped (Figure 5). Due to the different locations of some woodlands between 1991 and 2020, the NPP/NEP averages presented little difference. This was mainly because the changed locations of the woodlands were spread out throughout the entire study area and did not show regional characteristics.
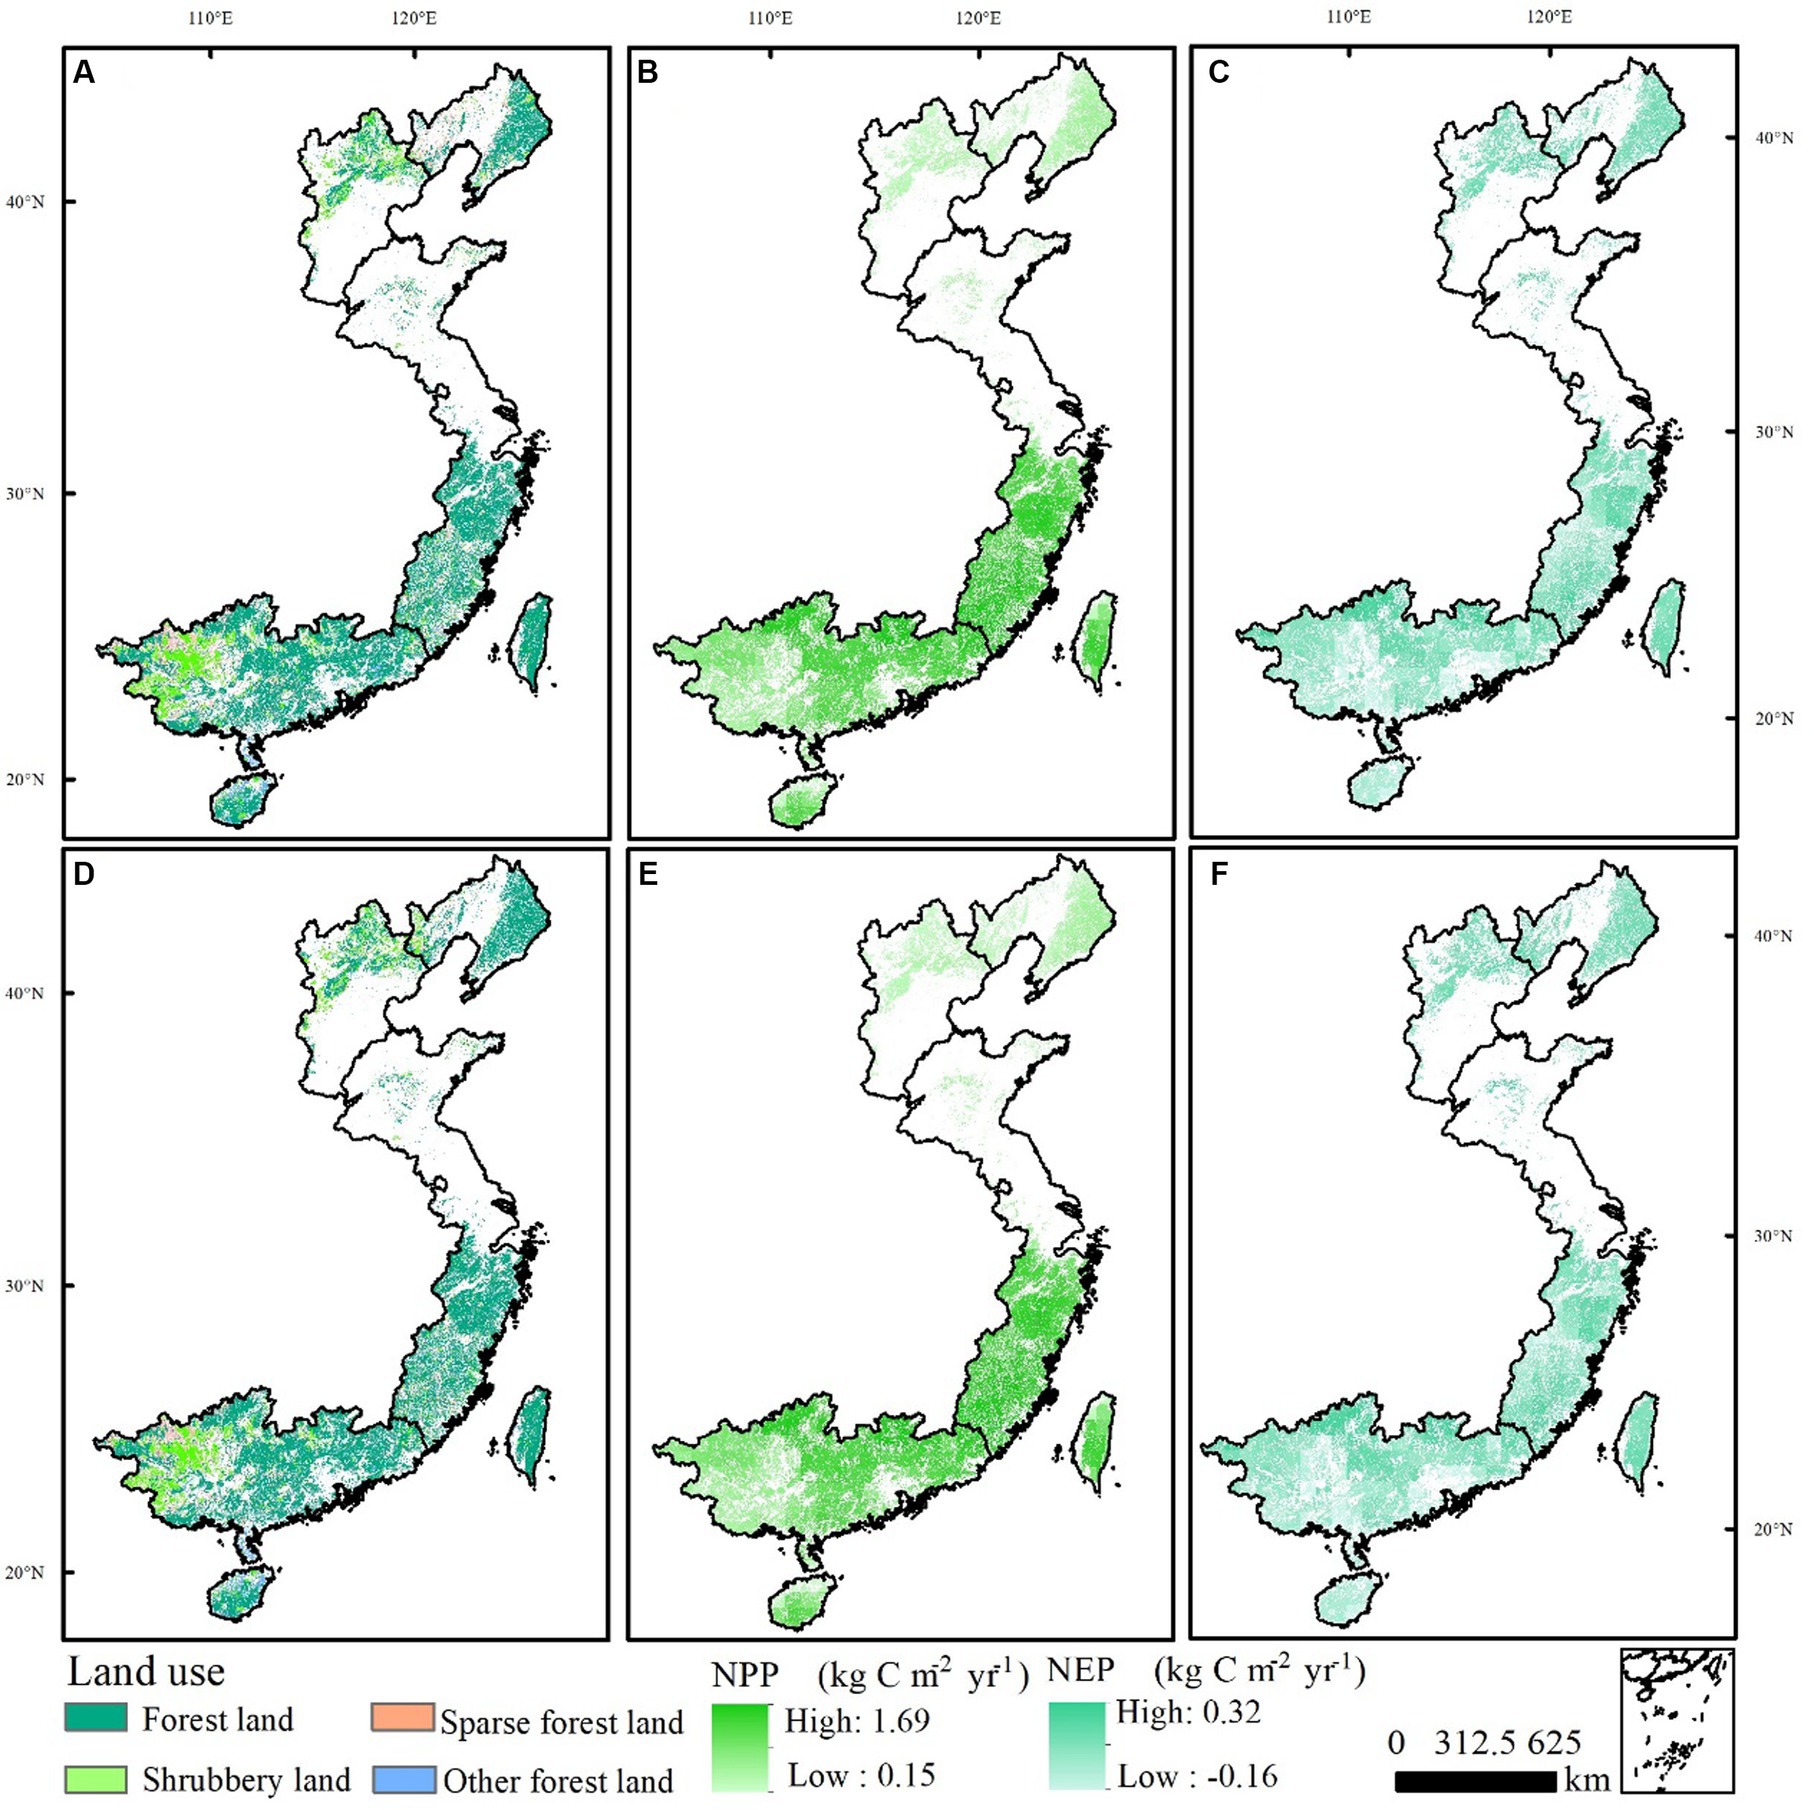
Figure 5. Spatial distribution of woodlands, NPP, and NEP in the coastal area of China considering only the influence of LUCC. (A) Woodland in 1991, (B) NPP in 1991, (C) NEP in 1991, (D) woodland in 2020, (E) NPP in 2020, and (F) NEP in 2020.
The NPP of the forest ecosystem in 1991 was relatively higher than that in 2020 (Table 1). The decreased NPP intensity accounted for 0.22% of the NPP in 1991. NEP presented a reversed trend, with a lower value in 1991 than in 2020. The increased NEP intensity accounted for 9.43% of the NEP in 1991. The difference in the NPP/NEP between 1991 and 2020 was mainly because the decreased and increased woodlands in these two years were located at different locations. The NPP/NEP intensity showed strong spatial variations since the soil physical characteristics, climate conditions, and vegetation types greatly influenced the NPP/NEP (He et al., 2019; Houghton, 2020). These results indicated that the changes in the woodland distributions increased the NEP but decreased the NPP from 1991 to 2020 in the coastal area of China.
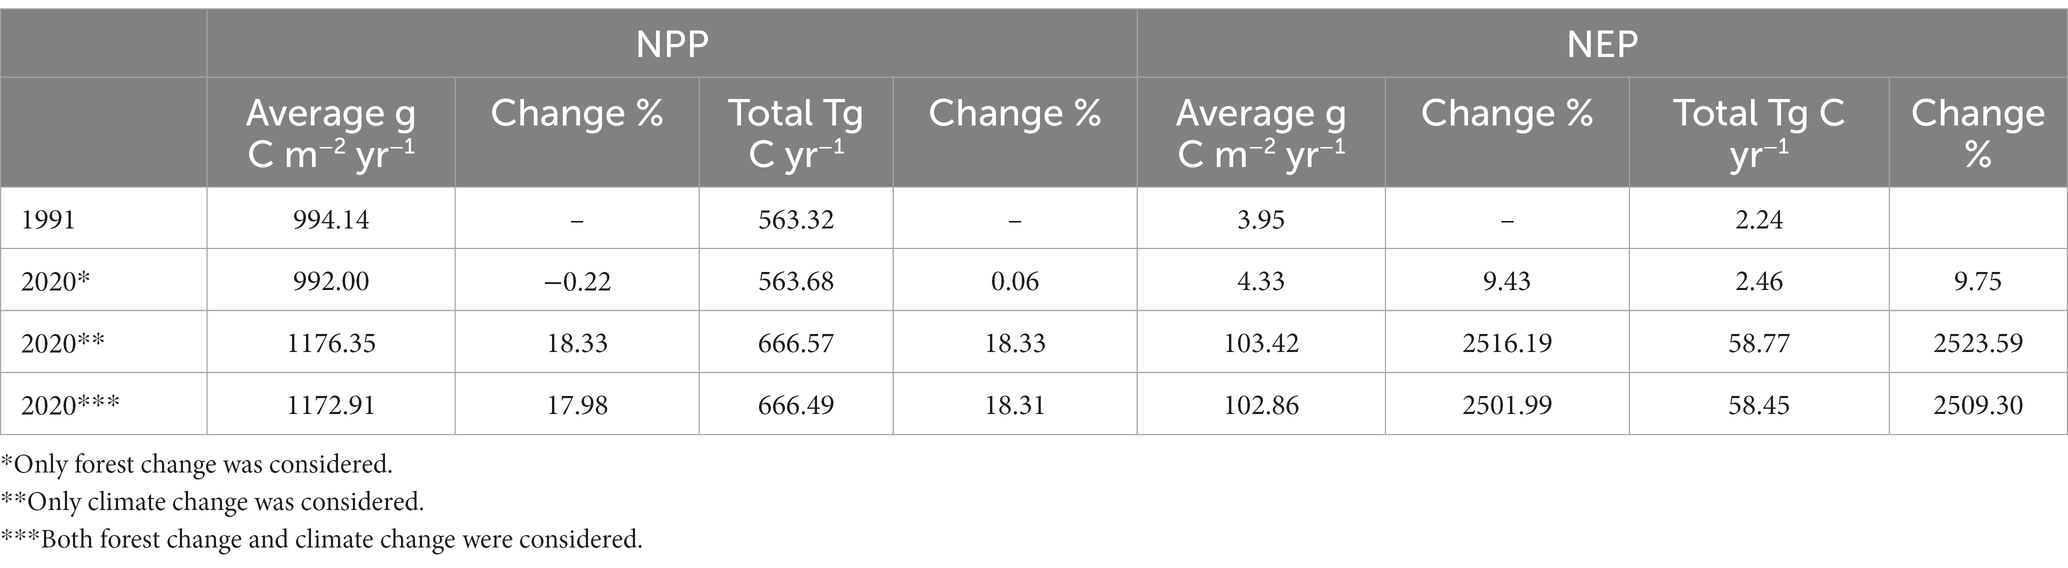
Table 1. Averages and total carbon sinks of the forest ecosystem in 1991 and 2020 under woodland cover and climate change.
Combining the differences in the NPP/NEP intensities and the woodland areas in 1991 and 2020 in the coastal area of China, the NPP was 563.32 vs. 563.68 Tg C yr−1 if the difference in the woodland cover between these two years was considered. The two carbon sink values by plants were close since the expanded woodland coverage offset the decreased NPP intensity in 2020. This result indicated that the changes in woodlands during the last 30 years did not have much influence on the carbon sinks of plants. The total NEP of the forest ecosystem in 1991 and 2020 in the coastal area was 2.24 and 2.46 Tg C yr−1, respectively, showing that the net carbon sink increased by 0.22 Tg C yr−1 due to woodland cover changes.
For the four regions, the NPP values in 1991 and 2020 were positive, indicating that the forest ecosystem functioned as a carbon sink due to plants. In 2020, the NPP in the NEC, NC, and EC regions increased, while it showed a slight decrease in SEC, comparing with those in 1991 (Figure 6). The NEP in SEC was negative, indicating that the forest ecosystems functioned as carbon sources in this region. The NEP increased in 2020 compared with that in 1991 in SEC, indicating lower carbon emissions in this region in 2020. The NEP increased in NEC and NC but decreased in EC. These results indicated that the influence of woodland changes on the carbon budgets of forest ecosystems presented spatial variations. The spatial heterogeneity of the changed carbon sinks in terrestrial ecosystems induced by the LUCC should be fully considered when the government conducts low-carbon land spatial planning.
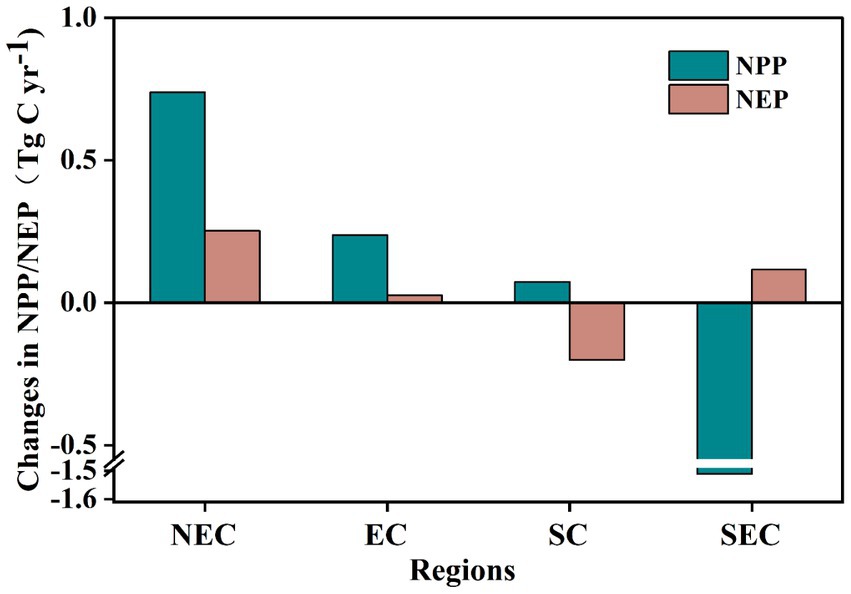
Figure 6. Changes in the NPP and NEP between 1991 and 2020 by forest cover changes in the four regions of the coastal area of China.
3.3. Combined effects of climate change and LUCC on carbon budgets of forest ecosystems
The spatial distribution of woodlands, the NPP and the NEP of the forest ecosystem simulated by IBIS based on the climate conditions and land use/cover in 2020 in the coastal areas are shown in Figures 7A–C. The woodland covered 568,233 km2, accounting for 42.83% of the study area. The average forest coverage ratio in the coastal area was much higher than the national average (24.02%) (Office of the National Afforestation Committee, 2023). For the four categories of woodlands, forestland accounted for 69.77%, shrubbery and sparse forestland accounted for 25.52%, and other forestland accounted for the remaining 4.71% of the area (Figure 7D).
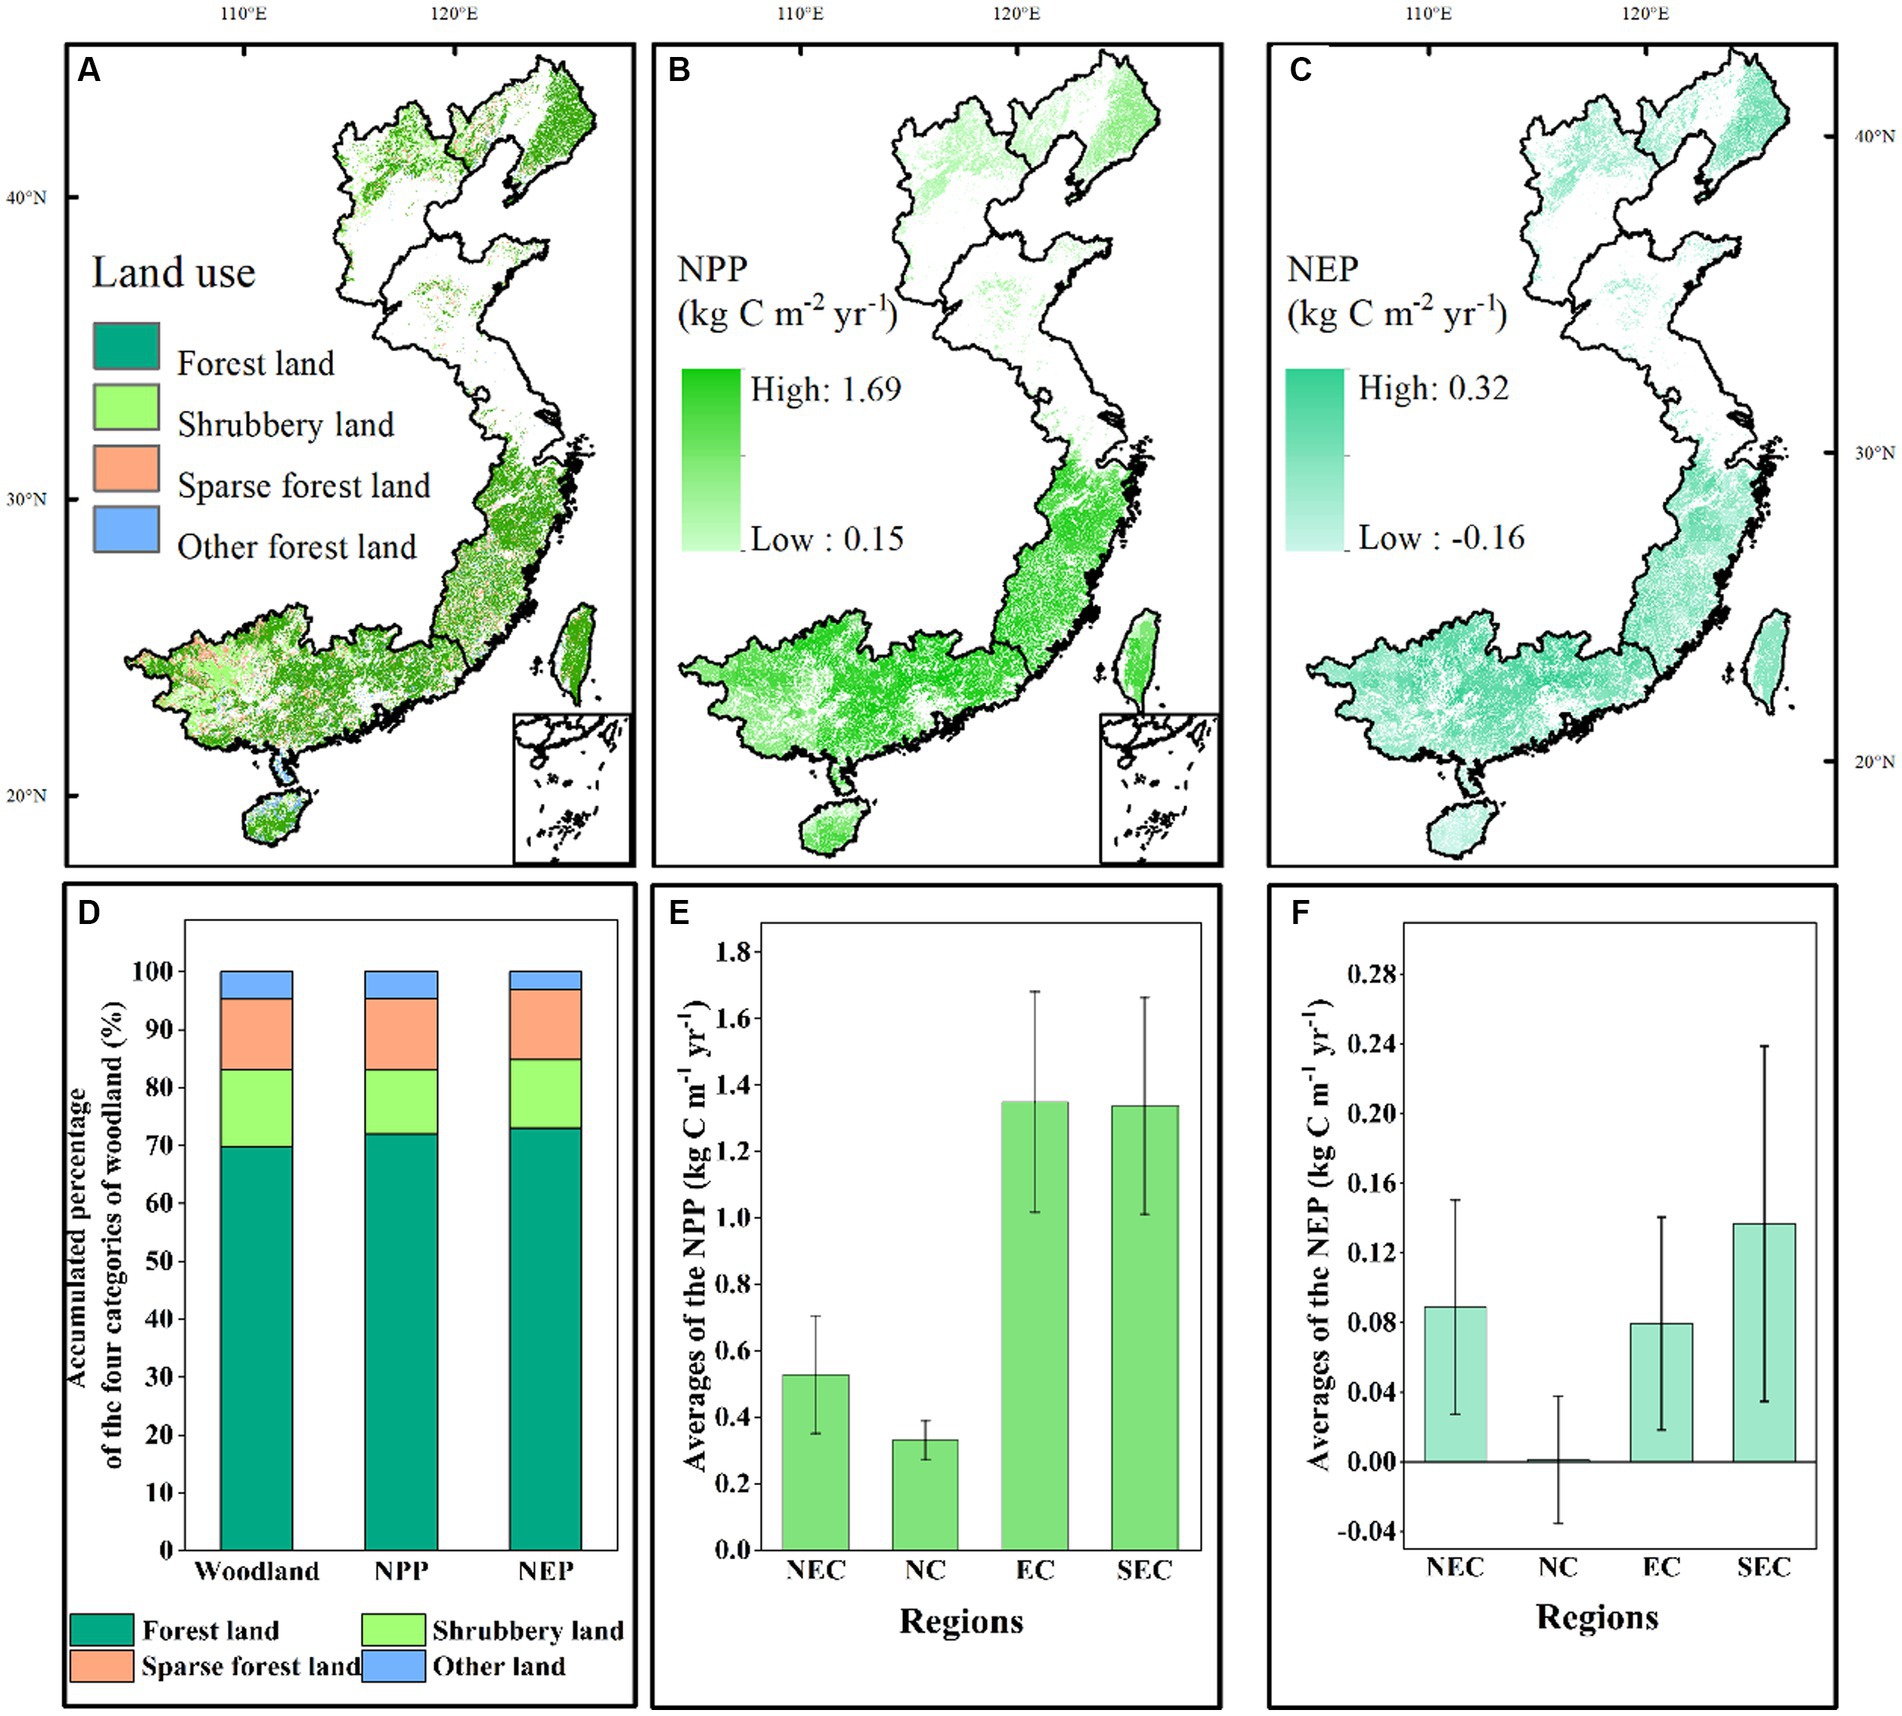
Figure 7. Woodland, NPP, and NEP in 2020 considering both climate change and LUCC in the coastal area of China. (A–C) indicates the spatial distribution of the four categories of woodland, NPP, and NEP; (E) indicates the accumulated percentage of the four categories of woodland for the areas, NPP, and NEP; (E,F) indicates the average NPP and NEP in the four regions.
The average NPP in the coastal area of China was 1.17 kg C m−2 yr−1, and the NEP was 0.10 kg C m−2 yr−1. The NPP and NEP presented similar spatial variations, increasing from north to south. All NPPs in the study area were positive, indicating that the sequestration of carbon by plants was positive. Most of the study area had positive NEP values, indicating that the forest ecosystems in these areas functioned as carbon sinks. This result was in accordance with the fact that eastern China has positive NEP values (He et al., 2019). The regions in the south of EC and SEC had NPP and NEP values approximately three times those in the northern regions of NEC and NC (Figures 7E,F). Similar phenomena were found in the NPP values obtained by satellites (Xu et al., 2020), which was mainly due to the higher temperature and precipitation in the south than in the north (Wang et al., 2017). In particular, NC had the lowest NPP and NEP values among the four regions, mainly due to the relatively low precipitation. Moreover, EC had a relatively high NPP value but a low NEP value, indicating that this region was both a high carbon sink due to its vegetation and a carbon source due to carbon emissions from soil respiration.
Considering the uneven spatial distribution of the woodland, NPP, and NEP, the total NPP and NEP values in the coastal area of China were 666.49 Tg C yr−1 and 58.45 Tg C yr−1, respectively. These values accounted for approximately 17.44 and 17.01% of the national NPP and NEP, respectively (Huang et al., 2021). For the total NPP and NEP, 92.88 and 90.61% were contributed from EC and SEC, respectively, due to the relatively larger areas of woodland coverage and higher averages in the south than in the north. Moreover, forestland contributed more than 70% of the total NPP and NEP, since this category of woodland had the largest area and the highest NPP and NEP averages among the four woodland types (Supplementary Figure S3). Forest ecosystems and sparse forest ecosystems had higher NPP and NEP values than did shrubbery and other forest ecosystems, which was mainly due to the different kinds of plants having different carbon sink potentials and carbon emission intensities (Thurner et al., 2016).
Comparing the NPP/NEP in 1991 (Figures 5B,C) and those in 2020 (Figures 7B,C), the average NPP across the study area increased by 178.78 g m−2 yr−1. The increase in NPP from 1991 to 2020 was due to both woodland changes and climate change, accounting for 17.98% of the average NPP in 1991. As discussed in Section 3.2, the average NPP in 2020 was 2.14 g m−2 yr−1 lower than that in 1991 due to woodland changes. Therefore, climate change increased the NPP by 18.33% in 1991. Considering a smaller increase in the woodland area in 2020 than in 1991, the influence of climate and woodland changes on the total carbon sink by the forest ecosystem showed similar trends with those of the average NPP. In total, the land use/cover changes and climate change increased the carbon sink provided by vegetation in the coastal area by 18.31% from 1991 to 2020.
In sharp contrast to the NPP, climate and land use changes greatly influenced the NEP. The average NEP in 2020 increased by 2509.30% that in 1991, which was mainly due to climate change. As shown in Figure 2, 1991 had a relatively low NEP value among the last 30 years. The woodland changes increased the net carbon sink in the forest ecosystem by 9.75% in 2020 compared with that in 1991 (Table 1). Comparing the influence of woodland changes and climate change on the NPP and NEP in the coastal area of China during the last 30 years, climate change had a much stronger influence than land use changes; moreover, the NEP did not show a stable trend since it was greatly influenced by climate factors, which also presented large variations.
4. Conclusion
The present study evaluated the effects of climate change and land use changes on the carbon sinks of forest ecosystems in the coastal area of China from 1991 to 2020 using a process-based global vegetation dynamic model. The results showed that during the last 30 years, the woodland areas mainly changed in terms of where they were located, while the total area remained approximately the same. The temperature presented an increasing trend, while precipitation did not. Combining the climate change and LUCC, the carbon sink by plants presented significant increasing trends, and climate change and LUCC together increased the NPP of forest ecosystems by 18.31% in 2020 compared with 1991. The NEP of the forest ecosystem presented large variations during the last 30 years, and this variation was much more influenced by climate change than by land use changes.
Certainly, there were some inevitable uncertainties in the evaluation results. The uncertainties in the data on the climate conditions and land use/cover could introduce uncertainty into the evaluation results. The land use/cover data in 1991 and 2020 were identified from satellite imagery, and the land use/cover had some uncertainties. Additionally, the climate data used in the study included temperature and precipitation, which were observed at meteorological stations. Although these observations were considered to reflect the true conditions, the collection samples, measurements, and the process of converting the point data to surface data still introduced uncertainties. The second source of uncertainty was from the simulation process of the IBIS. Since the process-based model requires a large amount of input data, including the soil properties, climate properties, land cover, and terrain, the accuracy of these input data will greatly influence the simulation results of the carbon budgets. Therefore, these uncertainties should be considered in future studies.
Data availability statement
Publicly available datasets were analyzed in this study. This data can be found here: The land use and land cover data were obtained from the Chinese Academy of Sciences Geography Science and Resource Institute (http://www.resdc.cn/DataList.aspx). The land use/cover maps were obtained by expert knowledge-assisted human-computer interaction interpretation methods, based on the remote sensing imageries of Landsat TM/ETM/OLI, HJ-1 A + B, CBERS, and GF-2.
Author contributions
YZ: Conceptualization, Methodology, Visualization, Writing – original draft. XZ: Conceptualization, Formal analysis, Investigation, Methodology, Writing – review & editing. CZ: Conceptualization, Formal analysis, Writing – review & editing. QG: Formal analysis, Investigation, Writing – review & editing, Data curation. JD: Data curation, Formal analysis, Writing – review & editing, Visualization. LZ: Validation, Writing – review & editing, Investigation. XL: Data curation, Investigation. YW: Investigation.
Funding
The author(s) declare financial support was received for the research, authorship, and/or publication of this article. This work was supported by the Basic Research Program of Jiangsu Province (No. BK20211156) and the National Natural Science Foundation of China (42371378).
Acknowledgments
The authors gratefully acknowledge the Chinese Academy of Sciences Geography Science and Resource Institute for the land use/cover data, the National Meteorological Information Center for the Daily value data set of Chinese ground climate data (V3.0), and the International Institute for Applied Systems Analysis (IIASA) for the Harmonized World Soil Database (version 1.2).
Conflict of interest
YW was employed by Jiaxing City Land Space Planning Research Co., Ltd.
The remaining authors declare that the research was conducted in the absence of any commercial or financial relationships that could be construed as a potential conflict of interest.
Publisher’s note
All claims expressed in this article are solely those of the authors and do not necessarily represent those of their affiliated organizations, or those of the publisher, the editors and the reviewers. Any product that may be evaluated in this article, or claim that may be made by its manufacturer, is not guaranteed or endorsed by the publisher.
Supplementary material
The Supplementary material for this article can be found online at: https://www.frontiersin.org/articles/10.3389/ffgc.2023.1271239/full#supplementary-material
Footnotes
References
Besnard, S., Santoro, M., Cartus, O., Fan, N., Linscheid, N., Nair, R., et al. (2021). Global sensitivities of forest carbon changes to environmental conditions. Glob. Chang. Biol. 27, 6467–6483. doi: 10.1111/gcb.15877
Calvo-Rodriguez, S., Kiese, R., and Sánchez-Azofeifa, G. A. (2020). Seasonality and budgets of soil greenhouse gas emissions from a tropical dry Forest successional gradient in Costa Rica. J. Geophys. Res. Biogeo. 125:e005647. doi: 10.1029/2020JG005647
Chen, C., Park, T., Wang, X., Piao, S., Xu, B., Chaturvedi, R. K., et al. (2019). China and India lead in greening of the world through land-use management. Nat. Sustain. 2, 122–129. doi: 10.1038/s41893-019-0220-7
Cheng, M., Jin, J., and Jiang, H. (2021). Strong impacts of autumn phenology on grassland ecosystem water use efficiency on the Tibetan plateau. Ecol. Indic. 126:107682. doi: 10.1016/j.ecolind.2021.107682
Chuai, X., Huang, X., Lu, Q., Zhang, M., Zhao, R., and Lu, J. (2015). Spatiotemporal changes of built-up land expansion and carbon emissions caused by the Chinese construction industry. Environ. Sci. Technol. 49, 13021–13030. doi: 10.1021/acs.est.5b01732
Feng, Z., Yang, Y., Zhang, Y., Zhang, P., and Li, Y. (2005). Grain-for-green policy and its impacts on grain supply in West China. Land Use Policy 22, 301–312. doi: 10.1016/j.landusepol.2004.05.004
Foley, J. A., Prentice, I. C., Ramankutty, N., Levis, S., Pollard, D., Sitch, S., et al. (1996). An integrated biosphere model of land surface processes, terrestrial carbon balance, and vegetation dynamics. Glob. Biogeochem. Cycles 10, 603–628. doi: 10.1029/96GB02692
Friedlingstein, P., O'Sullivan, M., Jones, M. W., Andrew, R. M., Hauck, J., Olsen, A., et al. (2020). Global carbon budget 2020. Earth Syst. Sci. Data 12, 3269–3340. doi: 10.5194/essd-12-3269-2020
Fu, Q., Gao, M., Wang, Y., Wang, T., Bi, X., and Chen, J. (2022). Spatiotemporal Patterns and Drivers of the Carbon Budget in the Yangtze River Delta Region, China. Land 11:1230. doi: 10.3390/land11081230
Grant, R. F., Baldocchi, D. D., and Ma, S. (2012). Ecological controls on net ecosystem productivity of a seasonally dry annual grassland under current and future climates: modelling with ecosys. Agric. For. Meteorol. 152, 189–200. doi: 10.1016/j.agrformet.2011.09.012
He, H., Wang, S., Zhang, L., Wang, J., Ren, X., Zhou, L., et al. (2019). Altered trends in carbon uptake in China's terrestrial ecosystems under the enhanced summer monsoon and warming hiatus. Natl. Sci. Rev. 6, 505–514. doi: 10.1093/nsr/nwz021
Houghton, R. A. (2020). Terrestrial fluxes of carbon in GCP carbon budgets. Glob. Change Biol. 26, 3006–3014. doi: 10.1111/gcb.15050
Huang, X., Zhang, X., Lu, X., Wang, P., Qin, J., Jiang, Y., et al. (2021). Land development and utilization for carbon neutralization. J. Nat. Resour. 36:2995. doi: 10.31497/zrzyxb.20211201
IPCCMasson-Delmotte, V., Zhai, P. A., Pirani, S. L. C., Péan, C., Berger, S., et al. (2021). “Climate change 2021: the physical science basis. Contribution of Working Group I to the Sixth Assessment Report of the Intergovernmental Panel on Climate Change”, in: Cambridge University Press.).
Jin, Y., Jin, K., Wang, F., Liu, C., Qin, P., Zong, Q., et al. (2023). Impacts of climate change and human activities on NDVI change in eastern coastal areas of China. Environ. Sci. 44, 3329–3342. doi: 10.13227/j.hjkx.202207039
Kuang, W., Zhang, S., Du, G., Yan, C., Wu, S., Li, R., et al. (2022). Remotely sensed mapping and analysis of spatio-temporal patterns of land use change across China in 2015-2020. Acta Geograph. Sin. 77:1056. doi: 10.11821/dlxb202205002
Lai, L., Huang, X., Yang, H., Chuai, X., Zhang, M., Zhong, T., et al. (2016). Carbon emissions from land-use change and management in China between 1990 and 2010. Sci. Adv. 2:e1601063. doi: 10.1126/sciadv.1601063
Li, J., Lo, K., Zhang, P., and Guo, M. (2021). Reclaiming small to fill large: a novel approach to rural residential land consolidation in China. Land Use Policy 109:105706. doi: 10.1016/j.landusepol.2021.105706
Liu, J., David, T. P., and Jing, M. C. (2005). Nitrogen controls on ecosystem carbon sequestration: a model implementation and application to Saskatchewan, Canada. Ecol. Model. 186, 178–195. doi: 10.1016/j.ecolmodel.2005.01.036
Liu, X., Wang, S., Wu, P., Feng, K., Hubacek, K., Li, X., et al. (2019). Impacts of urban expansion on terrestrial carbon storage in China. Environ. Sci. Technol. 53, 6834–6844. doi: 10.1021/acs.est.9b00103
Lu, F., Hu, H., Sun, W., Zhu, J., Liu, G., Zhou, W., et al. (2018). Effects of national ecological restoration projects on carbon sequestration in China from 2001 to 2010. Proc. Natl. Acad. Sci. 115, 4039–4044. doi: 10.1073/pnas.1700294115
Lu, X., Jiang, H., Liu, J., Zhang, X., Jin, J., Zhu, Q., et al. (2016). Simulated effects of nitrogen saturation the global carbon budget using the IBIS model. Sci. Rep. 6, 1–10. doi: 10.1038/srep39173
Lu, X., Ju, W., Jiang, H., Zhang, X., Liu, J., Sherba, J., et al. (2019). Effects of nitrogen deposition on water use efficiency of global terrestrial ecosystems simulated using the IBIS model. Ecol. Indic. 101, 954–962. doi: 10.1016/j.ecolind.2019.02.014
Ning, J., Liu, J., Kuang, W., Xu, X., Zhang, S., Yan, C., et al. (2018). Spatiotemporal patterns and characteristics of land-use change in China during 2010–2015. J. Geogr. Sci. 28, 547–562. doi: 10.1007/s11442-018-1490-0
Office of the National Afforestation Committee (2023). 2022 China Land Greening Status Bulletin. Available at: https://www.gov.cn/
Pan, Y., Birdsey, R. A., Fang, J., Houghton, R., Kauppi, P. E., Kurz, W. A., et al. (2011). A large and persistent carbon sink in the World’s forests. Science 333, 988–993. doi: 10.1126/science.1201609
Piao, S. L., He, Y., Wang, X. H., and Chen, F. H. (2022). Estimation of China's terrestrial ecosystem carbon sink: methods, progress and prospects. Sci. China Earth Sci. 65, 641–651. doi: 10.1007/s11430-021-9892-6
Post, W. M., and Kwon, K. C. (2000). Soil carbon sequestration and land-use change: processes and potential. Glob. Chang. Biol. 6, 317–327. doi: 10.1046/j.1365-2486.2000.00308.x
Post, E., Steinman, B. A., and Mann, M. E. (2018). Acceleration of phenological advance and warming with latitude over the past century. Sci. Rep. 8:3927. doi: 10.1038/s41598-018-22258-0
Reichstein, M., Bahn, M., Ciais, P., Frank, D., Mahecha, M. D., Seneviratne, S. I., et al. (2013). Climate extremes and the carbon cycle. Nature 500, 287–295. doi: 10.1038/nature12350
Rumpel, C., Amiraslani, F., Koutika, L. S., Smith, P., Whitehead, D., and Wollenberg, E. (2018). Put more carbon in soils to meet Paris climate pledges. Nature 564, 32–34. doi: 10.1038/d41586-018-07587-4
Shekhar, A., Hörtnagl, L., Buchmann, N., and Gharun, M. (2023). Long-term changes in forest response to extreme atmospheric dryness. Glob. Chang. Biol. 29, 5379–5396. doi: 10.1111/gcb.16846
Shi, S. H., Zhu, L. P., Luo, Z. H., and Qiu, H. (2023). Quantitative analysis of the contributions of climatic and anthropogenic factors to the variation in net primary productivity, China. Remote Sens. 15:789. doi: 10.3390/Rs15030789
Thurner, M., Beer, C., Carvalhais, N., Forkel, M., Santoro, M., Tum, M., et al. (2016). Large-scale variation in boreal and temperate forest carbon turnover rate related to climate. Geophys. Res. Lett. 43, 4576–4585. doi: 10.1002/2016GL068794
Verbesselt, J., Umlauf, N., Hirota, M., Holmgren, M., Van Nes, E. H., Herold, M., et al. (2016). Remotely sensed resilience of tropical forests. Nat. Clim. Chang. 6, 1028–1031. doi: 10.1038/nclimate3108
Wang, J., Chen, Y., Shao, X., Zhang, Y., and Cao, Y. (2012). Land-use changes and policy dimension driving forces in China: present, trend and future. Land Use Policy 29, 737–749. doi: 10.1016/j.landusepol.2011.11.010
Wang, X., Hou, X., and Wang, Y. (2017). Spatiotemporal variations and regional differences of extreme precipitation events in the coastal area of China from 1961 to 2014. Atmos. Res. 197, 94–104. doi: 10.1016/j.atmosres.2017.06.022
Xu, S. (2011). A preliminary study on the development stage and basic ideas of China's strategic marine emerging industries. Mar. Econ. 1, 6–11. doi: 10.19426/j.cnki.cn12-1424/p.2011.02.002
Xu, X., Jiang, H., Guan, M., Wang, L., Huang, Y., Jiang, Y., et al. (2020). Vegetation responses to extreme climatic indices in coastal China from 1986 to 2015. Sci. Total Environ. 744:140784. doi: 10.1016/j.scitotenv.2020.140784
Xu, X., Liu, J., Zhang, S., Li, R., Yan, C., and Wu, S. (2018). China’s multi-period land use land cover remote SensingMonitoring data set (CNLUCC) [online]. [].
Xu, X., Liu, J., Zhang, Z., Zhou, W., Zhang, S., Li, R., et al. (2017). A time series land ecosystem classification dataset of China in five-year increments (1990-2010). J. Glob. Change Data Disc. 1, 52–59. doi: 10.3974/geodp.2017.01.08
Yang, K., Gong, H., Li, J., Liu, Y., Sha, L., Song, Q., et al. (2020). Dynamic characteristics of soil respiration of savanna ecosystem in dry hot valley of Yuanjiang. J. Zhejiang A&F Univ. 37, 849–859. doi: 10.11833/j.issn.2095-0756.20190647
Yang, Y., Ma, Y., Jiang, H., Zhu, Q. A., Liu, J., and Peng, C. (2016). Evaluating the carbon budget pattern of Chinese terrestrial ecosystem from 1960 to 2006 using integrated biosphere simulator. Acta Ecol. Sin. 36, 3911–3922. doi: 10.5846/stxb201410262092
Yang, L., Pan, J., Wang, J., Tian, D., Zhang, C., Zhao, X., et al. (2023). Soil microbial respiration adapts to higher and longer warming experiments at the global scale. Environ. Res. Lett. 18:034044. doi: 10.1088/1748-9326/acbecb
Yang, C., Zhai, G., Fu, M., and Sun, C. (2023). Spatiotemporal characteristics and influencing factors of net primary production from 2000 to 2021 in China. Environ. Sci. Pollut. Res. 30, 91084–91094. doi: 10.1007/s11356-023-28666-8
Zhang, Z., Jiang, H., Liu, J., Ju, W., and Zhang, X. (2013). Effect of heterogeneous atmospheric CO2 on simulated global carbon budget. Glob. Planet. Chang. 101, 33–51. doi: 10.1016/j.gloplacha.2012.12.002
Keywords: forest carbon sequestration, climate change, land use/cover changes, IBIS model, coastal area of China
Citation: Zhen Y, Zhang X, Zhang C, Gao Q, Dong J, Zhang L, Lu X and Wang Y (2023) Effects of climate change and land use/cover changes on carbon sequestration in forest ecosystems in the coastal area of China. Front. For. Glob. Change. 6:1271239. doi: 10.3389/ffgc.2023.1271239
Edited by:
Lisu Chen, Shanghai Maritime University, ChinaCopyright © 2023 Zhen, Zhang, Zhang, Gao, Dong, Zhang, Lu and Wang. This is an open-access article distributed under the terms of the Creative Commons Attribution License (CC BY). The use, distribution or reproduction in other forums is permitted, provided the original author(s) and the copyright owner(s) are credited and that the original publication in this journal is cited, in accordance with accepted academic practice. No use, distribution or reproduction is permitted which does not comply with these terms.
*Correspondence: Xiuying Zhang, emhhbmd4eUBuanUuZWR1LmNu; Congguo Zhang, emNnOTZAMTYzLmNvbQ==