 Chuanwu Zhao
 Yaozhong Pan
 Xiufang Zhu1,2
- 1State Key Laboratory of Remote Sensing Science, Faculty of Geographical Science, Beijing Normal University, Beijing, China
- 2Key Laboratory of Environmental Change and Natural Disasters of Chinese Ministry of Education, Beijing Normal University, Beijing, China
- 3Beijing Engineering Research Center for Global Land Remote Sensing Products, Faculty of Geographical Science, Beijing Normal University, Beijing, China
- 4Academy of Plateau Science and Sustainability, Qinghai Normal University, Xining, China
- 5School of Management, Guangdong University of Technology, Guangzhou, China
Many countries and regions are currently developing new forest strategies to better address the challenges facing forest ecosystems. Timely and accurate monitoring of deforestation events is necessary to guide tropical forest management activities. Synthetic aperture radar (SAR) is less susceptible to weather conditions and plays an important role in high-frequency monitoring in cloudy regions. Currently, most SAR image-based deforestation identification uses manually supervised methods, which rely on high quality and sufficient samples. In this study, we aim to explore radar features that are sensitive to deforestation, focusing on developing a method (named 3DC) to automatically extract deforestation events using radar multidimensional features. First, we analyzed the effectiveness of radar backscatter intensity (BI), vegetation index (VI), and polarization feature (PF) in distinguishing deforestation areas from the background environment. Second, we selected the best-performing radar features to construct a multidimensional feature space model and used an unsupervised K-mean clustering method to identify deforestation areas. Finally, qualitative and quantitative methods were used to validate the performance of the proposed method. The results in Paraguay, Brazil, and Mexico showed that (1) the overall accuracy (OA) and F1 score (F1) of 3DC were 88.1–98.3% and 90.2–98.5%, respectively. (2) 3DC achieved similar accuracy to supervised methods without the need for samples. (3) 3DC matched well with Global Forest Change (GFC) maps and provided more detailed spatial information. Furthermore, we applied the 3DC to deforestation mapping in Paraguay and found that deforestation events occurred mainly in the second half of the year. To conclude, 3DC is a simple and efficient method for monitoring tropical deforestation events, which is expected to serve the restoration of forests after deforestation. This study is also valuable for the development and implementation of forest management policies in the tropics.
1. Introduction
Forests cover 4.06 billion hectares, almost one-third of the global land area (Hansen et al., 2013; Smith et al., 2023). According to the Global Forest Resources Assessment (FRA) data report, an estimated 420 million hectares of forests have been lost to deforestation globally between 1990 and 2020 (Arévalo et al., 2020; Smith et al., 2023). Of these, more than 90% occurred in the tropics, with an average annual deforestation of 9.28 million hectares in 2015–2020 (Smith et al., 2023). Deforestation in the Brazilian Amazon has increased by 52% in the last 20 years (Silva et al., 2023). Rapid forest loss has also been observed in Eurasia and Africa (Mitchell et al., 2017). From 1985 to 2015, deforestation accounted for 20.17% of total forest destruction in Canada (Hermosilla et al., 2019). In South Asia, total forest loss area was estimated at 29.62% between 1930 and 2014 (Sudhakar Reddy et al., 2018). Over the past 40 years, deforestation in India, Bangladesh, Sri Lanka and Nepal was 27,655, 2,482, 1,281, and 3,095 km2, respectively (Sudhakar Reddy et al., 2018). Carbon emissions from tropical deforestation increase the global mean temperature (Hansen et al., 2013; Arévalo et al., 2020) and provide negative feedback to human activities through climate change, such as floods and wildfires (Duveiller et al., 2008; Giam, 2017; Bousquet et al., 2022; Smith et al., 2023). Moreover, tropical deforestation leads to the loss of biological habitats and biodiversity, posing a serious threat to global ecological security (Xu et al., 2012; Eivazi et al., 2015; Watanabe et al., 2018; Huang et al., 2019). To mitigate global warming, a number of international conventions and initiatives have been developed to achieve carbon neutrality, such as the Reducing Emissions from Deforestation and Forest Degradation (REDD+) framework and the Sustainable Development Goals (SDGs) (Muthee et al., 2022; Sugimoto et al., 2022; Tang et al., 2023). Timely and accurate mapping deforested area is essential to for initiating appropriate forest management activities (such as reforestation). Satellite remote sensing is an effective earth observation technology as it provides objective records, wide coverage, and frequent observations (Xiao et al., 2019; Lechner et al., 2020; Zhao and Pan, 2023). However, current remote sensing-based deforestation mapping methods still face many challenges (e.g., poor timeliness, labor intensity), especially in the tropics.
Many studies have applied space sensors to monitor forest change in specific regions, tropical rainforests, and even globally (Hou et al., 2013; Lehmann et al., 2015). The Moderate Resolution Imaging Spectroradiometer (MODIS) sensor provides satisfactory temporal coverage in tropical areas with frequent cloud cover (Tang et al., 2019, 2020), but many small-scale deforestation events are missed due to its low resolution (Tarazona et al., 2018). MODIS missed up about half of forest changes compared to Landsat image (Hansen and Loveland, 2012). Landsat images are widely used as data source for forest monitoring (Shimizu et al., 2019; Smith et al., 2019; De Marzo et al., 2021; Cai et al., 2023), but frequent cloud cover in the tropics makes the data unusable (Guimarães et al., 2018), especially during monsoons (Ballère et al., 2021). As a result, optical satellite-based forest monitoring systems fail to detect new deforestation events in a timely manner (Rignot et al., 1997; Reiche et al., 2015; Sugimoto et al., 2022; Tang et al., 2023). Synthetic aperture radar (SAR) operates at microwave frequencies, is less susceptible to cloud and rain interference and has better temporal resolution for monitoring tropical deforestation events (Lehmann et al., 2015; Ballère et al., 2021; Zhao et al., 2022).
Methods used in deforestation area identification research can be divided into change detection methods (Tang et al., 2023) and classification-based methods (Ortega Adarme et al., 2022; Slagter et al., 2023). In recent years, change detection methods have proven to be effective in identifying deforestation areas (Chen et al., 2021; Ygorra et al., 2021; Cardille et al., 2022). Such an approach is a promising method to accurately identify deforestation areas from SAR images (Motohka et al., 2014; Reiche et al., 2015, 2018; Zhao et al., 2022), as more observations describing vegetation seasonality and deforestation are helpful to achieve more accurate results (Shimabukuro et al., 2014; Zhu, 2017; Arévalo et al., 2020; Bullock et al., 2020; Decuyper et al., 2022). Classification-based methods mainly combine advanced classifiers with remote sensing features to map deforested areas, including machine learning algorithms and deep learning algorithms (Ghulam et al., 2014; Magdon et al., 2014; Grecchi et al., 2017; Shumilo et al., 2020; Liang et al., 2023). However, most of these methods are supervised methods that rely on training samples, and their accuracy is heavily depend on the quality and quantity of the samples (McRoberts, 2014; Zhang et al., 2022; Zhao and Pan, 2023). Collecting training samples is time-consuming and labor-intensive and is often impractical in hard-to-reach rainforest areas (de Oliveira et al., 2011; David et al., 2022). In addition, due to model or algorithm limitations, the deforested areas identified by these two methods have delayed effects that cannot meet the timeliness requirements of deforestation monitoring.
Overall, for deforestation events in the tropics, existing methods cannot avoid human involvement and sample support. To address the existing limitations, this study aims to develop an automated method for deforestation detection using Sentinel-1 SAR data. Our specific objectives are as follows: (1) explore the sensitive SAR features that distinguish the deforestation area from the background environment, (2) develop an automatic identification method for forest deforestation areas by constructing a feature space model based on the sensitive SAR features; and (3) apply the proposed method to map the deforestation dynamics of specific areas and reveal their deforestation history. Overall, this study provides an accurate and automated method for monitoring deforestation events in the tropics, which helps to stop malicious deforestation activities. In addition, our study provides a theoretical reference for the formulation of forest management policies, which is conducive to timely management and restoration after deforestation.
2. Principle of 3DC
Radar backscatter intensities (BIs) are closely related to vegetation biophysical parameters (Reiche et al., 2018) and are widely used to identify deforested areas (Doblas et al., 2020; Ygorra et al., 2021). Besides the BIs, vegetation index (VI) and polarization feature (PF) are widely used for the quantitative description of forest parameters, including aboveground biomass (AGB) and canopy structure (CS) (Koch, 2010; Cutler et al., 2012; Xu et al., 2012; Fremout et al., 2022; Sugimoto et al., 2022).
Studies have revealed that radar backscatter intensity decreases after deforestation, with VH being more pronounced than VV (Sugimoto et al., 2022; Borlaf-Mena et al., 2023). Partial deforestation changes the radar signal less than obvious deforestation (Lei et al., 2018; Hethcoat et al., 2021). Considering the change in “vegetation”–“deforested area,” the VIs and PFs provide more information that is conducive to identifying deforested areas. First, this “vegetation”– “deforested area” variation is a direct result of AGB loss, and VIs can be a more valid indicator of AGB (Chang et al., 2018; Periasamy, 2018). Second, there are secondary reflections between the tree canopy and the tree trunks, and forests mainly show volume scattering (Sugimoto et al., 2022). In deforested areas, the removal of trees mainly manifests as surface scattering.
We used sample data to count the distribution of deforested and forested areas on the above three types of radar features (Supplementary Figure 1). We found that for each type of radar feature, there was a partial overlap between deforested areas and forests (Supplementary Figure 1A). Therefore, it is difficult to determine an appropriate threshold to distinguish deforested areas from forests. We showed the distribution of sample points in the three-dimensional (3D) spatial model formed by BI, VI and PF (Supplementary Figure 1B). We found that the discrimination between deforested and forested areas increased seemingly. The deforested area was mainly distributed in the lower part of the 3D space, while the forest area was located in the upper part of the 3D space.
Based on the above analysis, we constructed a three-dimensional (3D) feature space model using three types of features from Sentinel-1 radar data, and coupled it with a clustering algorithm to develop a simple and efficient deforestation area identification method (3DC) (Figure 1B). In this study, we chose the K-means clustering algorithm because it is a classical unsupervised learning method with the advantages of simple implementation form and low linear complexity (De Luca et al., 2021; Maurya et al., 2021). Notably, we also constructed feature space models in other dimensions (see section “3.4.1. Comparison with other feature combination strategies”) to demonstrate the performance of the proposed method. The technical flowchart is shown in Figure 1.
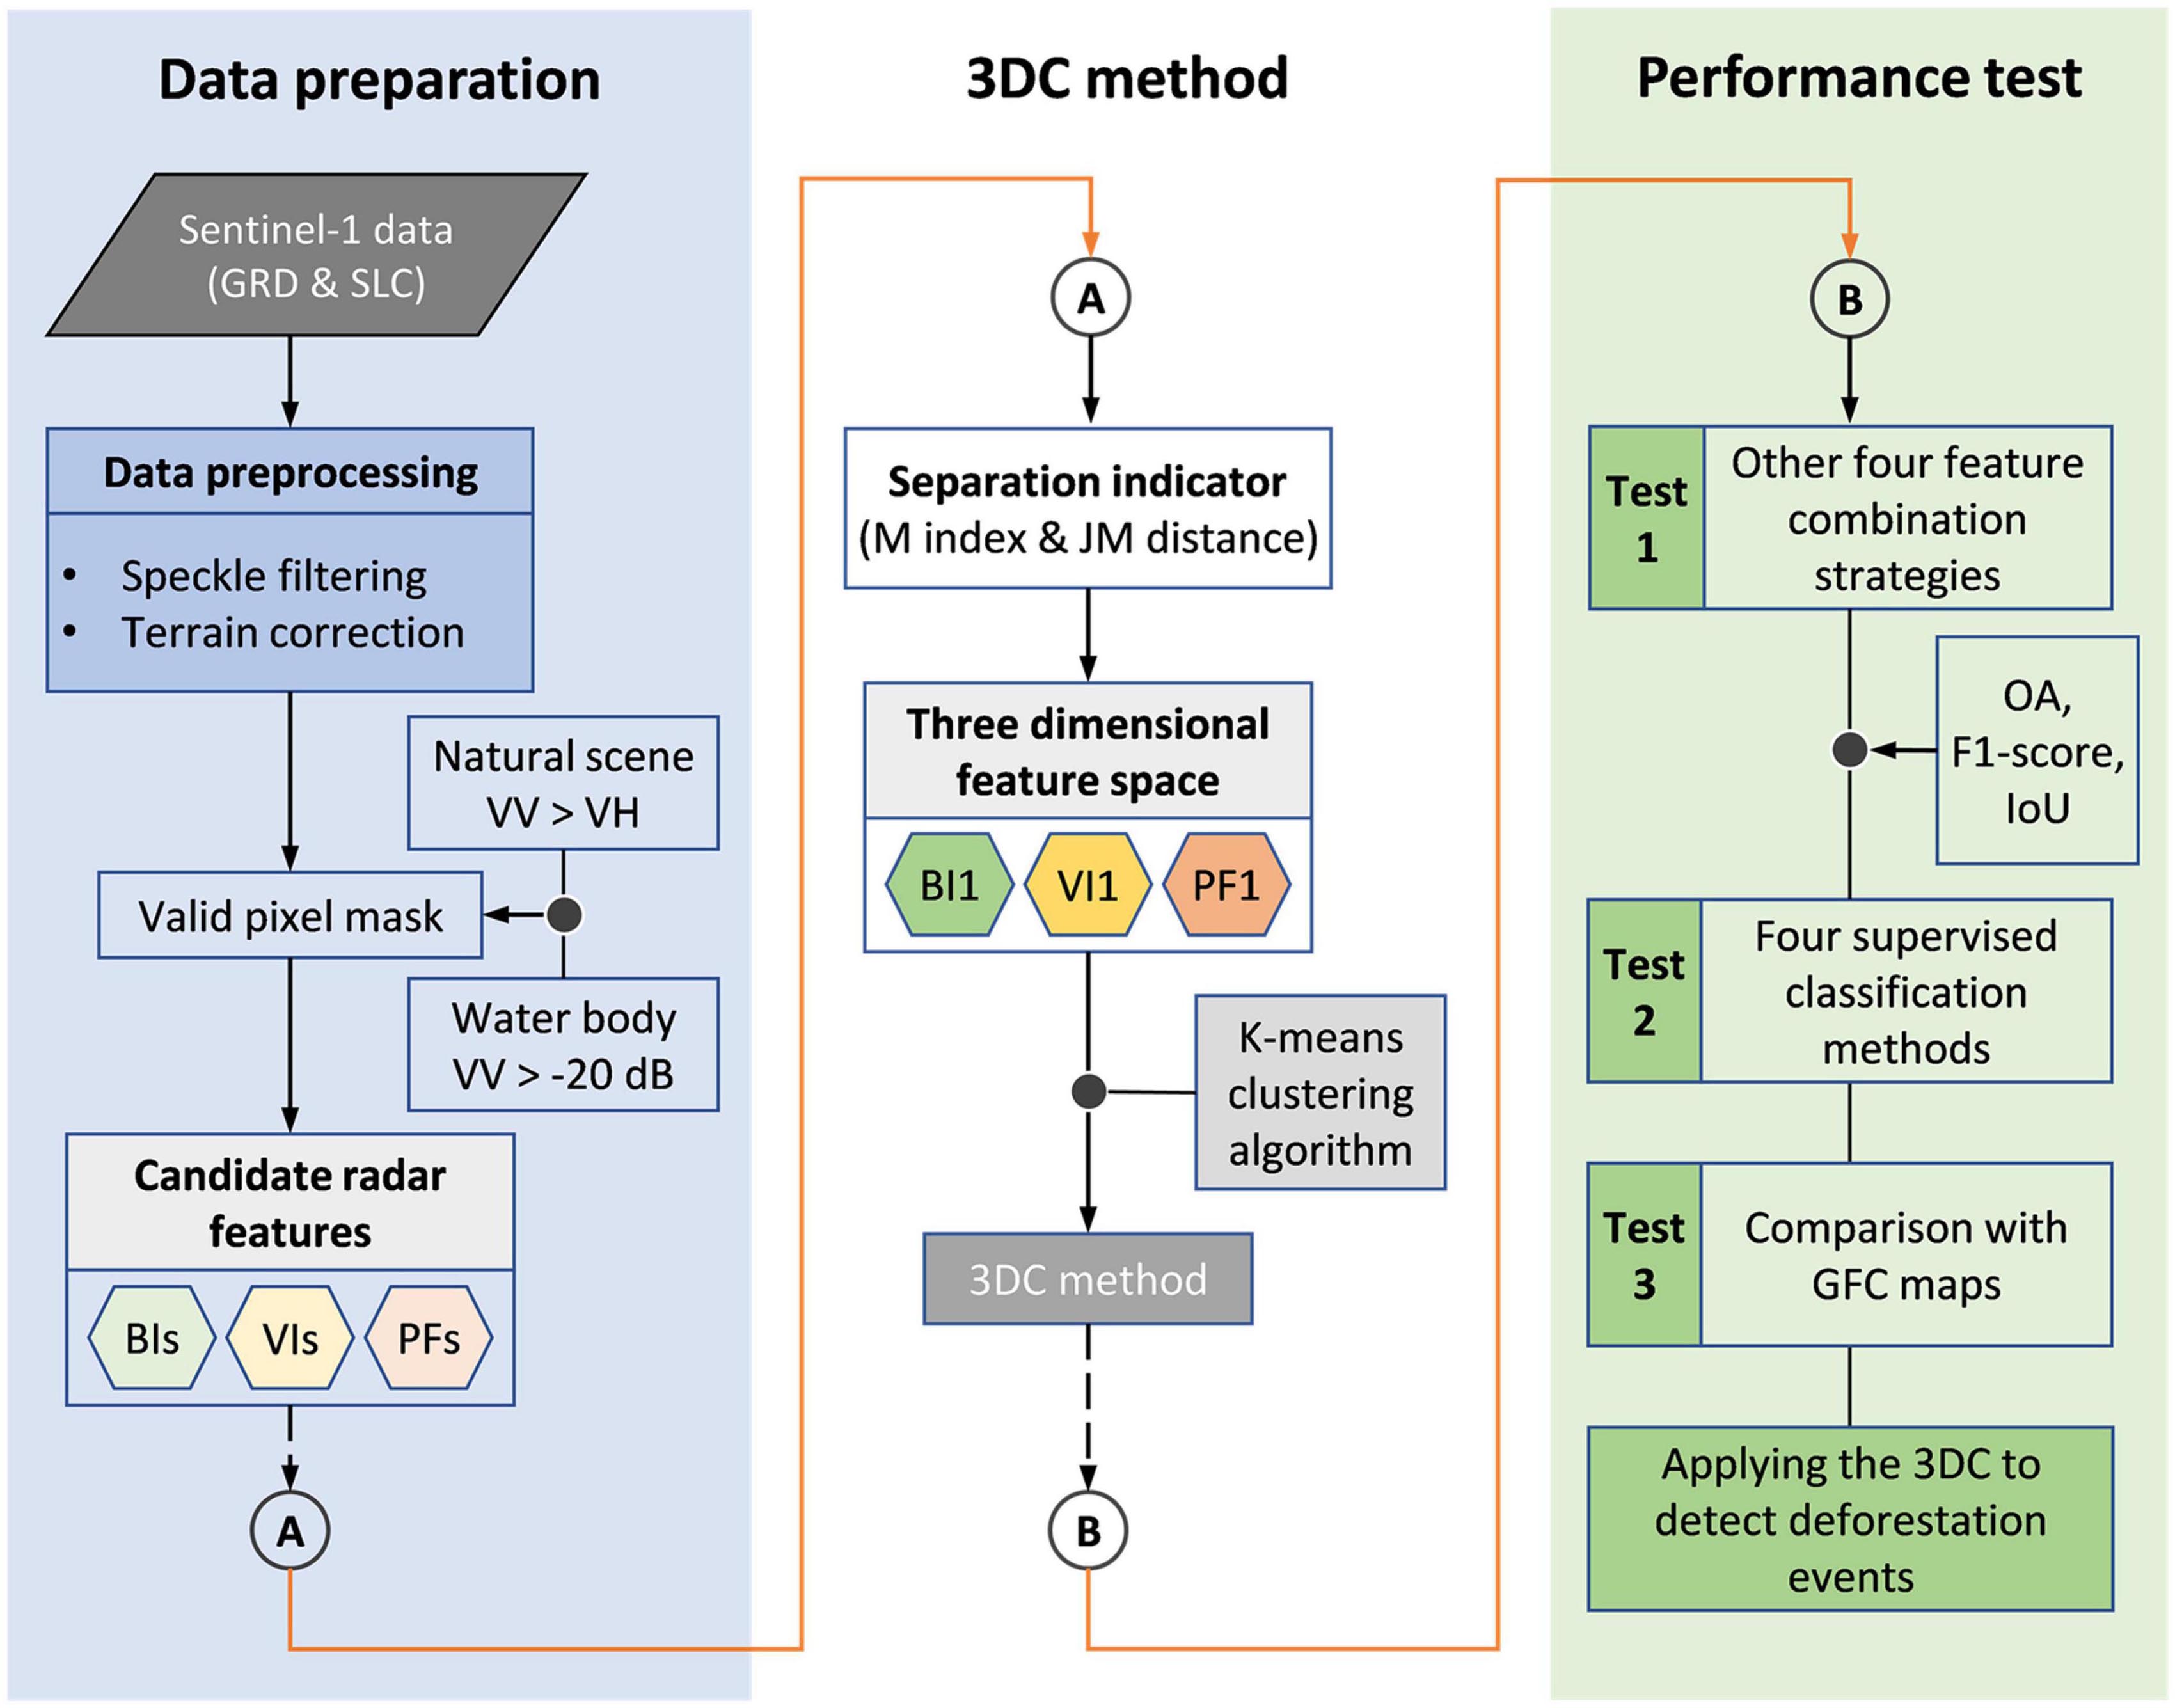
Figure 1. Technical flow chart of this paper.
3. Materials and methods
3.1. Study area
To ensure the applicability of the 3DC, we selected three study areas in Paraguay, Brazil, and Mexico (Figure 2). All three regions have high rates of forest cover and deforestation. Paraguay has a tropical dry forest climate with 54% forest cover. The dominant vegetation type of in Region A is closed deciduous broad-leaved forest. Brazil has 62% forest cover, accounting for one-fifth of the world’s forest area. Region B has a tropical rainforest climate, and the dominant vegetation type is closed evergreen needle-leaved forest. The eastern plain of Mexico has a subtropical humid climate, and open evergreen needle-leaved forest is the dominant vegetation type. The areas of regions A, B, and C are 180 km × 130 km, 150 km × 110 km, and 120 km × 70 km units, respectively.
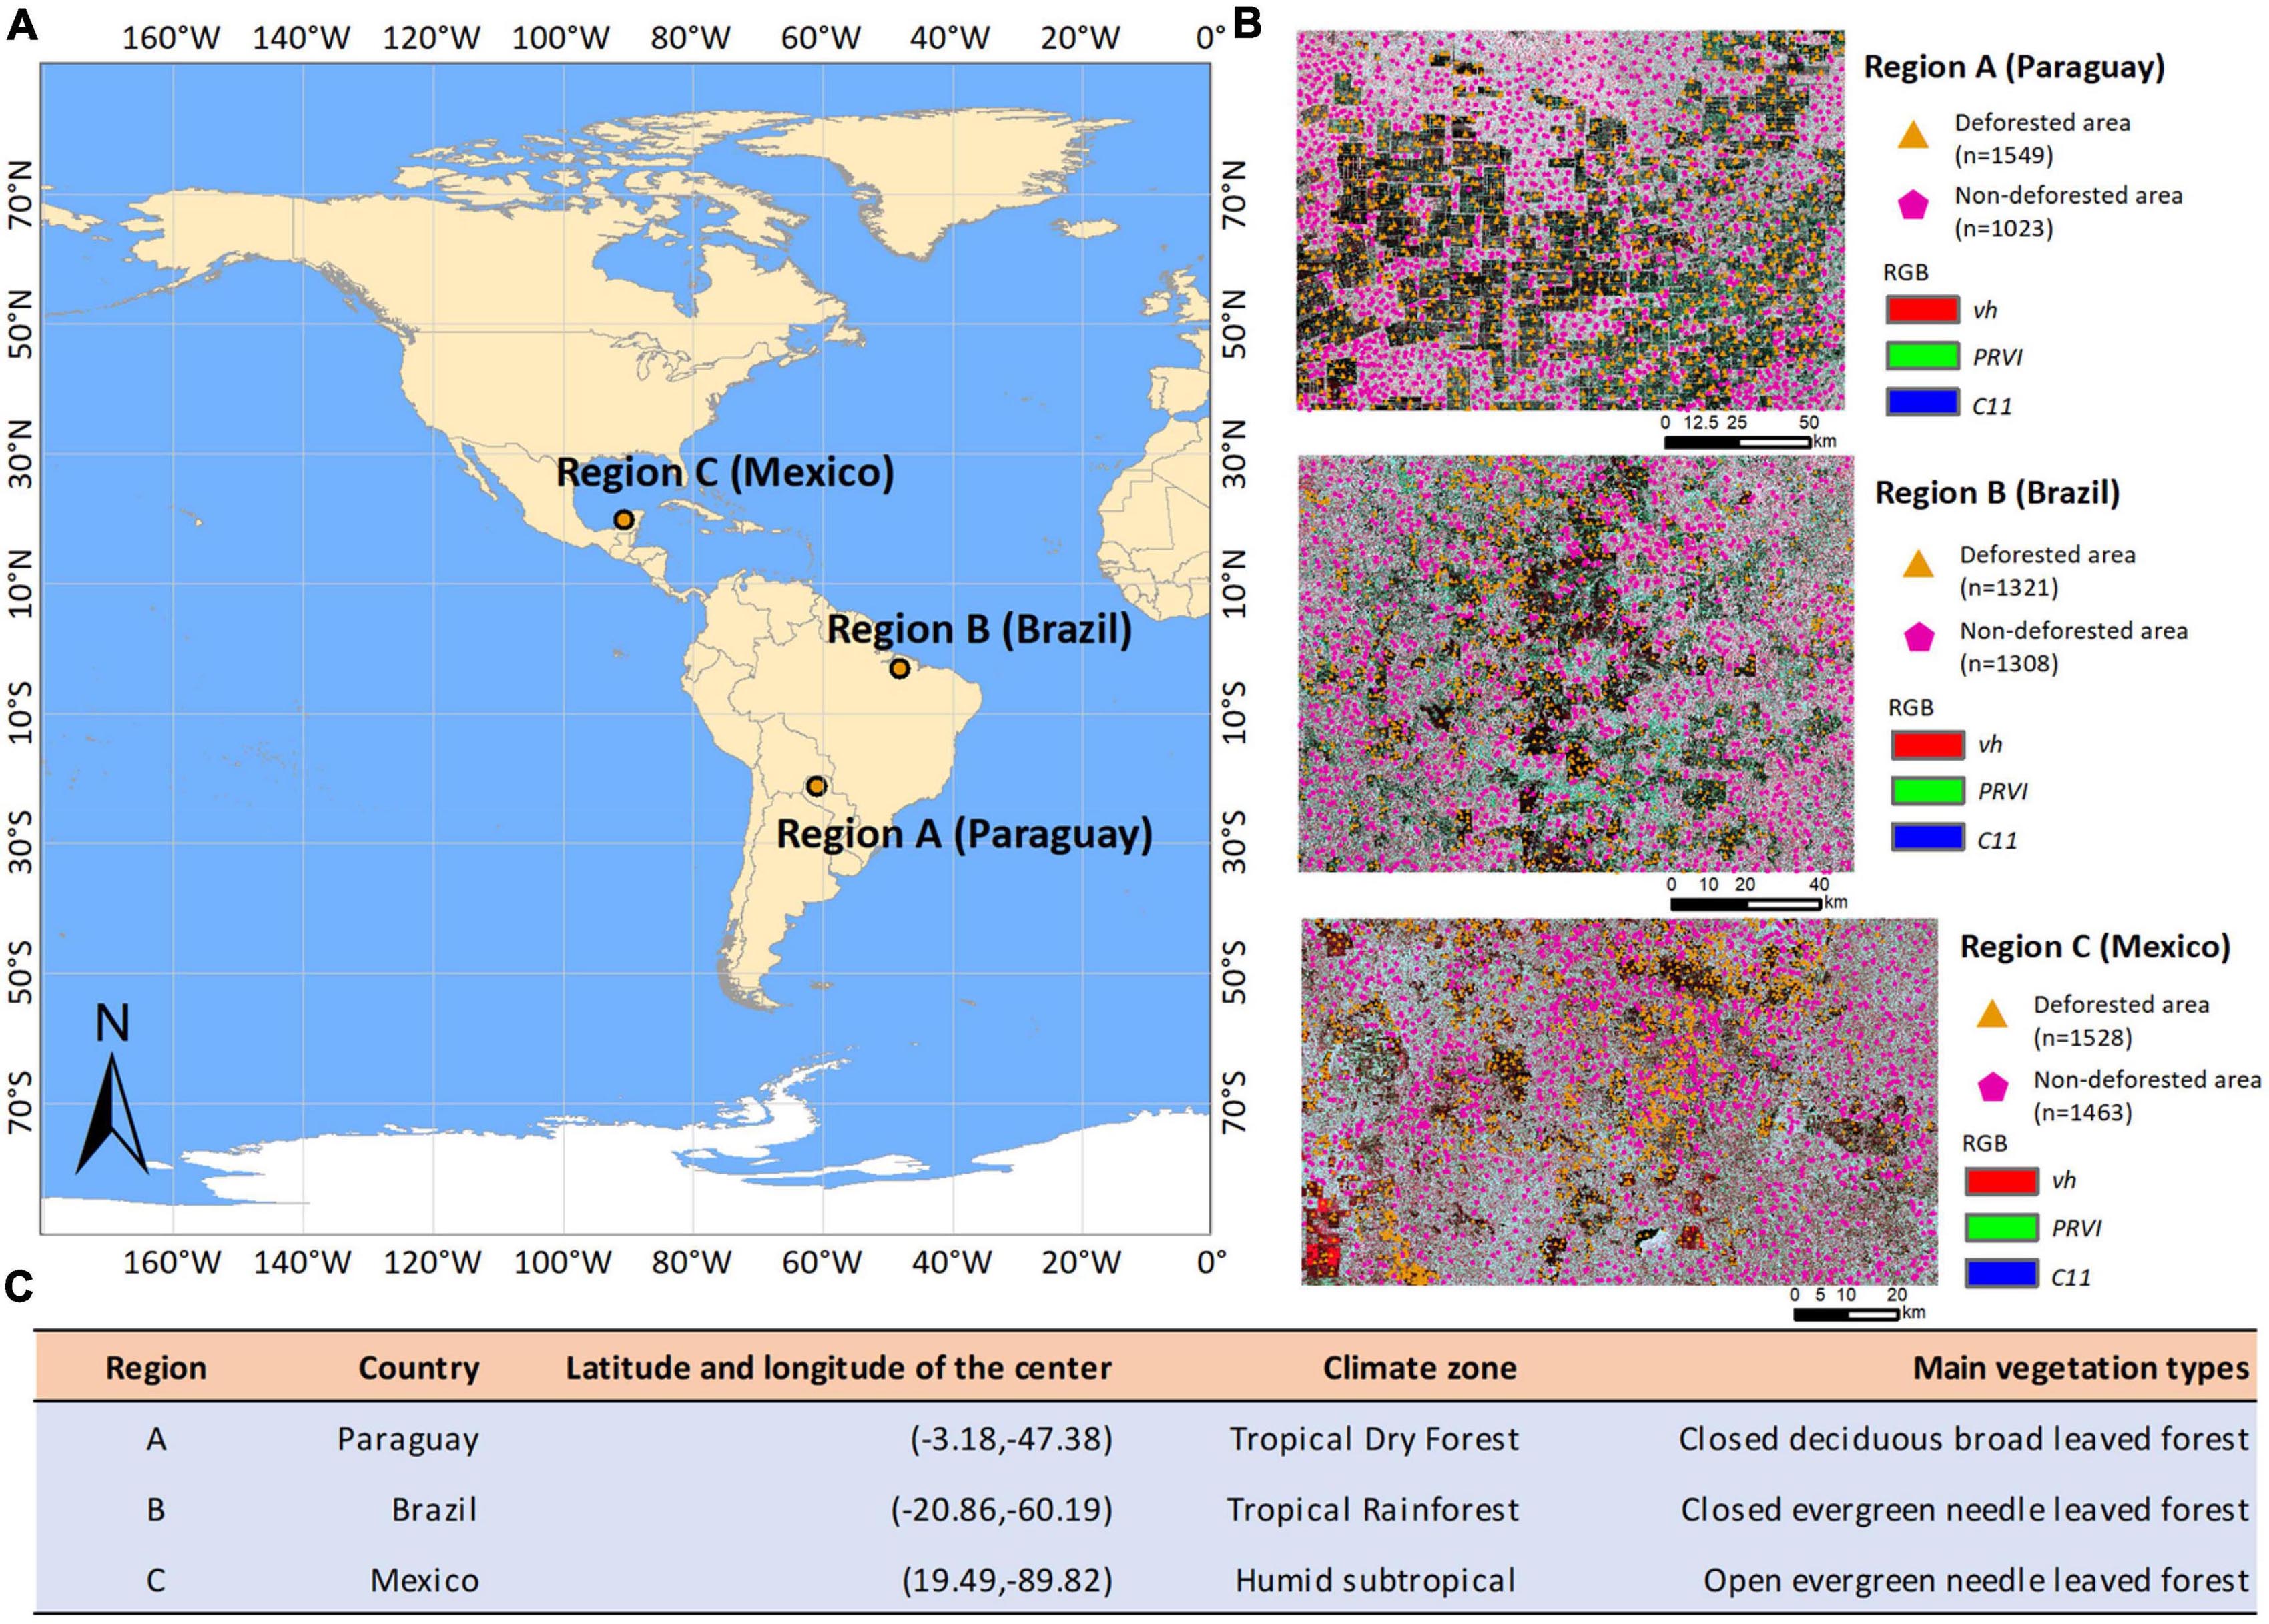
Figure 2. Overview of the study area. (A) Geographic location, (B) sample data, and (C) description.
3.2. Data analysis
3.2.1. Data sources
We downloaded the Level-1 ground range detected (GRD) and single look complex (SLC) data (Supplementary Table 1) covering the study area freely from the ASF website. The image acquisition dates for regions A, B, and C are September 16, 2019, August 13, 2021 and June 6, 2022, respectively. In addition, we downloaded auxiliary data for Sentinel 1 pre-processing, including precision orbit data and Digital Elevation Model (DEM) data. Sample points were generated by visual interpretation based on Planet satellite data from the Global Forest Watch (GFW) maps and Google Earth images. We selected 8,192 samples in three study areas, as detailed in Supplementary Table 2. The sample points were randomly selected and evenly distributed within the study area. In addition, we used Global Forest Change v1.9 (2000–2021) (GFC) data as reference maps (Hansen and Loveland, 2012; Hansen et al., 2013). GFC maps were generated using 654,178 Landsat images with a spatial resolution of 30 m (Hansen et al., 2013). The accuracy of forest loss detection in GFC products is 87.0–87.8% globally (Li et al., 2017). We evaluated the accuracy of the proposed method using annual tree loss maps of the GFC. Detailed data sources are listed in Table 1.
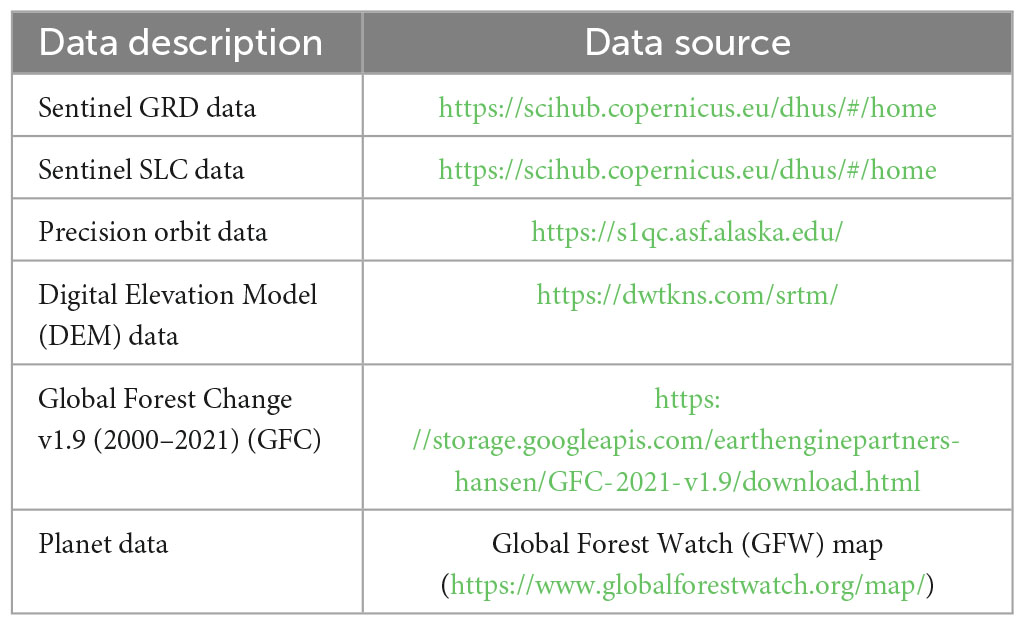
Table 1. Description of the data used in the study.
3.2.2. Data pre-processing
The Sentinel 1 data were pre-processed using the SNAP software available on the European Space Agency website (see Figure 3). We then used three masks on the pre-processed Sentinel 1 data to generate a valid image element value. The use of forest masks to exclude other land cover is a common approach in forest degradation studies (Ballère et al., 2021; Tang et al., 2023). Tropical forests often take 12 or more years to recover their pre-loss biodiversity and biological structure (Poorter et al., 2021). First, we used GFC forest cover data from the year before the study period to mask the Sentinel-1 data. In general, the backscatter coefficient of dual-band co-polarization (VV) is larger than that of cross-polarization (VH) (Yang et al., 2018; Wang et al., 2022). Second, we set (VV > VH) to ensure that the pixel values of the radar image match the natural scene. Third, we set (VV >−20 dB) to separate water bodies (Bhogapurapu et al., 2021).
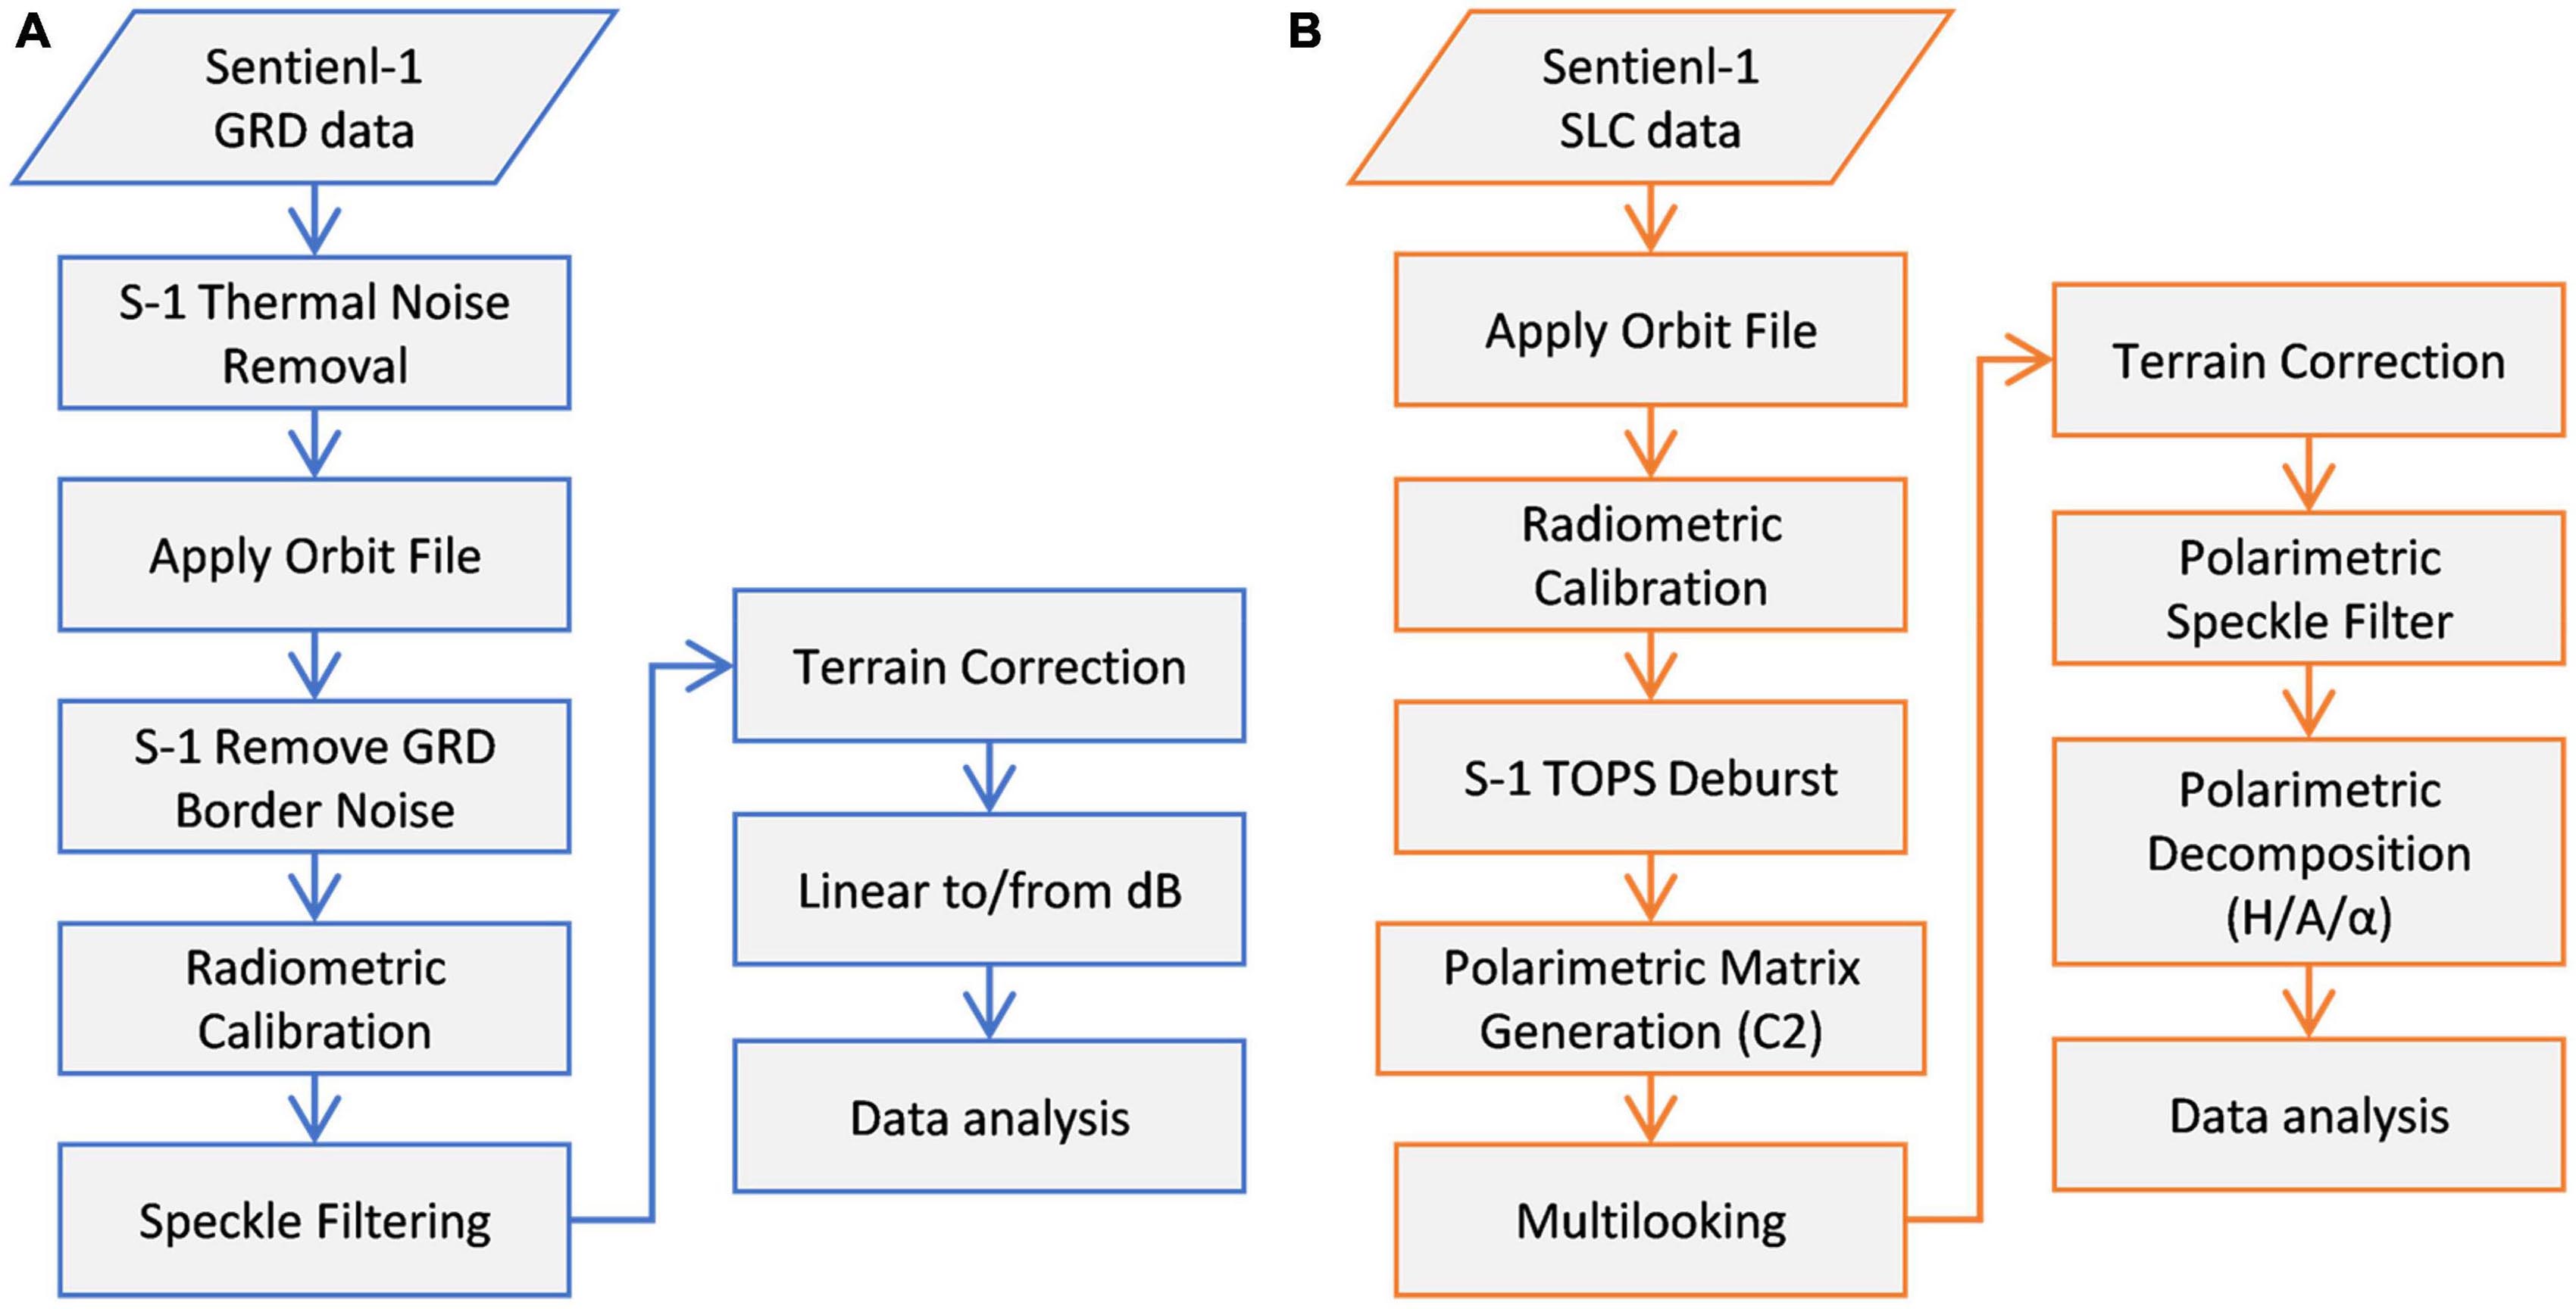
Figure 3. Pre-processing workflow for Sentinel 1 (A) GRD, and (B) SLC data.
3.2.3. Candidate radar features
We selected 15 radar variables, including four BIs, four VIs and seven PFs. Details of the features are given in Table 2. To the best of our knowledge, other features have been widely used for vegetation (e.g., biomass) studies, except for these two features (C11 and C22) obtained from the SAR coherence matrix, which have never been used for forest area extraction.
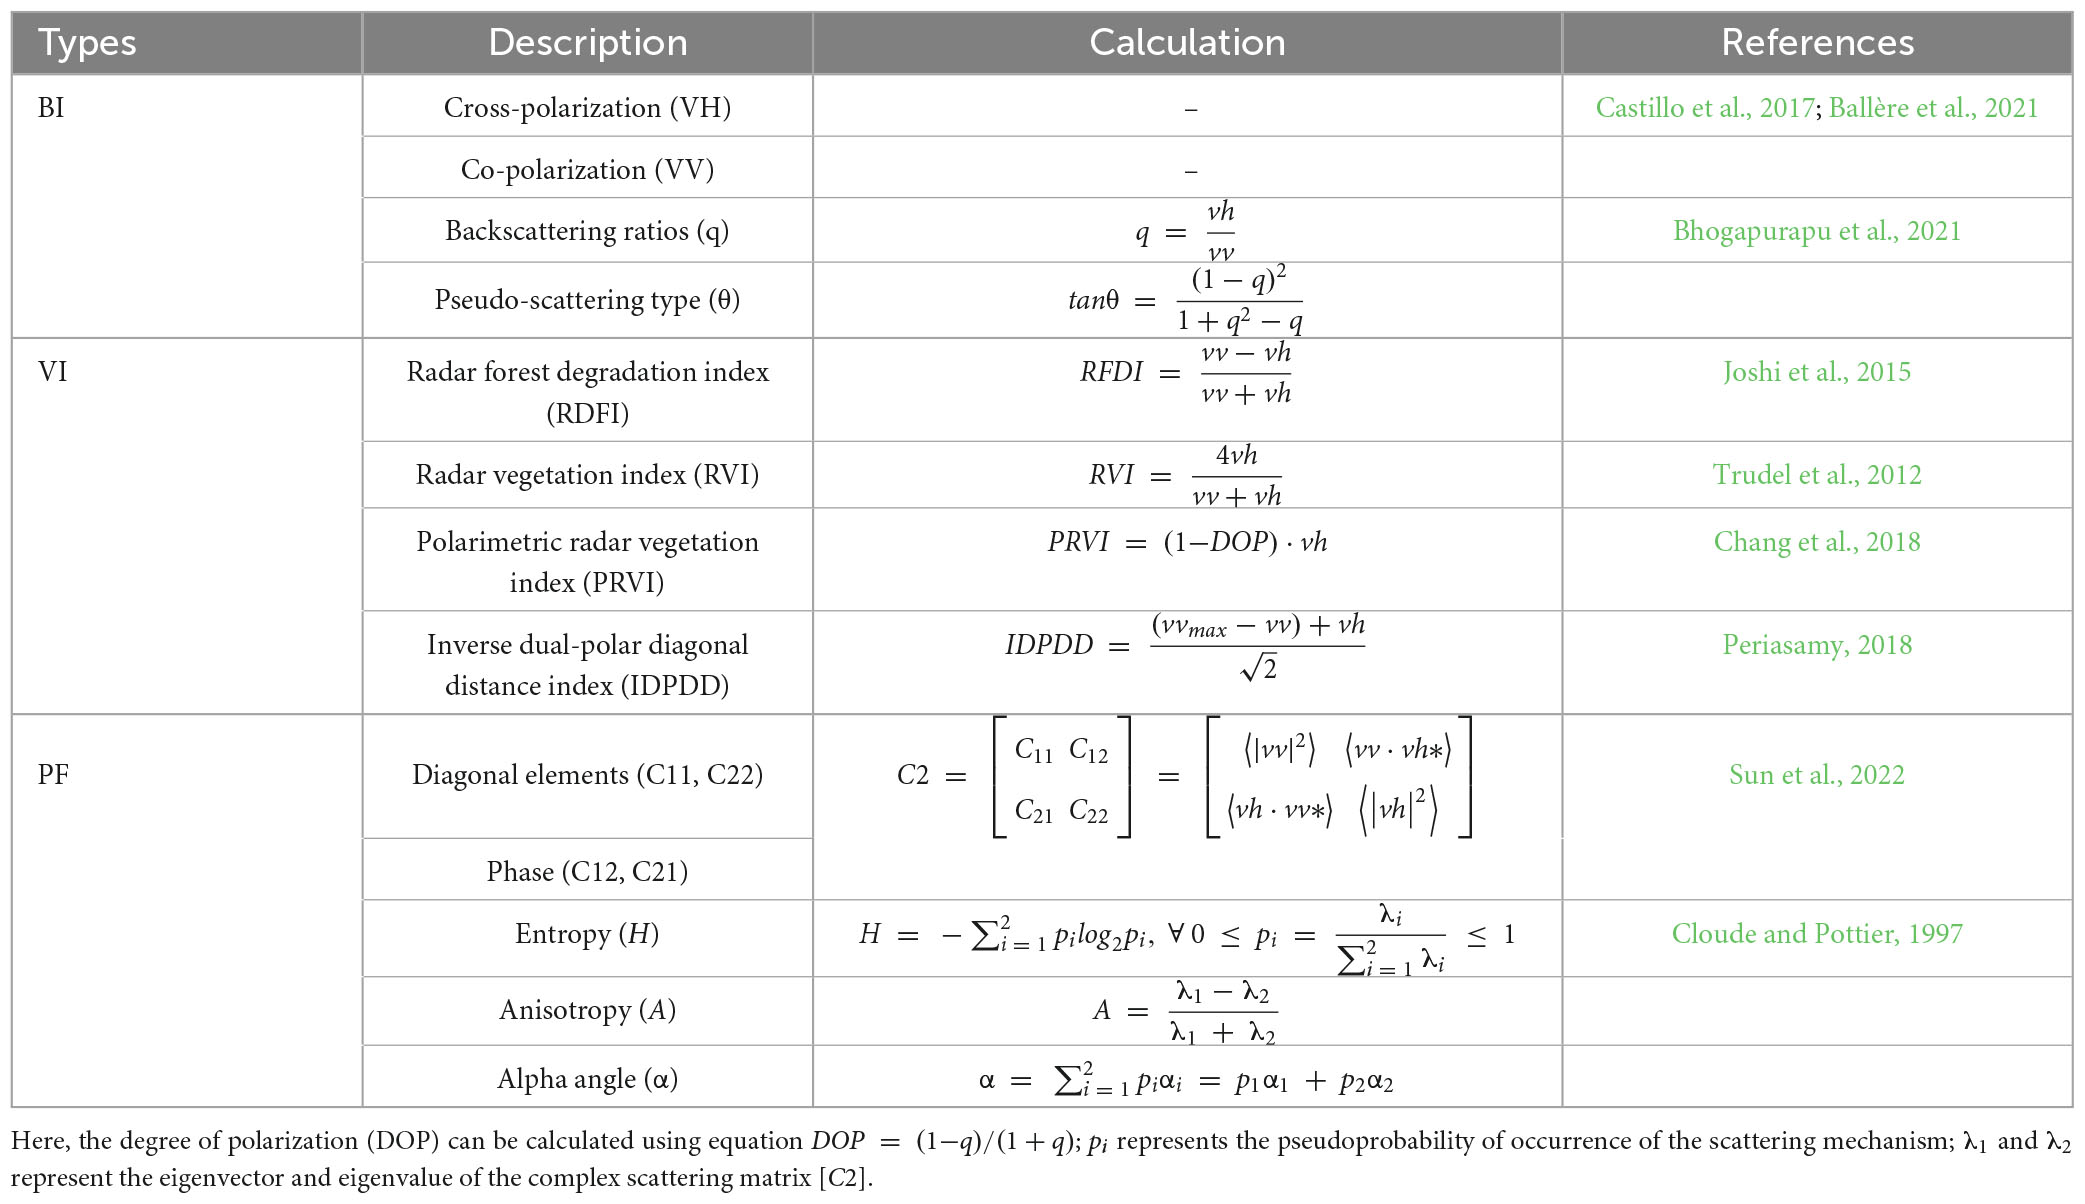
Table 2. Candidate radar parameters.
3.2.4. Separation indicators
The M-index (eq. 1) and the Jeffries-Matusita (JM) distance (eq. 2) (Xun et al., 2021) were selected for the separability analysis. They are calculated as follows.
where μ1 and μ2 denote the mean values of forested and non-forested area, respectively. σ1 and σ2 denote the standard deviation of forested and non-forested area, respectively. When the value of M (JM) is greater than 1, it indicates good separability; otherwise, it indicates poor separability.
3.3. Extraction of deforestation areas using 3DC
Based on the separability analysis, we selected the features with the highest separability among the features of each SAR type as the three axes of the 3D feature space. In the feature space, the deforested and non-forested deforested areas are divided into two clusters (Supplementary Figure 1). Then, the pixels in the deforested areas can be extracted using the K-mean clustering algorithm.
The K-mean clustering algorithm is an unsupervised classification method (De Luca et al., 2021; Maurya et al., 2021). Its implementation principle, including the following steps:
Input: dataset D = {x1, x2, ⋯, xn}, the number of class clusters is k, and the maximum number of iterations is υ.
Output: k number of class clusters, C = {C1, C2, ⋯, Cn}.
Step 1: Select k sample points from the dataset D randomly as the initial mean vector μ (eq. 4) representing the clusters.
Step 2: Calculate the distance (eq. 5) from each sample xi to each mean vector μj in the dataset D.
Step 3: Divide each sample in dataset D into the closest cluster.
Step 4: Update the class cluster centers (eq. 8) for each category.
where |Cj| represents the sample count in the j th cluster.
Step 5: Repeat Step 2, 3, and 4 until the class cluster centers no longer change or reach the pre-given maximum iterationumber υ.
After completing the above steps, the algorithm terminates. In this study, we set the number of classes for the K-mean clustering algorithm to be 2, and the default ENVI software settings were used for the other parameters.
3.4. Performance test of the proposed method
3.4.1. Comparison with other feature combination strategies
To test the performance of the 3D feature space, we established four other types of datasets (Figure 4). In these datasets, D1 considers only BI; D2 considers only VI; D3 considers only PF; D4 includes BI, VI, and PF. For dataset D5, the four best separation indicators were selected from all candidate radar parameters (BI-VI-PF, BVP). After assigning suitable parameters to each dataset, the K-means clustering algorithm was applied to identify the deforestation area.
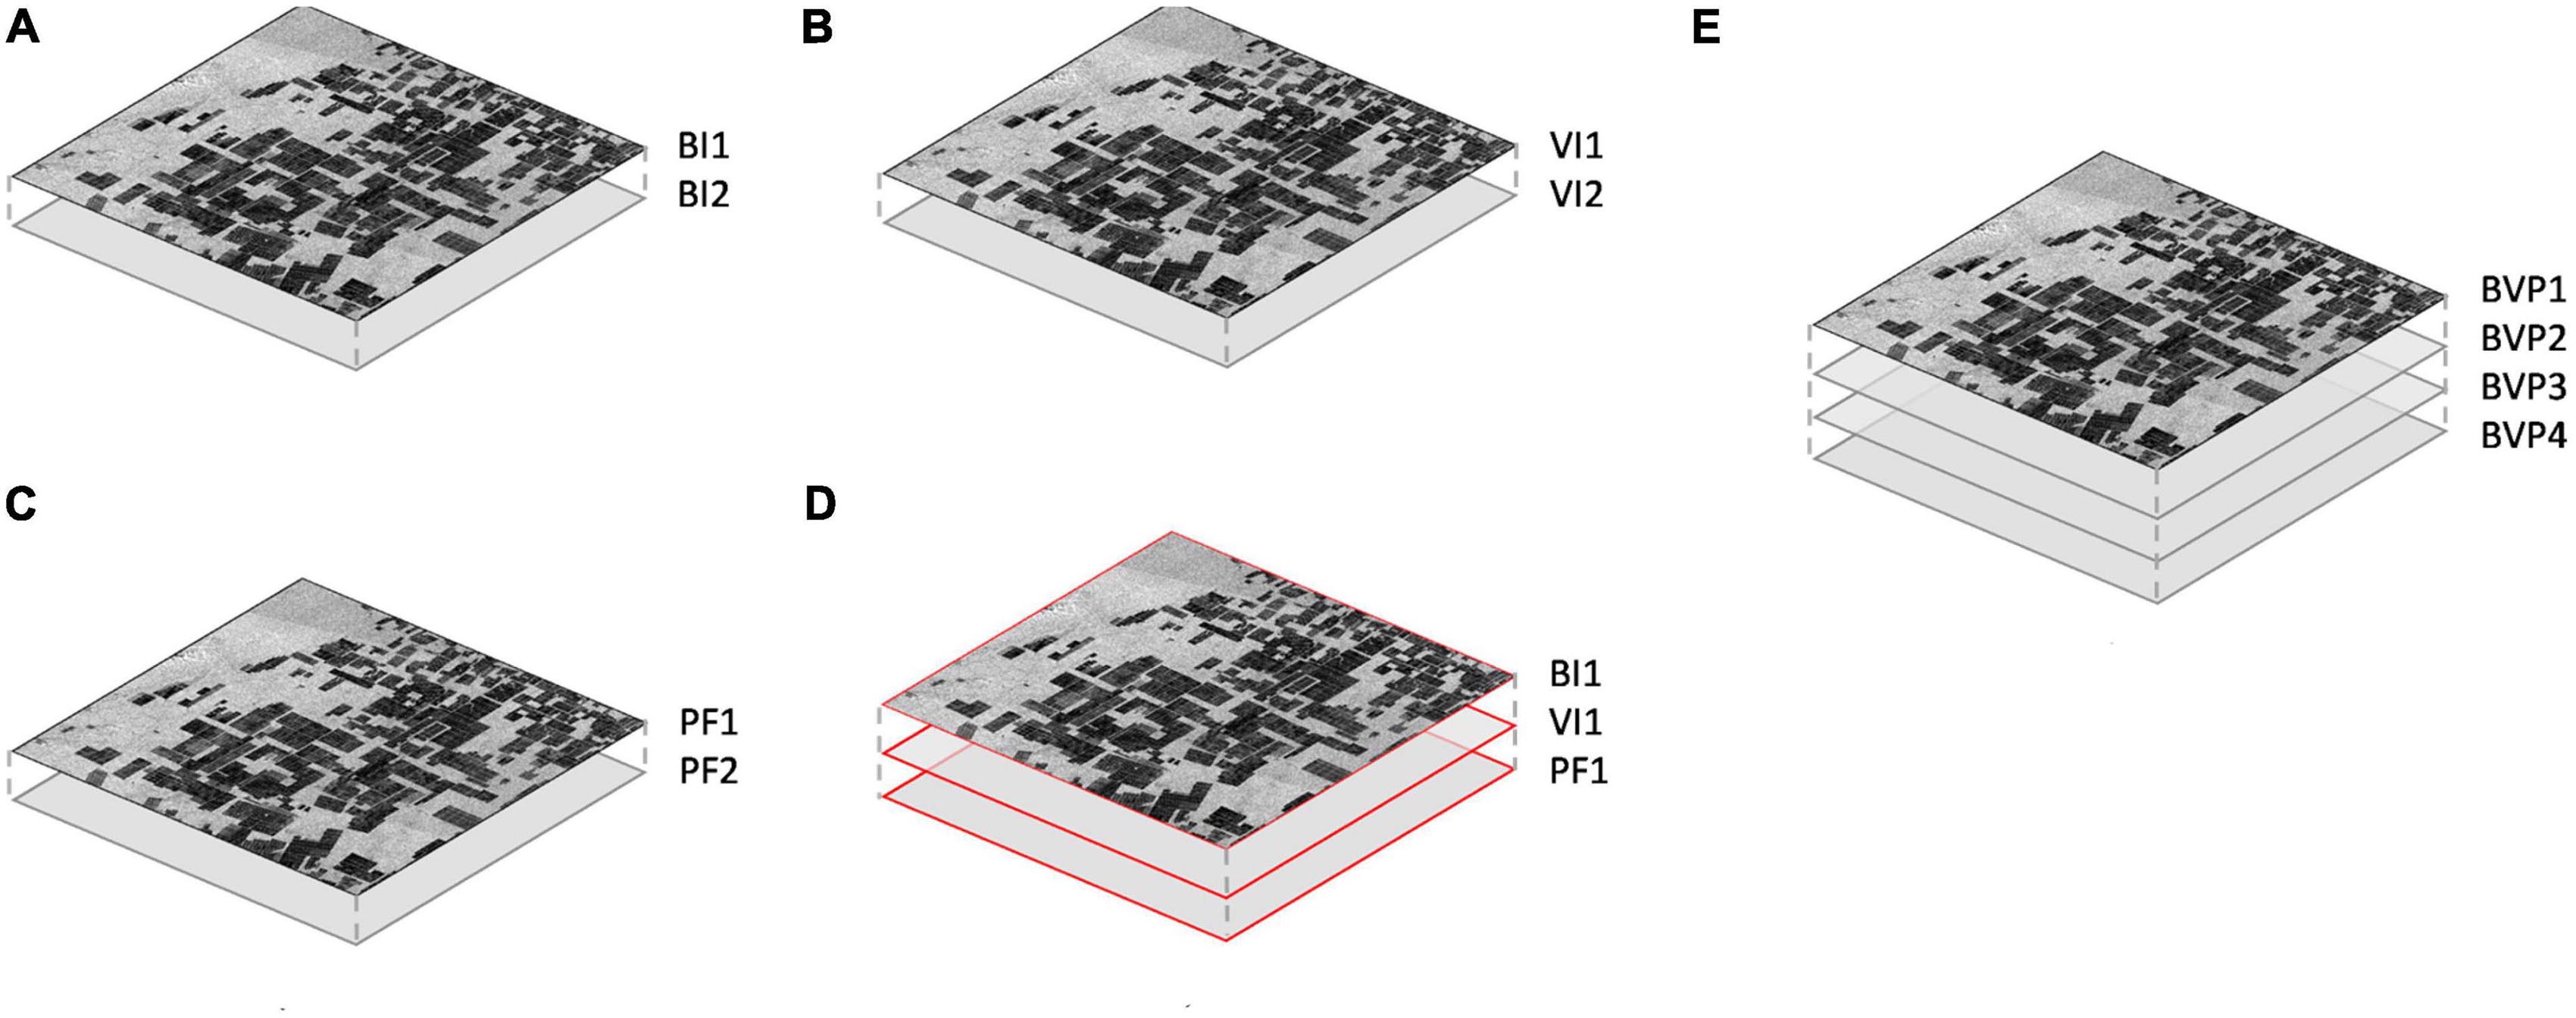
Figure 4. SAR dataset (A) D1: BI1 and BI2; (B) D2: VI1 and VI2; (C) D3: PF1 and PF2; (D) D4: BI1, VI1 and PF1; and (E) D5: BVP1, BVP2, BVP3 and BVP4. “*1” and “*2” are the first and second ranked by “Separation Indicators,” respectively.
3.4.2. Comparison with supervised classifiers
Four commonly used supervised classification methods (Maurya et al., 2021), including object-oriented (OOC), maximum likelihood (MLC), neural network (NN), and support vector machine (SVM), were selected for comparison with the 3DC. To ensure the best performance, we tested different parameter settings for the supervised classifiers. In this study, we used a rule-based object-oriented feature extraction workflow. The data scale factor of the MLC model was set to 1. The hidden layers and training iterations of the NN model were set to 1 and 1000, respectively. We selected the Radial Basis Function (RBF) as the kernel function of the SVM model. To train the SVM classifier, the kernel function gamma, penalty parameter and pyramid levels were set to 0.5, 100, and 0, respectively. The VV and VH images of the Sentinel-1 data are the input data for the four classifiers. We conducted experiments on supervised classification methods using ENVI software.
3.4.3. Comparison with GFC maps
Visual comparison with the GFC maps further demonstrates the ability of the 3DC to detect deforestation. To obtain objective evaluation results, (1) the consistency of 3DC results with GFC products was tested in three study areas; and (2) the 3DC was applied to map the deforestation dynamics in Paraguay for 2021.
3.5. Validations
The overall accuracy (OA) (eq. 9), F1 score (F1) (eq. 10) and intersection over union (IoU) (eq. 13) were employed to evaluate the performance of the 3DC. They are calculated as follows.
where TP, TN, FP, and FN denote the number of true-positive, true-negative, false-positive, and false-negative samples, respectively. IoU_0 and IoU_1 indicate the IoU of the non-deforested and deforested area, respectively (Ma et al., 2022).
4. Results
4.1. Sensitive remote sensing parameters of forest change
Among the BIs (Figure 5), the separation of VV and VH values for the deforested area and forest samples was greater than 1, with M (JM) values of 1.68 (1.50) and 1.75 (1.55), respectively. For the parameters q and tanθ, there was a large overlap between the forest and deforested area samples, indicating that less information was available to help identify deforested areas. In the VIs, the overlap between the RVI and RFDI values for deforested areas and forests was large, while there were large differences in the PRVI and IDPDD, with M (JM) values of 1.10 (1.02) and 1.15 (1.04), respectively. Among the PFs, the C11 and C22 values of the deforested areas and forest samples were highly variable, with M (JM) values of 2.20 (1.81) and 2.15 (1.78), respectively.
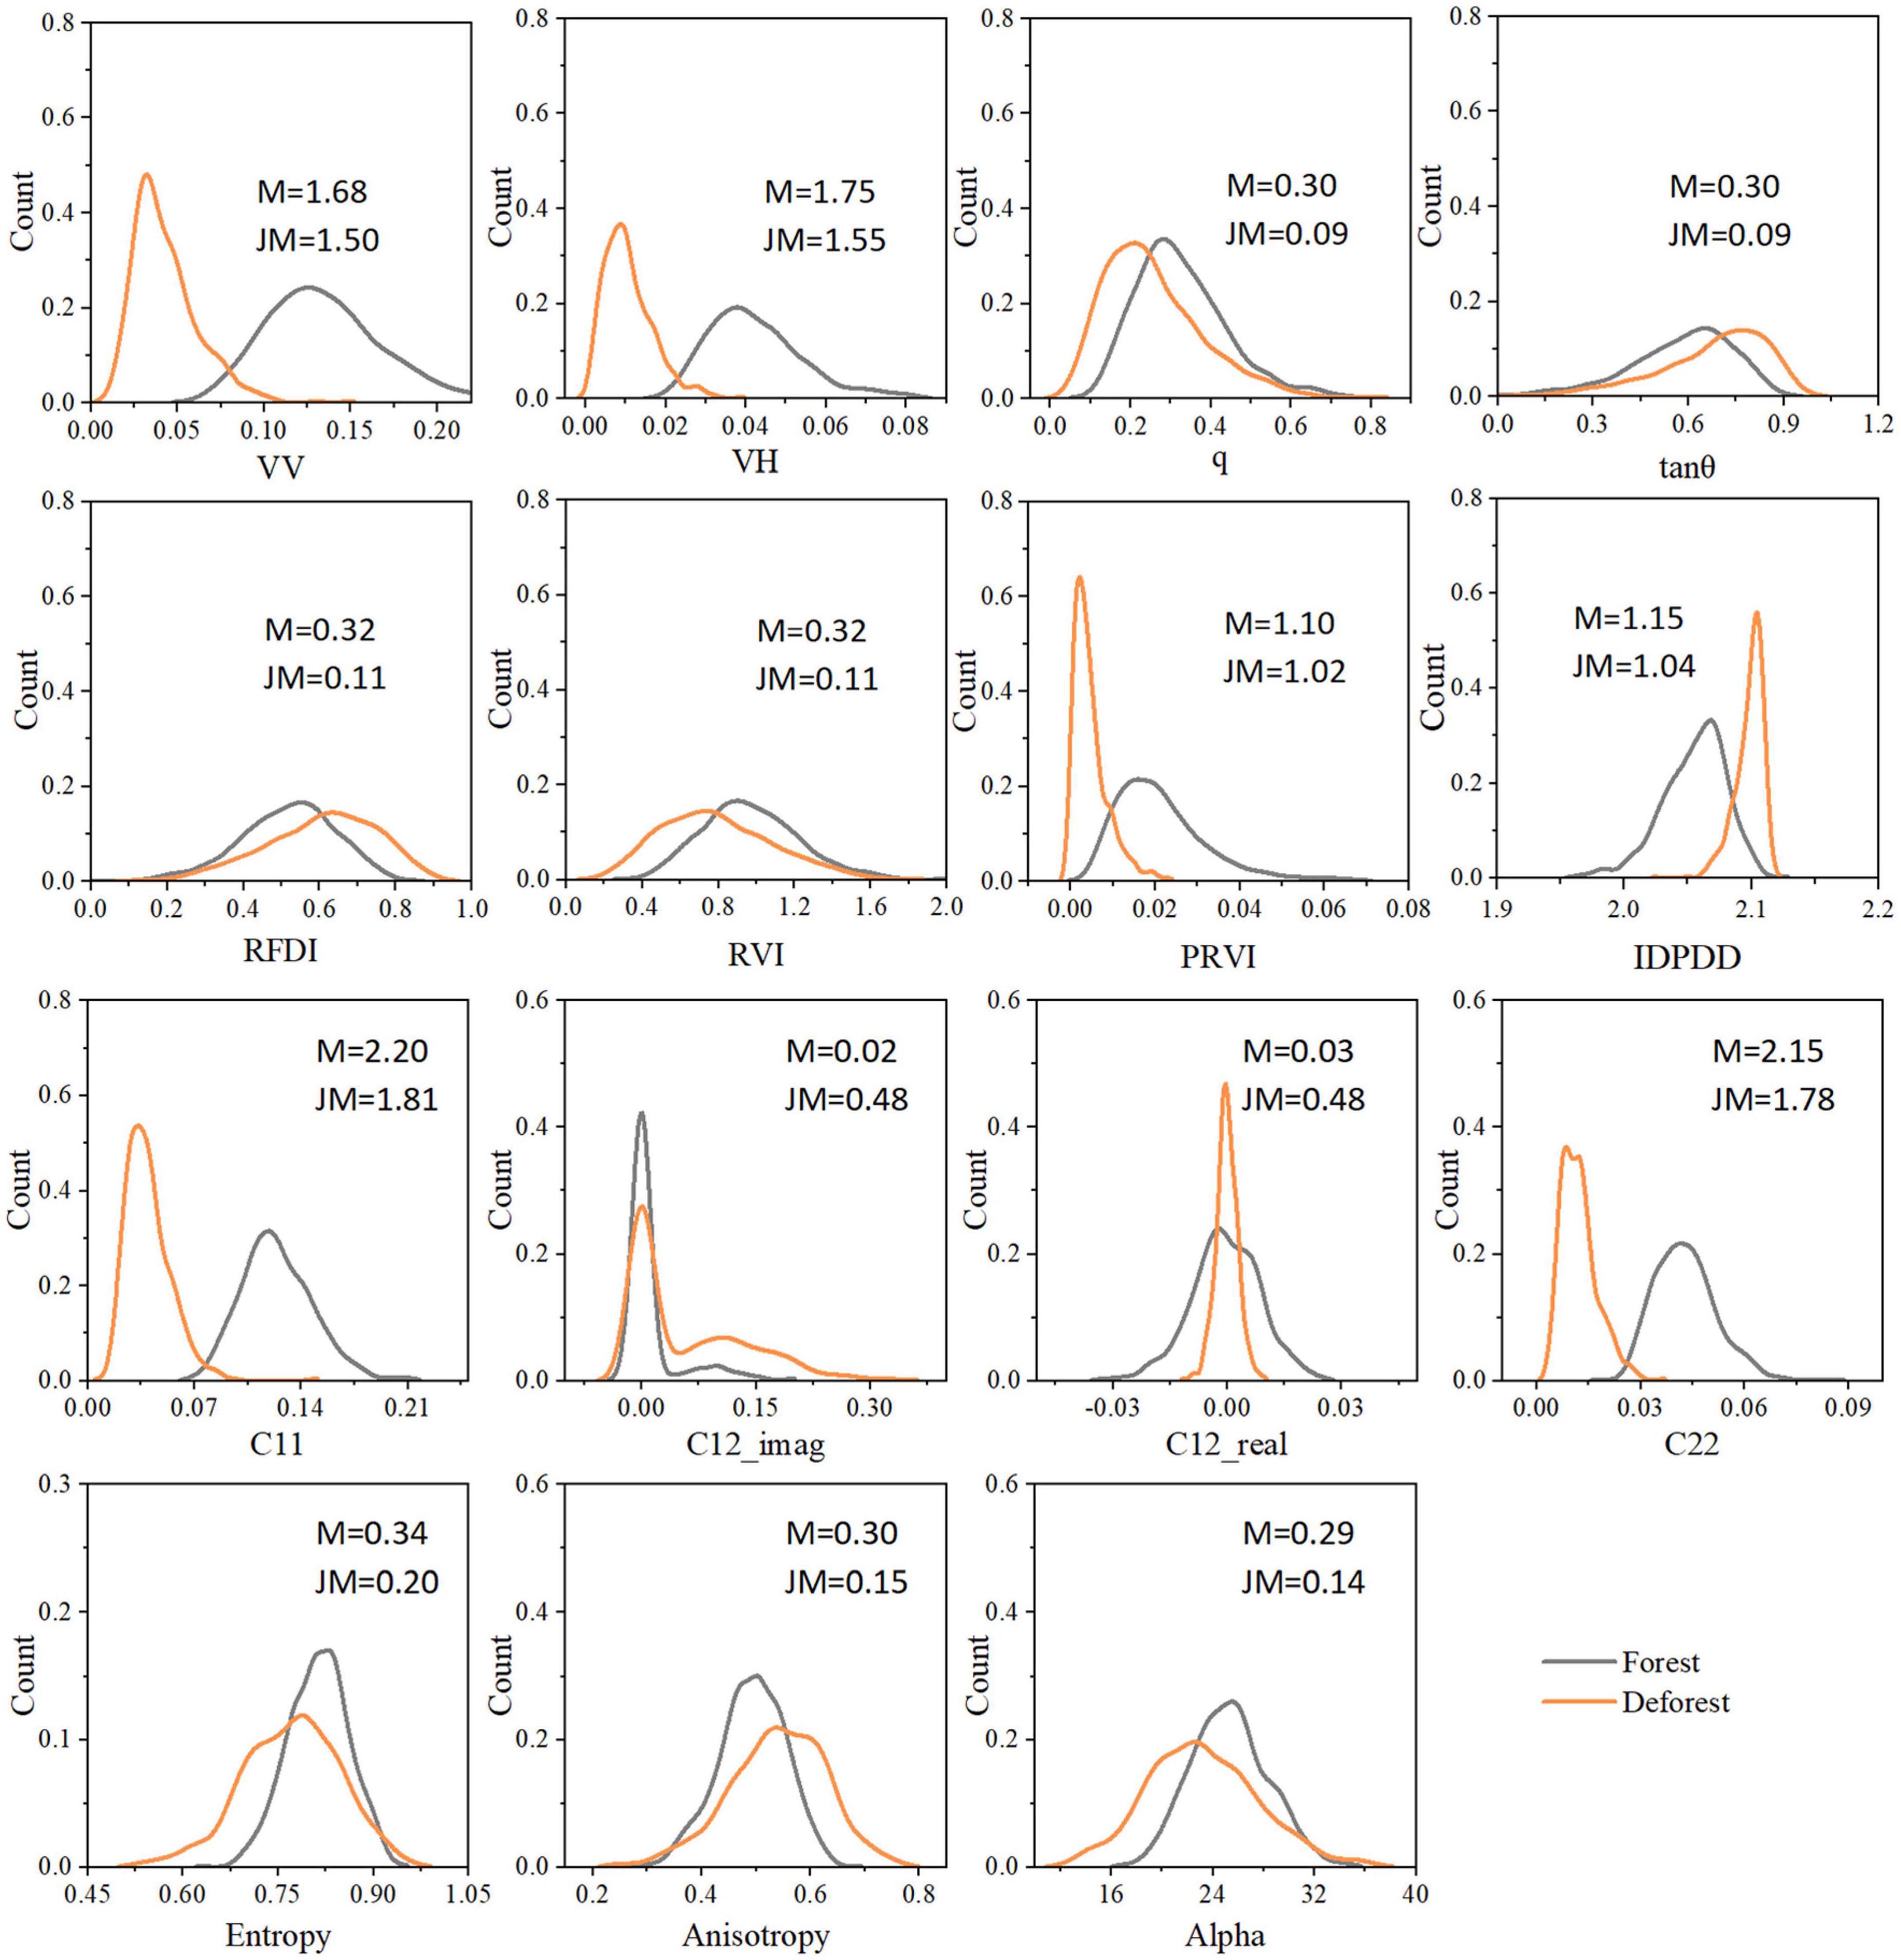
Figure 5. Frequency histograms of candidate feature values for forest and deforested area samples. C12_imag and C12_real are the phase features in the [C2] coherence matrix, representing C12 and C21, respectively.
Furthermore, the PFs (i.e., C11 and C22) performed better than the BIs (i.e., VV and VH) in separating deforested areas from forests. For parameters with a separation greater than 1, the deforested areas had low values, and the forests had high values except for IDPDD.
4.2. Comparison with other feature combination strategies
Table 3 shows the mapping accuracy of the five strategies (Supplementary Figure 2). It is easy to see that dataset D4 achieved the highest accuracy in all study areas compared to the other four feature combination strategies. The OA, F1, and mIoU of the deforested area extraction results in region A based on dataset D4 were 98.3, 96.4, and 96.5%, respectively. The identification accuracy of study area A was better than that of study areas B and C. The deforested areas in study area A are large and densely distributed, while the deforested areas in study areas B and C are scattered and in small patches. The diversity of distribution patterns and deforested area sizes led to differences in identification accuracy between regions. This is because the degree of landscape fragmentation affects the classification accuracy based on remote sensing images (Xun et al., 2021; Zhang et al., 2022; Zhao and Pan, 2023). To compare the feature space models in more detail and comprehensively, we visualized the extraction results for the three regions (Supplementary Figures 3–5). Overall, the accuracy of the 3D feature space model proposed in this paper is obviously superior to other feature space models.
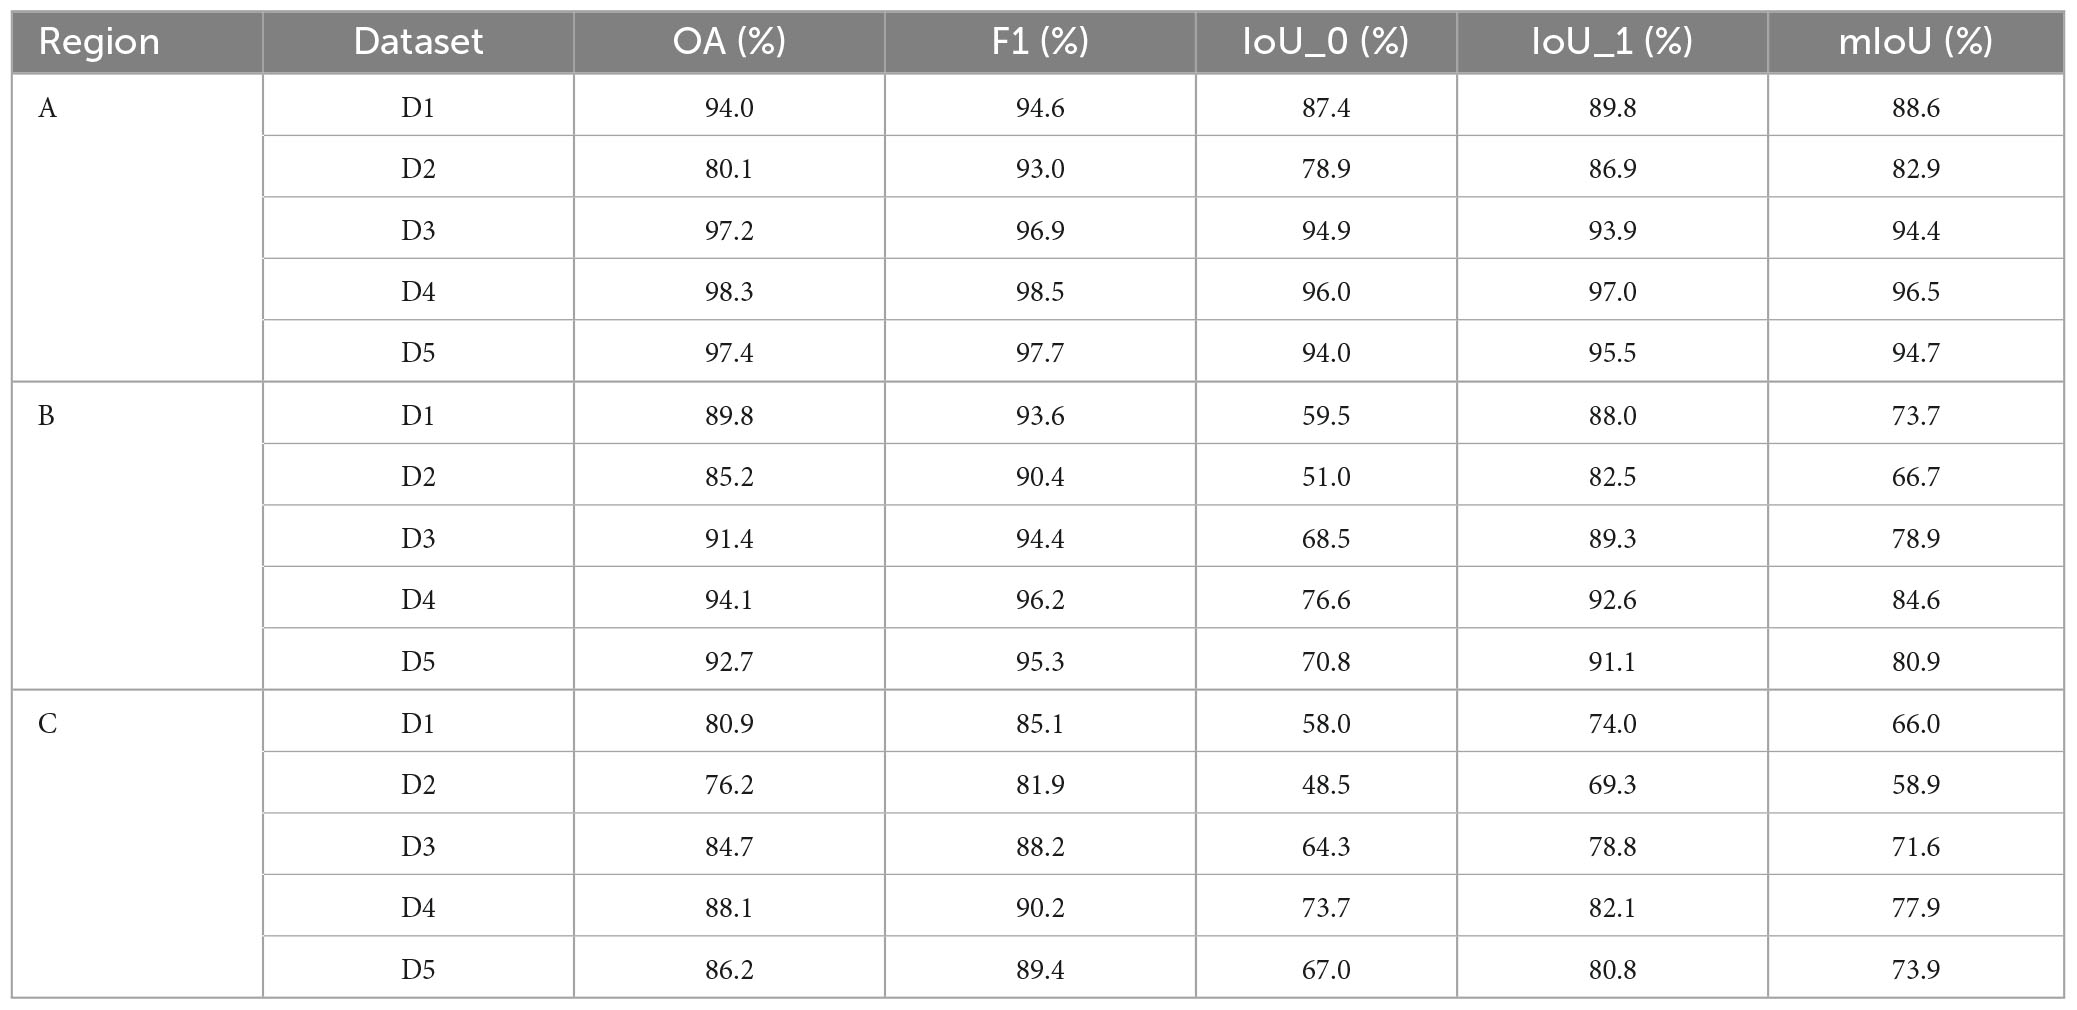
Table 3. Mapping accuracy of the five strategies.
4.3. Comparison with supervised classification methods
Table 4 shows the mapping accuracy of the supervised classifiers. Among the four supervised classification methods, SVM had the highest accuracy, and OOC had the lowest accuracy (Table 4). The proposed method outperformed OOC and had similar accuracy to MLC, NN, and SVM classifiers. Specifically, in region B, the OA, F1, and mIoU values of the 3DC were higher than those of the OOC, MLC, NN, and SVM classifiers, indicating that the proposed method performed similarly to supervised classifiers without the use of training samples. In regions A and C, the OA, F1, and mIoU values of the proposed method were all superior to OOC and slightly lower than MLC, NN and SVM classifiers. The results show that (1) the supervised classifier is robust when there are sufficient and high-quality training samples; and (2) when there are no or insufficient training samples, the 3DC is a more appropriate choice.
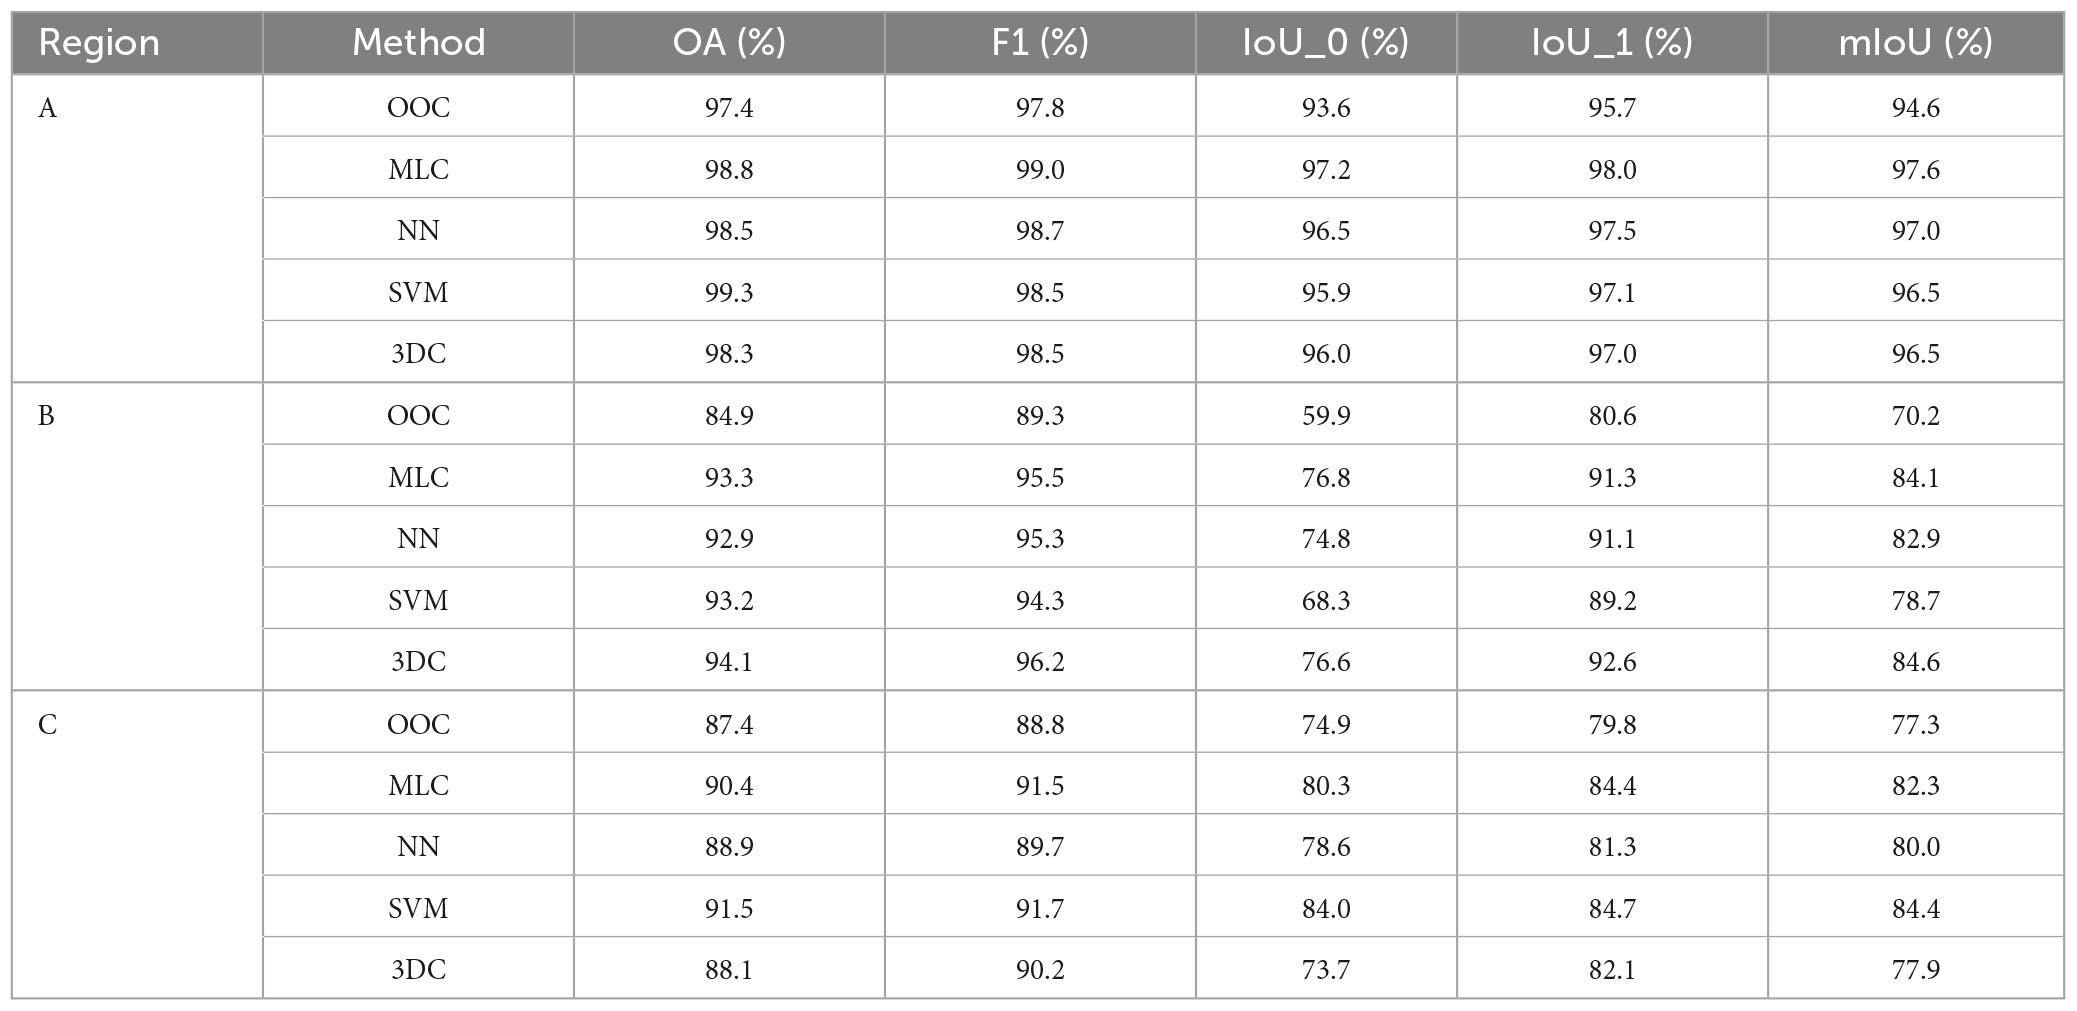
Table 4. Mapping accuracy of the supervised classifiers.
For a more detailed and comprehensive comparison of the proposed approach with other supervised classifiers, typical deforestation conditions in three regions were selected for further discussion. Supplementary Table 3 describes typical deforestation conditions. Figures 6–8 show the identification results of deforestation areas for the proposed method and the supervised classifiers. In condition 1, the proposed method was highly consistent with the supervised classification method in that both could accurately detect deforested areas. In condition 2, compared to the 3DC, the supervised classification methods suffered from a high omission error. Most of the missing areas correspond to areas of vegetation regeneration on the planet map (for example, natural grass growth or artificial crops after deforestation). In condition 3, the proposed method overestimated the deforestation area compared to the supervised classification method. In condition 4, there were obvious omissions in the supervised classification results, and the deforestation areas detected by the 3DC were highly consistent with the actual map. As shown in Figures 7, 8, there were more speckles in the classification results of region B and region C, which severely affected the accuracy of deforested area identification, which is consistent with the quantitative evaluation results in Table 4. In general, the proposed method is consistent with the four supervised classifiers in the spatial distribution of deforested areas.
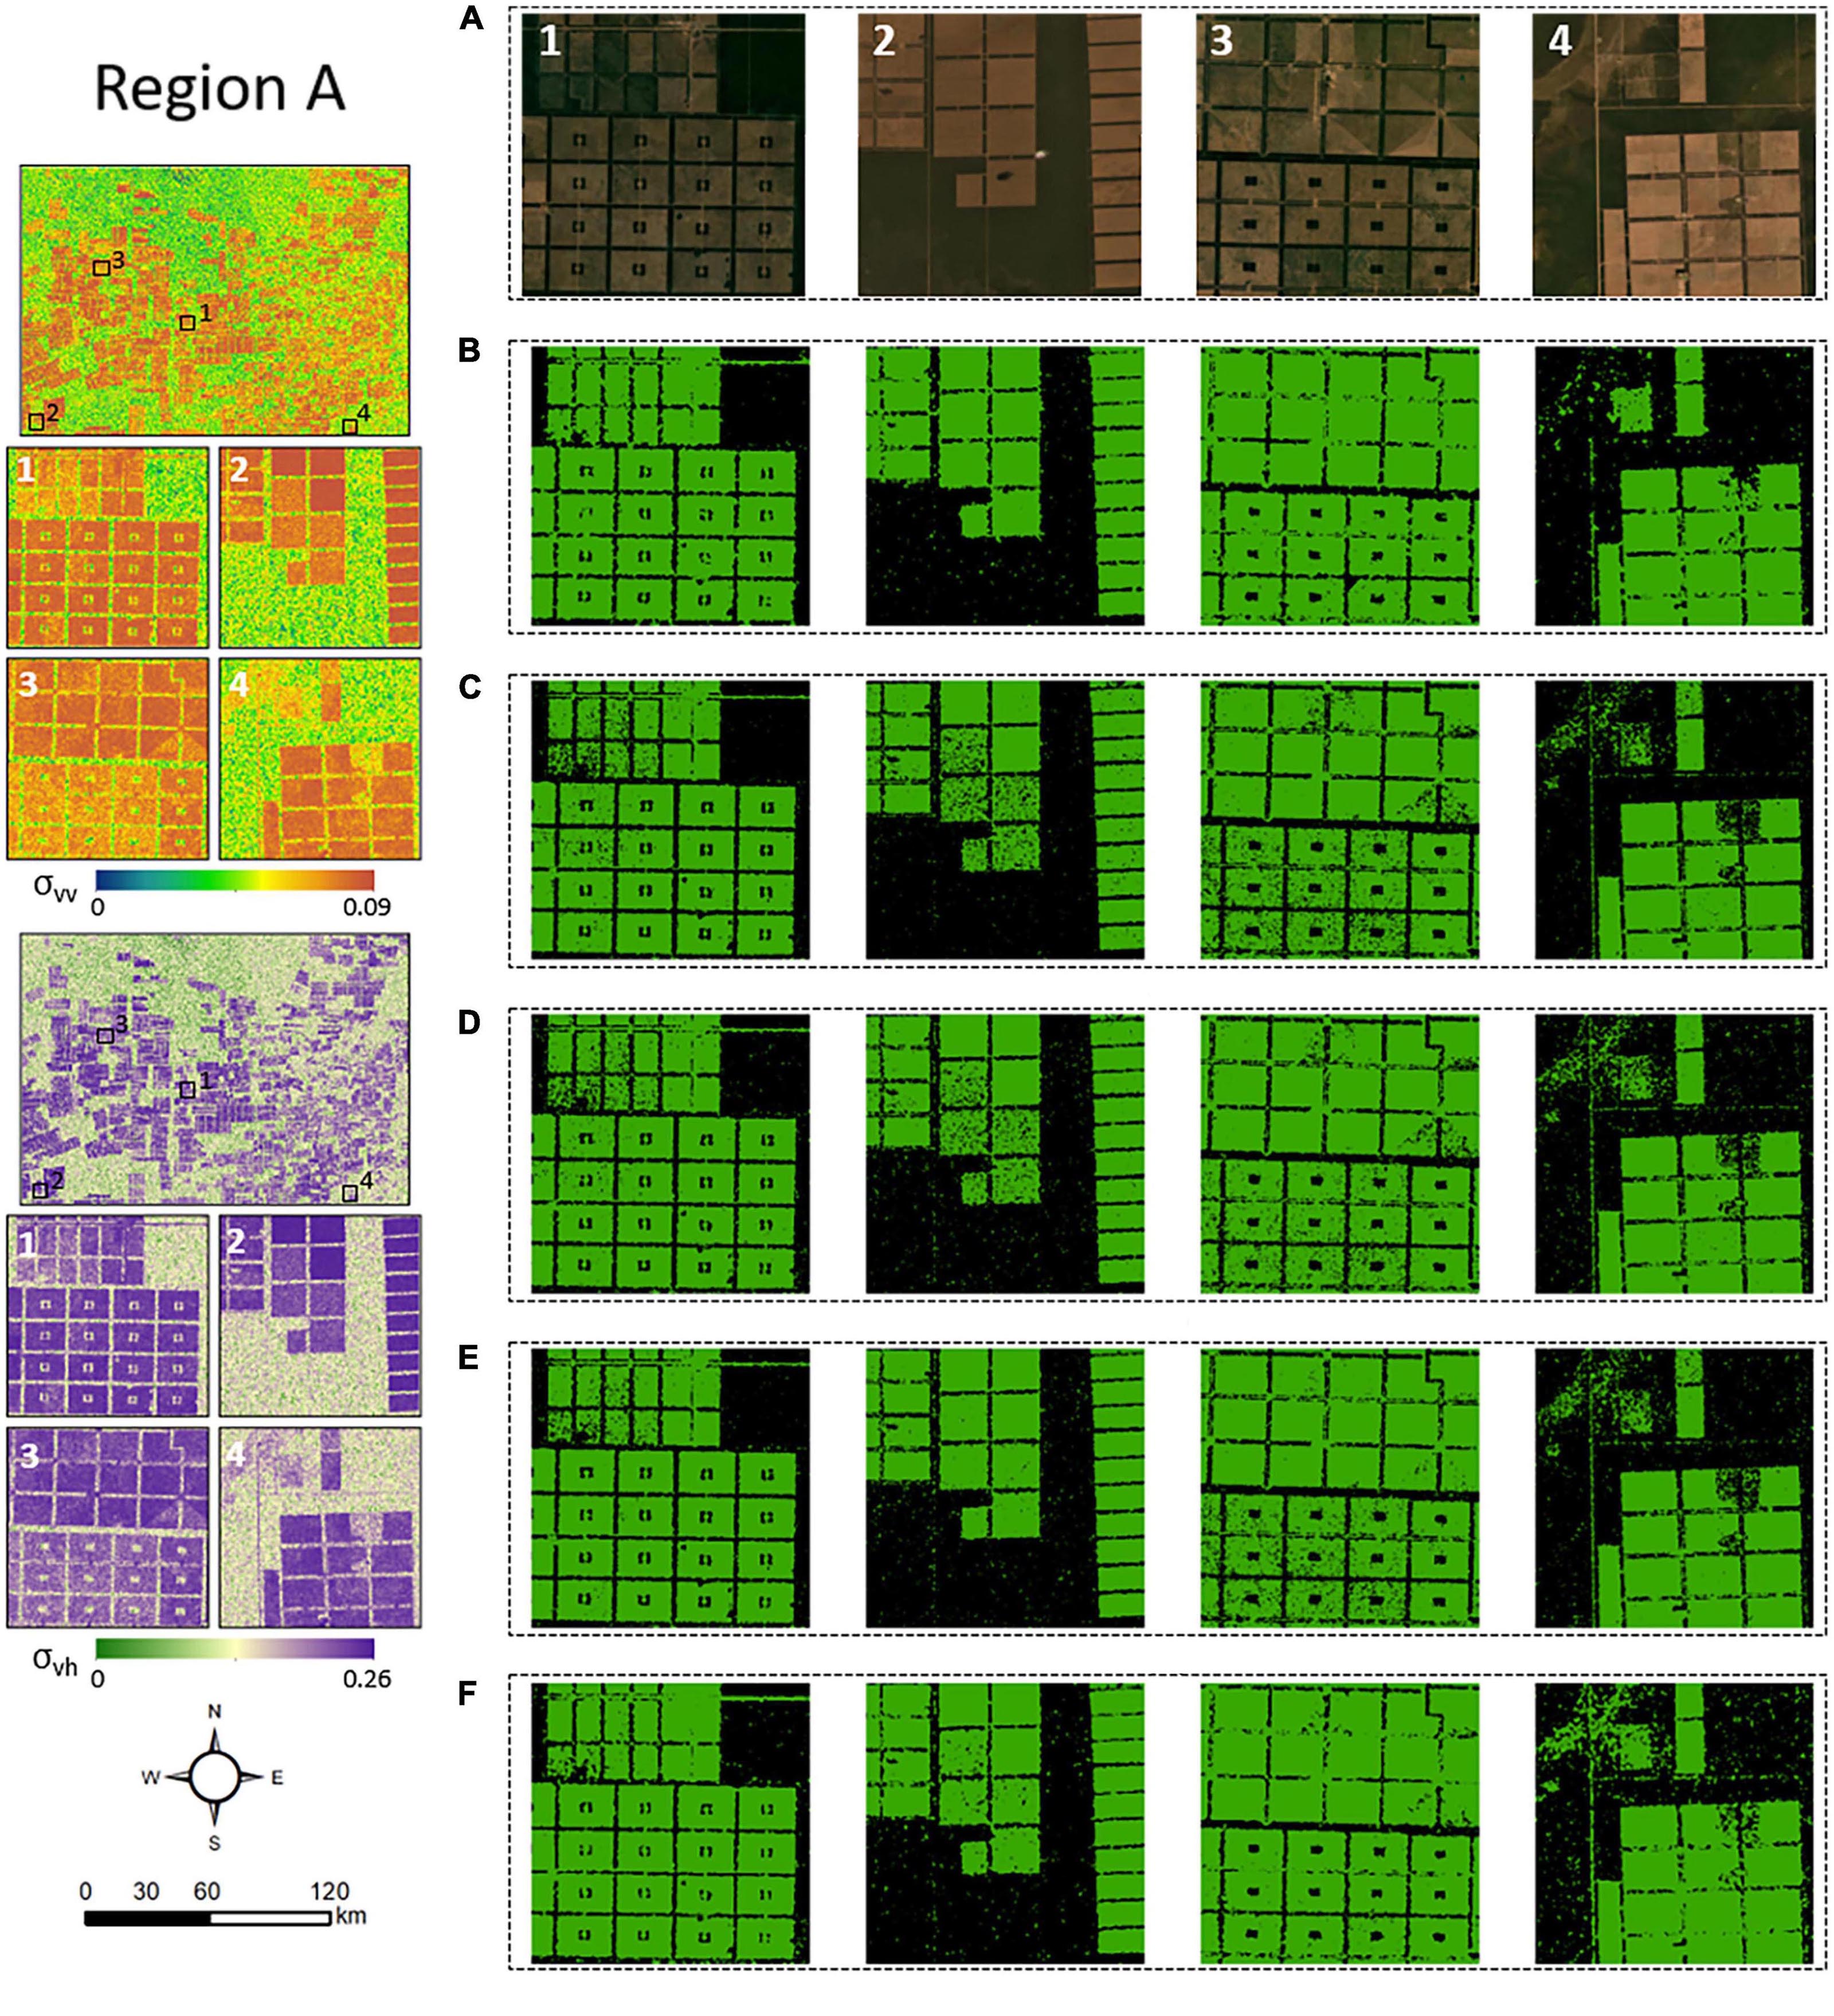
Figure 6. Deforestation detection results in Paraguay. (A) Planet satellite imagery for October 2019. (B) OOC, (C) MLC, (D) NN, (E) SVM, and (F) 3DC. The left column shows the VV and VH images of the Sentinel-1 data. Note that green represents the deforested areas, and black represents the background. The scale bar in the lower left corner applies to the entire area thumbnail, not to the case window.
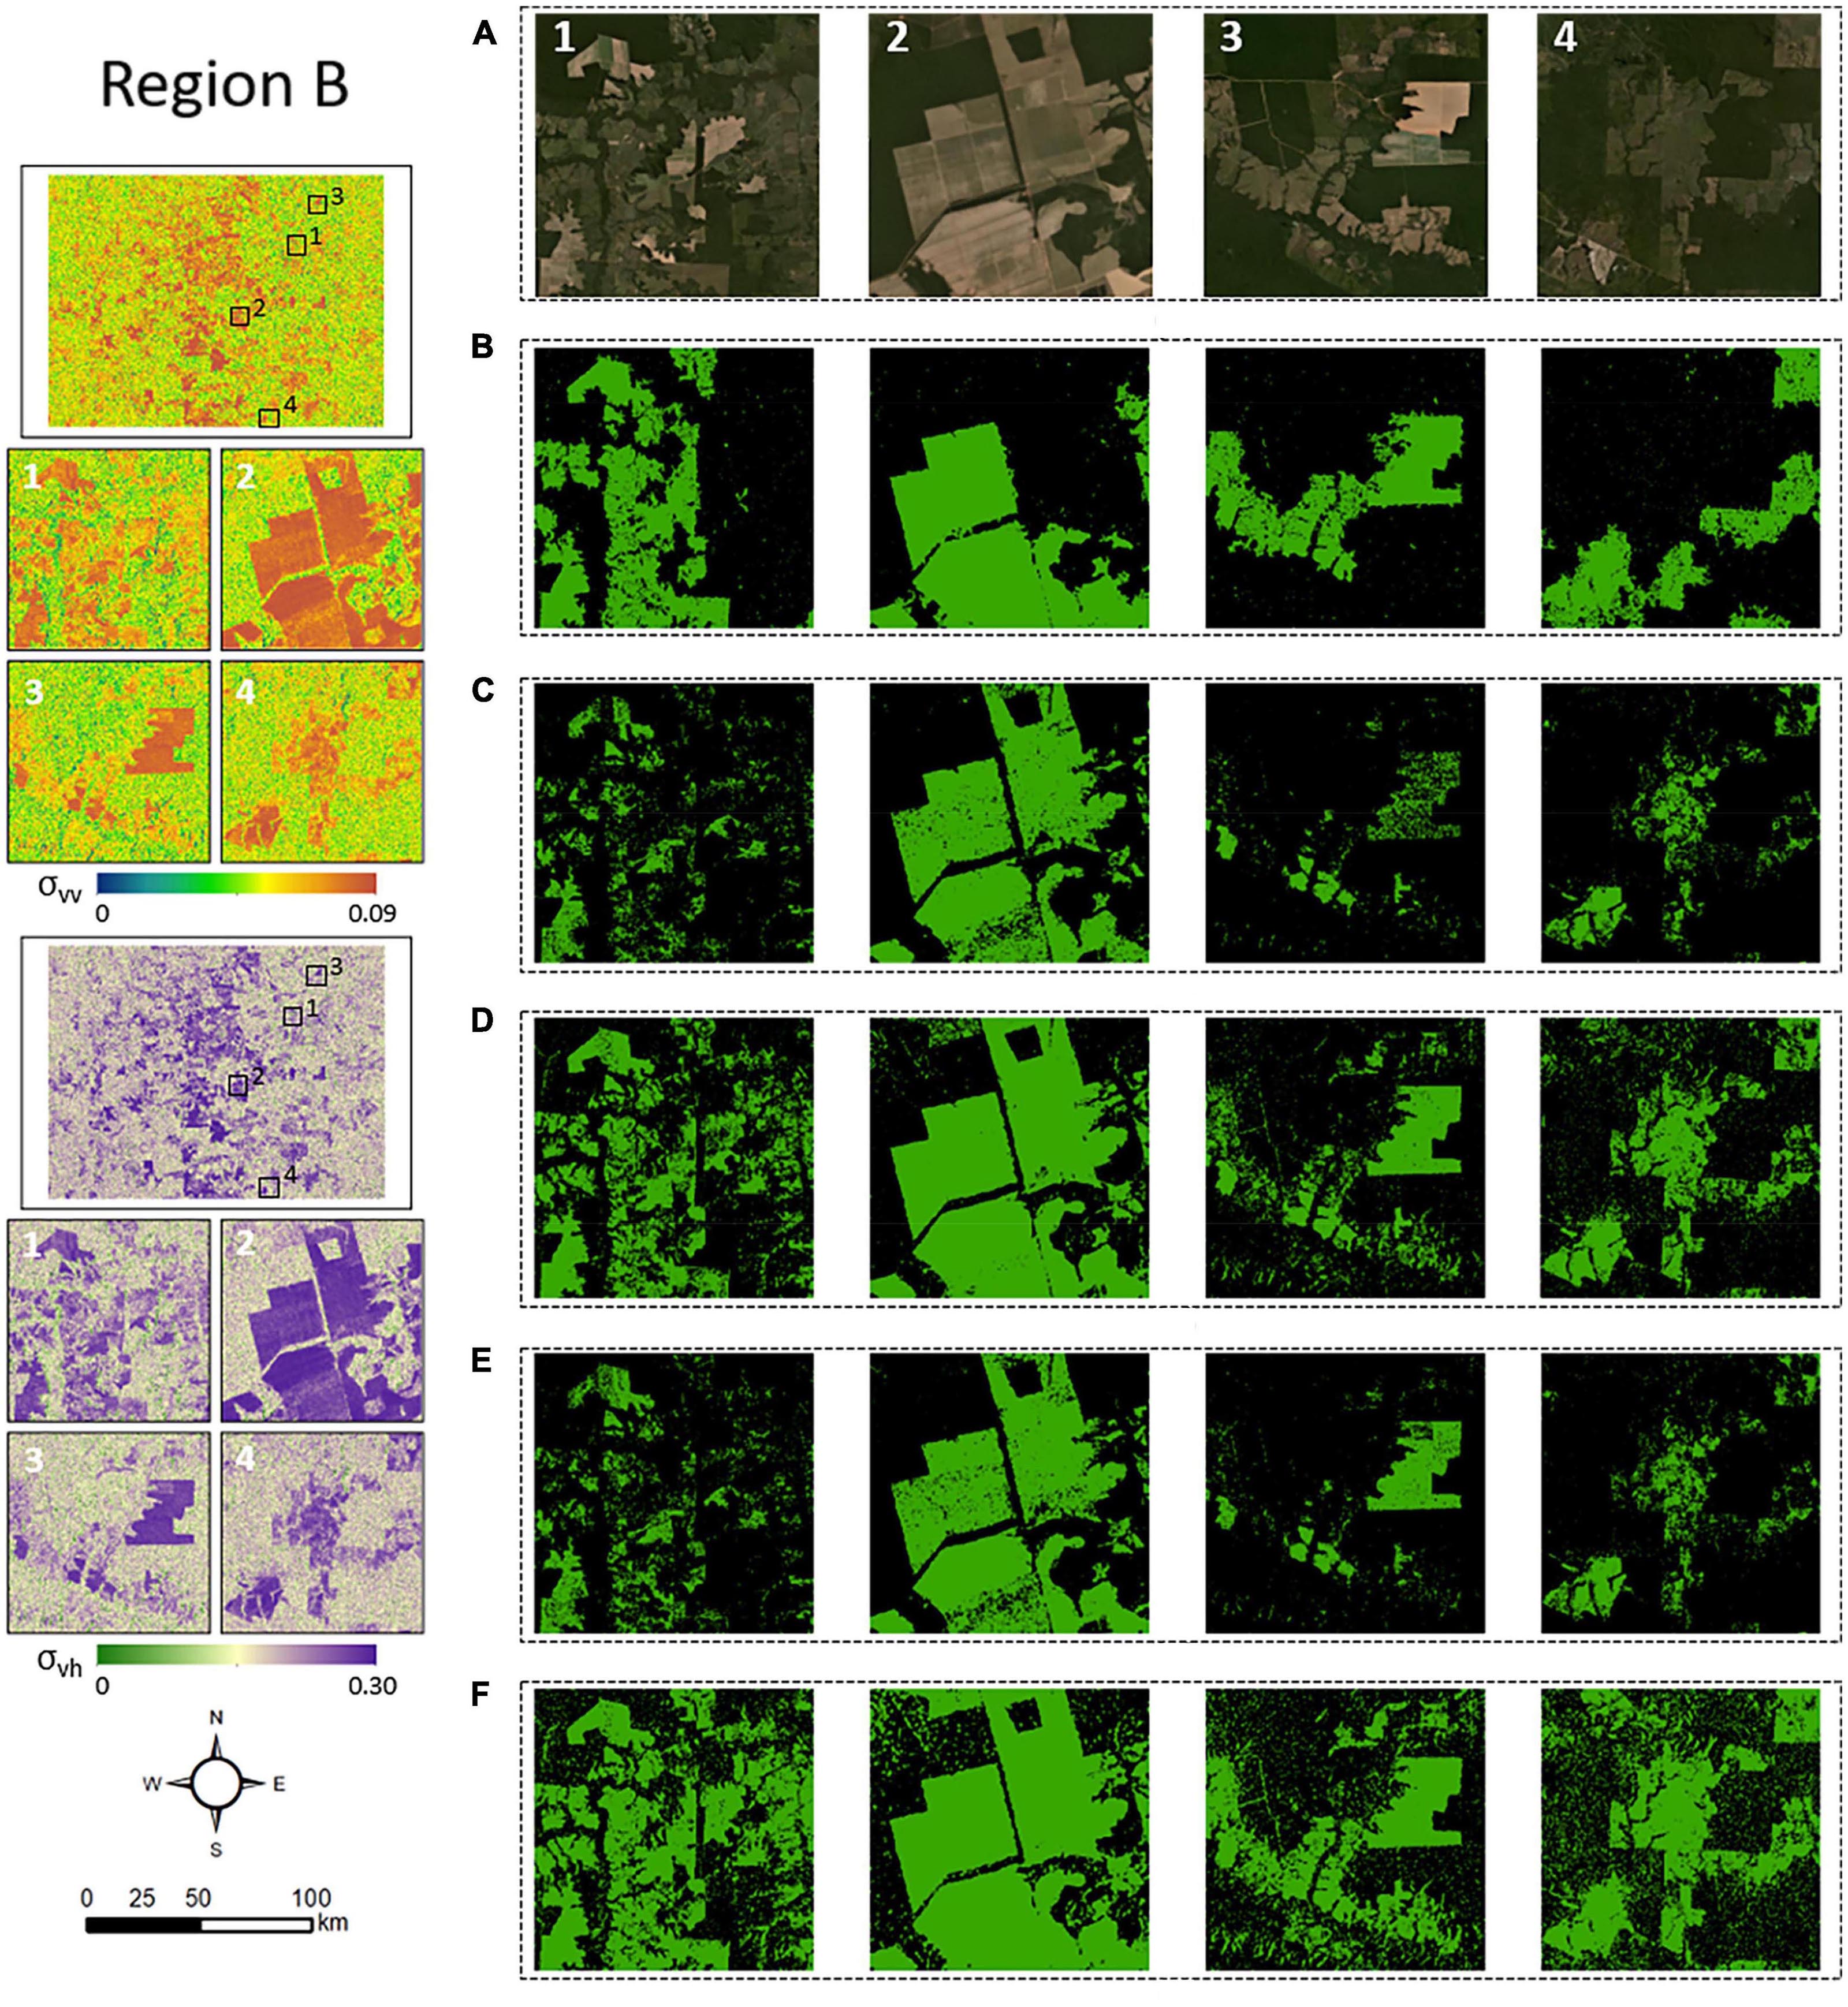
Figure 7. Deforestation detection results in Brazil. (A) Planet satellite imagery for September 2021. (B) OOC, (C) MLC, (D) NN, (E) SVM, and (F) 3DC. The left column shows the VV and VH images of the Sentinel-1 data. Note that green represents the deforested areas, and black represents the background. The scale bar in the lower left corner applies to the entire area thumbnail, not to the case window.
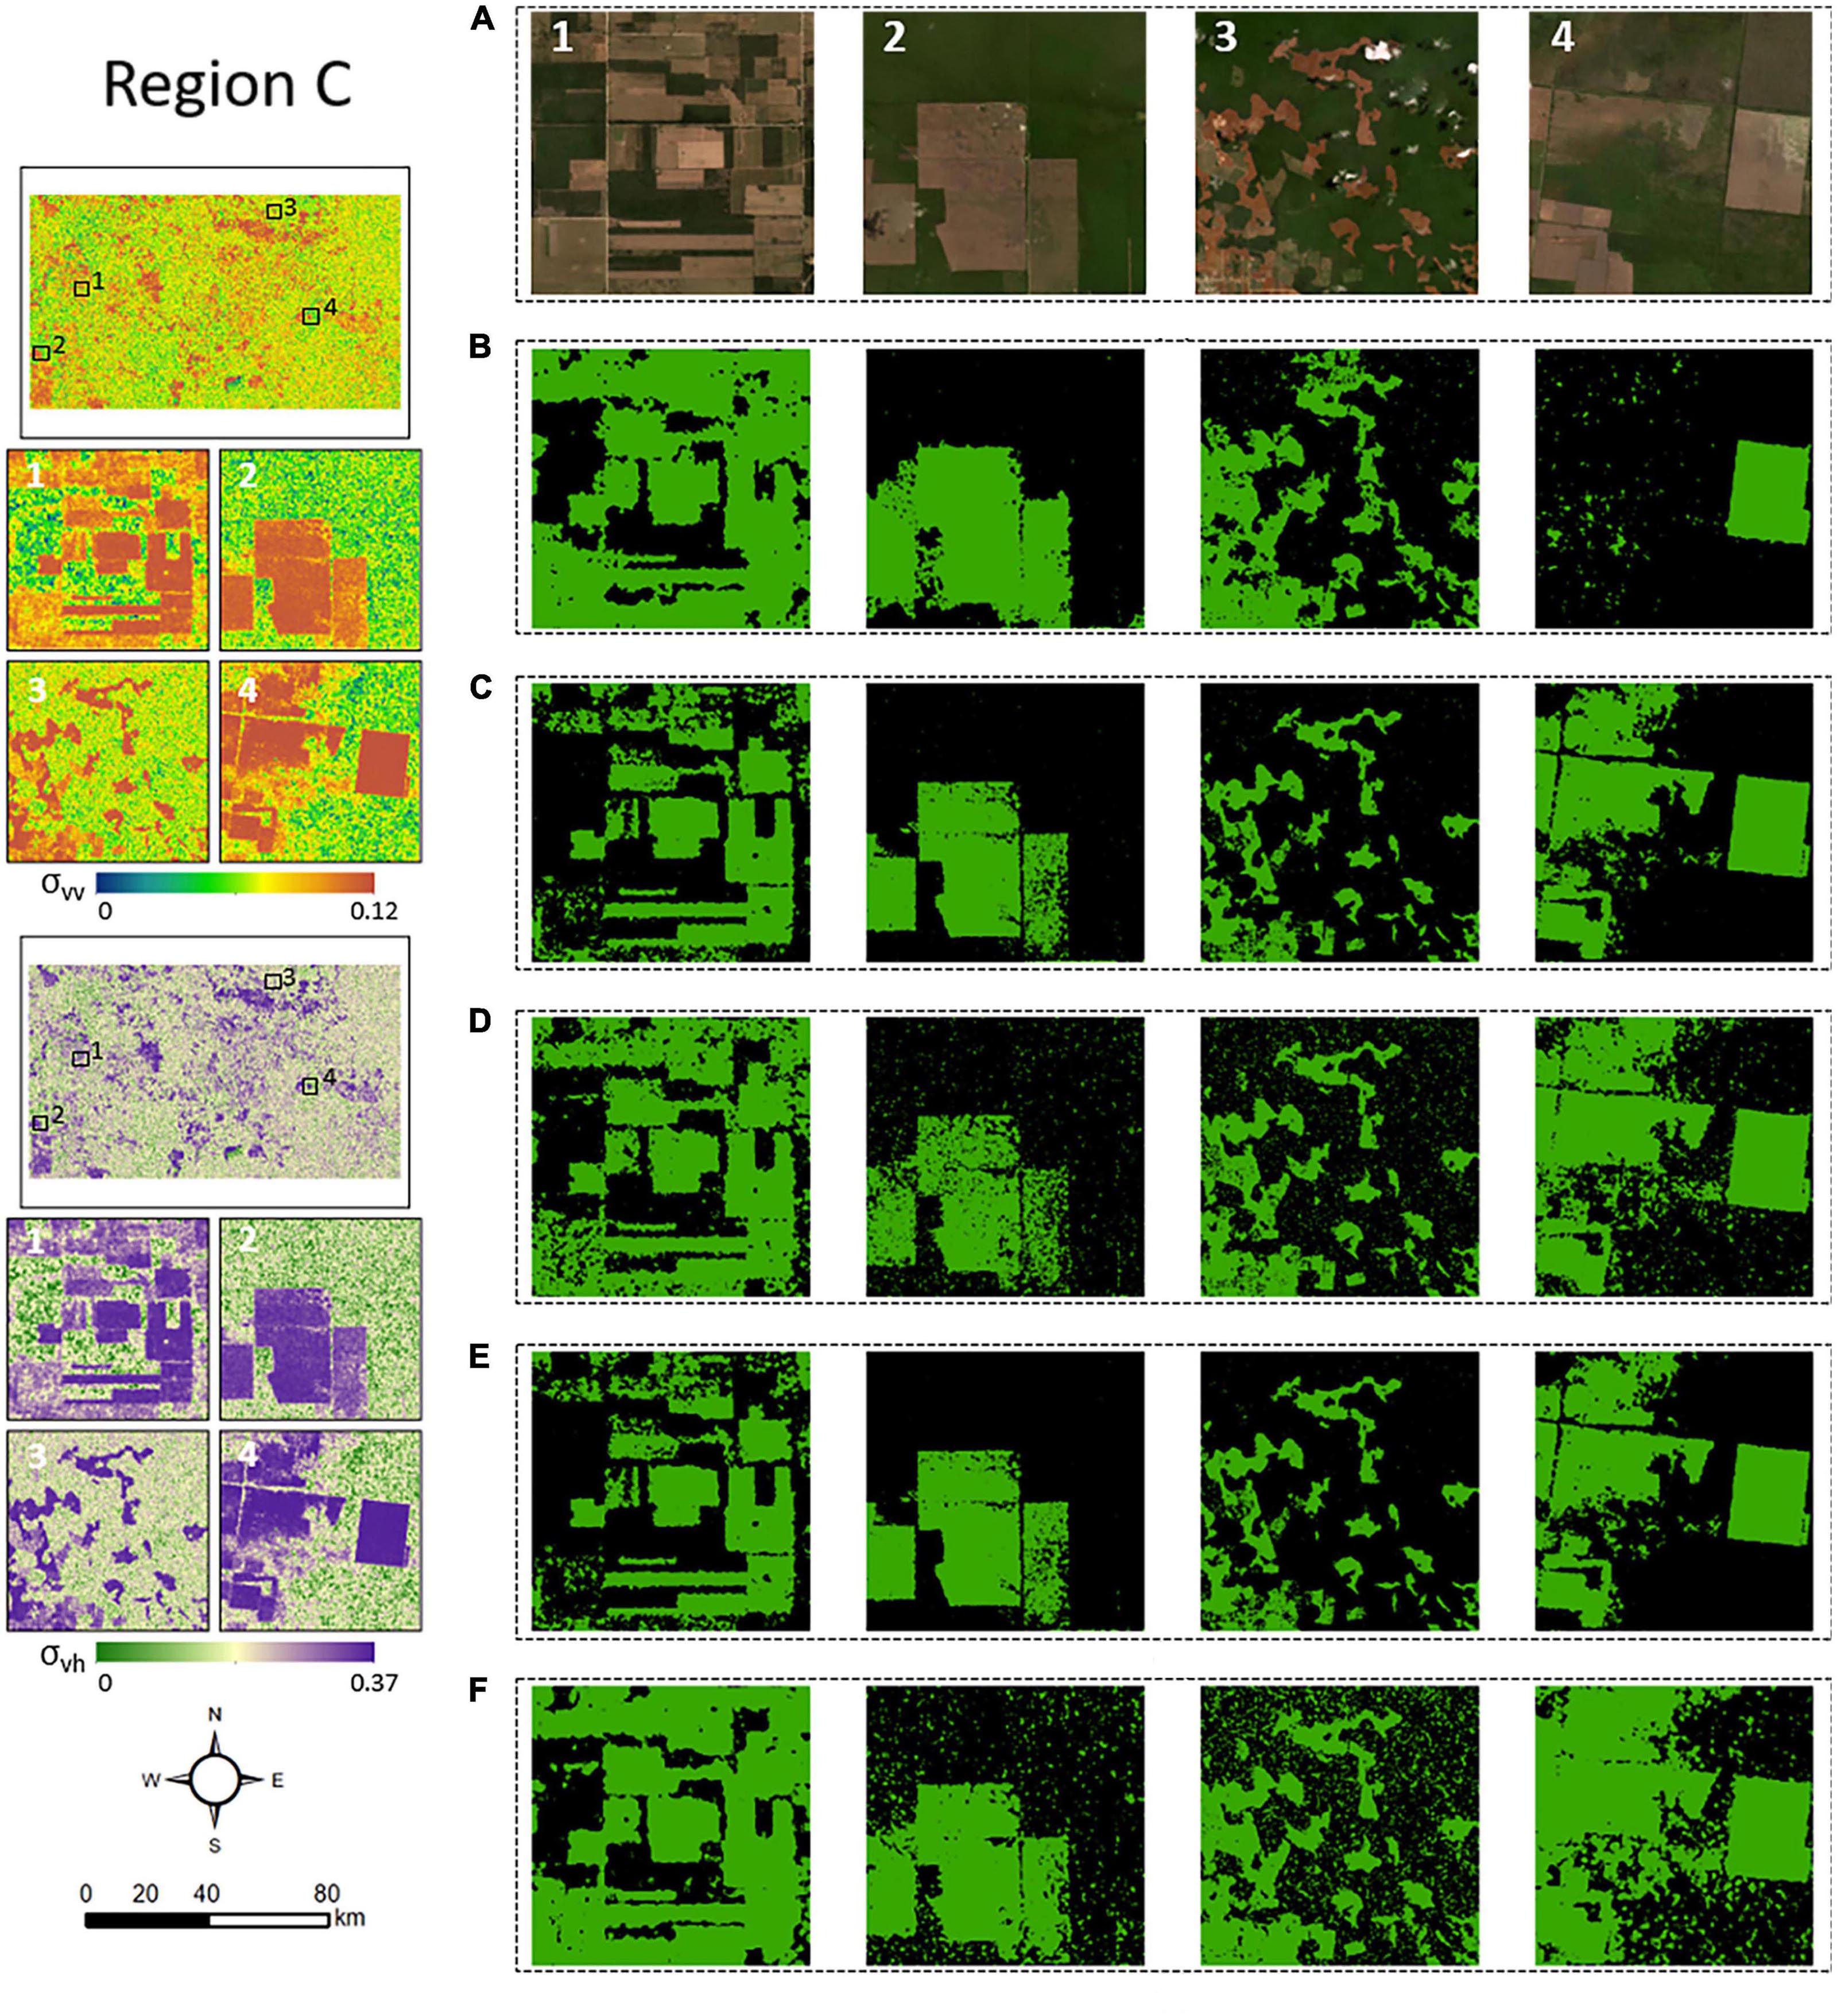
Figure 8. Deforestation detection results in Mexico. (A) Planet satellite imagery for September 2022. (B) OOC, (C) MLC, (D) NN, (E) SVM, and (F) 3DC. The left column shows the VV and VH images of the Sentinel-1 data. Note that green represents the deforested areas, and black represents the background. The scale bar in the lower left corner applies to the entire area thumbnail, not to the case window.
4.4. Consistency with the GFC maps
Figure 9 shows the 3DC results and GFC maps in the three study areas for a given year. In general, the 3DC results closely matched the GFC maps in all study areas. Moreover, the 3DC results provided more adequate and detailed distribution information. In Region B, for forest loss at two locations on the GFC map, 3DC was able to identify areas as deforested. Furthermore, the 3DC showed the distribution of deforested areas at a higher spatial resolution. For regions A and C, the 3DC and GFC maps were highly consistent in the overall spatial pattern, with differences some areas. For example, the differences occur mainly in some newly deforested areas, as shown by the red circles in Figure 9.

Figure 9. Comparison between the 3DC and GFC maps in three regions.
Figure 10 shows the multi-year dynamics of deforestation in Paraguay identified using the 3DC. It is not difficult to see that the identification results of deforestation areas using the 3DC closely match the extent of deforestation areas in the GFC maps (Figure 10). As shown in Figure 10, both maps yield consistent deforestation area extents, but there are differences in the years of deforestation. This is because the 3DC results were derived using single-period image for August, and the deforestation events may occur after August (i.e., between September and December). In conclusion, the comparison with the GFC maps demonstrated the accuracy and robustness of the 3DC in identifying deforestation areas.
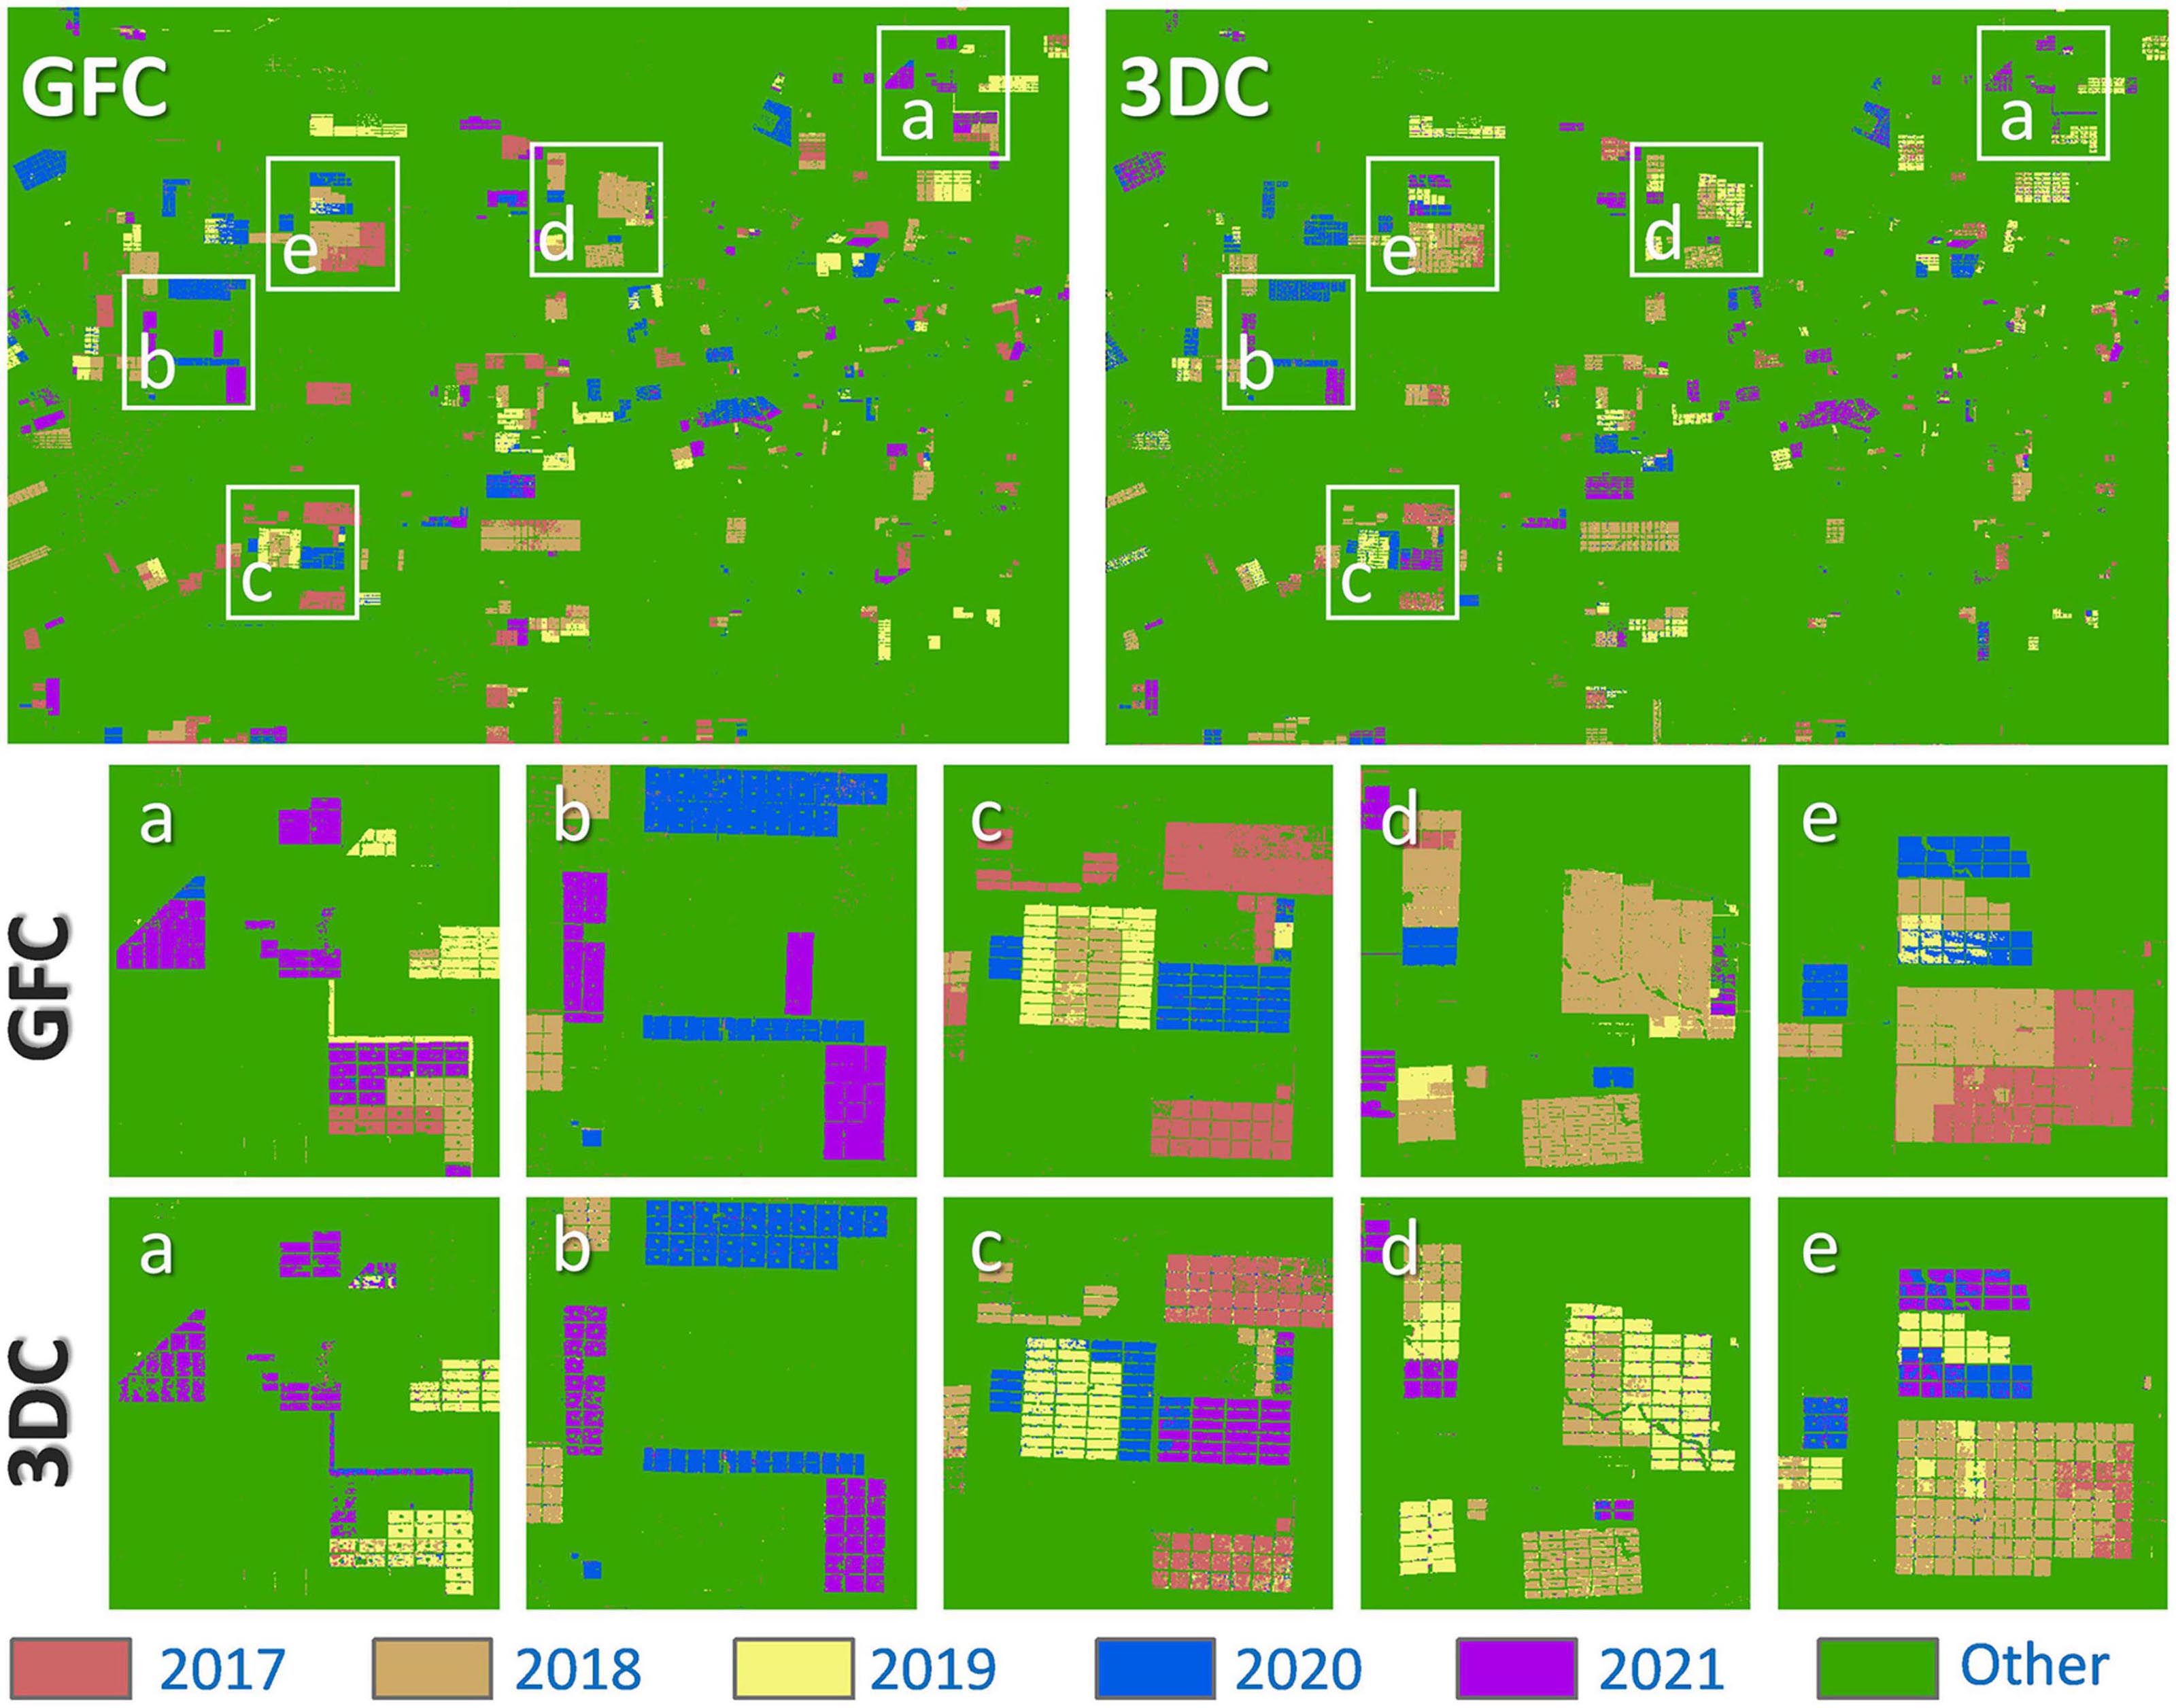
Figure 10. Comparison between the 3DC and GFC maps on a multi-year scale.
4.5. Applying the 3DC to detect deforestation events in Paraguay
Through the above study, we found that the 3DC can accurately and efficiently detect deforestation events in the tropics. We applied the 3DC to the dynamic mapping of deforestation in Paraguay in 2021 (Figure 11). We found that the deforestation events in Paraguay occurred mainly in the latter part of the year (June to January of the following year), which further explains why some deforested areas were missed by the 3DC (Figures 10, 11). Compared to the GFC maps, the 3DC not only accurately identified deforestation events, but also monitored deforestation events at a higher temporal frequency. Specifically, for deforestation events in Paraguay, the reporting time for GFC products is often delayed, by about 6 months or even a year. According to the study (Bárta et al., 2021), the effective management time after forest destruction is 6 weeks. This may need to be a shorter emergency event for deforestation events, which are more damaging and impactful. The 3DC provides a simple and efficient solution for monitoring frequent deforestation events in the tropics, which can better serve emergency response and post-event management.
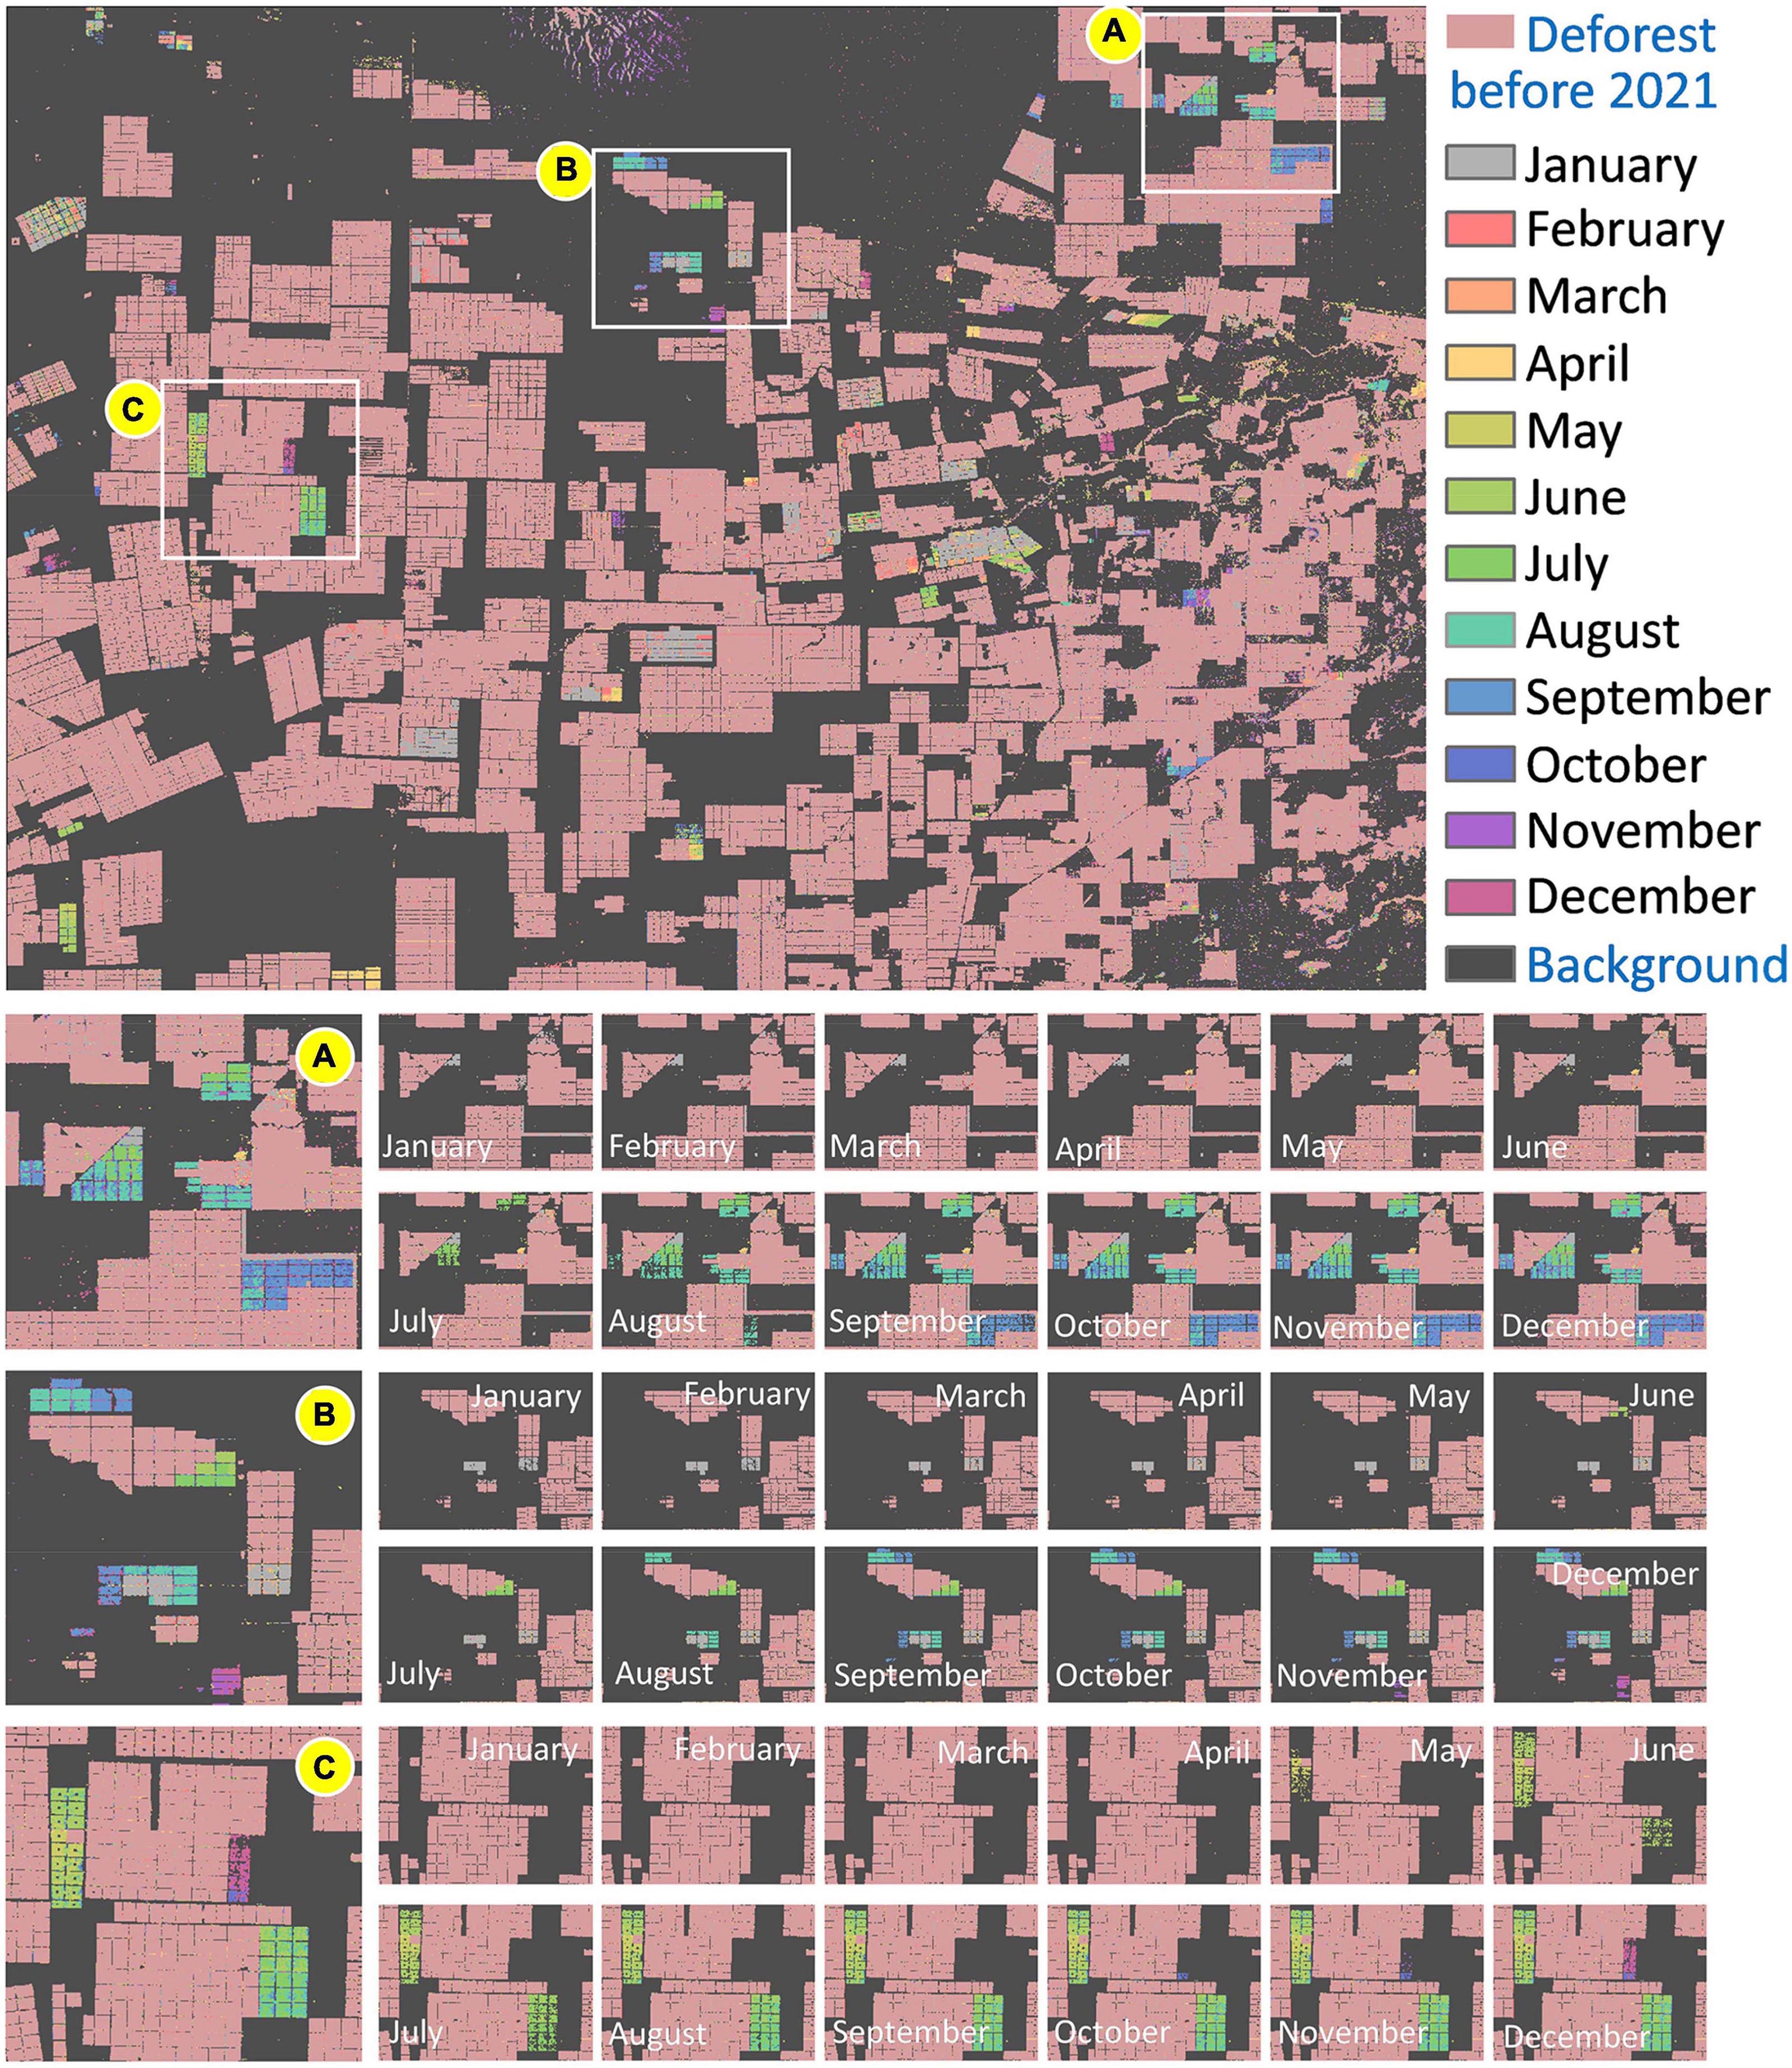
Figure 11. Deforestation dynamics for Paraguay in 2021.
5. Discussion
5.1. Reveals sensitive remote sensing parameters of forest change
We explored the separability of forest and deforestation areas in several features of the radar data to inform the selection of feature parameters for radar image-based deforestation identification. In previous studies, BIs (VV and VH) have been widely used to identify deforestation areas (Ballère et al., 2021; Ygorra et al., 2021; Bullock et al., 2022; Tang et al., 2023). In this study, we found that forests returned higher backscatter values in VH and VV, while deforested areas had lower backscatter values (Figure 5). In addition, the VIs are important indicators in forest research (Joshi et al., 2015; Shimabukuro et al., 2019; Stahl et al., 2023). Our experimental results showed that deforested areas and forests can be well separated based on the PRVI and IDPDD, while there is confusion between the two based on the RVI and RFDI (Figure 5). Moreover, PFs are sensitive to the structural information and dielectric behavior of the target (Sugimoto et al., 2022), with surface scattering dominating in deforested areas and double scattering and volume scattering in forested areas. Our experiment confirmed the effectiveness of PFs (C11 and C22) in separating forest and deforested areas (Figure 5), which is consistent with the study by Sun et al. (2022). Furthermore, we also investigated the effectiveness of the radar feature combination strategy in identifying deforested area (Table 3). The results showed that the combination of BI, VI, and PF achieved the best identification precision for deforested areas, but more features were not necessarily better (Supplementary Figures 3–5).
5.2. Expands the methods for detecting tropical deforestation events
We developed a new method (3DC) based on Sentinel-1 data and tested its accuracy in different regions to extend the forest identification method. First, most previous studies used supervised classification algorithms to map deforestation areas (Magdon et al., 2014; Lee et al., 2020; Ortega Adarme et al., 2022; Slagter et al., 2023). Sample collection requires a lot of manpower and material resources (de Oliveira et al., 2011; Xun et al., 2021; Zhang et al., 2022). Many remote areas are difficult for field investigators to reach, especially in tropical rainforests (de Oliveira et al., 2011). Moreover, existing methods have some lag and delay effect for identifying deforestation area due to limitations of the algorithms or models. The 3DC avoids sample selection work and is suitable for large-scale dynamic monitoring of forests in tropical regions. Second, the GFC maps were updated annually. In contrast, the use of the 3DC method has the potential to achieve higher frequency monitoring of tropical deforestation events. The proposed method achieved accurate identification of deforestation areas on a monthly scale (Figure 11). Finally, the OA, F1, and mIoU in three different test areas were 88.1–98.3%, 90.2–98.5%, and 77.9–96.5%, respectively (Table 4). In conclusion, the 3DC is a simple, efficient, and robust deforestation detection method that can better serve forest management and restoration programs.
5.3. Factors affecting the accuracy of the 3DC
Despite the excellent results obtained by the method for the identification of deforested area, there are still some technical details or limitations that can affect the accuracy of the method. First, we used a mask file (VV > −20 dB) to eliminate the effect of water, which is easily confused with deforestation. However, when applying the method to other areas, fine-tuning of the water threshold may be needed. Because water thresholds vary in different regions, a simple threshold may lead to omission or commission information of deforestation area. In addition, other more accurate methods can be used to determine the extent of water bodies, including water identification using radar texture features (Ygorra et al., 2021) or spectral indices (e.g., MNDWI) (Zou et al., 2018; Huang et al., 2023). Second, we found that the accuracy of 3DC varied across the three test areas (Table 3). It has been suggested that differences in geographic conditions, such as terrain slope, may affect the performance of the method (Altarez et al., 2023). The slope of the terrain affects the incidence angle of the radar beam, and the shadows produced by the slope also affect the radar signal. We analyzed the separability of forest and deforested areas at different slopes in regions B and C. As shown in Supplementary Figure 6, at slopes less than 5, the deforested areas and forest are the most separable at all three eigenvalues. When the slope is greater than 5, all three eigenvalues of the deforested area and forest increase, but the increase in the forest is smaller than that of deforested area; therefore, the separability of the deforested area and forest decreases. In the next study, a more accurate terrain correction model should be considered to reduce the effect of terrain on the proposed method. In addition, the application of 3DC to identify deforested areas in areas with large terrain slopes should be carefully considered.
5.4. Potential policy implications and future research
According to the Global Forest Resources Assessment (FRA) data report, an estimated 420 million hectares of forests have been lost to deforestation worldwide between 1990 and 2020 (Arévalo et al., 2020; Smith et al., 2023). Of these, over 90% occurred in the tropics, with an average annual deforestation of 9.28 million hectares in 2015–2020 (Smith et al., 2023). Forest cover and forest loss rates are high in the tropics, but advanced methods for monitoring deforestation events are still lacking. The development of effective forest monitoring methods is the basis for maintaining the stability of tropical forest ecosystems.
The proposal of the Reducing Emissions from Deforestation and Forest Degradation (REDD+) framework has prompted researchers to pay more attention to deforestation events in the tropics (Muthee et al., 2022; Sugimoto et al., 2022; Tang et al., 2023). One of the main challenges in monitoring deforestation events is the use of monitoring methods that are often cumbersome and lack timeliness. One possible way to overcome this challenge is to develop a simple and rapid method for monitoring deforestation events that is easier for farmers and government managers to use.
The 3DC method developed by using Sentinel-1 radar data proved to be an effective method for monitoring deforestation events. That is, 3DC can provide reliable information on forest dynamics for policymakers and planners in the forestry sector. The method is less susceptible to weather conditions and can detect deforestation events in a timely manner, helping to curb illegal logging activities. In future studies, the 3DC approach could be used to monitor forest hotspots, including South America, Africa, Europe, Australia and Canada. In addition, for areas where deforestation has already occurred, a rational ecological restoration plan can be developed based on field conditions. This is essential for the terrestrial carbon cycle and contributes to regional and global sustainable development.
6. Conclusion
In this paper, we develop an automated method (called 3DC) to identify deforested areas using multidimensional features of Sentinel-1 radar data. The performance of the 3DC method was validated at three selected case areas in Brazil, Paraguay and Mexico. We found that VH, PRVI and C11 were the best performing radar features for deforestation extraction. The experiments showed that the proposed method had satisfactory accuracy, with overall accuracy (OA) and F1 scores greater than 88%. Compared with traditional classification methods, 3DC achieved higher accuracy and avoided complicated sample collection. In the absence of samples, 3DC has a greater advantage. In addition, 3DC and GFC maps were highly spatially matched, but 3DC had higher spatial-temporal resolution. In conclusion, 3DC is a low-cost method that can be used by farmers, policymakers and government administrators. In the future, we will apply the 3DC approach to monitor forest hotspots, including South America, Africa, Europe, Australia, and Canada. We will continue to explore other features (e.g., texture features) that are useful for deforestation extraction and develop effective methods for complex scenarios. Considering the impact of water pixels and terrain slope on the performance of the 3DC methods, we will explore more accurate water body extraction methods and terrain correction methods.
Data availability statement
The original contributions presented in the study are included in the article/Supplementary material, further inquiries can be directed to the corresponding author.
Author contributions
CZ: Methodology, Writing – original draft. YP: Conceptualization, Funding acquisition, Methodology, Writing – review and editing. XZ: Methodology, Writing – review and editing. LL: Methodology, Writing – review and editing. XX: Formal Analysis, Writing – review and editing. SR: Writing – review and editing. YG: Writing – review and editing.
Funding
The author(s) declare financial support was received for the research, authorship, and/or publication of this article. This study was funded by the National Natural Science Foundation of China (Grant No. 42192581) and Open Fund of State Key Laboratory of Remote Sensing Science and Beijing Engineering Research Center for Global Land Remote Sensing Products (Grant No. 12800-310430005).
Acknowledgments
We sincerely thank the European Space Agency (ESA) for providing the sentinel-1 radar data. In addition, we thank all the three reviewers for their valuable suggestions.
Conflict of interest
The authors declare that the research was conducted in the absence of any commercial or financial relationships that could be construed as a potential conflict of interest.
The author(s) declared that they were an editorial board member of Frontiers, at the time of submission. This had no impact on the peer review process and the final decision.
Publisher’s note
All claims expressed in this article are solely those of the authors and do not necessarily represent those of their affiliated organizations, or those of the publisher, the editors and the reviewers. Any product that may be evaluated in this article, or claim that may be made by its manufacturer, is not guaranteed or endorsed by the publisher.
Supplementary material
The Supplementary Material for this article can be found online at: https://www.frontiersin.org/articles/10.3389/ffgc.2023.1257806/full#supplementary-material
References
Altarez, R. D. D., Apan, A., and Maraseni, T. (2023). Deep learning U-Net classification of Sentinel-1 and 2 fusions effectively demarcates tropical montane forest’s deforestation. Remote Sens. Appl. 29:100887. doi: 10.1016/j.rsase.2022.100887
Arévalo, P., Olofsson, P., and Woodcock, C. E. (2020). Continuous monitoring of land change activities and post-disturbance dynamics from Landsat time series: A test methodology for REDD+ reporting. Remote Sens. Environ. 238:110051. doi: 10.1016/j.rse.2019.01.013
Ballère, M., Bouvet, A., Mermoz, S., Le Toan, T., Koleck, T., Bedeau, C., et al. (2021). SAR data for tropical forest disturbance alerts in French Guiana: Benefit over optical imagery. Remote Sens. Environ. 252:112159. doi: 10.1016/j.rse.2020.112159
Bárta, V., Hanuš, J., Dobrovolný, L., and Homolová, L. (2021). Comparison of field survey and remote sensing techniques for detection of bark beetle-infested trees. Forest Ecol. Manag. 506:119984. doi: 10.1016/j.foreco.2021.119984
Bhogapurapu, N., Dey, S., Bhattacharya, A., Mandal, D., Lopez-Sanchez, J. M., McNairn, H., et al. (2021). Dual-polarimetric descriptors from Sentinel-1 GRD SAR data for crop growth assessment. ISPRS J. Photogramm. 178, 20–35. doi: 10.1016/j.isprsjprs.2021.05.013
Borlaf-Mena, I., García-Duro, J., Santoro, M., Villard, L., Badea, O., and Tanase, M. A. (2023). Seasonality and directionality effects on radar backscatter are key to identify mountain forest types with Sentinel-1 data. Remote Sens. Environ. 296:113728. doi: 10.1016/j.rse.2023.113728
Bousquet, E., Mialon, A., Rodriguez-Fernandez, N., Mermoz, S., and Kerr, Y. (2022). Monitoring post-fire recovery of various vegetation biomes using multi-wavelength satellite remote sensing. Biogeosciences 19, 3317–3336. doi: 10.5194/bg-19-3317-2022
Bullock, E. L., Healey, S. P., Yang, Z., Houborg, R., Gorelick, N., Tang, X., et al. (2022). Timeliness in forest change monitoring: A new assessment framework demonstrated using Sentinel-1 and a continuous change detection algorithm. Remote Sens. Environ. 276:113043. doi: 10.1016/j.rse.2022.113043
Bullock, E. L., Woodcock, C. E., and Holden, C. E. (2020). Improved change monitoring using an ensemble of time series algorithms. Remote Sens. Environ. 238:111156. doi: 10.1016/j.rse.2019.04.018
Cai, Y., Shi, Q., Xu, X., and Liu, X. (2023). A novel approach towards continuous monitoring of forest change dynamics in fragmented landscapes using time series Landsat imagery. Int. J. Appl. Earth Observ. Geoinform. 118:103226. doi: 10.1016/j.jag.2023.103226
Cardille, J. A., Perez, E., Crowley, M. A., Wulder, M. A., White, J. C., and Hermosilla, T. (2022). Multi-sensor change detection for within-year capture and labelling of forest disturbance. Remote Sens. Environ. 268:112741. doi: 10.1016/j.rse.2021.112741
Castillo, J. A. A., Apan, A. A., Maraseni, T. N., and Salmo, S. G. (2017). Estimation and mapping of above-ground biomass of mangrove forests and their replacement land uses in the Philippines using Sentinel imagery. ISPRS J. Photogramm. 134, 70–85. doi: 10.1016/j.isprsjprs.2017.10.016
Chang, J. G., Shoshany, M., and Oh, Y. (2018). Polarimetric radar vegetation index for biomass estimation in desert fringe ecosystems. IEEE T. Geosci. Remote 56, 7102–7108. doi: 10.1109/TGRS.2018.2848285
Chen, S., Woodcock, C. E., Bullock, E. L., Arévalo, P., Torchinava, P., Peng, S., et al. (2021). Monitoring temperate forest degradation on google earth engine using landsat time series analysis. Remote Sens. Environ. 265:112648. doi: 10.1016/j.rse.2021.112648
Cloude, S. R., and Pottier, E. (1997). An entropy based classification scheme for land applications of polarimetric SAR. IEEE Trans. Geosci. Remote 35, 68–78. doi: 10.1109/36.551935
Cutler, M. E. J., Boyd, D. S., Foody, G. M., and Vetrivel, A. (2012). Estimating tropical forest biomass with a combination of SAR image texture and Landsat TM data: An assessment of predictions between regions. ISPRS J. Photogramm. 70, 66–77. doi: 10.1016/j.isprsjprs.2012.03.011
David, R. M., Rosser, N. J., and Donoghue, D. N. M. (2022). Remote sensing for monitoring tropical dryland forests: A review of current research, knowledge gaps and future directions for Southern Africa. Environ. Res. Commun. 4:042001. doi: 10.1088/2515-7620/ac5b84
De Luca, G., Silva, J. M. N., and Modica, G. (2021). A workflow based on Sentinel-1 SAR data and open-source algorithms for unsupervised burned area detection in Mediterranean ecosystems. GISci. Remote Sens. 58, 516–541. doi: 10.1080/15481603.2021.1907896
De Marzo, T., Pflugmacher, D., Baumann, M., Lambin, E. F., Gasparri, I., and Kuemmerle, T. (2021). Characterizing forest disturbances across the Argentine Dry Chaco based on Landsat time series. Int. J. Appl. Earth Observ. Geoinform. 98:102310. doi: 10.1016/j.jag.2021.102310
de Oliveira, C. G., Paradella, W. R., and da Silva, A. Q. (2011). Assessment of radargrammetric DSMs from TerraSAR-X Stripmap images in a mountainous relief area of the Amazon region. ISPRS J. Photogramm. 66, 67–72. doi: 10.1016/j.isprsjprs.2010.08.008
Decuyper, M., Chávez, R. O., Lohbeck, M., Lastra, J. A., Tsendbazar, N., Hackländer, J., et al. (2022). Continuous monitoring of forest change dynamics with satellite time series. Remote Sens. Environ. 269:112829. doi: 10.1016/j.rse.2021.112829
Doblas, J., Shimabukuro, Y., Sant’Anna, S., Carneiro, A., Aragão, L., and Almeida, C. (2020). Optimizing near real-time detection of deforestation on tropical rainforests using sentinel-1 data. Remote Sens. 12:3922. doi: 10.3390/rs12233922
Duveiller, G., Defourny, P., Desclée, B., and Mayaux, P. (2008). Deforestation in Central Africa: Estimates at regional, national and landscape levels by advanced processing of systematically-distributed Landsat extracts. Remote Sens. Environ. 112, 1969–1981. doi: 10.1016/j.rse.2007.07.026
Eivazi, A., Kolesnikov, A., Junttila, V., and Kauranne, T. (2015). Variance-preserving mosaicing of multiple satellite images for forest parameter estimation: Radiometric normalization. ISPRS J. Photogramm. 105, 120–127. doi: 10.1016/j.isprsjprs.2015.03.007
Fremout, T., Cobián-De Vinatea, J., Thomas, E., Huaman-Zambrano, W., Salazar-Villegas, M., Limache-de la Fuente, D., et al. (2022). Site-specific scaling of remote sensing-based estimates of woody cover and aboveground biomass for mapping long-term tropical dry forest degradation status. Remote Sens. Environ. 276:113040. doi: 10.1016/j.rse.2022.113040
Ghulam, A., Porton, I., and Freeman, K. (2014). Detecting subcanopy invasive plant species in tropical rainforest by integrating optical and microwave (InSAR/PolInSAR) remote sensing data, and a decision tree algorithm. ISPRS J. Photogramm. 88, 174–192. doi: 10.1016/j.isprsjprs.2013.12.007
Giam, X. (2017). Global biodiversity loss from tropical deforestation. Proc. Natl. Acad. Sci. U.S.A. 114, 5775–5777. doi: 10.1073/pnas.1706264114
Grecchi, R. C., Beuchle, R., Shimabukuro, Y. E., Aragao, L., Arai, E., Simonetti, D., et al. (2017). An integrated remote sensing and GIS approach for monitoring areas affected by selective logging: A case study in northern Mato Grosso, Brazilian Amazon. Int. J. Appl. Earth Obs. 61, 70–80. doi: 10.1016/j.jag.2017.05.001
Guimarães, U. S., Narvaes, I. S., Galo, M. L. B. T., da Silva, A. Q., and Camargo, P. O. (2018). Radargrammetric approaches to the flat relief of the amazon coast using COSMO-SkyMed and TerraSAR-X datasets. ISPRS J. Photogramm. 145, 284–296. doi: 10.1016/j.isprsjprs.2018.09.001
Hansen, M. C., and Loveland, T. R. (2012). A review of large area monitoring of land cover change using Landsat data. Remote Sens. Environ. 122, 66–74. doi: 10.1016/j.rse.2011.08.024
Hansen, M. C., Potapov, P. V., Moore, R., Hancher, M., Turubanova, S. A., Tyukavina, A., et al. (2013). High-resolution global maps of 21st-century forest cover change. Science 342, 850–853. doi: 10.1126/science.1244693
Hermosilla, T., Wulder, M. A., White, J. C., and Coops, N. C. (2019). Prevalence of multiple forest disturbances and impact on vegetation regrowth from interannual Landsat time series (1985–2015). Remote Sens. Environ. 233:111403. doi: 10.1016/j.rse.2019.111403
Hethcoat, M. G., Carreiras, J. M. B., Edwards, D. P., Bryant, R. G., and Quegan, S. (2021). Detecting tropical selective logging with C-band SAR data may require a time series approach. Remote Sens. Environ. 259:112411. doi: 10.1016/j.rse.2021.112411
Hou, Z., Xu, Q., Nuutinen, T., and Tokola, T. (2013). Extraction of remote sensing-based forest management units in tropical forests. Remote Sens. Environ. 130, 1–10. doi: 10.1016/j.rse.2012.11.006
Huang, C.-Y., Anderegg, W. R. L., and Asner, G. P. (2019). Remote sensing of forest die-off in the Anthropocene: From plant ecophysiology to canopy structure. Remote Sens. Environ. 231:111233. doi: 10.1016/j.rse.2019.111233
Huang, W., Wang, F., Duan, W., Tang, L., Qin, J., and Meng, X. (2023). Image similarity-based gap filling method can effectively enrich surface water mapping information. ISPRS J. Photogr. Remote Sens. 202, 528–544. doi: 10.1016/j.isprsjprs.2023.07.011
Joshi, N., Mitchard, E. T. A., Woo, N., Torres, J., Moll-Rocek, J., Ehammer, A., et al. (2015). Mapping dynamics of deforestation and forest degradation in tropical forests using radar satellite data. Environ. Res. Lett. 10:034014. doi: 10.1088/1748-9326/10/3/034014
Koch, B. (2010). Status and future of laser scanning, synthetic aperture radar and hyperspectral remote sensing data for forest biomass assessment. ISPRS J. Photogramm. 65, 581–590. doi: 10.1016/j.isprsjprs.2010.09.001
Lechner, A. M., Foody, G. M., and Boyd, D. S. (2020). Applications in remote sensing to forest ecology and management. One Earth 2, 405–412. doi: 10.1016/j.oneear.2020.05.001
Lee, S.-H., Han, K.-J., Lee, K., Lee, K.-J., Oh, K.-Y., and Lee, M.-J. (2020). Classification of landscape affected by deforestation using high-resolution remote sensing data and deep-learning techniques. Remote Sens. 12:3372. doi: 10.3390/rs12203372
Lehmann, E. A., Caccetta, P., Lowell, K., Mitchell, A., Zhou, Z.-S., Held, A., et al. (2015). SAR and optical remote sensing: Assessment of complementarity and interoperability in the context of a large-scale operational forest monitoring system. Remote Sens. Environ. 156, 335–348. doi: 10.1016/j.rse.2014.09.034
Lei, Y., Treuhaft, R., Keller, M., dos-Santos, M., Gonçalves, F., and Neumann, M. (2018). Quantification of selective logging in tropical forest with spaceborne SAR interferometry. Remote Sens. Environ. 211, 167–183. doi: 10.1016/j.rse.2018.04.009
Li, Y., Sulla-Menashe, D., Motesharrei, S., Song, X. P., Kalnay, E., Ying, Q., et al. (2017). Inconsistent estimates of forest cover change in China between 2000 and 2013 from multiple datasets: Differences in parameters, spatial resolution, and definitions. Sci. Rep. 7:8748. doi: 10.1038/s41598-017-07732-5
Liang, M., Duncanson, L., Silva, J. A., and Sedano, F. (2023). Quantifying aboveground biomass dynamics from charcoal degradation in Mozambique using GEDI Lidar and Landsat. Remote Sens. Environ. 284:113367. doi: 10.1016/j.rse.2022.113367
Ma, X., Xu, J., Wu, P., and Kong, P. (2022). Oil spill detection based on deep convolutional neural networks using polarimetric scattering information from sentinel-1 SAR images. IEEE T. Geosci. Remote 60:4204713. doi: 10.1109/TGRS.2021.3126175
Magdon, P., Fischer, C., Fuchs, H., and Kleinn, C. (2014). Translating criteria of international forest definitions into remote sensing image analysis. Remote Sens. Environ. 149, 252–262. doi: 10.1016/j.rse.2014.03.033
Maurya, K., Mahajan, S., and Chaube, N. (2021). Remote sensing techniques: Mapping and monitoring of mangrove ecosystem—a review. Complex Intell. Syst. 7, 2797–2818. doi: 10.1007/s40747-021-00457-z
McRoberts, R. E. (2014). Post-classification approaches to estimating change in forest area using remotely sensed auxiliary data. Remote Sens. Environ. 151, 149–156. doi: 10.1016/j.rse.2013.03.036
Mitchell, A. L., Rosenqvist, A., and Mora, B. (2017). Current remote sensing approaches to monitoring forest degradation in support of countries measurement, reporting and verification (MRV) systems for REDD+. Carbon Balance Manag. 12:9. doi: 10.1186/s13021-017-0078-9
Motohka, T., Shimada, M., Uryu, Y., and Setiabudi, B. (2014). Using time series PALSAR gamma nought mosaics for automatic detection of tropical deforestation: A test study in Riau, Indonesia. Remote Sens. Environ. 155, 79–88. doi: 10.1016/j.rse.2014.04.012
Muthee, K., Duguma, L., Wainaina, P., Minang, P., and Nzyoka, J. (2022). A review of global policy mechanisms designed for tropical forests conservation and climate risks management. Front. For. Glob. Change 4:748170. doi: 10.3389/ffgc.2021.748170
Ortega Adarme, M., Doblas Prieto, J., Queiroz Feitosa, R., and De Almeida, C. A. (2022). Improving deforestation detection on tropical rainforests using sentinel-1 data and convolutional neural networks. Remote Sens. 14:3290. doi: 10.3390/rs14143290
Periasamy, S. (2018). Significance of dual polarimetric synthetic aperture radar in biomass retrieval: An attempt on Sentinel-1. Remote Sens. Environ. 217, 537–549. doi: 10.1016/j.rse.2018.09.003
Poorter, L., Craven, D., and Jakovac, C. C. (2021). Multidimensional tropical forest recovery. Science 374, 1370–1376.
Reiche, J., Hamunyela, E., Verbesselt, J., Hoekman, D., and Herold, M. (2018). Improving near-real time deforestation monitoring in tropical dry forests by combining dense Sentinel-1 time series with Landsat and ALOS-2 PALSAR-2. Remote Sens. Environ. 204, 147–161. doi: 10.1016/j.rse.2017.10.034
Reiche, J., Verbesselt, J., Hoekman, D., and Herold, M. (2015). Fusing Landsat and SAR time series to detect deforestation in the tropics. Remote Sens. Environ. 156, 276–293. doi: 10.1016/j.rse.2014.10.001
Rignot, E., Salas, W. A., and Skole, D. L. (1997). Mapping deforestation and secondary growth in Rondonia, Brazil, using imaging radar and thematic mapper data. Remote Sens. Environ. 59, 167–179. doi: 10.1016/S0034-4257(96)00150-2
Shimabukuro, Y. E., Arai, E., Duarte, V., Jorge, A., Santos, E. G., Gasparini, K. A. C., et al. (2019). Monitoring deforestation and forest degradation using multi-temporal fraction images derived from Landsat sensor data in the Brazilian Amazon. Int. J. Remote Sens. 40, 5475–5496. doi: 10.1080/01431161.2019.1579943
Shimabukuro, Y. E., Beuchle, R., Grecchi, R. C., and Achard, F. (2014). Assessment of forest degradation in Brazilian Amazon due to selective logging and fires using time series of fraction images derived from Landsat ETM+ images. Remote Sens. Lett. 5, 773–782. doi: 10.1080/2150704X.2014.967880
Shimizu, K., Ota, T., Mizoue, N., and Yoshida, S. (2019). A comprehensive evaluation of disturbance agent classification approaches: Strengths of ensemble classification, multiple indices, spatio-temporal variables, and direct prediction. ISPRS J. Photogramm. 158, 99–112. doi: 10.1016/j.isprsjprs.2019.10.004
Shumilo, L., Yailymov, B., Lavreniuk, M., and Bilokonska, Y. (2020). “Remote sensing approaches for deforestation identification in Ukraine,” in Proceedings of the 2020 IEEE 5th International Symposium on Smart and Wireless Systems within the Conferences on Intelligent Data Acquisition and Advanced Computing Systems (IDAACS-SWS), (Dortmund), 1–4. doi: 10.1109/IDAACS-SWS50031.2020.9297054
Silva, R. M., Lopes, A. G., and Santos, C. A. G. (2023). Deforestation and fires in the Brazilian Amazon from 2001 to 2020: Impacts on rainfall variability and land surface temperature. J. Environ. Manag. 326:116664. doi: 10.1016/j.jenvman.2022.116664
Slagter, B., Reiche, J., Marcos, D., Mullissa, A., Lossou, E., Peña-Claros, M., et al. (2023). Monitoring direct drivers of small-scale tropical forest disturbance in near real-time with Sentinel-1 and -2 data. Remote Sens. Environ. 295:113655. doi: 10.1016/j.rse.2023.113655
Smith, C., Baker, J. C. A., and Spracklen, D. V. (2023). Tropical deforestation causes large reductions in observed precipitation. Nature 615, 270–275. doi: 10.1038/s41586-022-05690-1
Smith, V., Portillo-Quintero, C., Sanchez-Azofeifa, A., and Hernandez-Stefanoni, J. L. (2019). Assessing the accuracy of detected breaks in Landsat time series as predictors of small scale deforestation in tropical dry forests of Mexico and Costa Rica. Remote Sens. Environ. 221, 707–721. doi: 10.1016/j.rse.2018.12.020
Stahl, A. T., Andrus, R., Hicke, J. A., Hudak, A. T., Bright, B. C., and Meddens, A. J. H. (2023). Automated attribution of forest disturbance types from remote sensing data: A synthesis. Remote Sensing of Environment 285:113416. doi: 10.1016/j.rse.2022.113416
Sudhakar Reddy, C., Saranya, K. R. L., Vazeed Pasha, S., Satish, K. V., Jha, C. S., Diwakar, P. G., et al. (2018). Assessment and monitoring of deforestation and forest fragmentation in South Asia since the 1930s. Glob. Planet. Change 161, 132–148. doi: 10.1016/j.gloplacha.2017.10.007
Sugimoto, R., Kato, S., Nakamura, R., Tsutsumi, C., and Yamaguchi, Y. (2022). Deforestation detection using scattering power decomposition and optimal averaging of volume scattering power in tropical rainforest regions. Remote Sens. Environ. 275:113018. doi: 10.1016/j.rse.2022.113018
Sun, G., Cheng, J., Zhang, A., Jia, X., Yao, Y., and Jiao, Z. (2022). Hierarchical fusion of optical and dual-polarized SAR on impervious surface mapping at city scale. ISPRS J. Photogramm. 184, 264–278. doi: 10.1016/j.isprsjprs.2021.12.008
Tang, X., Bratley, K. H., Cho, K., Bullock, E. L., Olofsson, P., and Woodcock, C. E. (2023). Near real-time monitoring of tropical forest disturbance by fusion of Landsat, Sentinel-2, and Sentinel-1 data. Remote Sens. Environ. 294:113626. doi: 10.1016/j.rse.2023.113626
Tang, X., Bullock, E. L., Olofsson, P., and Woodcock, C. E. (2020). Can VIIRS continue the legacy of MODIS for near real-time monitoring of tropical forest disturbance? Remote Sens. Environ. 249:112024. doi: 10.1016/j.rse.2020.112024
Tang, X., Bullock, E. L., Olofsson, P., Estel, S., and Woodcock, C. E. (2019). Near real-time monitoring of tropical forest disturbance: New algorithms and assessment framework. Remote Sens. Environ. 224, 202–218. doi: 10.1016/j.rse.2019.02.003
Tarazona, Y., Mantas, V. M., and Pereira, A. J. S. C. (2018). Improving tropical deforestation detection through using photosynthetic vegetation time series – (PVts-β). Ecol. Indic. 94, 367–379. doi: 10.1016/j.ecolind.2018.07.012
Trudel, M., Charbonneau, F., and Leconte, R. (2012). Using RADARSAT-2 polarimetric and ENVISAT-ASAR dual-polarization data for estimating soil moisture over agricultural fields. Can. J. Remote Sens. 38, 514–527. doi: 10.5589/m12-043
Wang, Y., Fang, S., Zhao, L., and Huang, X. (2022). Estimation of maize plant height in North China by means of backscattering coefficient and depolarization parameters using Sentinel-1 dual-pol SAR data. Int. J. Remote Sens. 43, 1960–1982. doi: 10.1080/01431161.2022.2054294
Watanabe, M., Koyama, C. N., Hayashi, M., Nagatani, I., and Shimada, M. (2018). Early-stage deforestation detection in the tropics with L-band SAR. IEEE J. Selected Top. Appl. Earth Observ. Remote Sens. 11, 2127–2133. doi: 10.1109/JSTARS.2018.2810857
Xiao, J., Chevallier, F., Gomez, C., Guanter, L., Hicke, J. A., Huete, A. R., et al. (2019). Remote sensing of the terrestrial carbon cycle: A review of advances over 50 years. Remote Sens. Environ. 233:111383. doi: 10.1016/j.rse.2019.111383
Xu, Q., Hou, Z., and Tokola, T. (2012). Relative radiometric correction of multi-temporal ALOS AVNIR-2 data for the estimation of forest attributes. ISPRS J. Photogramm. 68, 69–78. doi: 10.1016/j.isprsjprs.2011.12.008
Xun, L., Zhang, J., Cao, D., Yang, S., and Yao, F. (2021). A novel cotton mapping index combining Sentinel-1 SAR and Sentinel-2 multispectral imagery. ISPRS J. Photogramm. 181, 148–166. doi: 10.1016/j.isprsjprs.2021.08.021
Yang, H., Pan, B., Wu, W., and Tai, J. (2018). Field-based rice classification in Wuhua county through integration of multi-temporal Sentinel-1A and Landsat-8 OLI data. Int. J. Appl. Earth Obs. 69, 226–236. doi: 10.1016/j.jag.2018.02.019
Ygorra, B., Frappart, F., Wigneron, J. P., Moisy, C., Catry, T., Baup, F., et al. (2021). Monitoring loss of tropical forest cover from Sentinel-1 time-series: A CuSum-based approach. Int. J. Appl. Earth Obs. 103, 102532. doi: 10.1016/j.jag.2021.102532
Zhang, P., Du, P., Guo, S., Zhang, W., Tang, P., Chen, J., et al. (2022). A novel index for robust and large-scale mapping of plastic greenhouse from Sentinel-2 images. Remote Sens. Environ. 276:113042. doi: 10.1016/j.rse.2022.113042
Zhao, C., and Pan, Y. (2023). A novel spectral index for mapping blue colour-coated steel roofs (BCCSRs) in urban areas using Sentinel-2 data. Int. J. Digit. Earth 16, 2862–2884. doi: 10.1080/17538947.2023.2241427
Zhao, F., Sun, R., Zhong, L., Meng, R., Huang, C., Zeng, X., et al. (2022). Monthly mapping of forest harvesting using dense time series Sentinel-1 SAR imagery and deep learning. Remote Sens. Environ. 269:112822. doi: 10.1016/j.rse.2021.112822
Zhu, Z. (2017). Change detection using landsat time series: A review of frequencies, preprocessing, algorithms, and applications. ISPRS J. Photogramm. 130, 370–384. doi: 10.1016/j.isprsjprs.2017.06.013
Keywords: deforestation, tropical, synthetic aperture radar (SAR), feature space model, forest management
Citation: Zhao C, Pan Y, Zhu X, Li L, Xia X, Ren S and Gao Y (2023) Monitoring of deforestation events in the tropics using multidimensional features of Sentinel 1 radar data. Front. For. Glob. Change 6:1257806. doi: 10.3389/ffgc.2023.1257806
Received: 13 July 2023; Accepted: 21 August 2023;
Published: 04 September 2023.
Edited by:
Mehebub Sahana, The University of Manchester, United KingdomReviewed by:
Mohd Rihan, Jamia Millia Islamia, IndiaBhupendra Singh, VCSG Uttarakhand University, Ranichauri, Tehri Garhwal, India
Pulakesh Das, World Resources Institute, United States
Copyright © 2023 Zhao, Pan, Zhu, Li, Xia, Ren and Gao. This is an open-access article distributed under the terms of the Creative Commons Attribution License (CC BY). The use, distribution or reproduction in other forums is permitted, provided the original author(s) and the copyright owner(s) are credited and that the original publication in this journal is cited, in accordance with accepted academic practice. No use, distribution or reproduction is permitted which does not comply with these terms.
*Correspondence: Yaozhong Pan, cHl6QGJudS5lZHUuY24=