 Qingchun Guo
 Zhenfang He1,4
 Zhaosheng Wang
94% of researchers rate our articles as excellent or good
Learn more about the work of our research integrity team to safeguard the quality of each article we publish.
Find out more
ORIGINAL RESEARCH article
Front. For. Glob. Change, 08 December 2023
Sec. Forests and the Atmosphere
Volume 6 - 2023 | https://doi.org/10.3389/ffgc.2023.1249300
This article is part of the Research TopicThe Contribution of Managed Forestry and the Driving Variables in Climate Change Mitigation and AdaptationView all 8 articles
Introduction: Atmospheric temperature affects the growth and development of plants and has an important impact on the sustainable development of forest ecological systems. Predicting atmospheric temperature is crucial for forest management planning.
Methods: Artificial neural network (ANN) and deep learning models such as gate recurrent unit (GRU), long short-term memory (LSTM), convolutional neural network (CNN), CNN-GRU, and CNN-LSTM, were utilized to predict the change of monthly average and extreme atmospheric temperatures in Zhengzhou City. Average and extreme atmospheric temperature data from 1951 to 2022 were divided into training data sets (1951–2000) and prediction data sets (2001–2022), and 22 months of data were used as the model input to predict the average and extreme temperatures in the next month.
Results and Discussion: The number of neurons in the hidden layer was 14. Six different learning algorithms, along with 13 various learning functions, were trained and compared. The ANN model and deep learning models were evaluated in terms of correlation coefficient (R), root mean square error (RMSE), and mean absolute error (MAE), and good results were obtained. Bayesian regularization (trainbr) in the ANN model was the best performing algorithm in predicting average, minimum and maximum atmospheric temperatures compared to other algorithms in terms of R (0.9952, 0.9899, and 0.9721), and showed the lowest error values for RMSE (0.9432, 1.4034, and 2.0505), and MAE (0.7204, 1.0787, and 1.6224). The CNN-LSTM model showed the best performance. This CNN-LSTM method had good generalization ability and could be used to forecast average and extreme atmospheric temperature in other areas. Future climate changes were projected using the CNN-LSTM model. The average atmospheric temperature, minimum atmospheric temperature, and maximum atmospheric temperature in 2030 were predicted to be 17.23 °C, −5.06 °C, and 42.44 °C, whereas those in 2040 were predicted to be 17.36 °C, −3.74 °C, and 42.68 °C, respectively. These results suggest that the climate is projected to continue warming in the future.
Climate change has affected the reproduction and life of plants, alpine plant species and communities, alpine tree lines, the structure and function of forest ecosystems, forest fires, net biome production, terrestrial biodiversity, air quality, and human health (García-Duro et al., 2021; Guo et al., 2021; Zheng et al., 2021; Zhang J.-H. et al., 2021; Farooqi et al., 2022; Khalil and Osborne, 2022; Zhang et al., 2022; Dong et al., 2023; Fernández-Martínez et al., 2023; Neira et al., 2023; Guo et al., 2023a). Climate change threatens the survival and wellness of urban trees, as well as the various benefits they bring to urban residents. It has been predicted that low-latitude cities are at the highest risk as all urban tree species are vulnerable to the impact of climate change (Esperon-Rodriguez et al., 2022). The sensitivity of the phenology of spring leaf unfolding to global warming has significantly decreased (Fu et al., 2015). Modern climate change has caused most tree lines in the Northern Hemisphere to migrate to higher elevations and latitudes (Hansson et al., 2023). Climate change has increased the mortality rate of temporal trees. The increase in the mortality rates of young forests related to climate change is significantly higher than that of older forests due to the higher sensitivity of the former to regional warming (Luo and Chen, 2013). The impact of extreme atmospheric temperatures on forests may depend on tree species and provenance. Half of the annual seedlings of juvenile European beech (Fagus sylvatica L.) are subjected to high-temperature stress in their first spring, and plants exposed to high temperatures exhibit a decrease in growth during their first year (Vander Mijnsbrugge et al., 2021). Radial tree growth is related to temperature rise and altitude differences in the Guandi Mountains. Due to climate change, Picea wilsonii has been more susceptible to high temperatures (Huang et al., 2021). Tree growth has also been shown to be sensitive to climate change in the Northwestern Yunnan Plateau. The relationship between four different chronologies and climatic factors (monthly mean temperature, monthly maximum temperature, monthly minimum temperature, and monthly total precipitation) has been analyzed. In mid-to-high latitudes, the temperature of the first 11 months of a plant’s life is a key factor affecting tree growth (Sun et al., 2021). The burned area of Australian forests presents a linear positive annual trend but increases exponentially during the autumn and winter seasons. The average number of years since the last fire has been continuously decreasing every year for the past 40 years, whereas the frequency of catastrophic forest fires (>1 million hectares) has significantly increased since 2000. The increase in forest burning regions is consistent with serious fire weather conditions, as well as increases in risk factors related to thermal convection (including thunderstorms caused by fires) and fires caused by dry lightning, all of which are related to human climate change to varying degrees (Canadell et al., 2021).
In the context of climate change, the forest composition and ecosystem productivity of temperate forests are currently undergoing significant changes. The sensitivity of ecosystem productivity to temperature (≥50%) is higher than that to precipitation. In the case of climate warming, the increase in ecosystem respiration is greater than that of gross primary productivity, leading to the reduction of carbon sequestration and net ecosystem exchange (Wu et al., 2023). Tree growth positively correlates with air temperature in March but negatively with the highest temperatures in November and September. At the regional level, air temperature accounts for most of the differences in radial growth of both natural forests and planted forests (Ni et al., 2023). The increase in air temperature, site quality, precipitation, and competition intensity has had a positive impact on the growth of tree height in mixed forests in Northeastern China (Tian et al., 2022). The ecosystems in colder regions mainly respond to changes in air temperature, with this group mainly consisting of northern forests, temperate forests, and permafrost (Higgins et al., 2023). The temperatures of the current spring and previous winter are the key factors limiting the growth of Pinus pumila in the north and south of northeastern China (Yang et al., 2022).
At the same time, forests have a significant impact on climate change. The forest ecosystem is the largest carbon pool in the terrestrial ecosystem, accounting for approximately 80% of the total. The forest ecosystem absorbs carbon dioxide from the atmosphere through plant photosynthesis, playing an important role in reducing the increase in carbon dioxide concentration in the atmosphere, reaching carbon neutrality, and alleviating climate change (Caldera and Breyer, 2023; Wang et al., 2023a,b). The positive feedback between carbon levels and climate may exacerbate climate change and affect the achievement of ambitious climate goals, such as the 1.5°C and 2°C warming targets set by the Paris Agreement (Fernández-Martínez et al., 2023). The estimated total amount of aboveground carbon (C) in forest-protected areas (PAs) is 61.43 Gt, accounting for 26% of all terrestrial woody carbon. Compared to unprotected forests, these higher carbon reserves are mainly due to emissions avoided by deforestation and degradation in protected areas. This total amount is roughly equivalent to the annual global emissions of fossil fuels in 1 year (Duncanson et al., 2023).
Global afforestation has led to a weakening of the northern and mid-latitude circulation and a shift toward the poles, slowing down the Atlantic meridional overturning circulation and affecting the strength of Hadley cells, whereas deforestation has led to a reversal of these changes. Therefore, global forestation and deforestation changes have had significant impacts on regional precipitation, temperature, cloud cover, and surface wind patterns (Portmann et al., 2022). Changes in forest and forest coverage have had a significant impact on the regional climate in Changbai Mountain, China. Compared with open land, forests can reduce the summer daytime land surface temperature (LST) and nighttime LST in summer by approximately 1.10°C and 0.07°C, respectively. The increase in forest coverage in summer can reduce the summer daytime LST and nighttime LST by approximately 0.66°C and 0.04°C, respectively. The increase in forest and forest coverage has a cooling effect on the summer temperature of Paektu Mountain, which is mainly reflected in the decrease in daytime temperature. The daytime cooling effect is mainly related to the increase of latent heat flux caused by the increase in evapotranspiration (Zhang J. et al., 2021). Urban trees play an important role in reducing urban surface temperature through transpiration and evapotranspiration (Schwaab et al., 2021). The cooling effect of urban trees is reflected in the absolute coverage of trees and the cooling efficiency of trees. In the context of global cities and climate change, the cooling efficiency of urban trees is likely to change over time, with great spatial heterogeneity (Zhao et al., 2023).
Predicting climate change provides new insights into the management of existing urban green spaces, as well as future afforestation and green space construction planning. A series of climate models have been often used to predict climate change in the past few years (Tewari et al., 2022; Zhou et al., 2022). Regional climate models (RCMs) include regional climate forecasting model (RegCM), weather research and forecasting (WRF), climate-weather research and forecasting (CWRF), providing regional climates for impacts studies (PRECIS), and high-resolution limited-area model (HIRHAM) (Deng et al., 2023). Due to the different climate feedback processes of various models, there is significant uncertainty in climate sensitivity, affecting the credibility of climate forecasting (Guo et al., 2023b).
Artificial neural networks (ANNs) explore artificial intelligence techniques in computing the rendition and superiority utilizing appropriate and admissible input parameters. ANNs can unravel highly non-linear relationships and map complex input–output rules in data, which makes them applicable in multiple fields (Zema et al., 2020; Guo et al., 2023c,d,e). ANNs have been widely utilized in atmospheric science (Astsatryan et al., 2021; Goudarzi et al., 2021; Shrivastava et al., 2022). The Levenberg–Marquardt algorithm has performed better compared to other algorithms in most of the previous studies as it can rapidly solve any non-linear least squares problems (Pakalapati et al., 2019; Perera et al., 2020). However, the Bayesian regularization (BR) algorithm performed better than the Levenberg–Marquardt algorithm in other studies (Pandey et al., 2012; Guo et al., 2020; Nasrudin et al., 2020; Guo and He, 2021; He et al., 2022). The BR algorithm improves the generalization capability of the network by iterating sufficiently during the training process (Pakalapati et al., 2019). In addition, BFGS quasi-Newton and conjugate gradient algorithms have performed better compared to the conventional gradient descent algorithm. These algorithms employ second-order methods, unlike the gradient descent algorithm, which computes first-order methods only (Perera et al., 2020). Generic algorithms can outperform backpropagation algorithms as the former ensures training the network with optimal weights (Awolusi et al., 2019). These learning algorithms have good generalization ability and accuracy. Therefore, various learning algorithms are used to predict atmospheric temperature in Zhengzhou.
With the rapid development of machine learning (ML), the success of ML models in dealing with complex non-linear problems has led to the improvement and substitution of climate models worldwide (Bi et al., 2023). As deep learning (DL) has achieved great success in big data analysis, it may be a good candidate to leverage the potential of complex climate data (Kim et al., 2021). Deep convolutional neural networks (CNNs) are a powerful tool for effectively extracting hidden information from massive data sets and have increasingly been applied in climate prediction (Ham et al., 2019; Sun et al., 2023). Recurrent neural networks (RNNs) are an effective tool for processing sequence data for time series prediction. Due to their inherent problem of vanishing or exploding gradients, the performance of traditional RNNs in sequence prediction has not significantly improved. However, long short-term memory (LSTM) can solve this problem (Gao et al., 2020). Considering the significant time series characteristics of climate data, LSTM has demonstrated excellent predictive performance in the field of climate change (Xing et al., 2023). Gated recurrent units (GRUs) have shown considerable performance, but their structure is simpler, and their computational speed is higher (Gao et al., 2020; Gharehbaghi et al., 2022). The hybrid CNN-GRU prediction model improves prediction accuracy and generalization ability by combining the feature expression ability of CNNs with the time series memory advantage of GRUs (Yu et al., 2021). CNNs have been used to extract high-dimensional features from input climate data, and LSTM has been used to capture temporal correlations within historical sequences. The combined CNN-LSTM model can perform well in time series prediction (Dehghani et al., 2023; Wan et al., 2023). Although deep CNN and LSTM can independently predict time series problems, their performances are limited. For example, CNN is not sensitive to the characteristics of time series, and it is difficult for LSTM to reduce the data dimensionality of high-dimensional problems. Furthermore, finding the optimal hyperparameters for these models is an extraordinary challenge, which may affect prediction performance. To address these limitations, we developed a new CNN-LSTM that leverages the advantages of two algorithms and overcomes their drawbacks. There are three innovations in this study. First, taking features from different time domains as inputs for different machine learning models, we determine the impact of the input variables on the models. Second, multiple models are used to determine the number of hidden neurons to solve the local minima problem of neural networks. Finally, the optimal model is determined by comparing the performance of multiple machine learning models.
We analyzed the following questions: (i) What is the long-term trend of temperature changes in Zhengzhou? (ii) How are the network structures and parameters? (iii) Which training algorithm is most suitable for temperature prediction? (iv) Which training function is most suitable for prediction? (v) Which ML model is most suitable for predicting climate?
The monthly average, minimum, and maximum atmospheric temperatures time series in Zhengzhou city were divided into two groups: one subset for training the parameters of the models and for testing the ANN (from January 1951 to April 2001), and another subset for model prediction (from May 2001 to December 2022). In other words, the training data were 70% of the raw data, and the testing data were 30% of the raw data.
ANN is an artificial intelligence method inspired by neurophysiological discoveries about the structure and function of the human brain, consisting of interconnected units that achieve functions. As shown in Figure 1, the multi-layer feed-forward backpropagation ANN comprises input, hidden, and output layers. Each layer contains multiple neurons (nodes). The output of each neuron (node) is achieved by subsequently applying the activation function (transfer function) to the sum of weighted inputs and thresholds (biases). Various activation functions can be hired, such as softmax, sigmoid, hyperbolic tangent, linear, and threshold (Falcone et al., 2022). Four typical types of activation functions in ANN are tansig, logsig, purelin, and ReLU. The algorithm is a method of finding the minimum loss function. The function of optimization algorithms is to minimize the loss function by improving the training method. The six different algorithms are gradient descent (GD), conjugate gradient (CG), quasi-Newton (QN), Bayesian regularization (BR), Levenberg–Marquardt (LM), and resilient backpropagation (Rprop). The learning functions of CG are CG with Polak–Ribére updates (traincgp), CG with Powell–Beale restarts (traincgb), CG with Fletcher–Reeves updates (traincgf), and scaled CG (trainscg). The training functions of GD are GD (traingd), GD with adaptive learning rate (traingda), GD with momentum (traingdm), and GD with momentum and adaptive learning rate (traingdx). The learning functions of QN are Broyden–Fletcher–Goldfarb–Shanno QN (trainbfg) and one-step Secant backpropagation (trainoss). The learning functions of LM, BR, and RProp are trainlm, trainbr, and trainrp, respectively (Guo et al., 2023e). Thirteen different learning (training) functions were previously employed in predicting monthly average and extreme atmospheric temperatures in Zhengzhou, China (Nasrudin et al., 2020).
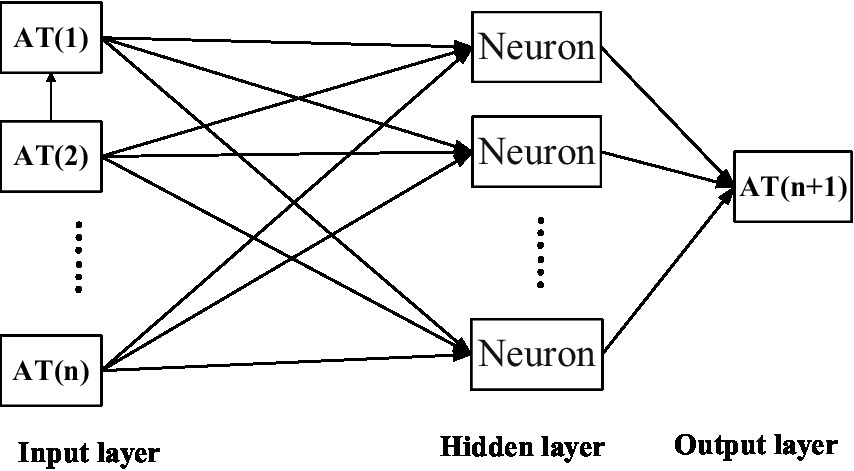
Figure 1. Architecture of the ANN for predicting atmospheric temperature.
In recent years, DL technologies have been used to predict extreme climate changes. Moreover, DL methods have seen impressive progress, with more accurate and effective forecasts of climate change (Wang G.-G. et al., 2023). In this study, the input of the model is considered a sequence of previous climate features in chronological order. Nevertheless, traditional RNNs have the problem of gradient vanishing or exploding due to backpropagation algorithms and long-term dependencies. Therefore, it is difficult for traditional RNNs to capture the correlation of large time steps in time series. To overcome this drawback, GRUs have been proposed as a variant of RNN, which not only overcomes gradient vanishing or explosion problems but also prevents overfitting by utilizing fewer training parameters. In GRUs, the reset gate allows the hidden state to discard any irrelevant information, whereas the update gate controls the amount of information transferred from the previous hidden state to the current hidden state (He et al., 2024).
Compared with traditional RNNs, LSTM can better process valuable information over a relatively long stage. Three gates (input gate, forget gate, and output gate) handle the flow of climate information. The input gate controls whether the new state should be updated into the memory cell (MC), the forget gate controls which information should be forgotten from the previous MC, and the output gate adjusts the output depending on the current MC (Cao et al., 2023).
The key advantage of CNNs is that they can combine feature extraction and prediction tasks into one framework. CNNs can analyze non-linear and non-stationary data. The core parts of a CNN include convolutional layers, max-pooling layers, and fully connected (dense) layers (Zhang et al., 2023).
A CNN comprises two convolutional layers (CLs) and two pooling layers (PLs). First, feature extraction is completed in the CL, and then, the hidden information is obtained through the PL to reduce the dimensionality. Second, the feature vectors output from the CNN are input to the GRU. Finally, the output is normalized inversely to give the final forecast result (Guo et al., 2023f).
The CNN-LSTM model first chooses a suitable CNN model for time series data to predict future fluctuation directions and then establishes an LSTM model to predict specific values. First, feature extraction is performed on the CL of the CNN model. Second, the PL further obtains hidden information and reduces feature dimensions to achieve the training objectives. Third, the pooled information is input to the LSTM layer to obtain features with long-term dependence. Finally, the obtained features are input into the fully connected (FC) layer to predict climate data (Zhang and Li, 2022).
Evaluation tools such as root mean square error (RMSE), mean absolute error (MAE), and correlation coefficient (R) are exploited to assess the effectiveness of the ANN and DL models developed in this study and their ability to make precise predictions. RMSE, MAE, and R are calculated using the following equations:
where denotes the measured atmospheric temperature, denotes the predicted atmospheric temperature, is the mean measured atmospheric temperature, and is the mean predicted atmospheric temperature.
As shown in Figure 2, the annual average, minimum, and maximum atmospheric temperatures in Zhengzhou in 2022 were 3.1°C, 9.1°C, and 2.3°C higher than those in 1951, respectively. The long-term warming rate of the annual average atmospheric temperature was 0.367°C/10 years from 1951 to 2022. The warming rate of the annual minimum temperature was 0.938°C/10 years. In 2022, the global average temperature was 1.11°C higher than the pre-industrialization level, and it was 0.89°C higher than the baseline period (1951 to 1980), which was one of the five warmest years as there were complete meteorological observation records. In 2022, the average temperature in China was 10.51°C. From 1951 to 2022, China’s annual average surface atmospheric temperature showed an upward trend, with a warming rate of 0.26°C/10 years. The atmospheric temperature in Zhengzhou city rose faster than that of the world and China.
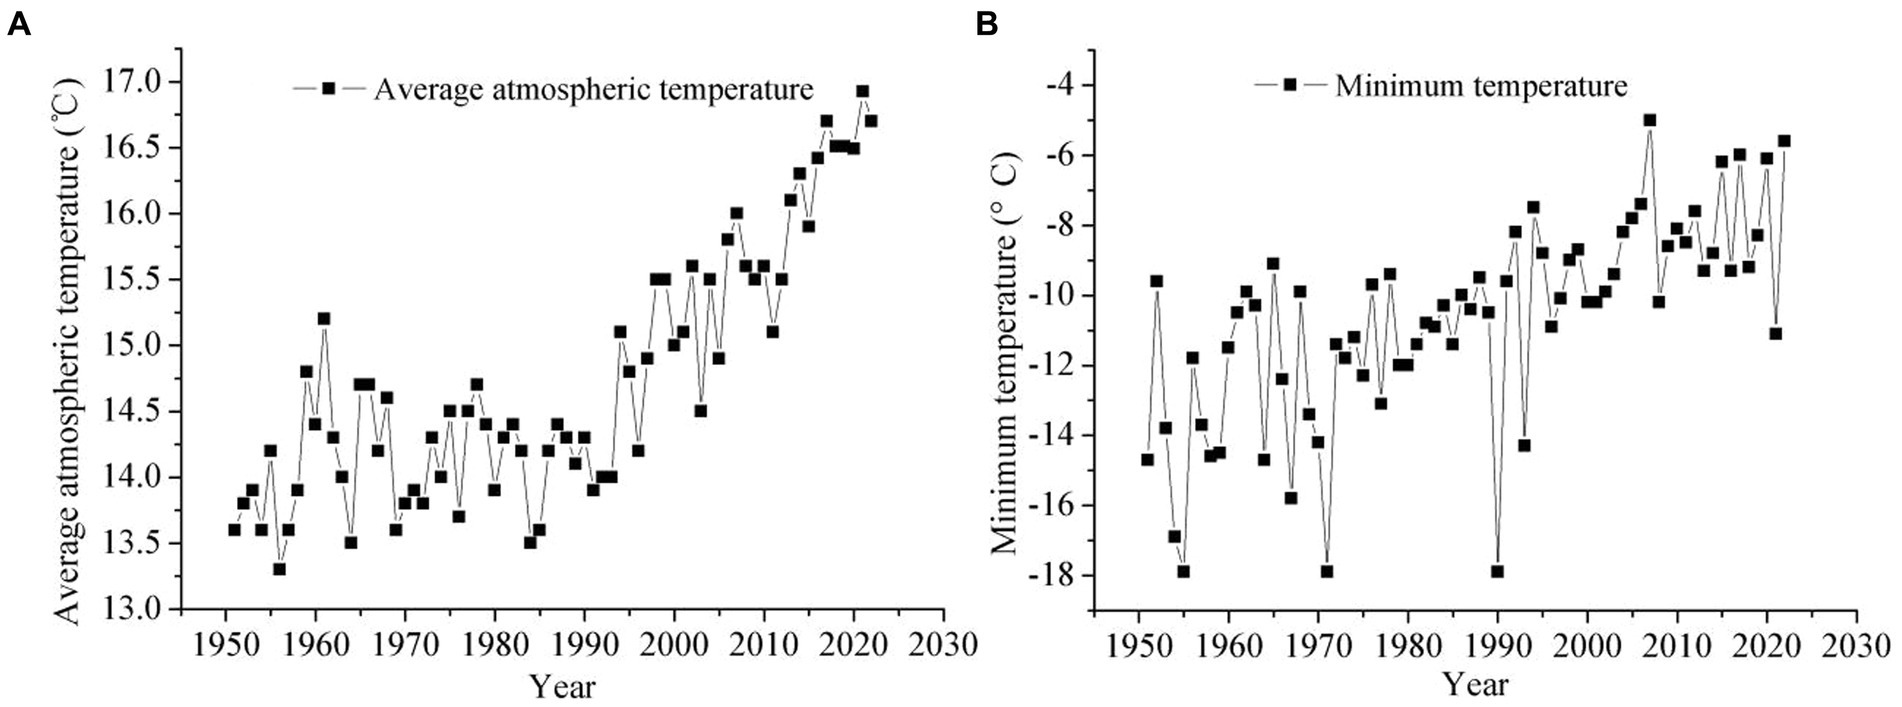
Figure 2. Change of annual average and minimum atmospheric temperatures in Zhengzhou city from 1951 to 2022. (A) Average and minimum atmospheric temperature. (B) Minimum atmospheric temperature.
The number of neurons in the input and hidden layers is practiced by trial and error. The climate dataset is split at a training–testing ratio of 70:30. Training is needed in ML because it allows the model to learn the relationships from the training climate data. This enables the model to generalize to new, unseen climate data and make accurate predictions. The performance of the DL models is also evaluated based on 10-fold cross-validation (CV) results. This is a reliable method to assess the performance of ML models as it eliminates bias in the results generated by the random splitting of the dataset. The climate dataset is initially divided into 10 equal parts: nine are used for training the ML models, and one is used for testing. The remaining eight parts are used to train the model. In the second step, eight parts are used to train the model, and two parts are used for testing. This process is repeated until all 10 parts are used for training and testing. The overall prediction result is the average prediction result of all parts used for training and testing (Vakharia et al., 2016, 2023; Xu et al., 2023). The statistical indicators (R, RMSE, and MAE) of different numbers of neurons are listed in Tables 1–7. Tables 1–6 show the various input variables, and Table 7 shows different neurons in the hidden layer. Tables 1–6 show the simulation results of monthly average atmospheric temperature in the training and testing phases. Twenty-two variables are selected for the prediction model input. We use the most recent 260 months from May 2001 to December 2022 during the prediction phase. Additionally, the number of neurons in the hidden layer is set to 14. Eventually, network topologies of the ANN model (22-14-1) were the best ones.
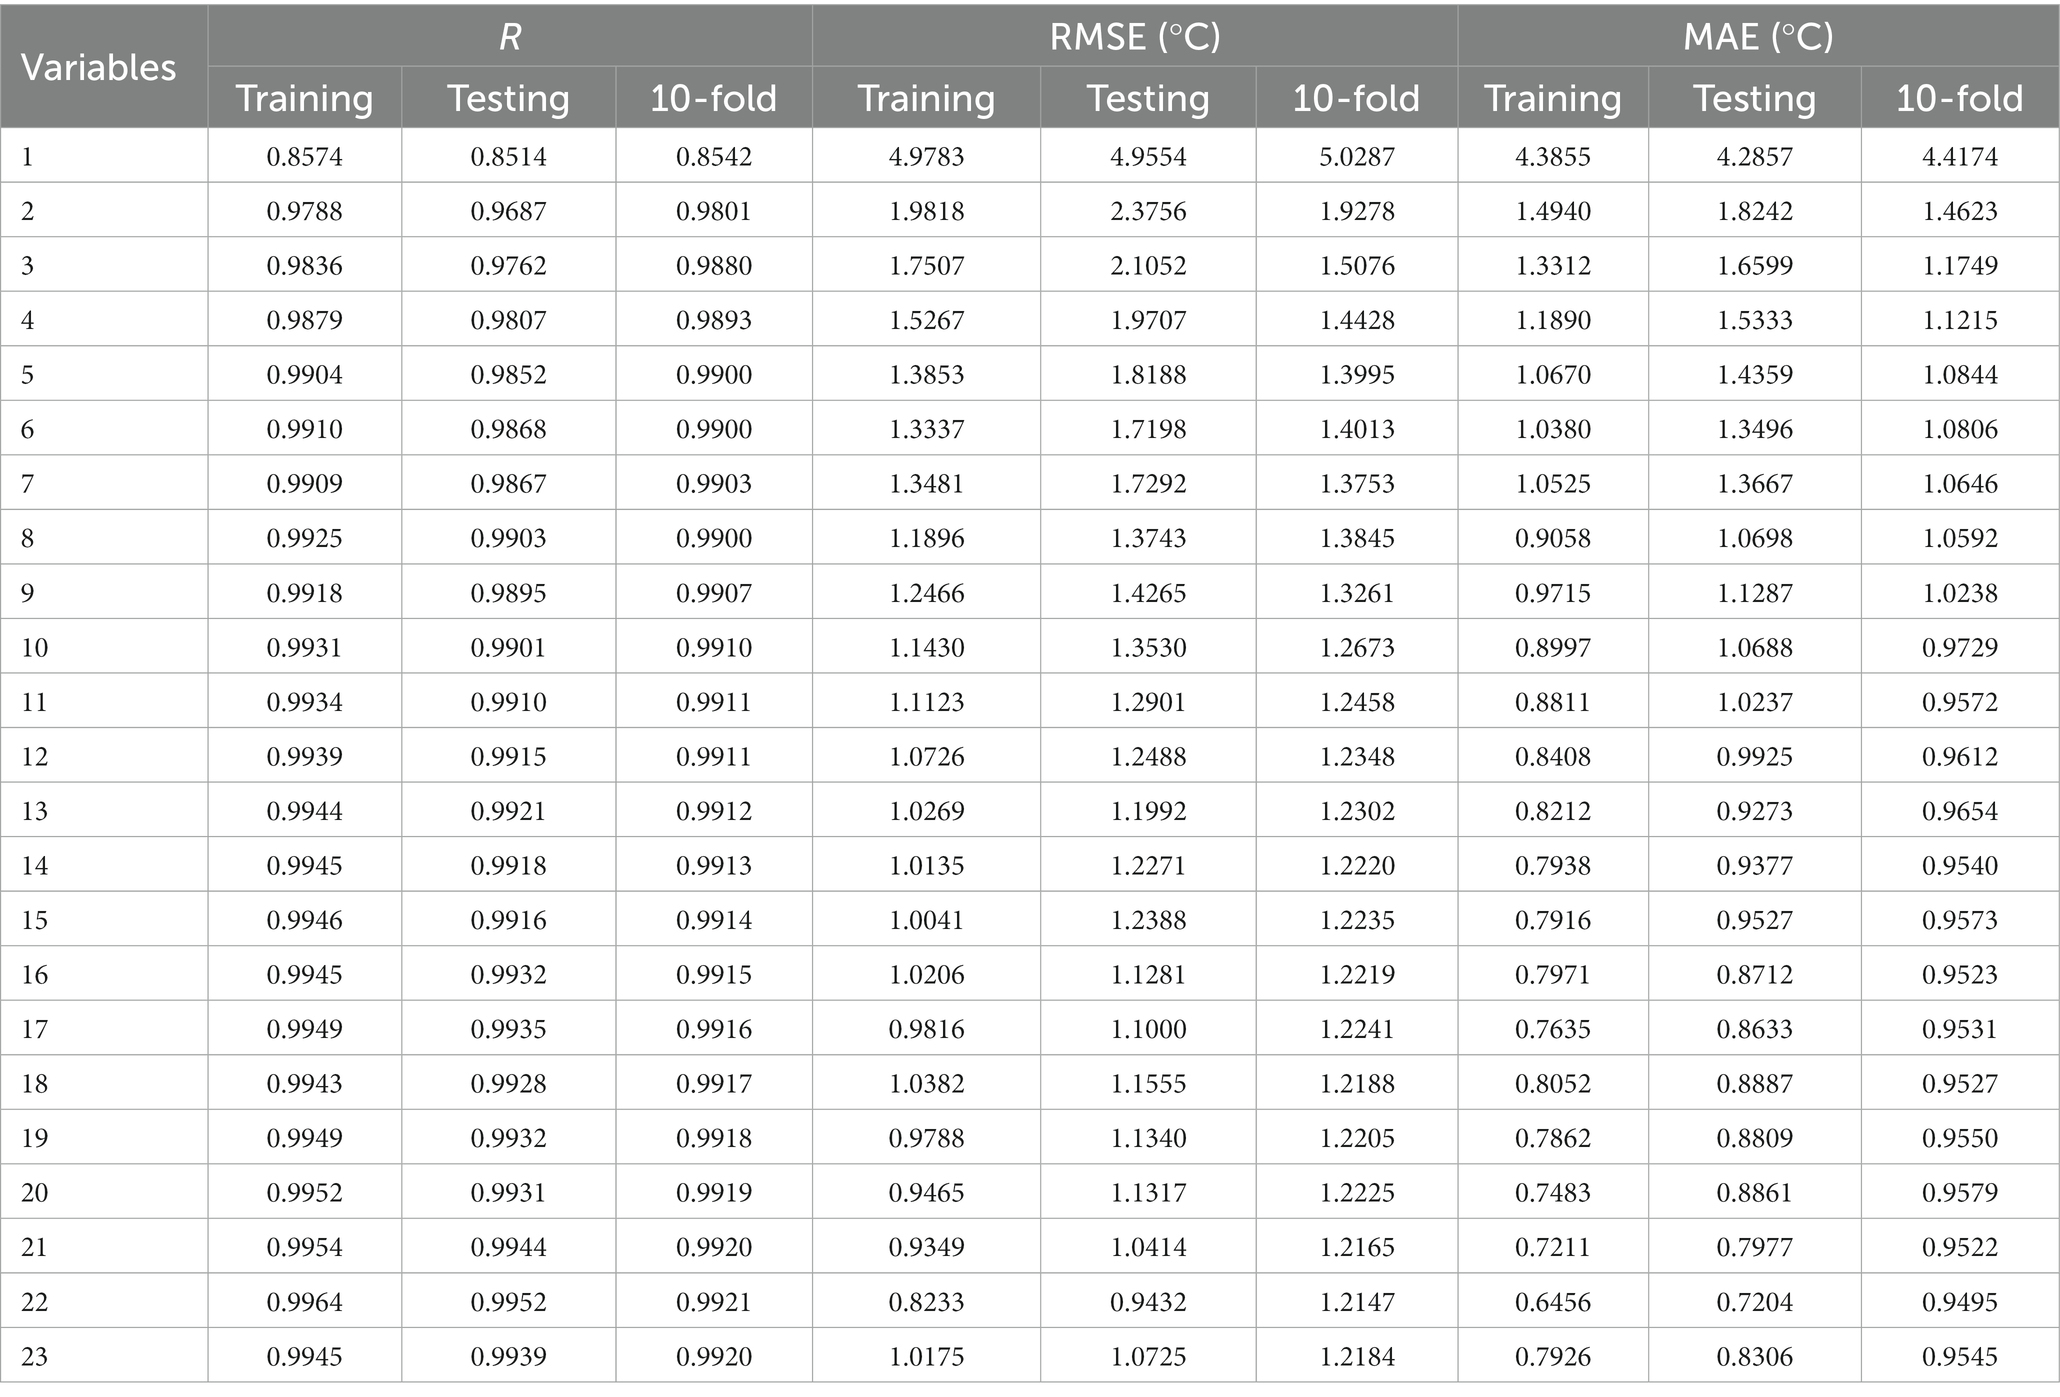
Table 1. Performance comparison between different input neurons for the ANN.
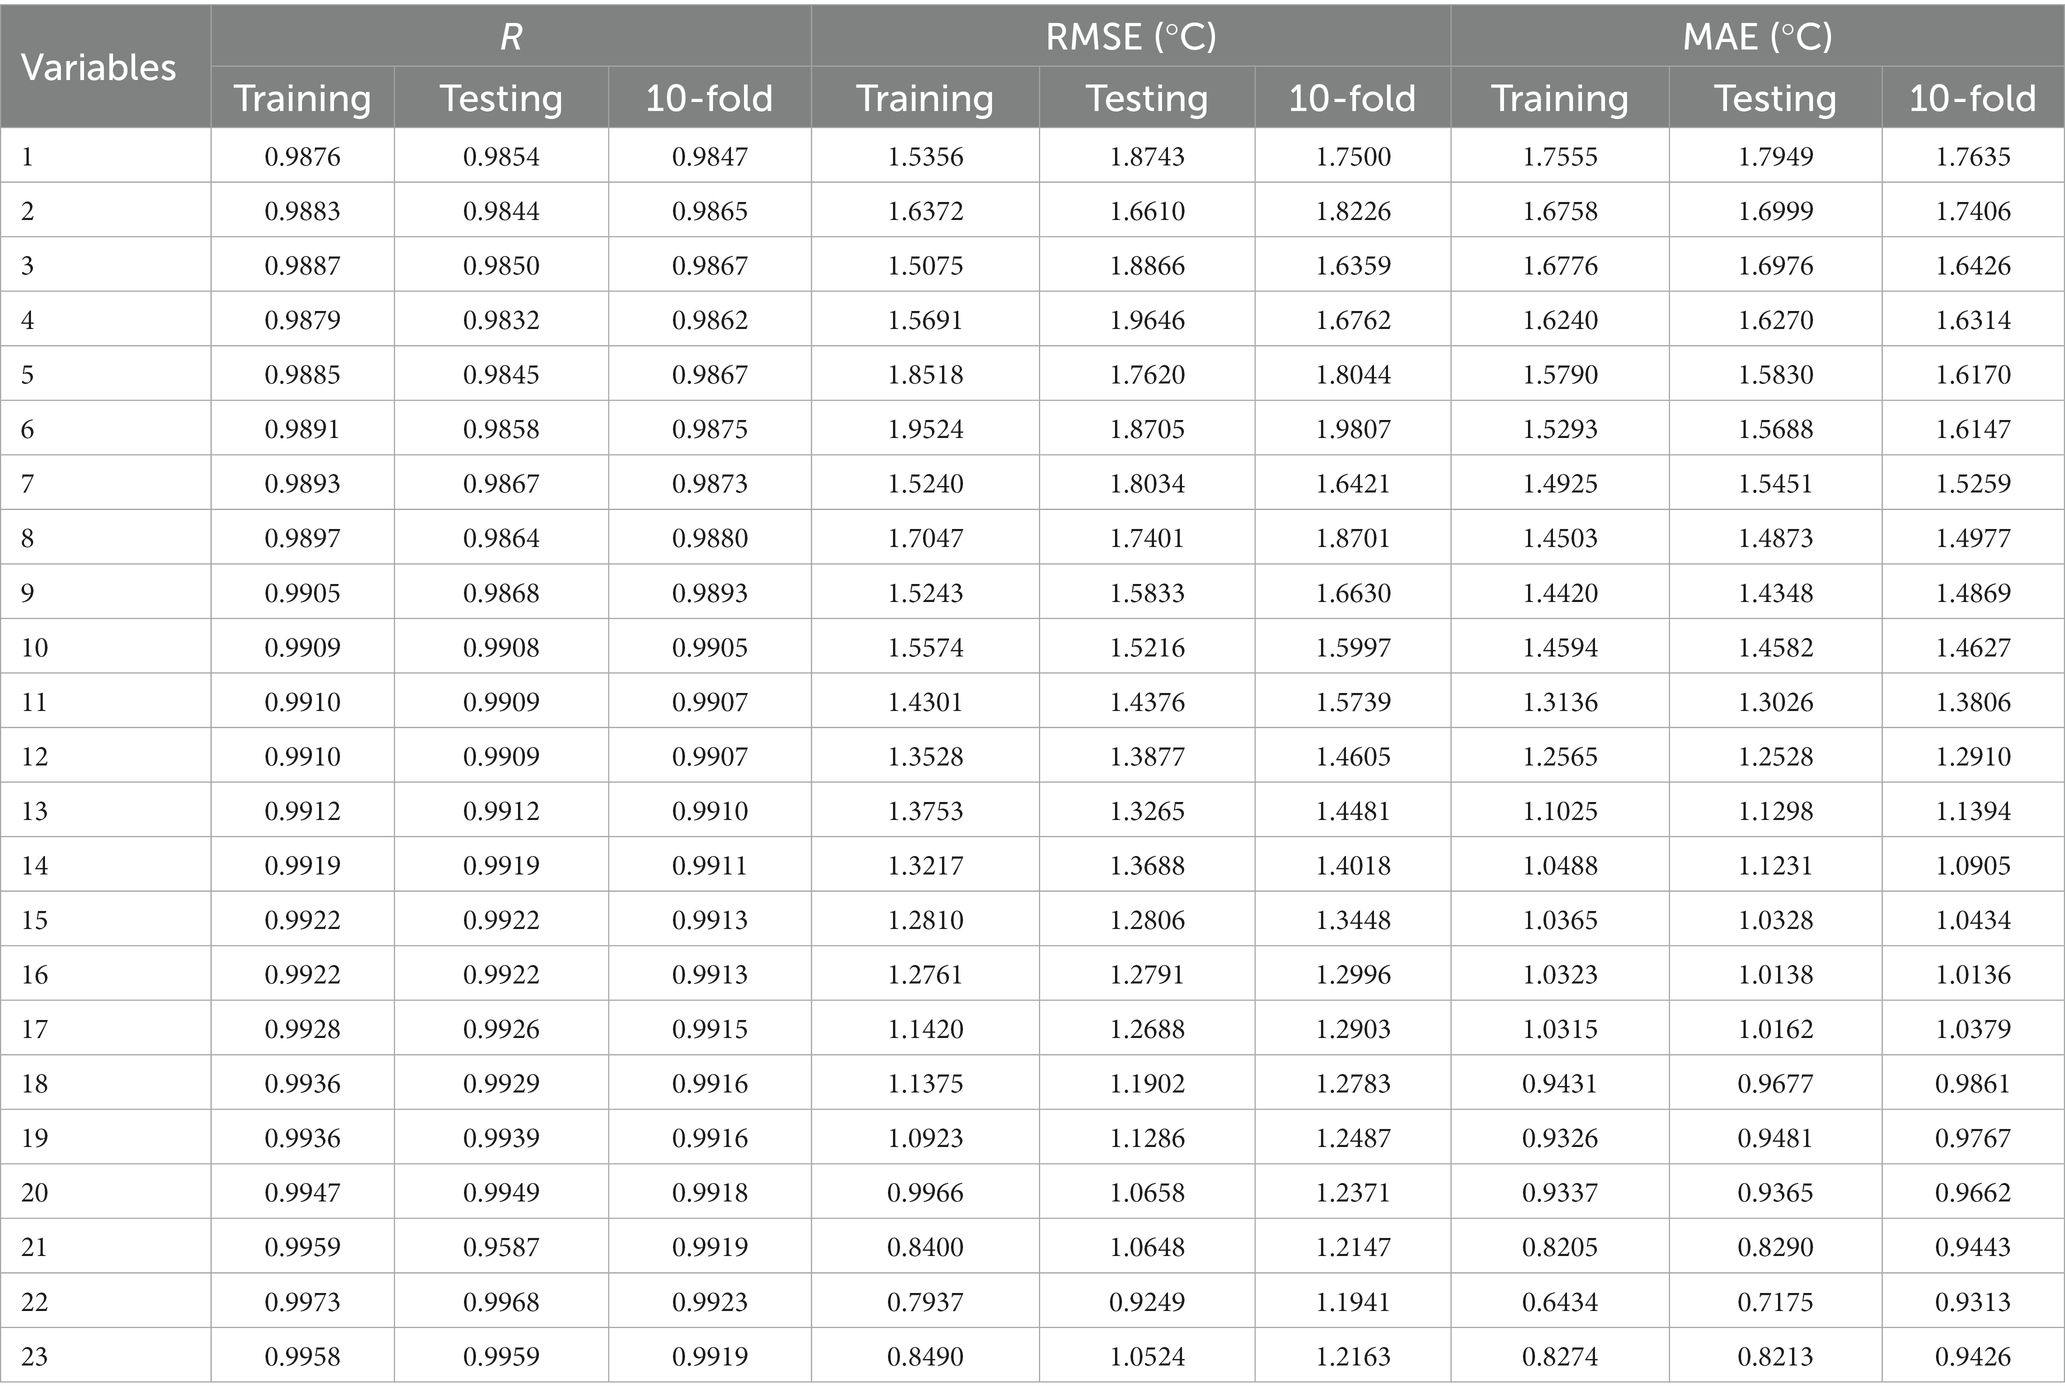
Table 2. Performance comparison between different input neurons for the GRU.
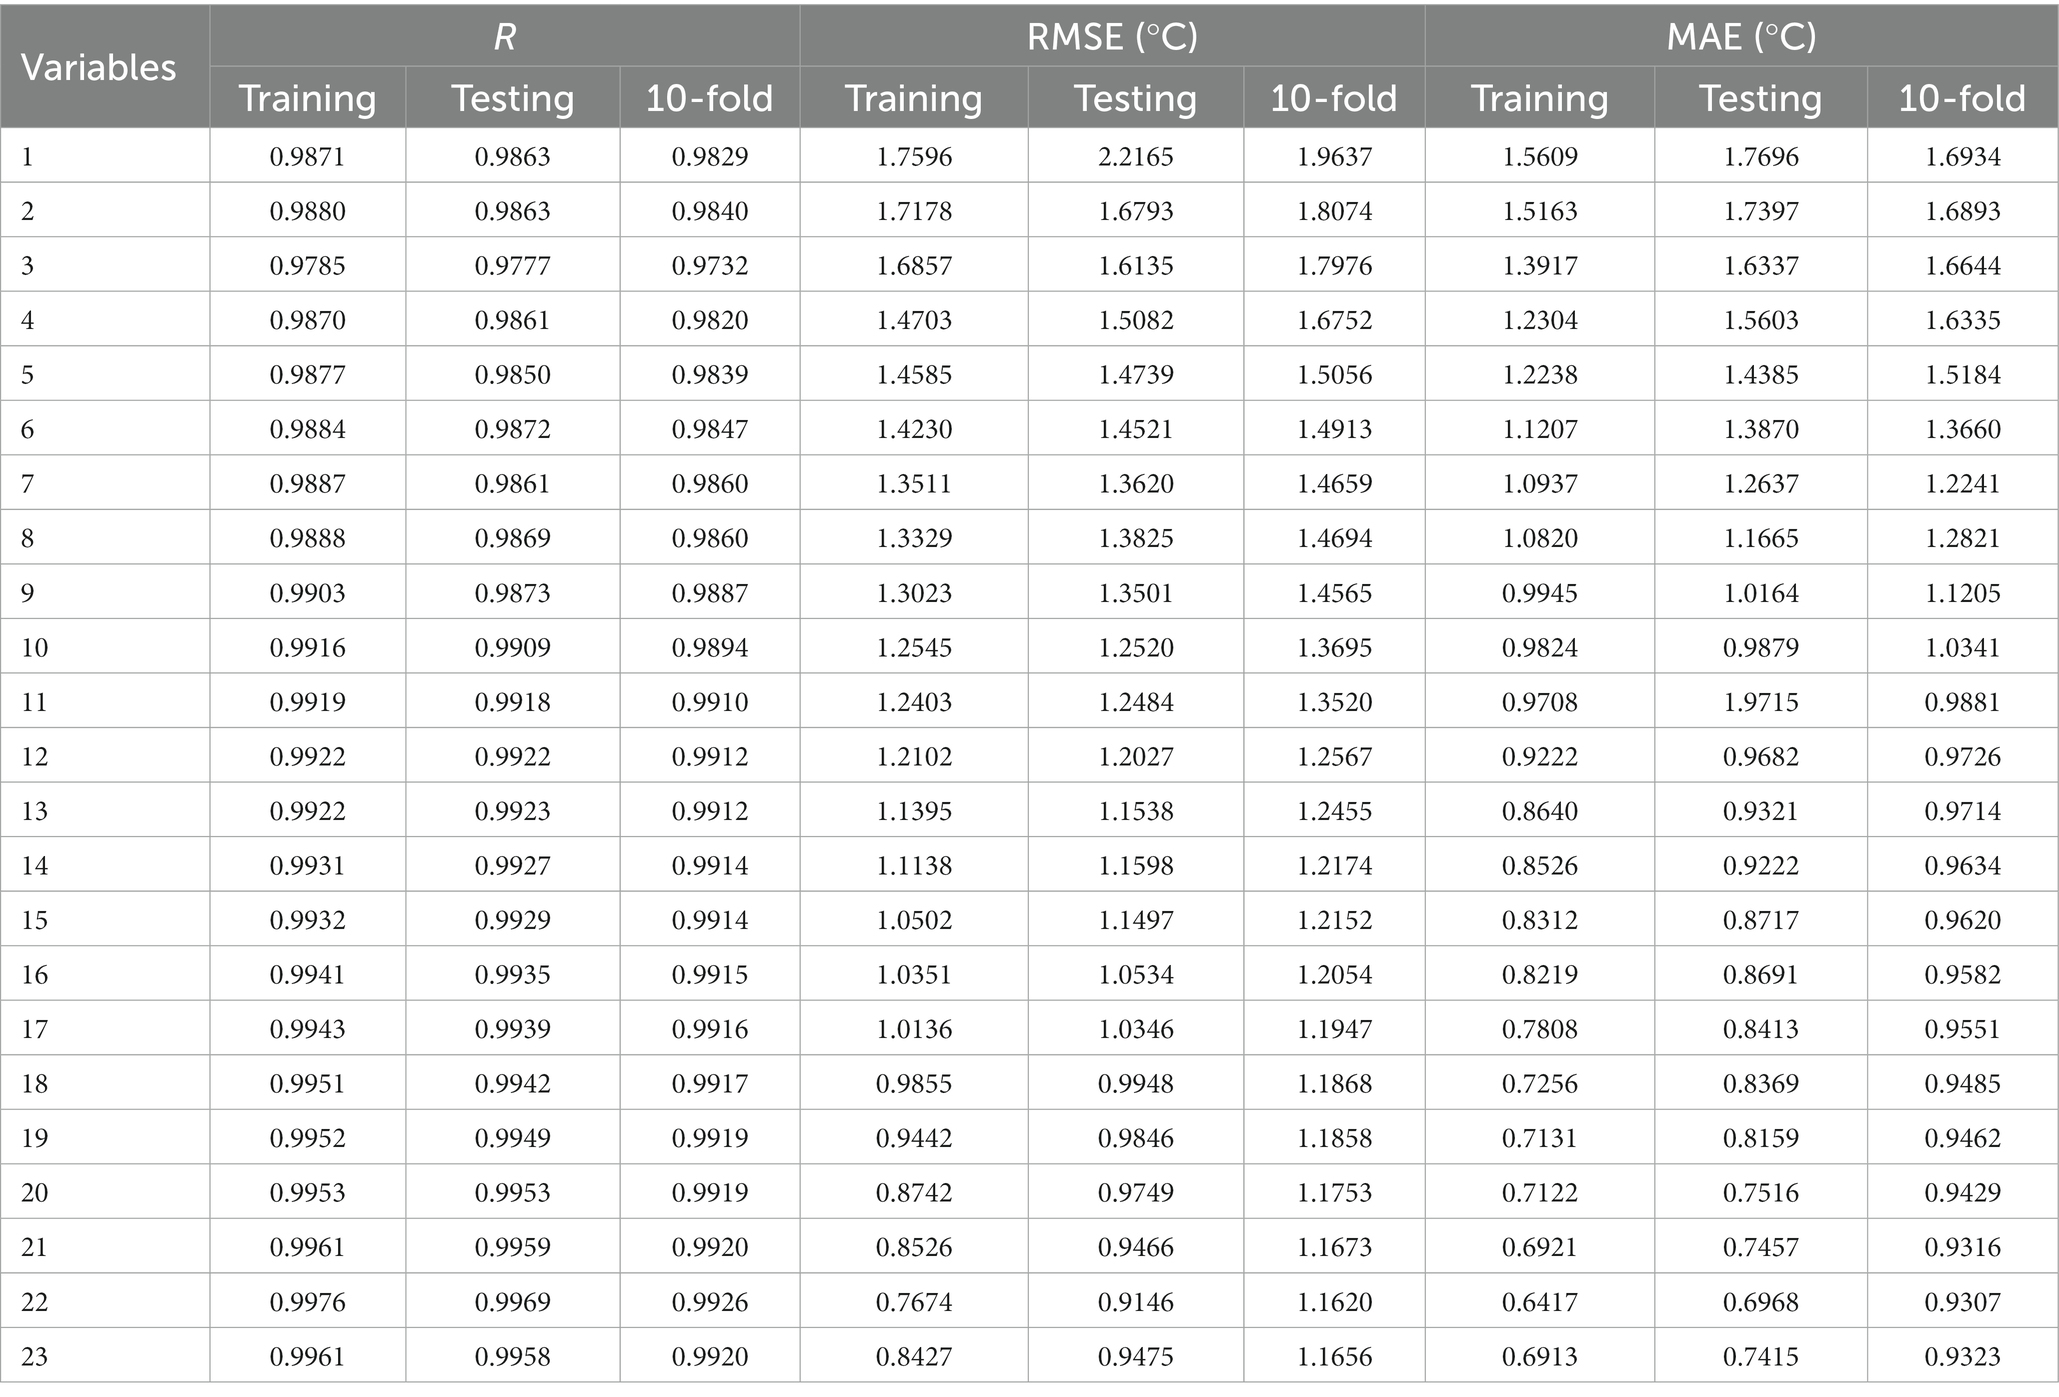
Table 3. Performance comparison between different input neurons for the LSTM.
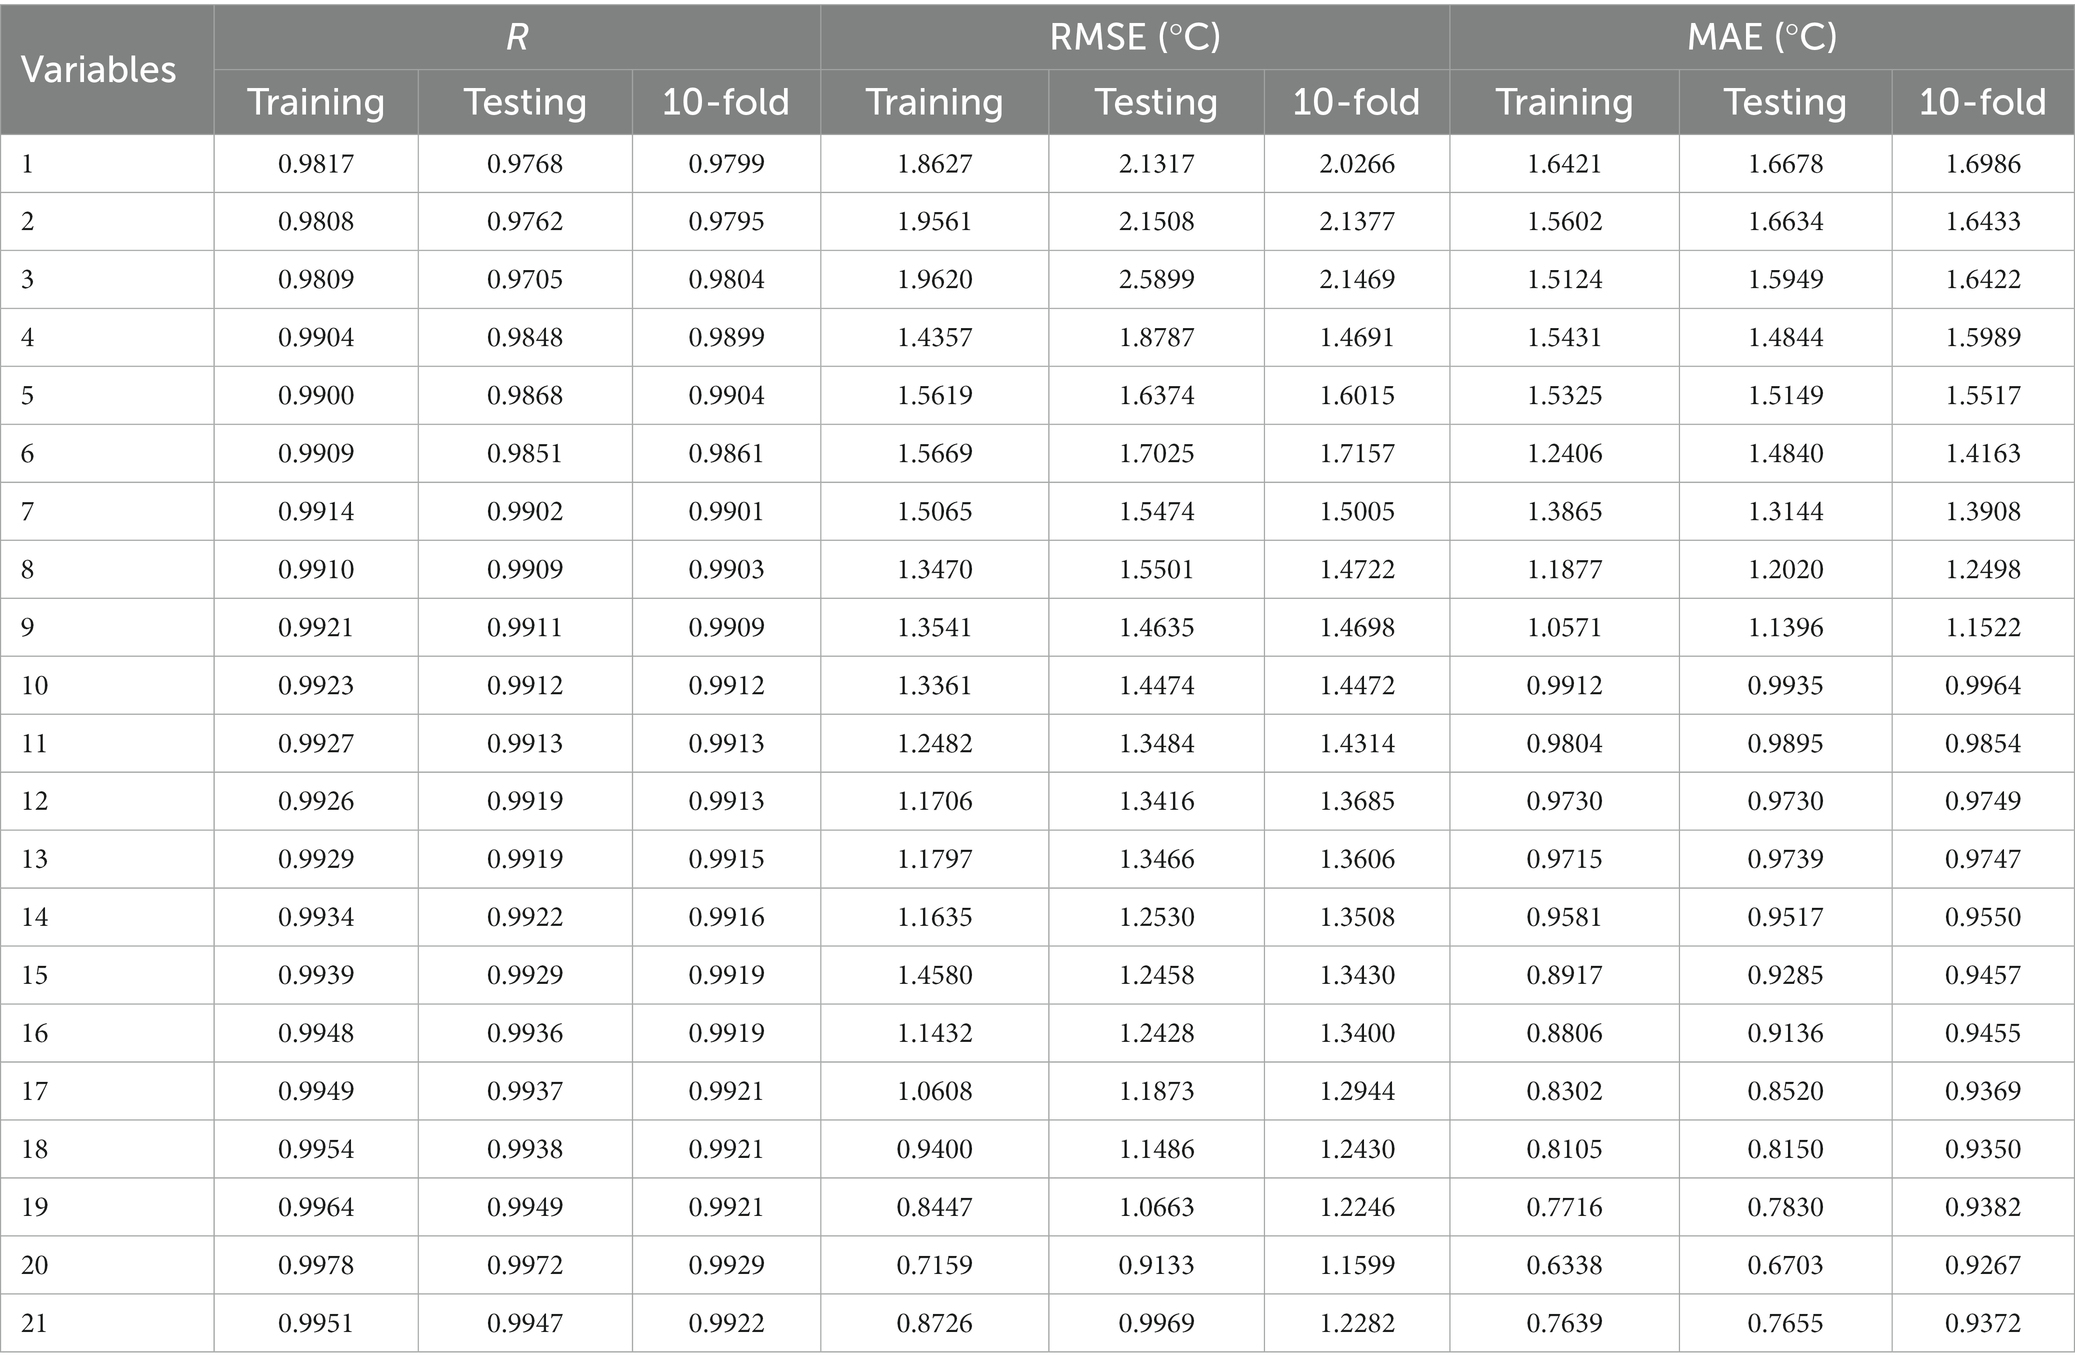
Table 4. Performance comparison between different input neurons for the CNN.
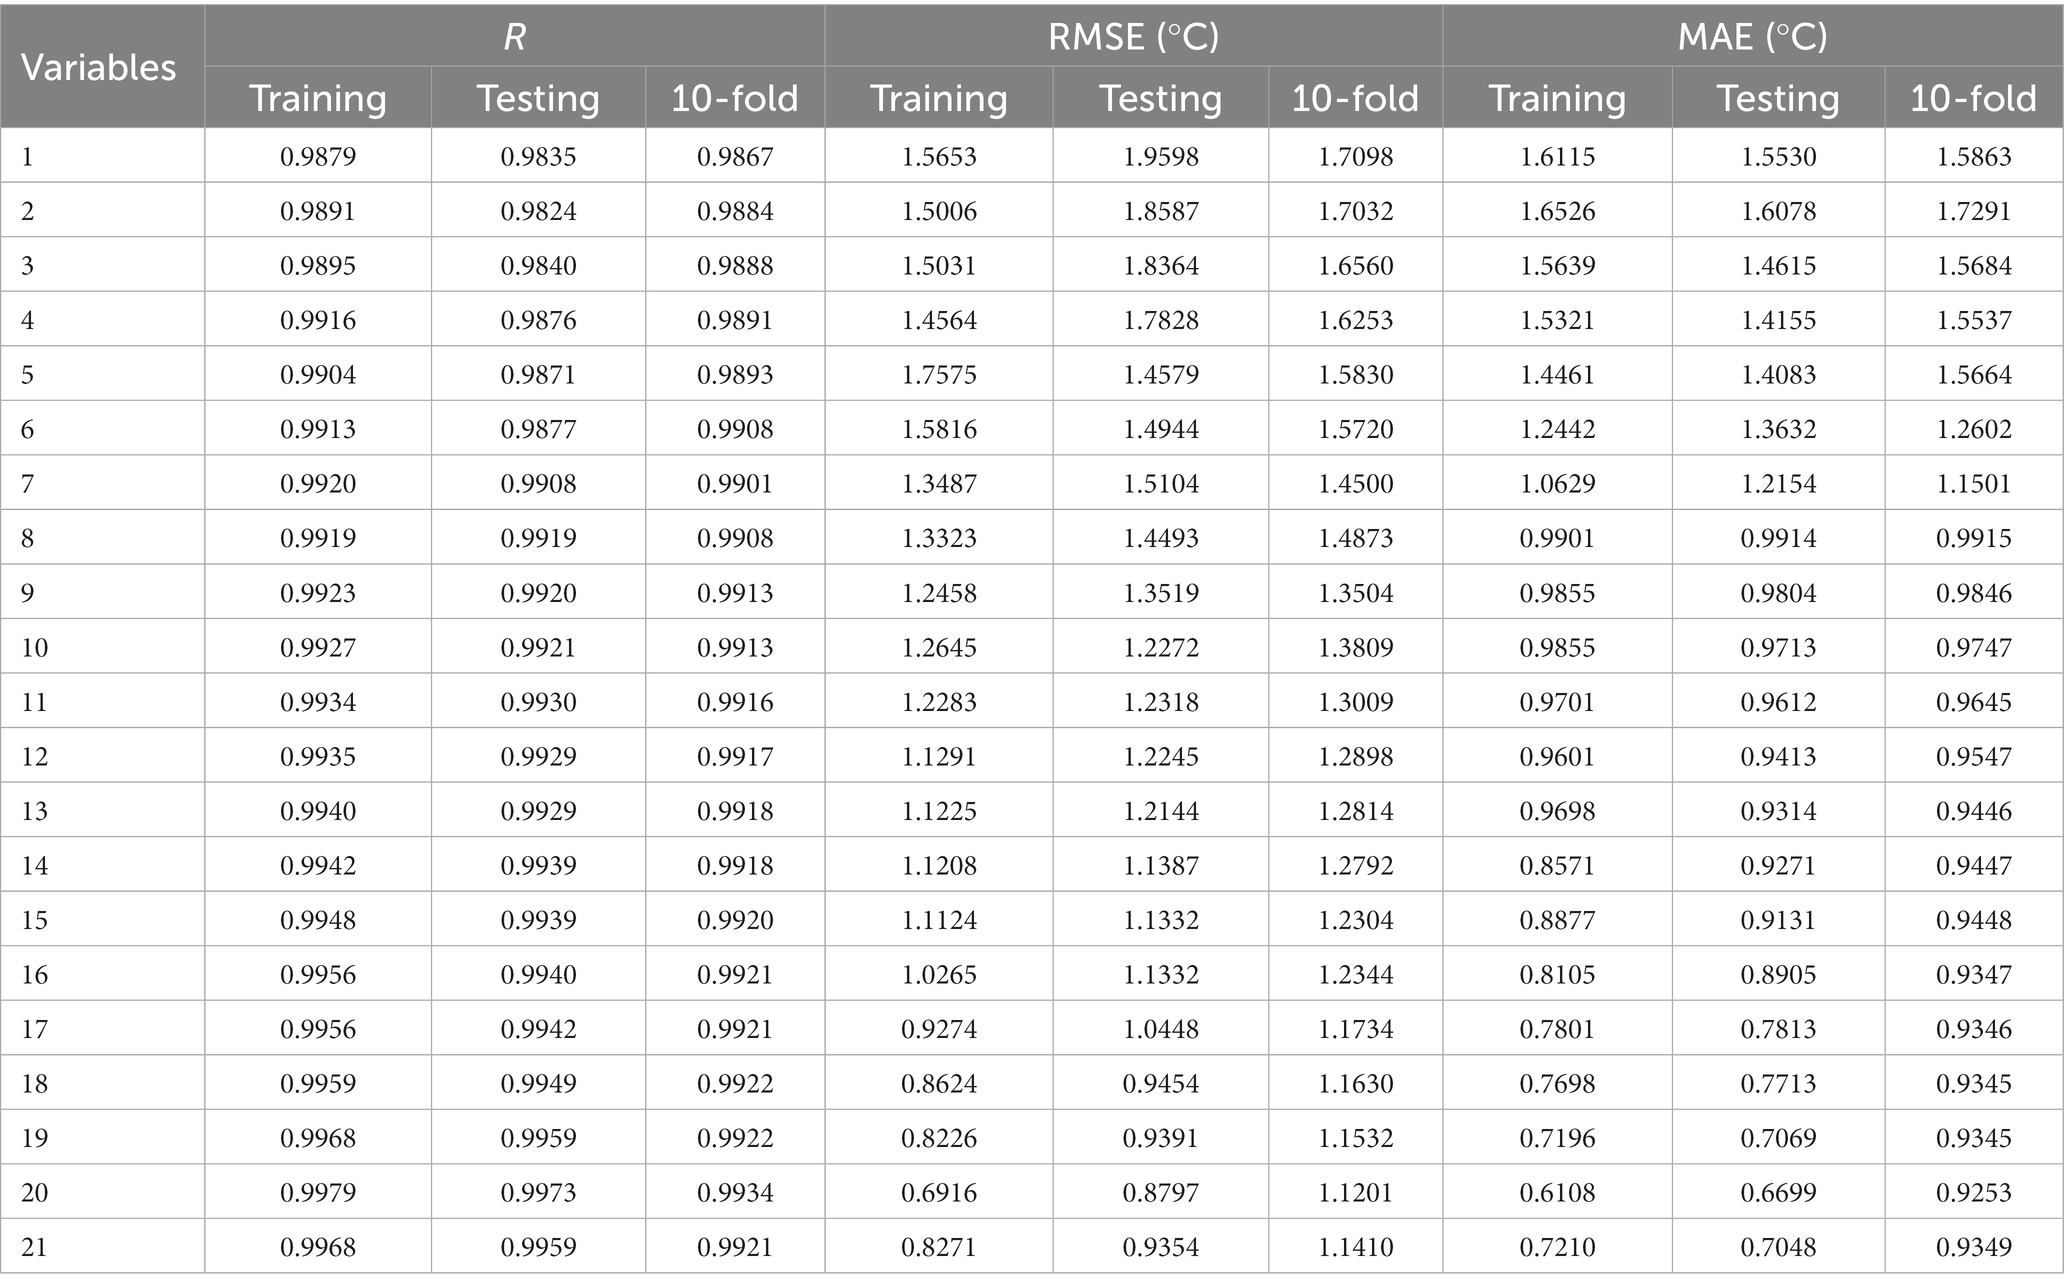
Table 5. Performance comparison between different input neurons for the CNN-GRU.
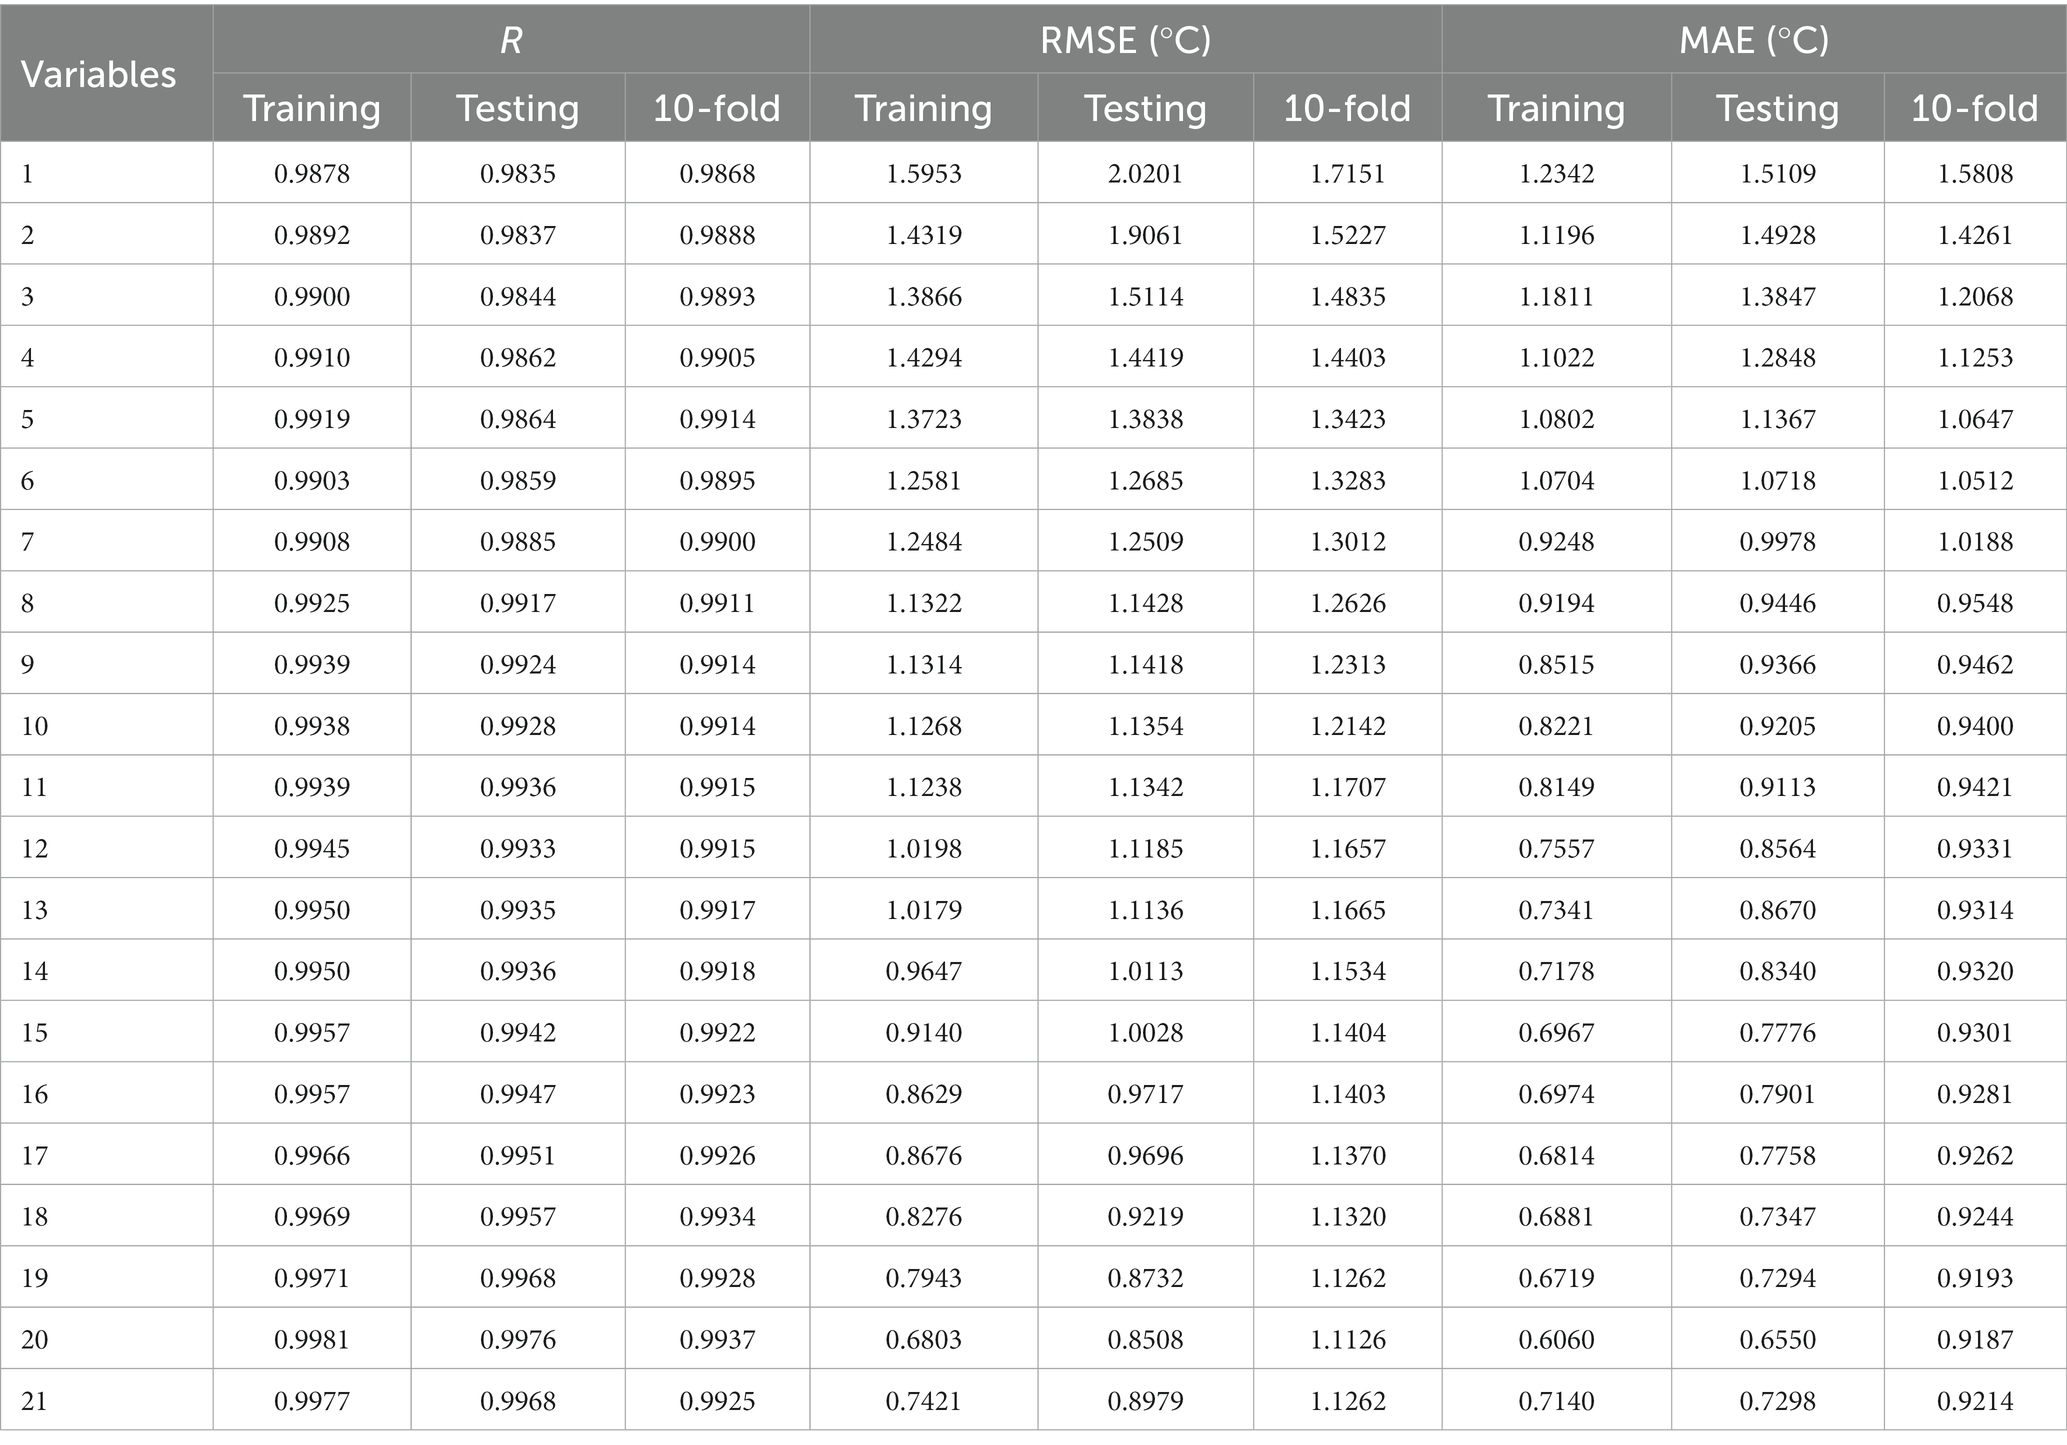
Table 6. Performance comparison between different input neurons for the CNN-LSTM.
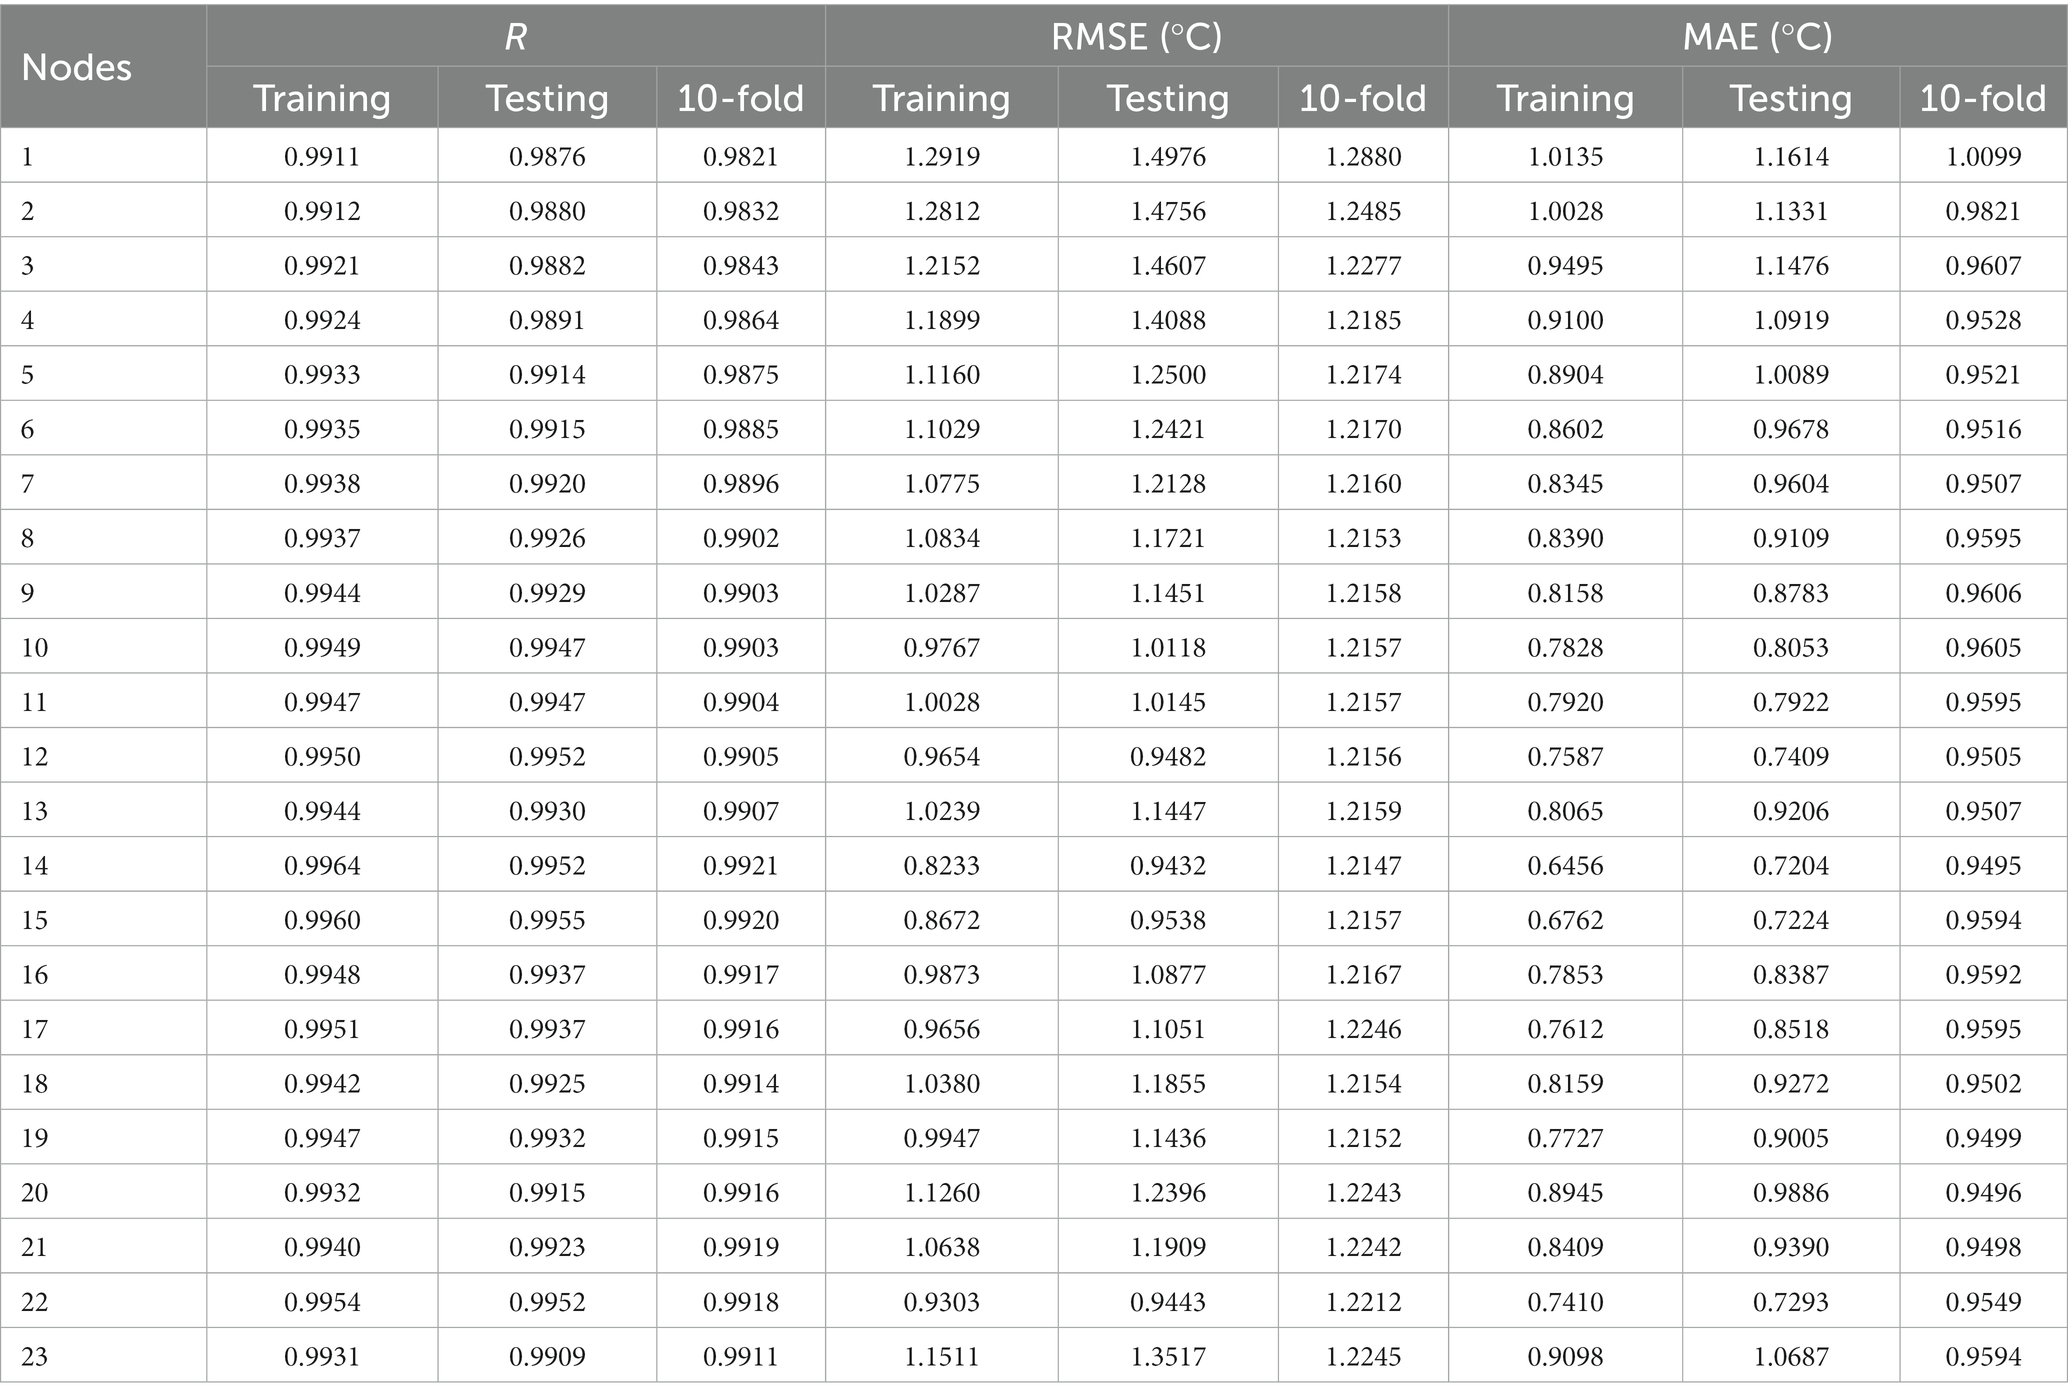
Table 7. Performance comparison between various neurons in the hidden layer for the ANN.
Learning algorithms of the ANN for predicting monthly average atmospheric temperature were also trained by trial and error. Table 8 shows the performances of learning algorithms for predicting the monthly average atmospheric temperature in Zhengzhou city. Trainbr has the best performance in predicting monthly average atmospheric temperature, followed by trainlm. Table 8 shows the best performance in simulating the monthly average atmospheric temperature in Zhengzhou during both the training phase and the prediction phase. The simulated monthly average atmospheric temperature is extraordinarily close to the actual atmospheric temperature.
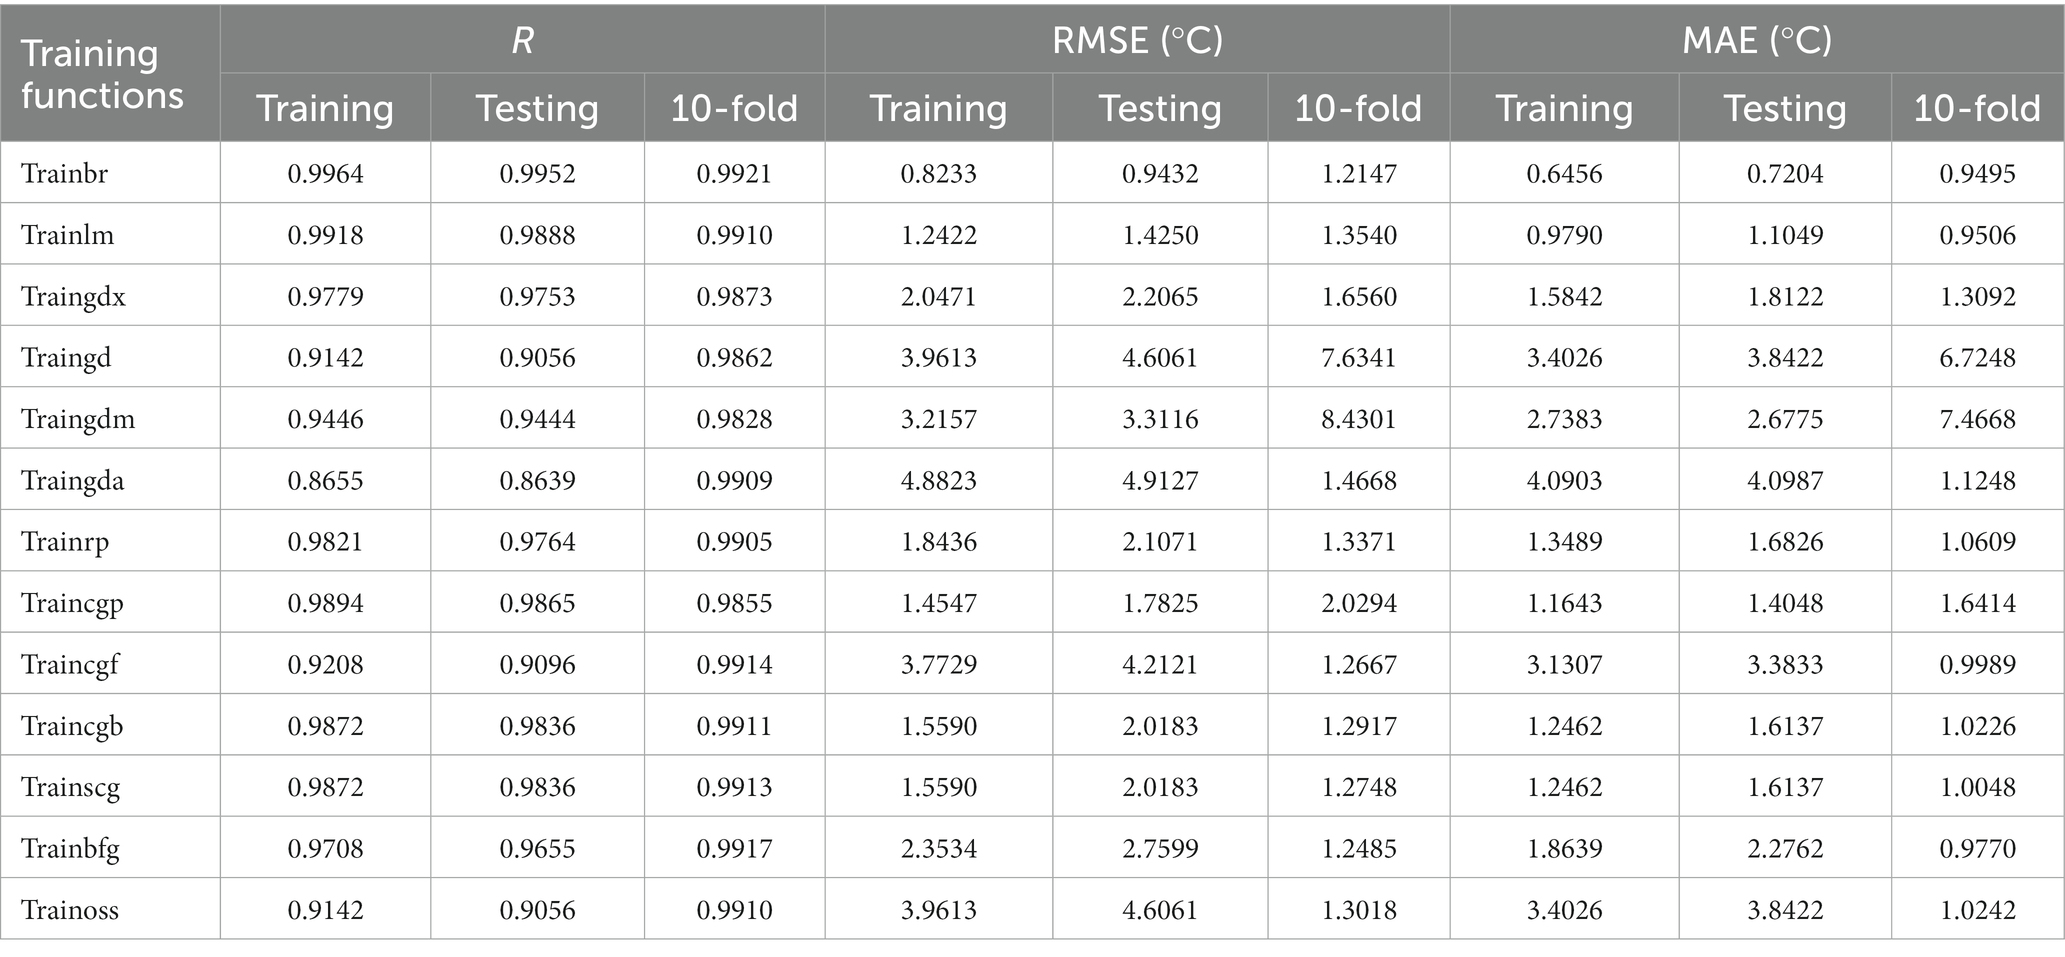
Table 8. Comparative performance of various ANN training algorithms in Zhengzhou city.
The RMSE, R, and MAE values of the ANN utilizing trainbr and trainlm for the training stage are 0.8233°C and 1.2422°C; 0.9964 and 0.9918; and 0.6456°C and 0.9790°C, respectively.
In this study, six types of ML models are proposed. The convergence speed, generalization ability, and prediction accuracy of the ML models are significantly affected by hyperparameters. Therefore, to achieve optimal model performance, it is necessary to select appropriate hyperparameters. The specific hyperparameters in the ML models after model training and validation are shown in Table 9. A CNN with nine layers was constructed to capture the features of the input climate data. Afterward, LSTM and GRU containing a hidden layer (HL) with 100 neurons are used to learn the features of the output data from the CNN layer. The activation functions (AFs) of LSTM and GRU were tanh and sigmoid, the learning rate (LR) was 0.001, the number of epochs was set to 100, the batch size (BS) was 6, the kernel size (KS) of the CNN was 3, the max-pooling (MP) was 2, the convolution filters (CFs) were 16 and 32, and the Adam Optimizer was used.
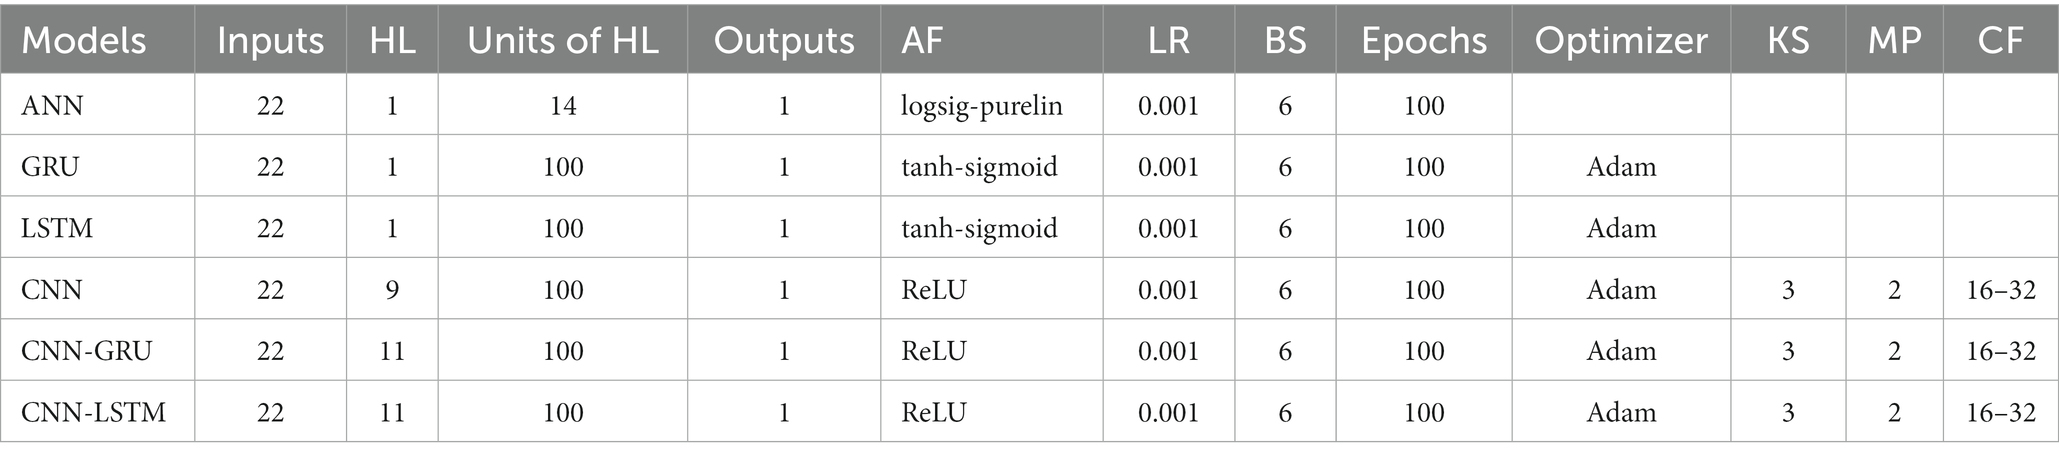
Table 9. Hyperparameter information of the machine learning models.
In the predicting period, average and extreme atmospheric temperatures in the coming month were predicted utilizing the atmospheric temperature data of the previous 22 months. Table 10 demonstrates the predicting performance utilizing trainbr and trainlm for the optimized ANN model. For the monthly average atmospheric temperature in Zhengzhou during the predicting stage, the R, RMSE, and MAE for trainbr were 0.9952, 0.9432°C, and 0.7204°C; and those for trainlm were 0.9888, 1.4250°C, and 1.1049°C, respectively. Table 10 shows the prediction results of average and extreme temperatures for the ANN during the training phase and the prediction phase. For the monthly minimum atmospheric temperature in Zhengzhou during the predicting stage, the R, RMSE, and MAE for trainbr were 0.9899, 1.4034°C, and 1.0787°C, respectively. For the monthly maximum atmospheric temperature in Zhengzhou during the predicting stage, the R, RMSE, and MAE for trainbr were 0.9721, 2.0505°C, and 1.6224°C, respectively.
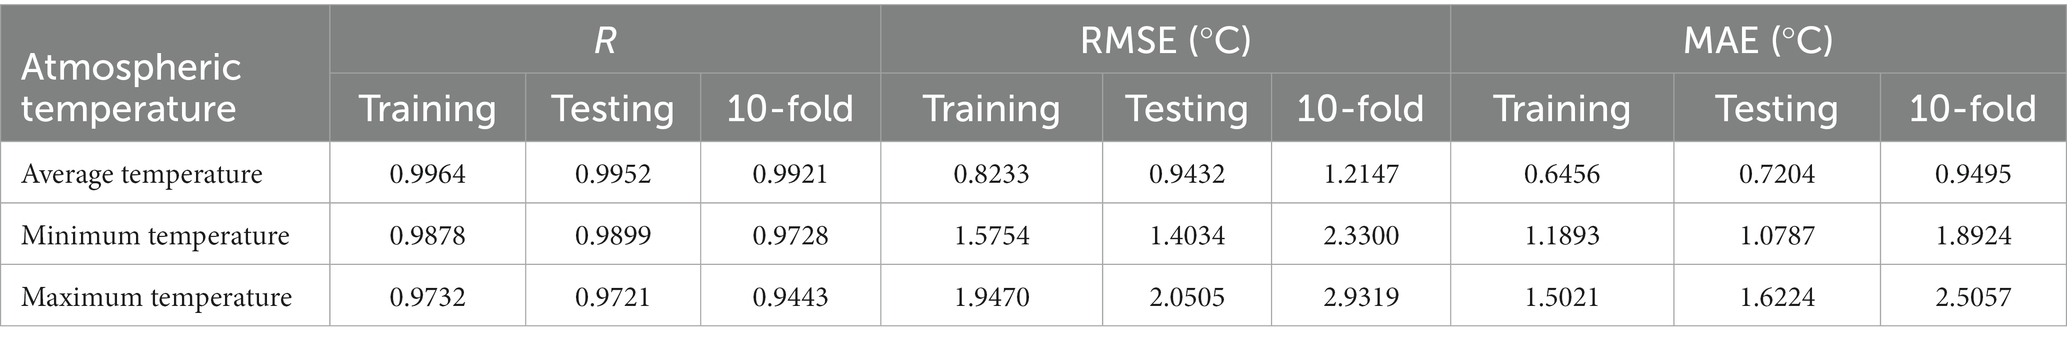
Table 10. Comparison of simulation results for the ANN model.
Figures 3A,B displays the predicted monthly average atmospheric temperature (AAT) in Zhengzhou from 2001 to 2022 using trainbr. In the predicting phase, the predicted values and the measured values were very close, especially in the simulated peak values. Figures 3C,D displays the predicted monthly minimum atmospheric temperature (MINAT) using trainbr. In the predicting phase, the forecasted minimum atmospheric temperature was similar to the measured minimum atmospheric temperature, especially in the simulated peak values. These results showed that tranbr had the best prediction effects.
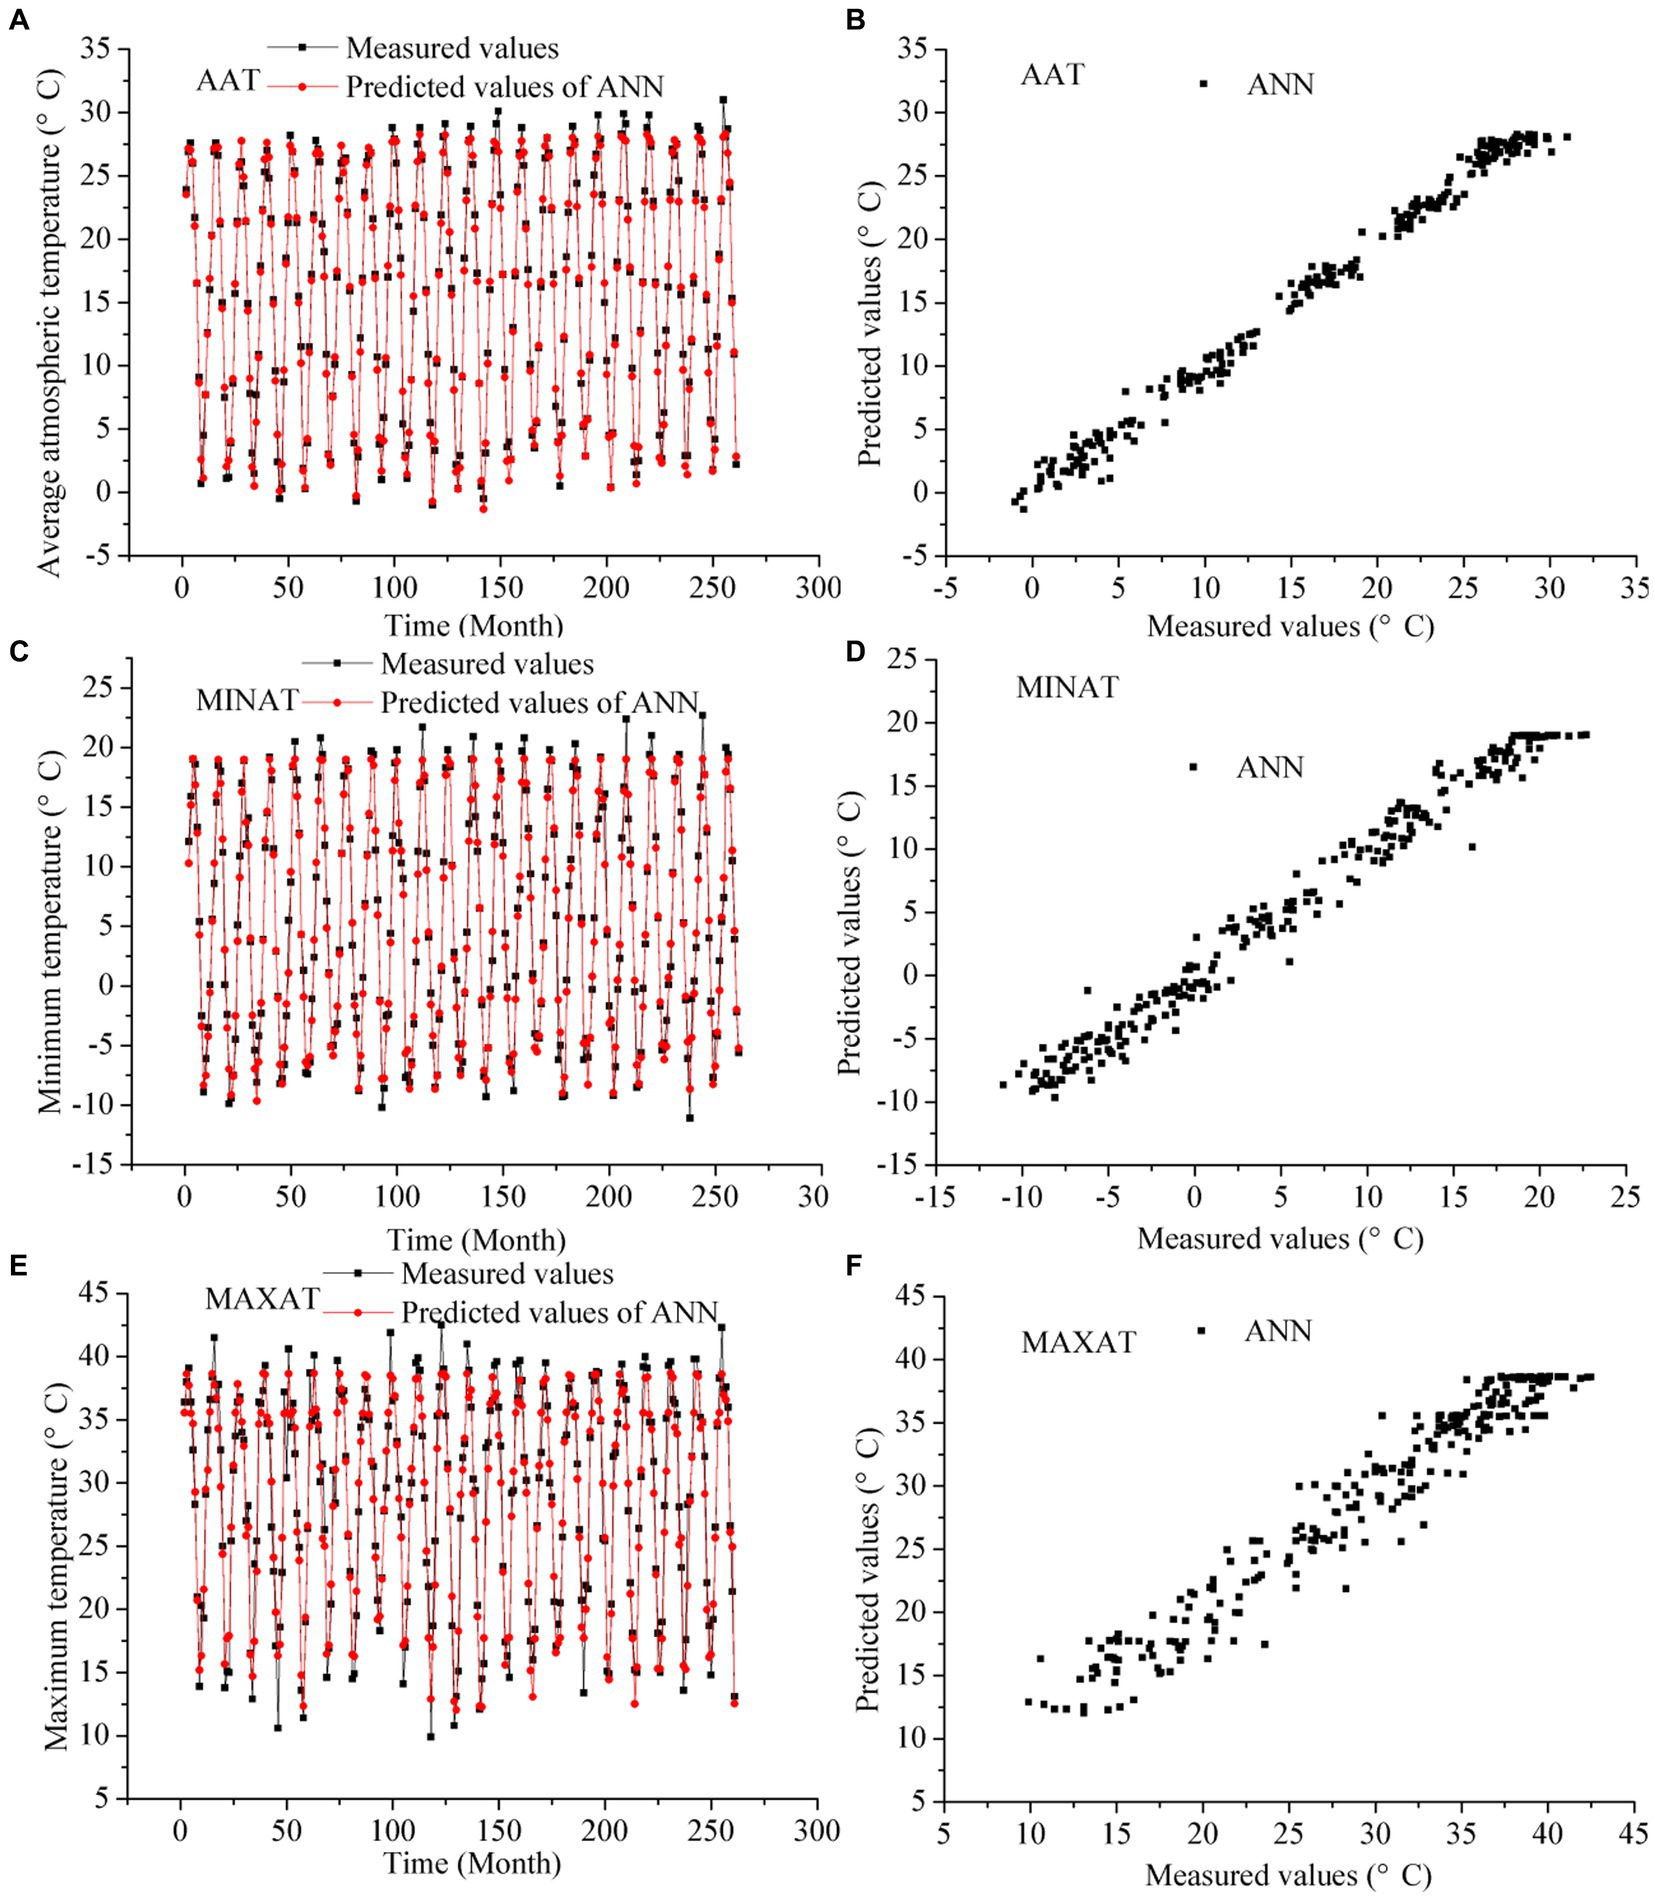
Figure 3. Monthly average, minimum, and maximum atmospheric temperatures in Zhengzhou from 2001 to 2022 predicted by the ANN: (A) Predicted vs. observed values. (B) Scatter plots. (C) Predicted vs. observed values. (D) Scatter plots. (E) Predicted vs. observed values. (F) Scatter plots.
Figures 3E,F displays the predicted monthly maximum atmospheric temperature (MAXAT) using trainbr. In the predicting phase, the forecasted maximum atmospheric temperature was similar to the measured maximum atmospheric temperature, especially in the simulated peak values. These results showed that tranbr had the best prediction effects.
The ANN and DL models were also compared. Table 11 lists the R, RMSE, and MAE achieved by each model when simulating the monthly average atmospheric temperature (AAT). Although the DL model performed better than the ANN, all models met reasonable prediction requirements. Table 11 lists the results of all the models for the monthly minimum atmospheric temperature (MINAT). Similarly, the DL model performed better than the ANN. Table 11 lists the simulated effects of each model for the monthly maximum atmospheric temperature (MAXAT). Similarly, the simulation results of the DL model were better than those of the ANN.

Table 11. Comparison between various models for simulating average, minimum, and maximum atmospheric temperatures.
The results showed that the monthly atmospheric temperatures (i.e., average temperature, minimum temperature, and maximum temperature) simulated by the CNN-LSTM model had the best correlation with actual measurements during the forecast period (i.e., R = 0.9976, 0.9955, and 0.9907, respectively). Furthermore, the results indicated that when simulating monthly average atmospheric temperature, the CNN-GRU model was more effective than the CNN and the GRU models but less effective than the CNN-LSTM model. When simulating values of monthly minimum atmospheric temperature and maximum atmospheric temperature, the CNN-GRU model also performed better than the CNN and the GRU models. Our results suggested that the CNN-LSTM model had superior performance and better accuracy than the ANN and other DL prediction models, making it a promising and useful tool to accurately predict climate change.
Figures 4A,B compares the temporal variations in the observed values and predicted values of monthly average atmospheric temperature for the CNN-LSTM model in Zhengzhou city during the forecast stage. The CNN-LSTM model could efficiently capture the monthly average atmospheric temperature trends as well as peaks.
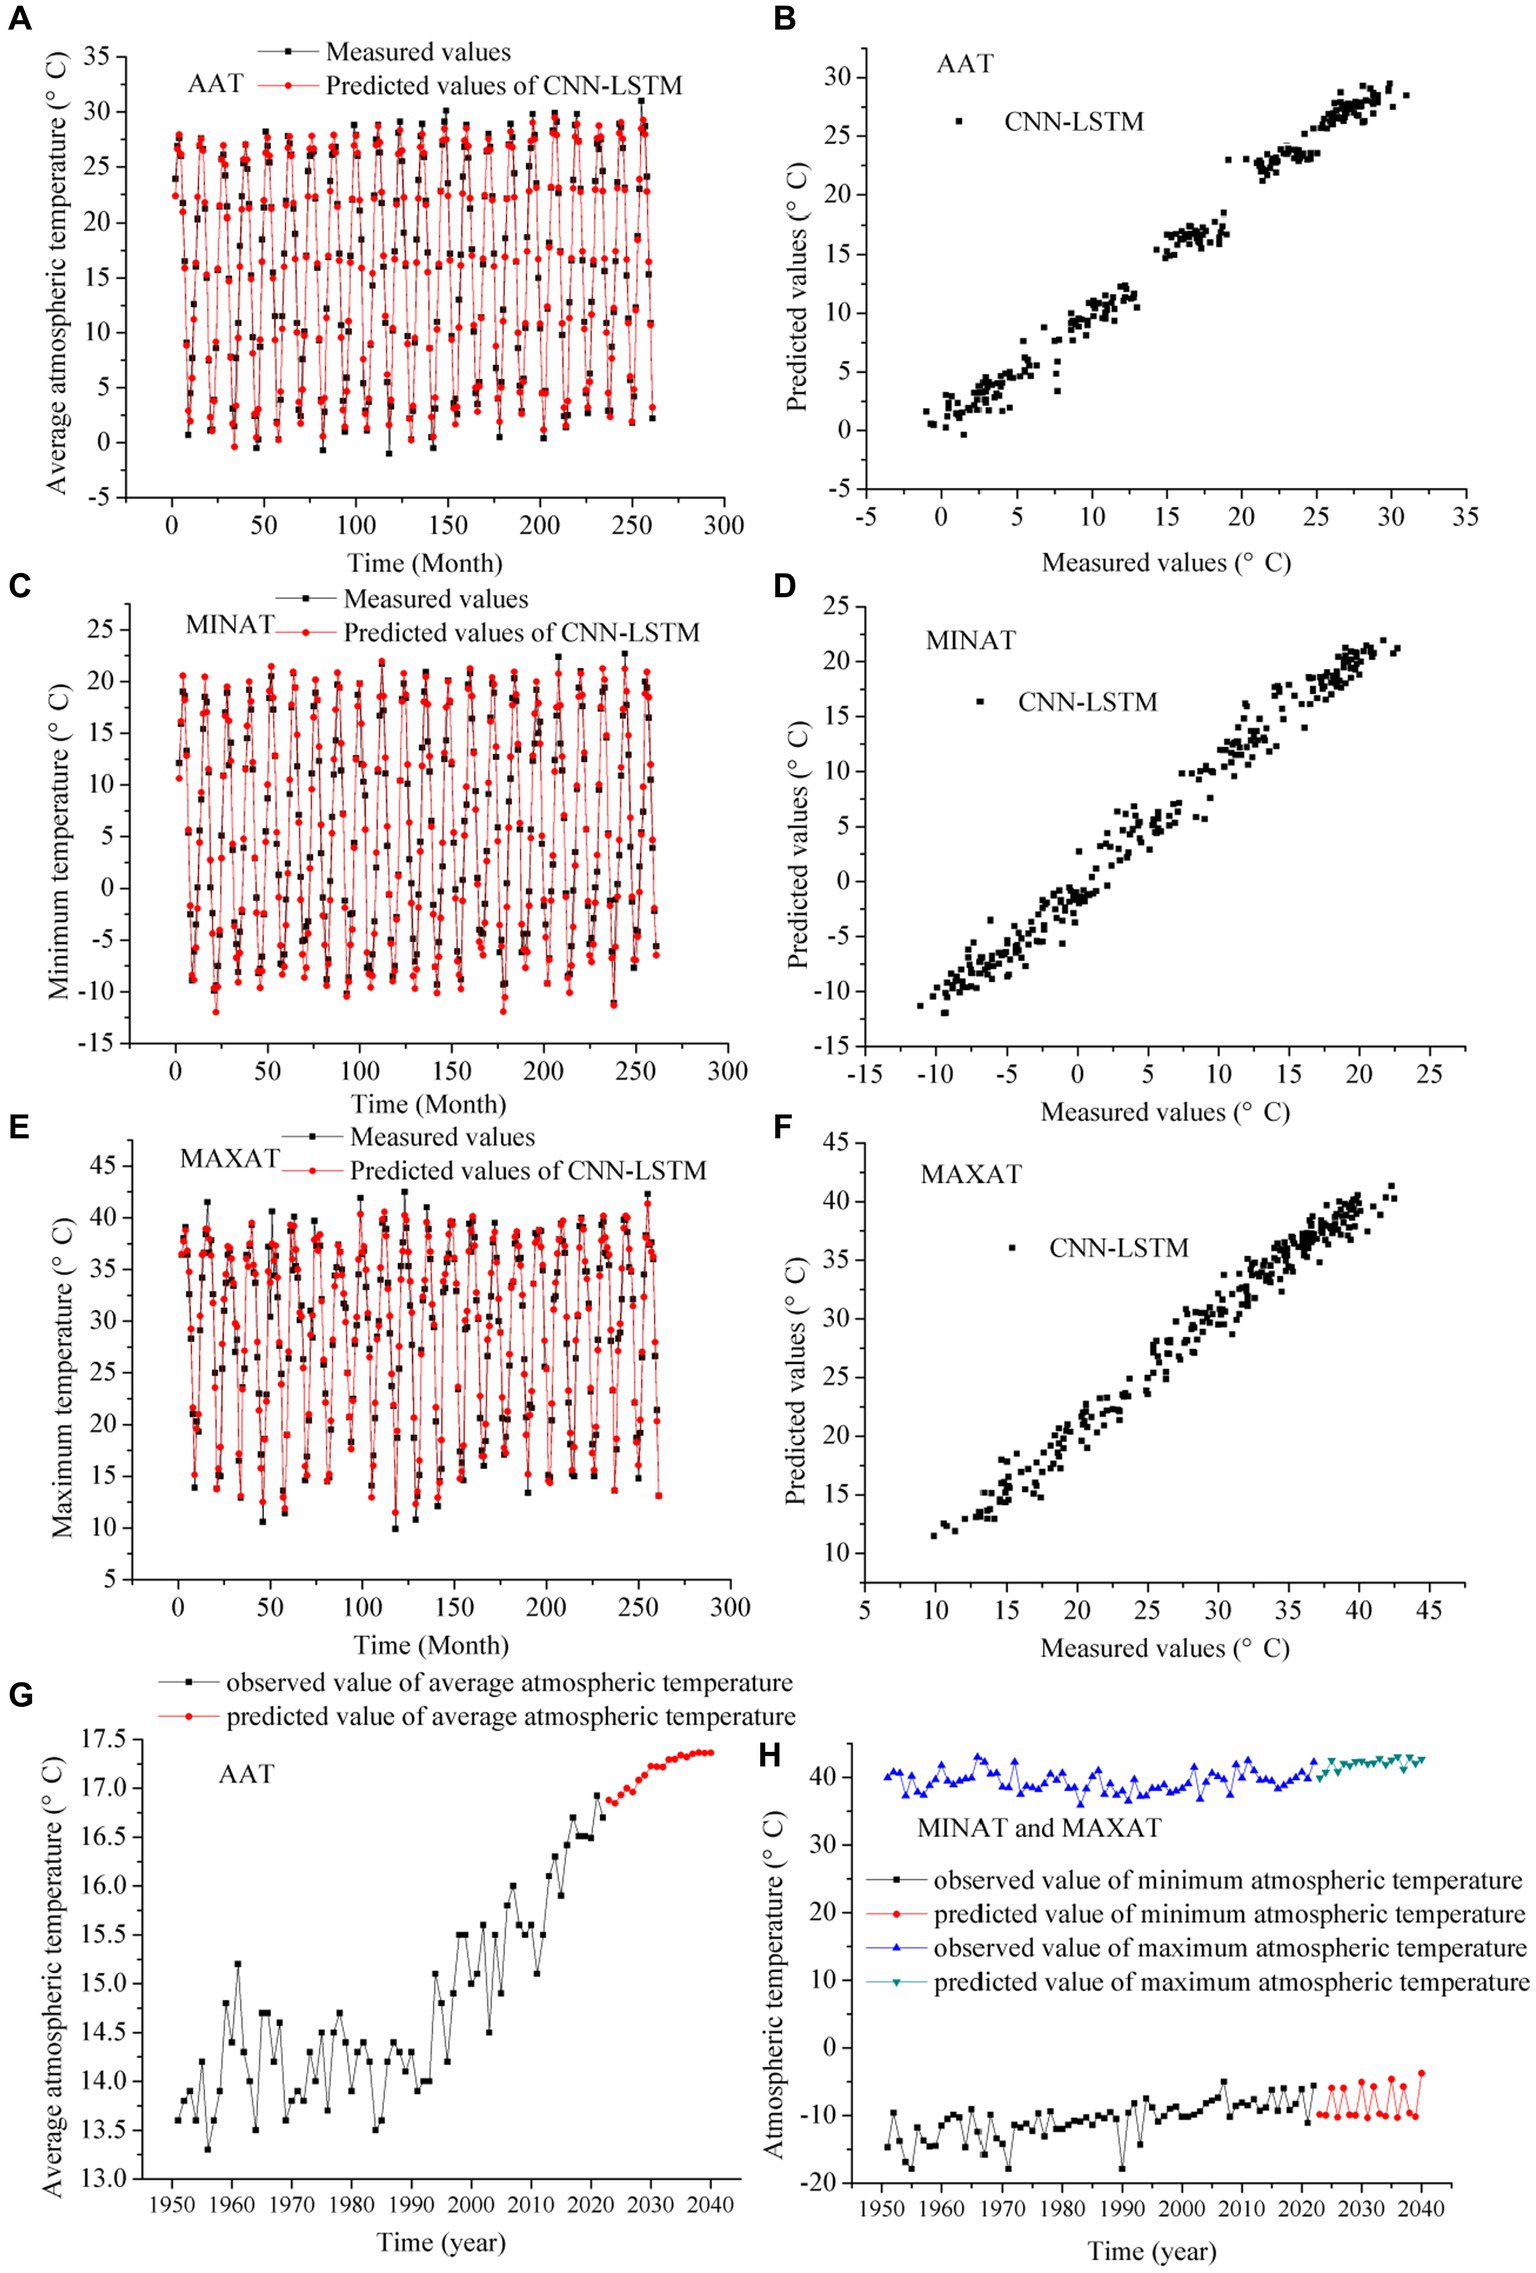
Figure 4. Prediction of monthly average, minimum, and maximum atmospheric temperatures in Zhengzhou from 2001 to 2022: (A) Predicted vs. observed values. (B) Scatter plots. (C) Predicted vs. observed values. (D) Scatter plots. (E) Predicted vs. observed values. (F) Scatter plots. Projection of future atmospheric temperature in Zhengzhou from 2023 to 2040. (G) Average temperature. (H) Minimum temperature, and maximum temperature.
Figures 4C,D shows a comparison of the monthly minimum atmospheric temperature time series between the observations and predictions. The magnitudes of the values predicted by the CNN-LSTM model were approximately consistent with the observations.
Figures 4E,F displays the monthly maximum atmospheric temperature predicted using the CNN-LSTM model. In the predicting phase, the forecasted maximum atmospheric temperature was similar to the measured maximum atmospheric temperature. The CNN-LSTM model captured the maximum atmospheric temperature trends and outperformed the CNN, LSTM, and CNN-GRU models.
Figures 4G,H shows the projected average, minimum, and maximum atmospheric temperatures using the CNN-LSTM model. In 2030, these values were 17.23°C, −5.06°C, and 42.44°C, and in 2040, they were 17.36°C, −3.74°C, and 42.68°C, respectively. These results suggest that the future climate is projected to continue warming, which requires us to achieve carbon neutrality as soon as possible.
Various models have been used to simulate and predict the average, minimum, and maximum atmospheric temperatures in several studies. The comparison of measured and forecasted atmospheric temperature determined the accurate training of the ANN for the forecast of air temperature for cities (Chania, Granada, Ancona, and Mollet) (Papantoniou and Kolokotsa, 2016). The ANN model had an accuracy of approximately 75.6% in forecasting the air temperature for the next 24 h in the Ararat Valley of Armenia (Astsatryan et al., 2021). The deep neural network (DNN) model (DNNM-3) for temperature prediction in New Delhi outperformed other models, with an accuracy rate of approximately 96.4% (Shrivastava et al., 2022). The ST-Net model (deep spatial and temporal network) was used to predict the future 1 hour air temperature at Baihetan Hydropower Station, China. The experimental results showed that the R2, RMSE, and MAE of ST-Net were 0.98, 0.63, and 0.45, respectively (Wu et al., 2022). The ANN was trained by 90% of the monthly land surface air temperatures from ERA5 and validated with the remaining 10%. The validation step showed the obvious improvements of the ANN over the empirical orthogonal teleconnection technique: The global spatial R increased from approximately 65% to 80%, and the RMSE difference decreased from approximately 0.99°C to 0.57°C during 1850–2020 (Huang et al., 2022). The U-net neural network forecasting surface air temperature over Xinjiang displayed the best correction performance with the highest R and the lowest MAE (Zhu et al., 2022). ANN was utilized to forecast the surface atmospheric temperature anomalies of the winter months in Japan. The results were validated in terms of R2. The ANN forecasts had higher skill scores compared to the North American Multi-Model Ensemble model skill scores (Ratnam et al., 2021). After comparing the atmospheric temperature forecast results with those of LSTM-Attention, BiLSTM, and LSTM, the symmetrical BiLSTM-Attention model had the best forecast effect in Beijing, with an MAE value of approximately 0.013 and an R2 value of 0.9618 (Hao et al., 2022).
Long-term monthly atmospheric temperatures in Turkey were modeled using the Elman neural network (ENN) and the feed-forward neural network (FNN) approaches with longitude, latitude, altitude, and the month number. The Levenberg–Marquardt algorithm was chosen as the learning algorithm. The FNN model gave better air temperature results than the ENN model. For the monthly minimum air temperature prediction, the FNN model showed the best result for the testing process in terms of a minimum MAE value of approximately 0.8848°C, and the RMSE and R2 values for the testing process were calculated as 1.0907°C and 0.9819, respectively. For the monthly maximum air temperature prediction, the best result for the testing process was obtained in terms of a minimum MAE value of 0.7202°C. The R2 value for the testing processes was calculated as 0.9928, whereas the RMSE value was 0.9136°C. For the prediction of mean air temperature, the best result for the testing process was obtained in terms of a minimum MAE value of 0.6248°C. The R2 value for the testing processes was calculated as 0.9918, whereas the RMSE value was 0.9918°C (Bilgili et al., 2023). Thus, the ANN model is a promising tool for forecasting the winter air temperature. Furthermore, it is feasible to predict atmospheric temperature using ANNs. Although ANN could simulate climate, its accuracy is not as high as that of DL models. Through the above analysis, we can see that the DL model performed better than the general ANN model, and our simulation results also supported this viewpoint.
This research employed multiple models to address the issue of local minima in neural networks and select the optimal one among them. Based on the results, we have proposed six artificial intelligence methods for predicting atmospheric temperature, exploring the potential improvement in prediction performance through variations in model parameters. Our findings suggest that enhancing the input variables could further improve the prediction performances of the six models. The CNN-LSTM model is found to outperform the ANN, GRU, LSTM, CNN, and CNN-GRU models. Therefore, we recommend using the CNN-LSTM model to predict atmospheric temperature in other forest areas, facilitating a better evaluation of the impact of climate change on forest ecosystems. However, future work will involve predicting atmospheric temperature using BiLSTM and BiGRU, with a focus on optimizing model parameters. Additionally, we will strive to improve the reliability and adaptability of the ANN model by incorporating various factors such as longitude, latitude, altitude, atmospheric circulation, underlying surface properties, greenhouse gases, solar radiation, and the number of months as inputs, thereby expanding the applicability of the models to other regions.
The original contributions presented in the study are included in the article/supplementary material, further inquiries can be directed to the corresponding author.
QG and ZH designed the research and drafted the manuscript. ZH and ZW collected and analyzed the data. QG, ZH, and ZW interpreted the results and revised the text. All authors contributed to the article and approved the submitted version.
This research was supported by the Shandong Provincial Natural Science Foundation (Grant No. ZR2023MD075), the State Key Laboratory of Loess and Quaternary Geology Foundation (Grant No. SKLLQG2211), LAC/CMA (Grant No. 2023B02), the Shandong Province Higher Educational Humanities and Social Science Program (Grant No. J18RA196), the National Natural Science Foundation of China (Grant No. 41572150), and the Junior Faculty Support Program for Scientific and Technological Innovations in Shandong Provincial Higher Education Institutions (Grant No. 2021KJ085).
The authors would like to thank the China Meteorological Data Sharing Service System (http://data.cma.cn) for providing meteorological data sets.
The authors declare that the research was conducted in the absence of any commercial or financial relationships that could be construed as a potential conflict of interest.
All claims expressed in this article are solely those of the authors and do not necessarily represent those of their affiliated organizations, or those of the publisher, the editors and the reviewers. Any product that may be evaluated in this article, or claim that may be made by its manufacturer, is not guaranteed or endorsed by the publisher.
Astsatryan, H., Grigoryan, H., Poghosyan, A., Abrahamyan, R., Asmaryan, S., Muradyan, V., et al. (2021). Air temperature forecasting using artificial neural network for Ararat valley. Earth Sci. Inf. 14, 711–722. doi: 10.1007/s12145-021-00583-9
Awolusi, T. F., Oke, O. L., Akinkurolere, O. O., Sojobi, A. O., and Aluko, O. G. (2019). Performance comparison of neural network training algorithms in the modeling properties of steel fiber reinforced concrete. Heliyon 5:e01115. doi: 10.1016/j.heliyon.2018.e01115
Bi, K., Xie, L., Zhang, H., Chen, X., Gu, X., and Tian, Q. (2023). Accurate medium-range global weather forecasting with 3D neural networks. Nature 619, 533–538. doi: 10.1038/s41586-023-06185-3
Bilgili, M., Ozbek, A., Yildirim, A., and Simsek, E. (2023). Artificial neural network approach for monthly air temperature estimations and maps. J. Atmos. Sol. Terr. Phys. 242:106000. doi: 10.1016/j.jastp.2022.106000
Caldera, U., and Breyer, C. (2023). Afforesting arid land with renewable electricity and desalination to mitigate climate change. Nat. Sustain. 6, 526–538. doi: 10.1038/s41893-022-01056-7
Canadell, J. G., Meyer, C. P., Cook, G. D., Dowdy, A., Briggs, P. R., Knauer, J., et al. (2021). Multi-decadal increase of forest burned area in Australia is linked to climate change. Nat. Commun. 12:6921. doi: 10.1038/s41467-021-27225-4
Cao, Y., Liu, G., Luo, D., Bavirisetti, D. P., and Xiao, G. (2023). Multi-timescale photovoltaic power forecasting using an improved stacking ensemble algorithm based LSTM-informer model. Energy 283:128669. doi: 10.1016/j.energy.2023.128669
Dehghani, A., Moazam, H. M. Z. H., Mortazavizadeh, F., Ranjbar, V., Mirzaei, M., Mortezavi, S., et al. (2023). Comparative evaluation of LSTM, CNN, and conv LSTM for hourly short-term streamflow forecasting using deep learning approaches. Ecol. Inform. 75:102119. doi: 10.1016/j.ecoinf.2023.102119
Deng, X., Zhang, Z., Zhao, F., Zhu, Z., and Wang, Q. (2023). Evaluation of the regional climate model for the forest area of Yunnan in China. Front. For. Glob. Change 5:1073554. doi: 10.3389/ffgc.2022.1073554
Dong, S., Li, S., Xu, Y., Shen, H., Song, H., Wu, Z., et al. (2023). Different responses of alpine plants to natural climate change reduced coexistence through phenological niche overlap. Sci. Total Environ. 892:164522. doi: 10.1016/j.scitotenv.2023.164522
Duncanson, L., Liang, M., Leitold, V., Armston, J., Krishna Moorthy, S. M., Dubayah, R., et al. (2023). The effectiveness of global protected areas for climate change mitigation. Nat. Commun. 14:2908. doi: 10.1038/s41467-023-38073-9
Esperon-Rodriguez, M., Tjoelker, M. G., Lenoir, J., Baumgartner, J. B., Beaumont, L. J., Nipperess, D. A., et al. (2022). Climate change increases global risk to urban forests. Nat. Clim. Chang. 12, 950–955. doi: 10.1038/s41558-022-01465-8
Falcone, R., Ciaramella, A., Carrabs, F., Strisciuglio, N., and Martinelli, E. (2022). Artificial neural network for technical feasibility prediction of seismic retrofitting in existing RC structures. Structure 41, 1220–1234. doi: 10.1016/j.istruc.2022.05.008
Farooqi, T. J. A., Irfan, M., Portela, R., Zhou, X., Shulin, P., and Ali, A. (2022). Global progress in climate change and biodiversity conservation research. Glob. Ecol. Conserv. 38:e02272. doi: 10.1016/j.gecco.2022.e02272
Fernández-Martínez, M., Peñuelas, J., Chevallier, F., Ciais, P., Obersteiner, M., Rödenbeck, C., et al. (2023). Diagnosing destabilization risk in global land carbon sinks. Nature 615, 848–853. doi: 10.1038/s41586-023-05725-1
Fu, Y. H., Zhao, H., Piao, S., Peaucelle, M., Peng, S., Zhou, G., et al. (2015). Declining global warming effects on the phenology of spring leaf unfolding. Nature 526, 104–107. doi: 10.1038/nature15402
Gao, S., Huang, Y., Zhang, S., Han, J., Wang, G., Zhang, M., et al. (2020). Short-term runoff prediction with GRU and LSTM networks without requiring time step optimization during sample generation. J. Hydrol. 589:125188. doi: 10.1016/j.jhydrol.2020.125188
García-Duro, J., Ciceu, A., Chivulescu, S., Badea, O., Tanase, M. A., and Aponte, C. (2021). Shifts in forest species composition and abundance under climate change scenarios in southern Carpathian Romanian temperate forests. Forests 12:1434. doi: 10.3390/f12111434
Gharehbaghi, A., Ghasemlounia, R., Ahmadi, F., and Albaji, M. (2022). Groundwater level prediction with meteorologically sensitive gated recurrent unit (GRU) neural networks. J. Hydrol. 612:128262. doi: 10.1016/j.jhydrol.2022.128262
Goudarzi, G., Hopke, P. K., and Yazdani, M. (2021). Forecasting PM2.5 concentration using artificial neural network and its health effects in Ahvaz, Iran. Chemosphere 283:131285. doi: 10.1016/j.chemosphere.2021.131285
Guo, Q., and He, Z. (2021). Prediction of the confirmed cases and deaths of global COVID-19 using artificial intelligence. Environ. Sci. Pollut. Res. 28, 11672–11682. doi: 10.1007/s11356-020-11930-6
Guo, Q., He, Z., Li, S., Li, X., Meng, J., Hou, Z., et al. (2020). Air pollution forecasting using artificial and wavelet neural networks with meteorological conditions. Aerosol Air Qual. Res. 20, 1429–1439. doi: 10.4209/aaqr.2020.03.0097
Guo, Q., He, Z., and Wang, Z. (2023a). Change in air quality during 2014–2021 in Jinan city in China and its influencing factors. Toxics 11:210. doi: 10.3390/toxics11030210
Guo, Q., He, Z., and Wang, Z. (2023b). Long-term projection of future climate change over the twenty-first century in the Sahara region in Africa under four shared socio-economic pathways scenarios. Environ. Sci. Pollut. Res. 30, 22319–22329. doi: 10.1007/s11356-022-23813-z
Guo, Q., He, Z., and Wang, Z. (2023c). Predicting of daily PM2.5 concentration employing wavelet artificial neural networks based on meteorological elements in Shanghai, China. Toxics 11:51. doi: 10.3390/toxics11010051
Guo, Q., He, Z., and Wang, Z. (2023d). Prediction of hourly PM2.5 and PM10 concentrations in Chongqing city in China based on artificial neural network. Aerosol Air Qual. Res. 23:220448. doi: 10.4209/aaqr.220448
Guo, Q., He, Z., and Wang, Z. (2023e). Simulating daily PM2.5 concentrations using wavelet analysis and artificial neural network with remote sensing and surface observation data. Chemosphere 340:139886. doi: 10.1016/j.chemosphere.2023.139886
Guo, Q., Wang, Z., He, Z., Li, X., Meng, J., Hou, Z., et al. (2021). Changes in air quality from the COVID to the post-COVID era in the Beijing-Tianjin-Tangshan region in China. Aerosol Air Qual. Res. 21:210270. doi: 10.4209/aaqr.210270
Guo, Z., Yang, C., Wang, D., and Liu, H. (2023f). A novel deep learning model integrating CNN and GRU to predict particulate matter concentrations. Process Saf. Environ. Prot. 173, 604–613. doi: 10.1016/j.psep.2023.03.052
Ham, Y.-G., Kim, J.-H., and Luo, J.-J. (2019). Deep learning for multi-year ENSO forecasts. Nature 573, 568–572. doi: 10.1038/s41586-019-1559-7
Hansson, A., Shulmeister, J., Dargusch, P., and Hill, G. (2023). A review of factors controlling southern hemisphere treelines and the implications of climate change on future treeline dynamics. Agric. For. Meteorol. 332:109375. doi: 10.1016/j.agrformet.2023.109375
Hao, X., Liu, Y., Pei, L., Li, W., and Du, Y. (2022). Atmospheric temperature prediction based on a BiLSTM-attention model. Symmetry 14:2470. doi: 10.3390/sym14112470
He, Z., Guo, Q., Wang, Z., and Li, X. (2022). Prediction of monthly PM2.5 concentration in Liaocheng in China employing artificial neural network. Atmos 13:1221. doi: 10.3390/atmos13081221
He, R., Zhang, L., and Chew, A. W. Z. (2024). Data-driven multi-step prediction and analysis of monthly rainfall using explainable deep learning. Expert Syst. Appl. 235:121160. doi: 10.1016/j.eswa.2023.121160
Higgins, S. I., Conradi, T., and Muhoko, E. (2023). Shifts in vegetation activity of terrestrial ecosystems attributable to climate trends. Nat. Geosci. 16, 147–153. doi: 10.1038/s41561-022-01114-x
Huang, X., Sun, X., Jiang, Y., Xue, F., Cui, M., Zhao, S., et al. (2021). The radial growth of Picea wilsonii was more restricted by precipitation due to climate warming on Mt. Guandi, China. Forests 12:1602. doi: 10.3390/f12111602
Huang, B., Yin, X., Menne, M., Vose, R., and Zhang, H.-M. (2022). Improvements to the land surface air temperature reconstruction in NOAAGlobalTemp: an artificial neural network approach. Artif. Intell. Earth Syst. 1, 1–35. doi: 10.1175/AIES-D-22-0032.1
Khalil, M. I., and Osborne, B. (2022). Developing climate-resilient agri-environmental production systems. Nutr. Cycl. Agroecosyst. 123, 1–4. doi: 10.1007/s10705-022-10215-3
Kim, J., Lim, C.-H., Jo, H.-W., and Lee, W.-K. (2021). Phenological classification using deep learning and the Sentinel-2 satellite to identify priority afforestation sites in North Korea. Remote Sens. 13:2946. doi: 10.3390/rs13152946
Luo, Y., and Chen, H. Y. H. (2013). Observations from old forests underestimate climate change effects on tree mortality. Nat. Commun. 4:1655. doi: 10.1038/ncomms2681
Nasrudin, N. A., Jewaratnam, J., Hossain, M. A., and Ganeson, P. B. (2020). Performance comparison of feedforward neural network training algorithms in modelling microwave pyrolysis of oil palm fibre for hydrogen and biochar production. Asia Pac. J. Chem. Eng. 15:e2388. doi: 10.1002/apj.2388
Neira, M., Erguler, K., Ahmady-Birgani, H., Al-Hmoud, N. D., Fears, R., Gogos, C., et al. (2023). Climate change and human health in the eastern Mediterranean and middle east: literature review, research priorities and policy suggestions. Environ. Res. 216:114537. doi: 10.1016/j.envres.2022.114537
Ni, Y., Xiao, W., Liu, J., Jian, Z., Li, M., Xu, J., et al. (2023). Radial growth-climate correlations of Pinus massoniana in natural and planted forest stands along a latitudinal gradient in subtropical central China. Agric. For. Meteorol. 334:109422. doi: 10.1016/j.agrformet.2023.109422
Pakalapati, H., Tariq, M. A., and Arumugasamy, S. K. (2019). Optimization and modelling of enzymatic polymerization of ε-caprolactone to polycaprolactone using Candida Antartica lipase B with response surface methodology and artificial neural network. Enzym. Microb. Technol. 122, 7–18. doi: 10.1016/j.enzmictec.2018.12.001
Pandey, S., Hindoliya, D. A., and Mod, R. (2012). Artificial neural networks for predicting indoor temperature using roof passive cooling techniques in buildings in different climatic conditions. Appl. Soft Comput. 12, 1214–1226. doi: 10.1016/j.asoc.2011.10.011
Papantoniou, S., and Kolokotsa, D.-D. (2016). Prediction of outdoor air temperature using neural networks: application in 4 European cities. Energ. Buildings 114, 72–79. doi: 10.1016/j.enbuild.2015.06.054
Perera, A., Azamathulla, H., and Rathnayake, U. (2020). Comparison of different artificial neural network (ANN) training algorithms to predict atmospheric temperature in Tabuk, Saudi Arabia. Mausam 71, 233–244. doi: 10.54302/mausam.v71i2.22
Portmann, R., Beyerle, U., Davin, E., Fischer, E. M., De Hertog, S., and Schemm, S. (2022). Global forestation and deforestation affect remote climate via adjusted atmosphere and ocean circulation. Nat. Commun. 13:5569. doi: 10.1038/s41467-022-33279-9
Ratnam, J. V., Nonaka, M., and Behera, S. (2021). Winter surface air temperature prediction over Japan using artificial neural networks. Weather Forecast. 36, 1343–1356. doi: 10.1175/WAF-D-20-0218.1
Schwaab, J., Meier, R., Mussetti, G., Seneviratne, S., Bürgi, C., and Davin, E. L. (2021). The role of urban trees in reducing land surface temperatures in European cities. Nat. Commun. 12:6763. doi: 10.1038/s41467-021-26768-w
Shrivastava, V. K., Shrivastava, A., Sharma, N., Mohanty, S. N., and Pattanaik, C. R. (2022). “Deep learning model for temperature prediction: an empirical study” in Model. Earth Syst. Environ. 9:2067–2080. doi: 10.1007/s40808-022-01609-x
Sun, L., Lan, Y., and Jiang, R. (2023). Using CNN framework to improve multi-GCM ensemble predictions of monthly precipitation at local areas: An application over China and comparison with other methods. J. Hydrol. 623:129866. doi: 10.1016/j.jhydrol.2023.129866
Sun, M., Li, J., Cao, R., Tian, K., Zhang, W., Yin, D., et al. (2021). Climate-growth relations of Abies georgei along an altitudinal gradient in Haba Snow Mountain, Southwestern China. Forests 12:1569. doi: 10.3390/f12111569
Tewari, K., Mishra, S., Salunke, P., and Dewan, A. (2022). Future projections of temperature and precipitation for Antarctica. Environ. Res. Lett. 17:014029. doi: 10.1088/1748-9326/ac43e2
Tian, D., Jiang, L., Shahzad, M. K., He, P., Wang, J., and Yan, Y. (2022). Climate-sensitive tree height-diameter models for mixed forests in northeastern China. Agric. For. Meteorol. 326:109182. doi: 10.1016/j.agrformet.2022.109182
Vakharia, V., Gupta, V., and Kankar, P. K. (2016). A comparison of feature ranking techniques for fault diagnosis of ball bearing. Soft. Comput. 20, 1601–1619. doi: 10.1007/s00500-015-1608-6
Vakharia, V., Shah, M., Nair, P., Borade, H., Sahlot, P., and Wankhede, V. (2023). Estimation of lithium-ion battery discharge capacity by integrating optimized explainable-AI and stacked LSTM model. Batteries 9:125. doi: 10.3390/batteries9020125
Vander Mijnsbrugge, K., Malanguis, J. M., Moreels, S., Lauwers, A., Thomaes, A., De Keersmaeker, L., et al. (2021). Growth recovery and phenological responses of juvenile beech (Fagus sylvatica L.). Exposed to spring warming and late spring frost. Forests 12:1604. doi: 10.3390/f12111604
Wan, A., Chang, Q., Al-Bukhaiti, K., and He, J. (2023). Short-term power load forecasting for combined heat and power using CNN-LSTM enhanced by attention mechanism. Energy 282:128274. doi: 10.1016/j.energy.2023.128274
Wang, G.-G., Cheng, H., Zhang, Y., and Yu, H. (2023). ENSO analysis and prediction using deep learning: a review. Neurocomputing 520, 216–229. doi: 10.1016/j.neucom.2022.11.078
Wang, Z., Gong, H., Huang, M., Gu, F., Wei, J., Guo, Q., et al. (2023a). A multimodel random forest ensemble method for an improved assessment of Chinese terrestrial vegetation carbon density. Methods Ecol. Evol. 14, 117–132. doi: 10.1111/2041-210X.13729
Wang, Z., Li, R., Guo, Q., Wang, Z., Huang, M., Cai, C., et al. (2023b). Learning ensembles of process-based models for high accurately evaluating the one-hundred-year carbon sink potential of China’s forest ecosystem. Heliyon 9:e17243. doi: 10.1016/j.heliyon.2023.e17243
Wu, S., Fu, F., Wang, L., Yang, M., Dong, S., He, Y., et al. (2022). Short-term regional temperature prediction based on deep spatial and temporal networks. Atmos 13:1948. doi: 10.3390/atmos13121948
Wu, M. M., Liang, Y., Taubert, F., Huth, A., Zhang, M., and Wang, X. (2023). Sensitivity of forest composition and productivity to climate change in mixed broadleaved-Korean pine forest of northeastern China. Ecol. Model. 483:110434. doi: 10.1016/j.ecolmodel.2023.110434
Xing, L., Cui, N., Guo, L., Gong, D., Wen, S., Zhang, Y., et al. (2023). Predicting daily solar radiation using a novel hybrid long short-term memory network across four climate regions of China. Comput. Electron. Agric. 212:108139. doi: 10.1016/j.compag.2023.108139
Xu, G., Gao, Y., Li, Y., Jia, Z., Du, X., Yang, Y., et al. (2023). A novel approach for prognosis of lithium-ion battery based on geometrical features and data-driven model. Front. Energy Res. 11:1144450. doi: 10.3389/fenrg.2023.1144450
Yang, J., Zhang, Q., Song, W., An, Y., and Wang, X. (2022). Divergent response of Pinus pumila growth to climate warming at different latitudes and in different simulation predictions. Front. For. Glob. Change 5:1075100. doi: 10.3389/ffgc.2022.1075100
Yu, J., Zhang, X., Xu, L., Dong, J., and Zhangzhong, L. (2021). A hybrid CNN-GRU model for predicting soil moisture in maize root zone. Agric. Water Manag. 245:106649. doi: 10.1016/j.agwat.2020.106649
Zema, D. A., Lucas-Borja, M. E., Fotia, L., Rosaci, D., Sarnè, G. M. L., and Zimbone, S. M. (2020). Predicting the hydrological response of a forest after wildfire and soil treatments using an artificial neural network. Comput. Electron. Agric. 170:105280. doi: 10.1016/j.compag.2020.105280
Zhang, J., and Li, S. (2022). Air quality index forecast in Beijing based on CNN-LSTM multi-model. Chemosphere 308:136180. doi: 10.1016/j.chemosphere.2022.136180
Zhang, J.-H., Li, K.-J., Liu, X.-F., Yang, L., and Shen, S.-K. (2021). Interspecific variance of suitable habitat changes for four alpine Rhododendron species under climate change: implications for their reintroductions. Forests 12:1520. doi: 10.3390/f12111520
Zhang, J., Shen, X., Wang, Y., Jiang, M., and Lu, X. (2021). Effects of Forest changes on summer surface temperature in Changbai Mountain, China. Forests 12:1551. doi: 10.3390/f12111551
Zhang, J., Xin, X., Shang, Y., Wang, Y., and Zhang, L. (2023). Nonstationary significant wave height forecasting with a hybrid VMD-CNN model. Ocean Eng. 285:115338. doi: 10.1016/j.oceaneng.2023.115338
Zhang, Z., Yang, S., Wang, G., Wang, W., Xia, H., Sun, S., et al. (2022). Evaluation of geographically weighted logistic model and mixed effect model in forest fire prediction in Northeast China. Front. For. Glob. Change 5:1040408. doi: 10.3389/ffgc.2022.1040408
Zhao, J., Zhao, X., Wu, D., Meili, N., and Fatichi, S. (2023). Satellite-based evidence highlights a considerable increase of urban tree cooling benefits from 2000 to 2015. Glob. Chang. Biol. 29, 3085–3097. doi: 10.1111/gcb.16667
Zheng, L., Shi, P., Zhou, T., Hou, G., Song, M., and Yu, F. (2021). Tree regeneration patterns on contrasting slopes at treeline ecotones in eastern Tibet. Forests 12:1605. doi: 10.3390/f12111605
Zhou, M., Yu, Z., Gu, H., Ju, Q., Gao, Y., Wen, L., et al. (2022). “Evaluation and projections of surface air temperature over the Tibetan plateau from CMIP6 and CMIP5: warming trend and uncertainty” in Clim Dyn 60:3863–3883. doi: 10.1007/s00382-022-06518-4
Keywords: extreme atmospheric temperature, artificial neural network, deep learning, CNN-GRU, CNN-LSTM, prediction, training algorithm, forest
Citation: Guo Q, He Z and Wang Z (2023) Prediction of monthly average and extreme atmospheric temperatures in Zhengzhou based on artificial neural network and deep learning models. Front. For. Glob. Change. 6:1249300. doi: 10.3389/ffgc.2023.1249300
Edited by:
Mohammad Ibrahim Khalil, University College Dublin, IrelandReviewed by:
Mehmet Şahin, Siirt University, TürkiyeCopyright © 2023 Guo, He and Wang. This is an open-access article distributed under the terms of the Creative Commons Attribution License (CC BY). The use, distribution or reproduction in other forums is permitted, provided the original author(s) and the copyright owner(s) are credited and that the original publication in this journal is cited, in accordance with accepted academic practice. No use, distribution or reproduction is permitted which does not comply with these terms.
*Correspondence: Qingchun Guo, Z3VvcWluZ2NodW5AbGN1LmVkdS5jbg==
Disclaimer: All claims expressed in this article are solely those of the authors and do not necessarily represent those of their affiliated organizations, or those of the publisher, the editors and the reviewers. Any product that may be evaluated in this article or claim that may be made by its manufacturer is not guaranteed or endorsed by the publisher.
Research integrity at Frontiers
Learn more about the work of our research integrity team to safeguard the quality of each article we publish.