 Rongxin Deng
 Qunzuo Guo
 Menghao Jia
- College of Surveying and Geo-Informatics, North China University of Water Resources and Electric Power, Zhengzhou, China
Introduction: Farmland shelterbelts play a positive role in ensuring food security and ecological safety. The absence or degradation of shelterbelt structures can lead to fragmentation of the remotely extracted results. Conversely, shelterbelt maintenance and management system considers these shelterbelts as entire units, even if they are divided into several parts by the gaps in them. It is essential to propose a remote extraction method to fill in fragmented results and accurately represent the distribution of farmland shelterbelts.
Methods: In this study, random forest algorithm was employed to classify land cover from ZY-3 (ZiYuan-3 satellite from China) imagery. Then, a thinning algorithm of mathematical morphology was applied to extract farmland shelterbelts, and the straight-line connection algorithm was used to connect central lines belonging to the same belt. Finally, the result was validated using nine uniformly distributed training sample areas across the entire region.
Results and discussion: This method achieved a correct identification rate of 94.9% within the training areas. Among the different regions, the highest identification accuracy recorded was 98.4% and the lowest was 87.7%. In conjunction with cropland information and the shape index of forest patches, it was possible to remove information for non-farmland shelterbelts without introducing external information. This approach achieved a more refined extraction of forestland information. The combination of the thinning algorithm and straight-line connection algorithm addressed the issue of fragmented results in farmland shelterbelt extraction, compensating for the limitations of relying solely on mathematical morphology for belt connectivity. The research method can provide technical support for the monitoring and management of farmland shelterbelts.
1. Introduction
Farmland shelterbelts are linear agricultural ecological landscapes composed of trees. The purpose of a farmland shelterbelt is to create a corridor network system that can reduce the wind speed, improve the microclimate and soil conditions in fields, increase the biodiversity of flora and fauna, and ensure the ecological stability of agricultural fields to promote stable and increased food production (Xiao and Huang, 2016; Zheng et al., 2016; Yang et al., 2018). Since the implementation of the Three-North Shelterbelt Project, farmland shelterbelts have become an essential component of the shelterbelt system, positively impacting food production security, ecological security, and human living environments (Brandle et al., 2004; Campi et al., 2009; Zhu, 2010). However, farmland shelterbelts belong to non-renewable forests. Since the project’s implementation, partial belt loss and degradation have occurred due to natural or human factors, resulting in incomplete structure and a decline in the protective benefits of farmland shelterbelts (Liknes et al., 2017; Burke et al., 2019; Yu et al., 2021; Liu et al., 2022). Therefore, information regarding the accurate extraction of farmland shelterbelt can provide timely and adequate information support for modern agricultural and forestry management.
There are two main methods for obtaining information about farmland shelterbelts: field surveys and remote sensing monitoring. Although field surveys provide comprehensive and accurate information, they are time-consuming and expensive, making them unsuitable for large-scale monitoring. On the other hand, remote sensing technology is macroscopic, comprehensive, dynamic, and can aid in rapid collection of data (Pippuri et al., 2016; Li et al., 2018; Fan et al., 2022). It has been widely applied in forestry monitoring and mapping due to its ability to collect, process, and update large-scale spatial data quickly (Zhu et al., 2005; Grabska et al., 2019; Li et al., 2020; Xi et al., 2021).
Extensive research efforts have been devoted to the study on remote sensing extraction of farmland shelterbelts. For example, Deng et al. (2017) used SPOT5 data and a human–machine interactive visual interpretation method to extract farmland shelterbelts, and further estimated belt widths by using computer algorithms. Amichev et al. (2015) used SPOT5 data as a base map for human–machine interactions and combined it with the prairie shelterbelt program database to map shelterbelts. Although human–machine interactive visual interpretation achieves high accuracy in information extraction, it is labor-intensive, time-consuming, and inefficient. On the other hand, computer-based classification methods are more efficient, cost-effective, and suitable for large-scale study areas, leading to their widespread application (Yang et al., 2017). Traditional remote sensing classification commonly uses methods based on pixel feature values. For example, Aksoy et al. (2010) extracted linear trees in agricultural landscapes based on spectral information, texture information, and granularity features by using QuickBird imagery. Liu et al. (2018) used GF2 satellite imagery and thresholding based on unique vegetation index features to rapidly extract information about afforestation. Hu (2014) used ZiYuan-3 satellite (ZY-3) imagery and a decision tree classification method to extract farmland shelterbelt information in Qian Gorlos Mongolian Autonomous County, Jilin Province. Some researchers have also proposed object-based image analysis methods, which consider the spatial characteristics of objects. Wiseman et al. (2009) used high-resolution imagery to identify shelterbelts. Shi et al. (2012) extracted farmland shelterbelt information in the central and western regions of Jilin Province based on SPOT 5 satellite data. Czerepowicz et al. (2012) extracted shelterbelt information in Canterbury Plains, New Zealand, and calculated carbon storage by the above-ground biomass method.
Furthermore, in-depth research has also been conducted on data sources with different resolutions, selection of classification features, and establishment of classification methods for extracting farmland shelterbelts by using remote sensing. However, the extraction results present the common issues. Owing to natural or human factors, there may be gaps in shelterbelts that result in discontinuity or fragmentation when using computer-based classification methods. Moreover, farmland shelterbelts are often managed and operated based on continuous shelterbelt structures. The discontinuity or fragmentation caused by shelterbelt extraction hinders their practical management and the exploration of deeper-level shelterbelt structure information.
To address the problem of fragmented and discontinuous identification results, Quackenbush suggested that mathematical morphology is a practical approach for automated linear feature extraction (Quackenbush, 2004). Xing et al. (2016) introduced mathematical morphology and applied basic operations such as dilation and erosion to obtain continuous shelterbelt networks in the central part of Jilin Province. Lu et al. (2018) applied mathematical morphology to process shelterbelt classification results based on decision trees and obtained a farmland shelterbelt network framework. These studies offer insights into farmland shelterbelt network extraction by using remote sensing images; nonetheless, some limitations remain (Zhang et al., 2015). Mathematical morphology methods are sensitive to structural element size, and changes in structural elements can affect the outcomes of belt connectivity. This may cause significant errors in areas where shelterbelt networks intersect. Therefore, further research is required to improve the accuracy and robustness of extraction methods for farmland shelterbelt networks. This may involve systematic exploration of alternative algorithms or integration of mathematical morphology with other approaches to achieve more reliable and continuous results, in particular, in areas where shelterbelt networks intersect.
To address this need, the present study focused on the distribution area of farmland shelterbelts in China, specifically the Northeast Farmland Shelterbelt Construction Zone. Dehui and Nong’an Counties in the central-western part of Jilin Province were selected as the study areas. High-resolution satellite imagery from ZY-3 was used as the data source. A classification feature space was constructed by combining the spectral and texture features of land objects. The random forest algorithm was employed to classify the entire study area, and forestland information was selected. A refinement algorithm was applied to extract the centerlines of farmland shelterbelts. The straight-line connection algorithm was utilized to connect the discontinuous centerlines within the same shelterbelts. This study explored a remote sensing-based method for extracting farmland shelterbelt information oriented toward shelterbelt structures. It aimed to solve the issues of forestland confusion and discontinuity in remote sensing extraction of farmland shelterbelts information, providing a methodological foundation for identifying shelterbelt structures and offering data support for reasonable management practices. Overall, this study contributes to the development of a more reliable and continuous method for remote sensing-based extraction of farmland shelterbelt information, mainly focusing on shelterbelt structures. The research was conducted in the selected areas of Jilin Province, providing valuable insights into the management and practice of farmland shelterbelts.
2. Materials
2.1. Study area
The study area is located in Dehui and Nong’an Counties in the central–western part of Jilin Province, China, as shown in Figure 1. The geographic coordinates range from 125°14′30″ to 126°0′39″E and from 44°14′40″ to 44°47′27″N. The study area lies in the central part of the Songliao Plain and is characterized by flat terrain. It has a cold temperate semi-humid continental climate.
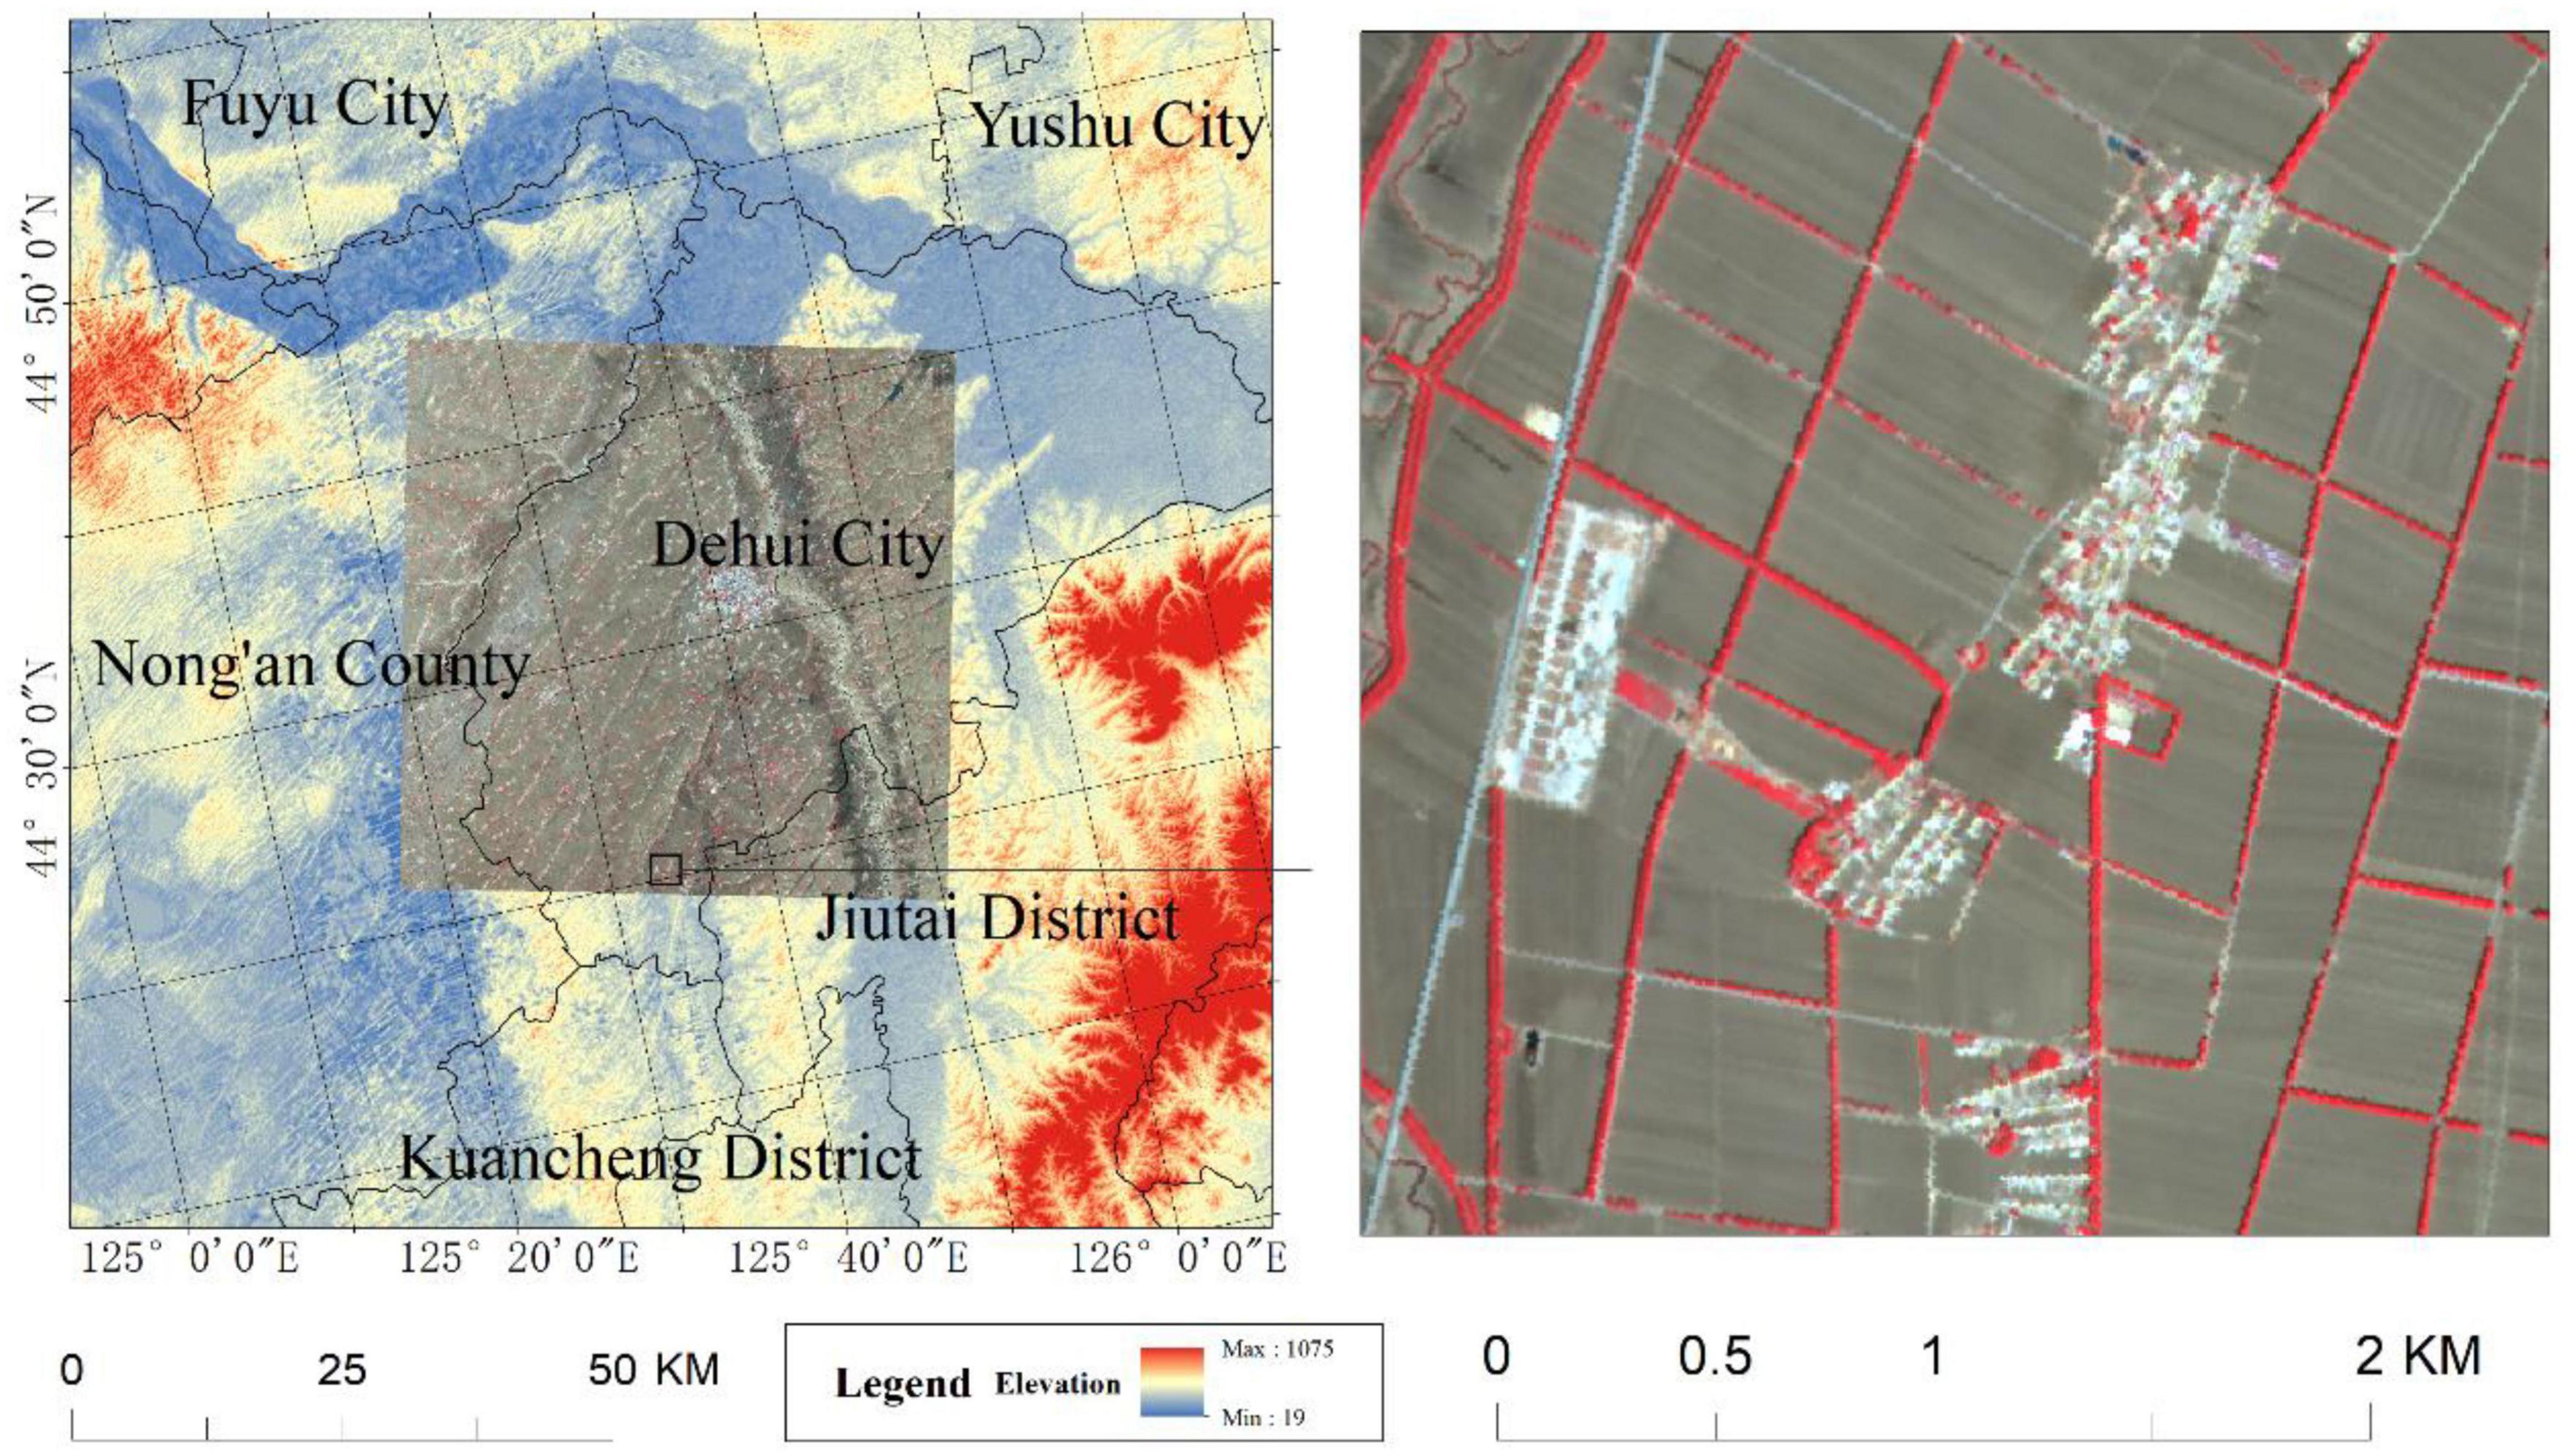
Figure 1. Location of the study area.
The region is abundant in agricultural resources; however, it is prone to wind damage during the spring and the environment is relatively fragile. Owing to the need for the protection of agricultural production in this area, the construction of farmland shelterbelts started early and has been carried out on a large scale. The establishment of farmland shelterbelts in this region began in the 1950s, and some farmland shelterbelts were created during the primary period in the 1970s. In particular, since the implementation of the Three-North Shelterbelt Project in 1978 (Zhang et al., 2017), the construction of farmland shelterbelts has become more systematic and comprehensive, achieving a network of interconnected forest belts (Yu et al., 2006). This area is a typical demonstration zone for farmland shelterbelts in the Northeast region.
2.2. Data source
2.2.1. Satellite imagery
For investigating farmland shelterbelts, a ZY-3 multispectral image taken on May 7th, 2019 with a spatial resolution of 5.8 m was selected as the data source. It was selected based on the image resolution, vegetation phenology patterns within the study area, and data availability. Preprocessing operations such as radiometric correction, were performed on the satellite image by using ENVI software, and the Albers equal-area conic projection with dual standard parallels was used as the geographic reference framework.
2.2.2. Validation data
A training sample dataset was established by visual interpretation of historical data from Google Earth in 2019 for the random forest classification. Nine validation areas were selected that were uniformly distributed throughout the study area and measured 925 km × 925 km. These areas were used for interactive interpretation of the imagery and to establish a verification sample dataset for farmland shelterbelts. In this manner, the accuracy of the extraction results was evaluated.
2.2.3. Sample data
In remote sensing image classification research, the commonly used methods for selecting sample points include single image element, seed image element, and polygonal block methods. Combining the feature situation and research purpose in the study area, this study uses the sample area of interest of ENVI5.3 software to randomly select 5,655 image elements as training sample points and 6,549 as validation sample points in the entire area by irregular polygonal block as a unit. Furthermore, the sample set of five categories, namely, forestland, cropland, buildings, water bodies, and unused land was constructed, as presented in Table 1.
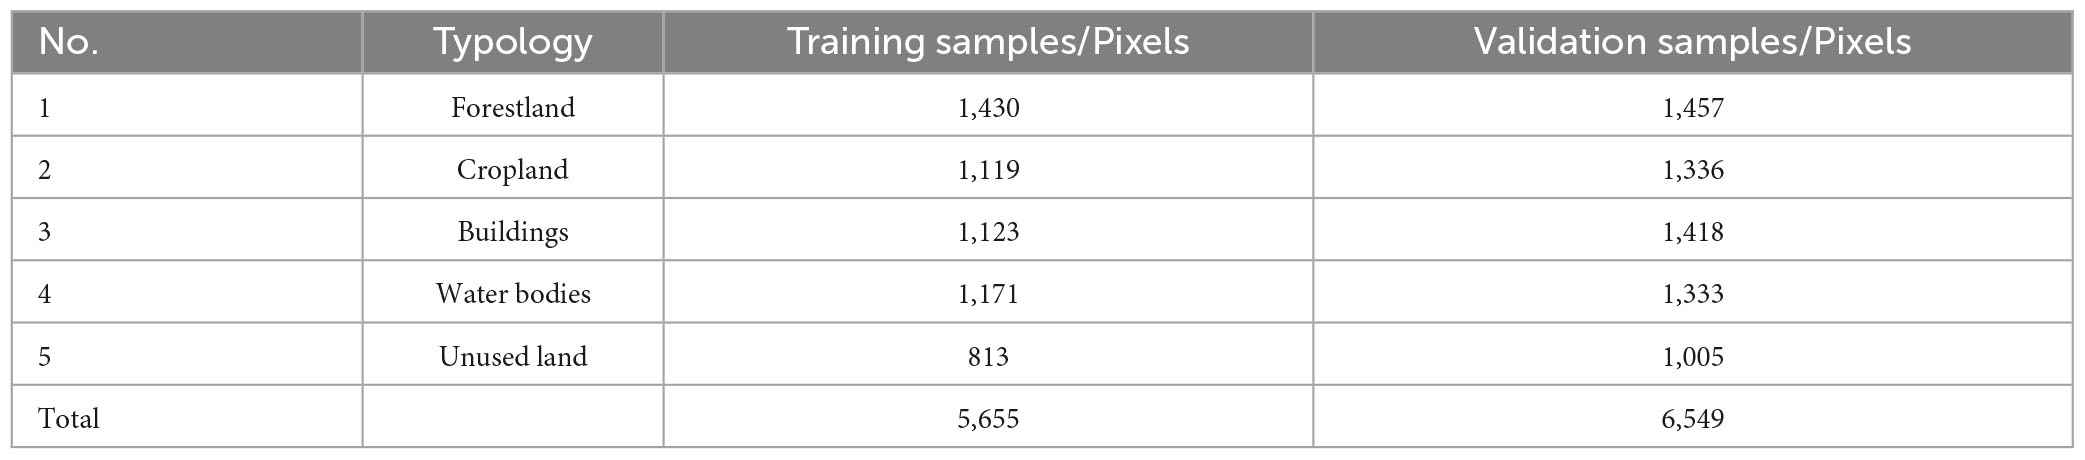
Table 1. Training and validation samples.
3. Methods
3.1. Technical process
First, a classification feature space was constructed based on the objects within the study area. By using a training sample dataset, the random forest classification algorithm was applied to classify the land cover into five categories; namely, forestland, cropland, buildings, water bodies, and unused land. Next, forestland area extraction results were refined by filtering out non-farmland shelterbelt information, retaining only the farmland shelterbelt information. Then, a refinement process involving thinning and line connection was applied to the farmland shelterbelt information, which connected the fragmented shelterbelt segments. This process resulted in a continuous vector line representation of farmland shelterbelts on a shelterbelt-by-shelterbelt basis. Finally, the accuracy of the extracted results was evaluated by using the selected validation sample areas. The technical workflow is illustrated in Figure 2.
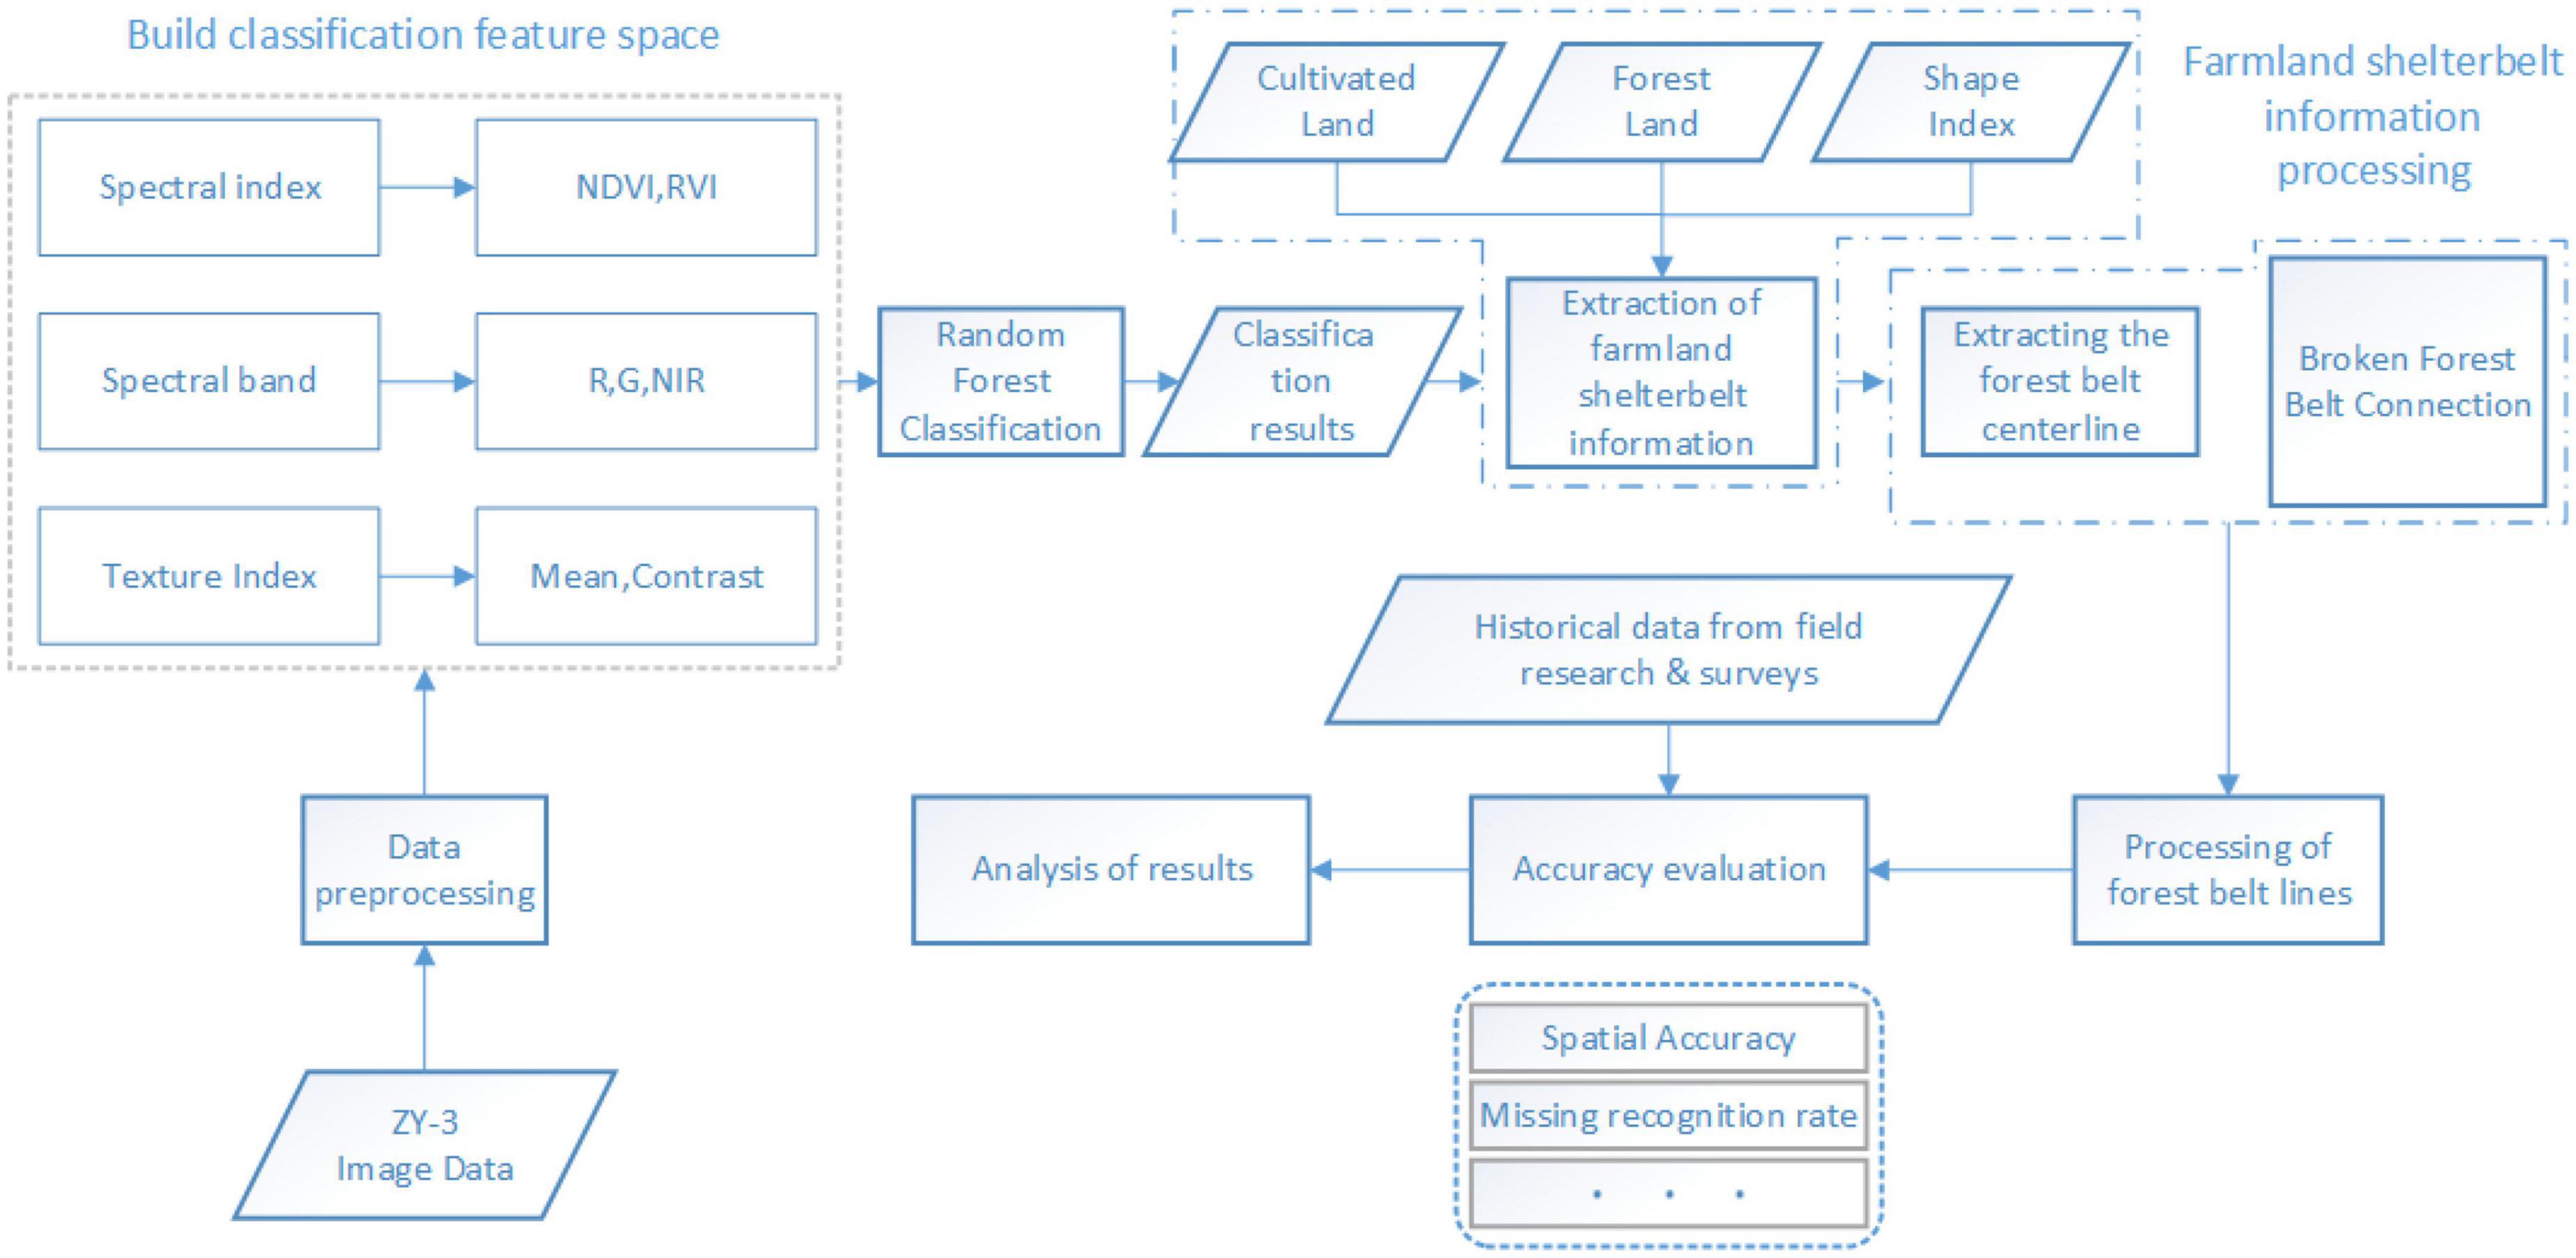
Figure 2. Technical workflow.
3.2. Extraction of land cover information
The Random Forest (RF) classification algorithm is a machine-learning algorithm that combines multiple decision trees (Del Río et al., 2014). It offers excellent noise resistance and stable performance, supports parallel computation, and can handle high-dimensional data. Numerous studies have shown that ensemble classifiers such as RF outperform individual classifiers in terms of accuracy (Dye et al., 2012; Hao et al., 2015; Grabska et al., 2019).
In extracting forest cover information, vegetation indices that reflect plant growth were selected as classification features. The most commonly used vegetation indices in remote sensing are the ratio vegetation index (RVI) and the normalized difference vegetation index (NDVI) (Gonenc et al., 2019). Texture features from the study area were calculated by using the gray-level co-occurrence matrix (GLCM). Based on the transformation parameters of the MUX sensor (Shi et al., 2019), the image was transformed into the brightness-component, the greenness-component, and the wetness-component by tasseled cap transformation.
Spectral features reflect the spectral differences among different objects, whereas texture features describe the visual homogeneity characteristics in the image. In this study, the spectral and texture features of a multispectral image were combined to construct a high-dimensional classification feature space. The RF algorithm was then used to evaluate the importance of these features and select the relevant ones. The number and sort of selected features were controlled based on the out-of-bag error rate (Gao et al., 2022; Kriese et al., 2022). Finally, the importance of the categorized features and the correlation among them were integrated, and the wetness-component, brightness-component, RVI, contrast texture index, entropy texture index, and correlation texture index were selected to make up the classification feature space.
3.3. Forest information separation
Complex information was extracted from forest classification results, which required the separation of farmland shelterbelt information from that of the other forestlands. Considering the actual conditions of the study area, other forestland mainly includes patchy forests, forests along riverbanks, and forestland within urban areas, towns, or villages. In order to maximize the protective benefits, the optimal planting locations for farmland shelterbelts are around the cultivated fields or vacant spaces within them (Dai and Chu, 2010; Liu et al., 2012; Zhu and Zheng, 2019). Based on the spatial distribution characteristics of farmland shelterbelts, information on forested land next to rivers and in construction land could be removed by overlaying the forestland and cultivated land classification results. The information screening process based on the spatial location of forestland is shown in Figure 3.
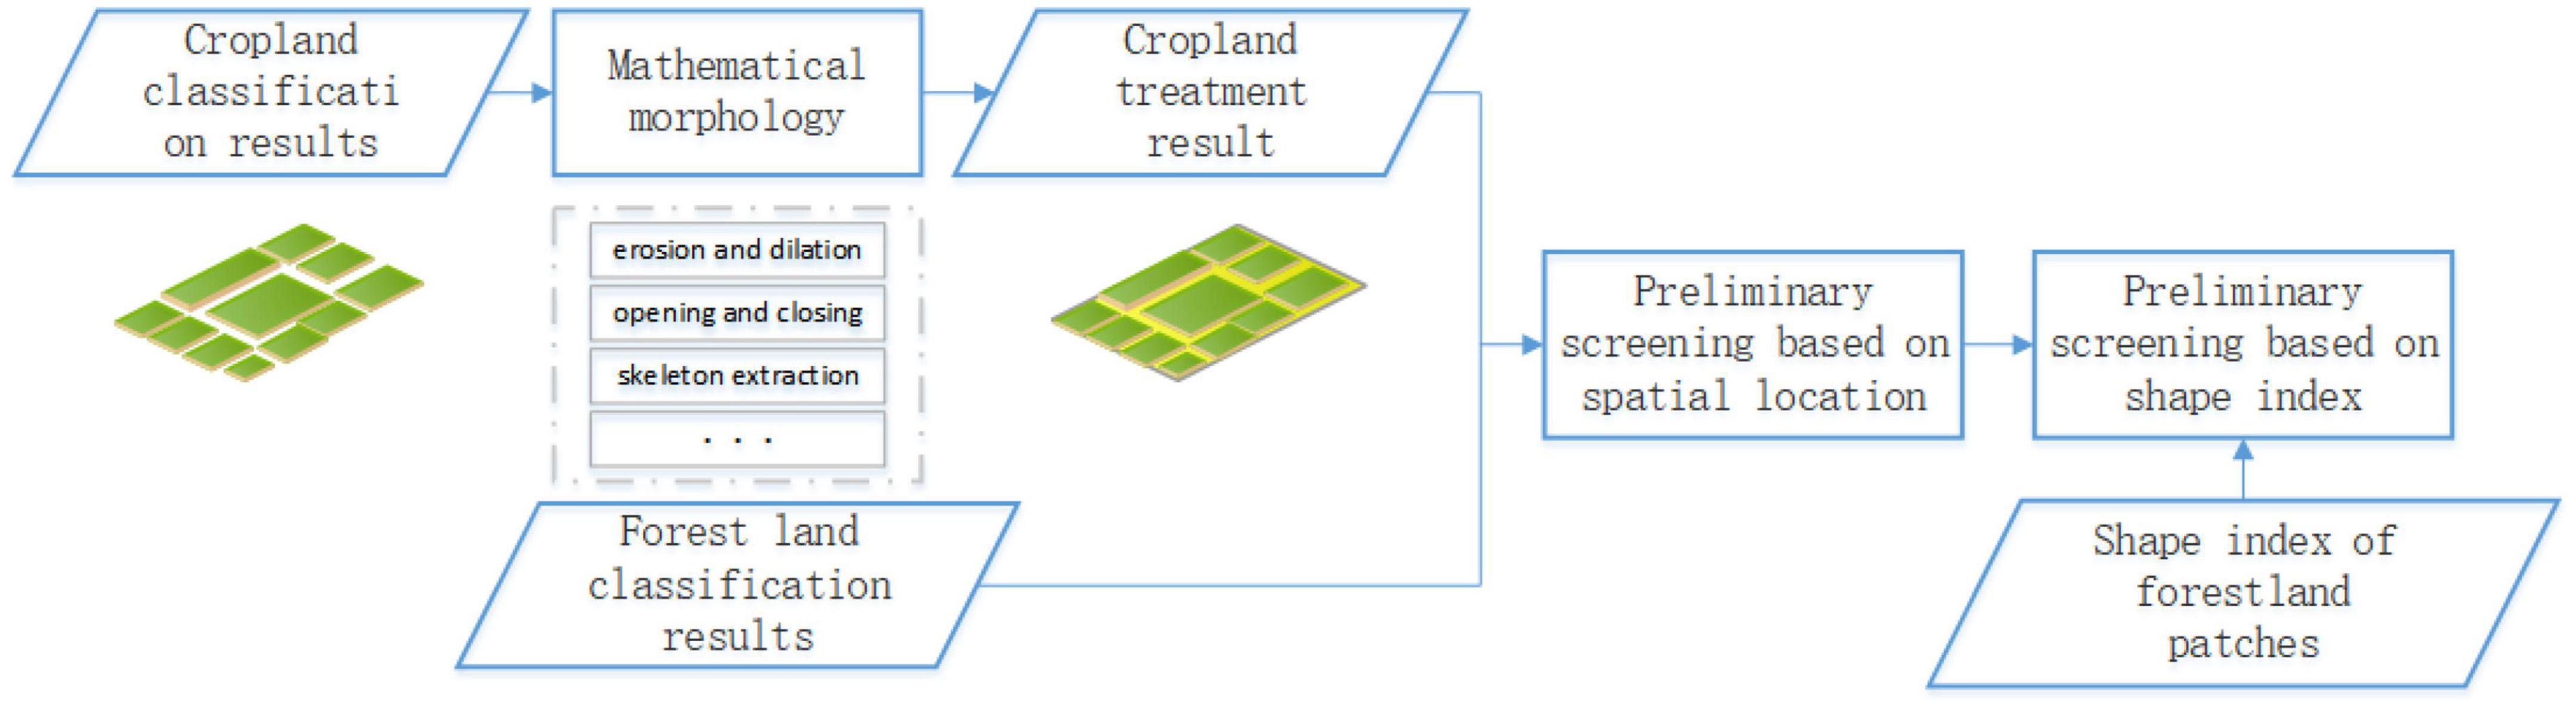
Figure 3. Information screening process based on cropland.
Other forestland information can be removed based on spatial location by incorporating cultivated land information processing. However, analysis of the study area indicates that some patchy forests were planned to be planted near agricultural land. Therefore, it was necessary to remove patchy forests with spatial distribution similar to shelterbelts.
Shelterbelts have a directional nature and are typically narrow and elongated with a belt-like distribution. On the other hand, patchy forests are often planted in a concentrated manner and exhibit regular rectangular shapes that are geometrically distinct from shelterbelts (Li, 1995). This study quantified the differences between patchy forests and shelterbelts using three shape parameters; namely, area, fill factor (density), and perimeter–area ratio (Liknes et al., 2017). The area parameter reflects the size of forest patches, the fill factor represents the directional nature, and the perimeter–area ratio indicates the proportion of boundary pixels. The region-props function was introduced to facilitate the calculation of shape indices for each forest patch. This function is commonly used to compute the area distribution of labeled regions, enabling the identification and measurement of various properties of regions in an image. The results were compiled, each connected domain was labeled, and geometric shape indices were calculated. The calculating area, fill factor, and perimeter–area ratio formulas are as follows:
(Note: In the equations, region props represent the array storing the results of the function operation. Box represents the minimum bounding rectangle that contains the corresponding region, ΔX represents the horizontal distance, and ΔY represents the vertical distance. Area and Perimeter represent the commands used to calculate the area and perimeter in the function).
Owing to the directional nature of forest belts, they tend to have lower filling levels in their minimum bounding rectangles, corresponding to lower density values. Moreover, farmland shelterbelts usually appear as narrow and elongated strips of forestland, resulting in a higher percentage of boundary pixels in the forest belt patches and, thus, a larger perimeter-to-area ratio. Consequently, by considering the area, filling level (density), and perimeter-to-area ratio of forest patches, it is possible to effectively screen and remove fragmented forest information from the extracted forestland information.
3.4. Belt-oriented connection
After the information screening, the extracted forest belts from the classified forestland results became discontinuous and fragmented. Therefore, a straight-line connection algorithm was applied to connect the fragmented portions and remove breakpoints in the extracted forest belts. In conventional linear feature extraction processes, boundary detection and line connection are typically performed to achieve straight-line connections (Shao et al., 2011; Yan and Meng, 2017; Zhang, 2020).
Edge detection is crucial in effective suppression of noise, extraction of actual edges, and accurate location of edges for successful line connections (Zhou et al., 2013). In extracting farmland shelterbelt information, noise was already eliminated through post-processing steps such as classification and information screening. Furthermore, due to the belt-like distribution of shelterbelts, performing edge detection introduced complexities and resulted in obtaining belt boundaries, which might have deviated from the actual spatial positions of the forestland.
Alternatively, a thinning algorithm based on mathematical morphology can be employed to progressively remove the boundaries of a forest belt without compromising image connectivity (Serra, 1986; Haralick et al., 1987; Li et al., 2017). This process abstracts the centerline of the image, allowing for the extraction of line-shaped features. It serves as an image “thinning” procedure, highlighting the target’s shape characteristics and topological structures while reducing redundant information. When this method was applied to the forest belt patches of farmland shelterbelts, the boundaries gradually stripped away, which resulted in a centerline that accurately represented the shelterbelt trend using a single pixel. Forest belt centerline positions have high accuracy and are unbiased, requiring only the recording of start and end coordinates of each centerline to achieve edge localization. The principles of the image thinning algorithm are as follows:
Where W is the set of pixels after refinement of the binary image; A is the set of pixels after binarization of the original image; and B is the binary structure element used for refinement, which is an arbitrarily shaped graph with a center.
(Note: In the equation, “↑” denotes hit-and-miss transformation; hit indicates that A contains B, and miss indicates that A does not contain B).
Connection of fracture lines in forest belts involves merging and connecting the same forest belt patches. The raster centerlines extracted by using thinning algorithms do not alter connectivity and require fracture line connection processing. When extracting forest belt centerlines, forest patch information was gradually simplified and the endpoint coordinates of the centerlines replaced the edge coordinates of the patches. By generating connecting lines based on the coordinates of each endpoint and connecting the centerlines end to end, fracture line connection was achieved.
The extraction results of farmland shelterbelts were in raster data format, where raster data were used to assign values to represent entity images of the grid cells. To update the image, it was necessary to reassign pixel values along the connecting lines. During the image processing, the Bresenham line algorithm was used to generate a connecting line between two points by tracking an error term and incrementally calculating the coordinates of the next point on the line in the X and Y directions (Bresenham, 1965). This allowed for the rapid generation of straight lines. The coordinates calculated by using this algorithm were directly matched to the row and column numbers of the raster data for indexing and reassigning the pixels along the lines. The specific principles of the Bresenham line connection algorithm are illustrated in Figure 4.
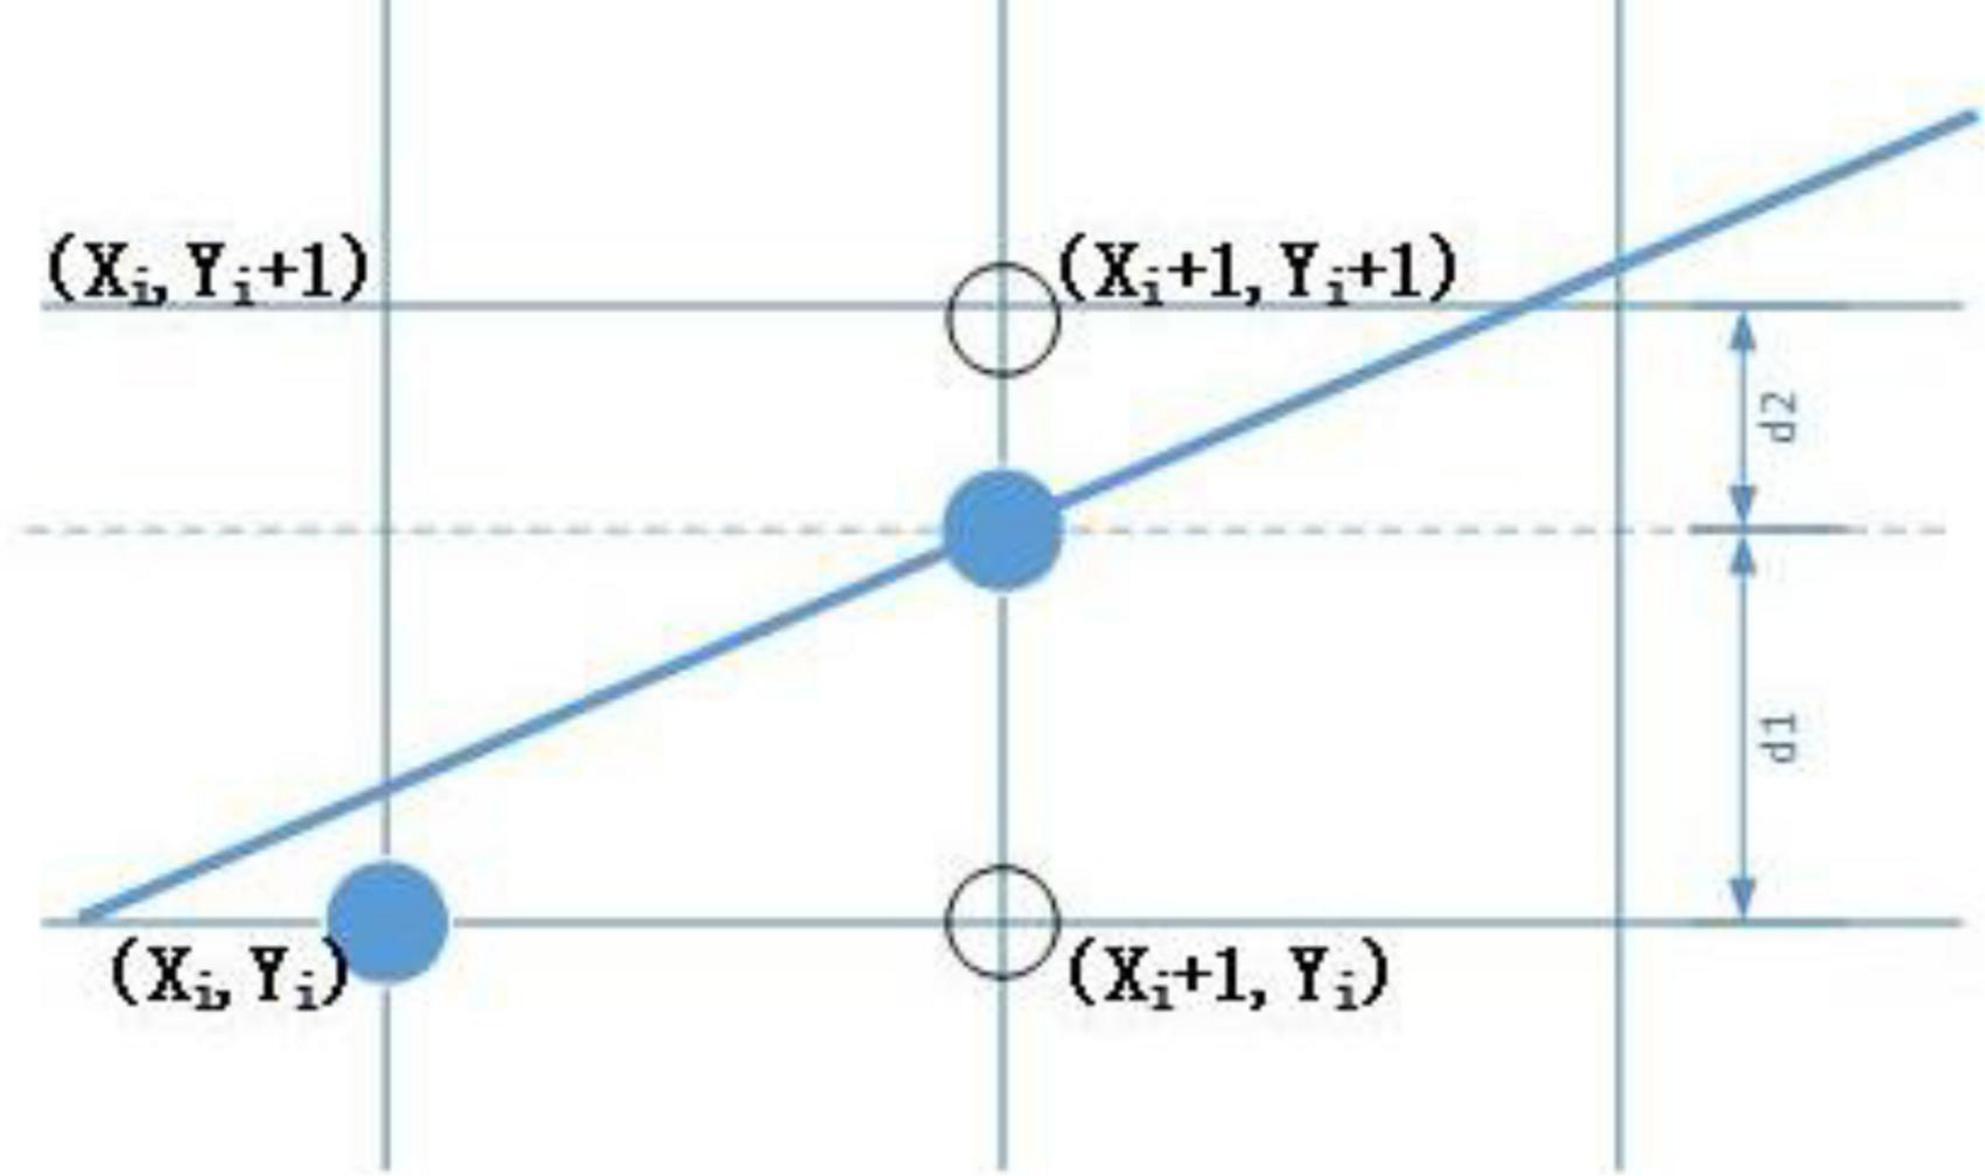
Figure 4. The coordinate calculation of the i + 1 pixel point.
In this study, farmland shelterbelt data were extracted separately through information filtering. Thinning operations were applied to the forest patches to identify shelterbelt trends by using the patch centerlines. This approach preserved the topological relationships while removing redundant information. The endpoint coordinates of the thinned patch centerlines were extracted, and straight-line connections were established based on a threshold for fracture width. Through these operations, the fracture lines in the shelterbelts were connected, addressing the issue of fragmented extraction results and achieving the extraction of farmland shelterbelt information focusing on belt structure.
3.5. Precision evaluation
A validation dataset for farmland shelterbelts was created through visual interpretation of high-resolution imagery over the validation area. The accuracy of the information extraction results was evaluated by using metrics such as the extraction length matching rate, extraction omission rate, and identification redundancy rate. The evaluation formulas are as follows:
Where P is the coincidence rate, %; F denotes the miss rate, %; R is the redundancy rate, %; Tr is correct extraction; L denotes omission extraction; Tf and is redundant extraction.
4. Results and analysis
4.1. Forest classification results
The training dataset was constructed by randomly selecting sample points from the entire area. By using the bootstrap resampling technique, RF was employed to extract multiple sub-samples from the sample set. Decision tree modeling was performed on each sub-sample, and the final classification result was obtained by voting. Figure 5 shows that the classification accuracy of the study area was 94.82%, and there was improved identification of shelterbelts in areas with dense planting and good management, whereas in other areas it was more fragmented. Although the overall extraction of forest information in the entire area was relatively sound, the extraction results included other forest information, and there were noticeable fractures in the shelterbelts.
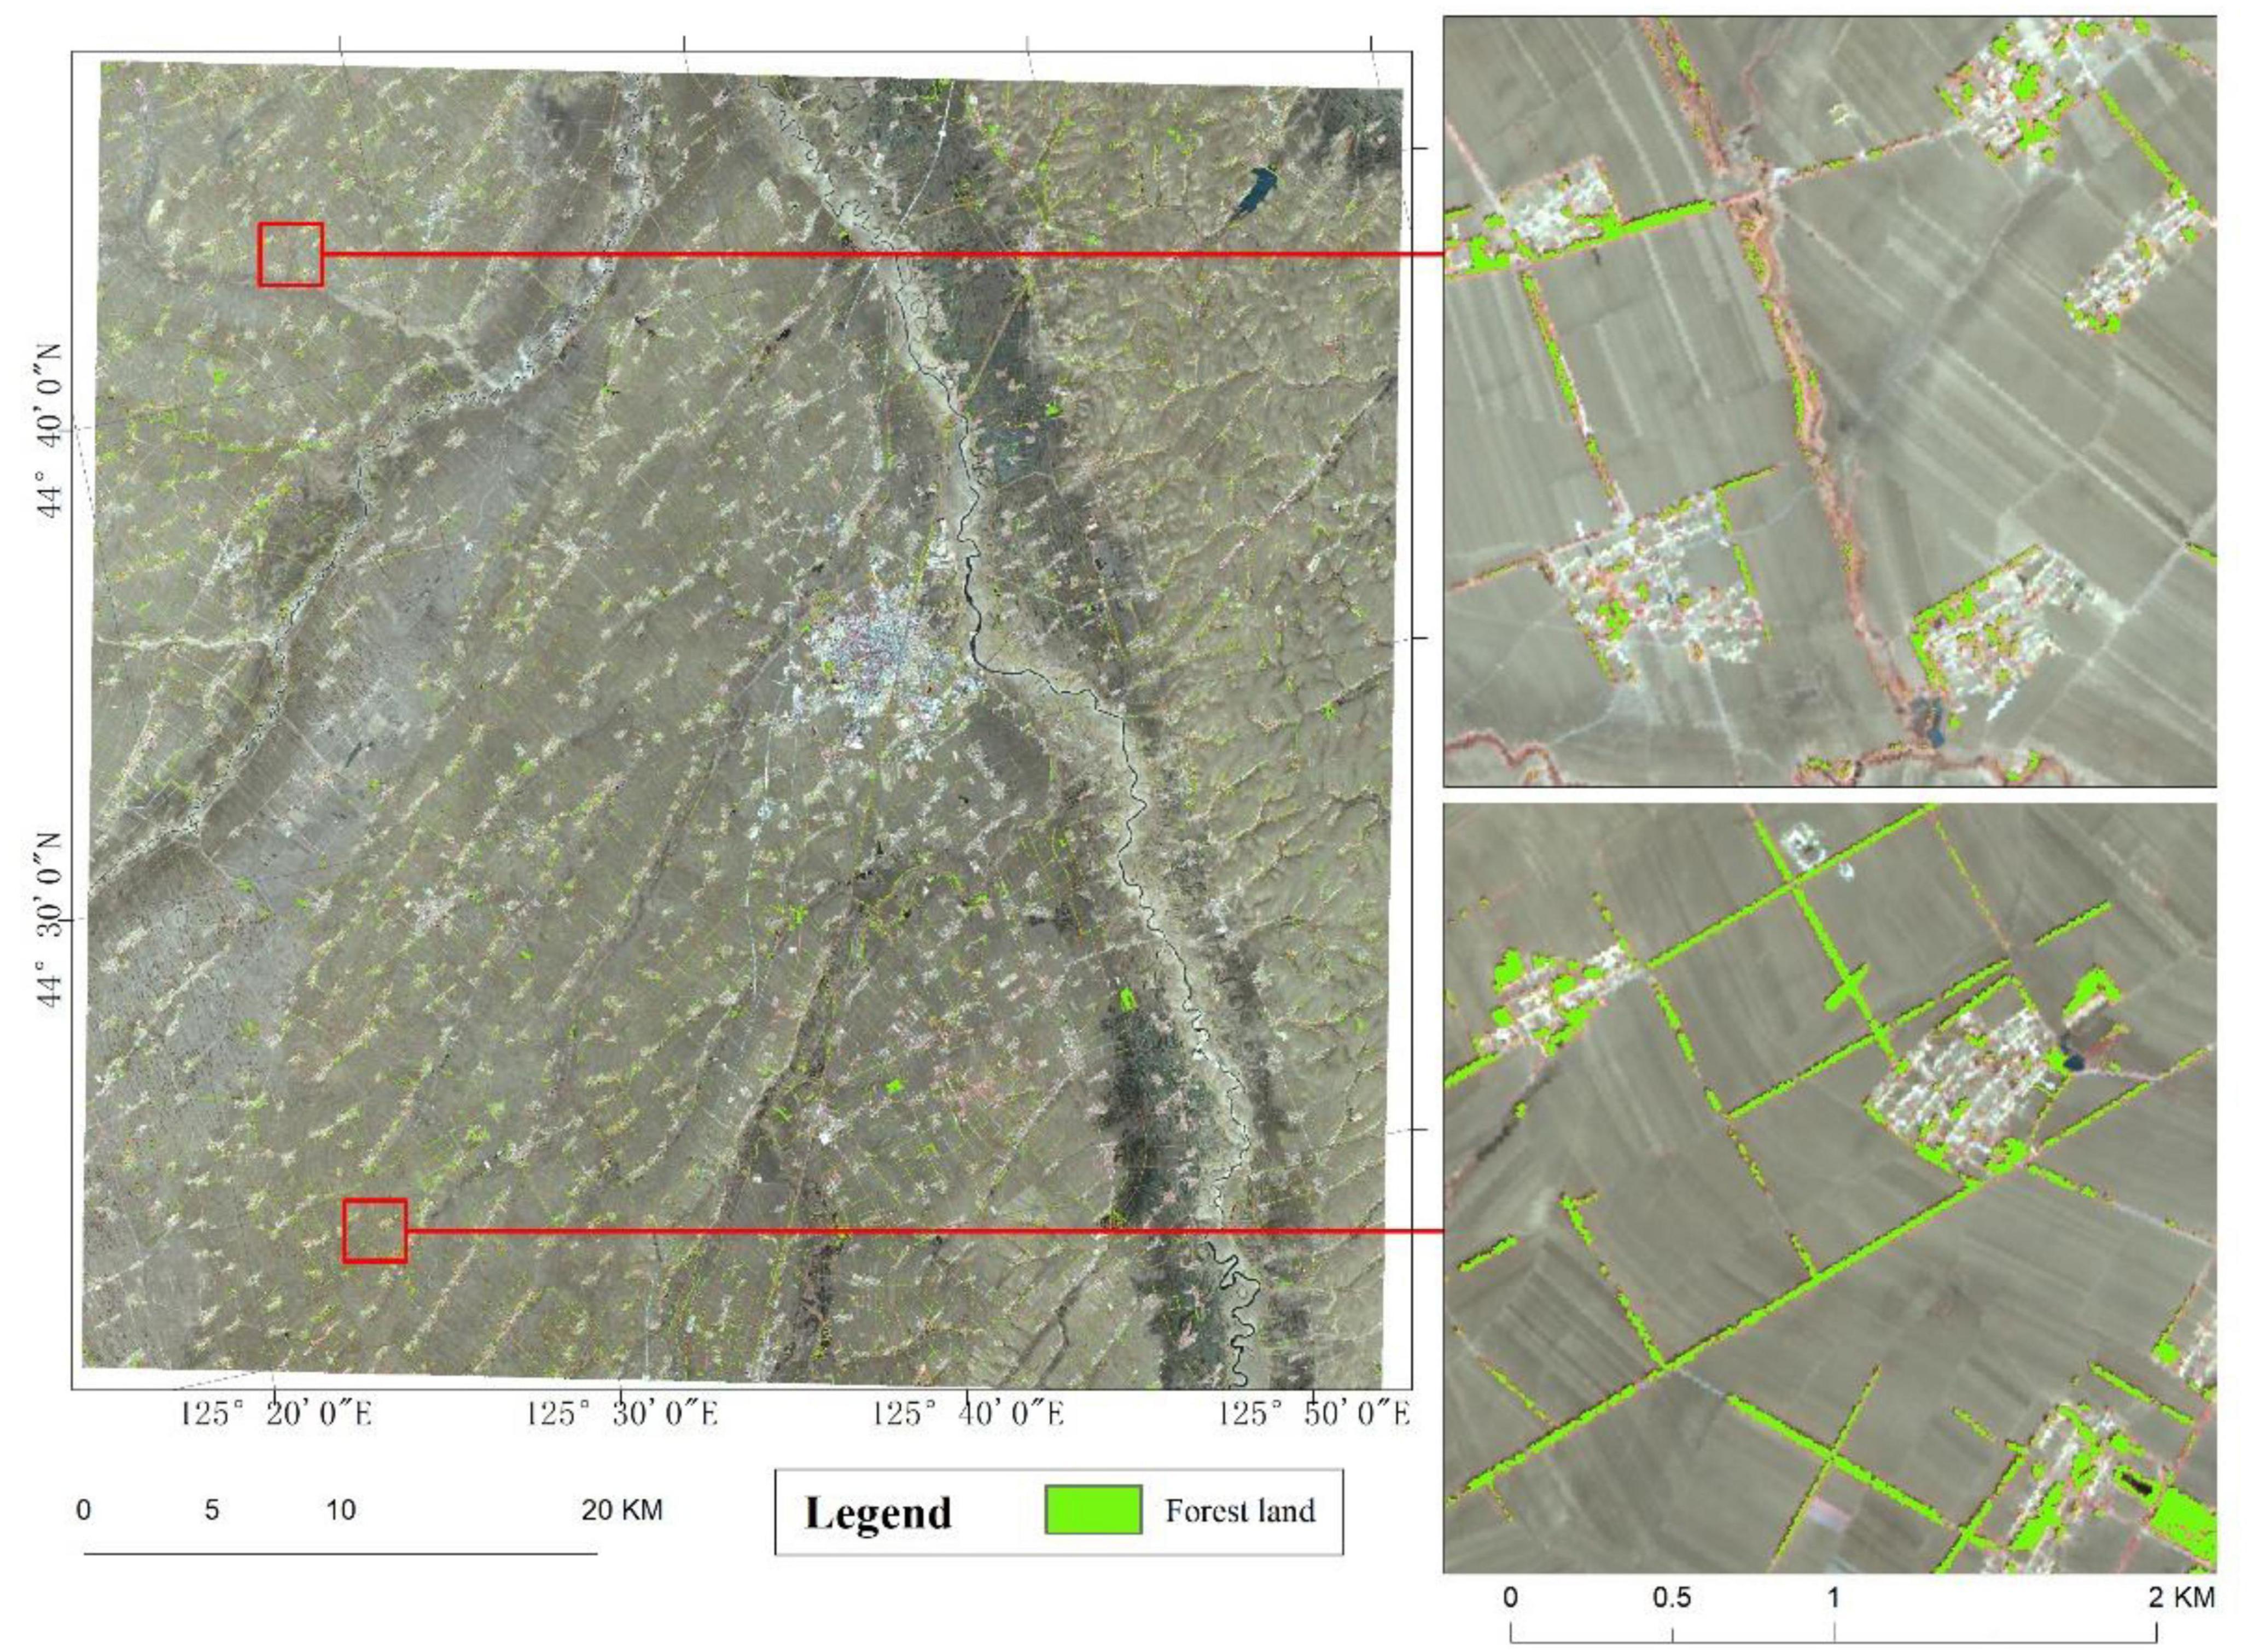
Figure 5. Regional classification results.
4.2. Forest information filtering results
The above-mentioned method was employed to extract farmland shelterbelt information in response to the issue of complex forest information in the preliminary identification results. The results are shown in Figure 6, wherein the extracted forest information is represented in yellow and the filtered-out forest information is represented in red. The marked rectangular area in Figure 6 indicates that the overlaying cultivated land information with forest information helped remove forest information within urban and village areas. In the marked elliptical area in Figure 6, the shape parameters of each forest patch were utilized to filter out fragmented forest information. These two steps of information filtering eliminated other forest information, ensuring the retention of farmland shelterbelt information. However, some errors were encountered, such as the area marked by the dotted line in Figure 6, where the forest land was wrongly screened out. After analysis, it was concluded that the features near the forestland were not classified as cropland, which led to the missing information when screening based on spatial location information.
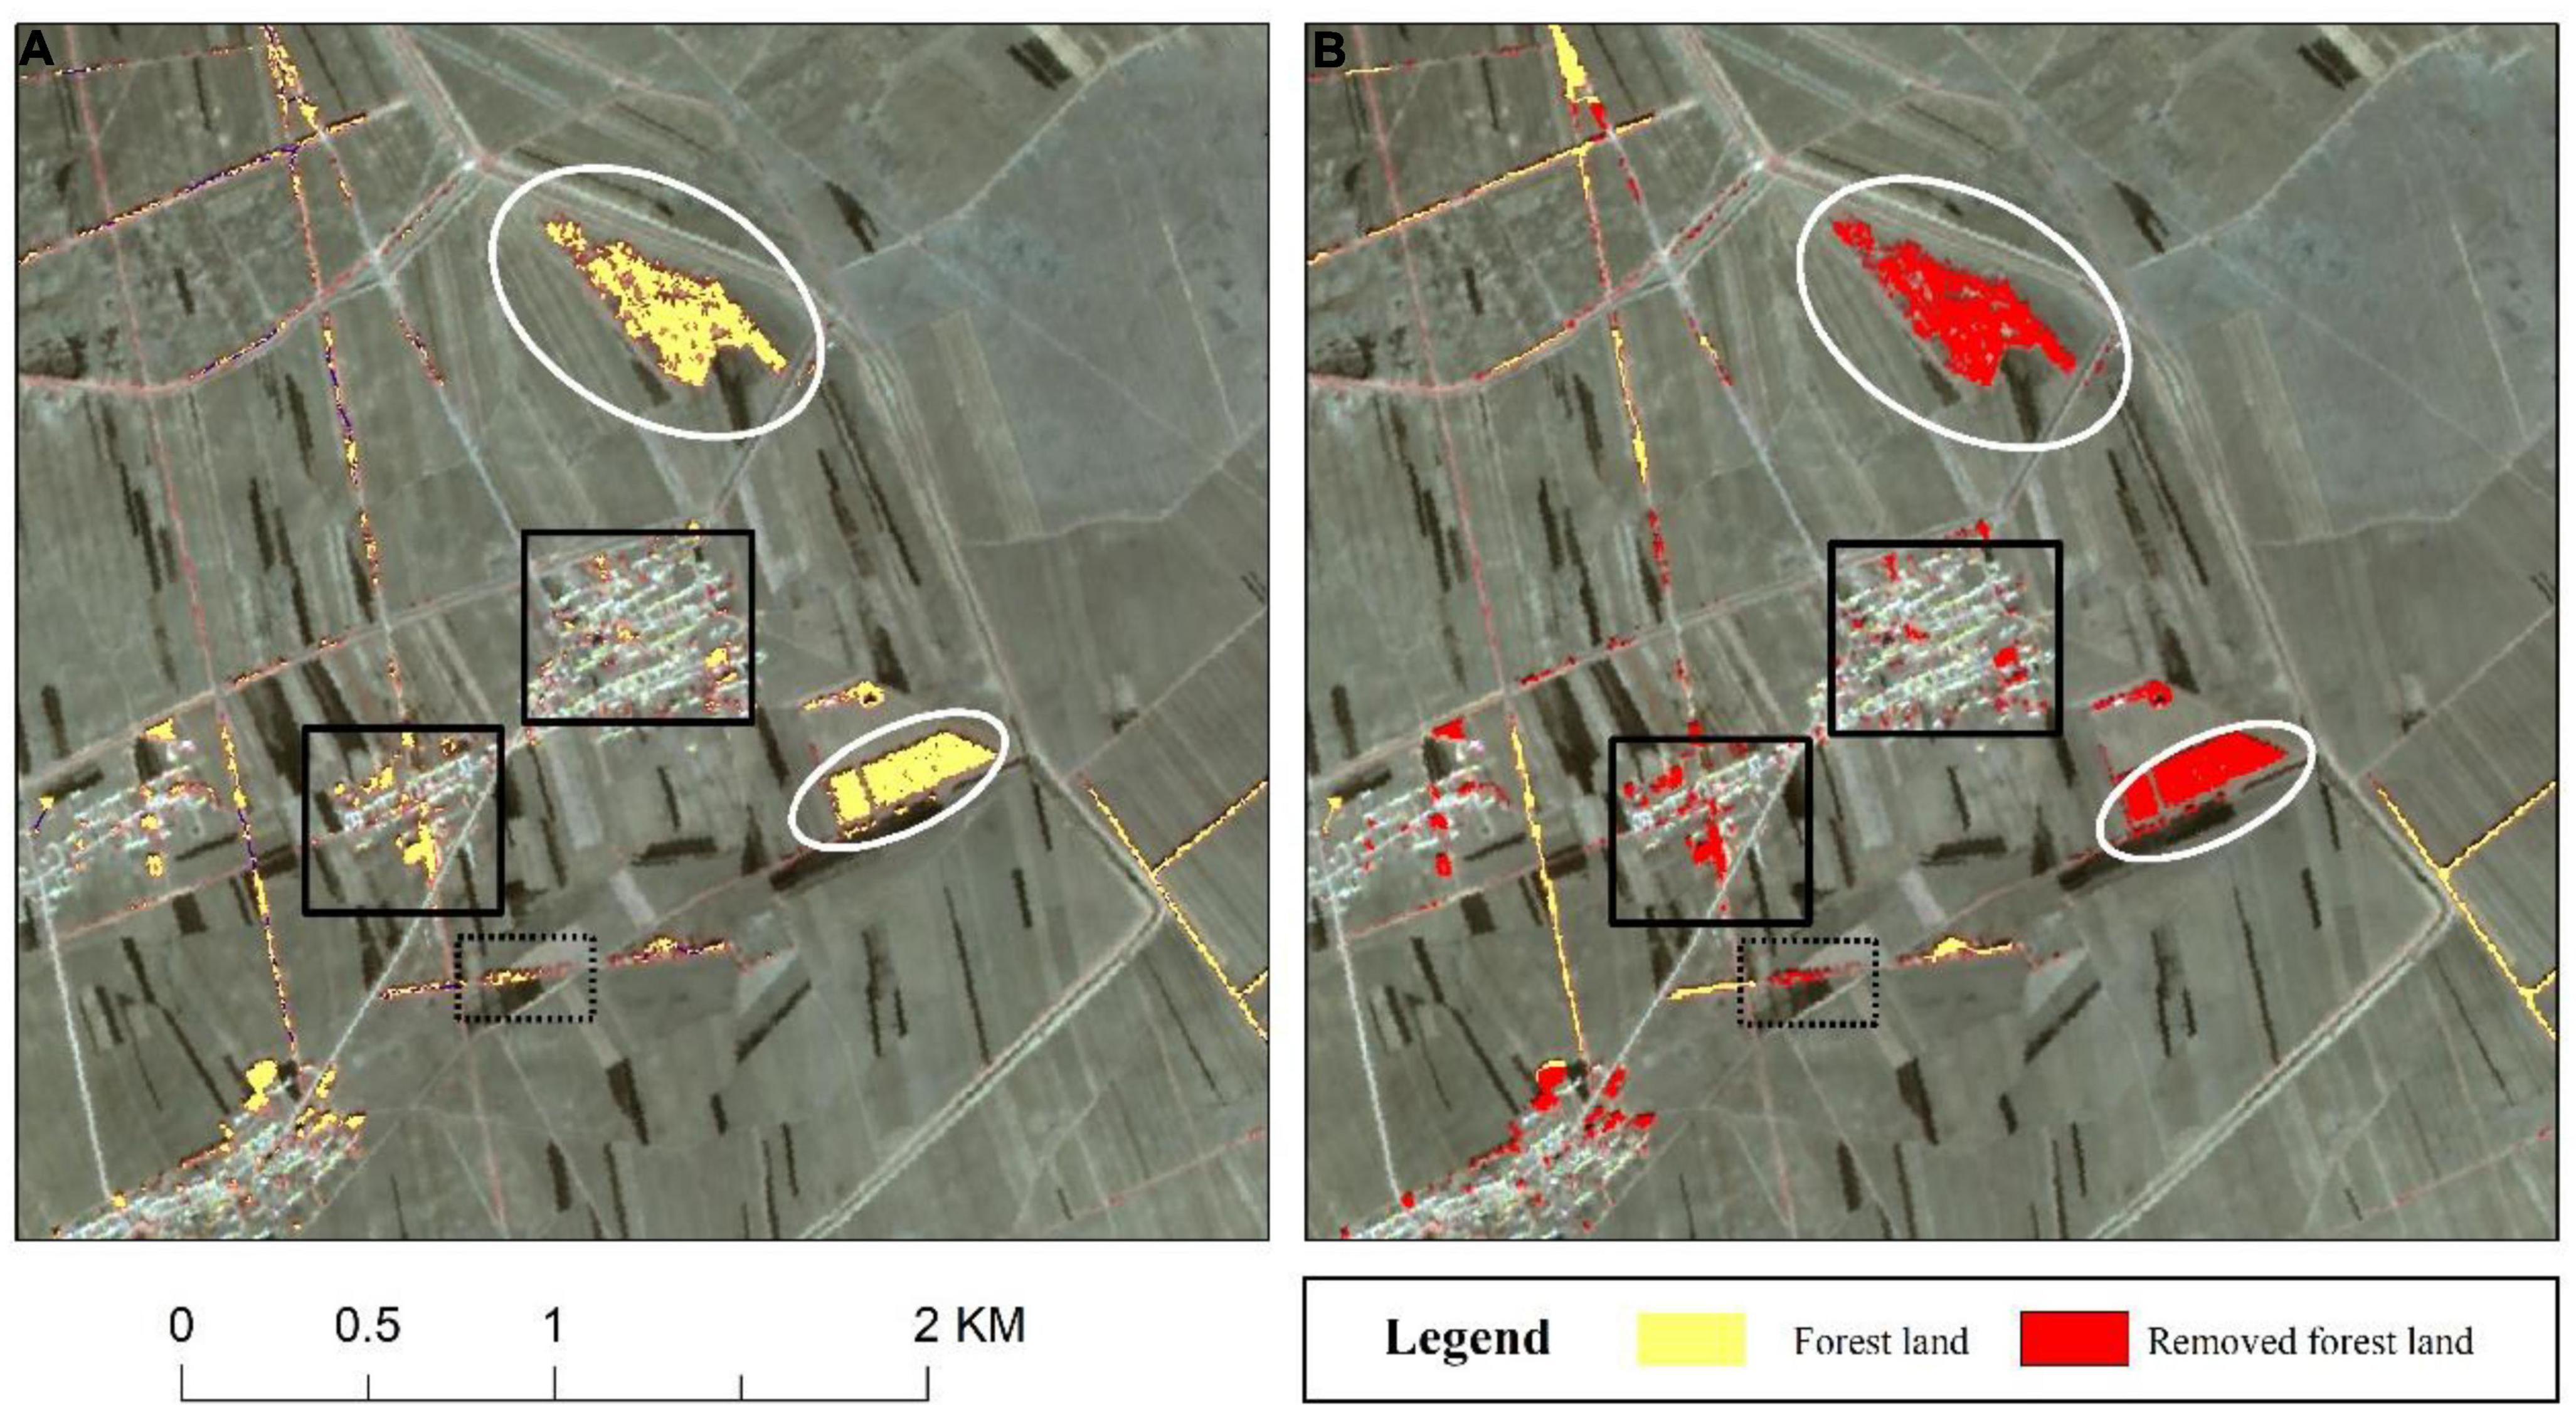
Figure 6. Results of forest land information screening. (A) Initial categorization results. (B) Information screening results.
4.3. Shelterbelt continuity connecting results
To address the fragmented and discontinuous extraction of farmland shelterbelt information, morphological thinning and line connection operations were performed on the filtered patches. Finally, connected centerlines were subjected to smooth boundary processing to extract farmland shelterbelt information. The results are shown in Figure 7, which shows the formation of two common “false fractures” in extracting farmland shelterbelt information. Figure 7A exhibits that artificial road intersections can cause interruptions in the shelterbelts. Figure 7C demonstrates that due to natural factors and sparse planting, shelterbelts are prone to damage in the extraction results due to road interference. By using the methods described above, the shelterbelts were connected, which aided in addressing the issue of fragmented extraction results and achieving information focusing on the farmland shelterbelts. Figures 7B, D exhibit that although the forest belt vector data are polylines with more inflection points, the accurate spatial position accuracy is good.
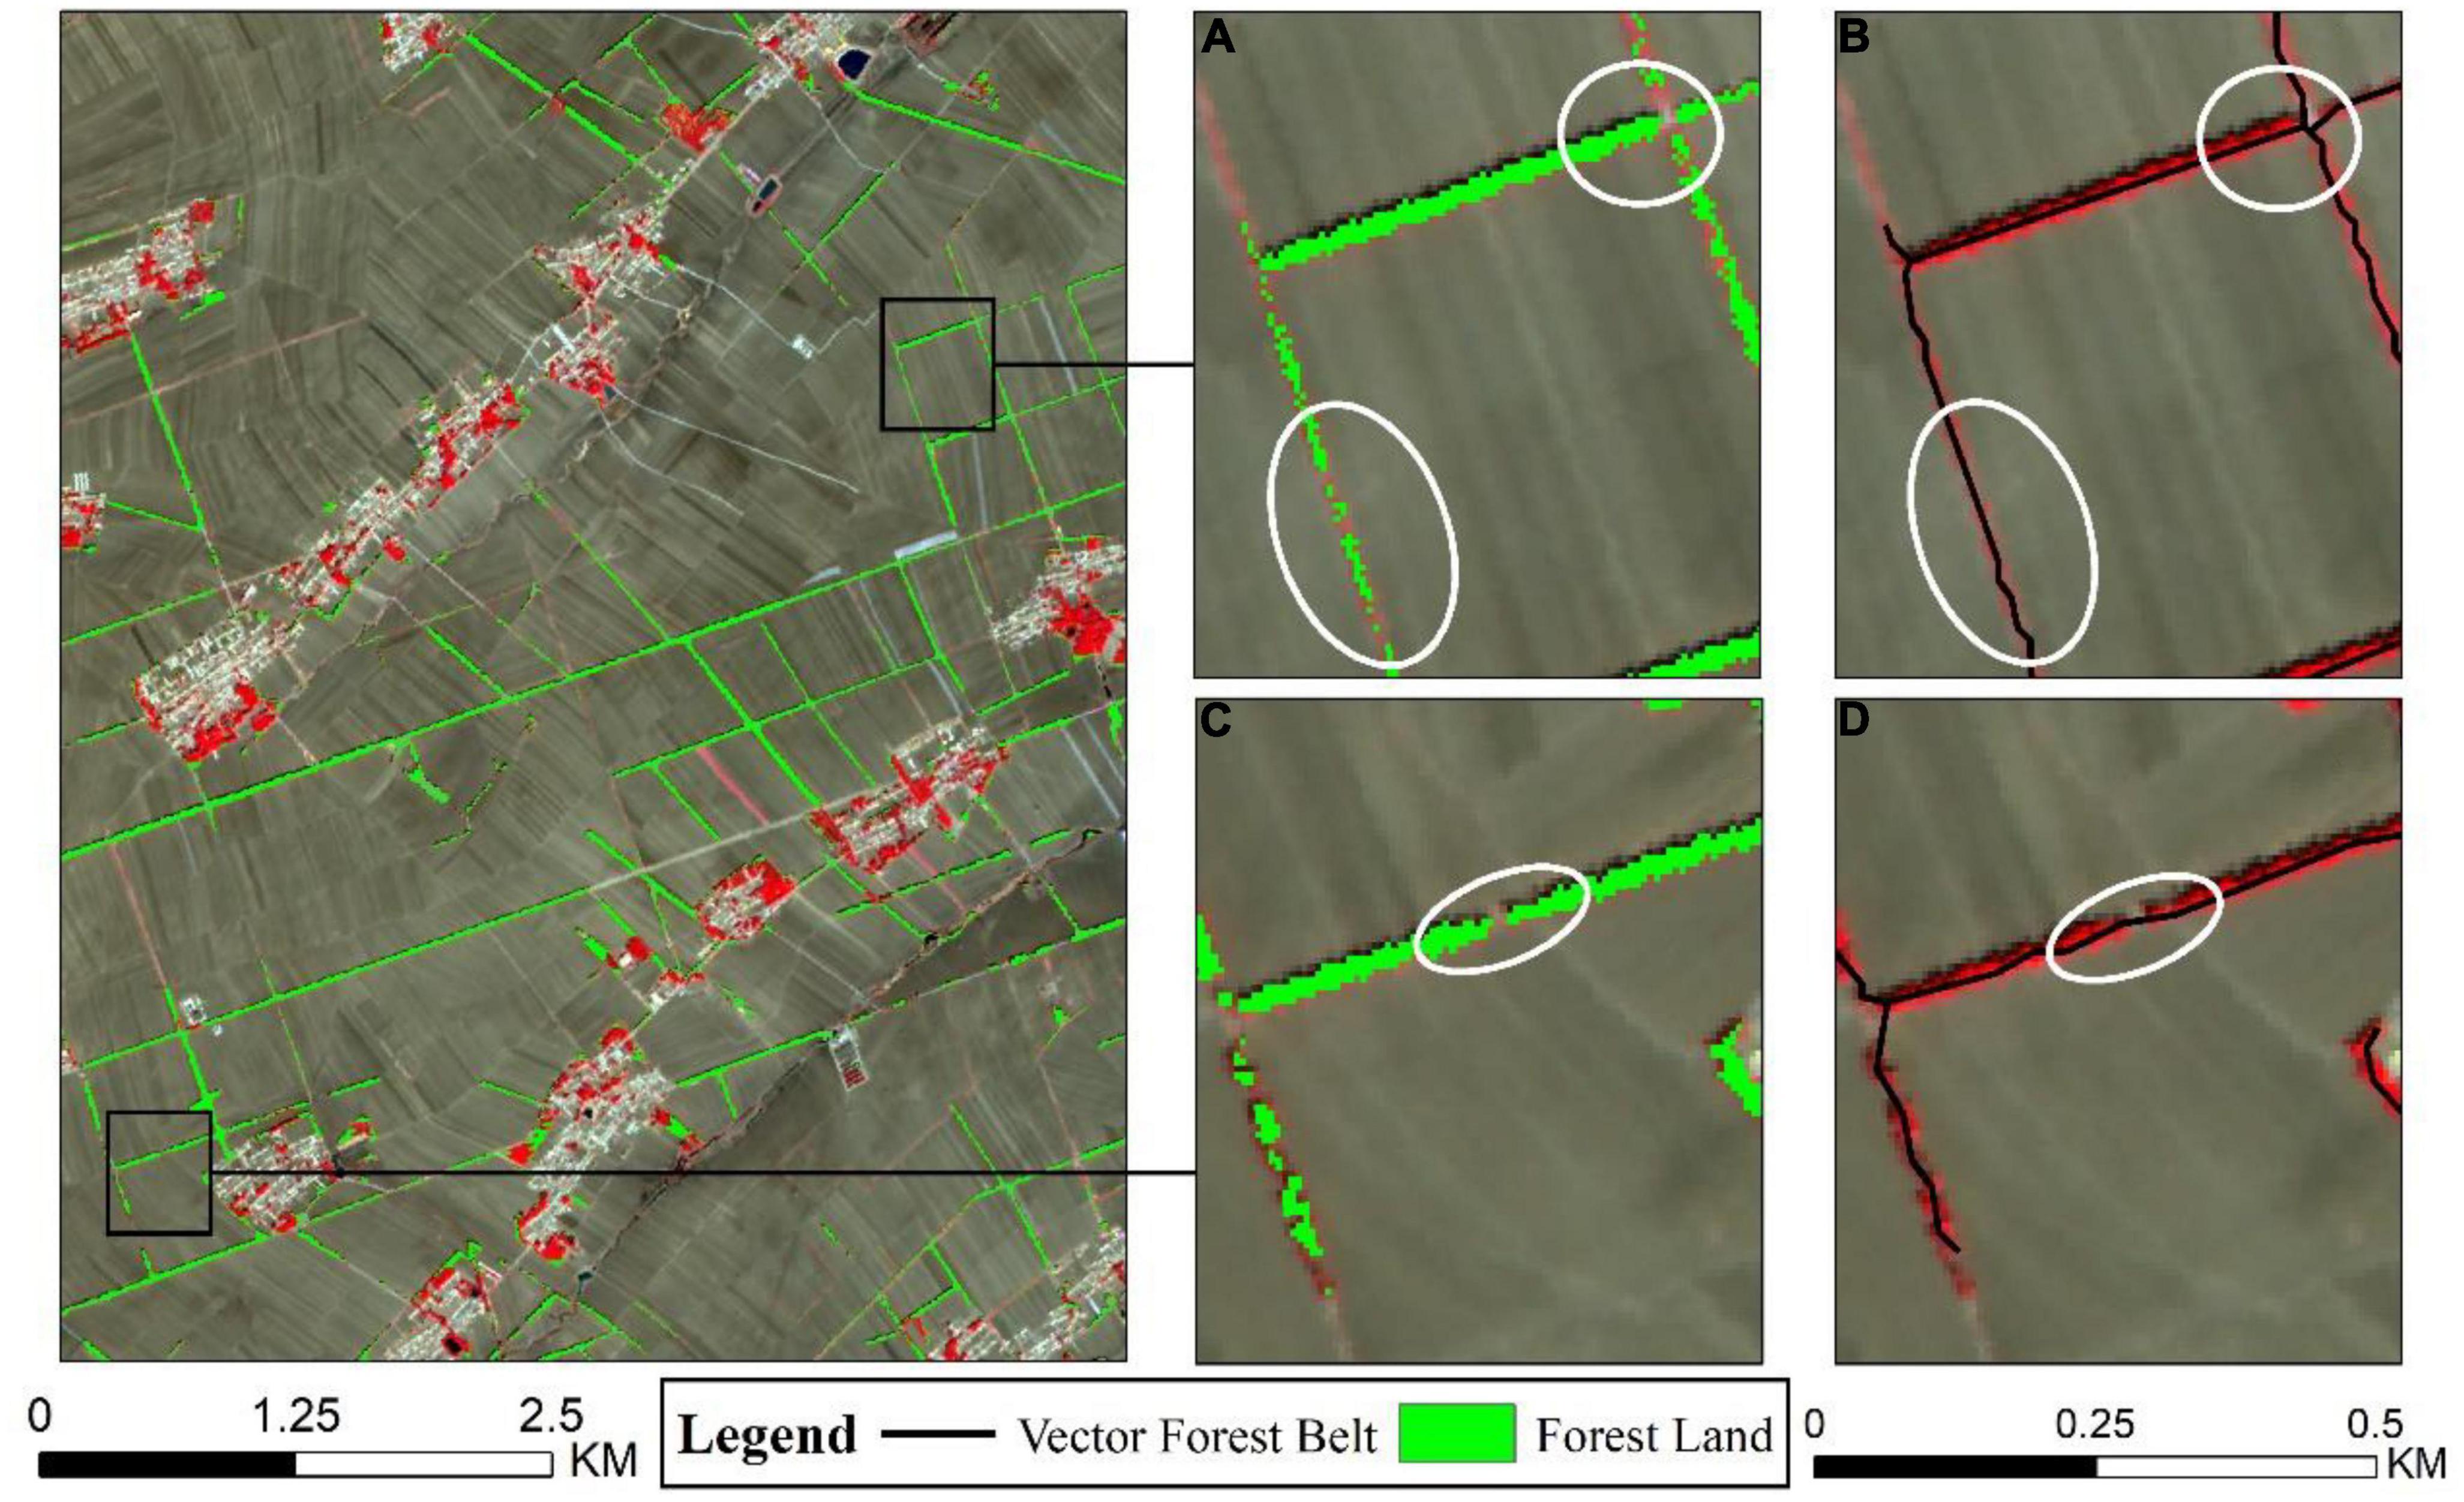
Figure 7. Results of farmland shelterbelt connection. (A,C) Discrete forest lands, (B,D) vector forest belts.
4.4. Accuracy evaluation results
Distribution maps of farmland shelterbelts in nine validation areas were generated by combining visual interpretation of historical imagery with survey data. The farmland shelterbelt extraction results were accurately evaluated regarding quantity and spatial distribution. Three representative regions were selected for presentation, as shown in Figure 8.
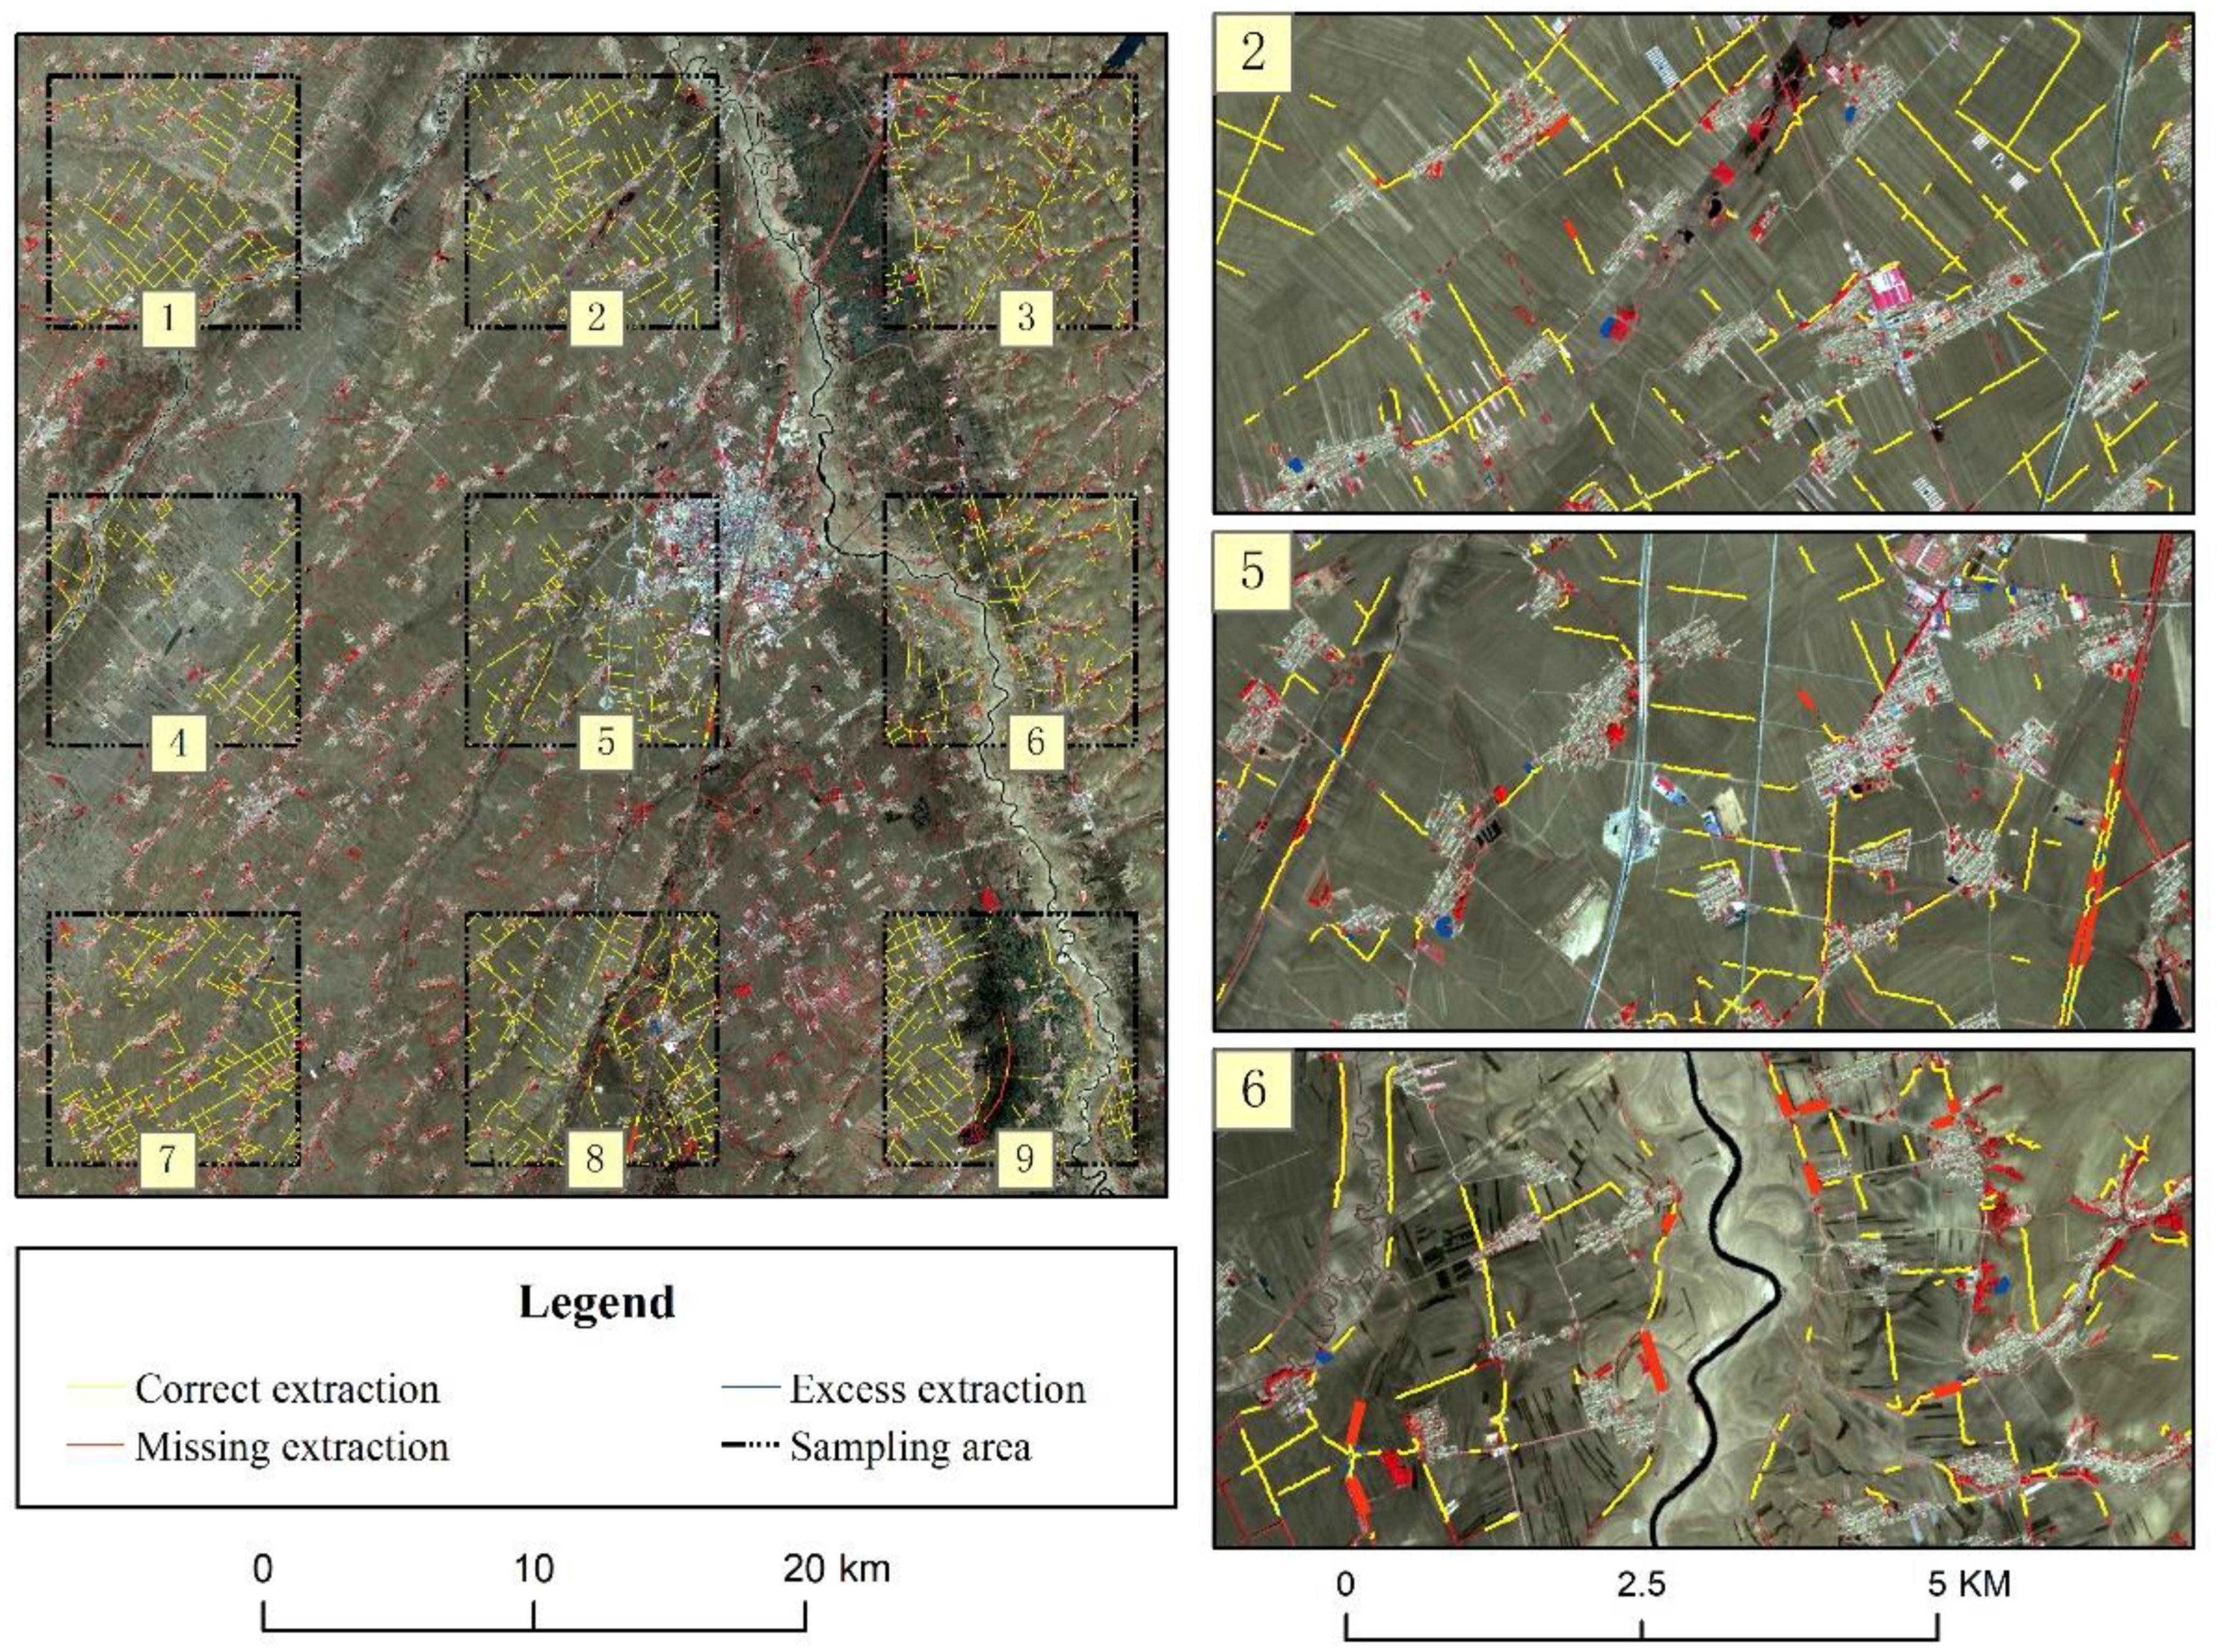
Figure 8. Farmland shelterbelt extraction results and validation.
The shelterbelt information extracted by the proposed method was compared with the actual observed data to determine the lengths of correctly extracted shelterbelts, redundant extractions, and missed extractions. Statistical analysis shows that the total length of correctly extracted shelterbelts (Tr) was 689,200.7 km, the total length of redundant extractions (L) was 37,195.5 km, and the total length of missed extractions (Tf) was 10,320.22 km. Based on these values, the precision (P) was calculated to be 94.88%, the F-value (F) was 5.12%, and the recall (R) was 1.48%. The accuracy evaluation was conducted in uniformly distributed sample areas across the entire region, covering various terrains. The evaluation parameters for each area are listed in Table 2. Shelterbelt extraction accuracy results for all nine validation areas were greater than 85%. In areas with regular shelterbelt planting, the accuracy was greater than 98%. Overall, the extraction of farmland shelterbelt information shows promising results.
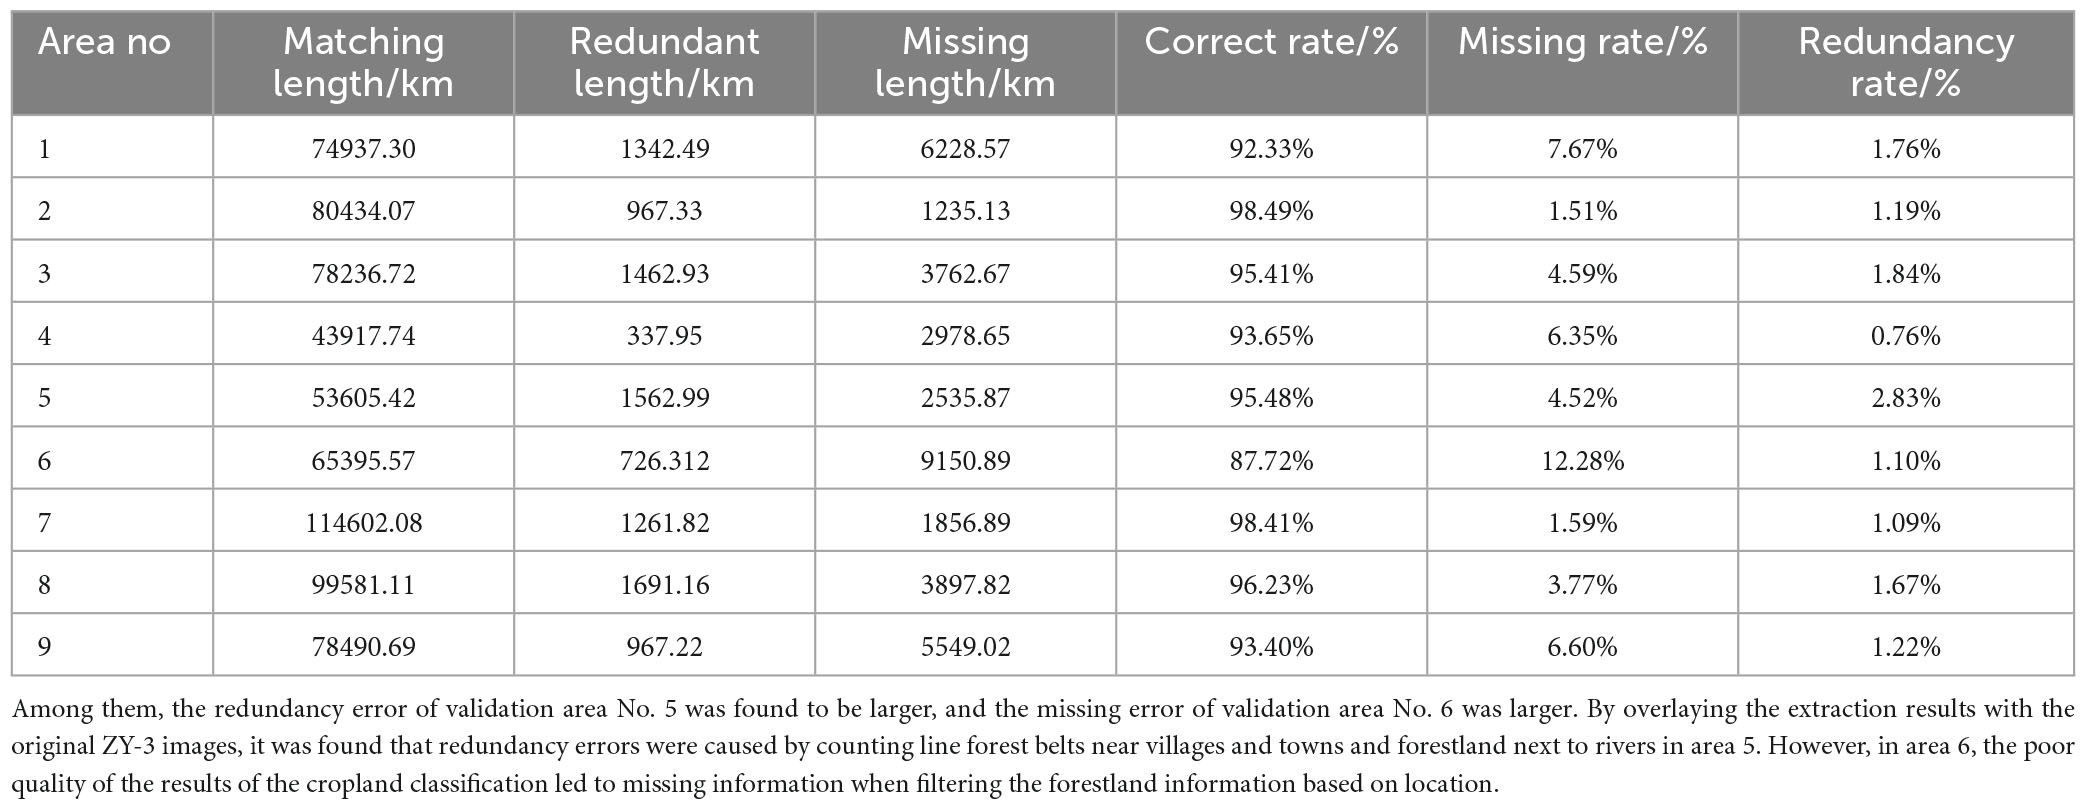
Table 2. Precision statistics.
5. Discussion
5.1. Comparison of related studies
When extracting land cover information at the pixel level by using computer classification, only the spectral and texture features of the land cover were considered. The preliminary extraction results still contained other land cover information. Therefore, filtering was required to obtain only farmland shelterbelt information. In this study, during the forestland information filtering process, the farmland shelterbelt information was filtered based on shelterbelt spatial location by overlaying the classified land cover information with the extraction results obtained for the entire region. Compared to previous studies (Hu, 2014; Lei et al., 2020), this study introduced auxiliary land cover data extracted from the same image, which was cost-effective and operationally simple. Moreover, in the process of further removal of information from mature forests, this study extracted forestland shape indices to make full use of the unique spatial geometric features of protected forest belts (Liknes et al., 2017). Furthermore, using building extraction results for information filtering along with shelterbelt information would have erroneously excluded farmland shelterbelts near roads. In contrast to the studies reported by Xing et al. (2016) and Lu et al. (2018), this study aimed to minimize information filtering errors by selecting cropland information as auxiliary data.
This study proposed a method for extracting farmland shelterbelt information based on the concept of shelterbelts to resolve the issue of fragmented and discontinuous results. The forest land extraction results belonging to the same shelterbelt were connected. The connection of shelterbelt fragments was achieved by using thinning and line connection algorithms, which resolved extraction result breakpoints and fragmented patches. Furthermore, the abstraction and quantification of farmland shelterbelt identification results were achieved, making their linear features more prominent. This approach ultimately obtained refined farmland shelterbelt identification results based on shelterbelts, facilitating further in-depth research.
In contrast to studies by Zhang et al. (2015) who used boundary detection operations based on the Canny operator to extract linear agricultural features, this study used shelterbelt centerlines to represent land cover patches. Furthermore, herein, by removing unnecessary pixels along the patch boundaries, information simplification was thus achieved to improve computational efficiency (Valero et al., 2010; Zhou et al., 2013; Zhang et al., 2015). Moreover, instead of fitting straight lines to each fragment individually, traditional line connection algorithms; specifically, the Bresenham algorithm, were used, based on data structure and spatial characteristics of the shelterbelts. The fragmented lines, representing the actual positions of each shelterbelt segment, accurately depicted the distribution of farmland shelterbelts without bias (Zhang, 2020; Ahlswede et al., 2021).
5.2. Limitations of this study
Indeed, this study offers some limitations as follows: (1) The constructed classification feature space can be continuously optimized. When constructing the classification feature space, the single reliance on the classification feature importance ranking selection has certain limitations. If there exists a linear correlation between the categorized features with high importance, it can lead to the classification results of the model being overly inclined to a certain class of features. In this study, the importance and correlation of categorized features were considered comprehensively, and the most important categorized features in each class of features were selected to construct the categorized feature space, and the categorization accuracy reached 94.87%. The classification feature space could be further optimized by combining factor analysis, searching for the uncorrelated list of variables and particle swarm optimization to optimize the selection of classification features (Menze et al., 2009; Deng et al., 2023). (2) The effectiveness of the land cover information filtering in this study depended on the land cover extraction accuracy. Preliminary land cover information filtering was based on the spatial relationship between agricultural land and forestland, aiming to remove forest information near rivers and urban areas by retaining the information that was obtained from areas adjacent to agricultural land. However, if multiple crops were planted within an agricultural area, there could be variations in the land cover classification features or uneven selection of training samples for agricultural land. In that case, it might have resulted in omission or misclassification of land cover, leading to significant extraction errors when using agricultural land information for filtering the forestland identification results. This was observed in validation zones 5 and 6 shown in Figure 8. (3) The vector representation of the extracted shelterbelt data also exhibited limitations. During the thinning process and conversion from raster to vector data, algorithm limitations might have introduced errors such as jaggedness and discontinuity in the extracted vector lines. Furthermore, when multiple continuous shelterbelts were well-planted and the preliminary extraction results appeared continuous, it was challenging to separate them, resulting in the misidentification of multiple shelterbelts as a single continuous shelterbelt.
5.3. Application value of this methodology
Despite these limitations and the possibility of some omissions or misidentifications in the extracted farmland shelterbelt information, the proposed method provided continuous vector shelterbelt lines. Moreover, the refined shelterbelt lines, resulting from pixel-by-pixel extraction, were located precisely at the shelterbelt centers with high positional accuracy. In subsequent operations, it was speculated that incorporation of a small amount of visual interpretation could significantly reduce redundancy errors and improve identification accuracy. Therefore, the method proposed in this study can serve as a foundation for shelterbelt structure identification in the context of farmland shelterbelts and provide data support for farmland shelterbelt management practices. Furthermore, it holds some reference value in studying linear features such as field roads, irrigation channels, and rivers (Liu et al., 2014; Gu et al., 2018; Supriyasilp et al., 2021).
6. Conclusion
This study used the Chinese-constructed ZY-3 multispectral imagery with a resolution of 5.8 m as the data source. The RF algorithm was employed for land cover classification. Through information filtering, feature refinement, and fractured line connection operations, continuous vector farmland shelterbelt information was extracted from the classified results, addressing the issue of fragmented and discontinuous results by extracting strip-shaped farmland shelterbelts based on remote sensing imagery. Accuracy evaluation was conducted in nine validation zones established throughout the study area, with a spatial coincidence of shelterbelt extraction exceeding 85% and an overall identification accuracy of 94.88%. This method resolved the issue of farmland shelterbelt fragmentation when relying solely on morphological connection, which can be susceptible to the influence of structural elements. It is characterized by simple operation and efficiency and provides a foundation for structural identification in farmland shelterbelts, opening up new possibilities for extracting linear features from remote sensing imagery. To resolve the limitations discussed above, improvements can be made by exploring alternative classification methods to enhance accuracy, in order to optimize the backbone extraction algorithm for shelterbelts to reduce errors caused by jaggedness and discontinuity, and incorporating land tenure information or human–computer interactions to achieve the segmentation of long shelterbelts. These measures would thereby optimize the accuracy of farmland shelterbelt information extraction.
Data availability statement
The original contributions presented in this study are included in the article/supplementary material, further inquiries can be directed to the corresponding author.
Author contributions
RD and QG: data curation, investigation, methodology, resources, supervision, and writing—review and editing. MJ, YW, QZ, and ZX: investigation, supervision, validation, and visualization. All authors contributed to the study conception and design, performed material preparation, data collection, and analysis, commented on previous versions of the manuscript, read, and approved the final version of the manuscript.
Funding
This research was supported by the National Natural Science Foundation of China (31971723) and the Foundation for Distinguished Young Talents in Higher Education of Henan (2020GGJS101).
Conflict of interest
The authors declare that the research was conducted in the absence of any commercial or financial relationships that could be construed as a potential conflict of interest.
Publisher’s note
All claims expressed in this article are solely those of the authors and do not necessarily represent those of their affiliated organizations, or those of the publisher, the editors and the reviewers. Any product that may be evaluated in this article, or claim that may be made by its manufacturer, is not guaranteed or endorsed by the publisher.
References
Ahlswede, S., Asam, S., and Röder, A. (2021). Hedgerow object detection in very high-resolution satellite images using convolutional neural networks. J. Appl. Remote Sens. 15:018501. doi: 10.1117/1.JRS.15.018501
Aksoy, S., Akcay, H. G., and Wassenaar, T. (2010). Automatic mapping of linear woody vegetation features in agricultural landscapes using very high resolution imagery. IEEE Trans. Geosci. Remote Sens. 48, 511–522. doi: 10.1109/TGRS.2009.2027702
Amichev, B. Y., Bentham, M. J., Cerkowniak, D., Kort, J., Kulshreshtha, S., Laroque, C. P., et al. (2015). Mapping and quantification of planted tree and shrub shelterbelts in Saskatchewan, Canada. Agrofor. Syst. 89, 49–65. doi: 10.1007/s10457-014-9741-2
Brandle, J. R., Hodges, L., and Zhou, X. H. (2004). Windbreaks in North American agricultural systems. Agrofor. Syst. 61, 65–78. doi: 10.1007/978-94-017-2424-1_5
Bresenham, J. E. (1965). Algorithm for computer control of a digital plotter. IBM Syst. J. 4, 25–30. doi: 10.1147/sj.41.0025
Burke, M., Rundquist, B., and Zheng, H. (2019). Detection of shelterbelt density change using historic Apfo and Naip Aerial imagery. Remote Sens. 11:218. doi: 10.3390/rs11030218
Campi, P., Palumbo, A. D., and Mastrorilli, M. (2009). Effects of tree windbreak on microclimate and wheat productivity in a Mediterranean environment. Eur. J. Agron. 30, 220–227. doi: 10.1016/j.eja.2008.10.004
Czerepowicz, L., Case, B. S., and Doscher, C. (2012). Using satellite image data to estimate aboveground shelterbelt carbon stocks across an agricultural landscape. Agric. Ecosyst. Environ. 156, 142–150. doi: 10.1016/j.agee.2012.05.014
Dai, G., and Chu, W. (2010). Analysis on the status of farmland shelterbelt resources in the three-north regions and corresponding strategies. For. Resour. Manag. 1, 27–32.
Del Río, S., López, V., Benítez, J. M., and Herrera, F. (2014). On the use of MapReduce for imbalanced big data using random forest. Inf. Sci. 285, 112–137. doi: 10.1016/j.ins.2014.03.043
Deng, R. X., Li, Y., Xu, X. L., Wang, W. J., and Wei, Y. C. (2017). Remote estimation of shelterbelt width from Spot5 imagery. Agrofor. Syst. 91, 161–172. doi: 10.1007/s10457-016-9915-1
Deng, Y. W., Jiang, W. G., Wang, X. Y., and Peng, K. F. (2023). Refined wetland classification of international wetland cities based on the random forest algorithm and knowledge-driven rules: A case study of Changde city, China. Nat. Remote Sens. Bull. 27, 1426–1440.
Dye, M., Mutanga, O., and Ismail, R. (2012). Combining spectral and textural remote sensing variables using random forests: Predicting the age of Pinus patula forests in KwaZulu-Natal, South Africa. J. Spatial Sci. 57, 193–211. doi: 10.1080/14498596.2012.733620
Fan, Q., Liao, J., Li, Y., Ye, W., Wang, T., Yu, L., et al. (2022). The formation of Yardangs Surrounding the Suoyang City Ruins in the Hexi Corridor of Northwestern China and its climatic–environmental significance. Remote Sens. 14:5628. doi: 10.3390/rs14215628
Gao, F., Jiang, Q. O., Xin, Z. M., Xiao, H. J., Lv, K. X., and Qiao, Z. (2022). Extraction method of Oasis Shelterbelt systems based on remote-sensing images——A case study of Dengkou county. Spectrosc. Spec. Anal. 42, 3896–3905.
Gonenc, A., Ozerdem, M. S., and Emrullah, A. C. A. R. (2019). “Comparison of Ndvi and Rvi vegetation indices using satellite images,” in Proceedings of the 2019 8th International Conference on Agro-Geoinformatics (Agro-Geoinformatics), Istanbu: IEEE, 1–4. doi: 10.1109/Agro-Geoinformatics.2019.8820225
Grabska, E., Hostert, P., Pflugmacher, D., and Ostapowicz, K. (2019). Forest stand species mapping using the sentinel-2 time series. Remote Sens. 11:1197. doi: 10.3390/rs11101197
Gu, Z. M., Jin, X. B., Yang, X. Y., Zhao, Q. L., Jiang, Y. C., Han, B., et al. (2018). Monitoring roads and canals utilization condition for land consolidation project based on Uav remote sensing image. Trans. Chin. Soc. Agric. Eng. 34, 85–93.
Hao, P., Zhan, Y., Wang, L., Niu, Z., and Shakir, M. (2015). Feature selection of time series modis data for early crop classification using random forest: A case study in Kansas, Usa. Remote Sen. 7, 5347–5369. doi: 10.3390/rs70505347
Haralick, R. M., Sternberg, S. R., and Zhuang, X. (1987). Image analysis using mathematical morphology. IEEE Trans. Pattern Anal. Mach. Intell. 9, 532–550. doi: 10.1109/TPAMI.1987.4767941
Hu, J. J. (2014). The farmland shelterbelts extraction based on Hj-1 andzy-3 satellite images. Beijing: Beijing Forestry University.
Kriese, J., Hoeser, T., Asam, S., Kacic, P., Da Ponte, E. D., and Gessner, U. (2022). Deep learning on synthetic data enables the automatic identification of deficient forested windbreaks in the Paraguayan Chaco. Remote Sens. 14:4327. doi: 10.3390/rs14174327
Lei, S. J., Sun, H., Liu, H., Jiang, F. G., Chen, S., Wu, T., et al. (2020). Study on extraction method of farmland shelterbelt supported by Landsat 8 time series image. J. Cent. S. Univer. For. Techno. 40, 57–63.
Li, B., Zhou, S., Wang, T., Sui, X., Jia, Z., Li, Y., et al. (2018). An improved gridded polycyclic aromatic hydrocarbon emission inventory for the lower reaches of the Yangtze River Delta region from 2001 to 2015 using satellite data. J. Hazard. Mater. 360, 329–339. doi: 10.1016/j.jhazmat.2018.08.011
Li, J. X., Li, J. Q., Li, S., Wang, W., and Chen, Y. (2017). The method for semi-automatic extraction of residential area from high resolution remote sensing images. Remote Sens. Nat. Resour. 29, 17–24.
Li, X. (1995). A new method to improve classification accuracy withshape information. Remote Sens. Environ. 10, 279–287.
Li, X., Tian, Y., Zheng, X., Cong, J., and Song, L. (2020). Characterizing 40 years of natural Pinus sylvestris var. mongolica carbon stocks in Northeast China using stand age from remote sensing time series. Int. J. Remote Sens. 41, 2391–2409. doi: 10.1080/01431161.2019.1688420
Liknes, G. C., Meneguzzo, D. M., and Kellerman, T. A. (2017). Shape indexes for semi-automated detection of windbreaks in thematic tree cover maps from the central United States. Int. J. Appl. Earth Observat. Geoinfor. 59, 167–174. doi: 10.1016/j.jag.2017.03.005
Liu, T., Bao, G. D., Zhang, D. W., He, H. J., Luo, Y., and Zhang, Z. H. (2018). Research on rapid extraction of shelter forest using Gf-2 images based on vegetation indices. For. Eng. 34, 13–19.
Liu, W., Wang, C. H., Zhao, E. P., and Du, H. J. (2014). Extraction of small river information based on object-oriented classification. Transa. Chin. Soc. Agric. Mach. 45, 237–244.
Liu, W. P., Yu, Z. R., Yun, W. J., Xiao, H., and Zhang, Q. (2012). Ecological and landscape design of farmland shelterbelt in land consolidation. Trans. Chin. Soc. Agric. Eng. 28, 233–240.
Liu, Y., Li, H., Wu, M., Wang, A., Wu, J., and Guan, D. (2022). Estimating the legacy effect of post-cutting shelterbelt on crop yield using Google Earth and Sentinel-2 data. Remote Sens. 14:5005. doi: 10.3390/rs14195005
Lu, Y. H., Zhang, C., Yun, W. J., Li, P. S., Sang, L. L., and Chen, Y. Y. (2018). Automatic recognition of farmland shelterbelts in high spatial resolution remote sensing data. Trans. Chin. Soc. Agric. Mach. 49, 157–163.
Menze, B. H., Kelm, B. M., Masuch, R., Himmelreich, U., Bachert, P., Petrich, W., et al. (2009). A comparison of random forest and its Gini importance with standard chemometric methods for the feature selection and classification of spectral data. BMC Bioinform. 10:213. doi: 10.1186/1471-2105-10-213
Pippuri, I., Suvanto, A., Maltamo, M., Korhonen, K. T., Pitkänen, J., and Packalen, P. (2016). Classification of forest land attributes using multi-source remotely sensed data. Int. J. Appl. Earth Observat. Geoinform. 44, 11–22. doi: 10.1016/j.jag.2015.07.002
Quackenbush, L. J. (2004). A review of techniques for extracting linear features from imagery. Photogramm. Eng. Remote Sens. 12, 1383–1392. doi: 10.14358/PERS.70.12.1383
Serra, J. (1986). Introduction to mathematical morphology. Comput. Vis. Graph. Image Process. 35, 283–305. doi: 10.1016/0734-189X(86)90002-2
Shao, Y., Guo, B., Hu, X., and Di, L. (2011). Application of a fast linear feature detector to road extraction from remotely sensed imagery. IEEE J. Select. Top. Appl. Earth Observat. Remote Sens. 4, 626–631. doi: 10.1109/JSTARS.2010.2094181
Shi, T. T., Xu, H. T., and Wang, S. (2019). Derivation of tasselled cap transformation coefficients for Zy-3 Mux sensor data. J. Remote Sens. 23, 514–525. doi: 10.11834/jrs.20197496
Shi, X. L., Li, Y., and Deng, R. X. (2012). Object-oriented information extraction of farmland shelterbelts from remote sensing image. Key Eng. Mater. 1485, 500–505. doi: 10.4028/www.scientific.net/KEM.500.500
Supriyasilp, T., Pongput, K., Boonyanupong, S., and Suwanlertcharoen, T. (2021). enhanced water management for muang fai irrigation systems through remote sensing and Swot analysis. Water Resour. Manag. 35, 263–277. doi: 10.1007/s11269-020-02724-z
Valero, S., Chanussot, J., Benediktsson, J. A., Talbot, H., and Waske, B. (2010). Advanced directional mathematical morphology for the detection of the road network in very high resolution remote sensing images. Pattern Recogn. Lett. 31, 1120–1127. doi: 10.1016/j.patrec.2009.12.018
Wiseman, G., Kort, J., and Walker, D. (2009). Quantification of shelterbelt characteristics using high-resolution imagery. Agric. Ecosyst. Environ. 131, 111–117. doi: 10.1016/j.agee.2008.10.018
Xi, J., Shao, Y., Li, Z., Zhao, P., Ye, Y., Li, W., et al. (2021). Distribution of woody plant species among different disturbance regimes of forests in a temperate deciduous broad-leaved forest. Front. Plant Sci. 12:618524. doi: 10.3389/fpls.2021.618524
Xiao, Q., and Huang, M. (2016). Fine root distributions of shelterbelt trees and their water sources in an oasis of arid northwestern China. J. Arid Environ. 130, 30–39. doi: 10.1016/j.jaridenv.2016.03.004
Xing, Z. F., Li, Y., Deng, R. X., Zhu, H. L., and Fu, B. L. (2016). Extracting farmland shelterbelt automatically based on Zy-3 remote sensing images. Sci. Silvae Sin. 52, 11–20.
Yan, Z. X., and Meng, L. N. (2017). Automatic extraction method of road sideline based on linear feature. Eng. Survey. Mapp. 26, 42–45.
Yang, D., Liu, W., Wang, J., Liu, B., Fang, Y., Li, H., et al. (2018). Wind erosion forces and wind direction distribution for assessing the efficiency of shelterbelts in northern China. Aeolian Res. 33, 44–52. doi: 10.1016/j.aeolia.2018.05.001
Yang, X., Yu, Y., and Fan, W. (2017). A method to estimate the structural parameters of windbreaks using remote sensing. Agrofor. Syst. 91, 37–49. doi: 10.1007/s10457-016-9904-4
Yu, K., Li, D., and Li, N. (2006). The evolution of Greenways in China. Landsc. Urban Plann. 76, 223–239. doi: 10.1016/j.landurbplan.2004.09.034
Yu, T., Liu, P., Zhang, Q., Ren, Y., and Yao, J. (2021). Detecting forest degradation in the three-north forest shelterbelt in China from Multi-Scale Satellite Images. Remote Sens. 13:1131. doi: 10.3390/rs13061131
Zhang, C., Wang, Z. H., Yang, J. C., and Zhu, D. H. (2015). Farmland linear project feature auto-extraction method based on canny algorithm. Trans. Chin. Soc. Agric. Mach. 46, 270–275.
Zhang, J. M. (2020). Research on intelligent extraction algorithm of linear terrain of remote sensing image. Geomat. Spat. Inform. Technol. 43, 169–171.
Zhang, X., Du, J., Huang, T., Zhang, L., Gao, H., Zhao, Y., et al. (2017). Atmospheric removal of Pm2.5 by man-made Three Northern Regions Shelter Forest in Northern China estimated using satellite retrieved Pm2.5 concentration. Sci. Total Environ. 593-594, 713–721. doi: 10.1016/j.scitotenv.2017.03.206
Zheng, X., Zhu, J., and Xing, Z. (2016). Assessment of the effects of shelterbelts on crop yields at the regional scale in Northeast China. Agric. Syst. 143, 49–60. doi: 10.1016/j.agsy.2015.12.008
Zhou, J. X., Zhou, A. F., Tao, C., Gao, C. Q., and Li, J. (2013). A methodology for urban roads network extraction from high resolution remote sensing imagery. J. Cen. S. Univer. 44, 2385–2391.
Zhu, J. J., and Zheng, X. (2019). The prospects of development of the Three-North Afforestation Program (Tnap): On the basis of the results of the 40-year construction general assessment of the Tnap Chin. Chin. J. Ecol. 38, 1600–1610.
Keywords: farmland shelterbelts, remote sensing, morphology, line linking, information extraction
Citation: Deng R, Guo Q, Jia M, Wu Y, Zhou Q and Xu Z (2023) Extraction of farmland shelterbelts from remote sensing imagery based on a belt-oriented method. Front. For. Glob. Change 6:1247032. doi: 10.3389/ffgc.2023.1247032
Received: 25 June 2023; Accepted: 21 August 2023;
Published: 01 September 2023.
Edited by:
Yan Li, Nanjing Forestry University, ChinaReviewed by:
Tianxiang Cui, Nanjing Forestry University, ChinaYangyang Liu, Northwest A&F University, China
Copyright © 2023 Deng, Guo, Jia, Wu, Zhou and Xu. This is an open-access article distributed under the terms of the Creative Commons Attribution License (CC BY). The use, distribution or reproduction in other forums is permitted, provided the original author(s) and the copyright owner(s) are credited and that the original publication in this journal is cited, in accordance with accepted academic practice. No use, distribution or reproduction is permitted which does not comply with these terms.
*Correspondence: Qunzuo Guo, YmxhY2tfYnJ1aW5AZm94bWFpbC5jb20=