 Xianghua Zhang
 Jonah Busch
 Yingli Huang
 Luuk Fleskens
 Huiyan Qin1
94% of researchers rate our articles as excellent or good
Learn more about the work of our research integrity team to safeguard the quality of each article we publish.
Find out more
ORIGINAL RESEARCH article
Front. For. Glob. Change, 05 December 2023
Sec. Forest Management
Volume 6 - 2023 | https://doi.org/10.3389/ffgc.2023.1229216
This article is part of the Research TopicSustainable forest management under climate change conditions- A focus on biodiversity conservation and forest restorationView all 7 articles
Reforestation is a potentially large-scale approach for removing CO2 from the atmosphere, thereby helping China achieve its goal of carbon neutrality by 2060. Although China has set ambitious national targets, the cost of mitigating climate change through reforestation has yet to be identified across space and time over the next 40 years. We construct spatially disaggregated marginal abatement cost curves for reforestation by modeling the effects of compensation for enhanced CO2 removals on reforestation. We project that carbon prices (compensation) of US$20 tCO2−1 and US$50 tCO2−1 would motivate land users in China to enhance reforestation by 3.35 Mha (2.65%) and 8.53 Mha (6.74%) respectively from 2020 to 2060 relative to the business-as-usual (BAU) scenario (127 Mha). Carbon dioxide removals through reforestation between 2020 and 2060 in China would be enhanced by 0.0124 GtCO2/yr (1.7%) at US$20 tCO2−1 or 0.0315 GtCO2/yr (4.3%) at US$50 tCO2−1, relative to the BAU scenario (0.740 GtCO2/yr). The cost potential of carbon dioxide removal demonstrates significant spatial heterogeneity. The top 10 provinces (Yunnan, Sichuan, Guangxi, Guizhou, Hunan, Guangdong, Heilongjiang, Jiangxi, Fujian, and Zhejiang), which comprise 73.19% of low-cost abatement potential, should be identified as priority areas for reforestation. Our results confirm the vast potential for low-cost CO2 removal through reforestation to address China’s carbon neutrality challenges while underscoring that targeting reforestation to regions with the greatest potential for low-cost CO2 removal would significantly reduce the cost burden.

Graphical Abstract.
- Reforestation is responsive to price incentives, in contrast to stereotypes about state-owned land.
- Marginal abatement cost reveals great potential for CO2 removal through China’s reforestation.
- Targeting reforestation policies to regions with the greatest potential for low-cost CO2 removal.
Reforestation is a potentially large-scale approach for removing CO2 from the atmosphere, with great potential for mitigating climate change (Hawes, 2018; Mitchard, 2018), thereby helping China achieve its goal of carbon neutrality by 2060. China has been a leader to date in reforesting large areas (Chen et al., 2019; Li et al., 2020; Piao et al., 2020). Over the past 30 years, China has undertaken a series of large-scale reforestation projects, investing hundreds of billions of dollars (Zhang et al., 2000; Wang et al., 2020; Winkler et al., 2021; Xi et al., 2022). These programs include the Natural Forest Conservation Program (NFCP), the Sloping Land Conversion Program (SLCP), Three-North Shelter Forest Program (TSFP), National Key Ecological Function Area Program (NKEFA), Chinese Certified Emission Reduction (CCER), etc. As a result, more than 69.3 million hectares of forest were planted in China from 1999 to 2013. Due in part to large-scale reforestation, China’s forests sequestered 1.11 ± 0.38 GtC yr−1 during 2010 to 2016, approximately 45 percent of annual greenhouse gas emissions over that period in China (Wang et al., 2020). China’s vast land area and conducive climatic conditions offer great potential opportunities for further reforestation (Xi et al., 2022).
The cost of removing CO2 through reforestation is a key part of the success of these programs, whether through government leadership or incentives for private individuals. For government-led large-scale reforestation programs, the cost of CO2 removal from reforestation tells policymakers where the most carbon removal can be achieved at the lowest cost, which will help policymakers to identify reforestation priority areas and improve the effectiveness of reforestation projects (Strassburg et al., 2020). For a carbon price mechanism, knowing the price salience can help anticipate how high a carbon price is needed to achieve a certain level of mitigation (Griscom et al., 1794).
Marginal abatement cost (MAC) curves illustrate how much CO2 could be removed through reforestation at various costs-per-tonne at particular places and times (Kesicki and Strachan, 2011). They can help policymakers prioritize the most cost-effective actions across sectors and regions for achieving carbon neutrality in the middle of the 21st century. However, there is a lack of MAC curves for large-scale government-led reforestation projects in China.
Previous global studies have developed analytical framework to determine the costs of carbon sequestration in reforestation programs (Stavins, 1999; Sohngen and Mendelsohn, 2003; Sathaye et al., 2006; Tavoni et al., 2007; Austin et al., 2020; Favero et al., 2020). One study (Busch et al., 2019) estimated cost and price salience for the tropics, producing a tropics-wide MAC curve for reforestation. However, this study did not produce a MAC curve for China. This is an important gap, given China’s large potential for mitigating climate change through reforestation.
There are several reasons why the tropics-wide MAC curve may not apply to China. First, the ecology and climate (such as precipitation and temperature) of China, which varies markedly across regions, is different from that of the tropics. Second, all land is owned by the state in China, with land management rights possessed by enterprises, farmers, foresters and forest farms (Yan, 2019; Tong et al., 2020; Feng et al., 2021). This is different from the economic system of most other countries (Chow, 1997; Piao et al., 2020). Some studies speculated that reforestation projects on public land, for example in China and India, might not be as responsive to price signals (Busch et al., 2019). Many researchers argue that government-led reforestation policies do not usually respond to cost/price signals, which constrains the replication of cost/price studies in China (Wang et al., 2018; Wu et al., 2018; Feng et al., 2021; Yang et al., 2021). However, China has been reforming the governance of forests from government control to private control for decades (e.g., northern forests are managed by enterprises, and southern forests are contracted to individuals), and has introduced market mechanisms (Wang et al., 2004; Huang, 2019; Hyde, 2019). However, this reform has not been completed and is still ongoing. Thus, reforestation in China remains a half-market and half-government-led process, which is different from the tropics. So, we are motivated to undertake the current study to fill these gaps.
To estimate the cost potential for CO2 removal and priority areas through reforestation in China, here we construct spatially disaggregated MAC curves for reforestation. We take advantage of geographic and satellite data. We estimate the effect of agricultural price on land-cover and use this to simulate the effects of carbon price on land-cover. Our estimates of the economic potential depend on the assumption that land users would respond to carbon prices just as they have responded to historical agricultural prices. These estimates assume that external environments such as socio-economic development remain relatively stable, with no sudden fluctuations such as socio-economic crises. We geographically disaggregate CO2 removal cost of reforestation, identifying regions and provinces with the greatest low-cost potential.
We estimated MAC curves for CO2 removal through China reforestation by applying the top-down approach (Busch et al., 2019). Government-led large-scale reforestation projects, commercial timber plantations, and the Sloping Land Conversion Program have been driving widespread forest cover enhancement. In addition to reforestation in commercial timber plantations and the Sloping Land Conversion Program being driven by economic forces, limited government investment forced managers of Government-led projects to incorporate cost considerations. Therefore, referring to Busch’s study (Busch et al., 2019), the approach assumes that carbon sequestration by reforestation is partly a response of human behavior to economic forces. We constructed a model to estimate the aggregate response of decision-makers of reforestation to a variable carbon price. We modified the forest cover change model based on Chinese realities to capture the reforestation response to agricultural revenue. Moreover, other socio-ecological determinants were controlled for in this model.
The main dependent variable in the forest cover change model, reforestation, was derived from forest cover data from 2000 to 2010, the most recent year (2010) for which this data was available. Moreover, we classified land with more than 30% tree-cover threshold as forest (Busch and Engelmann, 2017; Busch et al., 2019). All conversion from non-forest to forest was defined as ‘reforestation,’ while the opposite land-use transition was defined as ‘deforestation.’ ‘Afforestation’ can imply the intentional conversion of native non-forest ecosystems to exotic tree cover and violate biodiversity safeguards (Veldman et al., 2015). Therefore, we choose to refrain from using this term. The primary independent variable in the forest cover change model, potential agricultural revenue, was derived from potential yields of 21 crops and farmgate prices for major countries. The potential agricultural revenue was constructed as the maximum value by multiplying the weighted average national farmgate prices of the top five producing countries of each crop and the potential yields of the 21 crops, for the priod of 2000–2010 (Naidoo and Iwamura, 2007; Busch and Engelmann, 2017; Busch et al., 2019).
We assumed agricultural revenues are discounted at 10% annually, which is widely adopted in decision-making in developing countries (Busch and Engelmann, 2017; Busch et al., 2019). Our forest cover change model incorporates control variables [biome type (Dinerstein et al., 2017), elevation (Chinese Academy of Sciences, 2020), slope (Chinese Academy of Sciences, 2020), protected areas (IUCN and UNEP-WCMC, 2020), and distance from the nearest city (Xu, 2023)], that have been widely proven to affect forest cover (Busch and Ferretti-Gallon, 2017; Dinerstein et al., 2017). Based on previous studies (Busch et al., 2019), we included a fourth-order polynomial of forest cover as a control variable. After we excluded variables with multicollinearity problems, the remaining variables were adopted as control variables (Supplementary Table 3). Considering that we were first and foremost trying to estimate the parameter of the effect of changes in prices on changes in land cover, we used a regression rather than a machine method.
We aggregated all data into 0.05° [approximately 5.5 × 5.5 km2] grid cells following Naidoo et al. (Busch and Engelmann, 2017). We limited the scope to China, which contained 388,832 grid cells. Grid cells with zero forest cover in both 2000 and 2010 were excluded, under the assumption that natural conditions for reforestation were not present on these lands. In addition, due to the lack of data from Taiwan, Hong Kong and Macao, the corresponding grid cells were not considered. After exclusion, the dataset contained 179,484 grid cells in 31 provincial administrative regions. The regression model was:
in which Ri is the fraction of non-forest to forest transition in cell i from 2000 to 2010. Independent variables contain the net present value (NPV) of future agricultural revenue (ARi); a vector (Xi) of elevation, slope, protected areas, and distance from the nearest prefecture-level city; and a fourth-order polynomial of forest cover (Fi). Given the differences in social and ecological climate between Eastern Economic Belt (EEB), Central Economic Belt (CEB), and Western Economic Belt (WEB), regions (ηi) were analyzed using fixed effects. The λi stands for biome type. The superscript r stands for reforestation. α are the regression coefficients, εi is the error term.
in which Di is the fraction of forest to non-forest transition in cell i from 2000 to 2010. The superscript d stands for deforestation. We used a recursive model in order to predict reforestation under a business-as-usual scenario (BAU) for 2020–2060, through the recursive change of forest cover (Fi,t) per decade (t: a time step of 10 years). For each t in 2010–2060, we estimated reforestation and deforestation based on equations (1) and (2); that is:
Most attributes (biome type, elevation, slope, protected areas, distance from the nearest city, continent, agricultural revenue) in the grid remain stable in the model. Moreover, we assumed that future agricultural revenue would remain stable, as suggested by OECD (2013). We assumed that other unmodelled socio-ecological factors will remain unchanged as well. Unlike other grid attributes, we dynamically updated the forest cover. In other words, we estimated forest cover by adding reforestation and subtracting deforestation to forest cover at the beginning of the period. Moreover, we constrained the forest cover to be no more than 1 and less than 0.
In order to construct CO2 removal trajectories, we revised a time-dependent CO2 removal model, based on 2,556 samples of secondary forest biomass (stands’ location, age, and secondary type) in China (Anderson-Teixeira et al., 2021). We established above-ground carbon stocks as a function of the stand age (SAx) as suggested in Busch et al. (2019), using the formula:
The variable, FTx, is a binary variable for forest type (plantation or natural regrowth). The BTx is also a binary variable for three forest biome types (tropical and subtropical humid forests, temperate continental forests, temperate grasslands). The superscript c stands for carbon. Moreover, we extrapolated our model across China, that is: how much above-ground carbon (tC ha−1) would be stored in cell, i, as forest type n, after y years:
We assumed that future carbon accumulation rates would be consistent with historical rates. We estimated belowground biomass carbon ( ) based on the root-stem ratio of 0.26 to aboveground biomass (Mokany et al., 2006). Since large-scale plantation projects such as the Sloping Land Conversion Program (SLCP), Three-North Shelter Forest Program (TSFP), National Key Ecological Function Area Program (NKEFA), and Chinese Certified Emission Reduction (CCER) are aimed at ecological restoration (Zhang et al., 2000; Wang et al., 2020; Winkler et al., 2021), we assumed that there was no operational deforestation of plantation forests. Moreover, Since the Chinese government has formulated the Natural Forest Conservation Program (NFCP) (Xi et al., 2022), we assumed that natural reforestation will not be felled.
After the transition to natural forests, the average annual carbon increment ( ) was equivalent to 0.447% of the pre-transition soil carbon (Nachtergaele et al., 2023) as suggested in Busch et al. (2019). After the transition to plantation, the average annual carbon increment ( ) was equivalent to 0.919% of pre-transition soil carbon (Nachtergaele et al., 2023) as suggested in Busch et al. (2019).
The total forest carbon stock of cell i as forest type n in decade t ( ) is the average carbon stock in that 10-year period, containing aboveground biomass carbon, belowground biomass carbon, and soil carbon:
The carbon stock accumulation of cell i as forest type n (plantation or natural regrowth) in decade t = 1, 2, 3…… is equal to , , , and so on. We next estimated the CO2 removals factor of plantations (CRFit, plantation) and natural regrowth (CRFit, natural) in cell i as forest type n (plantation and natural regrowth) in decade t, by multiplying the carbon stock accumulation by 3.67 (the atomic mass conversion ratio of carbon to CO2). To reflect the effect of the share of natural regrowth and plantation, our estimated CRFit,m varied by province (National Science and Technology Infrastructure of China, 2023).
in which CRFitm is the CO2 removals factor per hectare in cell i, in decade t, in province m. αm is the share of natural regrowth in the secondary forest in province m.
Under a business-as-usual scenario (BAU), we multiplied the CO2 removal factor (CRFitm) by area of reforestation in 2010–2020 in order to estimate the removal of reforestation in the first decade of grid i (RDi1). Moreover, we multiplied area of reforestation in previous decades by the CO2 removal factor (CRFitm) in decade t to calculate removals associated with subsequent decades following reforestation at grid i (RDit).
To estimate the marginal abatement cost curves, we adjusted the BAU pace of reforestation by imposing a carbon price incentive (ITi) to equation (3). A carbon price increased the return on land from standing forests compared to agriculture, thereby increasing expected reforestation. Moreover, we assumed that the manager of the land would respond equally to carbon revenue and agricultural revenue [notably, carbon revenue is the opportunity cost of agricultural land usage, and thusly is subtracted from agricultural revenue in the regression model of reforestation equation (1)]; that is:
We assumed that land managers would be paid annually under any carbon compensation mechanism, not up front for reforestation in future decades. The incentive effect of a carbon price (ITi) is equal to the net present value of the product of the carbon removal from reforestation and the carbon price (P).
in which the CRFi,y stands for CO2 removal factor at year y of grid i. We adopted the discount rate ( ) of 10% for investment decisions of development banks. We assumed that the payment term of the carbon compensation mechanism is 30 years (Busch and Engelmann, 2017; Busch et al., 2019). We assumed there is no carbon leakage. We carved out the marginal abatement cost curve by estimating the increased CO2 removal associated with carbon prices. We estimated increasing removals from reforestation (IRR) by price specific removals (RDit,p) minus removals (RDit,BAU) under a business-as-usual scenario:
Notably, a relative comparison between our estimates and those in reference (Busch et al., 2019) was used for calibration, according to the methodology of Lu et al. (2022). Because both China (this study) and tropical studies (Busch et al., 2019) cover Hainan Province, carbon removal data from 1,261 grids in Hainan Province were selected. Based on 1,261 gridded data, we implemented a relative comparison of our estimates to the reference (Busch et al., 2019) for calibrating our estimates.
Finally, we further validated our estimates on both spatial and temporal scales. The Kling-Gupta efficiency (KGE), widely used for model validation, was estimated by following equation:
in which u stands for correlation coefficient between reference estimate and simulations. Moreover, this equation contains the standard deviation of reference estimate (yre), the standard deviation of simulations (ysim), the simulation mean (Zsim), and the mean of reference estimate (Zre). (1) Cross-spatial (carbon removal through reforestation across a spatial extent of 179,484 grids) validation of carbon removals. Given the lack of forest cover data for 2020, we calculated carbon removal through reforestation based on land use data (Potapov et al., 2022) in 2010–2020. Based on carbon removal through reforestation (179,484 grids of spatial extent) estimated by land-use data (2010–2020) (Potapov et al., 2022), the Kling-Gupta efficiency was calculated to validate our projections (carbon removal through reforestation projected for 2010–2020 based on tree cover data) using equation (13). (2) Cross-temporal (2035, 2055) validation of carbon removals. The cross-temporal (2035, 2055) validation was designed to assess the reliability of the time series for our projected carbon removals. The Kling-Gupta efficiency was used for validation of cross-temporal carbon removal using equation (13) in 2035 and 2055 separately, based on the overall data for China in the global estimates in reference (Austin et al., 2020).
Determinants of reforestation from 2000 to 2010 were mostly consistent with expectations (Table 1 and Supplementary Table 1), but there were still some non-negligible differences compared to the tropics. Reforestation increased on land that was flatter, at lower elevation, and with lower agricultural revenue which correspond broadly to the results of determinants of reforestation in the tropics (Busch et al., 2019). The highest amount of reforestation was achieved on land with medium forest cover. Reforestation was significantly greater near cities, which was also the case in Latin America (Supplementary Table 1). Specifically, reforestation was significantly greater near cites in the Western Economic Belt (Supplementary Table 1). However, the reforestation was not significantly greater near the cities in the Central Economic Belt and the Eastern Economic Belt (Supplementary Table 1), which were consistent with the findings of determinants of reforestation in the tropics (Table 1). Reforestation was significantly greater at lower elevation in the Western Economic Belt, which was not confirmed in the Central Economic Belt and Eastern Economic Belt. Moreover, unlike in the tropics, reforestation was not greater within multiple protected area and strictly protected area. This may be due to the fact that large-scale reforestation programs were not on protected land as there was no need or a lack of space for extensive reforestation within protected areas.
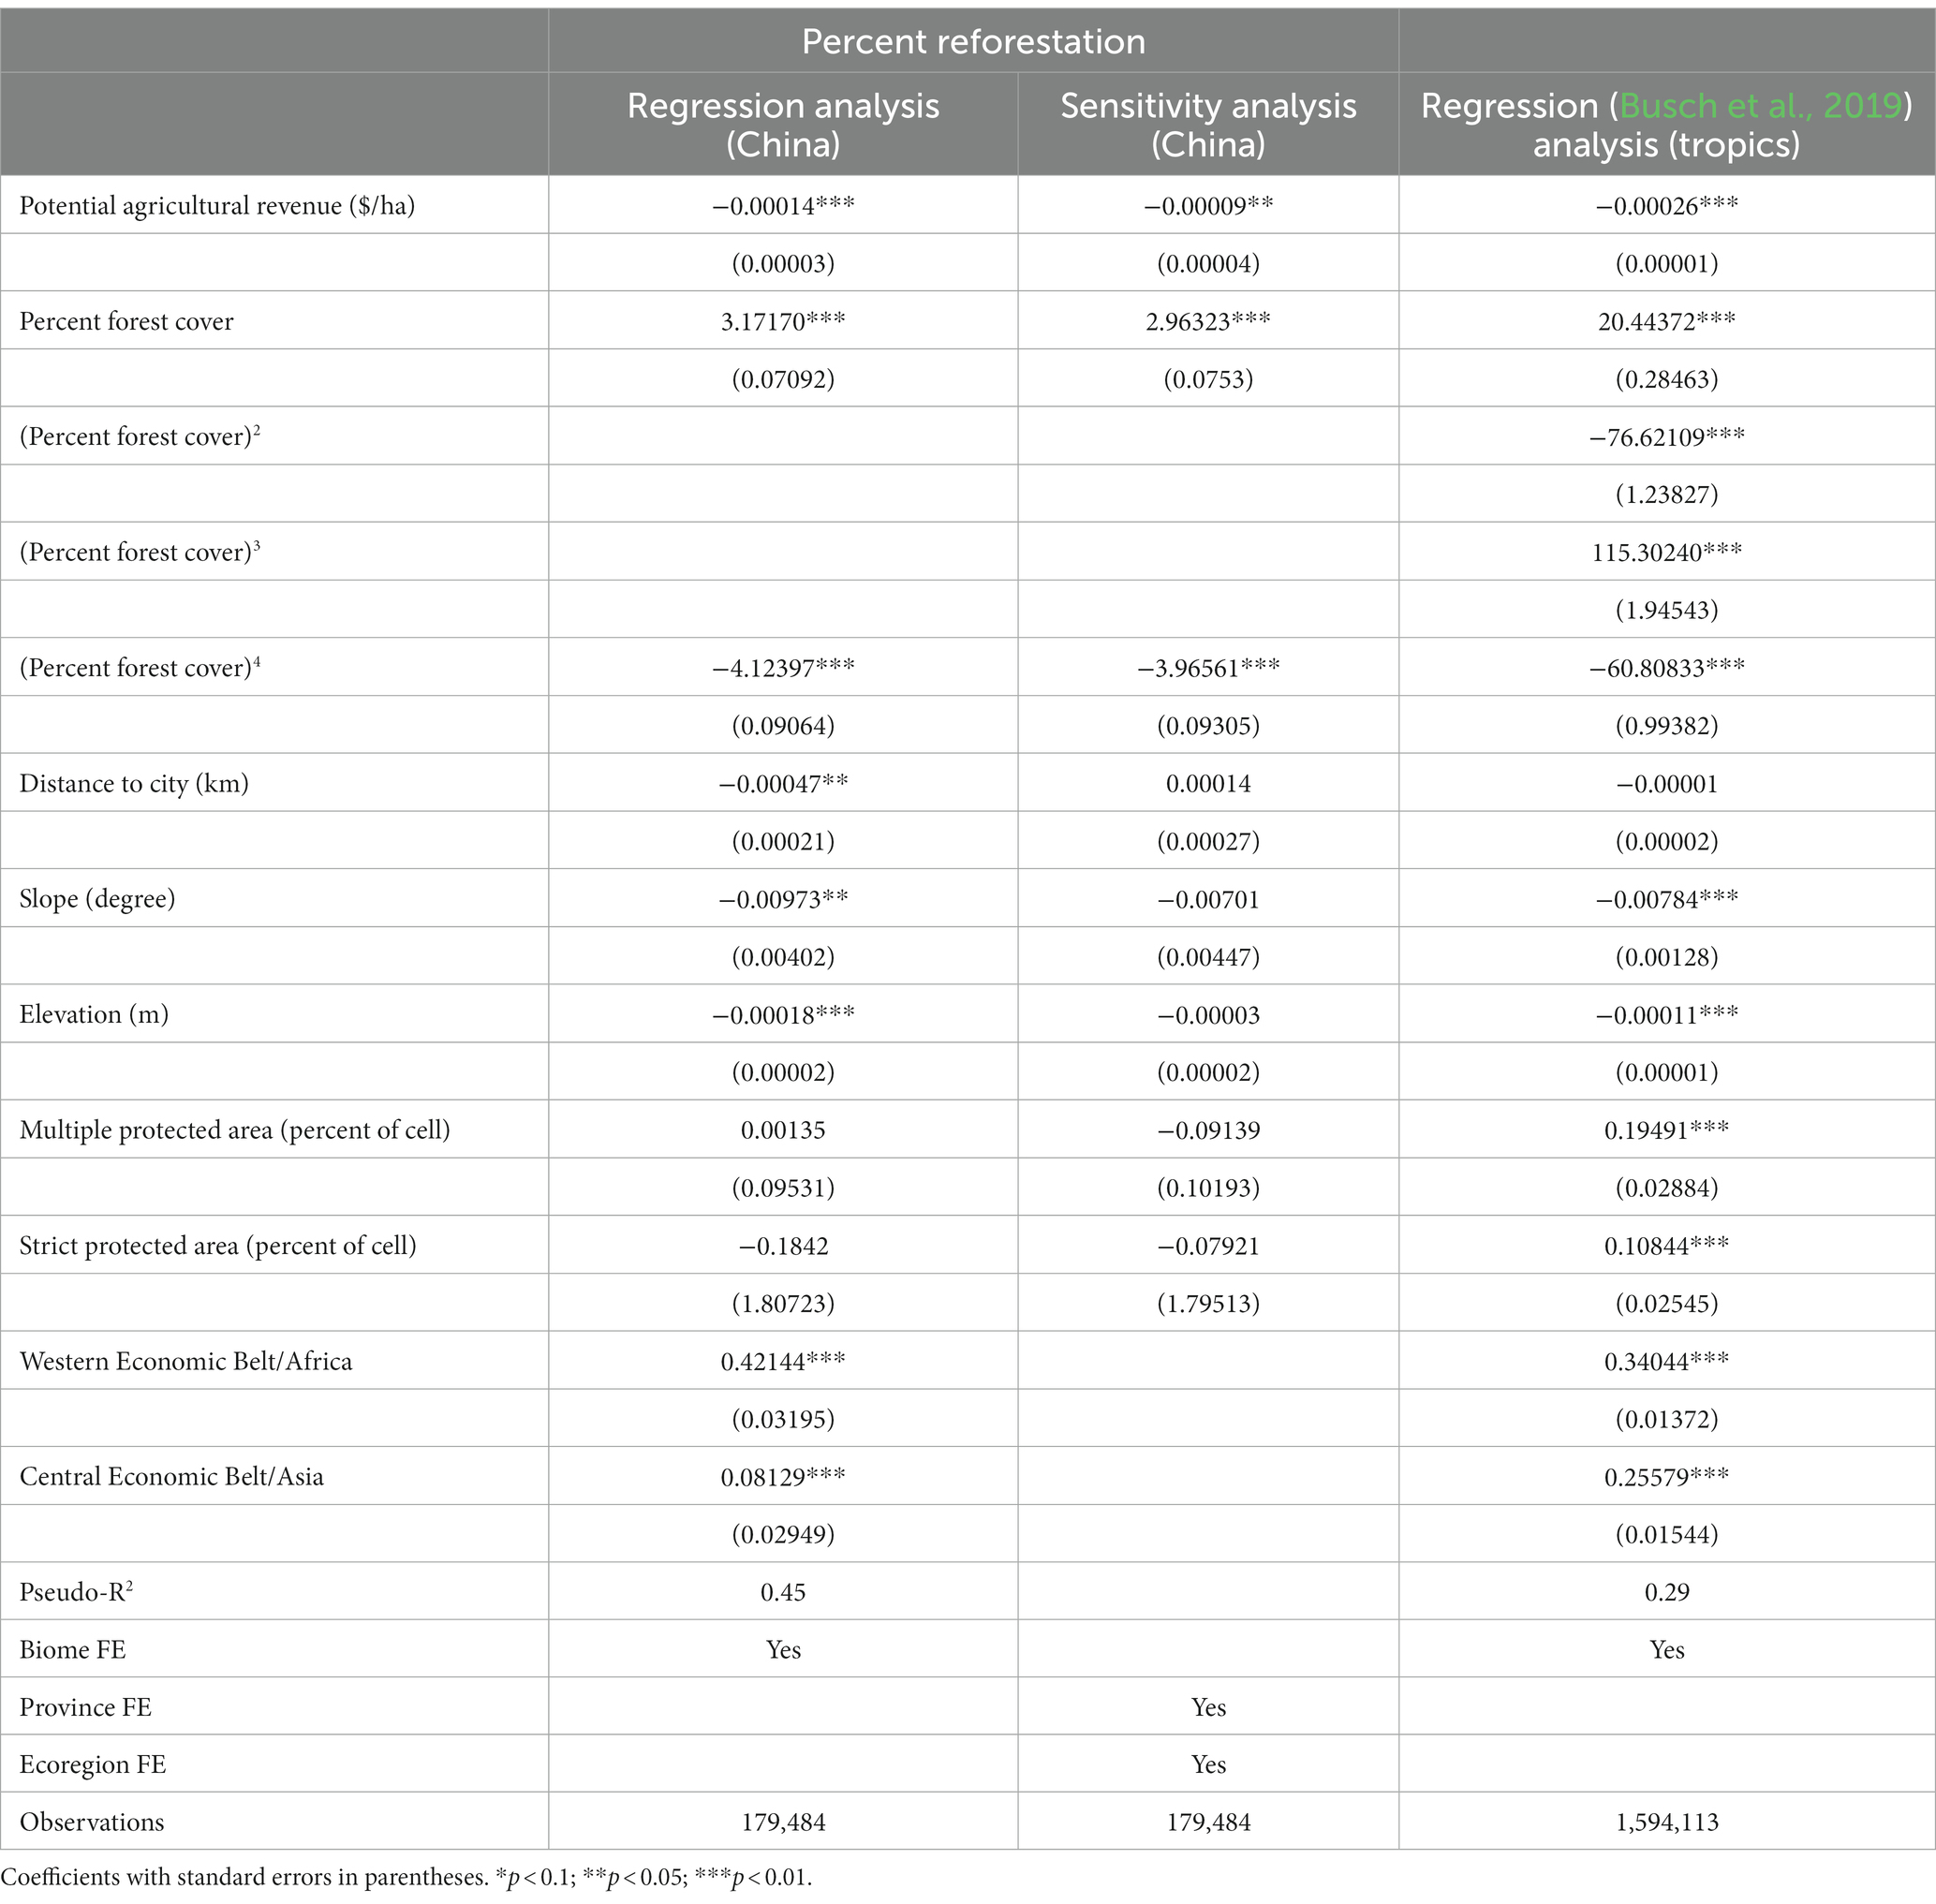
Table 1. Determinants of reforestation as % of cell in Poisson QMLE regressions.
In general, response of reforestation to carbon price was lower in China than in the tropics (Figure 1). Response of reforestation to carbon price in China was relatively close to that of the tropical regions of Asia and Latin America. Specifically, the response of reforestation to carbon price in the Eastern Economic Belt was close to that of the tropical regions of Africa. What’s more, the response of reforestation to carbon price was gradually decreasing from Eastern Economic Belt, Central Economic Belt to Western Economic Belt. According to Table 1, the price salience coefficient of reforestation on potential agricultural revenue was −0.00014 in China, which indicated reforestation was negatively related to potential agricultural revenue. This result is broadly consistent with the findings of determinants of reforestation in Central Economic Belt, Eastern Economic Belt, Latin America, Africa and Asia (Table 2).
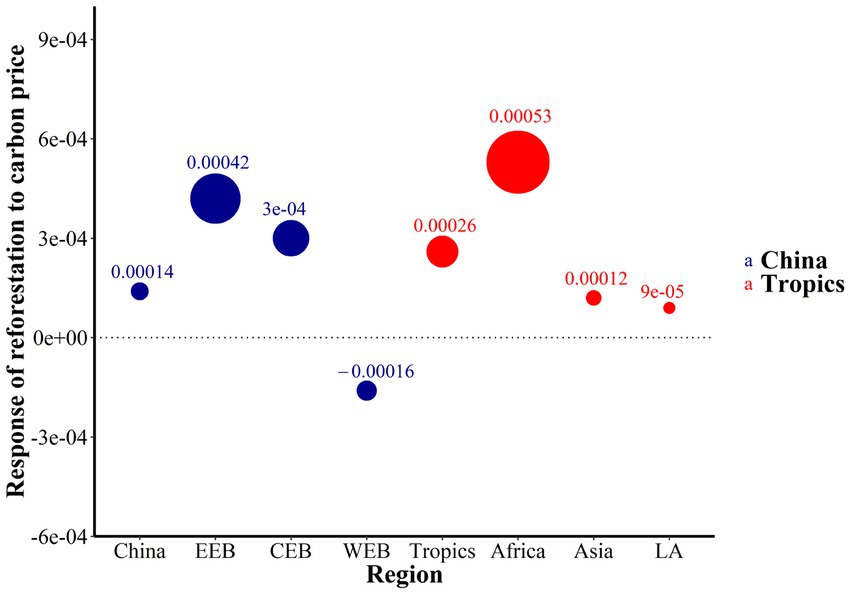
Figure 1. Response of reforestation to carbon price in China and the tropics (EEB, Eastern Economic Belt; CEB, Central Economic Belt; WEB, Western Economic Belt; Africa, Tropical Africa; Asia, Tropical Asia; LA, Tropical Latin America; Response intensity of reforestation to carbon price is the absolute value of Response of reforestation to carbon price; The larger the response intensity of reforestation to carbon price, the larger the circle).
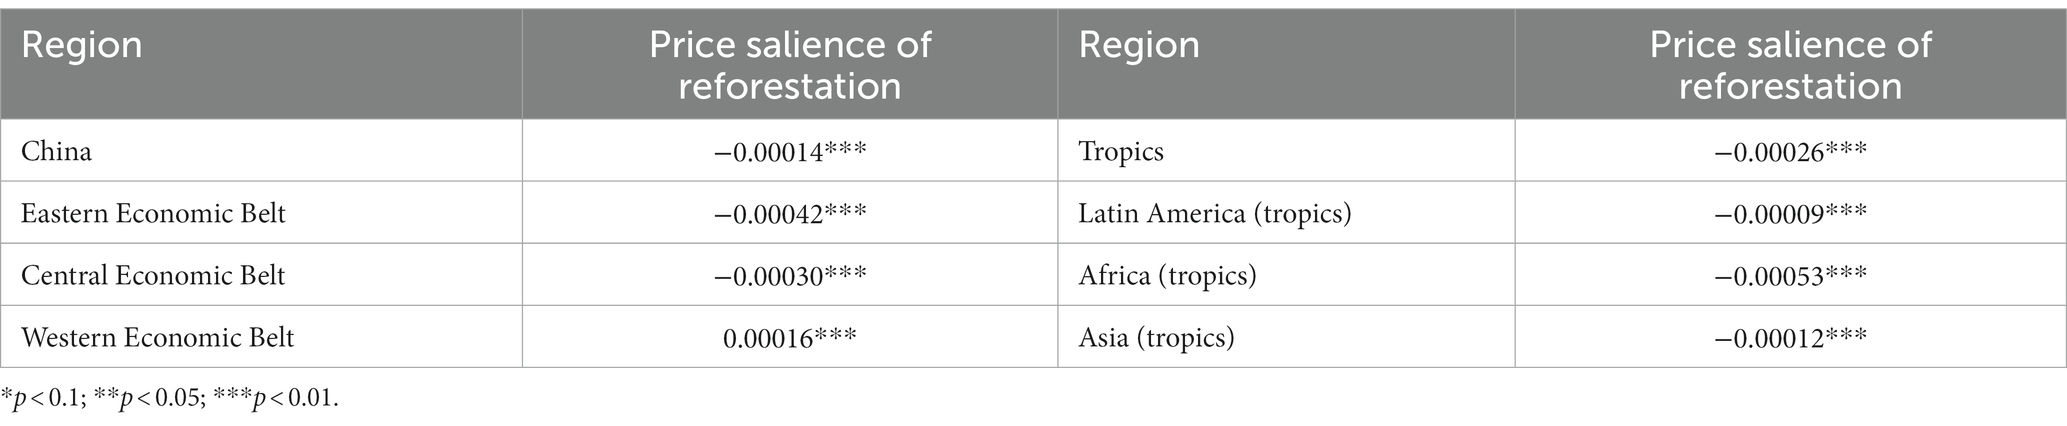
Table 2. Price salience coefficient of reforestation on potential agricultural revenue in China and the tropics.
However, the coefficient of the price salience of potential agricultural revenue on reforestation was 0.00016 in the Western Economic Belt, which indicated reforestation was positively related to potential agricultural revenue. This result which confirmed the symbiosis of agriculture and reforestation in Western Economic Belt was broadly inconsistent with the findings of determinants of reforestation in Central Economic Belt, Eastern Economic Belt, and the tropics (Latin America, Africa and Asia).
According to Figure 2, the price salience of reforestation was greater in land with a higher proportion of private reforestation and output value of non-state enterprises. This is due to the fact that private reforestation is usually more responsive to price than government programs.
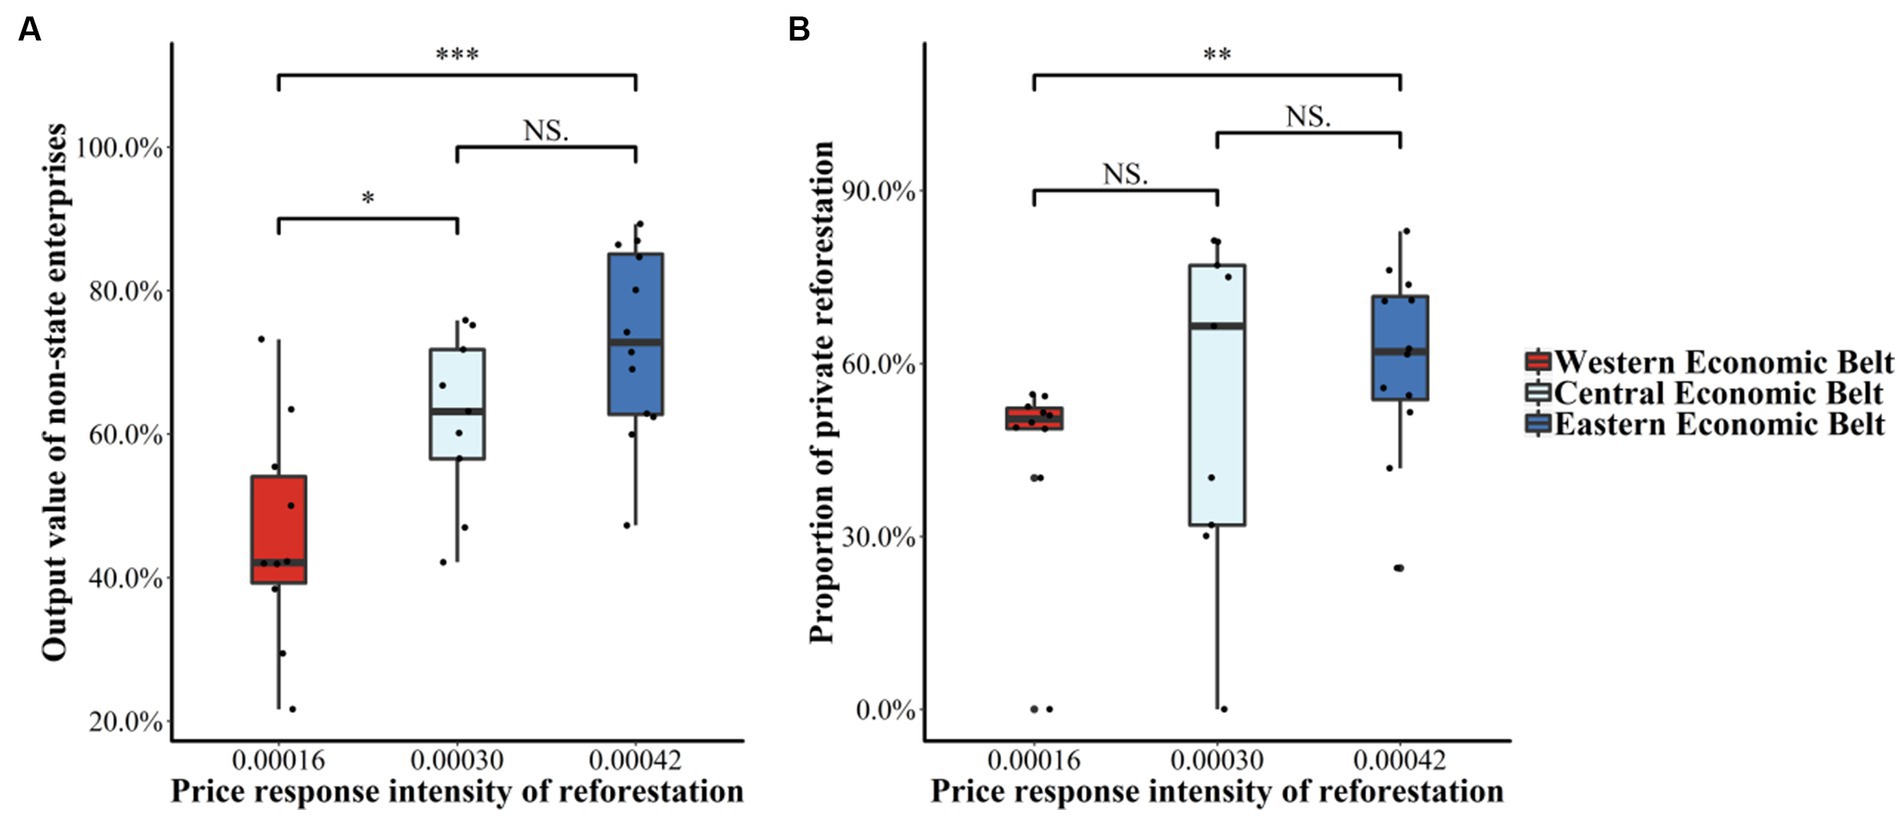
Figure 2. Relationship between price response intensity of reforestation and private economy (The price salience intensity of reforestation is the absolute value of the price salience coefficient of reforestation; Output value of non-state enterprises refers to the proportion of output value of non-state enterprises in total industrial output; Proportion of private reforestation refers to the proportion of private reforestation in total reforestation area; *p < 0.1, **p < 0.05, ***p < 0.01, NS., No significant difference).
We projected 126.48 Mha of reforestation in 2020–2060 under a BAU scenario (Supplementary Figure 2). This projected reforestation corresponds to 29.59 GtCO2 removals from reforestation from 2020 to 2060 (Supplementary Figure 3). The 93.82 Mha of reforestation from 2020 to 2050 in China was equal to 24.19% of the tropical reforestation (387.8 Mha) (Busch et al., 2019) over the same time period. Moreover, the 19.94 GtCO2 removals of reforestation from 2020 to 2050 in China was equal to 19.45% of the tropical removals of reforestation (102.5 GtCO2) (Busch et al., 2019) over the same time period.
A carbon price of US$20 tCO2−1 would motivate land managers to enhance reforestation in China by 3.35 Mha (2.65%) to 129.83 Mha from 2020 to 2060 compared to a business-as-usual scenario (Figure 3). This corresponds to enhancing CO2 removals by 0.49 GtCO2 (1.66%) to 30.08 GtCO2, from 2020 to 2060 (Figure 4). The increased removal (0.29 GtCO2) from reforestation at a carbon price incentive of US$20 tCO2−1 from 2020 to 2050 is much lower than in the tropics (5.7 GtCO2 from 2020 to 2050) (Busch et al., 2019). However, the removal of 20.24 GtCO2 from reforestation from 2020 to 2050 is still equivalent to 18.69% of that in the tropics (Busch et al., 2019) (108.3 GtCO2 in 2020–2050) at a price incentive of US$20 tCO2−1. A carbon price of US$50 tCO2−1 would motivate land managers to enhance reforestation in China by 8.53 Mha (6.74%) to 135.01 Mha from 2020 to 2060 compared to a business-as-usual scenario (Figure 3). This corresponds to enhancing CO2 removals by 1.26 GtCO2 (4.26%) to 30.85 GtCO2, from 2020 to 2060 (Figure 4). The removal of 20.69 GtCO2 from reforestation from 2020–2050 is equivalent to 17.58% of that in the tropics (Busch et al., 2019) (117.7 GtCO2 in 2020–2050) at a price incentive of US$50 tCO2−1.
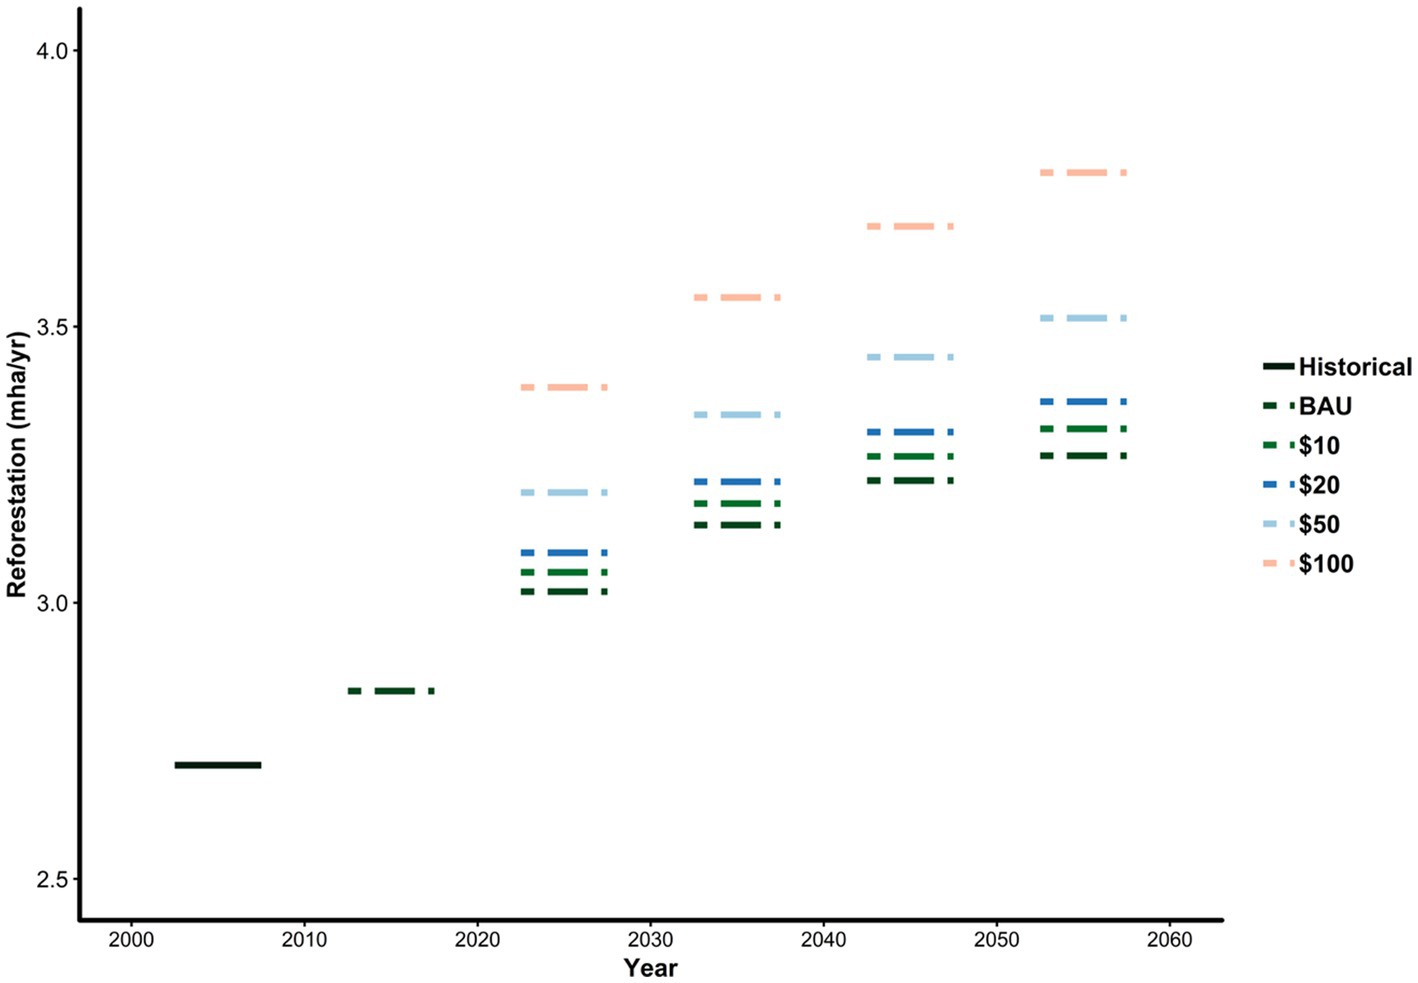
Figure 3. Reforestation under carbon price incentive effect from 2020 to 2060.
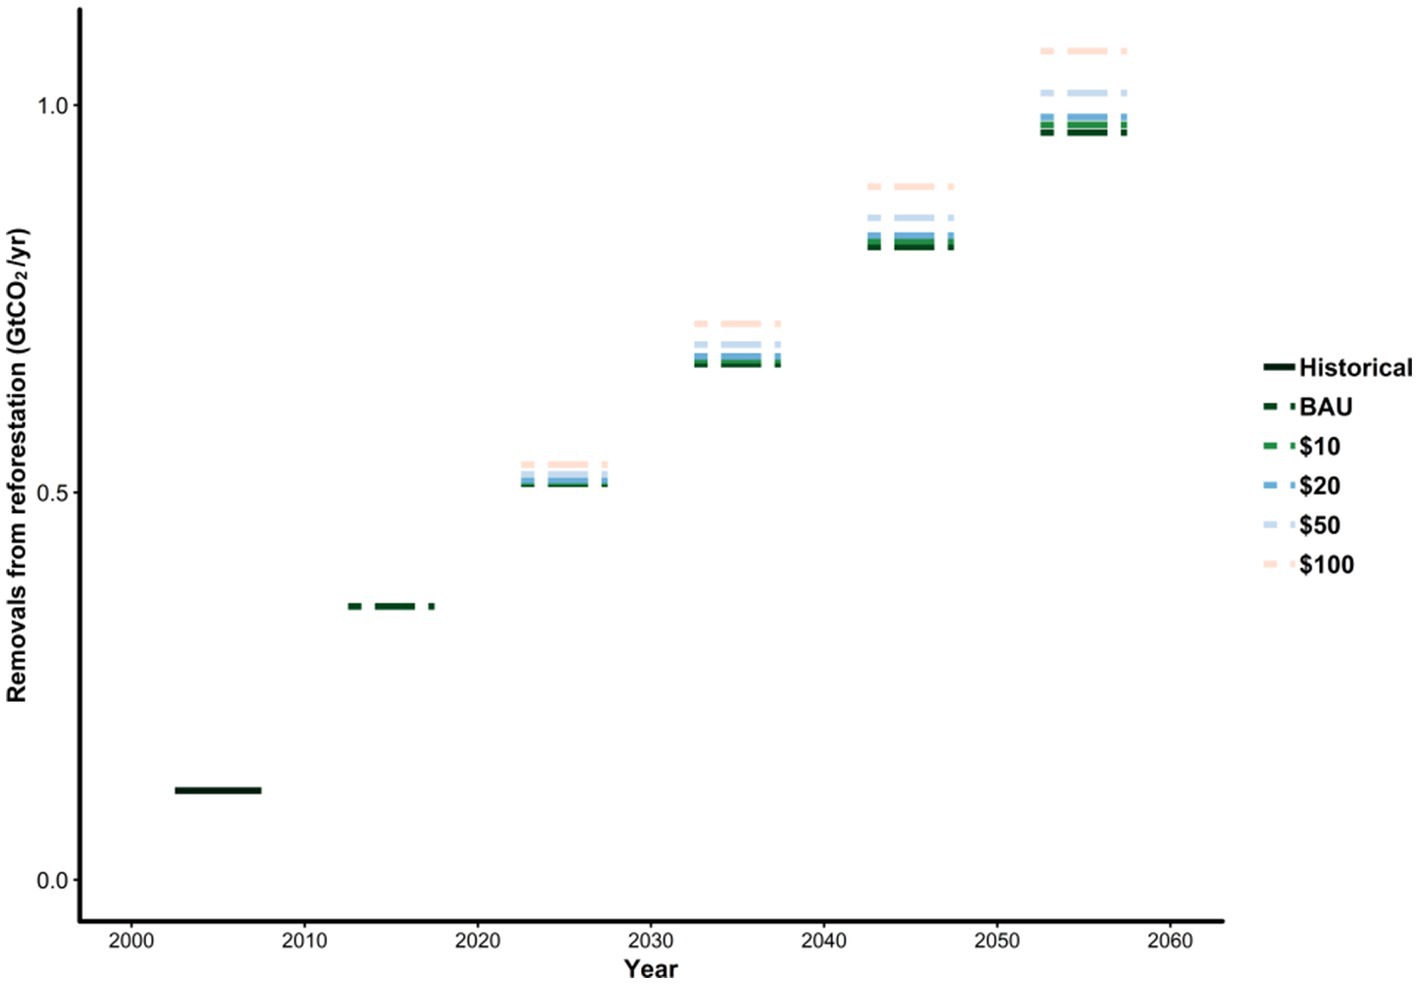
Figure 4. Removals under carbon price incentive effect from 2020 to 2060.
The low-cost abatement potential of reforestation enhanced from 2020 to 2060 (Figure 5). Enhanced removals at US$20 tCO2−1 are 109.52% higher in 2030–2040, 213.95% higher in 2040–2050 and 324.79% higher in 2050–2060 than in 2020–2030. Enhanced removals at US$50 tCO2−1 are 109.53% higher in 2030–2040, 213.93% higher in 2040–2050 and 324.73% higher in 2050–2060 than in 2020–2030. This percentage increment is clearly greater than in the tropics (Busch et al., 2019) (101, 188%) at US$20 tCO2−1.
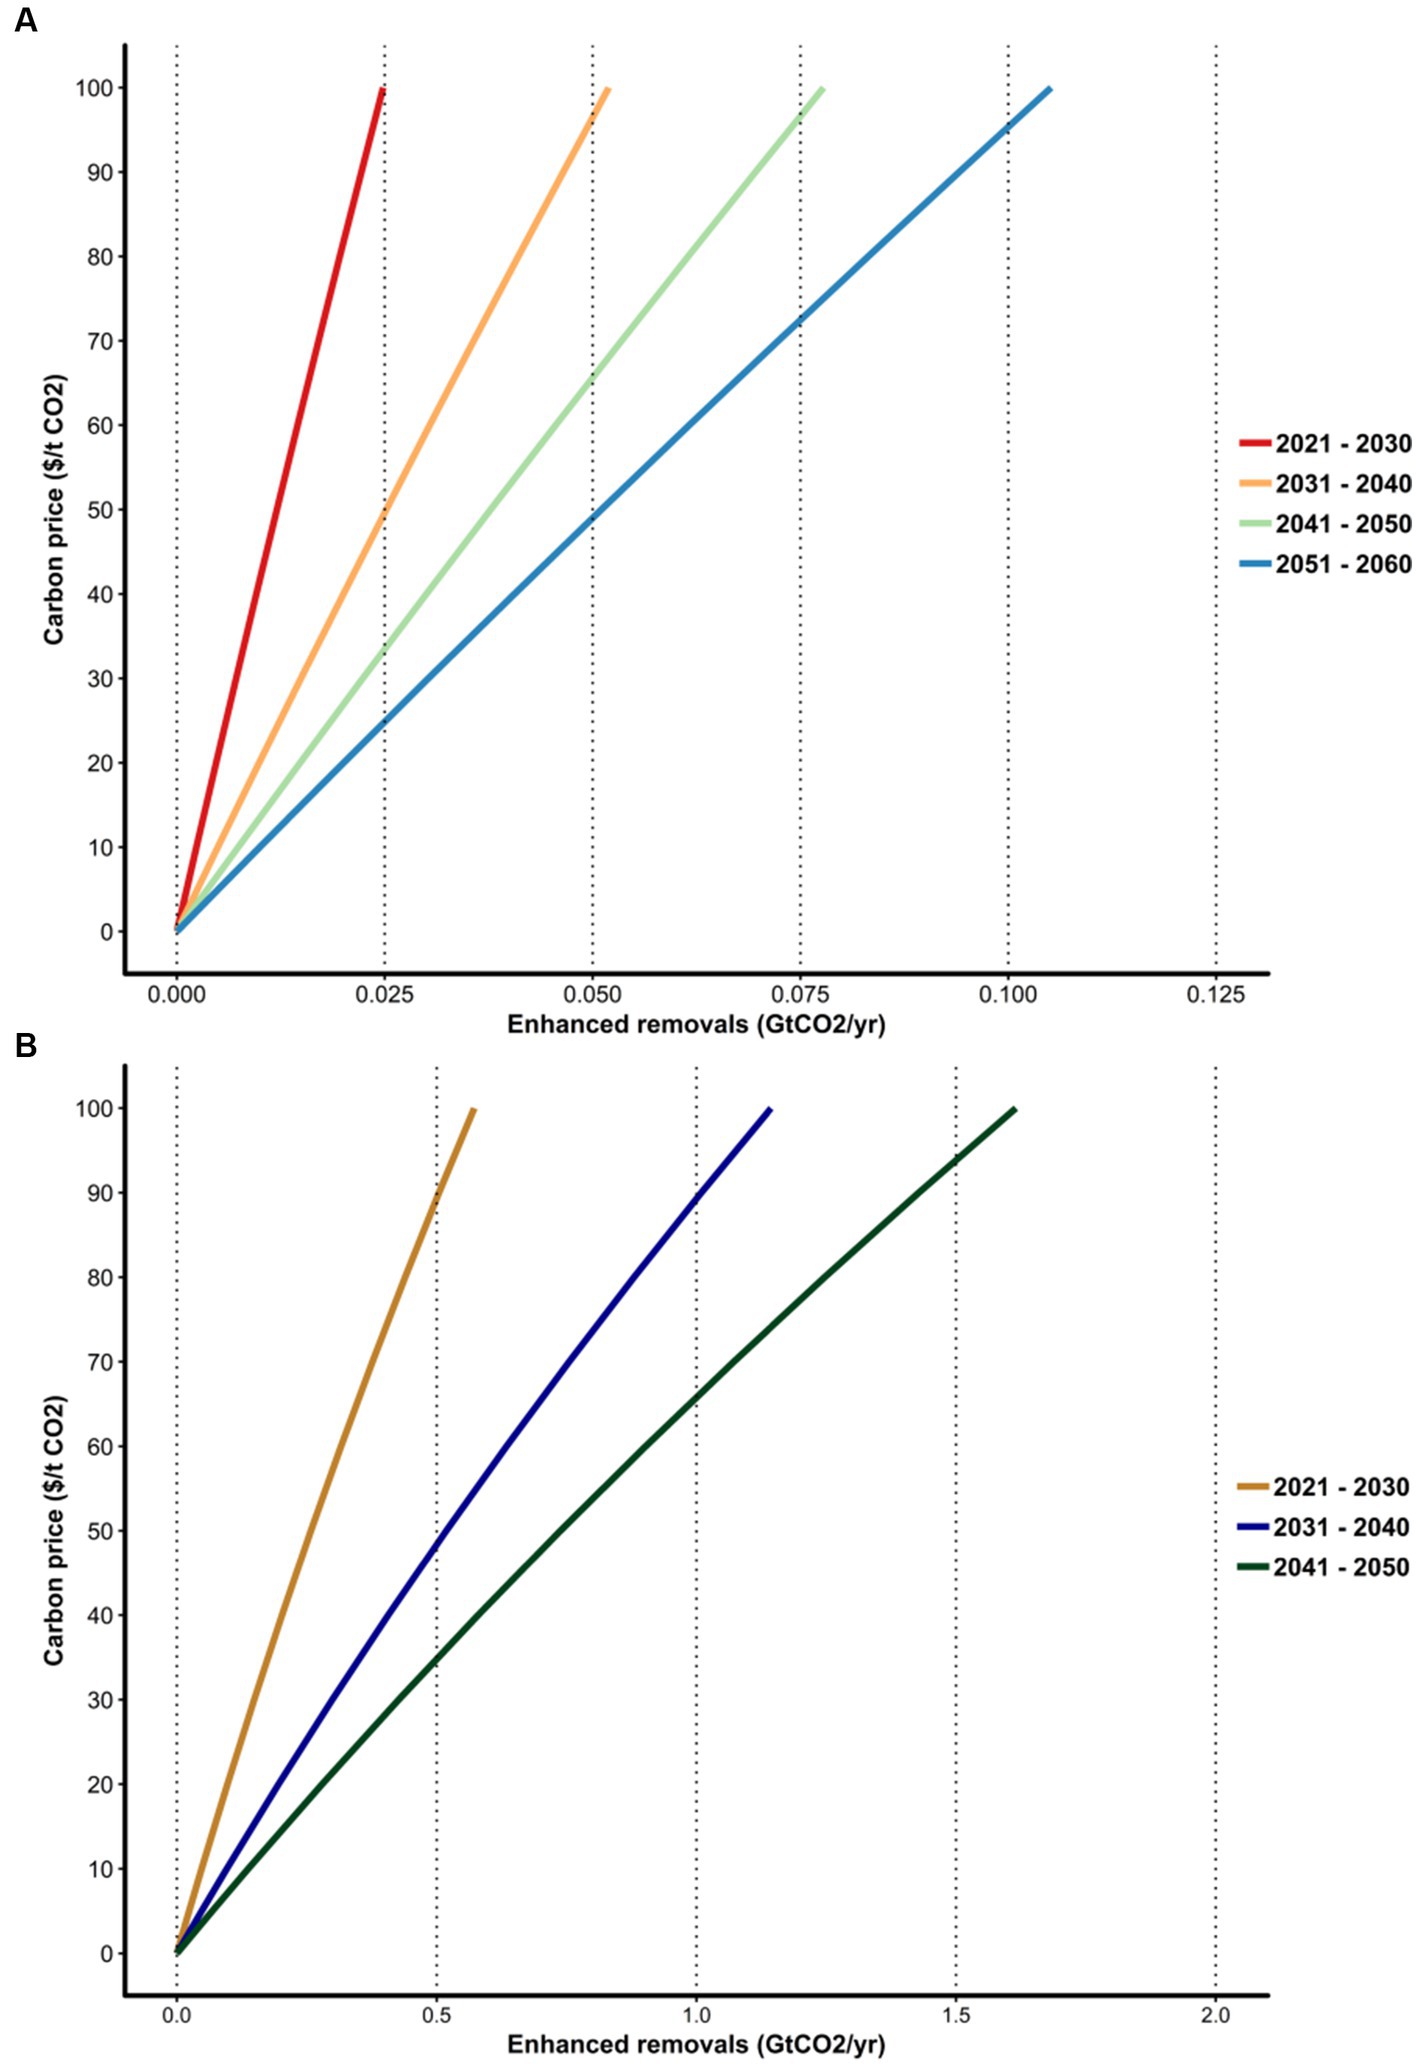
Figure 5. MAC curves about reforestation. The potential CO2 abatement from reforestation is shown for decades from 2020 to 2060. (A) MAC curves about reforestation from 2020 to 2060 in China. (B) MAC curves about reforestation from 2020 to 2050 in the tropics (Busch et al., 2019).
Enhanced removals from reforestation are 0.01236 GtCO2/yr. and 0.03149 GtCO2/yr at US$20 tCO2−1 and US$50 tCO2−1 carbon prices from 2020 to 2060 in China (Figure 5 and Table 3), respectively. Although our projection of low-cost enhanced removals for China is lower than for the United States, Southeast Asia, South Asia, Sub-Saharan Africa, Brazil, and Canada, it is closer to that of Central America and higher than that of East Asia, Japan, Oceania, and Russia (Table 3; Austin et al., 2020). Enhanced removals from reforestation are 0.12875 GtCO2/yr and 0.33865 GtCO2/yr at US$ 20 tCO2−1 and US$ 50 tCO2−1 carbon prices from 2030 to 2060 in Brazil (Austin et al., 2020), which ranks first in the world. In comparison to tropical results, our projection of low-cost enhanced removals for China is only lower than for Brazil and Indonesia from 2020 to 2050, but is higher than the remaining 86 tropical countries such as India, Democratic Republic of the Congo, Mexico, and Australia (Busch et al., 2019). This result confirms that low-cost enhanced removals in China are a non-negligible part of global climate mitigation efforts in the future. Notably, total carbon dioxide removals through reforestation in China is 20.237 GtCO2 from 2020 to 2050 (24.92 GtCO2 from 2030 to 2060) at US$20 tCO2−1 carbon prices, which is close to and lower than the low-cost dioxide removal potential through reforestation of Brazil (Busch et al., 2019) (24.55 GtCO2 at US$20 tCO2−1 from 2020 to 2050; Busch et al., 2019). This result confirms that total carbon dioxide removal potential from reforestation in China will be slightly inferior to tropical Brazil. China is likely to be one of the global leaders in mitigating climate through reforestation in the next 40 years, largely due to previous large-scale reforestation programmes that will continue to remove large amounts of carbon dioxide in the future, even if carbon prices are equal to 0 (removals from reforestation under BAU).
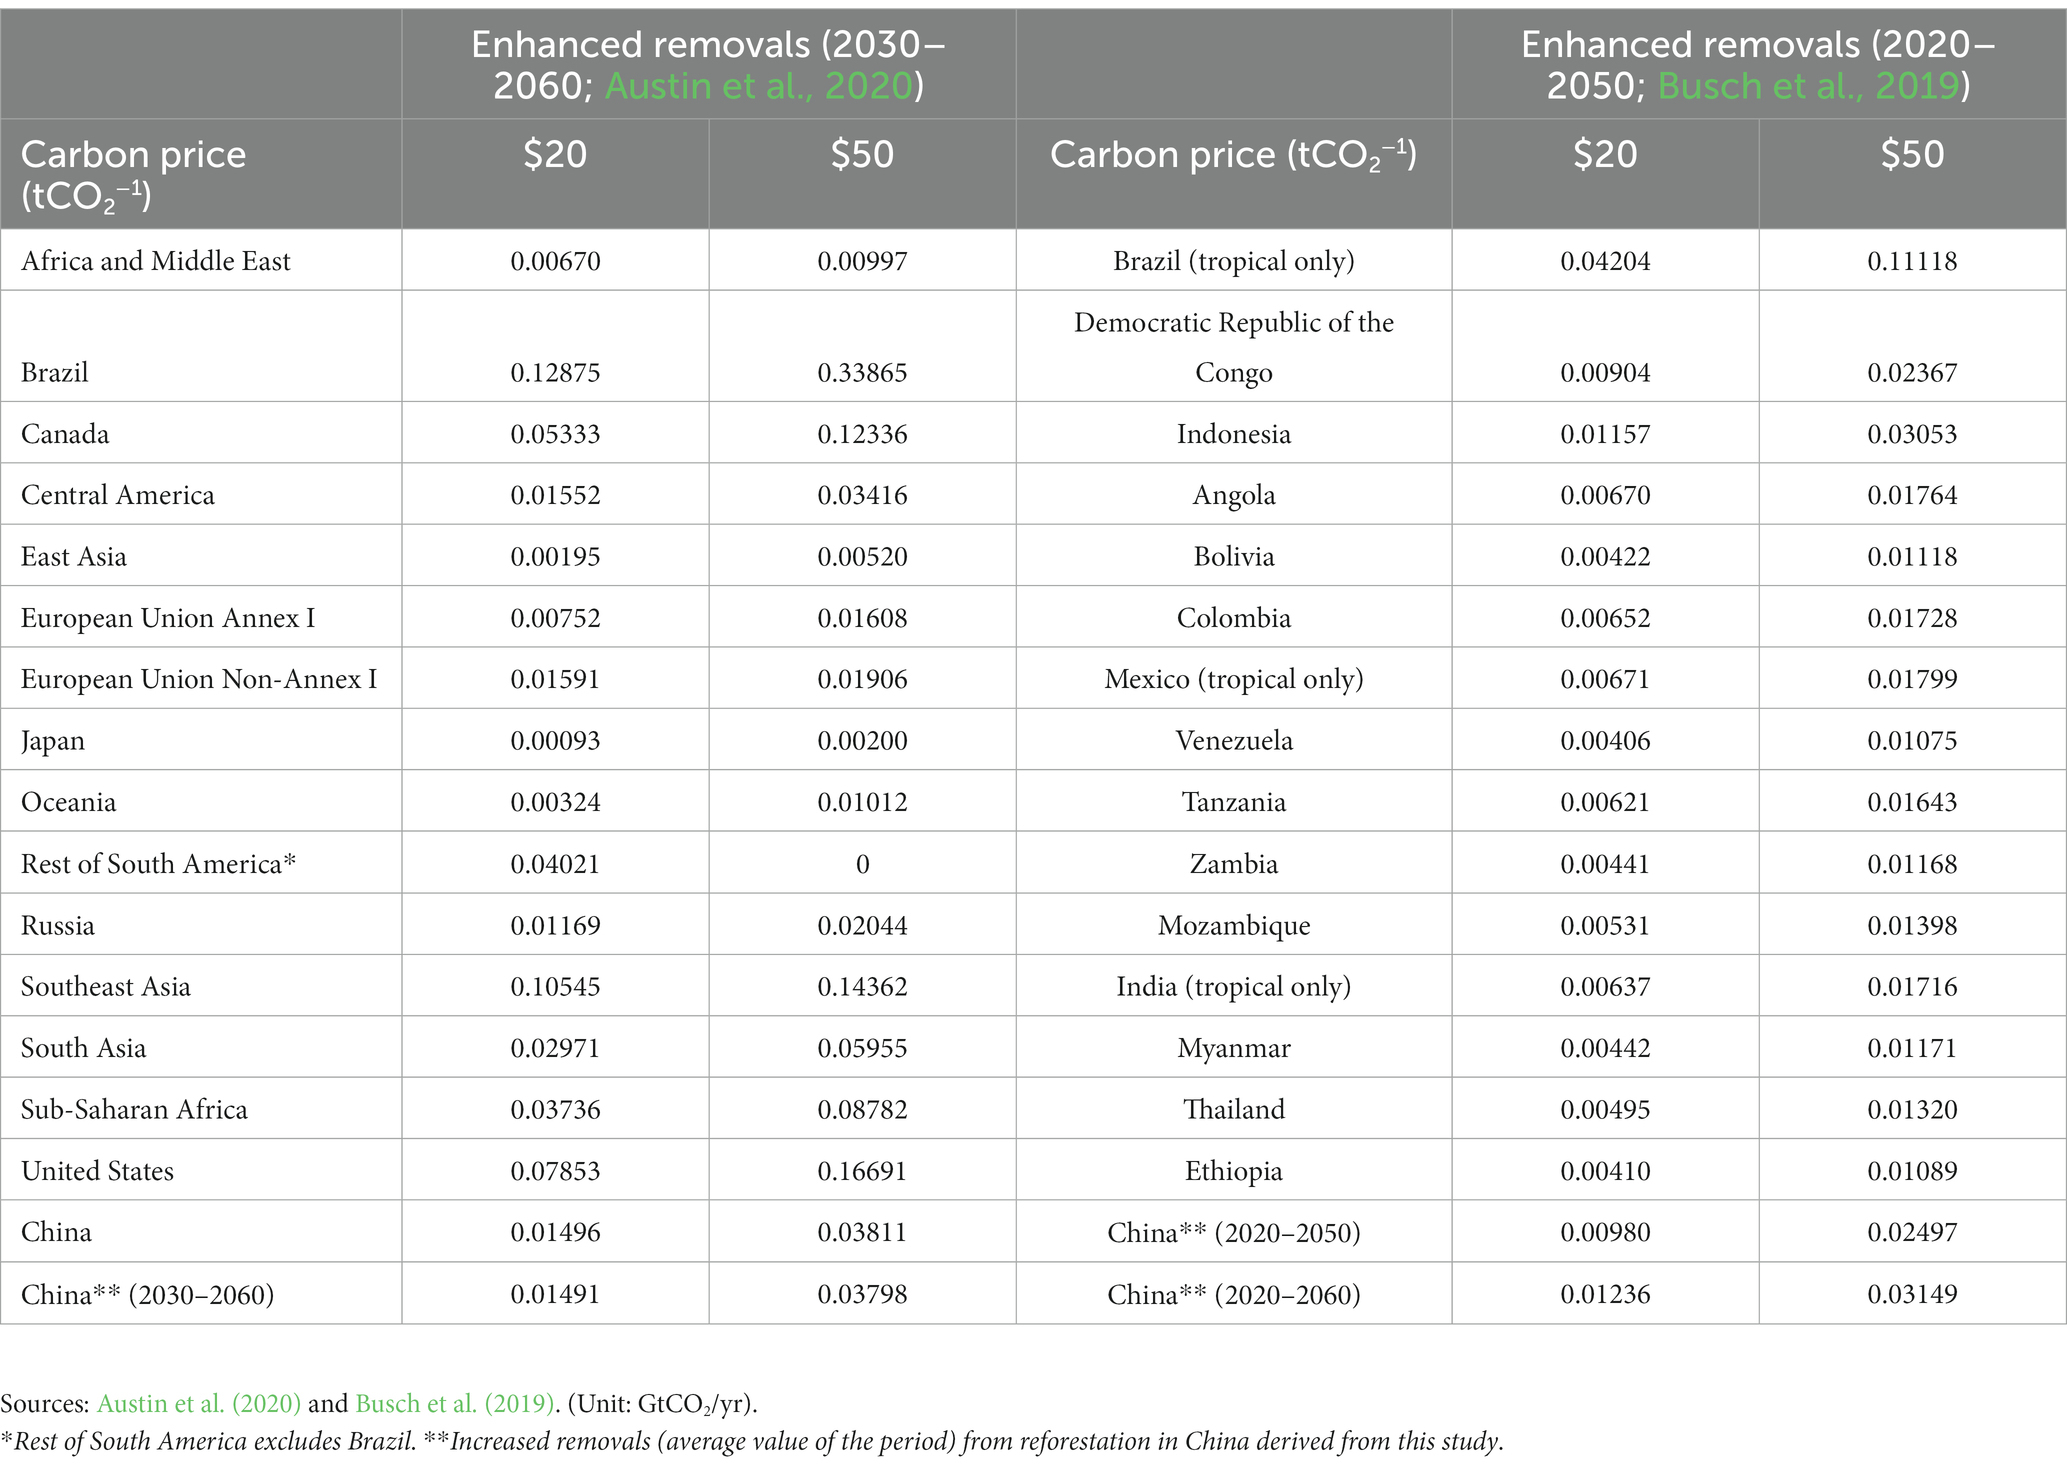
Table 3. Increased removals from reforestation in major countries and regions at US$20 tCO2−1 and US$50 tCO2−1 from 2020 to 2060.
The Western Economic Belt (1.2767 GtCO2) accounts for 42.44% of low-cost removals from 2020 to 2060 at US$20 tCO2−1 (Table 4), followed closely by Central Economic Belt (0.9495 GtCO2, 31.56%) and Eastern Economic Belt (0.7823 GtCO2, 26.00%). The Western Economic Belt (1.3098 GtCO2) comprised 42.46% of low-cost CO2 removals from 2020 to 2060 at US$50 tCO2−1, followed closely by Central Economic Belt (0.9717 GtCO2, 31.50%) and Eastern Economic Belt (0.8035 GtCO2, 26.04%). Western Economic Belt also comprised 43.32 and 43.21% of low-cost enhanced removals from reforestation respectively, followed by Central Economic Belt (29.15 and 29.07% respectively) and Eastern Economic Belt (27.73 and 27.72% respectively) at US$20 tCO2−1 and at US$50 tCO2−1 (Table 4).
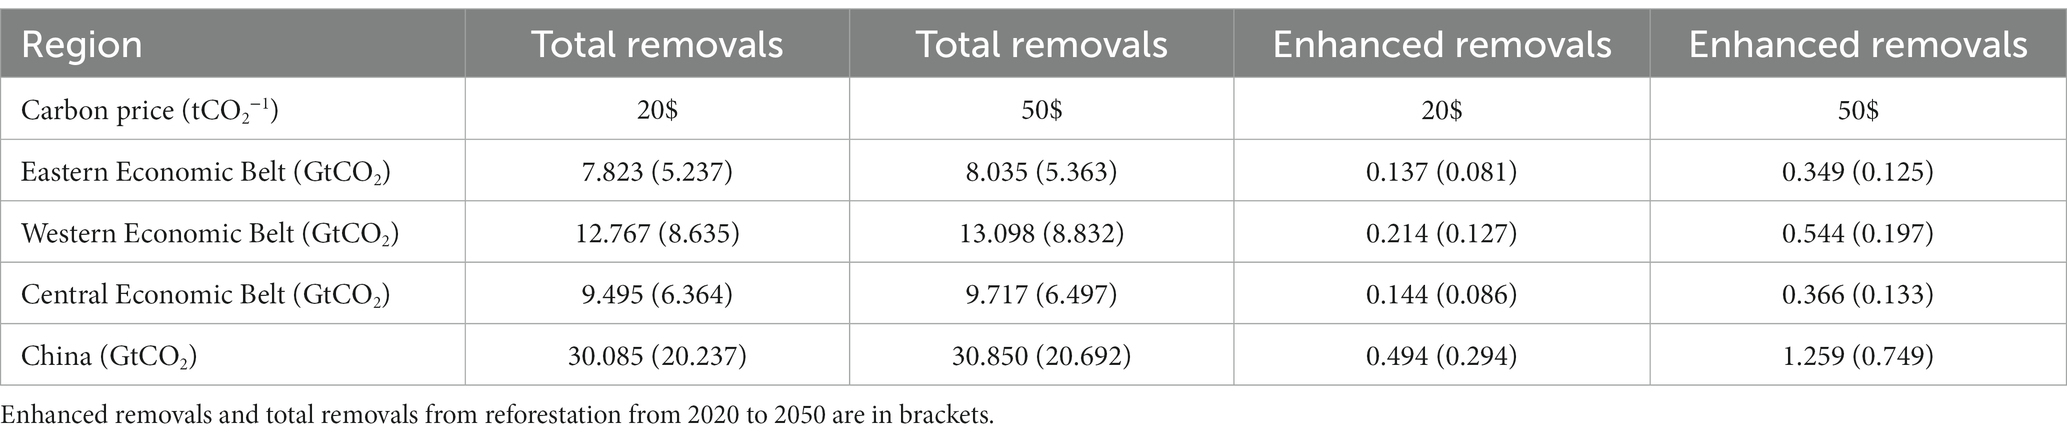
Table 4. Enhanced removals and total removals from reforestation at US$20/50 tCO2−1 from 2020 to 2060.
The cost potential of enhanced CO2 removal varied significantly across provinces (Figures 6, 7). The top 10 provinces for enhanced CO2 removals (representing 73.19 and 73.22% of total removals) from reforestation between 2020 and 2060 at US$20 tCO2−1 and US$50 tCO2−1 were Yunnan, Sichuan, Guangxi, Guizhou, Hunan, Guangdong, Heilongjiang, Jiangxi, Fujian, Zhejiang (Figures 6, 7).
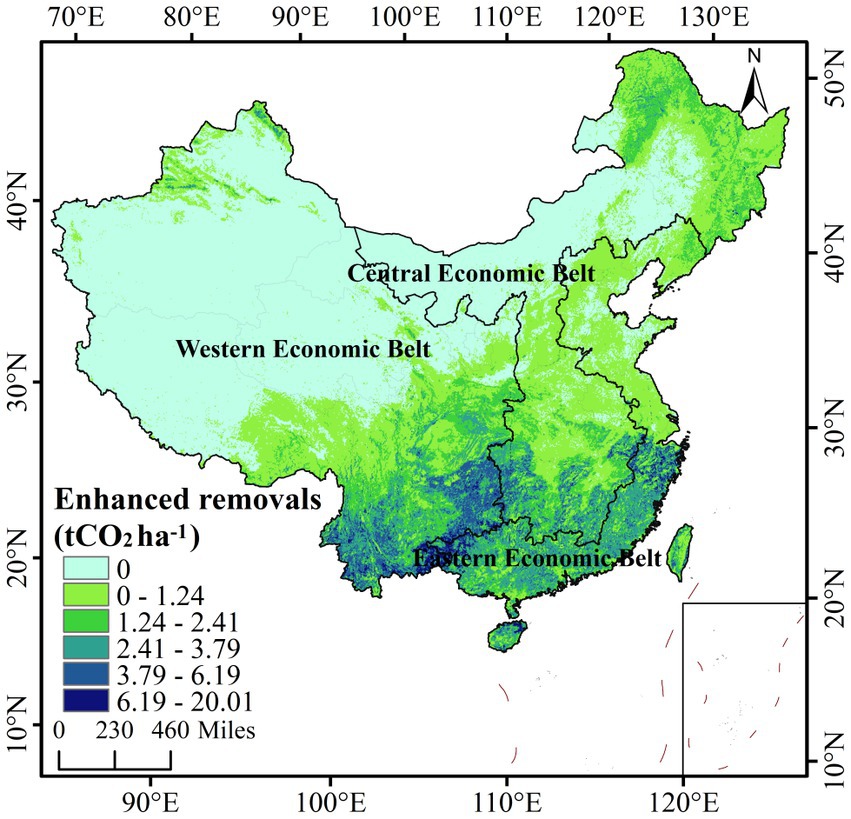
Figure 6. Maps of enhanced removals from reforestation at a carbon price of US$20 tCO2−1 from 2020 to 2060 (Enhanced removals of Taiwan, Hong Kong and Macao were calculated by the national average of some variables).
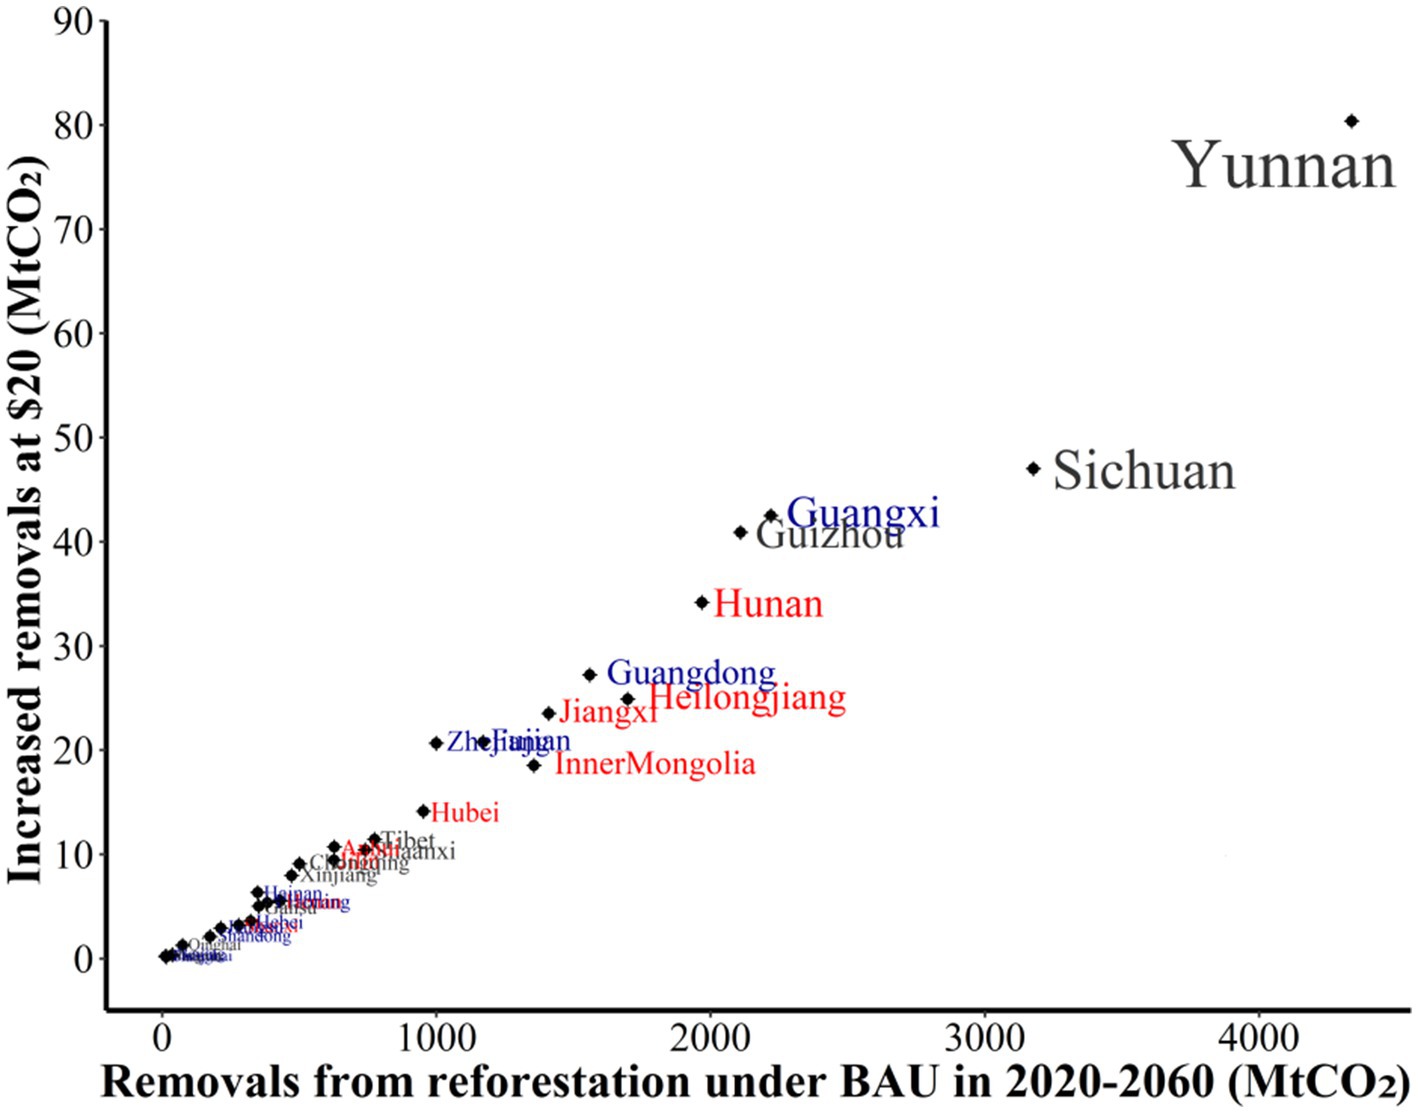
Figure 7. Potential for low-cost CO2 removal through reforestation in different provinces (The blue spectrum is for the Eastern Economic Belt; the orange spectrum is for the Central Economic Belt; and the gray spectrum is for the Western Economic Belt).
Potential agricultural revenue and percent forest cover showed significant effects on reforestation in the robustness test, which coincided with the results of the regression analysis, although distance to city, slope, elevation, multiple protected area, and strict protected area did not significantly affect reforestation (Table 1).
A relative comparison between our estimates and those in reference (Busch et al., 2019) was used for calibration, according to the methodology of reference (Lu et al., 2022). Our calibration results (Figure 8) show that carbon removals (InterQuartile Range: 0.00 ~ 135.77 tCO2 ha−1 and 0.00 ~ 135.74 tCO2 ha−1, respectively, in US$20 tCO2−1 and US$50 tCO2−1) from reforestation at carbon prices of US$20 tCO2−1 and US$50 tCO2−1 are close to those (InterQuartile Range:16.89 ~ 120.82 tCO2 ha−1 and 32.89 ~ 123.10 tCO2 ha−1, respectively, in US$20 tCO2−1 and US$50 tCO2−1) in Busch et al. (2019). Notably, the range (20.45 ~ 85.18 tCO2 ha−1) of our estimated Mean ± SD is slightly lower than that (40.90 ~ 91.89 tCO2 ha−1) of reference at carbon prices of US$20 tCO2−1. Moreover, the range (20.65 ~ 86.58 tCO2 ha−1) of our estimated Mean ± SD is also slightly lower than that (47.46 ~ 101.44 tCO2 ha−1) of reference (Busch et al., 2019) at carbon prices of US$50 tCO2−1. This may be due to the fact that unit carbon accumulation rates in Hainan are generally lower than the average values of carbon accumulation in typical tropical rainforests (Amazon Basin, Congo, and Southeast Asia), given the marginal location of the tropical climate (Busch et al., 2019). The difference between the Chinese secondary forest growth samples and the tropical secondary forest growth samples database caused this bias (Anderson-Teixeira et al., 2021). Moreover, the difference in response of reforestation to carbon prices on state-owned land and privately owned land is also an important cause of this bias.
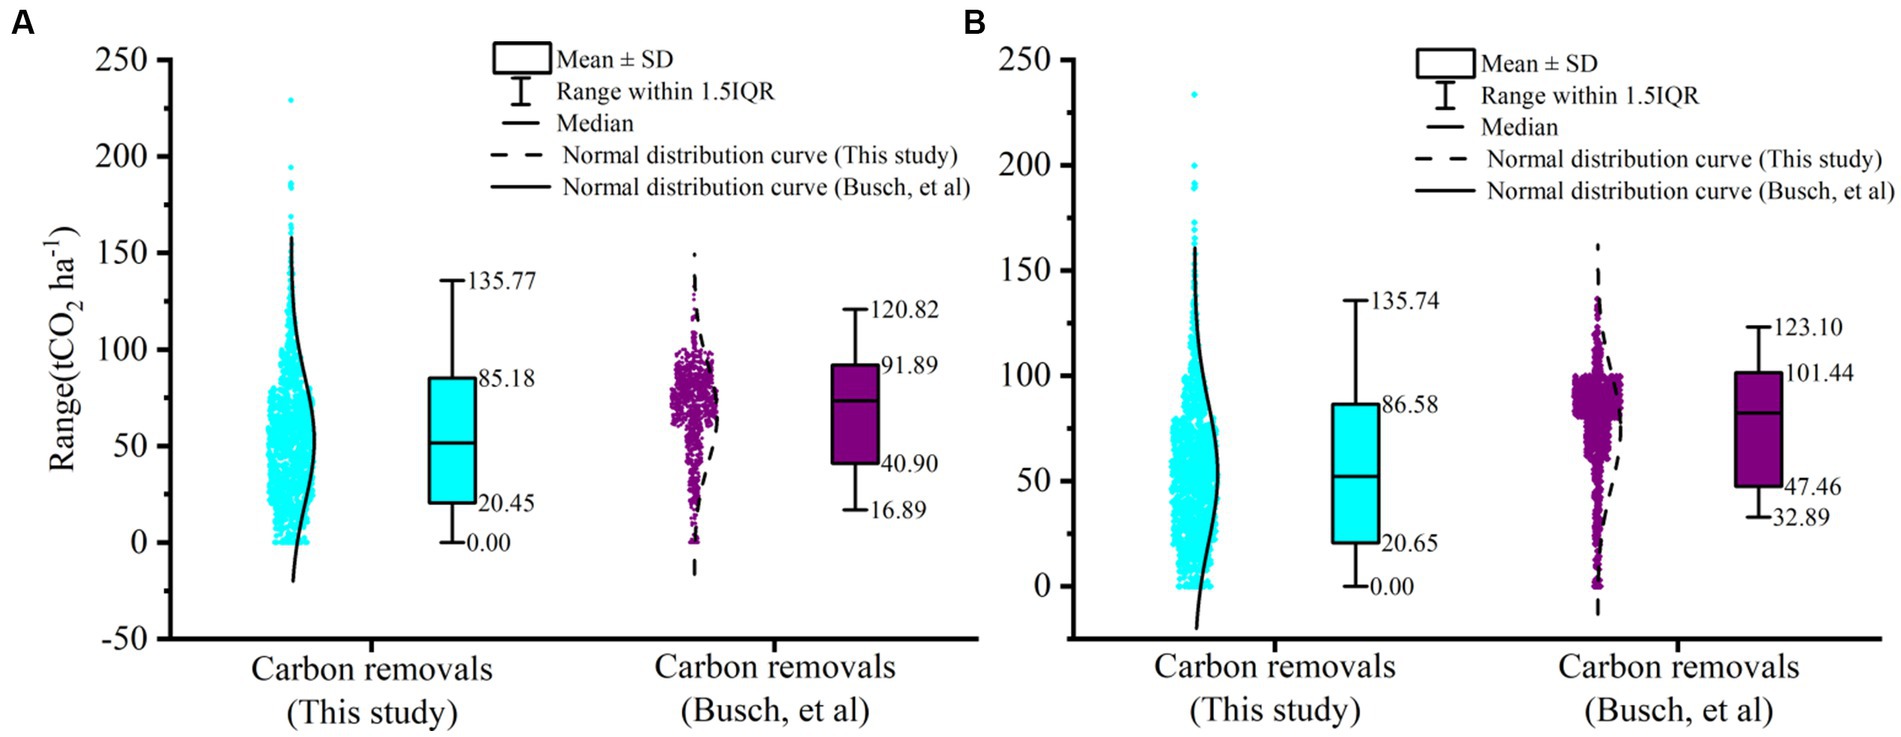
Figure 8. Calibration results of carbon removals through reforestation at carbon prices of US$20 tCO2−1 and US$50 tCO2−1 from 2020 to 2050 in Hainan province. (A) Carbon removals from reforestation at carbon prices of US$20 tCO2−1. (B) Carbon removals from reforestation at carbon prices of US$50 tCO2−1.
(1) Cross-spatial validation of carbon removals. We validated carbon removal using Kling-Gupta Efficiency (KGE) based on carbon removal through reforestation estimated by land-use data, given that KGE addresses several perceived shortcomings in the Nash-Sutcliffe efficiency (NSE) (Knoben et al., 2019). Moreover, given the lack of forest cover data for 2010–2020, our estimates were validated by carbon removal estimated by 2010–2020 land use data. According to Table 5 and Supplementary Table 4, the value of KGE about cross-spatial carbon removals through reforestation in 2010–2020 is 0.43. (2) Cross-temporal validation of carbon removals. The value of KGE is 0.67 and 0.080, respectively, in 2035 and 2055 (Table 6). These results confirm that this study is a “satisfactory” model simulation (Knoben et al., 2019; Vergopolan et al., 2021; Koppa et al., 2022).
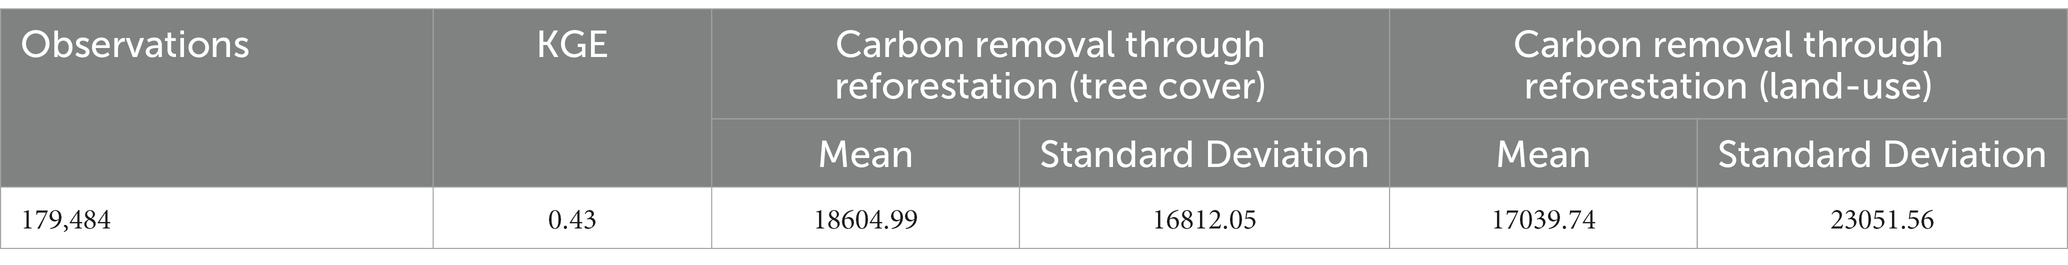
Table 5. Validation results of Kling-Gupta Efficiency (KGE) about cross-spatial carbon removals through reforestation in 2010–2020.
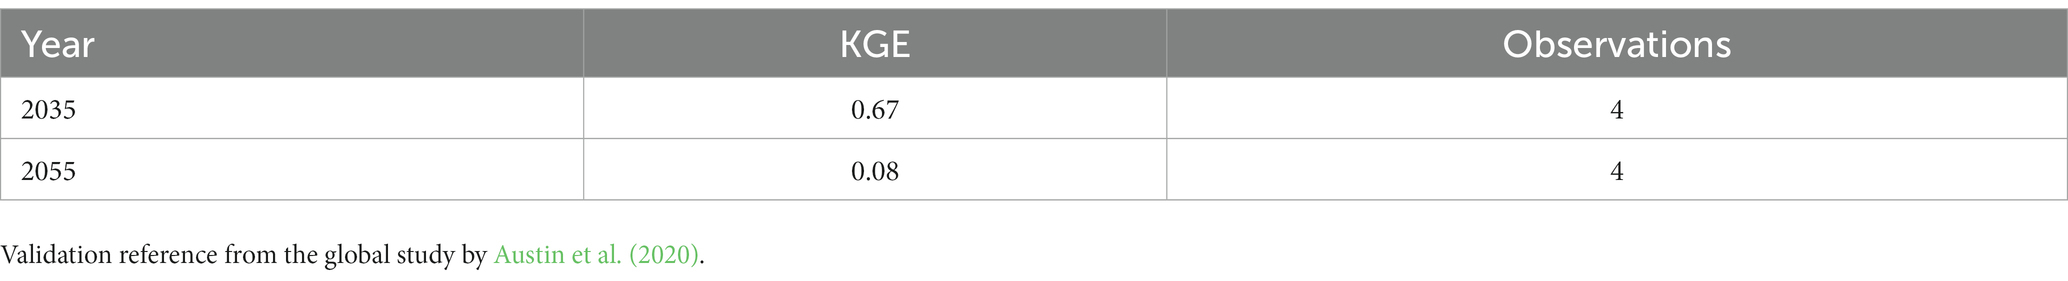
Table 6. Validation results of Kling-Gupta Efficiency (KGE) about cross-period carbon removals at carbon prices of US$20 tCO2−1 and US$50 tCO2−1 in China.
Among the global actions and plans for climate mitigation in the past decades, the tropical rainforests of Brazil, Indonesia, and Democratic Republic of the Congo have attracted lots of global attention due to their vast forests and carbon pools (Gullison et al., 2007; Murdiyarso et al., 2015; Rochedo et al., 2018; Pennisi, 2020; Staal et al., 2020; Heinrich et al., 2021; Koh et al., 2021; Masuda et al., 2021; Steckel et al., 2021; White et al., 2021; Koch and Kaplan, 2022). However, our projection of low-cost enhanced removals (0.01236 GtCO2/yr. at US$ 20tCO2−1, 0.03149 GtCO2/yr. at US$ 50tCO2−1) for China in the future is higher than all tropical countries except Brazil and Indonesia, such as Democratic Republic of the Congo, India, Mexico (Busch et al., 2019; Austin et al., 2020). Our projection of low-cost removals through reforestation in China from 2020 to 2060 is 30.08 GtCO2 at US$20 tCO2−1 carbon prices, which is 1.23 times that of Brazil from 2020 to 2050 (24.55 GtCO2 at US$20 tCO2−1; Busch et al., 2019).
Previous studies speculated that reforestation projects on public land (China and India), might not be as responsive to price signals (Busch et al., 2019). That government-led reforestation policies do not usually respond to cost/price signals is accepted by lots of Chinese researchers and mainstream views (Feng et al., 2021), which constrains the replication of cost/price studies in China. They believe that reforestation will not respond to price incentives under land ownership by the state and a strict land regime in China (Wang et al., 2018; Wu et al., 2018; Yang et al., 2021). However, the reality is not entirely so. First, government-led large-scale reforestation projects are the main driver for enhancing forest cover. Despite the inherently policy-driven nature of these reforestation projects (the Natural Forest Conservation Program, Three-North Shelter Forest Program, National Key Ecological Function Area Program, etc.), limited government investment forced project managers to incorporate cost considerations. The government is less willing to undertake reforestation in regions with high potential agricultural income, due to higher costs of arable land acquisition and food security (Cao, 2011; Yan, 2019; Tong et al., 2020; Winkler et al., 2021). Moreover, land management rights are possessed by enterprises, farmers, foresters, farms, and forest farms, who are the direct managers of the land, although all land is owned by the state in China (Chow, 1997; Feng et al., 2021). We have found that these enterprises, farmers, foresters, farms, and forest farms are responsive to price signals (or cost compensation). Second, commercial timber plantations responding to the demand for wood are also an important driver of forest cover change. Due to the natural forest conservation policy, commercial timber plantations have extensively cultivated fast-growing species such as poplar and eucalyptus to generate profits and fulfill the timber demand. Third, the Sloping Land Conversion Program is also a significant driver of forest cover change. As this program provides subsidies for converting farmland into forests, many farmers opt for reforestation on their land to reap greater economic benefits.
The cost potential of carbon dioxide removal through reforestation in China has been overlooked in the past. This study not only confirms that MAC curves about carbon dioxide removal can also be applied to China as well, but that China has a huge cost potential to CO2 removal through reforestation. In fact, the cost potential of CO2 removal in China may not be limited to this. The large-scale reforestation programs implemented in the past 30 years will continue to remove large amounts of carbon dioxide in the future, even if the carbon price is equal to 0 (removals through reforestation under BAU), which offers significant potential for zero-cost CO2 removal through reforestation. As per capita income crosses the inflection point of the Environment Kuznets Curve, the structure of economic growth and natural environmental needs have changed significantly in China (Wang et al., 2019; Yang et al., 2020). The idea of protecting nature has been widely accepted in China (O'Meara, 2021). These trends will broaden the cost potential of carbon dioxide removal through reforestation in China.
This study estimated the spatial extent and the potential of low-cost CO2 removal through China’s reforestation. We estimate that reforestation could remove 0.9848, and 1.0158 GtCO2 yr−1 at US$20 tCO2−1, and US$50 tCO2−1 in China from 2050 to 2060, respectively. These cost potentials are separately equal to 9.56 and 9.86% of CO2 emissions of China (10.3 GtCO2 yr−1) in 2019 (Jiang et al., 2020; Shan et al., 2020; Yang et al., 2020; Liu et al., 2022; Tang et al., 2022). Moreover, the potential for removals through reforestation (1.0 GtCO2 yr−1 from 2050 to 2060) at US$50 tCO2 are separately equal to 67.72 and 35.03% of CO2 emissions of China under the 1.5°C (1.5 GtCO2 yr−1) and 2°C (2.9 GtCO2 yr−1) goal in 2050 (group, P. s. r. w., 2020; Duan et al., 2021).
Our estimates indicate that reforestation has greater low-cost abatement potential in 2060 relative to direct CO2 capture & storage (0.03–0.3 GtCO2 yr−1 at US$ 390–415 tCO2−1) and bioenergy with carbon capture and storage (BECCS) (0.3–0.7 GtCO2 yr−1 at US$ 390–415 tCO2−1) (Zhang et al., 2022). Although removals (1.0158 GtCO2 yr−1) through reforestation at US$ 50 tCO2−1 are equivalent to conventional fossil fuel carbon capture and storage (0.9–1.5 GtCO2 yr−1) at US$ 390–415 tCO2−1 in 2060 (Zhang et al., 2022), the cost of removal through reforestation is much smaller than conventional fossil fuel carbon and storage.
Regions vary in price salience of reforestation for mitigating climate change. Price salience intensity of reforestation in China (0.00014) was lower than in the tropics (0.00026). The price salience of reforestation to carbon price is gradually decreasing from the Eastern Economic Belt, Central Economic Belt to the Western Economic Belt. The Eastern Economic Belt is the region with the most developed economy and the most active private economy in China. A large number of free trade zones, special administrative zones, special economic zones, and coastal open cities gather in the Eastern Economic Belt (Chen et al., 2018). The percentage of the output value of non-state enterprises is 79.17, 64.87, and 52.73%, respectively, in the Eastern Economic Belt, Central Economic Belt, and Western Economic Belt. Moreover, the percentage of private reforestation areas is 66.33, 49.88, and 54.95%, respectively, in the Eastern Economic Belt, Central Economic Belt, and Western Economic Belt. In fact, in the central and western regions, the state economy is extremely important, while the private sector is often weaker than that of the Eastern Economic Belt (Li et al., 2018). The active degree of the private economy is an important reason for the evolution of reforestation price salience.
The price salience coefficient of reforestation on potential agricultural revenue is 0.00016 in the Western Economic Belt, which is broadly inconsistent with the findings of determinants of reforestation in tropical (Latin America, Africa, and Asia), Central Economic Belt, and Eastern Economic Belt (Busch et al., 2019). An important reason for this result is the difference in natural conditions. The default non-agricultural ecological land cover in most of the tropics, Central Economic Belt, and Eastern Economic Belt is forest. In wetter areas such as the tropics, Central Economic Belt, and Eastern Economic Belt, where natural conditions are adequate for forestry and agriculture, the expected income becomes the key to the choice between forest or agriculture. Thus, there is a trade-off between agriculture and reforestation on the same land in the Eastern Economic Belt, Central Economic Belt, and the tropics. However, most of the Western Economic Belt is located in ecologically fragile areas with very low precipitation and temperature and over 3,000 meters in altitude (Herzschuh et al., 2019; Wu et al., 2020). This fragile natural condition imposes additional constraints on agriculture and forests. That is, regions, where natural conditions cannot satisfy forests, are usually difficult to satisfy agriculture. This constraint forces a symbiosis between agriculture and vegetation in ecologically fragile areas (Ran et al., 2013). Due to the fragility of ecosystems, sustainable agriculture depends on stable ecosystems covered by vegetation. Revegetation resulting from carbon price incentives will reduce wind and sand, soil erosion, and vegetation degradation, and enhance ecosystem stability (Wu et al., 2020), which will simultaneously enhance the sustainability of agriculture and ultimately farm income (Wen et al., 2019). However, the choice of vegetation and restoration methods (plantation or natural regrowth) is still uncertain in ecologically fragile areas, which is important for both carbon dioxide removal and agriculture.
Notably, the price salience of reforestation may face potential challenges and constraints that cannot be fully anticipated. Some studies around the world (White et al., 2018; Grainger, 2020) pointed out that not owning land may inhibit long-term investment such as reforestation, unless the carbon compensation to offset the reforestation investment is received in the period of the management right. Notably, the term of private contracts for forests across China is 30–70 years (Xu and Hyde, 2019). In addition to all the other potential challenges of long-term investment (economic, financial, policy, etc.) that private operators need to face, China’s forest operators will be exposed to the risk of international carbon price fluctuations in the future, which may not be easily coped with by their domestic operational experience from the past. These risks will need to be estimated and quantified in future studies. Carbon compensation payments (purchasing forest-based carbon offsets) have additionality in Brazil (Sonter et al., 2015), Congo (Hubau et al., 2020), Indonesia (Steckel et al., 2021), etc., as these countries face substantial deforestation and forest degradation. The additionality makes carbon compensation payments attractive. However, carbon compensation payments may not have significant additionality in China, due to the widespread presence of government-led large-scale afforestation (Zhang et al., 2000; Wang et al., 2020; Winkler et al., 2021).
Despite our efforts to incorporate major factors (Griscom et al., 1794; Busch et al., 2019) (biome type, elevation, slope, protected areas, forest age, price salience, etc.) influencing land use in the estimates, it’s important to note that personal preferences, religions, cultures, political instability, economic uncertainties, and other socioeconomic factors, which are challenging to quantify, may also play a role in affecting land-use change (Lu et al., 2022). These factors may introduce additional uncertainty into our estimates. Nonetheless, with carbon neutrality being identified as a long-term national strategy (Mallapaty, 2020), carbon removal through forests has become one of the goals of forest management in state forests (Tong et al., 2020). The spatial extent and potential for low-cost CO2 removal through China’s reforestation can help operators (state or private) prioritize the most cost-effective actions.
Our findings provide useful insights for research and policy in four main ways. First, our results find extensive cost potential for CO2 removal through afforestation in China which fills the research gap on the cost potential of carbon removal in China and sheds light on the important role of China’s afforestation in future global climate mitigation. Second, our results find that the stereotype that reforestation will not respond to price incentives or costs in China should be changed. This study not only confirms that MAC curves about carbon dioxide removal through reforestation apply to China as well, but also the significant response of reforestation to cost, which fills the research gap. Third, our results reveal priority areas for low-cost carbon removal through reforestation in China for the first time and confirm the significant spatial heterogeneity in the cost potential of carbon dioxide removal. The price salience of reforestation for mitigating climate change varies across the Western Economic Belt, Eastern Economic Belt, and Central Economic Belt. Targeting reforestation policies to regions with the greatest potential for low-cost CO2 removal would significantly reduce the cost burden. This could form a basis for ambitious national targets of achieving carbon neutrality by 2060 in China. Fourth, the potential for carbon dioxide removal through reforestation is constrained by socio-economic factors such as the proportion of private reforestation and active degree of private economy. The marketization process of the forest industry facilitates the enhancement of cost potential for CO2 removal through reforestation. The challenges to China’s commitment to the world to achieve carbon neutrality before 2060 are some of the greatest faced by China. If reforestation policies are well-planned and implemented, they can make substantial headway toward addressing them.
The original contributions presented in the study are included in the article/Supplementary material, further inquiries can be directed to the corresponding author.
XZ: data curation, formal analysis, writing – original draft, writing – review and editing, funding acquisition, investigation, funding acquisition, visualization, and editing. JB: writing – review and editing, methodology, resources, data curation, conceptualization, and editing. YH: supervision, project administration, and funding acquisition. LF: conceptualization, software, resources, writing – review and editing, methodology, data curation, and editing. HQ: writing – original draft, validation, writing – review and editing, and funding acquisition. ZQ: investigation, formal analysis, data curation, visualization. All authors contributed to the article and approved the submitted version.
This study was made possible with the financial support from the National Science Foundation (Grant No. 31700562), the National Social Science Fund of China (Grant No. 22CGL064), Research Project of Philosophy and Social Sciences in Heilongjiang Province (Grant No. 21JLB084), type D project of special fund for basic scientific research operation fees of central universities (Grant Nos. 2572020DZ09 and 2572020DY06), and Key Research and Development Program of Shaanxi (Grant No. 2021SF2-01). We also acknowledge the financial support from the China Scholarship Council.
We thank the experts who substantially commented on the manuscript. We are grateful for the writing suggestions and revisions from Lingtong Gai of Wageningen University.
The authors declare that the research was conducted in the absence of any commercial or financial relationships that could be construed as a potential conflict of interest.
All claims expressed in this article are solely those of the authors and do not necessarily represent those of their affiliated organizations, or those of the publisher, the editors and the reviewers. Any product that may be evaluated in this article, or claim that may be made by its manufacturer, is not guaranteed or endorsed by the publisher.
The Supplementary material for this article can be found online at: https://www.frontiersin.org/articles/10.3389/ffgc.2023.1229216/full#supplementary-material
Anderson-Teixeira, K. J., Herrmann, V., Morgan, R. B., Bond-Lamberty, B., Cook-Patton, S. C., Ferson, A. E., et al. (2021). Carbon cycling in mature and regrowth forests globally. Environ. Res. Lett. 16:53009. doi: 10.1088/1748-9326/abed01
Austin, K. G., Baker, J. S., Sohngen, B. L., Wade, C. M., Daigneault, A., Ohrel, S. B., et al. (2020). The economic costs of planting, preserving, and managing the world’s forests to mitigate climate change. Nat. Commun. 11:5946. doi: 10.1038/s41467-020-19578-z
Busch, J., and Engelmann, J. (2017). Cost-effectiveness of reducing emissions from tropical deforestation, 2016–2050. Environ. Res. Lett. 13:015001. doi: 10.1088/1748-9326/aa907c
Busch, J., Engelmann, J., Cook-Patton, S. C., Griscom, B. W., Kroeger, T., Possingham, H., et al. (2019). Potential for low-cost carbon dioxide removal through tropical reforestation. Nat. Clim. Chang. 9, 463–466. doi: 10.1038/s41558-019-0485-x
Busch, J., and Ferretti-Gallon, K. (2017). What Drives Deforestation and What Stops It? A Meta-Analysis. Review of Environmental Economics and Policy. 11, 3–23. doi: 10.1093/reep/rew013
Cao, S. X. (2011). Impact of China’s large-scale ecological restoration program on the environment and Society in Arid and Semiarid Areas of China: achievements, problems, synthesis, and applications. Crit. Rev. Environ. Sci. Technol. 41, 317–335. doi: 10.1080/10643380902800034
Chen, C., Park, T., Wang, X. H., Piao, S. L., Xu, B. D., Chaturvedi, R. K., et al. (2019). China and India lead in greening of the world through land-use management. Nat. Sustain. 2, 122–129. doi: 10.1038/s41893-019-0220-7
Chen, J. H., Wan, Z., Zhang, F. W., Park, N. K., Zheng, A. B., and Zhao, J. (2018). Evaluation and comparison of the development performances of typical free trade port zones in China. Trans. Res. Part A Policy Pract. 118, 506–526. doi: 10.1016/j.tra.2018.09.009
Chinese Academy of Sciences. (2020). SRTM 90m Digital Elevation Data from Computer Network Information Center, Chinese Academy of Sciences. Geospatial Data Cloud site. Available at: https://www.gscloud.cn/sources/accessdata/305?pid=302
Chow, G. C. (1997). Challenges of China's economic system for economic theory. Am. Econ. Rev. 87, 321–327.
Dinerstein, E., Olson, D., Joshi, A., Vynne, C., Burgess, N. D., Wikramanayake, E., et al. (2017). An ecoregion-based approach to protecting half the terrestrial realm. Bioscience 67, 534–545. doi: 10.1093/biosci/bix014
Duan, H. B., Zhou, S., Jiang, K. J., Bertram, C., Harmsen, M., Kriegler, E., et al. (2021). Assessing China’s efforts to pursue the 1.5 degrees C warming limit. Science 372:378. doi: 10.1126/science.aba8767
Favero, A., Daigneault, A., and Sohngen, B. (2020). Forests: carbon sequestration, biomass energy, or both? Sci. Adv. 6:eaay6792. doi: 10.1126/sciadv.aay6792
Feng, D., Bao, W., Yang, Y., and Fu, M. (2021). How do government policies promote greening? Evidence from China. Land Use Policy 104:105389. doi: 10.1016/j.landusepol.2021.105389
Grainger, A. (2020). “Compensating for opportunity costs in forest-based global climate change mitigation” in Economics of carbon sequestration in forestry. ed. T. J. Logan (Boca Raton: CRC Press), S163–S176.
Griscom, B. W., Busch, J., Cook-Patton, S. C., Ellis, P. W., Funk, J., Leavitt, S. M., et al. (1794). National mitigation potential from natural climate solutions in the tropics. Philos. Trans. R. Soc. Lond. Ser. B Biol. Sci. 375:20190126. doi: 10.1098/rstb.2019.0126
group, P. s. r. w. (2020). Research on China’s long-term low carbon development strategy and transformation path. China Populat. Resour. Environ. 30, 1–25.
Gullison, R. E., Frumhoff, P. C., Canadell, J. G., Field, C. B., Nepstad, D. C., Hayhoe, K., et al. (2007). Tropical forests and climate policy. Science 316, 985–986. doi: 10.1126/science.1136163
Hawes, M. (2018). Planting carbon storage. Nat. Clim. Chang. 8, 556–558. doi: 10.1038/s41558-018-0214-x
Heinrich, V. H. A., Dalagnol, R., Cassol, H. L. G., Rosan, T. M., de Almeida, C. T., Silva, C. H. L., et al. (2021). Large carbon sink potential of secondary forests in the Brazilian Amazon to mitigate climate change. Nat. Commun. 12:1785. doi: 10.1038/s41467-021-22050-1
Herzschuh, U., Cao, X. Y., Laepple, T., Dallmeyer, A., Telford, R. J., Ni, J., et al. (2019). Position and orientation of the westerly jet determined Holocene rainfall patterns in China. Nat. Commun. 10:10. doi: 10.1038/s41467-019-09866-8
Huang, W. (2019). Forest condition change, tenure reform, and government-funded eco-environmental programs in Northeast China. Forest Policy Econ. 98, 67–74. doi: 10.1016/j.forpol.2018.09.003
Hubau, W., Lewis, S. L., Phillips, O. L., Affum-Baffoe, K., Beeckman, H., Cuní-Sanchez, A., et al. (2020). Asynchronous carbon sink saturation in African and Amazonian tropical forests. Nature 579, 80–87. doi: 10.1038/s41586-020-2035-0
Hyde, W. F. (2019). The experience of China's forest reforms: what they mean for China and what they suggest for the world. Forest Policy Econ. 98, 1–7. doi: 10.1016/j.forpol.2018.09.009
Jiang, X. M., Wang, H. J., and Xia, Y. (2020). Economic structural change, renewable energy development, and carbon dioxide emissions in China. Mitig. Adapt. Strateg. Glob. Chang. 25, 1345–1362. doi: 10.1007/s11027-020-09921-6
Kesicki, F., and Strachan, N. (2011). Marginal abatement cost (MAC) curves: confronting theory and practice. Environ. Sci. Pol. 14, 1195–1204. doi: 10.1016/j.envsci.2011.08.004
Knoben, W. J., Freer, J. E., and Woods, R. A. (2019). Inherent benchmark or not? Comparing Nash–Sutcliffe and Kling–Gupta efficiency scores. Hydrol. Earth Syst. Sci. 23, 4323–4331. doi: 10.5194/hess-23-4323-2019
Koch, A., and Kaplan, J. O. (2022). Tropical forest restoration under future climate change. Nat. Clim. Change 12:279. doi: 10.1038/s41558-022-01289-6
Koh, L. P., Zeng, Y. W., Sarira, T. V., and Siman, K. (2021). Carbon prospecting in tropical forests for climate change mitigation. Nat. Commun. 12:1. doi: 10.1038/s41467-021-21560-2
Koppa, A., Rains, D., Hulsman, P., Poyatos, R., and Miralles, D. G. (2022). A deep learning-based hybrid model of global terrestrial evaporation. Nat. Commun. 13:1912. doi: 10.1038/s41467-022-29543-7
Li, Z. L., Liu, X. J., and Zhang, Q. (2018). The dynamic evolution of the scale and performance of listed companies under the background of mixed ownership reform. J. Quant. Tech. Econ. 38, 96–113.
Li, Y., Piao, S., Chen, A., Ciais, P., and Li, L. Z. X. (2020). Local and teleconnected temperature effects of afforestation and vegetation greening in China. Natl. Sci. Rev. 7, 897–912. doi: 10.1093/nsr/nwz132
Liu, Z., Deng, Z., He, G., Wang, H. L., Zhang, X., Lin, J., et al. (2022). Challenges and opportunities for carbon neutrality in China. Nat. Rev. Earth Environ. 3, 141–155. doi: 10.1038/s43017-021-00244-x
Lu, N., Tian, H., Fu, B., Yu, H., Piao, S., Chen, S., et al. (2022). Biophysical and economic constraints on China’s natural climate solutions. Nat. Clim. Chang. 12, 847–853. doi: 10.1038/s41558-022-01432-3
Mallapaty, S. J. N. (2020). How China could be carbon neutral by mid-century. Nature 586, 482–483. doi: 10.1038/d41586-020-02927-9
Masuda, Y. J., Garg, T., Anggraeni, I., Ebi, K., Krenz, J., Game, E. T., et al. (2021). Warming from tropical deforestation reduces worker productivity in rural communities. Nat. Commun. 12:1. doi: 10.1038/s41467-021-21779-z
Mitchard, E. T. (2018). The tropical forest carbon cycle and climate change. Nature 559, 527–534. doi: 10.1038/s41586-018-0300-2
Mokany, K., Raison, R. J., and Prokushkin, A. S. (2006). Critical analysis of root: shoot ratios in terrestrial biomes. Glob. Chang. Biol. 12, 84–96. doi: 10.1111/j.1365-2486.2005.001043.x
Murdiyarso, D., Purbopuspito, J., Kauffman, J. B., Warren, M. W., Sasmito, S. D., Donato, D. C., et al. (2015). The potential of Indonesian mangrove forests for global climate change mitigation. Nat. Clim. Chang. 5, 1089–1092. doi: 10.1038/nclimate2734
Nachtergaele, F., van Velthuizen, H., Verelst, L., Wiberg, D., Henry, M., Chiozza, F., et al. Harmonized world soil database version 2.0. Rome: Food and Agriculture Organization of the United Nations. (2023).
Naidoo, R., and Iwamura, T. J. B. C. (2007). Global-scale mapping of economic benefits from agricultural lands: implications for conservation priorities 140, 40–49. doi: 10.1016/j.biocon.2007.07.025,
National Science and Technology Infrastructure of China. (2023). The eighth national forest distribution map, National Forestry and Grassland Science Data Center, CSTR:17575.11.0120231024004.0000.V1. Available at: https://www.forestdata.cn/dataDetail.html?id=610c734e-3265-460f-8322-2b678289674e
O'Meara, S. (2021). Biodiversity’s importance is growing in China's urban agenda. Nature 591, S1–S3. doi: 10.1038/d41586-021-00596-w
Pennisi, E. (2020). Climate change tropical forests store carbon despite warming. Science 368:813. doi: 10.1126/science.368.6493.813
Piao, S. L., Wang, X. H., Park, T., Chen, C., Lian, X., He, Y., et al. (2020). Characteristics, drivers and feedbacks of global greening. Nat. Rev. Earth Environ. 1, 14–27. doi: 10.1038/s43017-019-0001-x
Potapov, P., Hansen, M. C., Pickens, A., Hernandez-Serna, A., Tyukavina, A., Turubanova, S., et al. (2022). The global 2000-2020 land cover and land use change dataset derived from the Landsat archive: first results. Front. Remote Sens. 3:856903. doi: 10.3389/frsen.2022.856903
Ran, L. S., Lu, X. X., and Xu, J. C. (2013). Effects of vegetation restoration on soil conservation and sediment loads in China: a critical review. Crit. Rev. Environ. Sci. Technol. 43, 1384–1415. doi: 10.1080/10643389.2011.644225
Rochedo, P. R. R., Filho, B., Schaeffer, R., Viola, E., Szklo, A., Lucena, A. F. P., et al. (2018). The threat of political bargaining to climate mitigation in Brazil. Nat. Clim. Change 8:695. doi: 10.1038/s41558-018-0213-y
Sathaye, J., Makundi, W., Dale, L., Chan, P., and Andrasko, K. (2006). (Special Issue#). GHG mitigation potential, costs and benefits in global forests: a dynamic partial equilibrium approach. Energ. J. 3, 127–162.
Shan, Y. L., Huang, Q., Guan, D. B., and Hubacek, K. (2020). China CO2 emission accounts 2016-2017. Sci. Data 7:1. doi: 10.1038/s41597-020-0393-y
Sohngen, B., and Mendelsohn, R. (2003). An optimal control model of forest carbon sequestration. Am J Agr Econ 85, 448–457. doi: 10.1111/1467-8276.00133
Sonter, L. J., Barrett, D. J., Moran, C. J., and Soares-Filho, B. S. (2015). Carbon emissions due to deforestation for the production of charcoal used in Brazil’s steel industry. Nat. Clim. Change 5, 359–363. doi: 10.1038/nclimate2515
Staal, A., Fetzer, I., Wang-Erlandsson, L., Bosmans, J. H. C., Dekker, S. C., van Nes, E. H., et al. (2020). Hysteresis of tropical forests in the 21st century. Nat. Commun. 11:4978. doi: 10.1038/s41467-020-18728-7
Stavins, R. N. (1999). The costs of carbon sequestration: a revealed-preference approach. Am. Econ. Rev. 89, 994–1009. doi: 10.1257/aer.89.4.994
Steckel, J. C., Dorband, I. I., Montrone, L., Ward, H., Missbach, L., Hafner, F., et al. (2021). Distributional impacts of carbon pricing in developing Asia. Nat. Sustain. 4:1005. doi: 10.1038/s41893-021-00758-8
Strassburg, B. B. N., Iribarrem, A., Beyer, H. L., Cordeiro, C. L., Crouzeilles, R., Jakovac, C. C., et al. (2020). Global priority areas for ecosystem restoration. Nature 586, 724–729. doi: 10.1038/s41586-020-2784-9
Tang, R., Zhao, J., Liu, Y. F., Huang, X., Zhang, Y. X., Zhou, D. R., et al. (2022). Air quality and health co-benefits of China's carbon dioxide emissions peaking before 2030. Nat. Commun. 13:1008. doi: 10.1038/s41467-022-28672-3
Tavoni, M., Sohngen, B., and Bosetti, V. (2007). Forestry and the carbon market response to stabilize climate. Energ. Policy 35, 5346–5353. doi: 10.1016/j.enpol.2006.01.036
Tong, X., Brandt, M., Yue, Y., Ciais, P., Rudbeck Jepsen, M., Penuelas, J., et al. (2020). Forest management in southern China generates short term extensive carbon sequestration 11, 129. doi: 10.1038/s41467-019-13798-8,
IUCN and UNEP-WCMC. (2020). The World Database on Protected Areas (WDPA) [https://www.protectedplanet.net/en/search-areas?filters%5Bdb_type%5D%5B%5D=wdpa&geo_type=region], [08/2020], Cambridge, UK: UNEP-WCMC. Available at: www.protectedplanet.net
Veldman, J. W., Overbeck, G. E., Negreiros, D., Mahy, G., Le Stradic, S., Fernandes, G. W., et al. (2015). Where tree planting and forest expansion are bad for biodiversity and ecosystem services. Bioscience 65, 1011–1018. doi: 10.1093/biosci/biv118
Vergopolan, N., Chaney, N. W., Pan, M., Sheffield, J., Beck, H. E., Ferguson, C. R., et al. (2021). SMAP-HydroBlocks, a 30-m satellite-based soil moisture dataset for the conterminous US. Sci. Data 8:264. doi: 10.1038/s41597-021-01050-2
Wang, F. T., An, P. L., Huang, C., Zhang, Z., and Hao, J. M. (2018). Is afforestation-induced land use change the main contributor to vegetation dynamics in the semiarid region of North China? Ecol. Indic. 88, 282–291. doi: 10.1016/j.ecolind.2017.12.061
Wang, J., Feng, L., Palmer, P. I., Liu, Y., Fang, S., Bösch, H., et al. (2020). Large Chinese land carbon sink estimated from atmospheric carbon dioxide data. Nature 586, 720–723. doi: 10.1038/s41586-020-2849-9
Wang, H. K., Lu, X., Deng, Y., Sun, Y. G., Nielsens, C. P., Li, Y. F., et al. (2019). China’s CO2 peak before 2030 implied from characteristics and growth of cities. Nat. Sustain. 2, 748–754. doi: 10.1038/s41893-019-0339-6
Wang, S., van Kooten, G. C., and Wilson, B. (2004). Mosaic of reform: forest policy in post-1978 China. Forest Policy Econ. 6, 71–83. doi: 10.1016/S1389-9341(02)00078-3
Wen, X., Deng, X. Z., and Zhang, F. (2019). Scale effects of vegetation restoration on soil and water conservation in a semi-arid region in China: resources conservation and sustainable for management. Resour. Conserv. Recycling 151:104474. doi: 10.1016/j.resconrec.2019.104474
White, A. E., Lutz, D. A., Howarth, R. B., and Soto, J. R. J. P. O. (2018). Small-scale forestry and carbon offset markets: an empirical study of Vermont current use forest landowner willingness to accept carbon credit programs 13:e0201967. doi: 10.1371/journal.pone.0201967,
White, L. J. T., Masudi, E. B., Ndongo, J. D., Matondo, R., Soudan-Nonault, A., Ngomanda, A., et al. (2021). Congo Basin rainforest – invest US$150 million in science. Nature 598, 411–414. doi: 10.1038/d41586-021-02818-7
Winkler, K., Fuchs, R., Rounsevell, M., and Herold, M. (2021). Global land use changes are four times greater than previously estimated. Nat. Commun. 12:1. doi: 10.1038/s41467-021-22702-2
Wu, J., Gong, Y. Z., and Wu, J. J. (2018). Spatial distribution of nature reserves in China: driving forces in the past and conservation challenges in the future. Land Use Policy 77, 31–42. doi: 10.1016/j.landusepol.2018.05.021
Wu, G. L., Liu, Y. F., Cui, Z., Liu, Y., Shi, Z. H., Yin, R., et al. (2020). Trade-off between vegetation type, soil erosion control and surface water in global semi-arid regions: a meta-analysis. J. Appl. Ecol. 57, 875–885. doi: 10.1111/1365-2664.13597
Xi, Y., Peng, S., Liu, G., Ducharne, A., Ciais, P., Prigent, C., et al. (2022). Trade-off between tree planting and wetland conservation in China. Nat. Commun. 13:1967. doi: 10.1038/s41467-022-29616-7
Xu, X. (2023). Multi-year data on the boundaries of provincial administrative divisions in China. Resource Environ. Sci. Data Registry Publish Syst. Available at: https://www.resdc.cn/DOI/DOI.aspx?DOIID=120
Xu, J., and Hyde, W. F. (2019). China's second round of forest reforms: observations for China and implications globally. For. Policy Econ. 98, 19–29. doi: 10.1016/j.forpol.2018.04.007
Yan, Y. P. (2019). Unintended land use effects of afforestation in China’s grain for green program. Am. J. Agric. Econ. 101, 1047–1067. doi: 10.1093/ajae/aay107
Yang, G. J., Li, J. H., and Zhou, L. H. (2021). Considerations on forest changes of Northwest China in past seven decades. Front. Environ. Sci. 9:9. doi: 10.3389/fenvs.2021.589896
Yang, Y. T., Qu, S., Cai, B. F., Liang, S., Wang, Z. H., Wang, J. N., et al. (2020). Mapping global carbon footprint in China. Nat. Commun. 11:2237. doi: 10.1038/s41467-020-15883-9
Yang, L., Wang, Y. T., Wang, R. R., Klemes, J. J., de Almeida, C., Jin, M. Z., et al. (2020). Environmental-social-economic footprints of consumption and trade in the Asia-Pacific region. Nat. Commun. 11:4490. doi: 10.1038/s41467-020-18338-3
Zhang, X. L., Huang, X. D., Zhang, D., Geng, Y., Tian, L. X., Fan, Y., and Chen, W. Y. (2022). Research on the pathway and policies for China's energy andEconomy transformation toward carbon neutrality. Manage. World. 38, 35–66.
Keywords: climate change mitigation, reforestation, marginal abatement cost (MAC) curves, China, carbon dioxide removal
Citation: Zhang X, Busch J, Huang Y, Fleskens L, Qin H and Qiao Z (2023) Cost of mitigating climate change through reforestation in China. Front. For. Glob. Change. 6:1229216. doi: 10.3389/ffgc.2023.1229216
Edited by:
Manfred J. Lexer, University of Natural Resources and Life Sciences, Vienna, AustriaReviewed by:
Yongzhe Chen, Chinese Academy of Sciences (CAS), ChinaCopyright © 2023 Zhang, Busch, Huang, Fleskens, Qin and Qiao. This is an open-access article distributed under the terms of the Creative Commons Attribution License (CC BY). The use, distribution or reproduction in other forums is permitted, provided the original author(s) and the copyright owner(s) are credited and that the original publication in this journal is cited, in accordance with accepted academic practice. No use, distribution or reproduction is permitted which does not comply with these terms.
*Correspondence: Yingli Huang, eWxodWFuZ25lZnVAMTYzLmNvbQ==
Disclaimer: All claims expressed in this article are solely those of the authors and do not necessarily represent those of their affiliated organizations, or those of the publisher, the editors and the reviewers. Any product that may be evaluated in this article or claim that may be made by its manufacturer is not guaranteed or endorsed by the publisher.
Research integrity at Frontiers
Learn more about the work of our research integrity team to safeguard the quality of each article we publish.