
95% of researchers rate our articles as excellent or good
Learn more about the work of our research integrity team to safeguard the quality of each article we publish.
Find out more
ORIGINAL RESEARCH article
Front. For. Glob. Change , 31 August 2023
Sec. Forest Management
Volume 6 - 2023 | https://doi.org/10.3389/ffgc.2023.1223605
This article is part of the Research Topic The Utilization and Management of Forest Resources in South and Southeast Asia View all 5 articles
 Yi Wang1,2†
 Chiwei Xiao2,3*†
Laos, the only landlocked country in Mainland Southeast Asia (MSEA), has established over 40 geopolinomical mechanisms with its neighboring countries (including China, Vietnam, Cambodia, Thailand, and Myanmar), leading to significant land-use change (LUC) in the border areas. However, the spatial characteristics and national differences of LUC in the border areas of Laos remain unknown. Through the use of land-use products from 1985 to 2020 and by employing GIS spatial analysis, the results indicate that (1) LUC along the Laos border has led to severe and extensive deforestation, primarily attributed to the rapid expansion of construction land and the consistent growth of cropland. (2) With strengthened border cooperation, differences between LUC in Laos and its neighboring countries have decreased since 1985. (3) Cropland and construction land on the Laos–China and Laos–Thailand borders show obvious bordering characteristics, with increasing land-use homogeneity in near-border areas. In contrast, the Laos–Vietnam, Laos–Cambodia, and Laos–Myanmar borders display the opposite trend. (4) Port areas (e.g., Boten–Mohan port) driven by geopolinomical relations have drastic LUC, but they have huge differences. This study provides a database for quantitative research on the interaction between geopolinomical relations and border LUC to promote border geography, including impact and response.
In recent times, economic globalization, regional cooperation, and integration have been deepening, leading to increased geopolinomical collaboration among countries (Van Houtum, 2005). As the spatial carrier and forefront for exerting geopolinomical influence and implementing geopolinomical strategy, national border areas are experiencing rapid and widespread land-use change (LUC). According to statistics from the European Space Agency's Global Land Cover Data Survey, border areas, which occupy ~1/12 of the global land area, have disproportionately contributed to ~1/3 of global LUC since 1990 (Xiao et al., 2021). Therefore, it is critical to understand the spatiotemporal characteristics and regional differences of border LUC to facilitate cooperation among neighboring countries and formulate effective land policies.
Recently, analyses of LUC from different perspectives have been conducted, such as an analysis of landscape patterns (Tscharntke et al., 2005), spatiotemporal variations (Zhai et al., 2022), drivers (Tian et al., 2014), mapping dynamics (Hu et al., 2021), and simulation prediction (Veldkamp and Lambin, 2001). LUC studies have mainly focused on areas with significant human activity (Han et al., 2015), fragile ecological environments (Li et al., 2013), or global impact (Deadman et al., 2004). However, LUC studies in borderlands and/or its geopolinomical impacts began to receive increasing attention worldwide until the 1990s, and some relevant studies discussed the following: LUC under border armed conflicts (Zheng et al., 2022), the impact of socioeconomic mutation (Revolutions of 1989) on land cover and landscape differences in the Ukrainian–Polish–Czech border region (Kuemmerle et al., 2006), the relationship between green infrastructure construction and different land cover categories and structural functions in the Austrian–Hungarian border region (Kuttner et al., 2013), sustainable land-use development along the Amazon basin due to border transportation facilities (Perz et al., 2013), spatiotemporal changes in land-use sustainability in the southwestern border mountains in China's Yunnan Province (Yang et al., 2022), and the disturbance of terrestrial ecology by wildfires in the China–Mongolia–Russia cross-border areas (Li et al., 2023). Border areas are becoming increasingly active zones for LUC, but most relevant studies are limited to armed conflict, infrastructure construction, and ecological and environmental effects. Studies on the cross-interaction between geopolinomical cooperation and borderland use remain scarce, and those quantifying these interactions from the perspective of national differences have seldom been reported or are in the initial stage (Xiao et al., 2021).
As the only landlocked country in Mainland Southeast Asia (MSEA), Laos has distinct geographical features, sharing its border with China, Vietnam, Cambodia, Thailand, and Myanmar. Since the implementation of the New Economic Mechanism in 1986, its geopolinomical relations with neighboring regions have shifted from close to open (Li et al., 2018). This has contributed to collaboration in infrastructure construction, resource development, and trade exchanges, resulting in extensive LUC in border areas, including forest loss, rubber boom and expansion of port areas (Liu et al., 2016; Li and Xiao, 2022). To determine how geopolinomical relations impact LUC in border areas, it is necessary to accurately monitor border LUC and understand its spatiotemporal processes, geographical characteristics, and national differences. To date, some studies have focused on regional scales such as provinces, watersheds, or certain cities, such as Bokeo Province in Laos (Boundeth et al., 2012) and the Mekong River Basin (Zhai et al., 2022), lacking systematic and comprehensive LUC studies in border areas (Zhang et al., 2022). Moreover, most studies focused on a single typical land type, such as the recovery of agriculture and fallow vegetation in northern Laos (Liao et al., 2015), the expansion of construction land in the Boten (Laos)–Mohan (China) border port (Li and Xiao, 2022), or the expansion of rubber plantations across national borders in Chinese border (Xiao et al., 2019). Therefore, there is still a need for comprehensive and quantitative studies on spatiotemporal comparisons of borderland LUC in the geopolinomical context.
Following the formula of “from the overall region (the whole border areas) to the local areas (different countries) and from polygons to points (typical ports)”, take Laos, for example, this study aims to (1) reveal the dynamic LUC process and spatiotemporal patterns in border areas among Laos and its neighbors from 1985 to 2020 and (2) analyse national variations in border LUC from the perspective of dominant LUC characteristics, such as the expansion of cropland and construction land and forest loss, within the context of regional cooperation. This study not only provides guidance for land-use management and structural optimisation in the border areas of Laos but also provides a reference for cross-interaction research on LUC and geopolinomical relations from the perspective of geographical space.
The border areas of Laos are adjacent to its borders with China, Vietnam, Cambodia, Thailand, and Myanmar (Figure 1). Laos' northern border with China's Yunnan Province extends 505 km. In the east, the border with Vietnam is bound by the Annamite Range (or Truong Son Ra) for 2,161 km. In the south, the border with Cambodia is bound by the Dângrêk Range for 555 km. In the west, the border with Thailand crosses the Mekong River and Luang Prabang Range for 1,754 km, with the north-western portion adjacent to the Myanmar Range for 236 km. International border studies and border management have different standards regarding the extent of border areas. For instance, Russia defines the border zone as a 5 km buffer around the borderline, while China, the EU, and the US have defined their border stripe as an area of 20, 30, and 60 km, respectively (Flesch et al., 2010; Medeiros, 2018). Considering Laos' characteristics, such as its territorial shape, the distribution of economic cooperation zones, and border-area ports, this study determines the border areas as being within 30 km of the national boundary. The average altitude of the border areas is over 1,070 m, with a topography that is high in the northeast and low in the southwest. The region has a typical tropical monsoon climate with dry (November to May) and rainy (June to October) seasons throughout the year and an average annual temperature of nearly 30°C. The border areas of Laos have abundant natural resources and diverse land-use types, making them an important area for traditional slash-and-burn farming and cross-border rubber cultivation (Liu et al., 2016).
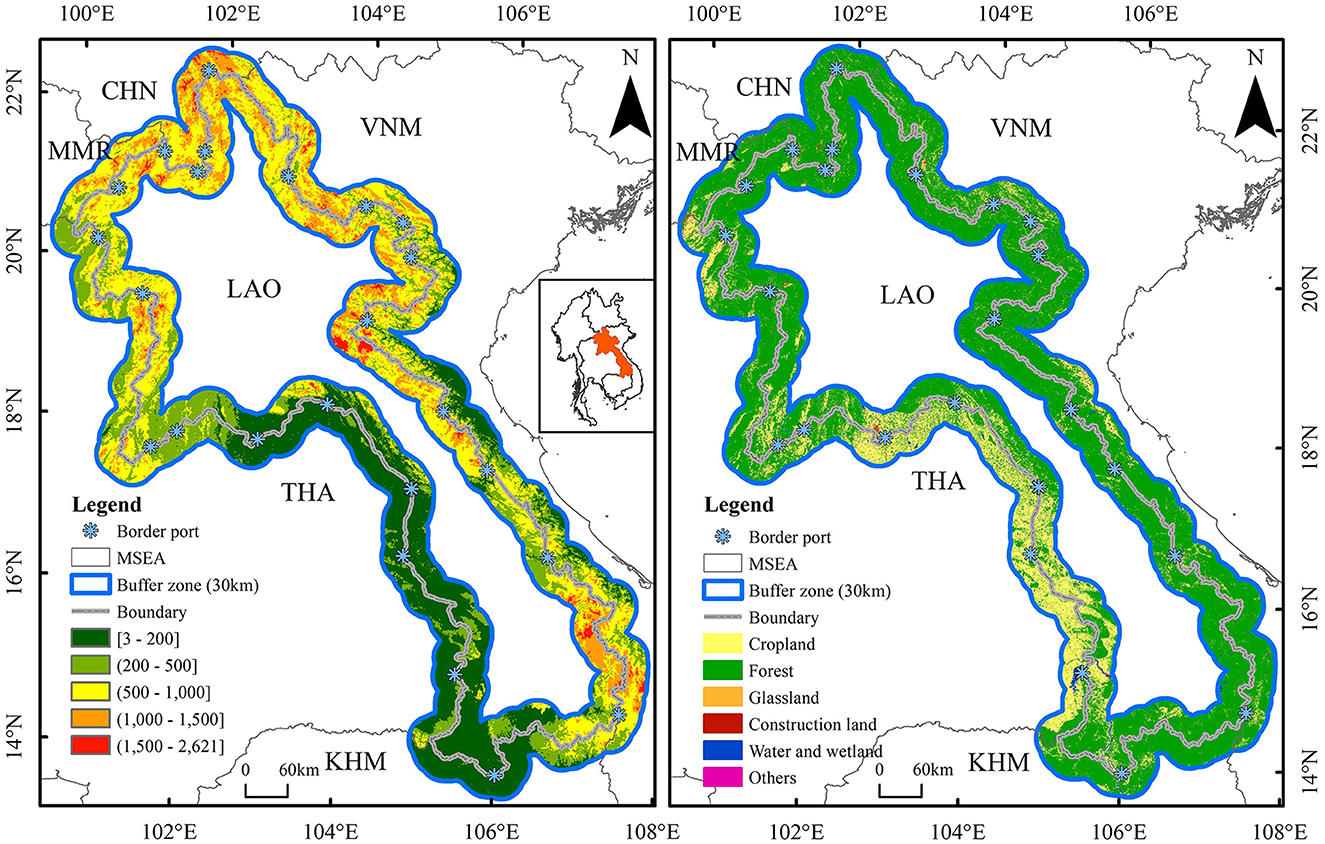
Figure 1. Topographic and land-use map of the 30 km buffer area of the Laos's border in 2020 (LAO refers to Laos, CHN refers to China, VNM refers to Vietnam, KHM refers to Cambodia, THA refers to Thailand, and MMR refers to Myanmar).
Given its characteristics as both landlocked and one of the world's least developed countries, Laos' economic development has been greatly impacted by its neighboring countries. This is exemplified by the opening of the China–Laos Railway and the construction of several bridges connecting Laos to Thailand and Myanmar. In addition, due to Laos' unique location, where its capital Vientiane faces Thailand across the Mekong River, its politics and economy exhibit distinct border characteristics. Laos has experienced one of the fastest economic growth rates in the world since the adoption and implementation of the New Economic Mechanism in 1986. According to the World Bank's national accounts data (https://data.worldbank.org.cn), the average annual GDP growth rate in Laos has been 6.3% since 1986. In particular, agriculture accounts for 16.2% of the total GDP in Laos, with the proportion of the population in the agricultural sector comprising more than 80% of the total population.
For the benchmark year, we used 1985, the year before the implementation of the New Economic Mechanism in Laos, and selected eight periods (every 5 years) of land-use products in Laos' border areas based on data availability. The data used in this study were from the GLC_FCS30 products (https://data.casearth.cn/thematic/glc_fcs30) developed in 2020 by the Aerospace Information Research Institute, Chinese Academy of Sciences. The products were successfully produced using the continuous time-series Landsat imagery (Landsat TM, ETM+, and OLI) on the Google Earth Engine platform with a resolution of 30 m and a classification accuracy of more than 82.5% (Zhang et al., 2021). To facilitate a comparative study of border countries, we reclassified the original data into six categories (Supplementary Table 1), considering the main land-use types in Laos' border areas. Our land-use data showed that, since 1985, the total area of cropland, forest, and construction land in Laos' border areas has accounted for ~98.2% of all types on average. Therefore, this study focuses on these three land types (i.e., cropland, forest, and construction land) to explore the spatial and temporal changes and national comparisons of border LUC within a geopolinomical context. However, it should be noted that, due to the limitations of the original land-use products, there may be a risk of tree-based plantations (rubber in particular) being confused for forests.
Buffer zone analysis is an important spatial analysis function in GIS, commonly used in line and point analyses such as along the border and port areas. To quantify the characteristics of spatial and temporal LUCs and country-specific differences at the Laotian border in the geopolinomical context, we conducted spatial overlay and statistical analyses of six buffer zone pairs (i.e., 0–5, 5–10, 10–15, 15–20, 20–25, and 25–30 km) at 5 km intervals along a narrow strip of land within 30 km on both sides of the borderline.
Different land-use categories have different amounts, directions, and speeds of change due to natural and human factors. However, their initial state affects the mutual transition between different land-use types. The land-use transition matrix can capture this change effectively. The matrix (Supplementary Table 1) has rows and columns representing land-use types in two consecutive periods (T1 and T2). The values in the matrix (Pnn, n = 1, 2, …, n) indicate the area of land that changed from one type to another in the two periods. The matrix's mathematical expression is as follows:
where S is the variation area of each land-use type, n is the total types of land use, and i and j are the types of land use at the beginning and end of the study.
Most research on geopolitical relations adopts qualitative methods, whereas geo-economic relations are often studied quantitatively, using techniques such as social network analysis (Wang and Liu, 2020), the Euclidean distance model (Wang et al., 2017), and the Analytic Hierarchy Process (AHP) (Song et al., 2017). However, these studies tend to be event based, thematic, and disjointed. Moreover, they rely mainly on official data and event data analysis methods to examine the evolution of geopolinomical relations, which limits their scope to bilateral relations. To overcome these limitations, we propose characterizing geopolinomical relations based on land-use homogeneity/heterogeneity to provide a more objective and comprehensive perspective.
The land-use homogeneity index (HI) refers to the ratio of the area of a certain type of land use on both sides of the national border to the total of the corresponding area. This was calculated as follows:
where SAi is the area of class i land in country A, SA is the total area of land in country A, SBi is the area of class i land in country B, and SB is the total area in country B. The higher the HI value, the stronger the homogeneity of class i land in countries A and B. This study mainly refers to the ratio of the area of cropland, construction land, and forest within the 30 km buffer zone on both sides of the Laotian borders with China, Vietnam, Cambodia, Thailand, and Myanmar to the corresponding buffer zone. Then, the HI is used to quantitatively reveal country-specific differences in LUC along the Laotian border in the geopolinomical context.
From 1985 to 2020, border LUC in Laos mainly manifested itself in the expansion of cropland and construction land and decreased forests (Supplementary Table 2). Cropland expanded the most, with an increase of 4,615.8 km2 in the last 36 years, followed by construction land, which increased by 1,183.0 km2. Conversely, forest was reduced by 6,631.2 km2. Regarding the magnitude of change, construction land showed the largest growth, nearly doubling in size. Notably, the changes in cropland, construction land, and forest over the 36-year observation period have varied significantly, with cropland expansion and forest shrinkage occurring faster before the year 2000 and slowing down afterwards. During the two phases of 1985–2000 and 2000–2020, there was a 6.4% difference in the cropland growth rate and a 1.3% difference in the forest shrinkage rate. After the year 2000, the expansion of construction land was higher than before 2000, with a difference of 23.7% between the two phases (Supplementary Table 2).
There are clear differences of LUC along the border of Laos during 1985–2020 (Figure 2). Laotian-Thailand border has experienced the most drastic interconversion of cropland and forest, with 4,782.1 km2 of cropland converted to forest and 3,807.3 km2 of forest converted to cropland, mainly in the eastern and northern regions. Notably, the Thai border has seen a significant decrease in cropland in contrast to the overall LUC. Moreover, Laos has experienced the largest cropland expansion due to forest conversion, with 2,559.6 km2 converted since 1985, accounting for ~70.4% of the total LUC area in the country. Finally, construction land has a “scattered overall and highly concentrated locally at port areas” spatial pattern (Figure 3), with over 72.8% of construction land in the study area transformed from cropland, mainly along the Laos–Thailand and Laos–Vietnam borders.
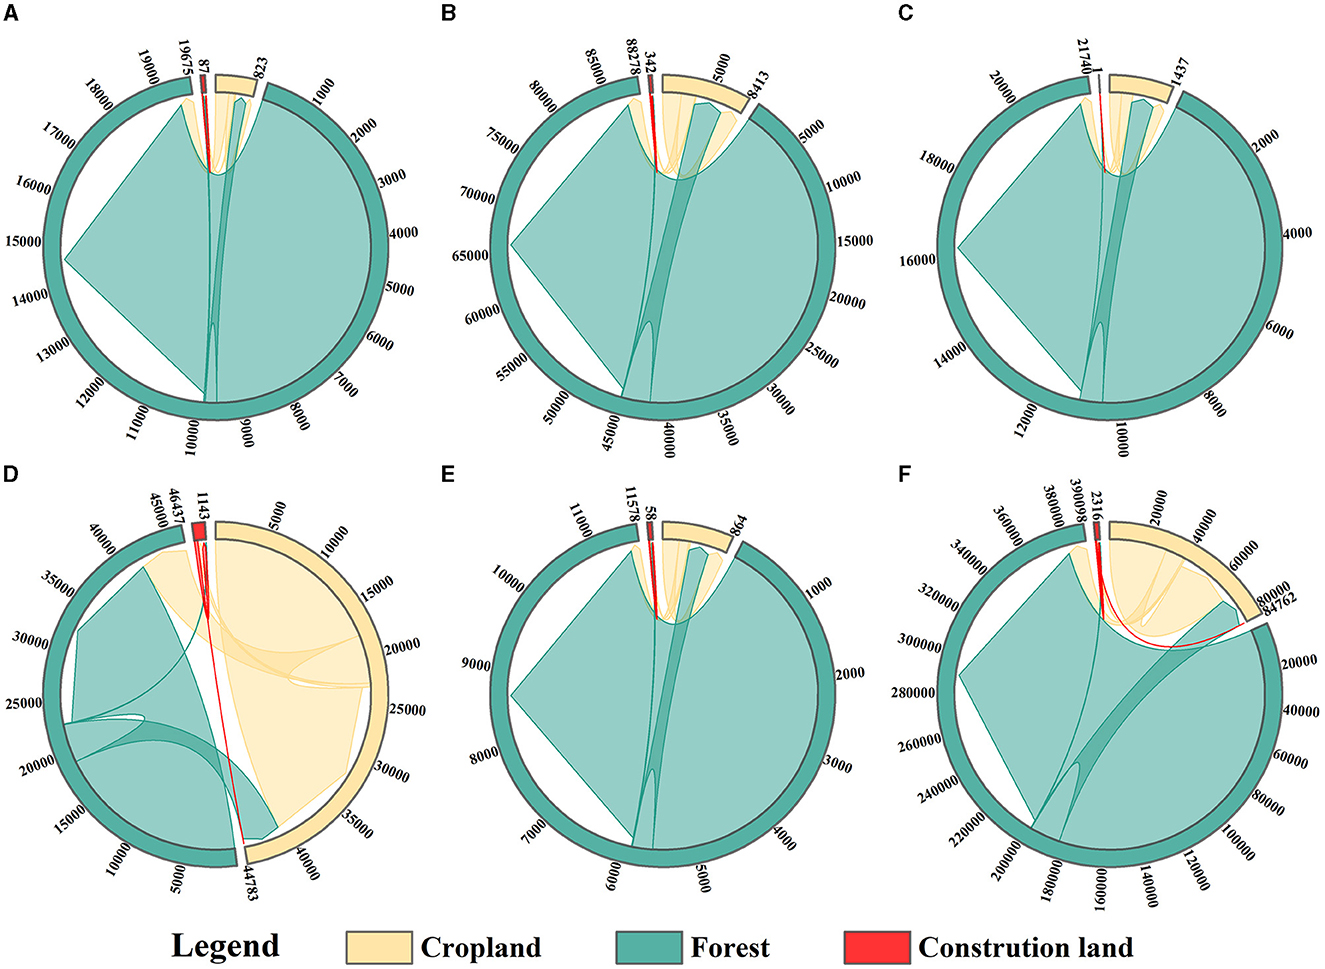
Figure 2. Land-use transfer on the Laos's border from 1985–2020. (A) The overall area in Laos near the border; (B) Laos-China border within China; (C) Laos-Vietnam border within Vietnam; (D) Laos-Cambodia border within Cambodia; (E) Laos-Thailand border within Thailand; (F) Laos-Myanmar border within Myanmar.
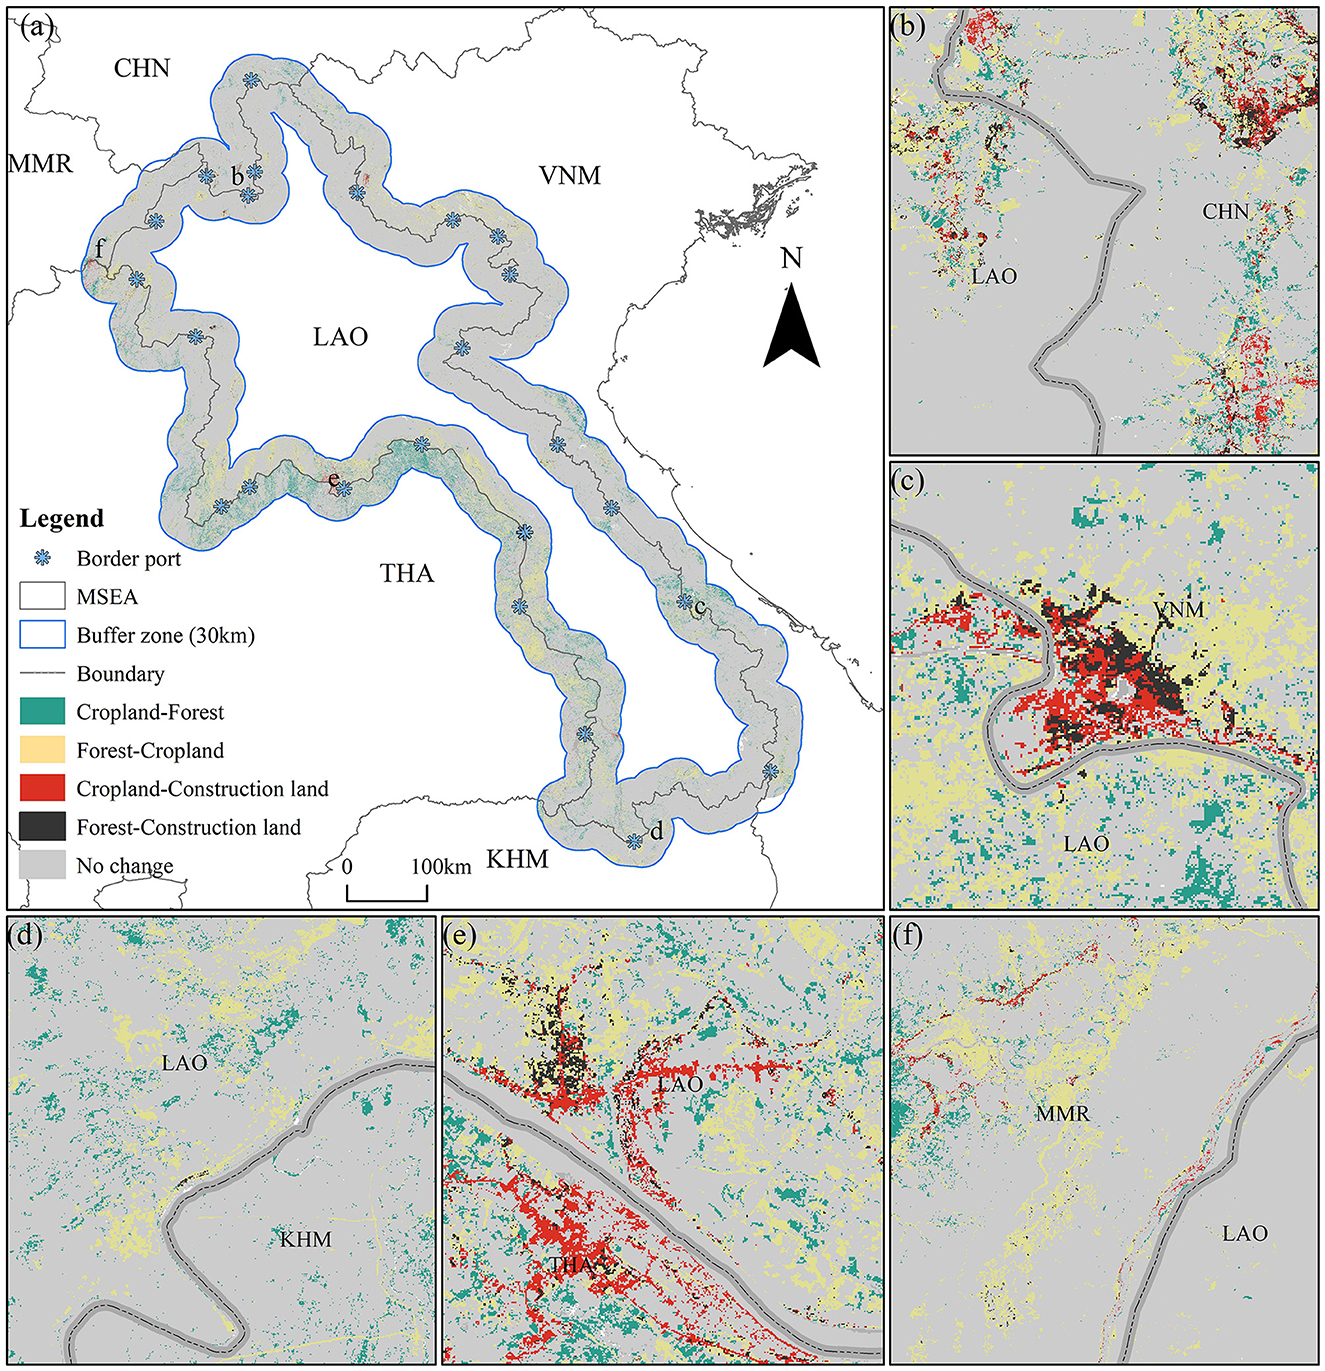
Figure 3. Spatial distribution of dominant LUC within the 30 km buffer area of (a) Laotian border from 1985 to 2020. The zoom-in figures represent the typical area in the borderlands of (b) Laotian-China, (c) Laotian-Vietnam, (d) Laotian-Cambodia, (e) Laotian-Thailand, and (f) Laotian-Myanmar (LAO refers to Laos, CHN refers to China, VNM refers to Vietnam, KHM refers to Cambodia, THA refers to Thailand and MMR refers to Myanmar).
The LUC in Laos' five border zones (i.e., Laotian–Chinese, Laotian–Vietnamese, Laotian–Thai, Laotian–Cambodian, and Laotian–Myanmar) shows considerable differences in scale and spatial characteristics. Regarding scale changes, the Laos–Thailand border has the largest increase in cropland (2060.9 km2), followed by the Laos–Vietnam border (1663.1 km2) and the Laos–China border (226.6 km2). However, the cropland on the Laos-Myanmar border has the highest growth rate (76.4%), followed by the Laos–China border (34.7%) and the Laos–Thailand border at 6.2%. Regarding the construction land expansion, the Laos–Thailand border has the highest increase (821.5 km2), followed by the Laos–Vietnam border (220.2 km2) and the Laos–Cambodia border (10.8 km2). Nevertheless, the Laos–Cambodia border had the highest growth rate (1811.2%), followed by the Laos–China border (532.1%) and the Laos–Thailand border (183.3%). The growth scales of cropland and construction land in the five border zones are not synchronous with their growth rates, which are affected by the different land areas of each border and their respective geopolinomical relations. Furthermore, the expansion of cropland and construction land in Laos' border areas varies significantly in different buffer zones, displaying spatial patterns of bordering/de-bordering, which means that the closer/farther the distance from the borderline, the larger the area expansion of a certain land type and homogeneity/heterogeneity development.
Between 1985 and 2020, cropland on the Laotian-side of Laotian-China border increased from 197.7 km2 to 494.0 km2, increasing by 149.8% and accounting for 30.3–56.3% of total cropland on both sides of the border. In contrast, cropland on China's side decreased from 453.9 km2 to 384.3 km2. Construction land on the Laotian side grew from less than 3.0 km2 to 36.3 km2, accounting for 17.2–32.9% of total construction land on both sides of the border. Spatially, cropland on China's side expanded in the near-border areas in the south but contracted in the far-border areas in the north due to forest expansion, which gradually extended toward the border. The spatial pattern of cropland change on the Laotian side was similar. The expansion of construction land was mainly concentrated in the southern part of the Laos–China border, with construction land clustered near the border on China's side and scattered across the border on Laotian side (Figure 4).
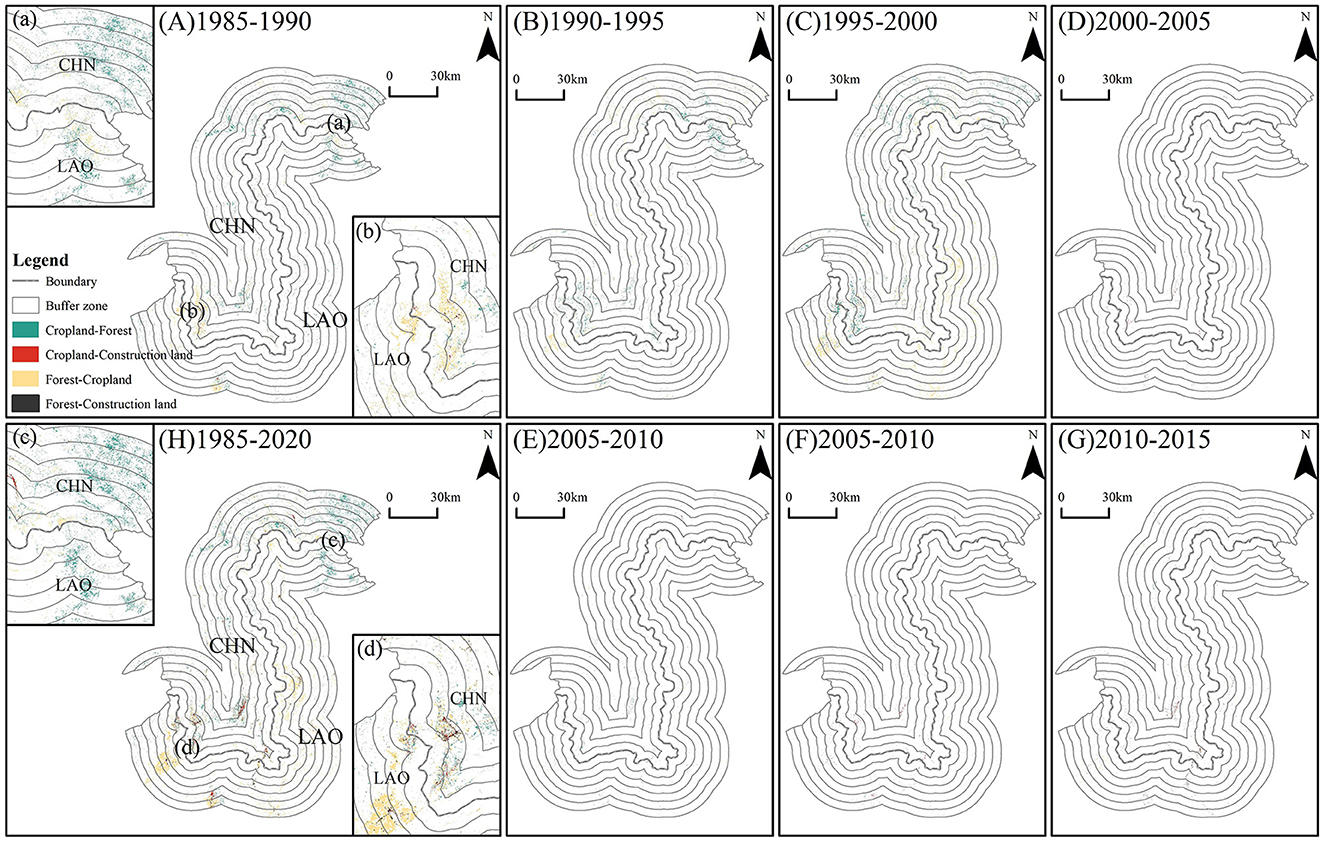
Figure 4. Spatial distribution of dominant LUC within the 30 km Laos–China border areas from 1985-2020. (A–H) Series represent different time periods; (a, b) Series represent the detail view of figure (A); and (c, d) Series represent the detail view of figure (H) (LAO refers to Laos and CHN refers to China. Starting from the national boundary, each interval is a buffer zone of 5, 10, 15, 20, 25, and 30 km, in which the white areas mean that there was no LUC within the buffer zone, and the following Figures 6–9 are all like this).
From 1985 to 2020, there was an increase in land-use HI along the Laos–China border, which progressed from small to large and from far- to near-border (Figure 5a). This is especially evident in cropland, where the near-border HI increased by over 0.4 in the 0–10 km buffer zone and less than 0.1 in the 30 km buffer zone. Regarding construction land, the HI increased by 0.15, 0.13, and 0.22 in the 0–15 km buffer zone and decreased by 0.12 in the 30 km buffer zone. In the early 1990s, geopolinomical cooperation strengthened between Laos and China, with Laos attracting foreign investment and Yunnan Province taking advantage of its location to encourage the border population and enterprises to go abroad. The HI of cropland and construction land increased, as evidenced by the development in the Laos–China border since the country opened up.
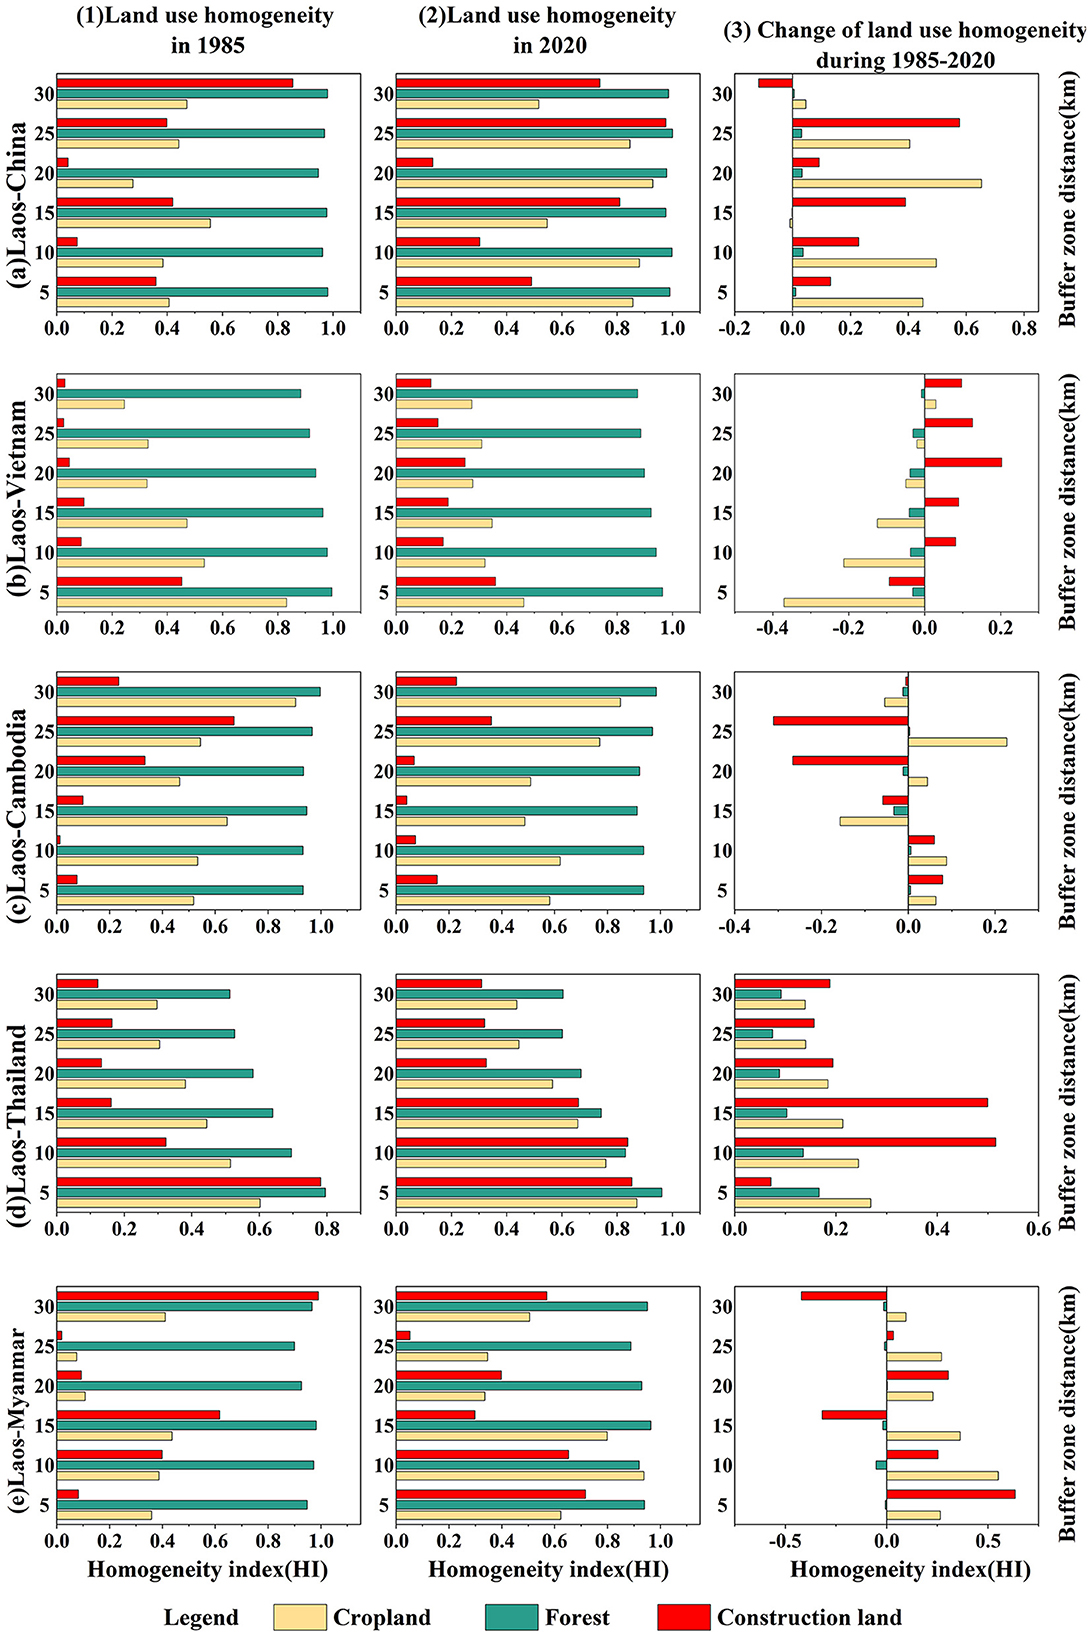
Figure 5. Changes of Land-use HI for Laos and neighboring countries. (a–e) Series represent borders of different countries; (1–3) Series represent different time periods (The higher the value of HI, the more similar the land use of the two countries).
Since 1985, cropland on the Laotian-side of Laotian-Vietnam border has increased from 1,310.6 km2 to 1,525.8 km2, with a decrease in the proportion from 26.8% to 23.5% of the total cropland on both sides of the border. Moreover, cropland on Vietnam's side saw a dramatic increase from 3,580.1 km2 to 4,968.9 km2, nearly 38.8%, throughout the entire period. Construction land on the Laotian side soared from merely 4.2 km2 to 47.4 km2, and the proportion rose from 4.7% to 15.5%. On Vietnam's side, construction land increased from 94.4 km2 to 260.7 km2. Spatially, on the northern part of the border, cropland expansion is mainly within the near border on Vietnamese side. In the central part, the change in cropland is mainly concentrated in the far-border areas, with expansion on the Laotian side and reduction on Vietnam's side due to forest conversion. In the southern part, cropland expansion and reduction coexist, with expansion on the Laotian side occurring in the far-border areas, whereas the near-border is experiencing an increase in forest. Construction land expansion is more sporadic on both sides of the Laos and Vietnam borders but mostly occurs in the far-border areas of both countries (Figure 6).
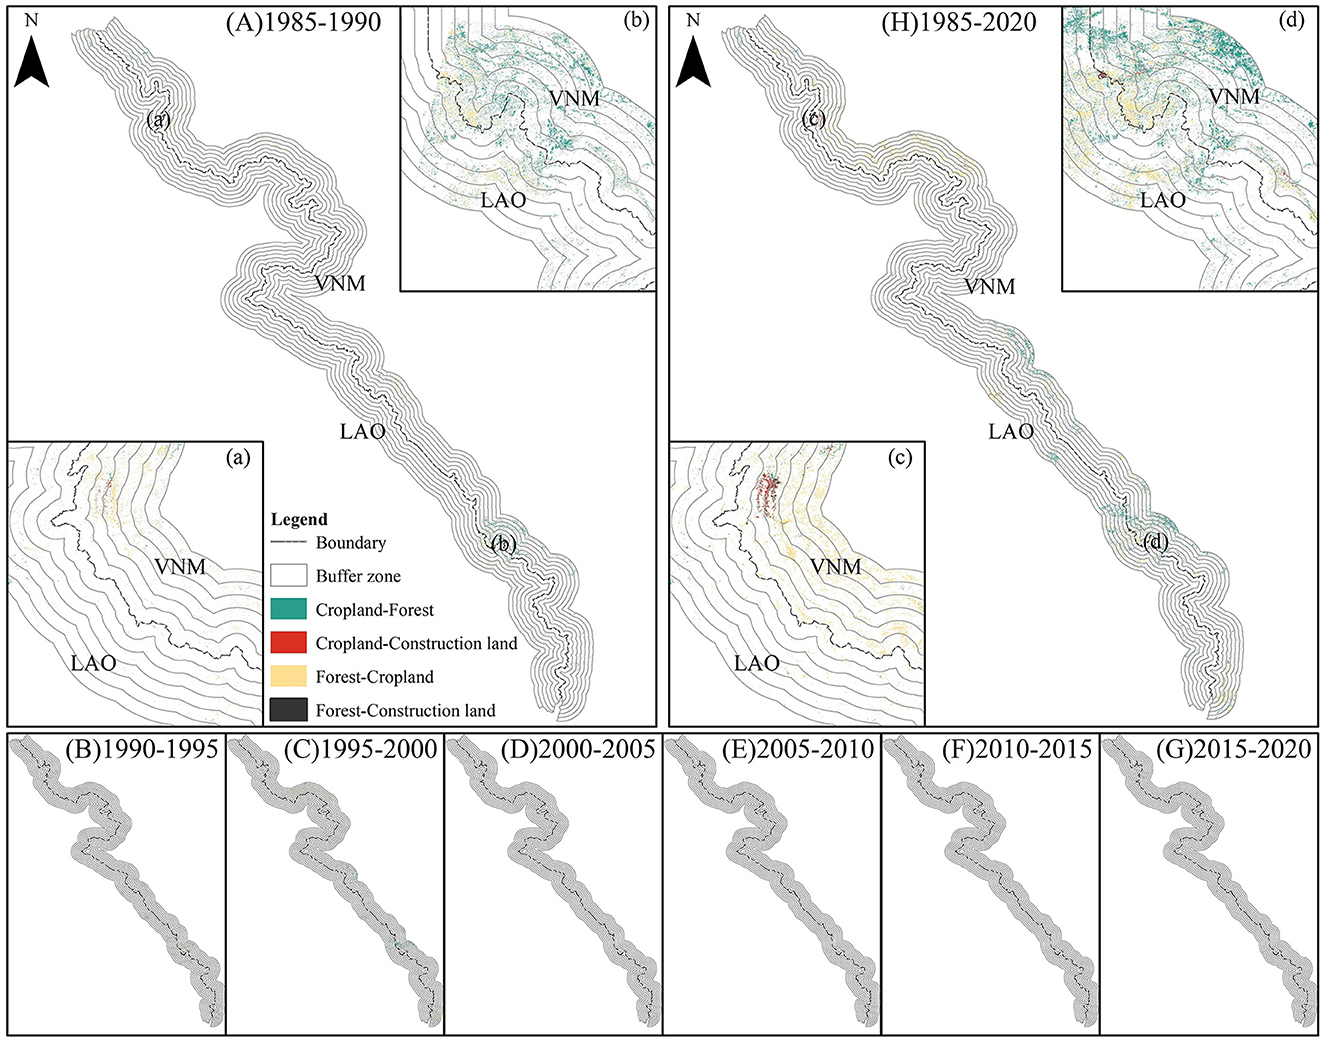
Figure 6. Spatial distribution of dominant LUC within the 30 km Laos–Vietnam border areas during 1985-2020. (A–H) Series represent different time periods, (a, b) series represent the detail view of figure (A), and (c, d) series represent the detail view of figure (H) (LAO refers to Laos and VNM refers to Vietnam).
Over the past 36 years (1985–2020), land-use HI along the Laos–Vietnam border has been stronger in near-border areas and weaker in far-border areas. The cropland HI decreased slightly, whereas the construction land HI increased (Figure 5b). Despite the strong geopolinomical relations between Vietnam and Laos, the Annamite Range along the border hinders practical and in-depth cooperation in the near-border areas. Additionally, Vietnam has limited geopolinomical radiation, with its development focus tilted toward southern Laos, which has a weak foundation and prefers developing far-border areas with better infrastructure. Thus, cropland HI along the Laos–Vietnam border has generally decreased, particularly in the near-border areas, while construction land HI has increased, especially in the far-border areas.
During 1985–2020, cropland on the Laotian-side of Laotian-Cambodia border increased from 603.2 km2 to 775.2 km2, accounting for 39.1% to 40.4%. On Cambodia's side, cropland grew from 939.0 km2 to 1,145.0 km2, showing a 32.2% increase. Construction land on the Laotian side grew with greater scale and magnitude, from less than 0.5 km2 to 10.1 km2, while Cambodian side increased from 0.1 km2 to 1.3 km2, with a low scale and slower growth. Compared to other borders, construction land on the Laotian side of the Laos–Cambodia border is higher than that on Cambodia's side. Spatially, cropland expansion on the Laos–Cambodia border occurs mainly in the far-border areas. Construction land expansion is fragmented, with the Laotian side showing distinct bordering trends, while the expansion's bordering/de-bordering characteristics are less pronounced in Cambodia (Figure 7).
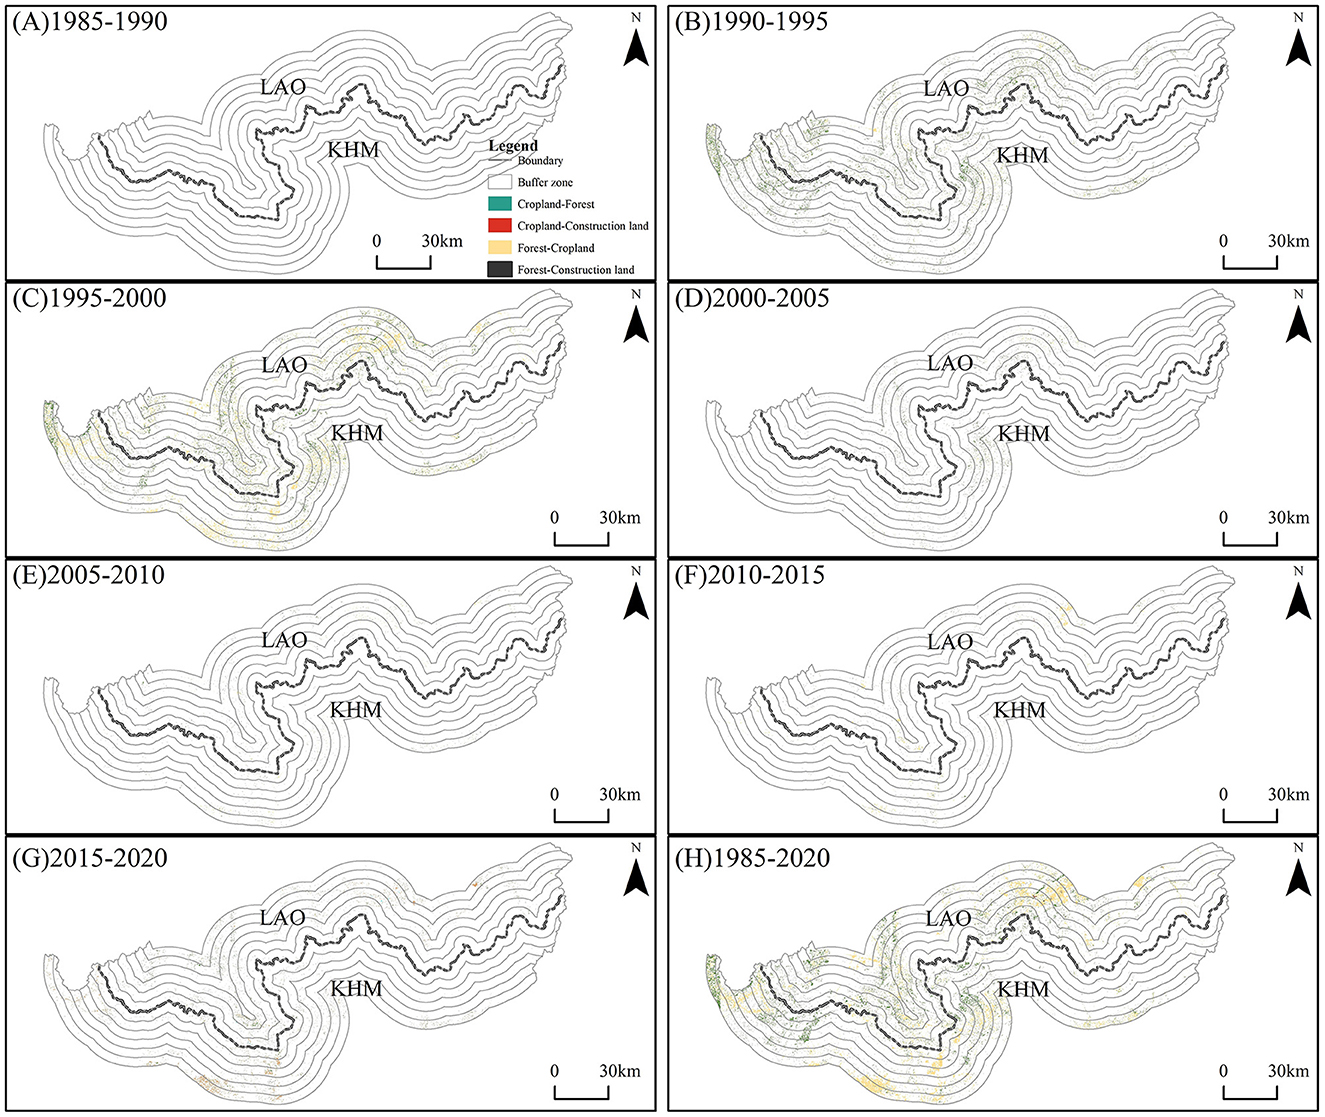
Figure 7. Spatial distribution of dominant LUC within the 30 km Laos–Cambodia border areas from 1985–2020. (A–H) Series represent different time periods (LAO refers to Laos and KHM refers to Cambodia).
Meanwhile, land-use HI in the Laos–Cambodia far-border areas was strongest; however, the changes in land-use HI along the border areas exhibited heterogeneity across various land types and buffer distances (Figure 5c). For instance, cropland HI showed a pattern of “small increase - decrease - increase - small decrease” in the 0–30 km buffer zones. Meanwhile, construction land HI increased in the near-border areas but decreased in the far-border areas. Because both countries are economically underdeveloped, LUCs caused by geopolinomical relations are limited.
Between 1985 and 2020, cropland on the Laotian-side of Laotian-Thailand border experienced expansion, increasing from 9,726.1 km2 to 13,305.3 km2, with the proportion rising from 29.5% to 37.9%. Meanwhile, cropland on Thailand's side decreased, fluctuating from 23,280.9 km2 to 21,762.6 km2, showing a reduction of 6.5%. Additionally, construction land on the Laotian side surged from 108.9 km2 to 463.8 km2, showing an increase of 325.8%, with the proportion increasing from 24.3% to 36.5%. On Thailand's side, construction land rose from 339.3 km2 to 805.9 km2, showing an increase of 137.6%. Within the 30 km buffer zone, cropland expansion on the Laotian side was especially notable in the near-border areas (0–15 km). As the distance from the border increased, the cropland expansion on the Laotian side decreased, displaying bordering characteristics. In contrast, changes in cropland on Thai side varied more spatially within the 30 km buffer zone, with some expansion in the north and south but a large-scale reduction in the central part due to afforestation and tree-based plantations (e.g., rubber plantations) (more drastic in the near-border areas, especially in the 0–5 km buffer zone, with a reduction of 419.5 km2). Both Laos and Thailand showed a pattern of expansion in terms of change in construction land. Construction land expansion was dependent on the ports, and the expansion areas decreased significantly with increasing distance from the border, with obvious bordering characteristics (Figure 8).
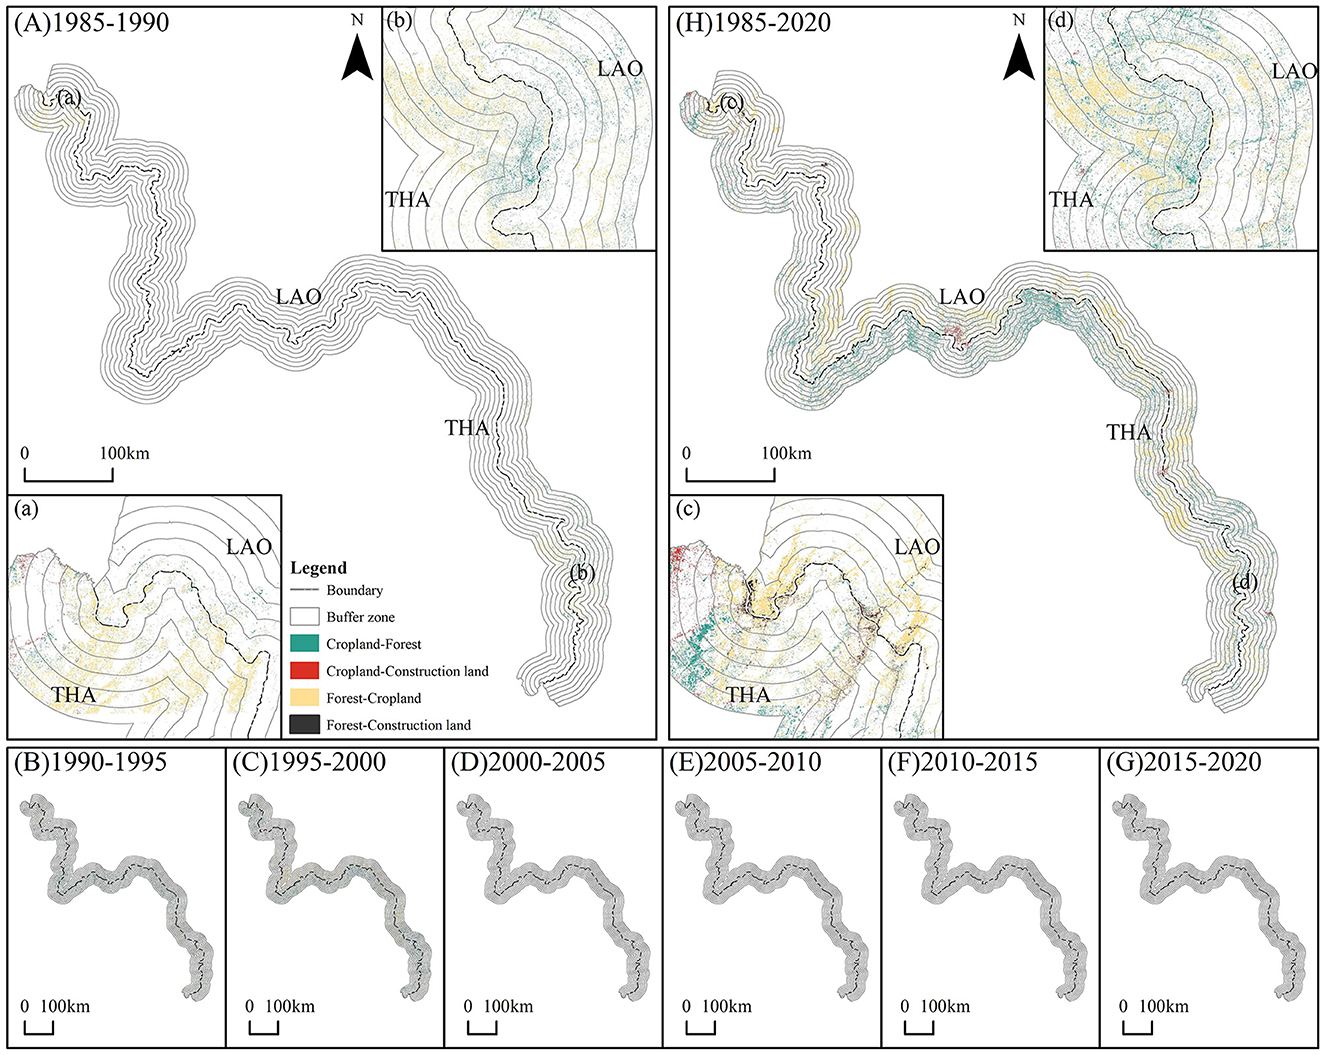
Figure 8. Spatial distribution of dominant LUC within the 30 km Laos–Thailand border areas from 1985–2020. (A–H) Series represent different time periods (LAO refers to Laos and THA refers to Thailand).
During the same period, land-use HI along the Laos–Thailand border was consistently higher than that at other borders in the study area, with the HI continuing to increase (Figure 5d). Vientiane, the capital of Laos, is also located in this area, making it a focus for development. Moreover, the two countries share the same ethnic group (i.e., Lao or Thai) and have a long history of geopolinomical relations, resulting in a high level of land development along the entire border. The land-use homogeneity of cropland in the border areas (especially near the border) is particularly high. Moreover, HI in the far-border areas has seen a dramatic increase over the past 30 years, with an average increase of 0.2 for cropland and a maximum increase of over 0.5 for construction land. This suggests that the impact of geopolinomical relations between Laos and Thailand on land use has spread from the near-border to the far-border areas.
From 1985 to 2020, there was a significant increase in cropland and construction land on both sides of the Laos–Myanmar border. On the Laotian side, there was a 282.7% increase in cropland, increasing from 94.7 km2 to 362.6 km2, and the proportion jumped from 19.5% to 42.2%. On Myanmar's side, there was a 103.6 km2 (a 26.5% increase) in cropland, expanding from 391.4 km2 to 495.0 km2. Moreover, construction land on the Laotian side rose from less than 2.5 km2 to 26.3 km2, showing an increase of 23.9 km2, and the proportion increased from 17.4% to 36.3%. On Myanmar's side, construction land expanded from 11.7 km2 to 41.1 km2, showing an increase of 256.4%. Spatially, these changes were mainly observed in the southern zone bordering Thailand and the northern zone bordering China (Figure 9).
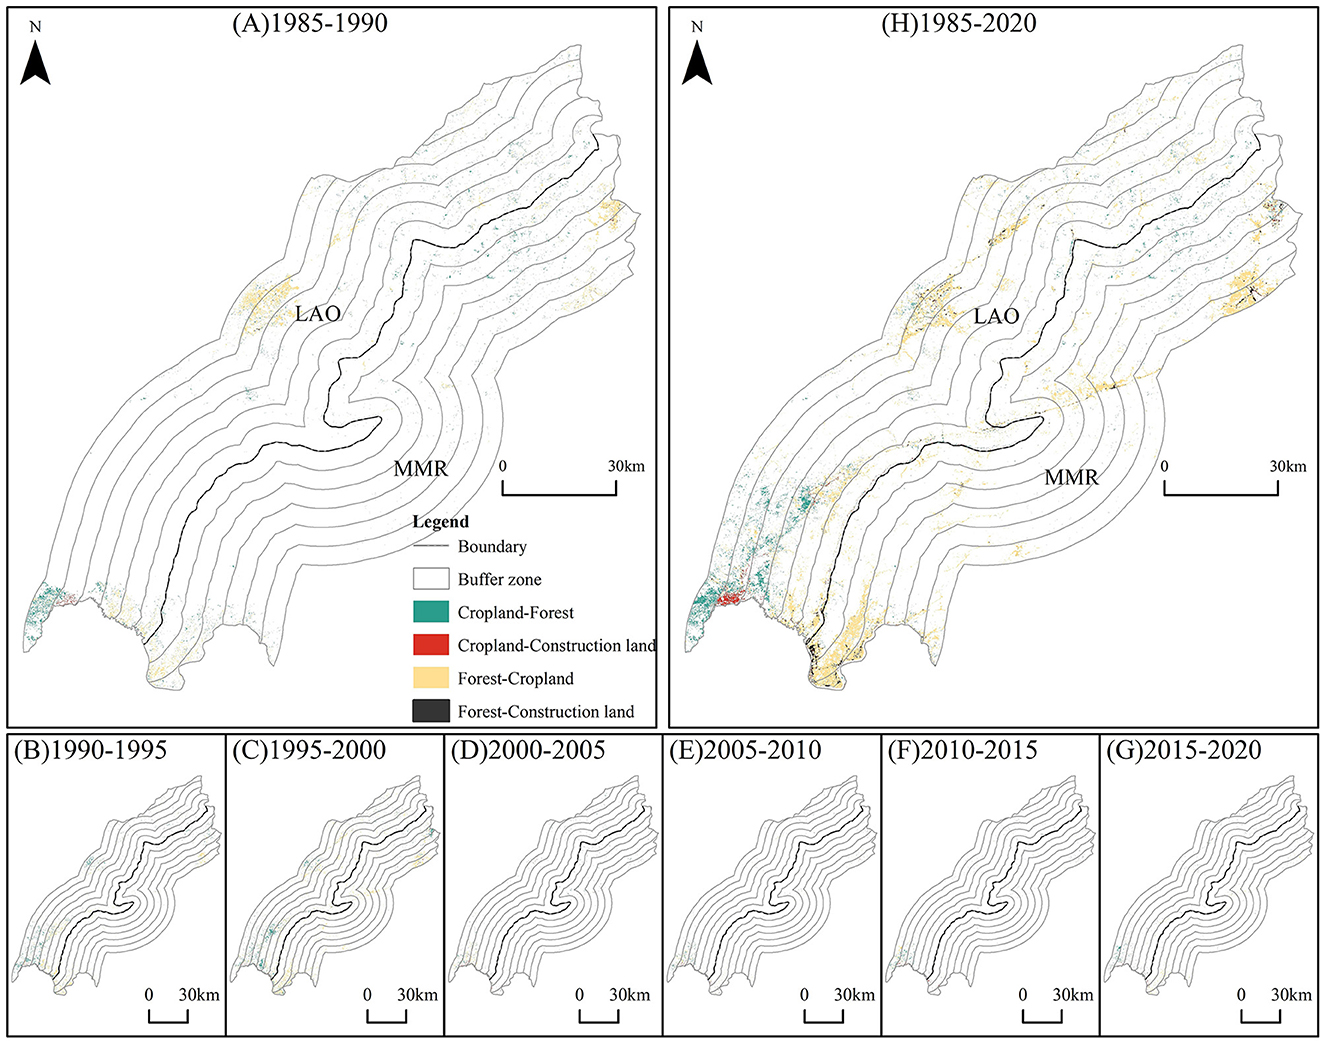
Figure 9. Spatial distribution of dominant LUC within the 30 km Laos–Myanmar border areas from 1985–2020. (A–H) Series represent different time periods (LAO refers to Laos and MMR refers to Myanmar).
Comparing land-use HI between Laos and Myanmar, we observed the strongest HI in the far-border areas in 1985, which subsequently decreased. Both countries are economically underdeveloped and have limited external radiation capacity and geopolinomical relations, mainly within the border zones with China and Thailand. From 1985 to 2020, land-use HI along the Laos–Myanmar border increased, with forest HI in the near-border areas increasing more than that in the far-border areas. Cropland land-use HI increased by 0.2, 0.5, and 0.4 in the 0–15 km buffer zones and by only 0.1 at 30 km. Construction land HI increased more in the near-border areas but decreased or was negative in the far-border areas (Figure 5e).
Since the 1990s, the implementation of Laos' border-opening policy has driven the development and construction of port/cross-border economic cooperation zones, representing the primary means and form of LUC. The ratio of the construction land area of port areas to the total construction land area of the border increased from 13.7% in 1985 to 18.8% in 2020. Therefore, we selected the following ports to analyse the impact of geopolinomical relations on LUC in key areas (i.e., port areas), including Boten–Mohan port on the Laos–China border, Vientiane–Nong Khai port on the Laos–Thailand border, and Dansavanh–Lao Bâo port on the Laos–Vietnam border. Following Li and Xiao (2022), we constructed a 15 km buffer zone centered on the port.
As shown in Figure 10, cropland and construction land in Boten–Mohan port have changed from non-existent to evident and from dotted to striped over the past 36 years. Specifically, cropland increased from 11.3 km2 in 1985 to 27.0 km2 in 2020, while construction land grew from 0.2 km2 to 10.6 km2. Furthermore, the Chinese side of the port (i.e., Mohan) has a better economic base, and cropland and construction land have a far-port pattern distributed in multiple strips. In contrast, Boten's side in Laos has a weaker economic base, and cropland and construction land are small in scale but expanding rapidly, with a high concentration in the near-port area.
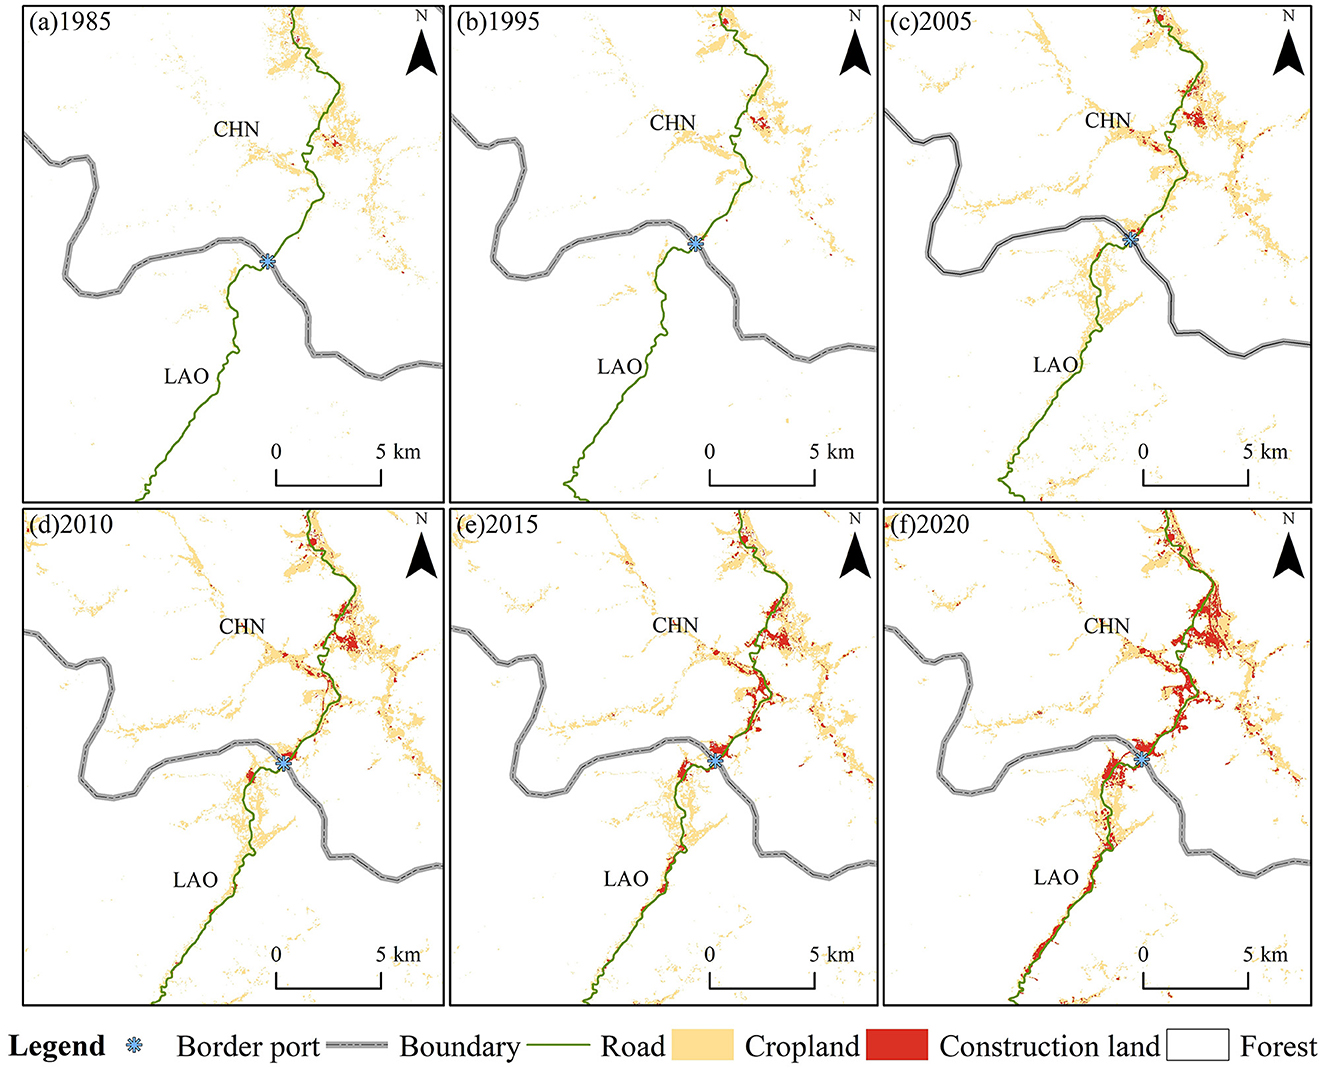
Figure 10. Changes in cropland and construction land in the 15 km buffer area of the Laos–China Boten–Mohan port from 1985–2020. (a–f) Series represent different time periods (LAO refers to Laos and CHN refers to China).
Geopolinomical relations between Laos and China have profoundly influenced the LUC characteristics of the Boten–Mohan port. Initially, cropland and construction land were small in scale and scattered in a Dotted pattern. However, with the official opening of the international port between Laos and China (1993) and the establishment of the border trade zone in Mohan (2001), the growth rate of cropland and construction land in Boten–Mohan port accelerated compared with the initial period, with significantly larger growth on the Chinese side (5.1 km2) compared to that of Laos (3.5 km2). Subsequently, geopolinomical relations intensified, including the following: the Mohan Economic Development Zone was established in 2006, the Mankun Highway was opened in its entirety in 2007, the Boten Special Economic Zone was created in 2009, and the Xiaomao Expressway was officially opened in 2017. These developments have not only led to the east–west expansion of cropland and construction land in a clear strip but have also caused the land-use gap of the Boten–Mohan port to shrink continuously. The proportion of cropland and construction land around the Boten–Mohan port is increasing, with cropland growing from 6.1% to 33.1% and construction land incrementally increasing from 3.6% to 35.9% throughout the entire period. With the creation of transportation infrastructure, such as the China–Laos Railway, the construction of these channel-type facilities will have a growing impact on land use in areas along the route, with construction land being the most affected.
At the Vientiane (Laos)-Nong Khai (Thailand) port, large-scale construction land expansion and the occupation of cultivated land are evident. From 1985 to 2020, cropland decreased from 1006.5 km2 to 881.5 km2, representing a 12.4% decrease, while construction land increased from 69.8 km2 to 205.6 km2, at a rate of 194.6%. Spatially, cropland is distributed in a large area surrounding the Vientiane–Nong Khai port, while construction land has better infrastructure on Thailand's side, showing a far-port pattern. However, on the Laotian side, construction land is mainly concentrated along the Mekong River (Figure 11). Additionally, some parts of the Vientiane–Nong Khai port display a striped expansion, likely due to the construction of transportation routes, which has driven the development of construction land in the area.
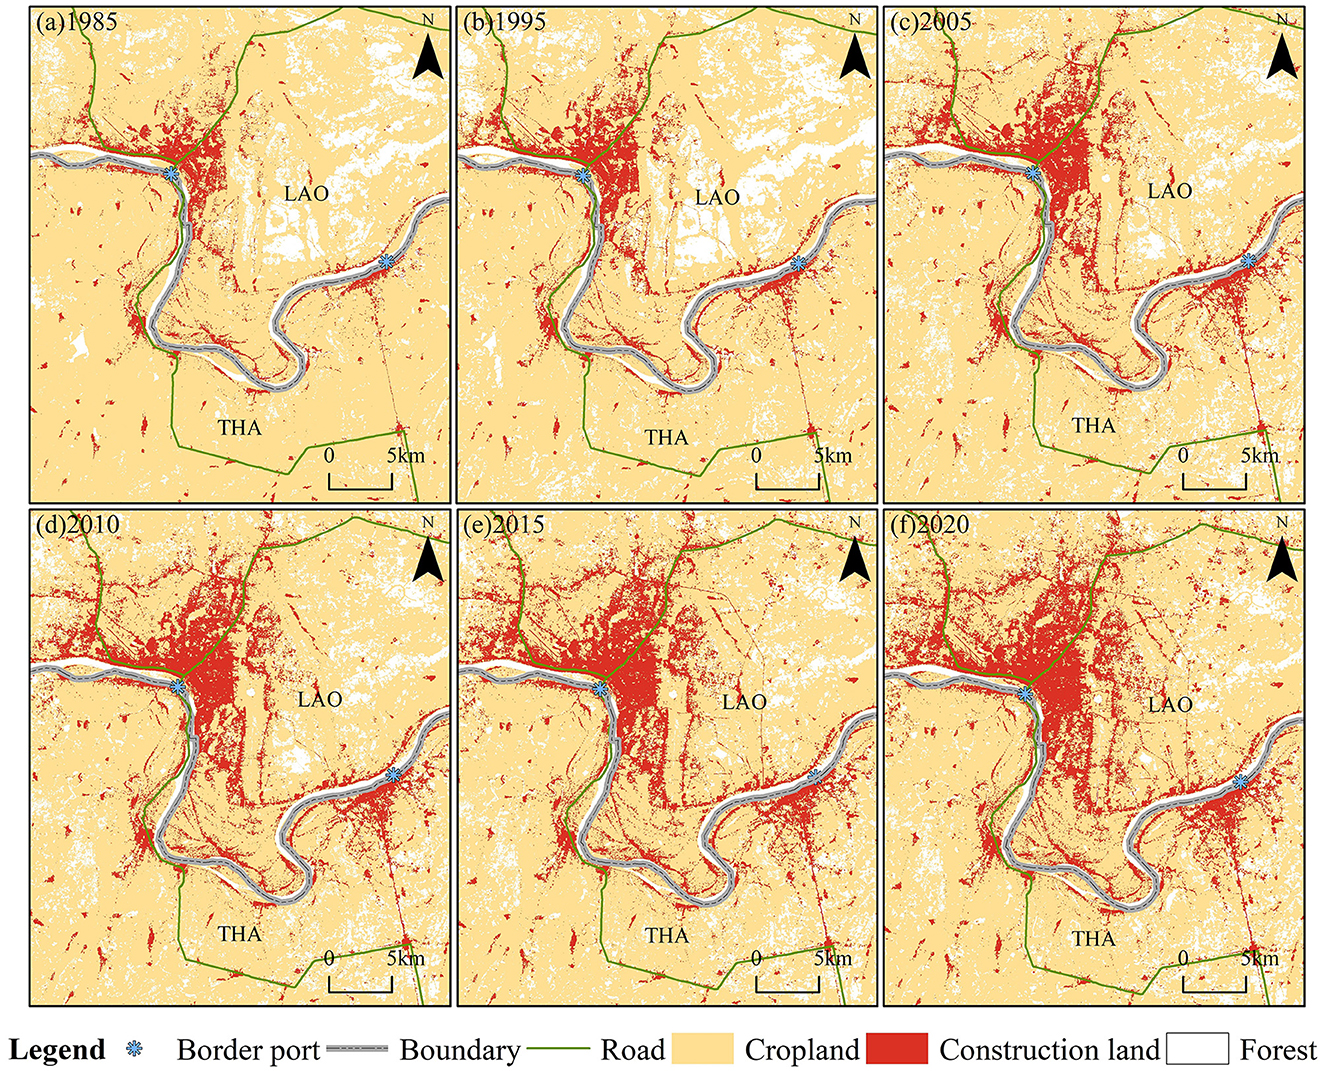
Figure 11. Changes in cropland and construction land in the 15 km buffer area of the Laos–Thailand Vientiane–Nong Khai Port from 1985–2020. (a–f) Series represent different time periods (LAO refers to Laos and THA refers to Thailand).
As progress was made in the peaceful settlement of the Cambodia issue in the late 1980s and early 1990s, Laos' policy toward Thailand shifted from siding with the socialist camp to an all-around diplomatic strategy. As a result, relations between Laos and Thailand have improved rapidly, and border cooperation has strengthened. In 1988, Laos enacted and implemented an investment law, allowing foreign capital to invest in and operate in Laos. In 1989, the Thai government ordered the opening of all Thai–Lao ports. In 1992, the Prime Ministers of Laos and Thailand signed the Thai–Lao Treaty of Peace and Friendship in Bangkok, which included the settlement of disputes between the two countries by peaceful means and through peaceful coexistence, friendship, and cooperation between both sides. With the strengthening of geopolinomical cooperation between the two countries, the amount of land used for construction near the Vientiane–Nong Khai port grew significantly, crowding out cropland and forest. Additionally, the size of Vientiane's port has consistently been much larger than that of the Nong Khai port, which has led to an expanding gap between the two sides of the border port. The proportion of Vientiane port land in the construction land of the Vientiane–Nong Khai port has increased from 67.1% in 1985 to 73.8% in 2020.
From 1985 to 2020, cropland at the Dansavanh–Lao Bâo port on the Laos–Vietnam border decreased slightly, from 150.5 km2 to 148.4 km2, while construction land saw a dramatic rise, expanding from 1.2 km2 to 9.3 km2. Construction land is highly concentrated in the near-port area and displays cluster-like development. In contrast, cropland shows a linear distribution along the traffic artery and a scattered distribution away from the port (Figure 12). Despite the rapid development of construction land at the Laos–Vietnam port, the Annamite Range constrains the entire area. Dansavanh–Lao Bâo is situated in a valley surrounded by high mountains and jungles, thus limiting its development and resulting in a distinct spatial morphology compared to the Laos–China and Laos–Thailand ports at Boten–Mohan and Vientiane–Nong Khai.
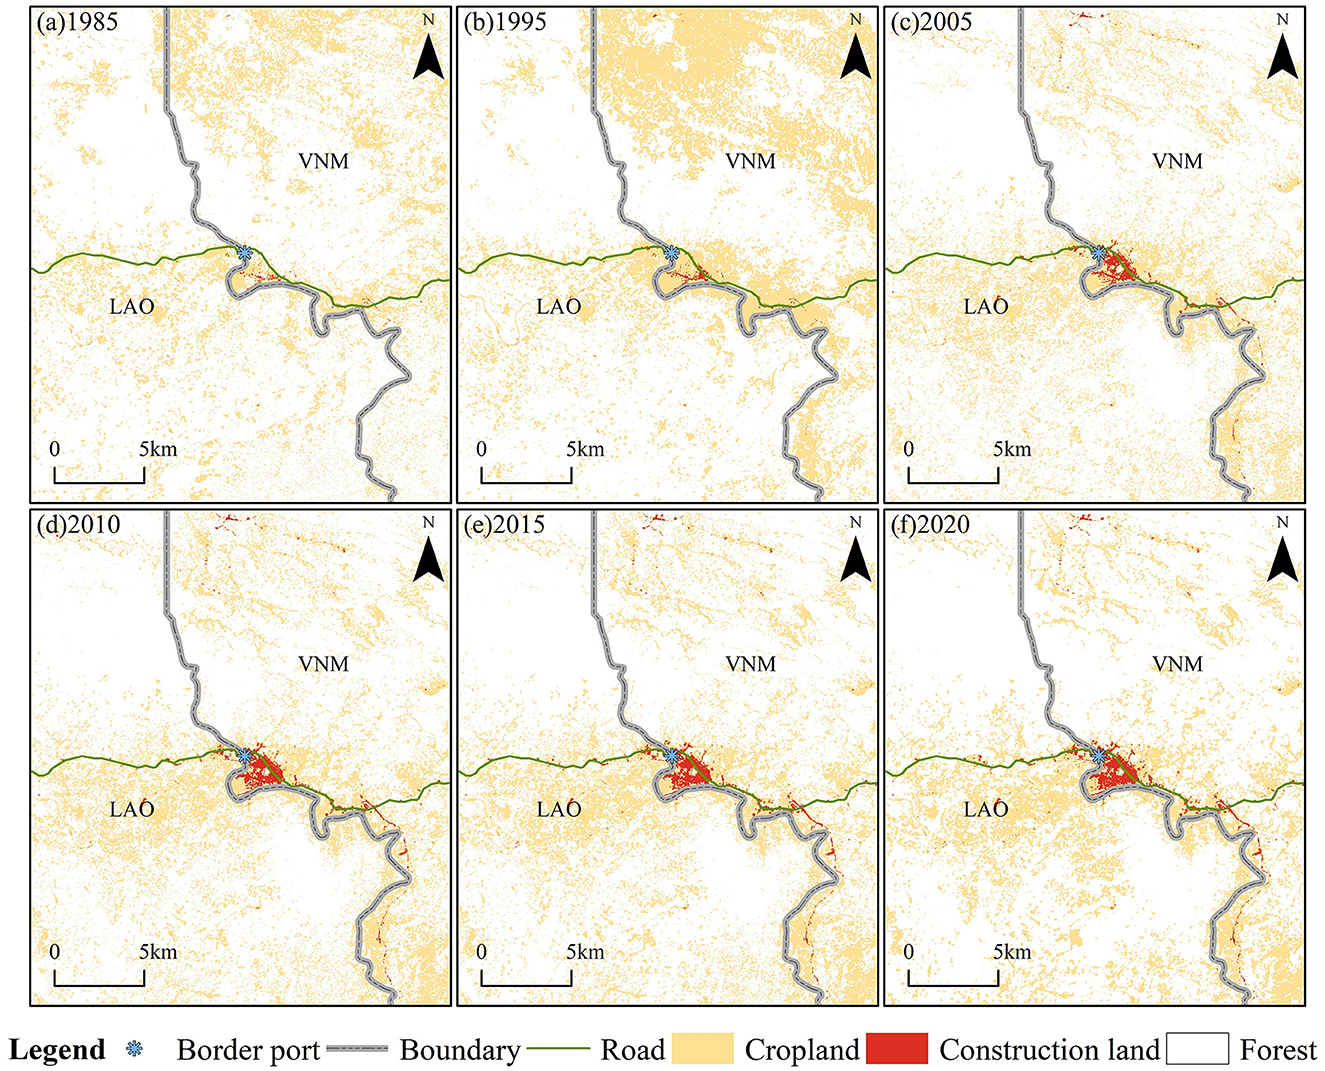
Figure 12. Changes in cropland and construction land in the 15 km buffer area of the Laos–Vietnam Dansavanh–Lao Bao Port from 1985–2020. (a–f) Series represent different time periods (LAO refers to Laos and VNM refers to Vietnam).
Laos and Vietnam have a strong bond of unity and friendship and have established “brotherly and cooperative relations” in their border areas. This relationship was further reinforced in 1986 by the signing of a new border agreement. Since the 1990s, the Greater Mekong Subregion, represented by Vietnam and Laos, has initiated various cross-border joint projects that have significantly increased the development of border ports, such as the Cross-border Transport Agreement, the East–West Economic Corridor, and Laos' Fort Economic and Trade Zone, as well as the implementation of both Single Window Inspection and Single Site Inspection (Lamijo, 2016). Therefore, Dansavanh–Lao Bâo, one of the oldest cross-border passages, has become an important node of the project, facilitating the flow of goods, people, and services between the two sides and improving road links and port facilities. The geopolinomical relations between Laos and Vietnam are close and stable, and the proportion of construction land at the Dansavanh port on the Laotian side has remained relatively consistent, decreasing slightly from 14.7% in 1985 to 13.7% in 2020. This is in part due to the Annamite range, a natural barrier on the border of Laos and Vietnam.
For a long time, Laos could not participate in globalization due to its enclosed geographical environment and scarce transportation. However, with the introduction of Southeast Asian infrastructural connectivity, which is part of long-established plans to integrate the region by the Association of Southeast Asian Nations (ASEAN, 1967), the Greater Mekong Subregion (GMS, 1992) and the ASEAN Economic Community (AEC, 2015), the Laos government has taken a proactive approach to strengthening geopolinomical relations with surrounding regions (Rowedder, 2020). Cross-border cooperation with cross-border rubber plantations (Sturgeon, 2013), road construction (Zheng et al., 2021), and economic zones (Li and Xiao, 2022) are the main content, which have led to a significant increase in cropland and construction land with simultaneous deforestation. In this region, the magnitude of change in these three land-use categories of forest, cropland, and construction land has surpassed 98.2% of the total LUC area documented in the study region.
As the carrier and frontier of geopolinomical influence and the implementation of geopolinomical strategies, national border areas have multiple impacts on LUC. Laos has close relations with China, Vietnam, and Thailand, where there is a large expansion of construction land near the border. Most land control areas in Myanmar and Cambodia have less geopolinomical influence and are located near the border of Laos. In addition, the LUC along the Myanmar–Cambodia border mainly occurs in the far-border areas. This is strong evidence that geopolinomical relations are also drivers of LUC. However, research on the impact-response interaction between geopolinomical relations and borderland use among countries is still in its early stages (Cotula, 2012; Woods et al., 2021). Specifically, current studies on geopolinomical cooperation are largely static, focusing on describing the research status and problems of competition and cooperation, such as cross-border trade and cooperation (Watcharejyothin and Shrestha, 2009) and national policies and institutions (Dovers and Hezri, 2010). However, few studies have examined its processes, mechanisms, and dynamic monitoring and simulation (Xiao et al., 2021). Moreover, research on border LUC is largely sporadic (e.g., the expansion of rubber plantations, the increase of slash-and-burn farming, and the expansion of border ports) (Sturgeon, 2013; Jiang et al., 2022), with most studies focusing on remote-sensing monitoring methods for typical land types and few, if any, integrating geopolinomical issues. As a typical region for conducting such studies, Laos can help advance interaction studies on geopolinomical relations and borderland LUC and promote discipline development in border geography research.
Border areas that share a given region are geographically close. They are naturally and ecologically relatively homogeneous, in general, yet heavily dissected by political borders. Therefore, national variations of LUC in border areas can largely be attributed to differences in broad-scale political and socioeconomic factors, such as land ownership patterns and management policies (Kuemmerle et al., 2006). In turn, the geopolinomical context between countries may dilute these differences and somewhat enhance land-use homogeneity (Perz et al., 2013). Therefore, the land-use homogeneity index (HI) could be used somewhat to characterize the extent of geo-economic cooperation between countries. The result of HI could be better discussed and the individual causes highlighted more prominently. With their greater economic and geopolinomical influence, China and Thailand have developed more effective cooperation with Laos, leading to the evident homogeneity of cropland and construction land along the Laos–China and Laos–Thailand borders, and this HI is further enhanced near the border. Conversely, Laos has weaker geopolinomical ties with Myanmar and Cambodia, whose HI is starting to decrease. Interestingly, despite the close geo-relationship between Laos and Vietnam, the expansion of cropland and construction land on both sides of the border in the northern mountainous areas occurs more in the far-border areas, while in the southern plains, it occurs mainly in the border areas. Moreover, the HI is characterized by a higher far-border than near-border HI. This result may be due to the Annamite Range's barrier, which makes it difficult for Laos and Vietnam to cooperate directly and pragmatically in the near-border area.
Last but not least, it is necessary to point out that a potential limitation of the HI is that it may not accurately capture the geopolinomical context between countries, as LUC can result from various factors, regardless of the level of interaction. Therefore, future studies could improve this index by incorporating more socioeconomic data. Moreover, the ports of Laos had distinct country characteristics from 1985 to 2020. The development of the border port of Botan–Mohan, Vientiane–Nong Khai, and Dansavanh–Lao Bâo is heavily influenced by the geopolinomical policies implemented by Laos–China, Laos–Thailand, and Laos–Vietnam. While the Botan (Laos)–Mohan (China) port has a relatively weak foundation, cropland and construction land are expanding rapidly. The Vientiane (Laos)–Nong Khai (Thailand) port has a strong foundation, with the conversion of cropland and forest leading to rapid growth in construction land. The Dansavanh (Laos)–Lao Bâo (Vietnam) port is also developing rapidly, although it is more significantly affected by topography. The deepening geopolinomical relations in the Laos–China, Laos–Thailand, and Laos–Vietnam partnerships have had a significant impact on the development and construction of Laos' ports, which are closely linked to the increasing geopolinomical influence of China, Thailand, and Vietnam and the development of Laos through geopolinomical advantages. The expansion of these ports in recent years is an example of the influence and response of the Laos–China, Laos–Thailand, and Laos–Vietnam geopolinomical policies on the port/border economic cooperation zone and LUC in the border areas.
Although border areas exhibit widespread deforestation in Laos within the geopolinomical context, there is also, interestingly, huge cropland-to-forest conversion in some areas (especially along the Laos–China and Laos–Thailand borders). The reasons and mechanisms behind this phenomenon are still unknown. Further research should integrate field investigations and comparative studies on a fine scale. At present, tree-based plantations (especially rubber) and growing forest conservation policies are important factors contributing to this phenomenon. On the one hand, due to the rapid increase in the price of natural rubber and the policies that encourage rubber plantations, rubber plantations have expanded rapidly (great than 50%) in MESA since the early 2000s (Ahrends et al., 2015; Zeng et al., 2018). A study revealed that new rubber plantations have mainly come from cropland, such as cassava and sugarcane plantations (37.72 %), old rubber plantations (27.63 %), and forests (24.12 %), in the six countries of the Great Mekong Subregion (GMS) since the late 1980s (Chen et al., 2023). According to the Association of Natural Rubber Producing Countries (ANRPC), the harvest area under rubber cultivation in Thailand at the end of 2019 was 3.5 million ha, followed by China, Vietnam, Myanmar, Cambodia, and Laos, with a gradual decrease from 1.16 to ~0.28 million hectares (ANRPC 2013). On the other hand, Thailand, Vietnam, and Laos have been enacting forest protection policies, such as logging bans, forest laws, and land allocation policies, since the late 20th century to eliminate shifting cultivation and encourage forest regeneration (Pichler et al., 2021; Li et al., 2022). These measures have succeeded, with increased forest coverage in Thailand, Cambodia, and Vietnam. Both planted and natural forests contribute to the growth of forest coverage, and both have contributed equally to the growth of forest coverage (Van Khuc et al., 2020; Paradis, 2021).
This study examines the spatiotemporal dynamics of LUC at the border of Laos in a geopolinomical context and considers country differences. As geopolinomical relations between Laos and its neighboring countries intensify, it will likely bring about a more dramatic LUC. Thus, it is essential to further explore how geopolinomical relations affect LUC in border areas and to identify the mechanisms and extent of such influence. Furthermore, it is essential to understand how borderland use responds to geopolinomical relations and quantitatively analyse its influence. Thus, more refined data, advanced models, and richer theories are required.
Through GIS spatial analysis, this study has examined the LUC dynamics in Laos' border areas and key ports compared to those of its neighboring countries (i.e., China, Vietnam, Cambodia, Thailand, and Myanmar). Based on the Global Land Cover Product (i.e., GLC_FCS30), the HI of LUC from 1985 to 2020 was also used. This study reveals the geographical characteristics and country-specific differences of Laos' border LUC during 1985–2020, since the country's reform and opening up, including overall characteristics, major change types, and country-specific difference patterns. Our study highlights the advantage of the time series of land-use products in quantifying the impacts of geopolinomical relations on border LUC.
In the last 36 years, Laos' border LUC has largely been characterized by the continuous expansion of cropland (2.4%, 4,615.8 km2) and construction land (88.1%, 1,183.0 km2) and a corresponding decrease in forest (-1.1%, 6,631.2 km2). LUC at the borders of China and Thailand has mainly occurred in the near-border areas, where HI has increased. Conversely, LUC along the Vietnam, Myanmar, and Cambodia borders has mainly occurred in the far-border areas, where HI has not increased significantly. Particularly, port areas represent the frontier of border LUC, accounting for 13.7% of total border construction land area in 1985 and growing to 18.8% in 2020. However, significant disparities exist between different border ports. In response to the decline in forests, finding a balance between felling and protecting forest resources is necessary. A key objective is accelerating the development of policies that protect forests and delineate ecological red lines and urban development boundaries. Moreover, given the national variations in land use arising from different degrees of geopolinomical context, the Laos government should not only maintain its collaboration with countries such as China, Vietnam, and Thailand but also improve its ties with Myanmar and Cambodia, possibly through developing ports and special economic zones. These pressing issues demand immediate attention from scientific researchers and the Laos government.
The raw data supporting the conclusions of this article will be made available by the authors, without undue reservation.
YW: Writing—original draft and data curation. CX: Writing—review and editing, data curation, funding acquisition, and supervision. All authors contributed to the article and approved the submitted version.
This study was supported by the National Natural Science Foundation of China (42371280, 42130508, and 42001226), the Strategic Priority Research Program of the Chinese Academy of Sciences (XDA28060302), and the Programme of Kezhen-Bingwei Excellent Young Scientists of the Institute of Geographic Sciences and Natural Resources Research, Chinese Academy of Sciences (2022RC002).
We acknowledge the contributions of specific colleagues, institutions, or agencies that aided our efforts. We also thank the valuable comments and/or suggestion of two referees to improve the manuscript.
The authors declare that the research was conducted in the absence of any commercial or financial relationships that could be construed as a potential conflict of interest.
All claims expressed in this article are solely those of the authors and do not necessarily represent those of their affiliated organizations, or those of the publisher, the editors and the reviewers. Any product that may be evaluated in this article, or claim that may be made by its manufacturer, is not guaranteed or endorsed by the publisher.
The Supplementary Material for this article can be found online at: https://www.frontiersin.org/articles/10.3389/ffgc.2023.1223605/full#supplementary-material
Ahrends, A., Hollingsworth, P. M., Ziegler, A. D., Fox, J. M., Chen, H., Su, Y., et al. (2015). Current trends of rubber plantation expansion may threaten biodiversity and livelihoods. Glob. Environ. Change 34, 48–58. doi: 10.1016/j.gloenvcha.2015.06.002
Boundeth, S., Nanseki, T., Takeuchi, S., and Satho, T. (2012). Land use change and its determinant factors in northern Laos: spatial and socioeconomic analysis. J. Agric. Sci. 4, 190–204. doi: 10.5539/jas.v4n12p190
Chen, B., Ma, J., Yang, C., Xiao, X., Kou, W., Wu, Z., et al. (2023). Diversified land conversion deepens understanding of impacts of rapid rubber plantation expansion on plant diversity in the tropics. Sci. Tot. Environ. 874, 162505. doi: 10.1016/j.scitotenv.2023.162505
Cotula, L. (2012). The international political economy of the global land rush: a critical appraisal of trends, scale, geography and drivers. J. Peas. Stu. 39, 649–680. doi: 10.1080/03066150.2012.674940
Deadman, P., Robinson, D., Moran, E., and Brondizio, E. (2004). Colonist household decisionmaking and land-use change in the Amazon Rainforest: an agent-based simulation. Environ. Plann. Desig. 31, 693–709. doi: 10.1068/b3098
Dovers, S. R., and Hezri, A. A. (2010). Institutions and policy processes: the means to the ends of adaptation. Wiley Interdis. Rev. Clim. Change 1, 212–231. doi: 10.1002/wcc.29
Flesch, A. D., Epps, C. J. W., Clark, M., Krausman, P. R., and Morgart, J.R. (2010). Potential effects of the United States-Mexico border fence on wildlife. Conserv. Biol. 24, 171–181. doi: 10.1111/j.1523-1739.2009.01277.x
Han, H., Yang, C., and Song, J. (2015). Scenario simulation and the prediction of land use and land cover change in Beijing, China. Sustainability 7, 4260–4279. doi: 10.3390/su7044260
Hu, Q., Yin, H., Friedl, M. A., You, L., Li, Z., Tang, H., et al. (2021). Integrating coarse-resolution images and agricultural statistics to generate sub-pixel crop type maps and reconciled area estimates. Remote Sens. Enviro. 258, 112365. doi: 10.1016/j.rse.2021.112365
Jiang, N., Li, P., and Feng, Z. (2022). Remote sensing of swidden agriculture in the tropics: a review. Int. J. Appl. Earth Observ. Geoinf. 112, 102876. doi: 10.1016/j.jag.2022.102876
Kuemmerle, T., Radeloff, V. C., Perzanowski, K., and Hostert, P. (2006). Cross-border comparison of land cover and landscape pattern in Eastern Europe using a hybrid classification technique. Remote Sens. Environ. 103, 449–464. doi: 10.1016/j.rse.2006.04.015
Kuttner, M., Hainz-Renetzeder, C., Hermann, A., and Wrbka, T. (2013). Borders without barriers–Structural functionality and green infrastructure in the Austrian–Hungarian transboundary region of Lake Neusiedl. Ecol. Indic. 31, 59–72. doi: 10.1016/j.ecolind.2012.04.014
Lamijo, L. (2016). The Development of Border Regions in Southeast Asia: Cross-border Trade in the Vietnam-Lao PDR Border Areas.
Li, P., Feng, Z., and Xiao, C. (2018). Acquisition probability differences in cloud coverage of the available Landsat observations over mainland Southeast Asia from 1986 to 2015. Int. J. Digo Earth 11, 437–450. doi: 10.1080/17538947.2017.1327619
Li, P., and Xiao, Z. (2022). Impervious surface expansion in the China-Laos border area under the context of geo-economic cooperation: a case study of the mohan-boten economic cooperation zone. GIScience Remote Sens. 59, 2184–2201. doi: 10.1080/15481603.2022.2154919
Li, X. L., Gao, J., Brierley, G., Qiao, Y. M., Zhang, J., Yang, Y. W., et al. (2013). Rangeland degradation on the Qinghai-Tibet plateau: implications for rehabilitation. Land Deg. Dev. 24, 72–80. doi: 10.1002/ldr.1108
Li, Y., Schaffer-Smith, D., Myint, S. W., and Zhu, Y. (2022). Monitoring ecological and environmental stress patterns over the past two decades in the Mekong River basin. GIScience Remote Sens. 59, 1817–1836. doi: 10.1080/15481603.2022.2139387
Li, Y., Xu, S., Fan, Z., Zhang, X., Yang, X., Wen, S., et al. (2023). Risk factors and prediction of the probability of wildfire occurrence in the china-mongolia-russia cross-border area. Remote Sens. 15, 42. doi: 10.3390/rs15010042
Liao, C., Feng, Z., Li, P., and Zhang, J. (2015). Monitoring the spatio-temporal dynamics of swidden agriculture and fallow vegetation recovery using Landsat imagery in northern Laos. J. Geograph. Sci. 25, 1218–1234. doi: 10.1007/s11442-015-1229-0
Liu, X., Jiang, L., Feng, Z., and Li, P. (2016). Rubber plantation expansion related land use change along the laos-china border region. Sustainability 8, 1011. doi: 10.3390/su8101011
Medeiros, E. (2018). Should EU cross-border cooperation programmes focus mainly on reducing border obstacles? Doc. Geog. 64, 467–491. doi: 10.5565/rev/dag.517
Paradis, E. (2021). Forest gains and losses in Southeast Asia over 27 years: the slow convergence towards reforestation. Forest Policy Econ. 122, 102332. doi: 10.1016/j.forpol.2020.102332
Perz, S. G., Qiu, Y., Xia, Y., Southworth, J., Sun, J., Marsik, M., et al. (2013). Trans-boundary infrastructure and land cover change: Highway paving and community-level deforestation in a tri-national frontier in the Amazon. Land use Policy 34, 27–41. doi: 10.1016/j.landusepol.2013.01.009
Pichler, M., Bhan, M., and Gingrich, S. (2021). The social and ecological costs of reforestation. Territorialization and industrialization of land use accompany forest transitions in Southeast Asia. Land Use Policy 101, 105180. doi: 10.1016/j.landusepol.2020.105180
Rowedder, S. (2020). Railroading land-linked Laos: China's regional profits, Laos' domestic costs? Eur. Geog. Econ. 61, 152–161. doi: 10.1080/15387216.2019.1704813
Song, T., Cheng, Y., Liu, W., and Liu, H. (2017). Spatial difference and mechanisms of influence of geo-economy in the border areas of China. J. Geograph. Sci. 27, 1463–1480. doi: 10.1007/s11442-017-1447-8
Sturgeon, J. C. (2013). Cross-border rubber cultivation between C hina and L aos: Regionalization by A kha and T ai rubber farmers. Singapore J. Trop. Geograph. 34, 70–85. doi: 10.1111/sjtg.12014
Tian, Y., Yin, K., Lu, D., Hua, L., Zhao, Q., Wen, M., et al. (2014). Examining land use and land cover spatiotemporal change and driving forces in Beijing from 1978 to 2010. Remote Sens. 6, 10593–10611. doi: 10.3390/rs61110593
Tscharntke, T., Klein, A. M., Kruess, A., Steffan-Dewenter, I., and Thies, C. (2005). Landscape perspectives on agricultural intensification and biodiversity - ecosystem service management. Ecol. Lett. 8, 857–874. doi: 10.1111/j.1461-0248.2005.00782.x
Van Houtum, H. (2005). The geopolitics of borders and boundaries. Geopolitics 10, 672–679. doi: 10.1080/14650040500318522
Van Khuc, Q., Le, T. A. T., Nguyen, T. H., Nong, D., Tran, B. Q., Meyfroidt, P., et al. (2020). Forest cover change, households' livelihoods, trade-offs, and constraints associated with plantation forests in poor upland-rural landscapes: evidence from north central Vietnam. Forests 11, 548. doi: 10.3390/f11050548
Veldkamp, A., and Lambin, E. F. (2001). Predicting land-use change. Agric. Ecosyst. Environ. 85, 1–6. doi: 10.1016/S0167-8809(01)00199-2
Wang, S., Zhu, A., Ge, Y., Liu, Y., and Xue, X. (2017). The spatio-temporal evolution of geo-economic relationships between China and ASEAN countries: competition or cooperation? Sustainability 9, 1064. doi: 10.3390/su9061064
Wang, Y., and Liu, Y. (2020). Central Asian geo-relation networks: evolution and driving forces. J. Geograph. Sci. 30, 1739–1760. doi: 10.1007/s11442-020-1810-z
Watcharejyothin, M., and Shrestha, R. M. (2009). Effects of cross-border power trade between Laos and Thailand: energy security and environmental implications. Energy Policy 37, 1782–1792. doi: 10.1016/j.enpol.2008.12.021
Woods, K. M., Wang, P., Sexton, J. O., Leimgruber, P., Wong, J., Huang, Q., et al. (2021). Integrating pixels, people, and political economy to understand the role of armed conflict and geopolitics in driving deforestation: the case of myanmar. Remote Sens. 13, 4589. doi: 10.3390/rs13224589
Xiao, C., Li, P., and Feng, Z. (2019). Monitoring annual dynamics of mature rubber plantations in Xishuangbanna during 1987-2018 using Landsat time series data: a multiple normalization approach. Int. J. Appl. Earth Obs. Geoinf. 77, 30–41. doi: 10.1016/j.jag.2018.12.006
Xiao, C., Li, P., Feng, Z., and Zheng, F. (2021). Global border watch: from land use change to joint action. Int. J. Appl. Earth Obs. Geoinf. 103, 102494. doi: 10.1016/j.jag.2021.102494
Yang, R., Wu, Q., Yang, Z., and Yang, S. (2022). Study on spatio-temporal changes of land use sustainability in southwestern border mountainous provinces in recent 20 years based on remote sensing interpretation: a case study in Yunnan Province, China. Land 11, 1957. doi: 10.3390/land11111957
Zeng, Z., Estes, L., Ziegler, A. D., Chen, A., Searchinger, T., Hua, F., et al. (2018). Highland cropland expansion and forest loss in Southeast Asia in the twenty-first century. Nat. Geosci. 11, 556–562. doi: 10.1038/s41561-018-0166-9
Zhai, J., Xiao, C., Feng, Z., and Liu, Y. (2022). Spatio-temporal patterns of land-use changes and conflicts between cropland and forest in the mekong river basin during 1990-2020. Land 11, 927. doi: 10.3390/land11060927
Zhang, X., Liu, L., Chen, X., Gao, Y., Xie, S., Mi, J., et al. (2021). GLC_FCS30: Global land-cover product with fine classification system at 30 m using time-series Landsat imagery. Earth Syst. Sci. Data 13, 2753–2776. doi: 10.5194/essd-13-2753-2021
Zhang, Y., Niu, X., Hu, Y., Yan, H., and Zhen, L. (2022). Temporal and spatial evolution characteristics and its driving mechanism of land use/land cover change in laos from 2000 to 2020. Land 11, 1188. doi: 10.3390/land11081188
Zheng, F., Huang, J., Feng, Z., and Xiao, C. (2021). Impact of the Kunmingandndash;bangkok highway on land use changes along the route between laos and Thailand. Land 10, 991. doi: 10.3390/land10090991
Keywords: land-use change (LUC), border areas, geopolinomical relations, border geography, Laos
Citation: Wang Y and Xiao C (2023) Spatiotemporal characteristics and the national variations of borderland use change in Laos within the geopolinomical context. Front. For. Glob. Change 6:1223605. doi: 10.3389/ffgc.2023.1223605
Received: 16 May 2023; Accepted: 27 July 2023;
Published: 31 August 2023.
Edited by:
Jiahua Zhang, Institute of Remote Sensing and Digital Earth, ChinaReviewed by:
Yongzhe Chen, Research Center for Eco-Environmental Sciences (CAS), ChinaCopyright © 2023 Wang and Xiao. This is an open-access article distributed under the terms of the Creative Commons Attribution License (CC BY). The use, distribution or reproduction in other forums is permitted, provided the original author(s) and the copyright owner(s) are credited and that the original publication in this journal is cited, in accordance with accepted academic practice. No use, distribution or reproduction is permitted which does not comply with these terms.
*Correspondence: Chiwei Xiao, eGlhb2N3QGlnc25yci5hYy5jbg==
†These authors have contributed equally to this work
Disclaimer: All claims expressed in this article are solely those of the authors and do not necessarily represent those of their affiliated organizations, or those of the publisher, the editors and the reviewers. Any product that may be evaluated in this article or claim that may be made by its manufacturer is not guaranteed or endorsed by the publisher.
Research integrity at Frontiers
Learn more about the work of our research integrity team to safeguard the quality of each article we publish.