
95% of researchers rate our articles as excellent or good
Learn more about the work of our research integrity team to safeguard the quality of each article we publish.
Find out more
ORIGINAL RESEARCH article
Front. For. Glob. Change , 09 January 2024
Sec. Forest Management
Volume 6 - 2023 | https://doi.org/10.3389/ffgc.2023.1214911
This article is part of the Research Topic Evidence-based options and forward-looking approaches for the conservation and management of diverse wet forests in times of rapid climate change View all 5 articles
 Bryan Finegan*
 Diego Delgado
 Alba Lorena Hernández GordilloNelson Zamora VillalobosRafael Núñez FlorezFabio Díaz Santos
 Sergio Vílchez Mendoza
Introduction: Tropical mountain rain forests (TMRF, natural forests at > 300 m asl) are globally important for biodiversity and ecosystem services and are believed to be highly vulnerable to climate change. But there are no specific approaches for rigorous assessment of their vulnerability at the landscape and local scales necessary for management for adaptation. We address the challenge of evaluating the ecological sensitivity to temperature of TMRF, applying a multidimensional approach in protected areas over a 440–2,950 m asl altitudinal gradient in Costa Rica, synthesizing results of a long-term research programme (2012-present). We evaluate the sensitivity to the current spatial temperature gradient of eleven ecosystem properties in three categories: forest composition and diversity, thermal characteristics of forest stands and forest structure and dynamics.
Methods: Data are from 29 to 32 plots of 50 m x 50 m (0.25 ha) distributed over the gradient, in which all trees, palms and tree ferns ≥ 10 dbh are identified to species and measured for recruitment, growth and mortality. An experimental study of leaf litter decomposition rates was carried out in twelve plots. Current and future (SSP 585, 2070) values of mean annual temperatures MAT were obtained from online climate surfaces. Thermal characteristics of forest stands were determined using MATs of species occurrences in GBIF and include a new index, the Community Thermal Capital Index (CTCI), calculated as CTI-MAT.
Results: We classified degrees of sensitivity to temperature as very weak, weak, moderate or substantial. All eleven ecosystem properties are substantially sensitive, so changes in their values are expected under rising temperatures. Species density, the community temperature index CTI, tree recruitment and mortality rates and leaf litter decomposition rates are positively related to temperature, while the community weighted mean thermal niche breadth, the CTCI, net basal area increments, stand basal area and carbon in aboveground biomass are negatively related. Results point to zones of vulnerability in the protected areas.
Discussion: In montane forests, positive values of the CTCI–climate credit– robust basal area growth and very low mortality and leaf litter decomposition rates suggest healthy ecosystems and no risk of mountaintop extinction. Lowland forests may be vulnerable to degradation and biotic attrition, showing current basal area loss, high mortality and climate debts. National and local actors are participating in a process of adoption of the sensitivity analysis and recommendations regarding zones of vulnerability.
Mountains cover 25% of the Earth’s surface and provide drinking water to 50% of humanity; they harbor 85% of the planet’s species of amphibians, birds, and mammals (Körner, 2007; Rahbek et al., 2019). Tropical mountain rain forests (TMRF: natural forests at > 300 m asl) are a major component of this biodiversity and the benefits it provides to people (Malhi et al., 2010). They are also considered to be highly vulnerable to degradation by climate change (Colwell et al., 2008; Pérez et al., 2016; Parmesan et al., 2022). The Intergovernmental Panel on Climate Change (IPCC) currently defines vulnerability as the propensity or predisposition to be negatively affected, adding that vulnerability comprises a variety of concepts and elements that include the sensitivity or susceptibility to harm of a socioecological system (Marshall et al., 2010). This approach to vulnerability analysis, thanks to its ease of empirical quantification, continues to be widely used (Gaughan et al., 2019; Ishtiaque et al., 2022) and is the approach we adopt in the present paper (Figure 1A).
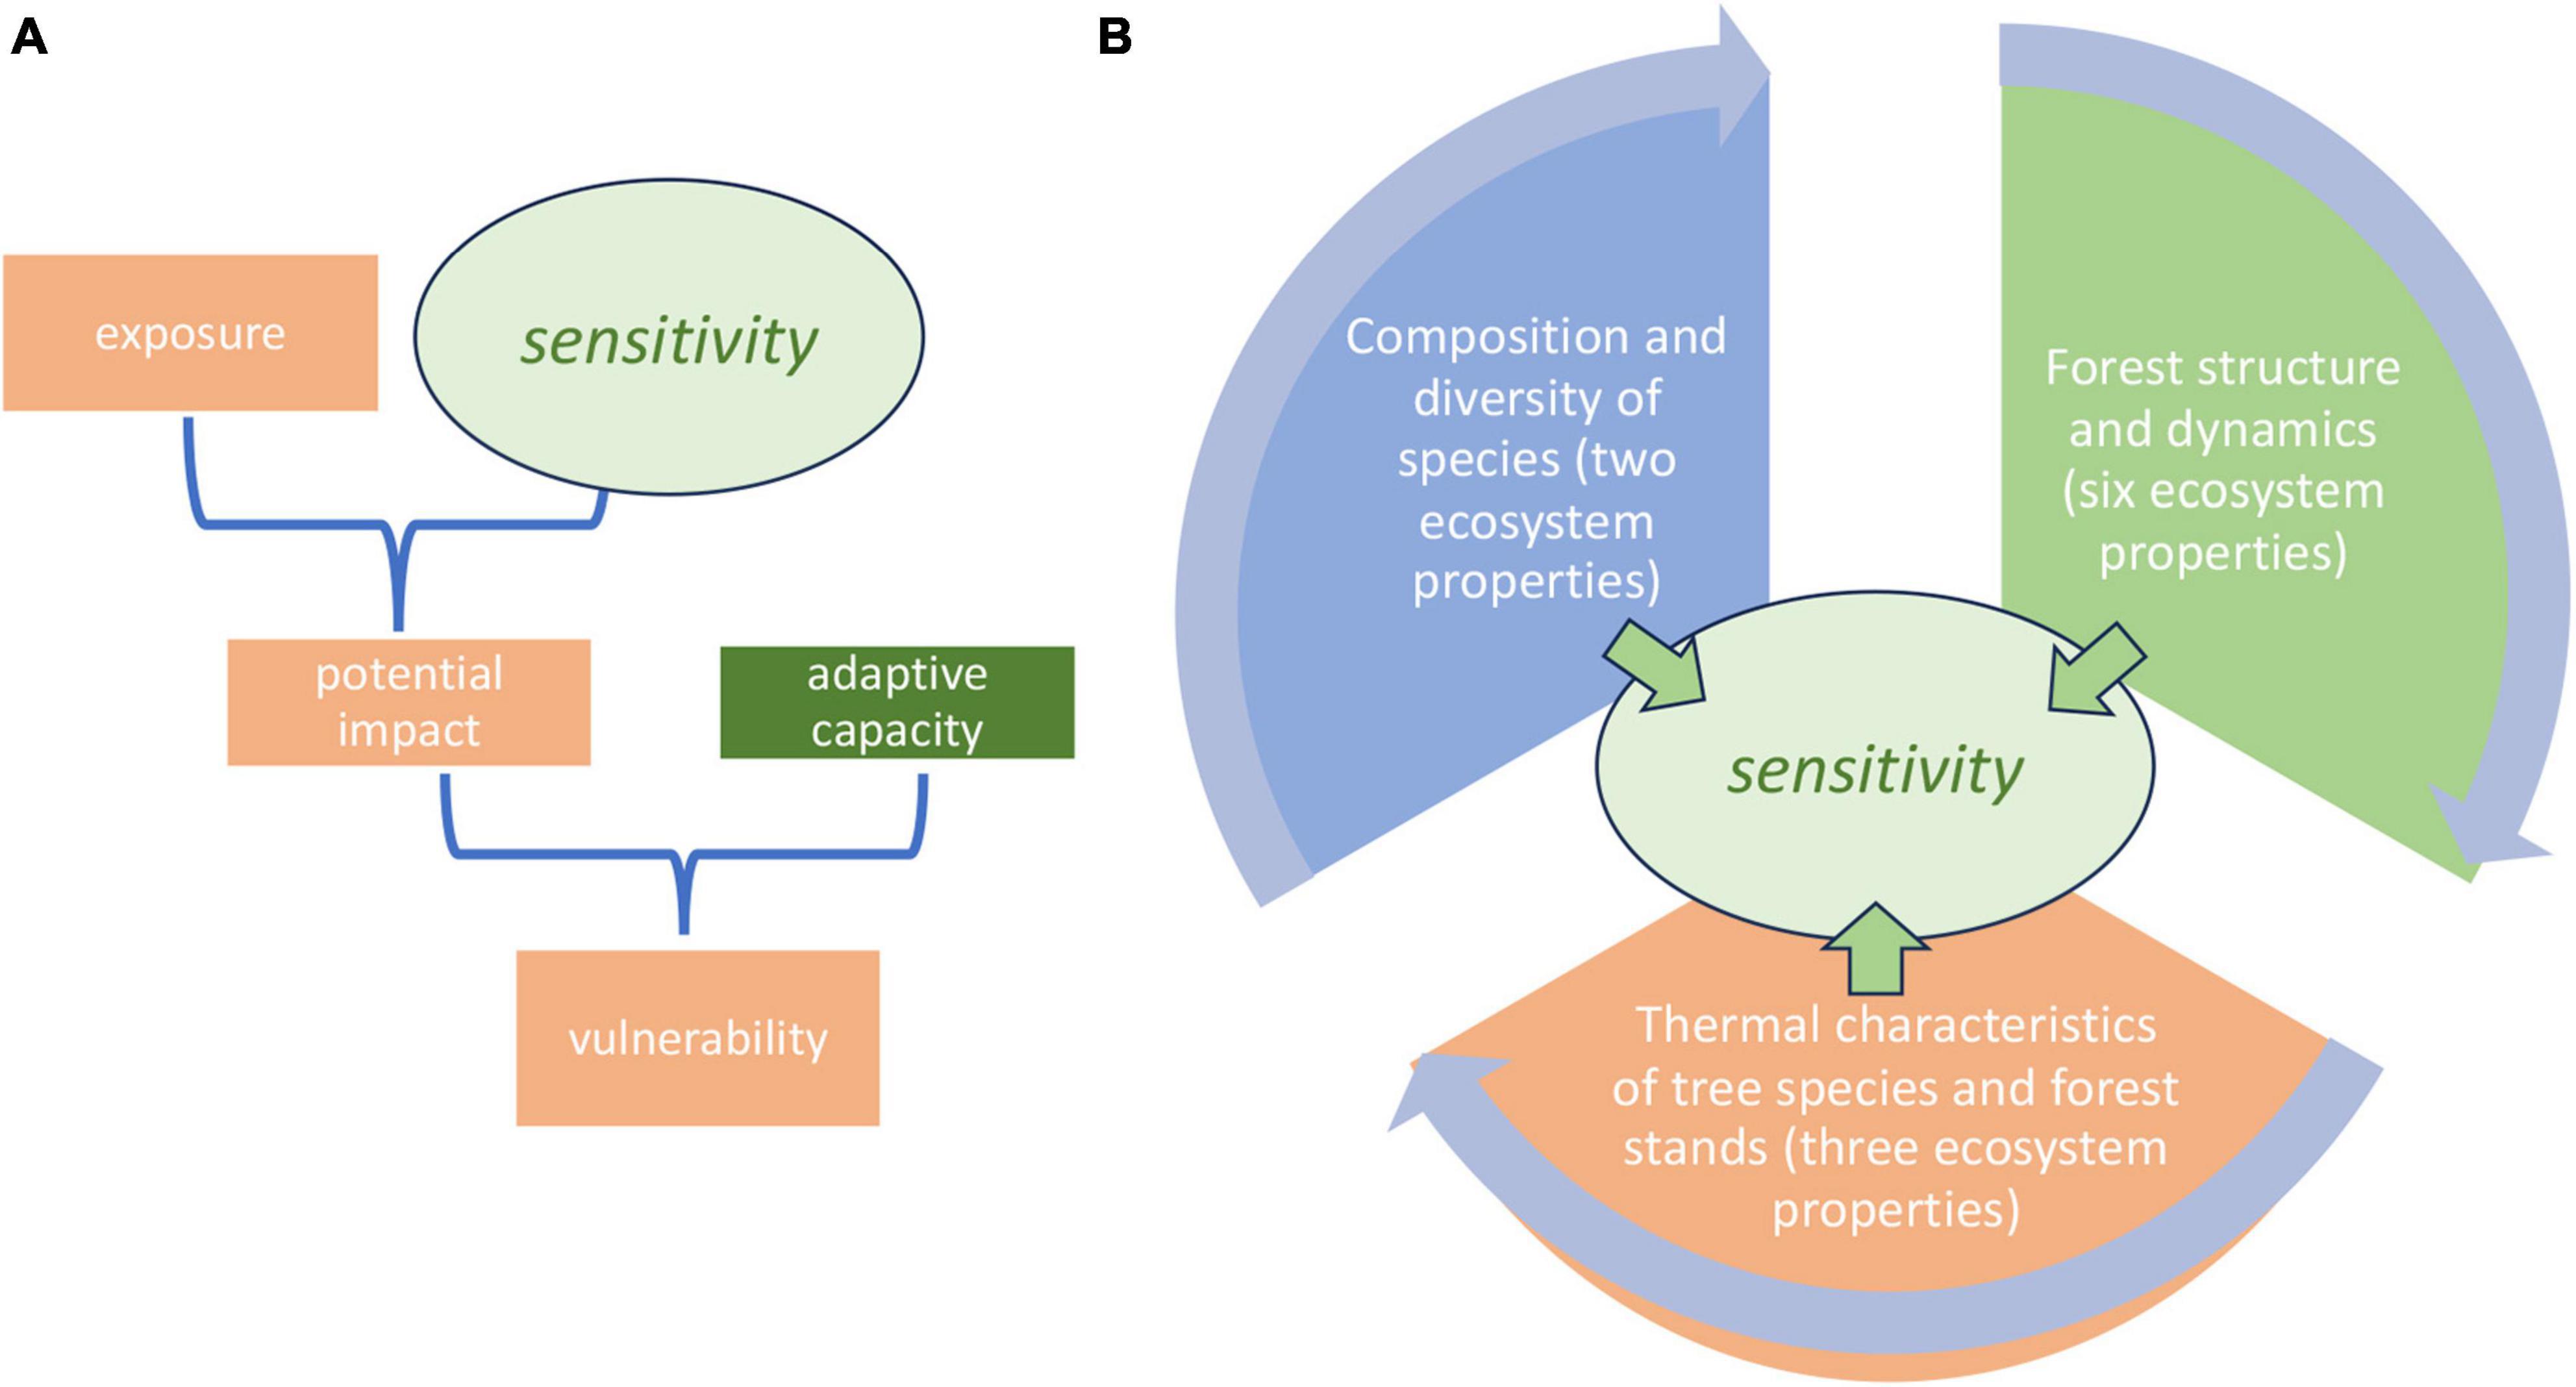
Figure 1. (A) Operative framework for climate change vulnerability analysis (Marshall et al., 2010); (B) ecosystem properties of tropical mountain rain forests proposed for the evaluation of the sensitivity component of the operative framework (this paper).
In relation to TMRF, we consider that the most challenging component of CCVA is the evaluation of the sensitivity of the rain forest ecosystem. Marshall et al. (2010) define sensitivity as the degree to which a system is affected, either adversely or beneficially, by climate-related stimuli. That temperature is one of the most important factors in the control of ecosystem properties and processes in TMRF is a long-established general principle (Grubb, 1977; Malhi et al., 2010): TMRF are therefore sensitive to temperature by this definition. But the multidimensional nature of ecosystems must be recognized in sensitivity evaluations for CCVA. Researchers and practitioners therefore need a tested and validated multi-dimensional set of ecosystem properties for an integrated evaluation of ecosystem sensitivity. Testing and validation require research-based understanding of the predicted sensitivity of these properties to the main climate-related stimuli. The management plans of the protected areas in our research area are among the initiatives that reflect this need, identifying the strategic goal of managing biodiversity through an ecosystem approach based on scientific and technical foundations (Sistema Nacional de Áreas de Conservación [SINAC], 2014, 2016a,b). But what are the specific ecosystem properties that will be measured to define these foundations?
To contribute to the development of approaches for CCVA of tropical mountain rain forests, in this paper we evaluate the sensitivity to the current spatial temperature gradient of eleven ecosystem properties we consider to be potentially valuable for sensitivity analysis in the context of CCVA (Figure 1B). We focus on the landscape and local scales. All these ecosystem properties, with one exception, can be measured using tree data (species, diameter at breast height) from standard permanent sample plots, combined with easily accessed data from online platforms that permit the characterization of the thermal characteristics of species and stands. The exception, leaf litter decomposition rates, can be measured using additional well-tested and low-cost field techniques and basic laboratory facilities. High sensitivity to spatial temperature gradients may mean high vulnerability to rising temperatures, depending on the degree of exposure to climate change and the social and institutional adaptive capacity to manage for adaptation (Bouroncle et al., 2017; Figure 1A). We carry out our evaluation using data from a long-term research programme in protected areas on an altitudinal gradient in Costa Rica. The evaluation is partly based on the results of published research by our programme, and partly on the testing of new hypotheses, published here for the first time.
Following Malhi et al. (2010) the research in our long-term programme is designed to detect the effects of spatial and temporal temperature gradients on the properties of rain forest ecosystems. In the context of CCVA, the exposure to rising temperatures of our altitudinal gradient is high: first, using five general circulation models and four then-current IPCC emissions scenarios, Nogués-Bravo et al. (2007) modeled rises of mean annual temperature for tropical American mountains in the range 1.8–2.7°C for 2055 and 2.4–4.6°C for 2085. Second, our programme used a spatially downscaled climate change model to determine that our altitudinal gradient is highly exposed to climate change for the period 2012–2080, in terms of ten temperature variables (Delgado et al., 2016). This focus on temperature is possible, and necessary, because the ecosystems are not currently subject to periodic or annual water deficit, and climate change is not expected to lead to water deficits in the future (Imbach et al., 2018).
The first two ecosystem properties we evaluate are ecosystem species composition and plot-level species density (Figure 1B). Besides being fundamentally important ecosystem properties in themselves, both these components of plant biodiversity are correlated at different scales with the magnitude of ecosystem processes such as primary production (Harrison et al., 2006; Poorter et al., 2015), and ecosystem stability in the face of climate variability (Oliveira et al., 2021). The evaluation of these two properties contributes to the conservation of the main forest ecosystems of the protected areas, identified as focal management elements in the current management plans (Sistema Nacional de Áreas de Conservación [SINAC], 2014, 2016a,b).
Previous work in Central American TMRF has evaluated the regional-scale ecological sensitivity of forest composition indirectly, using broadly defined natural ecosystem types. Fung et al. (2017) modeled the potential distributions of Costa Rican phytogeographic units, which are delimited using bioclimatic and biogeographic criteria (Zamora, 2008), for the 2041–2060 period under RCP 4.5. Their models suggested a significant reduction of the extent of the Talamanca Cordillera rain forest phytogeographic unit of which our research area is part, showing how the inherent temperature sensitivity of the vegetation gives rise to changes in ecosystem distributions under climate change. Phytogeographic units and the modeling of potential vegetation, however, are most relevant to national-scale priority-setting for conservation, such as the gap analysis carried out by Zamora (2008). The scale of phytogeographic units is too coarse as a basis for management for adaptation. This is because first, foreseeable management interventions will be made at the landscape scale, for example to maintain or restore connectivity, or at the scale of the stand and the individual, to assist species migrations; and second, because as we will see, phytogeographic units show considerable internal heterogeneity of ecosystem structure, composition and process rates, meaning that interventions will have to be designed and implemented with a fine-grained approach.
The main question of our paper is, how sensitive to the current spatial temperature gradient are the principal ecosystem properties of these tropical mountain rain forests? We assign each ecosystem property to one of three categories.
Landscape-scale variation of forest stand species composition is the first ecosystem property we evaluate (Table 1). Temperature-sensitive variation of forest stand species composition is expected to be accompanied by variation of stand-scale species diversity, which is the second ecosystem property we evaluate. Although the sensitivity of species diversity to temperature should be considered indirect, as in general it responds to energy availability and ecosystem productivity (Rahbek et al., 2019), it is a meaningful ecosystem property for many actors, is a globally outstanding characteristic of the TMRF biome (Rahbek et al., 2019) and is relatively easy to measure in forest plots. The sensitivity of species diversity metrics to climate gradients is very well-documented. Species richness declines on altitudinal gradients (Rahbek, 1995; Lieberman et al., 1996; Girardin et al., 2014), so it is predicted to increase under rising temperatures. Upslope species range shifts on mountains have been demonstrated frequently (e.g., Freeman et al., 2018) and as a consequence, plant species richness is increasing at an accelerating rate on European mountain summits in response to warming, due to migration and with a probably low degree of migration lag (Steinbauer et al., 2018). On the other hand, the local extinction of species of montane ecosystems has been identified as a particular threat to TMRF and may be associated with declines of species richness (Colwell et al., 2008; Mata-Guel et al., 2023). If montane species become locally extinct, species diversity would decline unless upward range shifts of species adapted to higher temperatures occur. For Costa Rica’s Central Volcanic Cordillera, Colwell et al. (2008) found little evidence for such mountaintop extinctions. Rather, they emphasized that future temperatures in the tropical lowlands may be beyond the current tolerances of any lowland species. This scenario raises the possibility of lowland biotic attrition, conceived by Colwell et al. (2008) as a net loss of species richness in the tropical lowlands due to intolerable temperature increases: local extinctions and upslope range shifts.
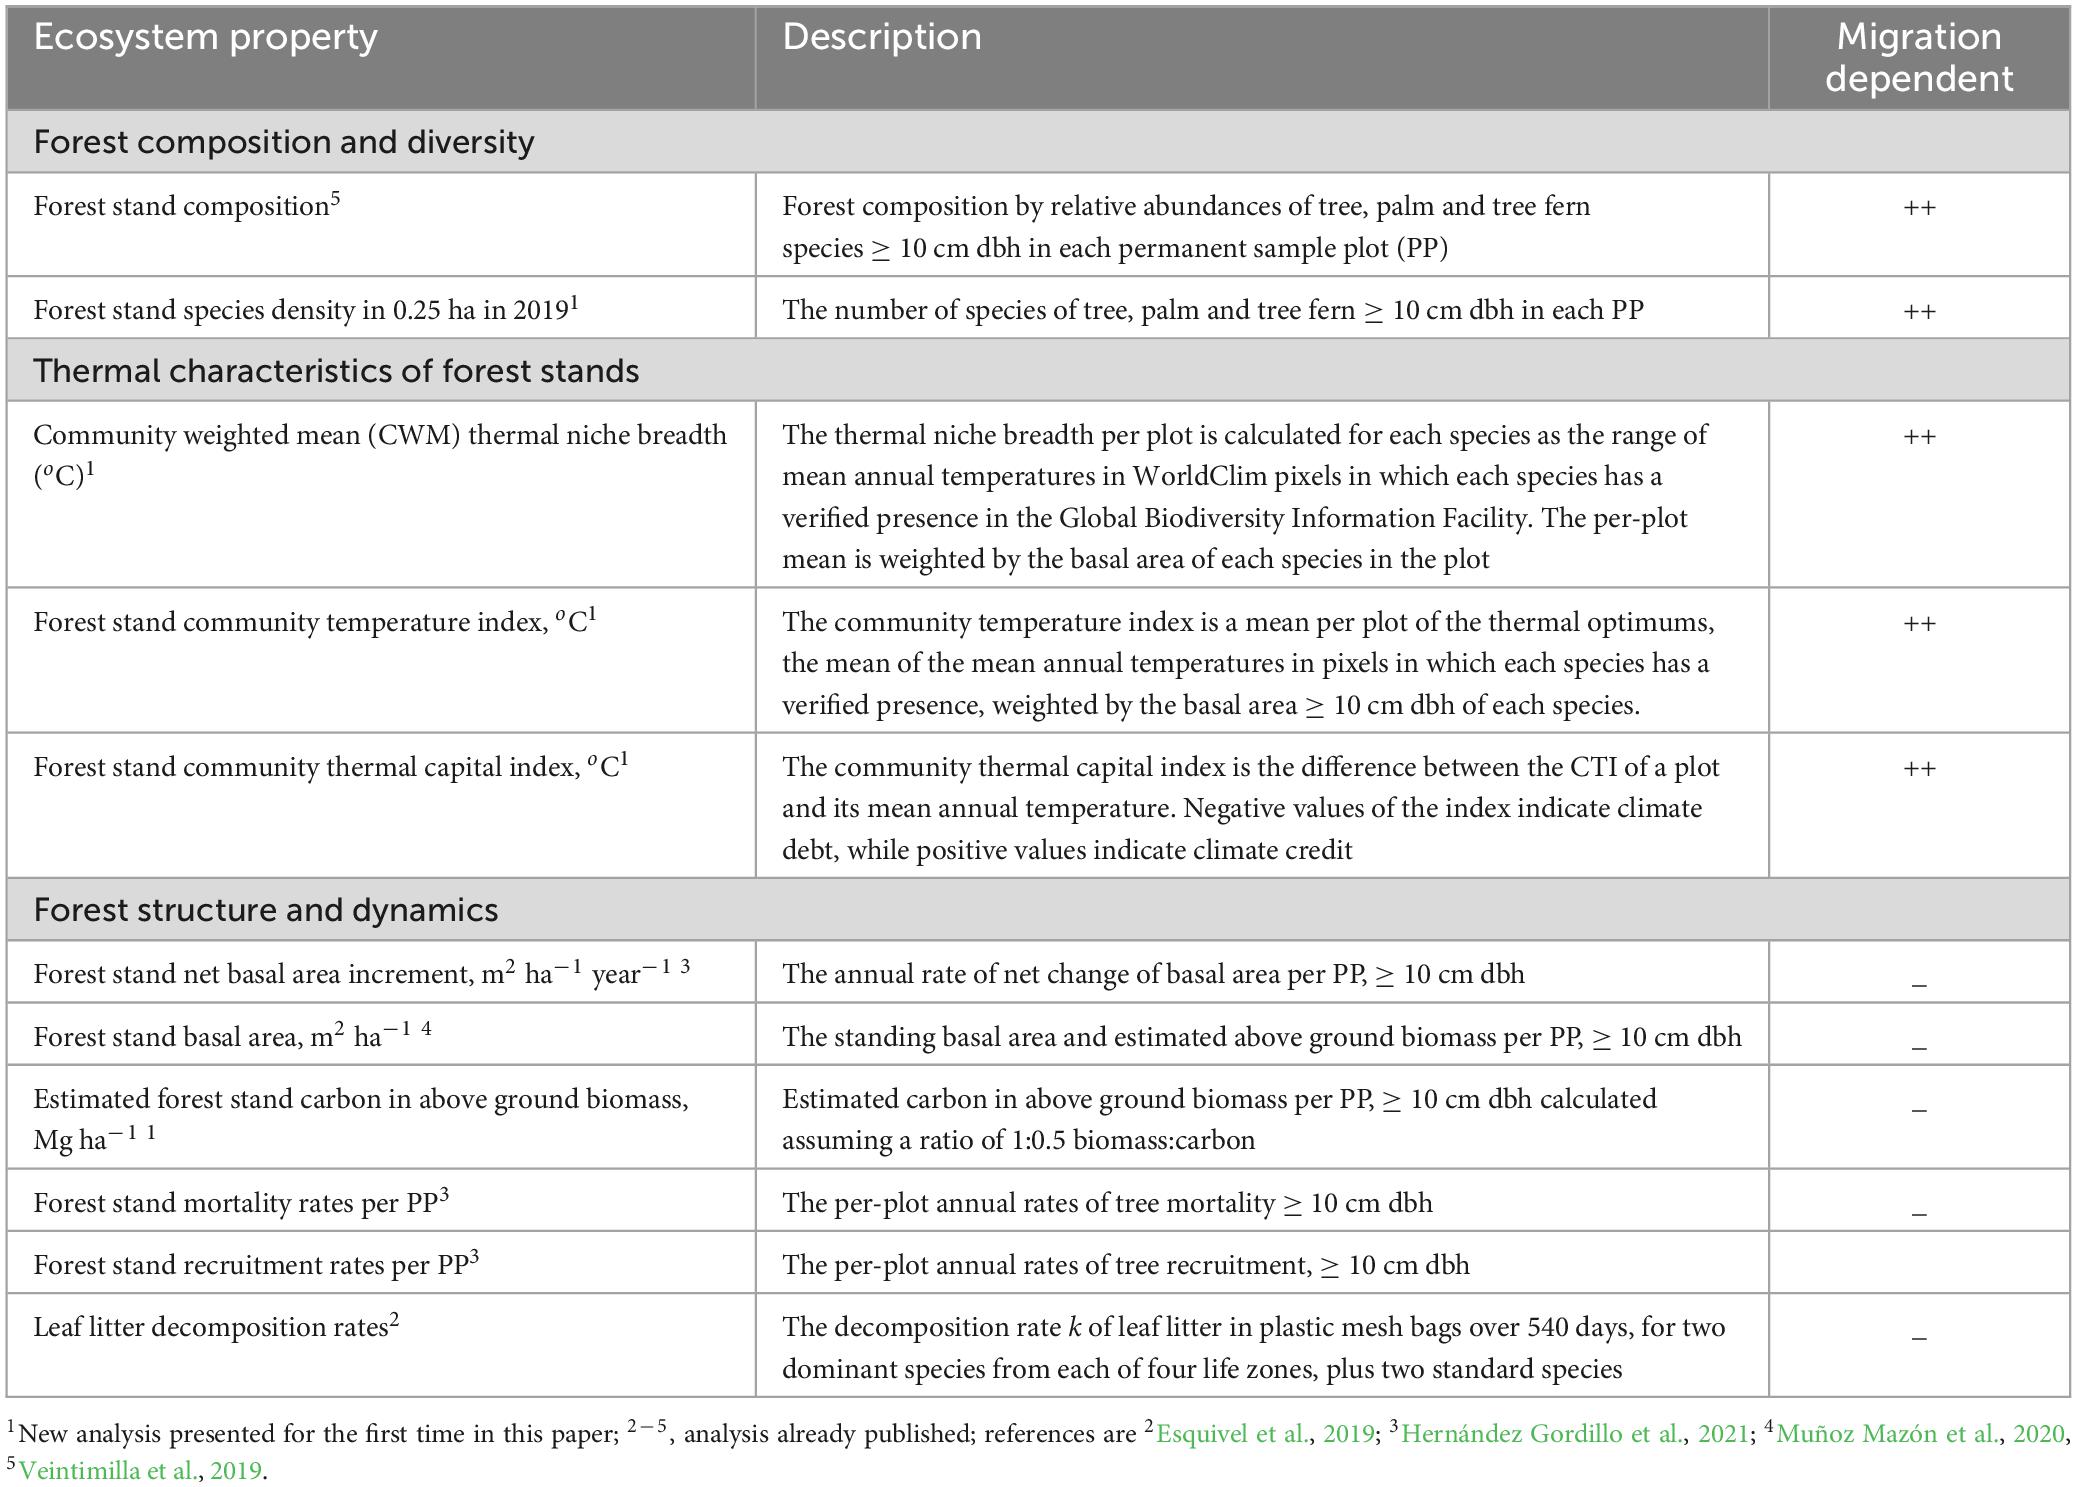
Table 1. Forest ecosystem properties used in the evaluation of ecological sensitivity to the spatial temperature gradient of mature tropical mountain rain forests in protected areas of the Talamanca Cordillera, Costa Rica.
Recent advances in the availability of global-scale climate surfaces and georeferenced species presence data permit the extension of trait-based ecology (Díaz and Cabido, 2001; Reich, 2014) to the approximation of thermal niche traits of tree species and the thermal characteristics of forest stands (Fadrique et al., 2018; Cuesta et al., 2020). The evaluation of species and communities by thermal niche traits – which are response traits in the terminology of Díaz and Cabido (2001) - offers more direct evaluations of sensitivity to temperature than do species-based descriptors of forest diversity (Fadrique et al., 2018; Cuesta et al., 2020).
Here, then, we evaluate the temperature sensitivity of three thermal characteristics of the tree species and forest stands in our research area, each of which is obtained at the level of the individual permanent plot. The first of these is the community temperature index CTI, a potentially valuable indicator of the effects of rising temperatures (Fadrique et al., 2018; Figure 1B; Table 1). We predicted a positive relationship between this index and temperature. We propose a new index, the community temperature capital index CTCI, as CTI-MAT, and determine its relationship to altitude. Negative differences between CTI and mean annual temperature suggest a climate debt exists, which would be evidence of a mismatch between the thermal adaptation of a community and the prevailing temperature regime (Richard et al., 2021). However, the difference between CTI and current MAT may be positive. Positive values of this community thermal characteristic suggest that a forest stand may be adapted to a certain magnitude of temperature increase – in other words, it is in a state of climate credit. The use of the word capital in the name of the index accounts for either state, climate debt or climate credit. Finally, we calculate the community weighted mean (CWM) thermal niche breadth for each sample plot and determine its relationship to mean annual temperature. This index permits an indirect test of the climate variability hypothesis, that lowland locations with reduced seasonal temperature variation select for species with narrower thermal ranges (Stevens, 1992; Cuesta et al., 2020) than montane areas with wider ranges of temperature variation, as found by Klipel et al. (2022) for the Brazilian Atlantic Forest biome. We therefore hypothesize that CWM thermal niche breadth has a negative relationship to temperature, so that the mean thermal niche breadth should decrease with increasing mean annual temperature.
These hypothesis tests on thermal characteristics of tree species and forest stands are published here for the first time for our landscape.
Temperature effects on forest stand dynamics are a key component of our approach to sensitivity analysis. Forest stand dynamics - rates of tree recruitment, stand growth, for example in terms of gross and net basal area increments, and tree mortality - are a fundamentally important ecosystem property (Malhi et al., 2015). Critically, forest stand dynamics and key components of the carbon cycle are strongly dependent on climate variability, independently of forest taxonomic composition. Annual aboveground productivity of lowland rain forests, for example, varies in relation to interannual variation in nighttime temperatures and rainfall patterns; medium-term reductions of productivity may occur, with potential effects on the global carbon budget if they were to become long-term under climate change (Clark et al., 2010, 2015; Sullivan et al., 2020).
We evaluate the temperature sensitivity of TMRF in terms of six forest structure and dynamics ecosystem properties (Table 1; Figure 1B): forest stand net basal area increment, forest stand basal area, tree recruitment and mortality rates using published results of Muñoz Mazón et al. (2020) and Hernández Gordillo et al. (2021), carbon in above ground biomass, using a new analysis, and leaf litter decomposition rates, a key process of the carbon cycle, highly sensitive to temperature and rainfall gradients in the tropics (Powers et al., 2009). We evaluate the temperature sensitivity of leaf litter decomposition rates on our gradient using experimental results published by Esquivel et al. (2019).
Species migration is a critically important process in the adaptation of ecosystems to climate change (Arneth et al., 2020; Richard et al., 2021). Migration is only a component of sensitivity as we have defined it in this paper, however, if seed production and dispersal, seedling establishment and generation time (Engler and Guisan, 2009) change in response to spatial and temporal temperature gradients. Because of lack of data, at this point in time we can only assume that this is not the case; however, we strongly believe that for the purposes of CCVA, the sensitivity of an ecosystem property must be weighted according to whether changes in its values depend on migration or not (Table 1). This point is evaluated in our discussion.
Finally, given the high exposure of the TMRF of our gradient to rising temperatures, what are the implications of the sensitivity of the eleven ecosystem properties for adaptation of these mature forests to climate change during the 21st century? This final question is one of the main subjects of our discussion.
This research programme is being carried out in Costa Rica, in state-owned and private protected areas on the Caribbean slope of the Talamanca Cordillera (Figure 2), part of the Mesoamerican biodiversity hotspot, megadiverse for plant species (Rahbek et al., 2019) and one of the Five Great Forests prioritized by international conservation organizations in Mesoamerica.1 Studies of the Quaternary history of Costa Rican forest ecosystems establish the overall sensitivity of the forests of these protected areas to climate change, as well as their capacity to adapt to climate change, at least in the long-term context of the Holocene (Islebe and Hooghiemstra, 1997; Anchukaitis and Horn, 2005; Wu et al., 2019). The regional, millennial-scale climatic processes of the Holocene and the high topographical heterogeneity of the Talamanca mountains have undoubtedly contributed to their high biological diversity (Trew and Maclean, 2021).
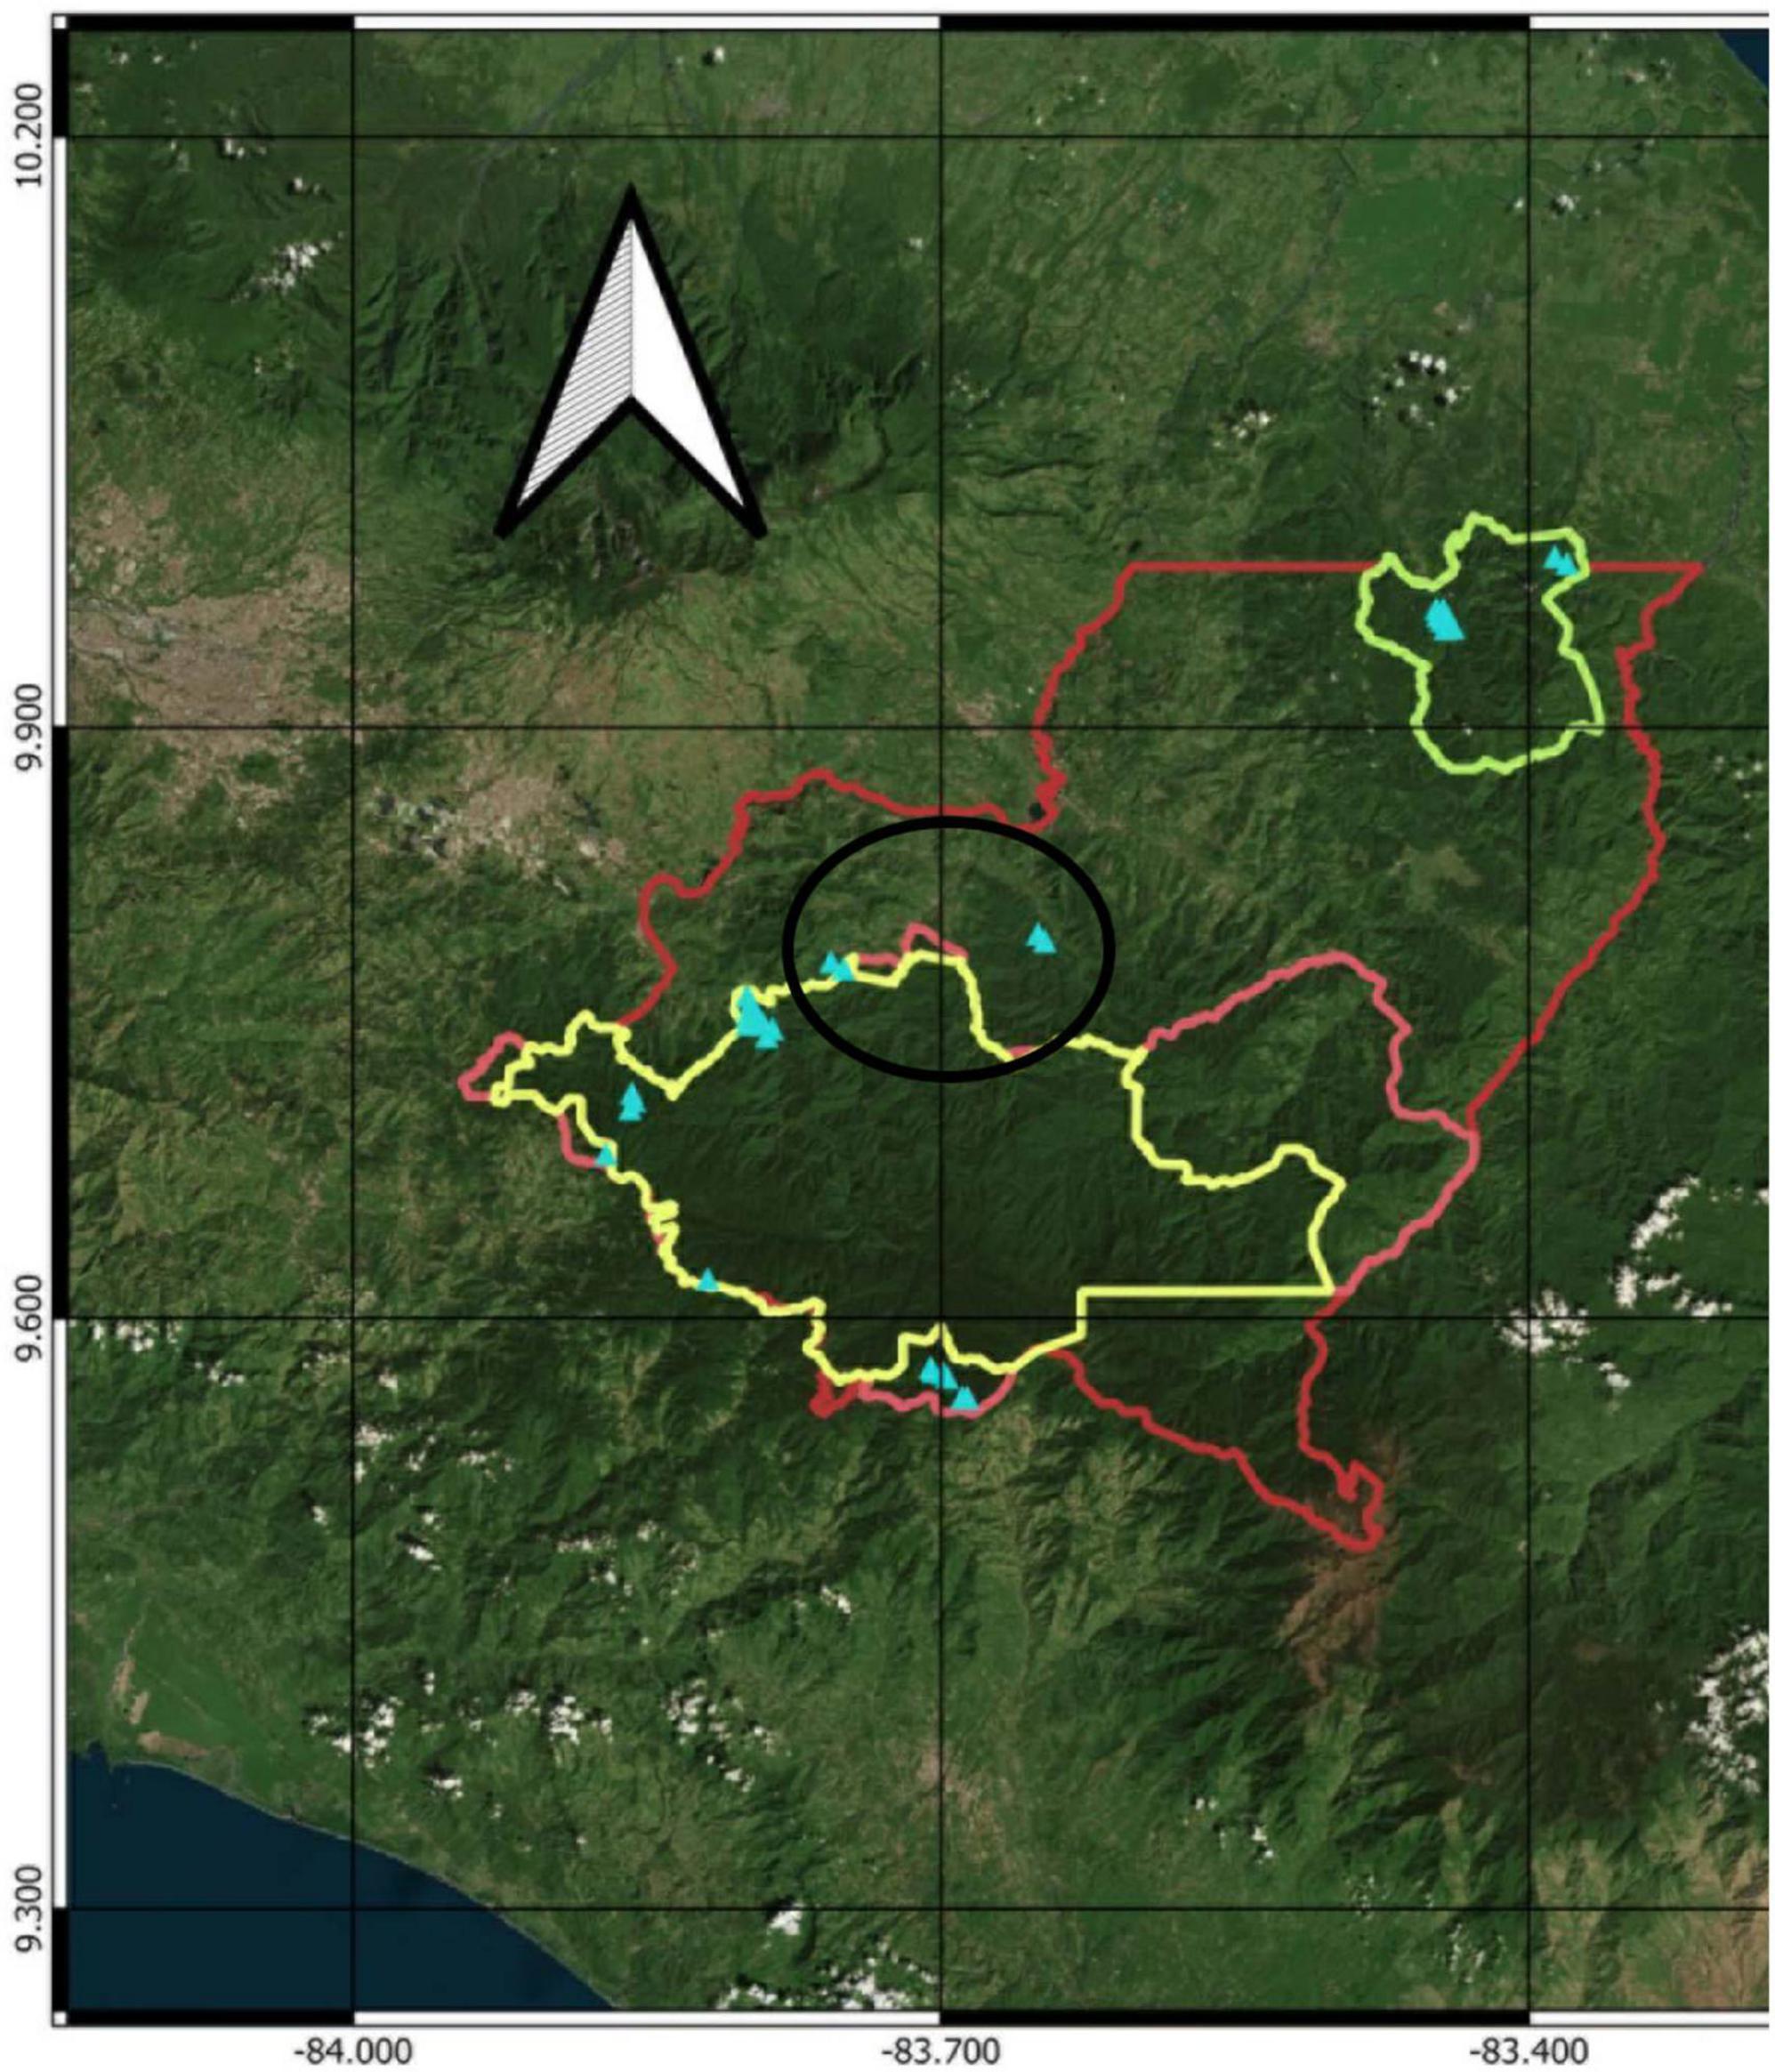
Figure 2. Map of our study area on the eastern slope of the Talamanca Cordillera, Costa Rica (red outline). Blue triangles show the locations of permanent sample plots. State protected areas shown are Barbilla National Park [light green outline, northeast of the study area; altitudinal range of plots 440–620 m asl, mean annual temperature range (Chelsa) 23.9–23.2°C]; Tapantí-Macizo de la Muerte National Park (yellow outline, altitudinal range of plots 1,400–2,600 m asl, mean annual temperature range 18.4–13.6°C); and Rio Macho Forest Reserve (pink outline). Plots in the altitudinal range 1,000–1,120 m asl (black oval, temperature range 20.9–19.9°C) are in private protected areas.
The protected areas are located on a 430 m to 2,950 m asl altitudinal gradient, and climatic and biophysical detail are presented in Veintimilla et al. (2019). The main Holdridge life zones in the study area are tropical wet forest, premontane rain forest, lower montane rain forest and montane rain forest (Holdridge, 1967). WorldClim data for the pixels in which our plots are located indicate that current mean annual temperatures on the gradient range from 24.3°C at 440 m asl to 10°C at 2,950 m asl. Annual rainfall, also from WorldClim data, ranges from 2000 mm at 2,950 m asl to around 4,000 mm at 1,200 m asl. Water is not limiting at any point on this altitudinal gradient, allowing us to focus on ecological sensitivity to temperature (cf. Malhi et al., 2010) and rainfall is expected to increase during the present century (Delgado et al., 2016). In the lowest and premontane zones, soils are predominantly Ultisols belonging to the suborder Humult, and Inceptisols belonging to the suborders Tropept, Aquept and Andept. At 0–30 cm depth, these soils are acid over the whole gradient (pH 4–5), dominated by clays in the tropical wet forest life zone and predominantly sandy over the rest of the gradient, with high carbon-nitrogen ratios at altitudes > 2,000 m asl and cation exchange capacity strongly negatively related to altitude (Veintimilla et al., 2019).
The state-owned protected areas are Barbilla National Park, Tapantí-Macizo de la Muerte National Park and the Rio Macho Forest Reserve (Figure 2). Together, these protect 93,000 ha of mainly mature TMRF. These protected areas are part of the Amistad Biosphere Reserve, a vast and internationally important conservation area.2 Tapantí-Macizo de la Muerte conserves paramo and peatlands as well as TMRF. Management plans from the years 2014 and 2016 are focused on general objectives including the conservation of ecosystems and the goods and services they provide, with emphasis on water resources, as well as the maintenance of connectivity with other protected areas including territories and sites vital to the Cabecar ethnicity. The first private protected area is El Copal, which is run by a local organization and comprises 177 ha of mature TMRF as well as other ecosystems.3 The other is Quijote, a 700 ha private farm.4
A total of 32 permanent sample plots (PPs) each with an area of 0.25 ha (50 m × 50 m) and distanced from each other by a minimum of 300 m, were installed in 2012. Plots were set up in homogeneous areas of primary forests located on hillsides without evidence of recent human intervention. Plots were positioned by walking a transect from the access point in such areas until a site meeting the following criteria was reached: we avoided recent large tree fall gaps and steep slopes, to reduce possible slope effects on the testing of our main hypotheses: median slope of plots measured with a clinometer was 25°, with a minimum of 15°and a maximum of 36°.
Of the original set of 32 PPs, ten were in the Tropical Wet Forest Life Zone, four in the Premontane Rain Forest life zone, seven in the Lower Montane Rain Forest life zone and twelve in the montane rain forest life zone. For the final set of 29 PPs, these numbers were reduced to eight, four, six, and twelve, respectively, for logistical reasons.
The original set of 32 plots was measured in 2012 (Veintimilla et al., 2019) and the 29 plots of the final set were subsequently measured five times over a 7-year period, 2012–2019 (Hernández Gordillo et al., 2021). We measured stem diameter of all trees, palms, and tree ferns ≥ 10 cm diameter using a metal tape. Stem diameters were measured at breast height (dbh, 1.3 m) or 20 cm above buttresses or deformations. Of the total of 4,008 trees evaluated at least once over the 7 years, 82 (2.04%) had two or three stems ≥ 10 cm dbh. These multiple-stemmed trees were treated as single individuals for calculations of all response variables.
Data for all trees, palms, and tree ferns, ≥ 10 cm diameter at breast height (DBH, 1.3 m) are analyzed in the present paper. Full botanical identification is maintained under the supervision of Zamora and we review species names on the TNRS portal (Taxonomic Name Resolution Service), available at: http://tnrs.iplantcollaborative.org, and taxonomy at the family level following the APG classification system IV, available on the Missouri Botanical Garden portal: https://www.missouribotanicalgarden.org (APG, 2016).
We evaluated the sensitivity to the spatial temperature gradient of eleven ecosystem properties as outlined in our introduction (Table 1). Forest species composition and alpha diversity were evaluated for the year 2012 using Veintimilla et al. (2019; n = 32 PPs), and one new analysis was carried out using the most recent measurement of the plots (n = 29 PPs). Veintimilla et al. (2019) used a Non-Metric Multidimensional Scaling (NMS) ordination to describe patterns of floristic composition on the gradient and variation partitioning (VARPART) to determine the compositional variation explained by altitude, soil, and spatial variables quantified using Principal Components of Neighbor matrices. They used linear regressions to explore the relationship between four alpha diversity metrics and altitude. In this paper, we used linear regression to determine the relationship of species density in 2019 to mean annual temperature obtained from CHELSA climate surfaces as described below.
We carried out new analyses of the relationship of the thermal characteristics of forest stands to CHELSA mean annual temperatures (MAT) using linear regression. Thermal characteristics were measured using the following procedures
We first obtained all records of occurrences of each of 410 species recorded in our plots in the GBIF (Global Biodiversity Information Facility) data portal, together with the annual mean temperature (MAT; C°) in CHELSA-Bio1 (Karger et al., 2017)5 corresponding to each GBIF record. Only records from Central America were used, including Panama and the state of Chiapas in southern Mexico6 (data were downloaded on December 19, 2019).7 The geographic information was downloaded through the GBIF function of the ‘Rgbif’ library in R Chamberlain and Boettiger (2017). The data were checked and filtered, eliminating duplicate occurrences, georeferencing and/or projection errors and points in anomalous areas such as bodies of water. Subsequently, the species occurrence data from the GBIF was superimposed on the CHELSA mean annual temperature (MAT) raster layer, which has a resolution of 30-arccosine (equivalent to approximately 1 km2 on the Equator) (Karger et al., 2017) and the MAT corresponding to each species occurrence obtained.
We obtained the thermal niche breadth of each species as the difference between the minimum and the maximum MAT recorded for it, after excluding extreme climate values by taking only the central 95% quantile of the data for each species, therefore reducing the influence of outliers and georeferencing errors on the results (Fadrique et al., 2018). Then, we calculated the community weighted mean thermal niche breadth of dominant species for each plot, using basal area as the weighting variable. In line with principles of forest functional ecology, dominant tree species were defined as the species that make up at least 80% of the total basal area in the plot (Finegan et al., 2015; Hernández Gordillo et al., 2021). Where one species made up 80% of stand basal area, always Quercus sapotifolia in montane forest plots, the CWM was set as the thermal niche breadth of this species. We tested the hypothesis that mean thermal niche breadth increases with decreasing temperature using linear regression.
We calculated the forest stand community temperature index for each permanent sample plot using the procedures described in Fadrique et al. (2018), as follows.
First, the thermal optima of each of the 410 species (TO; C°) identified in the plots were obtained as the mean value of the MATs where each species is recorded in the GBIF. For the calculation of TOs, we again excluded extreme climate values as described for the community weighted thermal niche breadth. The TO of each species was calculated as the mean MAT for those species with n > 10 occurrences. For individuals identified at the genus level the MAT values of all occurrences at the genus level were used. Finally, the basal-area weighted community temperature index (CTI; C°) was calculated for each plot from the following formula:
Where n is the number of species in the plot, TOi is the thermal optimum of species i, and BAi and BAplot are the basal area (m2) of species i and of the plot, respectively.
We based the calculation of a Community Thermal Capital Index (CTCI, oC) on the concept of climate debt (Steinbauer et al., 2018; Richard et al., 2021). A climate debt accumulates when the rate of change of community composition is slower than that of climate (Richard et al., 2021). We calculated the CTCI for each plot as the difference between CTI and current CHELSA MAT. Negative values of the CTCI suggest a climate debt, but positive values occur and suggest a forest stand resistant to a degree of temperature increase. We determined the relationship of the CTCI to MAT using linear regression.
We determined the temperature sensitivity of forest structural variables first, by evaluating the results of Muñoz Mazón et al. (2020) regarding the relationship between plot basal area ha–1 ≥ 10 cm dbh and altitude, determined by them using linear regression. The relationships to altitude of net increments of basal area, in m2 ha–1 yr–1, and annual rates of recruitment and mortality of individuals ≥ 10 cm dbh, were determined by Hernández Gordillo et al. (2021) with generalized additive models (GAMs) using the “gam” function of the “mgcv” library in R. To select the best GAMs, they evaluated models with > 4 effective degrees of freedom, as well as smoothed graphs.
We present a new analysis of the relationship of carbon in above ground biomass to CHELSA MAT. Above ground biomass was estimated for each permanent sample plot using a set of four equations (Table 2). Díaz Santos (2017) found that four equations were necessary because the allometric relationships used for estimating tree above ground biomass differ among forest types (Chave et al., 2005; Álvarez et al., 2012), because AGB of very large trees may be best estimated with specific equations (Álvarez et al., 2012), and because specific equations are required for palms (Goodman et al., 2013), which are abundant in the forests of our landscape up to approximately 1,000 m asl (Veintimilla et al., 2019). Carbon was obtained from estimated biomass assuming the ratio 1:0.5, biomass:carbon (Saatchi et al., 2011).
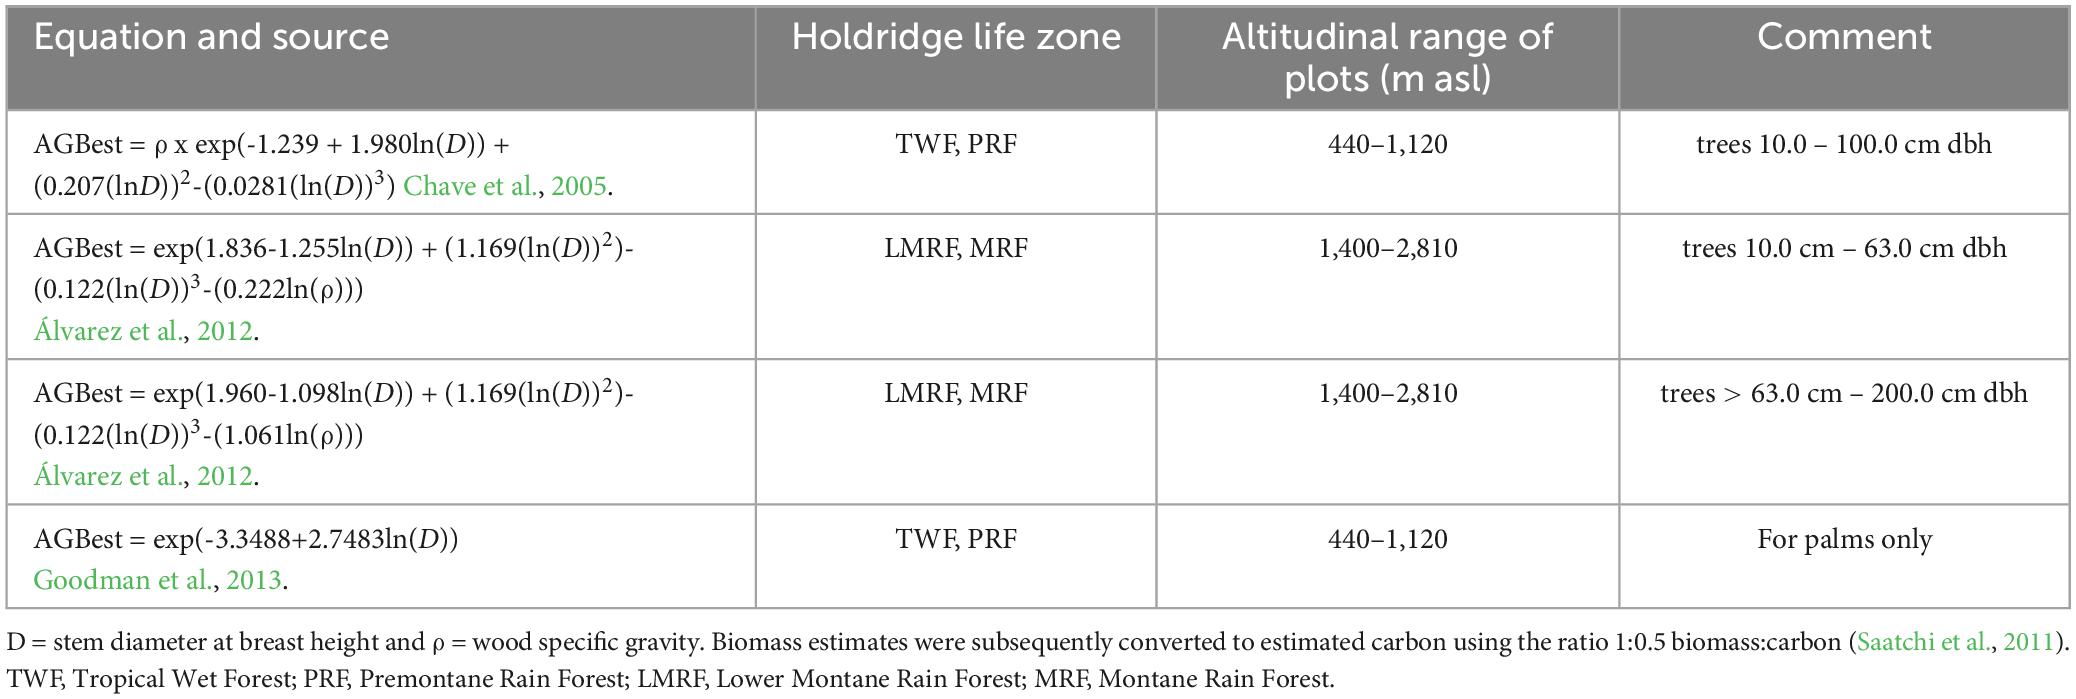
Table 2. Equations used for estimation of above ground biomass (AGB).
Finally, Esquivel et al. (2019) used the following procedures in their translocation study of leaf litter decomposition rates, comparing rates across four of the Holdridge life zones. A fully replicated experiment was implemented, placing plastic mesh litter bags in field plots in in each of three of the PPs in each of the lowland wet forest, the premontane rain forest, the lower montane rain forest and the montane rain forest. Leaf litter decomposition rates (k) of ten tree species, two dominant species from each life zone, plus two standard species, were calculated over 540 days. % dry matter remaining DM was ArcSin square root transformed to meet normality and homoscedasticity criteria for the comparison of main factors and their interaction using ANOVA. They used general linear mixed models for analysis (GLMM) to take into consideration the autocorrelation in repeated measures over time and the hierarchy of the plot structure, as well as the remaining heteroscedasticity. They set life zone, species, time, and their interactions as fixed factors. Main plots, decomposition beds within them, and rows of litterbags within decomposition beds were all set as random factors. They estimated litter decomposition rate coefficients (k) using a simple negative exponential model. They used single exponential models because of their superior fit to the data in the great majority of cases. The 240 k values describing the decay rates of treatments were compared using GLMM ANOVA as described for DM. All their analysis was carried out using InfoStat 2016 software (Di Rienzo et al., 2016).
We believe that the consistent use of simple adjectives, instead of statistical parameters of relationships, to describe the degree of sensitivity to climate is important for communication, especially in the case of non-specialists. We therefore adapted the framework of Cohen (1988), which was established for use with the results of linear regression analysis, for the results of all our statistical procedures. The coefficients of determination (R2) from all our hypothesis tests were therefore classified as follows: very weak (R2< 0.02), weak (0.02 < = R2< 0.13), moderate (0.13 < = R2< 0.26) or substantial (R2> 0.26). We then used these adjectives to classify the degree of sensitivity of the ecosystem property concerned – for example, a property whose relationship to altitude a.s.l. has R2 = 0.1 is weakly sensitive to temperature, while a property with R2 = 0.6 has substantial sensitivity to temperature.
We characterized exposure to rising temperatures in the framework of IPCC’s Shared Socio-Economic Pathway (SSP) 585 for the year 2070. SSP 585 features very high levels of fossil fuel use, up to a doubling of global food demand, and as much as a tripling of energy demand and emissions of greenhouse gases (Kriegler et al., 2017). We downloaded modeled mean annual temperature values for this scenario and year from WorldClim 2 (24 general circulation models), for the pixels in which our permanent plots are located (Supplementary Table 1). As the potential future MATs vary among models, we calculated a mean MAT per pixel from the 24 values, and then calculated a MAT increase per pixel as the difference between mean future MAT and current MAT. Mean values of increases per Holdridge Life Zone were then calculated.
Veintimilla et al. (2019) showed that 43% of the variability of the taxonomic composition of the stand ≥ 10 dbh can be explained in terms of mean annual temperature, soil and spatial variables. They found that altitude, a surrogate for temperature, was the most important individual variable and its individual effect, after removing the effects of the other variables, was very highly significant. For the present paper, we add the conclusion that forest species composition has substantial sensitivity to temperature.
Species density in 0.25 ha was very strongly positively related to MAT (simple linear regression, R2 = 0.94, p < 0.0001, Figure 3A) so its sensitivity to temperature is substantial. The regression coefficient was 4.23, suggesting a rate of increase of ca. four species oC–1 MAT. Despite declining stand basal area in lowland plots (see below), species density did not change between 2012 and 2019 (Hernández Gordillo, 2020, see Supplementary material).
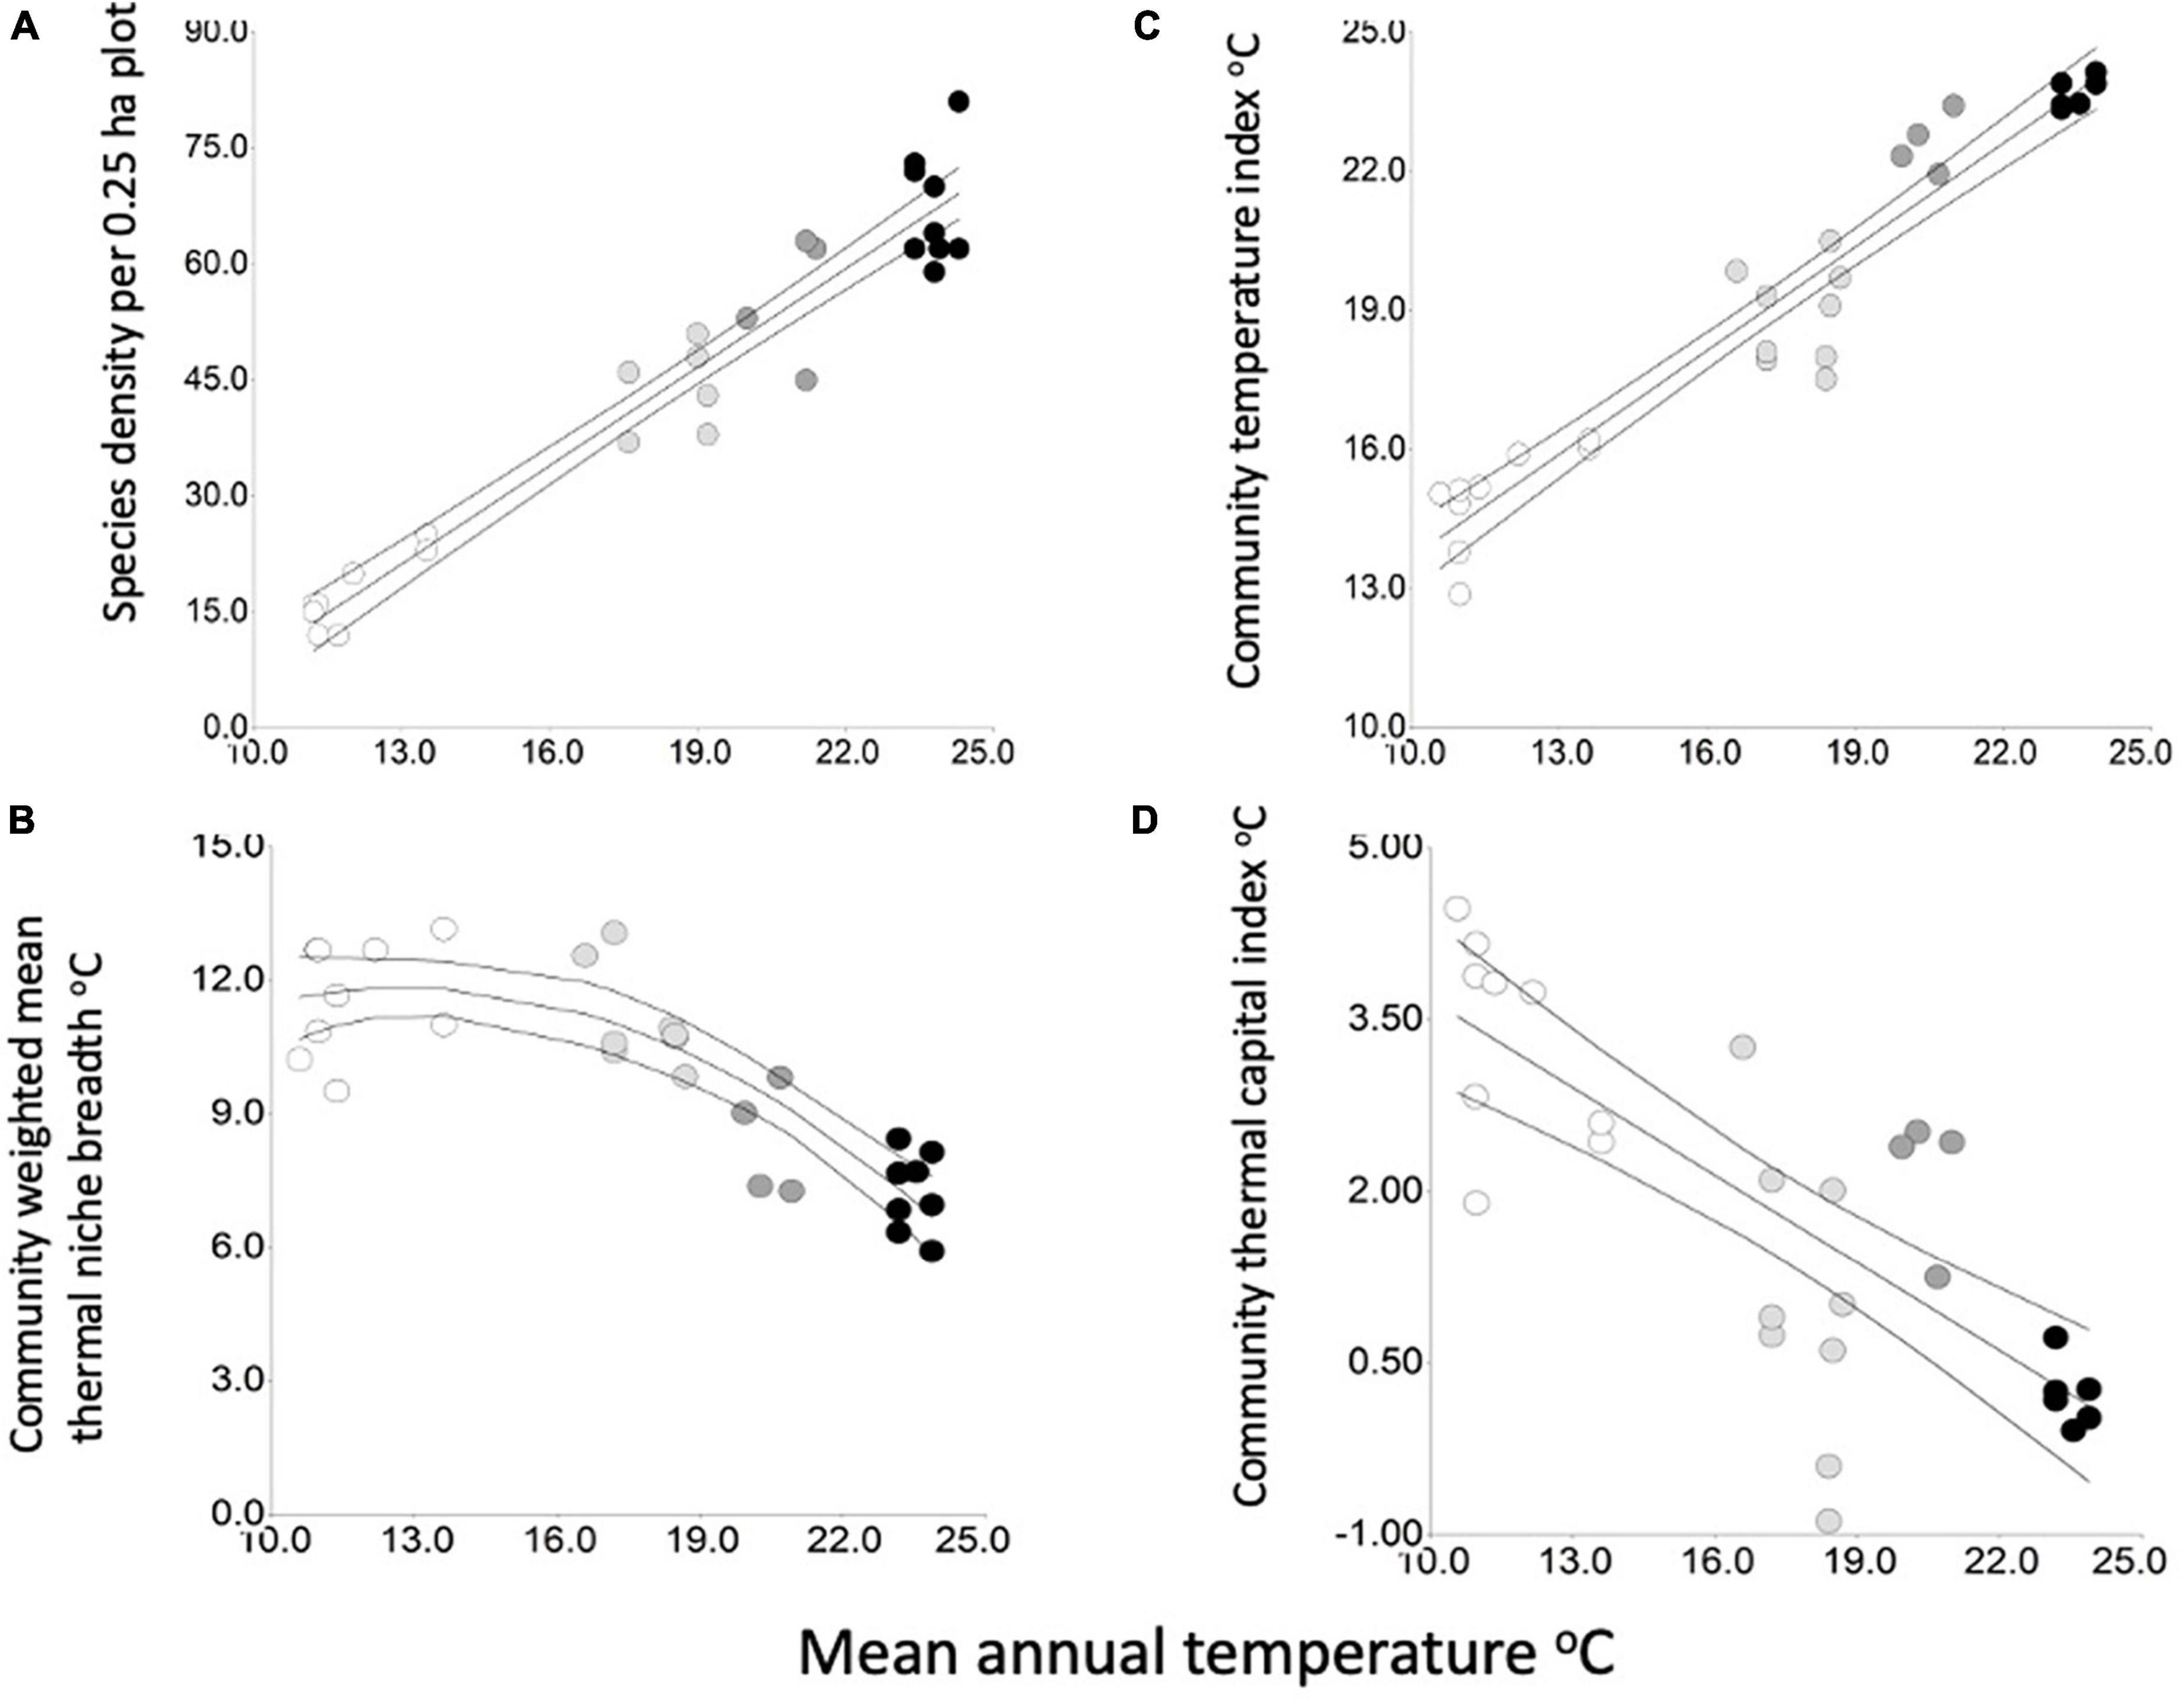
Figure 3. The relationship to mean annual temperature (from Chelsa climate surfaces) of (A), species density per plot in 2019 (R2 = 0.94, p < 0.0001), (B), the community weighted mean thermal niche breadth (R2adj = 0.73, p < 0.0001 and p = 0.0017 for the quadratic term) (C), the community temperature index (R2 = 0.83, p < 0.0001) and (D), the community thermal capital index (R2 = 0.60, p < 0.0001). Symbols for Holdridge Life Zones: black, tropical wet forest; dark gray, premontane rain forest; light gray, lower montane rain forest; white, montane rain forest. Upper and lower curves are 95% confidence intervals.
Values of CWM thermal niche breadth were in the overall range 5.92–13.2°C. The relationship of CWM niche breadth to mean annual temperature was best described by a quadratic linear regression (R2adj = 0.73, p < 0.0001 and p = 0.0017 for the quadratic term) and is therefore classified as substantial. CWM niche breadth was lowest in the tropical Wet Forest plots, rising strongly as temperatures decrease in the premontane and lower montane life zones (Figure 3B). Between 17–18°C and 10–12°C MAT in the lower montane and montane forests, respectively (an altitudinal range of 1,500–2,950 m asl), there was no obvious trend of CWM thermal niche breadth.
The community temperature index CTI was very strongly positively related to temperature (simple linear regression, R2 = 0.83, p < 0.0001, Figure 3C). The regression coefficient was 0.64, suggesting a rate of increase of the CTI of 0.64°C °C–1 MAT. This result suggests that the sensitivity of the CTI to temperature is substantial, though forest stand thermophilisation rate 2012–2019 was not related to temperature (Hernández Gordillo, 2020, see Supplementary material).
The community thermal capital index CTCI showed a strong negative relationship to mean annual temperature (R2 = 0.60, p < 0.0001, Figure 3D). Values were negative in the lowland tropical wet forest, suggesting an already existing climate debt and risk of biotic attrition, and positive in all montane forest plots, suggesting that the montane forest ecosystem may be adapted to 2–3 oC increases of MAT and that there is little evidence of threat of mountaintop extinctions. The sensitivity of the CTCI to the spatial temperature gradient is also substantial.
Regarding stand dynamic processes, Hernández Gordillo et al. (2021) found that in line with their hypotheses, mortality and recruitment rates of individuals ≥ 10 cm dbh for the 2012–2019 period were both positively related to temperature, leveraged principally by low or very low values in montane forests. The R2 values for their generalized additive models suggest that sensitivity to temperature of mortality and recruitment rates is again, substantial.
Hernández Gordillo et al. (2021) found that net basal area increments for 2012–2019 are also negatively related to temperature. Net basal area growth was strongly positive in many montane and lower montane forest plots but negative in all the tropical wet forest plots, possibly due to lightning strikes on canopy trees which are frequent in permanent sample plots and in the surrounding forest. In this case, sensitivity to temperature remains to be confirmed. Estimated carbon in above ground biomass (R2 = 0.62, p < 0.0001, Figure 4) and stand basal area (Muñoz Mazón et al., 2020) showed negative relationships to temperature, both ecosystem properties showing very high values in montane forests and substantial sensitivity to the spatial temperature gradient.
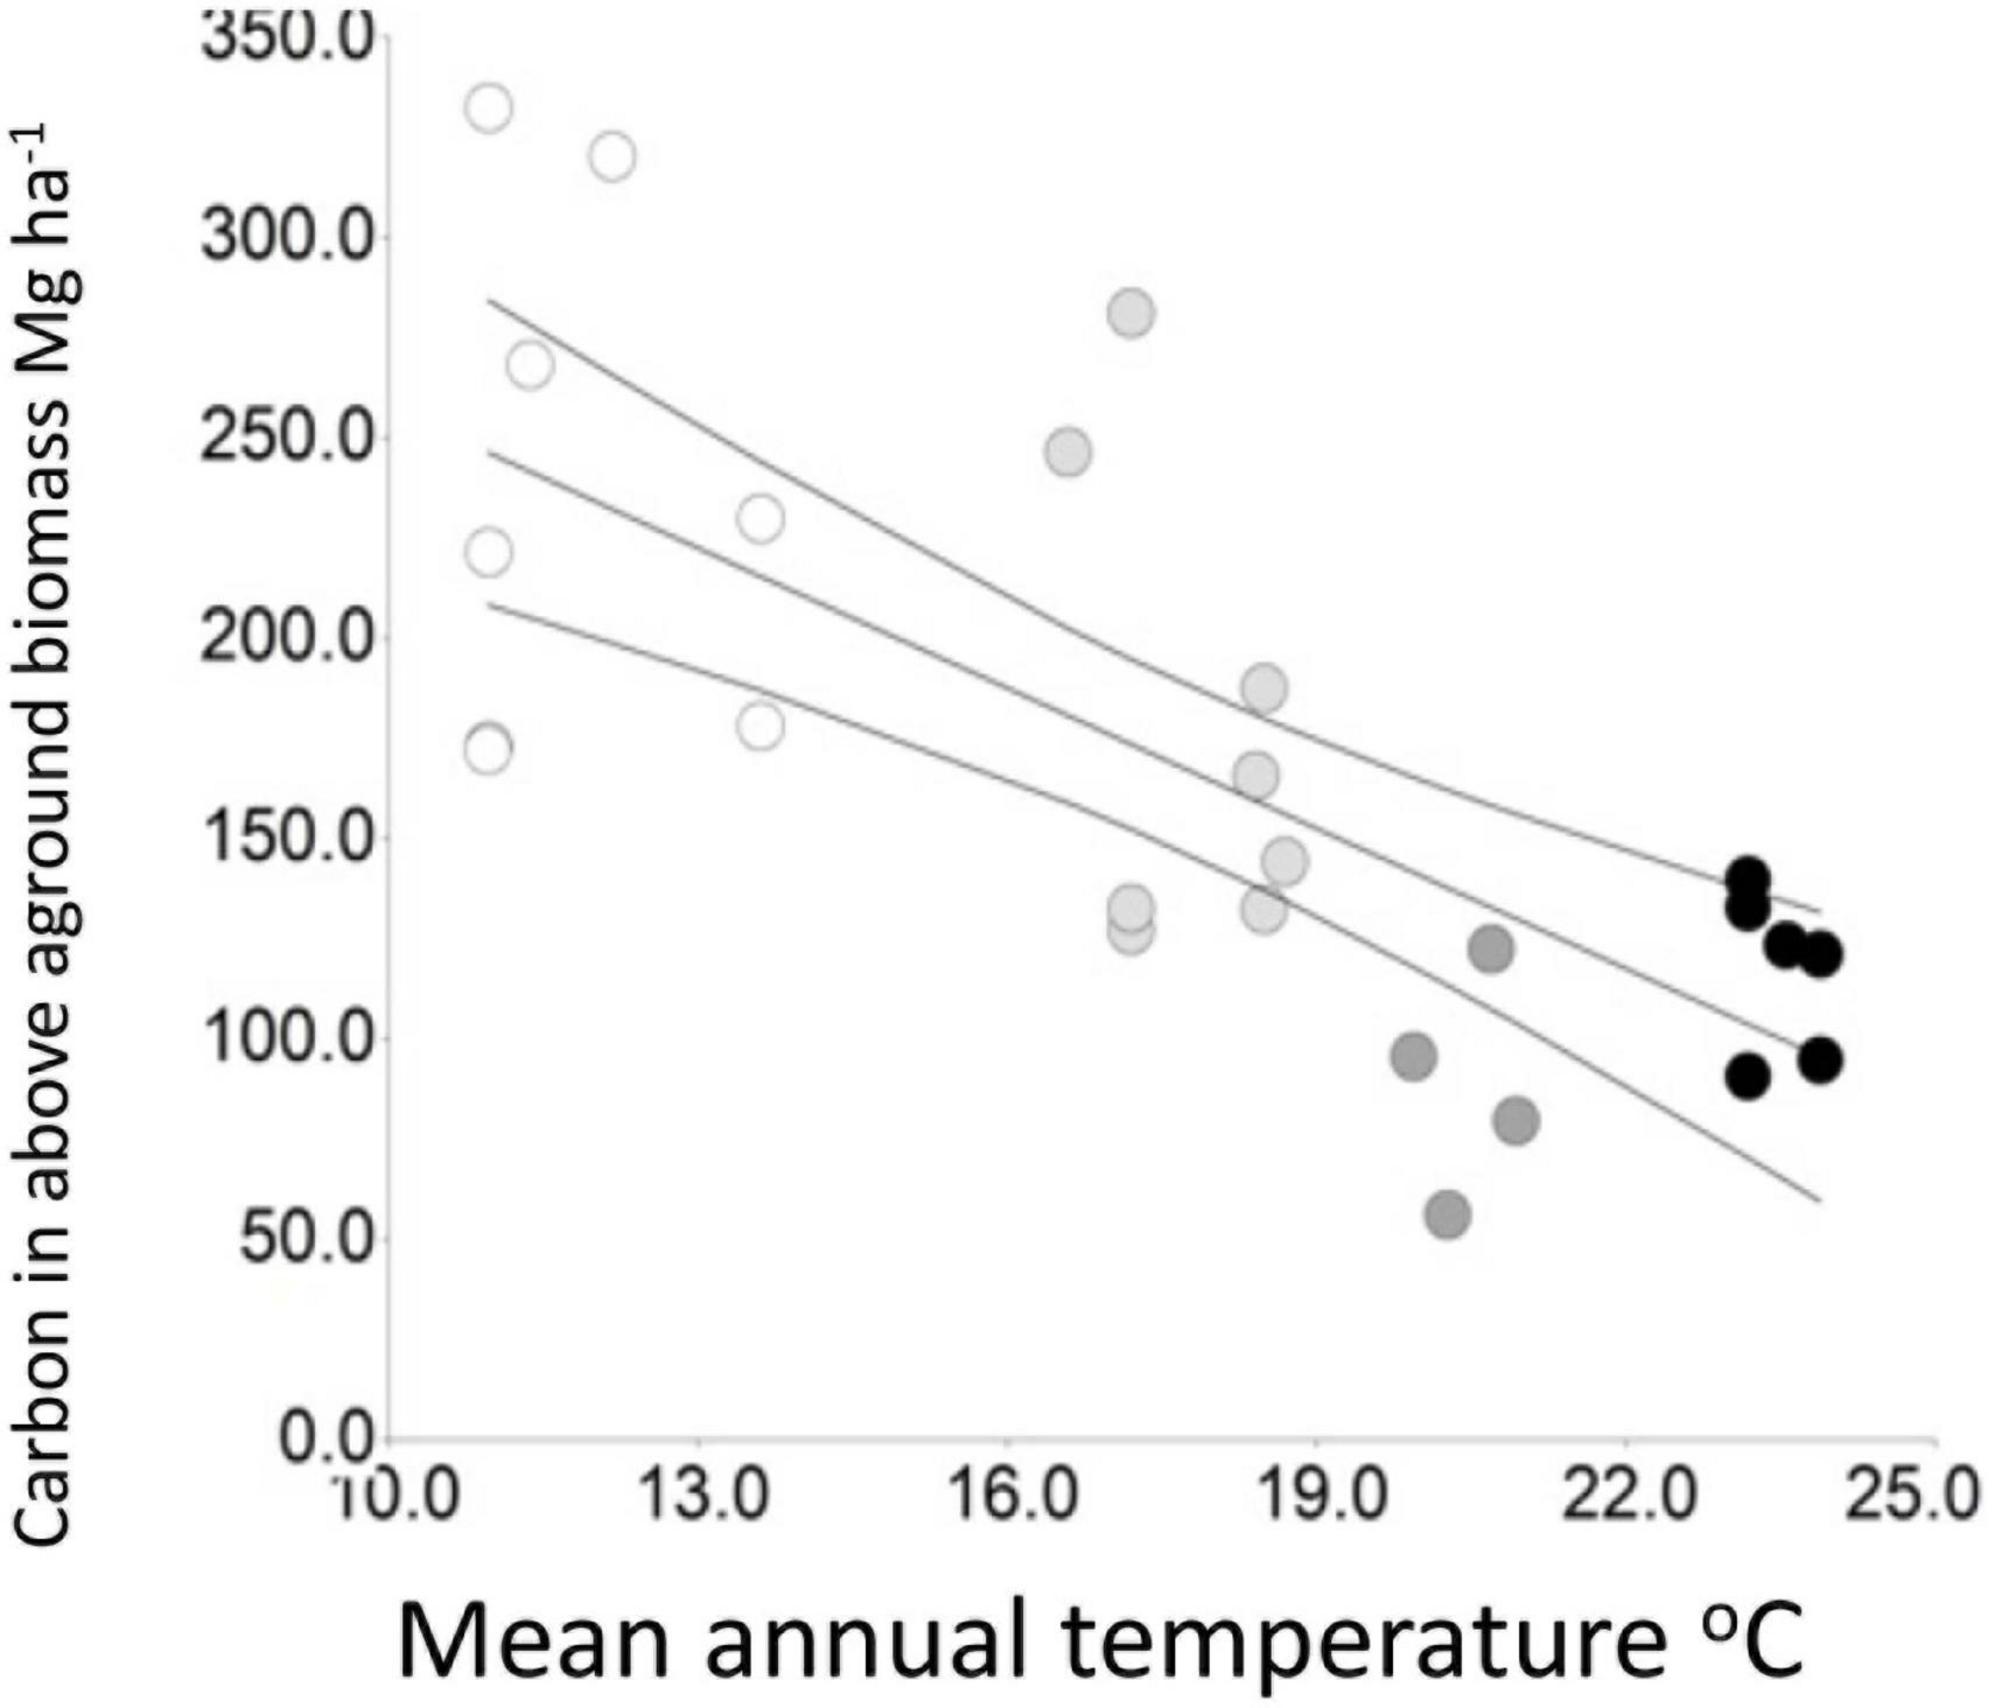
Figure 4. The relationship to mean annual temperature of carbon in above-ground biomass (R2 = 0.52, p < 0.0001). Symbols as in Figure 3.
As expected, leaf litter decomposition rates on our altitudinal gradient are also substantially sensitive to temperature. Esquivel et al. (2019) found that annual decomposition rates (k) increased fourfold between plots in montane forest with mean annual temperature = 11°C and plots in lowland wet forest where mean annual temperatures are = 24°C. Interestingly, k values in their study did not differ between the tropical wet forest and the premontane rain forest life zones.
Under SSP 585, modeled increases of mean annual temperatures for the pixels in which our permanent plots are in the range 2.79–3.22°C (Supplementary Table 2), with an overall mean of 2.97°C (Supplementary Table 2).
The evaluation of ecosystem sensitivity is one of the most challenging aspects of climate change vulnerability analysis for tropical mountain rain forests, so it is necessary to identify and validate a set of ecosystem properties that adequately represent the characteristics and processes of these ecosystems. We are not aware of any studies that have addressed this need with the goal of formulating recommendations for decision-makers and practitioners challenged by the management of tropical mountain rain forest landscapes under rising temperatures.
To contribute to building an approach to sensitivity analysis for tropical montane rain forests, we examined the responses of eleven forest ecosystem properties to the spatial gradient of mean annual temperature (altitudinal range 440–2,950 m asl, WorldClim mean annual temperature range, 24.3–10.0°C) in protected forests of Costa Rica’s Talamanca Cordillera. Data are for the 2012–2019 period from permanent sample plots and a field experiment on decomposition rates. We proposed a new index, the community temperature capital index CTCI, that recognizes the existence of climate credits as well as climate debts. Also, we translated the statistical significance of results into language appropriate for non-specialists using simple adjectives.
Applying these adjectives, all eleven ecosystem properties are substantially sensitive to the current spatial temperature gradient of our study area (Table 3). Forest stand species composition is substantially sensitive to temperature. Five of the properties are strongly positively related to temperature: the community temperature index CTI, species density per plot, tree recruitment rates, tree mortality rates and leaf litter decomposition rates. Five of the ecosystem properties are negatively related to temperature and have their highest values in lower montane and montane forests: the community weighted mean thermal niche breadth, stand basal area, stand above ground carbon, net basal area increments and the Community Thermal Capital Index CTCI. Negative values of the CTCI – a climate debt - already exist in the current tropical wet forest and premontane rain forest life zones. Conversely, montane forests have climate credit: positive values of the CTCI due to the broad thermal niches of their dominant species. We now discuss these results and their implications for climate change vulnerability analysis and landscape management for adaptation.
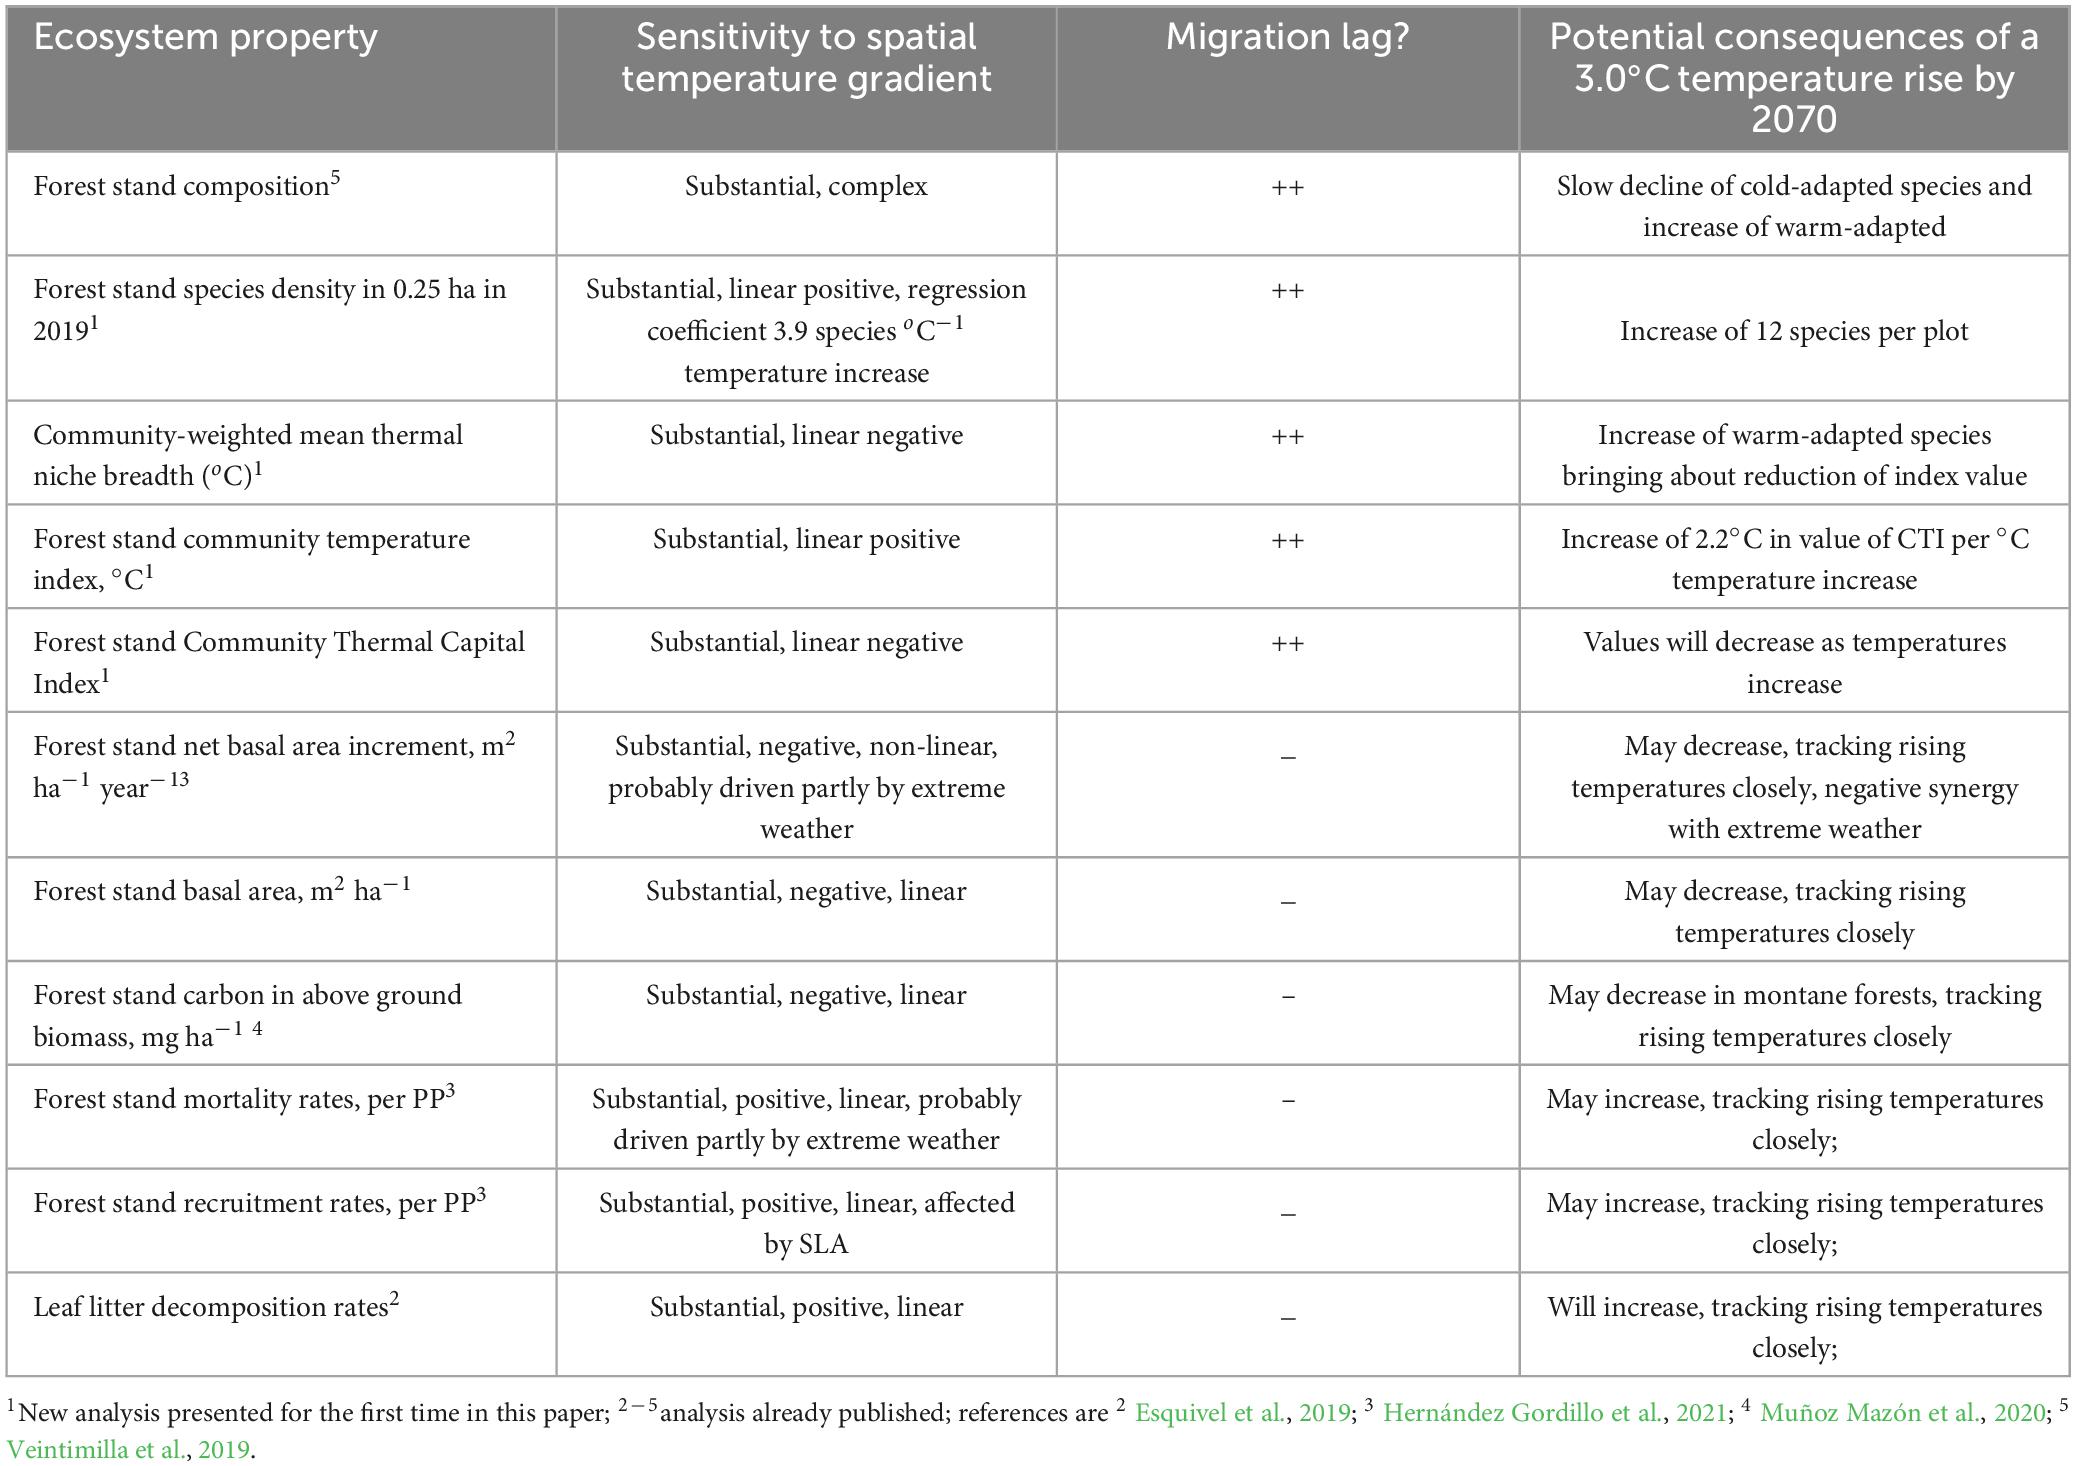
Table 3. Summary of results of the evaluation of sensitivity of ecosystem properties to the spatial temperature gradient, with forecast of their potential response to a 3°C temperature rise occurring by the year 2070 under SSP585, and the threats associated with a lack of adaptation.
The altitudinal zonation of species composition in TMRF has long been recognized. The zonation in our research area responds not only to temperature (represented by its surrogate altitude in the analysis by Veintimilla et al., 2019), however, but also to soil conditions and spatial factors, and < 10% of the compositional variation explained in multivariate analysis can be directly attributed to temperature. This result does not mean sensitivity to temperature is low but is a consequence of analyzing a data matrix containing hundreds of species, many with low abundances and all with individualistic responses to environmental gradients (Veintimilla et al., 2019). Therefore, we conclude that forest species composition is substantially sensitive to temperature but believe that analysis and management based on the thermal characteristics of communities, like the community temperature index CTI, rather than their species composition, has many conceptual and practical advantages.
Indeed, the CTI is one of the ecosystem properties most sensitive to temperature on our altitudinal gradient (Table 3). The very strong relationship of CTI to MAT supports the view that temperature is a major control of forest composition (Feeley et al., 2013; Fadrique et al., 2018). The substantial sensitivity to temperature is matched by that of species density, and it is likely that the values of these properties are interdependent. The relationship of CTI to temperature occurs due to species turnover (Fadrique et al., 2018). Hundreds of species are adapted to the high temperatures of the Tropical Wet Forest and Premontane Rain Forest on our gradient, while the number of species adapted to low temperatures in the Lower Montane and Montane zones is small. Species density and CTI therefore show the same strong relationships to temperature. Increases of the CTI (thermophilisation, see below) are accompanied by increases of species diversity in European mountain ecosystems (Steinbauer et al., 2018). In such plot are predicted to have temperature optima that match the temperature increase, although migration lag may slow down these responses (Jackson and Sax, 2010).
The CTI offers practical evaluation of ecosystem temperature sensitivity, as well as monitoring of temporal change in composition due to rising temperatures. Considerable attention has been given in recent years to the possibility that the CTI is increasing over time in tropical mountain forest ecosystems. This phenomenon is known as thermophilisation and has been observed in Andean and Costa Rican TMRF (Feeley et al., 2013; Fadrique et al., 2018). If thermophilisation can be rigorously demonstrated, then natural adaptation to rising temperatures may be taking place; the effectiveness of natural adaptation can be evaluated by the comparison of thermophilisation rates with the velocity of temperature increase (Richard et al., 2021). Using statistical thresholds, however, we did not find unequivocal evidence for thermophilisation in our permanent plots for the 2012–2019 period (Hernández Gordillo, 2020, see Supplementary material). We also believe more work is required on potential changes of forest thermal characteristics under climate change. Is thermophilisation to be expected in montane forests with broad CWM temperature niches that confer a state of climate credit, for example?
The robustness of the linear relationships of CTI and species density to the long spatial temperature gradient of our study area suggest tentative quantitative expectations of changes in the values of these properties based on the regression coefficients (Table 3; for the CTI, see also Fadrique et al., 2018). A 2.97°C increase in mean annual temperature for the year 2070 represents an approximately 600 m upslope shift of isotherms. For this temperature increase, the regression coefficient of 0.64 suggests an expected increase of ca. 2°C in the CTI at any given point, while the regression coefficient of 3.91 for species density suggests an increase of nearly twelve species in a 0.25 ha plot. This potential future species density is equivalent to an immigration credit, the number of species committed to eventual immigration following a forcing event as proposed by Jackson and Sax (2010). In our case, the forcing event is the 2.97°C increase in MAT for the year 2070. Warming-driven increases of plant species diversity have been observed on European mountain summits (Steinbauer et al., 2018) though we have found no evidence of this for the 2012–2019 period on our gradient (Hernández Gordillo, 2020, see Supplementary material). The expected increases of the CTI and species density can be tested for by monitoring; if they do not occur, monitoring could be suggesting a lack of natural capacity to adapt to the rising temperature, migration lag for example.
For increases of the CTI and species density to occur at a given point, two conditions must be fulfilled: tree species adapted to higher temperatures must be present in the landscape, and they must be able to migrate. We discuss migration in Section 4.7. Regarding the first of these conditions, the critical question is: do such species exist in the lowlands? In their seminal study, Colwell et al. (2008) pointed out that lowland rain forests are at risk of biotic attrition, conceiving this phenomenon as a net loss of species richness that occurs because species adapted to the increased temperatures do not exist. Do our results suggest a risk of biotic attrition in the lowland sector of our gradient? The current mean of the mean annual temperatures of the pixels in which our lowland permanent plots are located (440–620 m asl) is 23.2°C, and the range of simulated means for 2,070 from 24 general circulation model simulations is 25.6–26.0°C (Supplementary Table 2). The maximum current temperatures of pixels in which 27 dominant species of these plots are recorded in the GBIF unpublished data range from 26.0°C to 27.8°C (mean 26.9°C). This suggests that under SSP 585, by 2070 dominant tree species may be approaching the limits of their thermal tolerances.
A necessary caveat regarding thermal tolerances is provided by Feeley and Silman (2010). As an alternative to biotic attrition, they propose that thermal niches quantified using current distributions of species, as in our study and that of Colwell et al. (2008), are in fact truncated because species may retain adaptations to higher past temperatures that do not occur under the current Holocene climate. If this were the case, then the risk of biotic attrition in the neotropical lowlands might be reduced (Feeley and Silman, 2010). We conclude, however, that in the context of management for adaptation, and in the absence of concrete evidence for Feeley and Silman’s truncation hypothesis, precaution requires acceptance of the risk of biotic attrition, and monitoring must take it into account.
The climate variability hypothesis, which posits that locations with reduced seasonal temperature variation select for species with narrower thermal ranges (Cuesta et al., 2020) is the basis of our hypothesis that community weighted mean thermal niche breadth would decrease with mean annual temperature. Our hypothesis is supported and the CWM thermal niche breadth is therefore substantially sensitive to the spatial temperature gradient (Table 3). In line with the climate variability hypothesis, broad thermal niches may arise in montane species due to the need to tolerate a broader inter- and intra-annual range of environmental conditions than is the case for lowland tropical species (as proposed by Stevens, 1992, among others, and verified for 1,138 tree species of Brazilian Atlantic Forest by Klipel et al., 2022). Among the key elements of the broad range of environmental conditions in montane environments could be chilling temperatures and frost, Rehm and Feeley (2015). The upper altitudinal limits of tropical taxa may be determined by lack of tolerance of chilling temperatures, which can cause tissue damage in the 10–12°C range (Lyons, 1973; Osland et al., 2021) and frost, which in our landscape occurs only in the montane forest zone (Herrera, 2005).
The broad thermal niches of montane tree species and the stands they form are particularly relevant to the putative risk of mountaintop species extinctions in montane ecosystems. The current montane rain forest life zone, sampled by us at altitudes in the range 2,150–2,950 m asl, is the focus for the possibility of mountain top extinction, which has been hypothesized on the assumption that the climate envelopes of montane species will become greatly reduced in extent or disappear under climate change (Colwell et al., 2008). That these species have narrow altitudinal ranges, therefore narrow climate envelopes, is implicit in this discussion (Colwell et al., 2008; Mata-Guel et al., 2023).
Our study and that of Klipel et al. (2022) nevertheless show that the dominant tree species of montane forests have broad, not narrow, climate envelopes, and the weighted mean niche breadths are therefore also broad. The optimum temperatures of the dominant species of our montane forests are > 15°C unpublished data, even though current MAT in the forests they dominate is in the 10–11°C range – this is also the reason why values of the community thermal capital index are positive in the montane forest plots, as we discuss below. It seems unlikely that the populations of the dominant species of the montane forests of our landscape face extinction.
The CTCI shows substantial sensitivity to temperature, with climate debt at low and middle elevations and climate credit in lower montane and montane areas (Table 3). Climate debt has been characterized as a mismatch between community thermal characteristics, such as the CTI, and the prevailing temperature regime at a site; climate debts can arise and accumulate if thermophilisation rates are lower than the velocity of climate change (Richard et al., 2021). Climate credit arises in the montane forests of our landscape, however, because dominant species have broad thermal niches and optimum temperatures higher than the mean annual temperatures of the sites they dominate. Positive CTCI values suggest that an ecological community would potentially be buffered against the effects of rising temperatures, while the existence of climate debt in lowland forests complements results for other ecosystem properties in indicating that these forests may be at risk of degradation.
Leaf litter decomposition rates, standing basal area, carbon stored in above ground biomass and net basal area increment are fundamentally important ecosystem properties with substantial sensitivity to the spatial temperature gradient of our landscape (Table 3). The strong positive relationship of leaf litter decomposition rates to temperature was expected (Powers et al., 2009; Salinas et al., 2011) as were the intermediate-strength positive relationships of recruitment and mortality rates, but the negative relationships of basal area, carbon in AGB and basal area increments were not.
By analogy with results from research in cold biomes (Cornelissen et al., 2007), decomposition rates in TMRF will be directly affected by increasing temperatures and will likely track rising temperatures closely, potentially reducing soil carbon storage. Decomposition rates will likely increase whether or not changes in forest composition and diversity occur, although species leaf traits affect them strongly, in TMRF (Salinas et al., 2011; Esquivel et al., 2019) as in other biomes (e.g., Cornelissen et al., 2007). Any changes in forest composition may therefore interact with rising temperature in the determination of future patterns of litter decomposition.
The negative relationships to temperature of stand basal area and carbon stored in above ground biomass seem to be characteristics associated with TMRF where high-AGB montane forests are dominated by species of Fagaceae (discussed by Hernández Gordillo et al., 2021). The past and present climatic and biogeographical factors that underpin this pattern need further research.
The substantial sensitivity of forest stand dynamic variables to the spatial temperature gradient may give rise to short-term responses to rising temperatures. Evidence for this is that diameter growth and AGB productivity vary in response to interannual temperature and precipitation variation, as has been shown for tropical forests using permanent sample plots (Clark et al., 2003) and dendrochronological approaches (Rozendaal and Zuidema, 2011). The annual mean of the daily minimum temperature was negatively correlated with tree growth in lowland wet forests in Costa Rica, possibly because higher temperatures cause higher respiration (Clark et al., 2003). While these short-term responses to climate variation suggest that TMRF dynamic rates, like decomposition rates, may track rising temperatures closely, Sullivan et al. (2020) point out that short-term responses may be a poor guide to long-term changes, because trees and forest stands may undergo physiological and ecological acclimation.
The negative relationship of net basal area growth to temperature is one of the most striking aspects of our results for 2012–2019. All the tropical wet forest plots - the 440–620 m asl altitudinal range – lost basal area during this period. These plots are separated by at least 300 m horizontal distance (Veintimilla et al., 2019) so this does not seem to be a localized event. It is possible that such a decline in stand structure would occur at the beginning of temperature-driven biotic attrition, but lightning strikes are implicated by Hernández Gordillo et al. (2021), so that the relationship to temperature would be indirect at the most. If lightning is proved to be the major driver of forest stand decline, then the analysis of exposure for climate change vulnerability analysis would have to include extreme weather events.
Forest stand composition, diversity and thermal characteristics are substantially sensitive to the spatial temperature gradient, and the adaptation of these ecosystem properties to rising temperatures during the present century depends at least partially on migration (Table 3). We are currently modeling species migrations under climate change for this forest landscape and make only brief comments here.
Species can respond to climate change through physiological, behavioral and genetic adaptation or by migrating: moving to remain in favorable climates (Arneth et al., 2020). Migration should be understood as the process of colonization of habitat that becomes appropriate for a species due to temporal environmental change. Migration is only a component of sensitivity as we have defined it in this paper, if seed dispersal, seedling establishment and generation time change in response to spatial and temporal temperature gradients. It is not possible to determine if this is the case at the moment. Empirical studies have shown, however, that migration rates of plants are often slower than the rate of climate change – “migration lag,” or the failure of species to track their changing climate envelopes (Richard et al., 2021). Climate debts may arise because of migration lag. Responses to the changing climate that require species migrations (Table 3) are of high priority for management for adaptation.
Also, if migration is most important for species with narrow temperature niches (Colwell et al., 2008; Mata-Guel et al., 2023), we hypothesize that it is most important in our landscape for species of lowland and middle-elevation forests where the stand CWM thermal niche breadths are low because of the predominance of such species. What are the seed dispersal capacities, requirements for seedling establishment and growth rates to reproductive maturity of species that are required to migrate (Engler and Guisan, 2009; Boisvert-Marsh et al., 2022)? In a Costa Rican Tropical Wet Forest managed for timber production, three of the dominant tree species of the Tropical Wet Forest of our altitudinal gradient – Carapa guianensis (family Meliaceae), Minquartia guianensis (Olacaceae) and Pourouma bicolor (Urticaceae) showed median growth rates in the range 3–7 mm yr–1 for individuals ≥ 10 cm dbh (Finegan et al., 1999). If these species attain reproductive maturity on average at 30 cm dbh, these growth rates suggest median times of 30–70 yr to reach that stage from 10 cm dbh, and considerably longer overall generation times starting from seedlings. It is still necessary to demonstrate as rigorously as possible that migration lag will occur, but it seems very likely.
In this final section, we identify and briefly discuss the implications and potential for application of our approach to sensitivity analysis as a component of climate action, in the biogeographical context of the protected areas of the area of action of our programme, and the policy and legislative context of Costa Rica. The points made should have relevance beyond this context because of undoubted biogeographical, political and legislative similarities with other places in the American tropics.
Climate action is any policy, measure or programme that reduces greenhouse gas emissions, builds resilience to climate change or supports and finances these goals. Enabling conditions for concerted, mainstreamed, climate action for conservation are a work in progress in Costa Rica and in general, their development is a complex subject (e.g., Bouman et al., 2020). In this discussion we focus on the state protected areas that cover a large proportion of the forest ecosystems of our research area. This is possible because these protected areas have official management plans (Sistema Nacional de Áreas de Conservación [SINAC], 2014, 2016a,b) which address climate change issues in the context of Costa Rica’s National Biodiversity Strategy 2016–2025 (Ministerio de Ambiente y Energía, 2016).
The management plans cited identify as focal management elements – defined as ecological values that are the objective or priority for management (Ministerio de Ambiente y Energía, 2016) – the forests across the altitudinal range of each protected area, and their contributions to people (Sistema Nacional de Áreas de Conservación [SINAC], 2014, 2016a,b). The plans identify climate change as the main threat to the forests of the protected areas and set out specific objectives and timelines for the development and implementation of a climate action agenda for them. Work to address these objectives is currently in progress.
This policy, legislative and management planning environment suggests that potential for the implementation of climate action exists, so what might be the contribution of our research programme? Climate change vulnerability analysis is a tool for climate action. We have the full support of the national authorities for our research and our contribution is an approach for the evaluation of the temperature sensitivity of tropical mountain rain forests, to contribute to rigorous vulnerability analysis. Our approach, however, is not yet adopted for the management of the protected areas.
Views on the role of research programmes like ours in the support of decision-making for climate action have evolved from science-driven linear methods to interdisciplinary approaches that recognize the complexity of the decision-making process (Jones et al., 2014). The crucial next step for our programme is to participate in such an interdisciplinary process to achieve the adoption and implementation of the sensitivity analysis by the authorities of the protected areas. This process should include prioritization or weighting of ecosystem properties, or the inclusion of additional ones, for example in relation to the characteristics of a landscape, the management objectives of a particular protected area or the priorities of local actors. As an example, the relatively low degree of fragmentation of the forest landscape in the protected areas of our research area contrasts with the fragmented landscape adjacent to and around protected areas on altitudinal gradients on Costa Rica’s Pacific slope, where a stronger focus on landscape connectivity is required (e.g., Céspedes et al., 2008).
The approach to sensitivity analysis is the first contribution of this paper in support of support climate action in the management of these TMRF. The second is a strong recommendation, on the basis of our results, to re-evaluate existing perceptions of the vulnerability of these forests to climate change. We have shown that the montane and lower montane forest zones, although the least species-rich of the gradient, have broad community-weighted mean thermal niche breadths and are in a state of climate credit as measured by the Community Thermal Capital Index. Their positive net basal area increments and very low or zero tree mortality for the 2012–2019 period complement these forest stand thermal characteristics in suggesting ecosystems that are not currently undergoing degradation and may be resistant to ongoing temperature increases, rather than being at risk of mountaintop extinctions as defined by Colwell et al. (2008) and Mata-Guel et al. (2023). The very high carbon storage in above-ground biomass in montane forests could therefore be maintained for a considerable period. In their seminal study in another Costa Rican mountain range, Colwell et al. (2008) did not forecast mountaintop extinctions either.
Besides recommending a reevaluation of the vulnerability of montane forests, we recommend a switch of attention toward the vulnerability of forests in the lowlands. Although the lowland Tropical Wet Forest stands are the most species-rich of the gradient, they have the narrowest community-weighted mean thermal niche breadths and are in a state of climate debt. They had negative net basal area increments for the 2012–2019 period and relatively high tree mortality. Lightning may be an additional climate-related driver of change in this sector of the altitudinal gradient (Hernández Gordillo et al., 2021). These results suggest that at this moment in time, the lowland forests are the most vulnerable to degradation by climate variability and change. Whether or not any degradation includes biotic attrition as defined by Colwell et al. (2008) for similar Costa Rican lowland forests must be determined by monitoring.
All the eleven ecosystem properties we have evaluated show substantial sensitivity to spatial temperature gradients. In the framework of the IPCC approach to CCVA (Figure 1A), the high exposure already demonstrated (Delgado et al., 2016, this paper) is now accompanied by a rigorous demonstration of substantial sensitivity. High exposure and substantial sensitivity give high overall vulnerability to climate change. As high exposure is a given and ecological sensitivity is inherent, vulnerability can only be reduced by strengthening social and institutional adaptive capacity (Delgado et al., 2016; Bouroncle et al., 2017). National and local organizations should adopt multidimensional sensitivity analysis as part of the scientific basis of this strengthening.
Raw data supporting the conclusions of this article will be made available by the authors, without undue reservation, in the case of analysis published for the first time in this manuscript. Data from studies already published may be available depending on the stipulations of each individual publication.
BF: research conceptualization, design, data analysis, and writing—original and final draft. DD and SV: research conceptualization, design, data analysis, and writing—final draft. AH and FD: execution of research and data analysis. RN and NZ: execution of research. All authors contributed to the article and approved the submitted version.
This work was funded by the Inter-American Development Bank’s Sustainable Energy and Climate Change Initiative, the National Institute of Forest Sciences [NIFOS, Republic of Korea (RG-T1837)], and Scholarship A-1022018 awarded to AH by the Colombian Corporation for Research in Agriculture (AGROSAVIA) and CATIE.
We thank the staff of Costa Rica’s National System of Conservation Areas (SINAC), Barbilla and Tapantí National Parks, Rio Macho Forest Reserve, and the Quijote and El Copal Private Reserves for their support.
The authors declare that the research was conducted in the absence of any commercial or financial relationships that could be construed as a potential conflict of interest.
All claims expressed in this article are solely those of the authors and do not necessarily represent those of their affiliated organizations, or those of the publisher, the editors and the reviewers. Any product that may be evaluated in this article, or claim that may be made by its manufacturer, is not guaranteed or endorsed by the publisher.
The Supplementary Material for this article can be found online at: https://www.frontiersin.org/articles/10.3389/ffgc.2023.1214911/full#supplementary-material
Álvarez, E., Duque, A., Saldarriaga, J., Cabrera, K. de la Salas, G. del Valle, I., et al. (2012). Tree above-ground biomass allometries for carbon stock estimation in the natural forests of Colombia. For. Ecol. Manage. 267, 297–308.
Anchukaitis, K. J., and Horn, S. P. (2005). A 2000-year reconstruction of forest disturbance from southern Costa Rica. Palaeogeogr. Palaeoclimatol. Palaeoecol. 221, 35–54.
APG (2016). An update of the Angiosperm Phylogeny Group classification for the orders and families of flowering plants: APG IV. Bot. J. Linnaean Soc. 181, 1–20.
Arneth, A., Shin, Y.-J., Leadley, P., Rondinini, C., Bukvareva, E., Kolb, M., et al. (2020). Post-2020 biodiversity targets need to embrace climate change. Proc. Natl. Acad. Sci. U.S.A. 117, 30882–30891. doi: 10.1073/pnas.2009584117
Boisvert-Marsh, L., Pedlar, J. H., de Blois, S., Le Squin, A., Lawrence, K., McKenney, D. W., et al. (2022). Migration-based simulations for Canadian trees show limited tracking of suitable climate under climate change. Divers. Distribut. 28, 2330–2348. doi: 10.1111/ddi.13630
Bouman, T., Verschoor, M., Albers, C. J., Böhm, G., Fisher, S. D., Poortinga, W., et al. (2020). When worry about climate change leads to climate action: How values, worry and personal responsibility relate to various climate actions. Glob. Environ. Change 62:102061.
Bouroncle, C., Imbach, P., Rodríguez-Sánchez, B., Medellín, C., Martinez-Valle, A., Läderach, P., et al. (2017). Mapping climate change adaptive capacity and vulnerability of smallholder agricultural livelihoods in Central America: Ranking and descriptive approaches to support adaptation strategies. Clim. Change 141, 123–137.
Céspedes, M. V., Finegan, B., Herrera, B., Delgado, L. D., Velásquez, S., and Campos, J. J. (2008). Diseño de una red ecológica de conservación entre la Reserva de Biosfera La Amistad y las áreas protegidas del Área de Conservación Osa, Costa Rica. Recursos Naturales y Ambiente (CATIE). Ago 2008, No. 54. (Turrialba, CR: CATIE), 44–50.
Chamberlain, S. A., and Boettiger, C. (2017). R, Python and Ruby clients for GBIF species occurrence data. PeerJ Preprints 5:e3304v1. doi: 10.7287/peerj.preprints.3304v1
Chave, J. C., Andalo, C., Brown, S., Cairns, M. A., Chambers, J. Q., Eamus, D., et al. (2005). Tree allometry and improved estimation of carbon stocks and balance in tropical forests. Oecologia 145, 87–99.
Clark, D. A., Piper, S. C., Keeling, C. D., and Clark, D. B. (2003). Tropical rain forest tree growth and atmospheric carbon dynamics linked to interannual temperature variation during 1984–2000. Proc. Natl. Acad. Sci. U.S.A. 100, 5852–5857. doi: 10.1073/pnas.0935903100
Clark, D. B., Clark, D. A., and Oberbauer, S. F. (2010). Annual wood production in a tropical rain forest in NE Costa Rica linked to climatic variation but not to increasing CO2. Glob. Change Biol. 16, 747–759. doi: 10.1111/j.1365-2486.2009.02004.x
Clark, D. B., Hurtado, J., and Saatchi, S. (2015). Tropical rain forest structure, tree growth and dynamics along a 2700-m elevational transect in Costa Rica. PLoS One 10:e0122905. doi: 10.1371/journal.pone.0122905
Cohen, J. (1988). Statistical power analysis for the behavioral sciences, 2nd Edn. New York, NY: Routledge.
Colwell, R. K., Brehm, G., Cardelús, C. L., Gilman, A. C., and Longino, J. T. (2008). Global warming, elevational range shifts, and lowland biotic attrition in the wet tropics. Science 322, 258–226. doi: 10.1126/science.1162547
Cornelissen, J. H. C., Van Bodegom, P. M., Aerts, R., Callaghan, T. V., Van Logtestijn, R. S. P., Alatalo, J., et al. (2007). Global negative vegetation feedback to climate warming responses of leaf litter decomposition rates in cold biomes. Ecol. Lett. 10, 619–627. doi: 10.1111/j.1461-0248.2007.01051.x
Cuesta, F., Tovar, C., Llambí, L. D., Gosling, W., Halloy, S., Carilla, J., et al. (2020). Thermal niche traits of high alpine plant species and communities across the tropical Andes and their vulnerability to global warming. J. Biogeogr. 47, 408–420. doi: 10.1111/jbi.13759
Delgado, D., Finegan, B., Martin, M., Acosta, M., Carrillo, F., Hernández, T., et al. (2016). Análisis de la vulnerabilidad al cambio climático de bosques de montaña en Latinoamérica: Un punto de partida para su gestión adaptativa. Serie Técnica. Informe Técnico no. 406. Turrialba, CR: CATIE, 54.
Di Rienzo, J. A., Casanoves, F., Balzarini, M. G., Gonzalez, L., Tablada, M., and Robledo, C. W. (2016). InfoStat versión 2016. Córdoba: Grupo InfoStat, FCA, Universidad Nacional de Córdoba.
Díaz Santos, F. (2017). Estimación del carbono aéreo almacenado y su relación con factores ambientales, en tres paisajes boscosos centroamericanos. Ph. D. Thesis. Turrialba, CR: CATIE.
Díaz, S., and Cabido, M. (2001). Vive la différence: Plant functional diversity matters to ecosystem processes. Trends Ecol. Evol. 16, 646–655. doi: 10.1016/S0169-5347(01)02283-2
Engler, R., and Guisan, A. (2009). MigClim: Predicting plant distribution and dispersal in a changing climate. Divers. Distrib. 15, 590–601. doi: 10.1111/j.1472-4642.2009.00566.x
Esquivel, M. J., Park, B. B., Casanoves, F., Delgado, D., Park, G. E., and Finegan, B. (2019). Altitude and species identity drive leaf litter decomposition rates of ten species on a 2950 m altitudinal gradient in neotropical rain forests. Biotropica 52, 11–21.
Fadrique, B., Báez, S., Duque, Á, Malizia, A., Blundo, C., Carilla, J., et al. (2018). Widespread but heterogeneous responses of Andean forests to climate change. Nature 564, 207–212.
Feeley, K. J., and Silman, M. R. (2010). Biotic attrition from tropical forests correcting for truncated temperature niches. Glob. Change Biol. 16, 1830–1836. doi: 10.1111/j.1365-2486.2009.02085.x
Feeley, K. J., Hurtado, J., Saatchi, S., Silman, M. R., and Clark, D. B. (2013). Compositional shifts in Costa Rican forests due to climate-driven species migrations. Glob. Change Biol. 19, 3472–3480.
Finegan, B., Camacho, M., and Zamora, N. (1999). Diameter increment patterns among 106 tree species in a logged and silviculturally treated Costa Rican rain forest. For. Ecol. Manag. 121, 159–176.
Finegan, B., Peña-Claros, M., de Oliveira, A., Ascarrunz, N., Bret-Harte, M. S., Carreño-Rocabado, G., et al. (2015). Does functional trait diversity predict above-ground biomass and productivity of tropical forests? Testing three alternative hypotheses. J. Ecol. 103, 191–201. doi: 10.1111/1365-2745.12346
Freeman, B., Lee-Yaw, J., Sunday, J., and Hargreaves, A. (2018). Expanding, shifting and shrinking: The impact of global warming on species’ elevational distributions. Glob. Ecol. Biogeogr. 27, 1268–1276. doi: 10.1111/geb.12774
Fung, E., Imbach, P., Corrales, L., Vilchez, S., Zamora, N., Argotty, F., et al. (2017). Mapping conservation priorities and connectivity pathways under climate change for tropical ecosystems. Clim. Change 141, 77–92. doi: 10.1007/s10584-016-1789-8
Gaughan, A., Stevens, F., Pricope, N., Hartter, J., Cassidy, L., and Salerno, J. (2019). Operationalizing vulnerability: Land system dynamics in a transfrontier conservation area (en línea). Land 8:111. doi: 10.3390/land8070111
Girardin, C. A. J., Farfan-Rios, W., Garcia, K., Feeley, K. J., Jørgensen, P. M., Murakami, A. A., et al. (2014). Spatial patterns of above-ground structure, biomass and composition in a network of six Andean elevation transects. Plant Ecol. Divers. 7, 161–171. doi: 10.1080/17550874.2013.820806
Goodman, R. S., Phillips, O. L. del Castillo Torres, D., Freitas, L. Tapia Cortese, S., Monteagudo, A., et al. (2013). Amazon palm biomass and allometry. For. Ecol. Manage. 310, 994–1004.
Grubb, P. J. (1977). Control of forest growth and distribution on wet tropical mountains: With special reference to mineral nutrition. Annu. Rev. Ecol. Syst. 8, 83–107.
Harrison, S., Davies, K. F., Safford, H. D., and Viers, J. H. (2006). Beta diversity and the scale-dependence of the productivity-diversity relationship: A test in the Californian serpentine flora. J. Ecol. 94, 110–117.
Hernández Gordillo, A. L., Finegan, B., Vilchez Mendoza, S., Ngo Bieng, M. A., and Delgado, D. (2021). Altitude and community traits explain rain forest stand dynamics over a 2370 m altitudinal gradient in Costa Rica. Ecosphere 12:e03867. doi: 10.1002/ecs2.3867
Hernández Gordillo, L. (2020). Dinámicas de bosques lluviosos tropicales de un gradiente altitudinal de la vertiente Caribe de Costa Rica. Ph. D. Thesis. Turrialba, CR: CATIE, 81.
Herrera, W. (2005). “El clima de los páramos de Costa Rica,” in Páramos de Costa Rica, eds M. Kappelle and S. P. Horn (San José, CR: Instituto Nacional de Biodiversidad), 113–128.
Imbach, P., Chou, S., Lyra, A., Rodrigues, D., Rodriguez, D., Latinovic, D., et al. (2018). Future climate change scenarios in Central America at high spatial resolution. PLoS One 13:e0193570. doi: 10.1371/journalpone.0193570
Ishtiaque, A., Estoque, R., Eakin, H., Parajuli, J., and Rabby, Y. (2022). IPCC’s current conceptualization of ‘vulnerability’ needs more clarification for climate change vulnerability assessments (en línea). J. Environ. Manag. 303:114246. doi: 10.1016/j.jenvman.2021.114246
Islebe, G., and Hooghiemstra, H. (1997). Vegetation and climate history of montane Costa Rica since the last glacial. Quaternary Sci. Rev. 16, 589–604.
Jackson, S. T., and Sax, D. F. (2010). Balancing biodiversity in a changing environment: Extinction debt, immigration credit and species turnover. Trends Ecol. Evol. 25, 153–160. doi: 10.1016/j.tree.2009.10.001
Jones, R. N. A., Patwardhan, S. J., Cohen, S., Dessai, A., Lammel, R. J., Lempert, M. M. Q., et al. (2014). “Foundations for decision making,” in Climate Change 2014: Impacts, Adaptation, and Vulnerability. Part A: Global and Sectoral Aspects. Contribution of Working Group II to the Fifth Assessment Report of the Intergovernmental Panel on Climate Change, eds Field, C. B., Barros, V. R., Dokken, D. J., Mach, K. J., Mastrandrea, M. D., Bilir, T. E., et al. (Cambridge: Cambridge University Press). pp. 195–228.
Karger, D., Conrad, O., Böhner, J., Kawohl, T., Kreft, H., Soria-Auza, R. W., et al. (2017). Climatologies at high resolution for the earth’s land surface areas. Sci. Data 4:170122. doi: 10.1038/sdata.2017.122
Klipel, J., Bergamin, R. S., Esquivel-Muelbert, A., de Lima, R. A. F., de Oliveira, A. A., Prado, P. I., et al. (2022). Climatic distribution of tree species in the Atlantic Forest. Biotropica 54, 1170–1181. doi: 10.1111/btp.13140
Kriegler, E., Bauer, N., Popp, A., Humpenöder, F., Leimbach, M., Strefler, J., et al. (2017). Fossil-fueled development (SSP5): An energy and resource intensive scenario for the 21st century. Glob. Environ. Change 42, 297–315.
Lieberman, D., Lieberman, M., Peralta, R., and Hartshorn, G. S. (1996). Tropical forest structure and composition on a large-scale altitudinal gradient in Costa Rica. J. Ecol. 84, 1376–1152.
Malhi, Y., Doughty, C. E., Goldsmith, G. R., Metcalfe, D. B., Girardin, C. A. J., Marthews, T. R., et al. (2015). The linkages between photosynthesis, productivity, growth and biomass in lowland Amazonian forests. Glob. Change Biol. 21, 2283–2295. doi: 10.1111/gcb.12859
Malhi, Y., Silman, M., Salinas, N., Bush, M., Meir, P., and Saatchi, S. (2010). Introduction: Elevation gradients in the tropics: Laboratories for ecosystem ecology and global change research. Glob. Change Biol. 16, 3171–3175.
Marshall, N., Marshall, P., Tamelander, J., Obura, D., Malleret-King, D., and Cinner, J. (2010). A framework for social adaptation to climate change sustaining tropical coastal communities and industries. Gland: IUCN.
Mata-Guel, E. O., Soh, M. C. K., Butler, C. W., Morris, R. J., Razgour, O., and Peh, K. S. –H. (2023). Impacts of anthropogenic climate change on tropical montane forests: An appraisal of the evidence. Biol. Rev. Camb. Philos. Soc. 98, 1200–1224. doi: 10.1111/brv.12950
Ministerio de Ambiente y Energía, Comisión Nacional para la Gestión de la Biodiversidad, and Sistema Nacional de Áreas de Conservación (2016). Estrategia Nacional de Biodiversidad 2016-2025. San Jose, CR: FMAM-PNUD, Fundación de Parques Nacionales-Asociación Costa Rica por Siempre, 146.
Muñoz Mazón, M., Klanderud, K., Finegan, B., Veintimilla, D., Bermeo, D., Murrieta, E., et al. (2020). How forest structure varies with elevation in old growth and secondary forest in Costa Rica. For. Ecol. Manag. 469:118191. doi: 10.1016/j.foreco.2020.118191
Nogués-Bravo, D., Araújo, M. B., Errea, M. P., and Martínez-Rica, J. P. (2007). Exposure of global mountain systems to climate warming during the 21st century. Glob. Environ. Change 17, 420–428.
Osland, M. J., Stevens, P. W., Lamont, M. M., Brusca, R. C., Hart, K. M., Waddle, J. H., et al. (2021). Tropicalization of temperate ecosystems in North America: The northward range expansion of tropical organisms in response to warming winter temperatures. Glob. Change Biol. 27, 3009–3034. doi: 10.1111/gcb.15563
Parmesan, C., Morecroft, M. D., Trisurat, Y., Adrian, R., Anshari, G. Z., Arneth, A., et al. (2022). “Terrestrial and freshwater ecosystems and their services,” in Climate change 2022: Impacts, adaptation and vulnerability. contribution of working group ii to the sixth assessment report of the Intergovernmental Panel on Climate Change, eds H.-O. Pörtner, D. C. Roberts, M. Tignor, E. S. Poloczanska, K. Mintenbeck, A. Alegría, et al. (Cambridge: Cambridge University Press), 197–377. doi: 10.1017/9781009325844.004
Pérez, T., Stroud, J. T., and Feeley, K. J. (2016). Thermal trouble in the tropics. Science 351, 1392–1393.
Poorter, L. van der Sande, M. T., Thompson, J., Arets, E. J. M. M. Alarcón, A. Álvarez-Sánchez, J., et al. (2015). Carbon storage in tropical forests. Glob. Ecol. Biogeogr. 24, 1314–1328. doi: 10.1111/geb.12364
Powers, J. S., Montgomery, R. A., Adair, E. C., Brearley, F. Q., DeWalt, S. J., Castanho, C. T., et al. (2009). Decomposition in tropical forests: A pan-tropical study of the effects of litter type, litter placement and mesofaunal exclusion across a precipitation gradient. J. Ecol. 97, 801–811. doi: 10.1111/j.1365-2745.2009.01515.x
Rahbek, C. (1995). The elevational gradient of species richness: A uniform pattern? Ecography 18, 200–205.
Rahbek, C., Borregaard, M. K., Colwell, R. K., Dalsgaard, B., Holt, B. G., Morueta-Holme, N., et al. (2019). Humboldt’s enigma: What causes global patterns of mountain biodiversity? Science 365, 1108–1113. doi: 10.1126/science.aax0149
Rehm, E. M., and Feeley, K. J. (2015). Freezing temperatures as a limit to forest recruitment above tropical Andean treelines. Ecology 96, 1856–1865. doi: 10.1890/14-1992.1
Reich, P. B. (2014). The world-wide ‘fast–slow’ plant economics spectrum: A traits manifesto. J. Ecol. 102, 275–301. doi: 10.1111/1365-2745.12211
Richard, B., Dupouey, J., Corcket, E., Alard, D., Archaux, F., Aubert, M., et al. (2021). The climatic debt is growing in the understorey of temperate forests: Stand characteristics matter. Glob. Ecol. Biogeogr. 30, 1474–1487. doi: 10.1111/geb.13312
Rozendaal, D. M. A., and Zuidema, P. A. (2011). Dendroecology in the tropics: A review. Trees 25, 3–16. doi: 10.1007/s00468-010-0480-3
Saatchi, S., Harris, N. L., Brown, S., Lefsky, M., Mitchard, E. T. A., Salas, W., et al. (2011). Benchmark map of forest carbon stocks in tropical regions across three continents. Proc. Natl. Acad. Sci. U.S.A. 108, 9899–9904.
Salinas, N., Malhi, Y., Meir, P., Silman, M., Roman Cuesta, R., Huaman, J., et al. (2011). The sensitivity of tropical leaf litter decomposition to temperature: Results from a large-scale leaf translocation experiment along an elevation gradient in Peruvian forests. N. Phytol. 189, 967–977. doi: 10.1111/j.1469-8137.2010.03521.x
Sistema Nacional de Áreas de conservación [SINAC] (2016b). Plan General de Manejo de la Reserva Forestal Rìo Macho, 2016 - 2026. Costa Rica: Área de conservación La Amistad Paciìfico, 123.
Sistema Nacional de Áreas de Conservación [SINAC] (2016a). Plan General de Manejo del Parque Nacional Barbilla, 2016-2026. Costa Rica: Área de Conservación La Amistad Caribe, 878.
Sistema Nacional de Áreas de Conservación [SINAC] (2014). Plan de Manejo del Parque Nacional Tapantí-Macizo de la Muerte. Costa Rica: Área de Conservación la Amistad Pacífico, 166.
Oliveira, M. S., Finegan, B., Casanoves, F., Delgado, D., Sepulveda, N., Aguilar, A. C., et al. (2021). Biomass of timber species in Central American secondary forests: Towards climate change mitigation through sustainable timber harvesting. For. Ecol. Manag. 496:119439. doi: 10.1016/j.foreco.2021.119439
Steinbauer, M. J., Grytnes, J. A., Jurasinski, G., Kulonen, A., Lenoir, J., Pauli, H., et al. (2018). Accelerated increase in plant species richness on mountain summits is linked to warming. Nature 556, 231–234. doi: 10.1038/s41586-018-0005-6
Stevens, G. C. (1992). The elevational gradient in altitudinal range: An extension of Rapoport’s latitudinal rule to altitude. Am. Natural. 140, 893–911.
Sullivan, M. J. P., Lewis, S. L., Affum-Baffoe, K., Castilho, C., Costa, F., Sanchez, A. C., et al. (2020). Long-term thermal sensitivity of Earth’s tropical forests. Science 368, 869–874. doi: 10.1126/science.aaw7578
Trew, B. T., and Maclean, I. M. D. (2021). Vulnerability of global biodiversity hotspots to climate change. Glob. Ecol. Biogeogr. 30, 768–783. doi: 10.1111/geb.13272
Veintimilla, D., Ngo Bieng, M. A., Delgado, D., Vilchez, S., Zamora, N., and Finegan, B. (2019). Drivers of tropical rainforest composition and alpha diversity patterns over a 2530 m altitudinal gradient. Ecol. Evol. 9, 5720–5730.
Wu, J., Porinchu, D. F., and Horn, S. P. (2019). Late Holocene hydroclimate variability in Costa Rica: Signature of the terminal classic drought and the Medieval Climate Anomaly in the northern tropical Americas. Quaternary Sci. Rev. 215, 144–159. doi: 10.1016/j.quascirev.2019.04.023
Keywords: adaptation, thermal niche breadth, biotic attrition, community temperature index, Mesoamerica, Quercus, climate change vulnerability analysis
Citation: Finegan B, Delgado D, Hernández Gordillo AL, Zamora Villalobos N, Núñez Florez R, Díaz Santos F and Vílchez Mendoza S (2024) Multi-dimensional temperature sensitivity of protected tropical mountain rain forests. Front. For. Glob. Change 6:1214911. doi: 10.3389/ffgc.2023.1214911
Received: 04 May 2023; Accepted: 11 December 2023;
Published: 09 January 2024.
Edited by:
Arshad Ali, Hebei University, ChinaReviewed by:
Kauane Maiara Bordin, Federal University of Rio Grande do Sul, BrazilCopyright © 2024 Finegan, Delgado, Hernández Gordillo, Zamora Villalobos, Núñez Florez, Díaz Santos and Vílchez Mendoza. This is an open-access article distributed under the terms of the Creative Commons Attribution License (CC BY). The use, distribution or reproduction in other forums is permitted, provided the original author(s) and the copyright owner(s) are credited and that the original publication in this journal is cited, in accordance with accepted academic practice. No use, distribution or reproduction is permitted which does not comply with these terms.
*Correspondence: Bryan Finegan, YmZpbmVnYW5AY2F0aWUuYWMuY3I=
Disclaimer: All claims expressed in this article are solely those of the authors and do not necessarily represent those of their affiliated organizations, or those of the publisher, the editors and the reviewers. Any product that may be evaluated in this article or claim that may be made by its manufacturer is not guaranteed or endorsed by the publisher.
Research integrity at Frontiers
Learn more about the work of our research integrity team to safeguard the quality of each article we publish.