 Longwei Li1,2,3†
 Huizi Zhu
 Tianzhen Wu
 Nan Li
95% of researchers rate our articles as excellent or good
Learn more about the work of our research integrity team to safeguard the quality of each article we publish.
Find out more
ORIGINAL RESEARCH article
Front. For. Glob. Change , 26 July 2023
Sec. Forest Management
Volume 6 - 2023 | https://doi.org/10.3389/ffgc.2023.1204329
This article is part of the Research Topic The Utilization and Management of Forest Resources in South and Southeast Asia View all 5 articles
On-year and off-year phenomena is an unique spatiotemporal characteristics of Moso bamboo forests (MBFs), the combination of multiple sources data to assess the impact of on-/off-year phenomena and human activities is a new perspective to better understand MBFs. There is an urgent need to explore how to characterize the spatial variability of MBFs, whether there is a pattern in the spatial distribution of MBFs boundary lines, and whether the causes of the boundary lines are directly related to human activities. In this paper, Anji County, with a large MBF area, was selected as the study area. Based on Sentinel-2 time-series data, topography and impermeability data, the on-year/off-year status and boundary lines of MBFs were determined, and the Integrated Moso bamboo On-off year Differentiation Index (IMODI) was proposed to evaluate spatial differentiation. Spatial heterogeneity, the shape pattern of boundary lines, and the impact of human activities on the MBFs were quantitatively analyzed, and 631.5 km2 of MBFs and 140 on-off boundaries were accurately obtained. The on-year and off-year MBFs and boundaries were mainly distributed in mountainous areas, especially at elevations of 100–400 m and on slopes of 10–35°. The patterns in elevation can be categorized as stable, single-change, ascending-descending and descending-ascending patterns. The patterns in slope can be summarized as stable, single-change, and trapezoidal patterns. The newly proposed IMODI shows the best performance in reflecting the spatial differentiation of MBFs, and the on-year and off-year phenomenon of MBFs was closely related to human activities because the boundary lines were mostly concentrated within 2 km of villages. The results of this paper provide a new perspective to understand landscape of MBFs and the integrated management of carbon sequestration and sinks.
Alternate bearing is a periodic variation pattern with a high-yielding year (on-year) followed by a low-yielding year (off-year), it varies biennially and frequently occurs in perennial plants, such as those growing in orchards (Shalom et al., 2012) and natural forests (Noble et al., 2018). Normally, alternate bearing can become synchronous at the sample, local and provincial scales (Li et al., 2019). As the most widely distributed and economically valuable bamboo species in the tropics and subtropics (Yuen et al., 2017; Shi et al., 2022; Zheng et al., 2022), Moso bamboo (Phyllostachys edulis) exhibits alternate bearing, a fluctuating reproduction pattern with numerous new bamboo trees growing in the on-year and rarely new bamboo trees in the off-year (Chen et al., 2019; Li et al., 2019).
Unlike other forests, Moso bamboo forests (MBFs) essentially consist of graminaceous plants characterized by tall trunks, tree shapes, and evergreen and perennial characteristics (Fang et al., 2015). They have both an aboveground bamboo stem system and underground root system (Huang Z. Y. et al., 2021). Although MBFs have flowering, dormant and fruiting periods, they are propagated by asexual reproduction of underground stems. Generally, MBFs bear fruit after flowering and then die, accompanied by the falling of leaves and the withering of the bamboo stem (Fang et al., 2015). In the 20th century, farmers tried to stop alternate bearing in the hope that new bamboo shoots would grow every year. However, Huang et al. (1980) showed that a newly planted MBF that did not exhibit the on-year and off-year pattern in the first 5 years will begin to show this patter after 5–7 years. Both exogenous conditions, such as external environmental factors (Huang et al., 1980; Zheng et al., 1996; Zhang, 2016), and endogenous triggers, such as consumption rhythm variations and hormone balance (Chen, 2010; Xu et al., 2013; Zou, 2013; Yao et al., 2015; Huang Z. Y. et al., 2021), have been considered contributing factors to the alternate bearing phenomenon of MBFs.
Traditionally, alternate bearing is a cyclical temporal phenomenon that affects annual production (Chen et al., 2018), and this temporal cycle traditionally occurs in MBFs. In addition, there is one obvious difference in that MBFs have spatial heterogeneity, for example, the leaves of on-year Moso bamboo show a dark green color, while those of off-year Moso bamboo show a bright green color in May (Figure 1A), this spatiotemporal variability undoubtedly increases the complexity and difficulty of monitoring MBFs (Li et al., 2020). Furthermore, humans are deeply involved in the growth and harvesting of MBFs (Fang et al., 2015), such as digging bamboo shoots (Figure 1B), hooking off the top tips (Figure 1C), and logging old bamboos (Figure 1D).
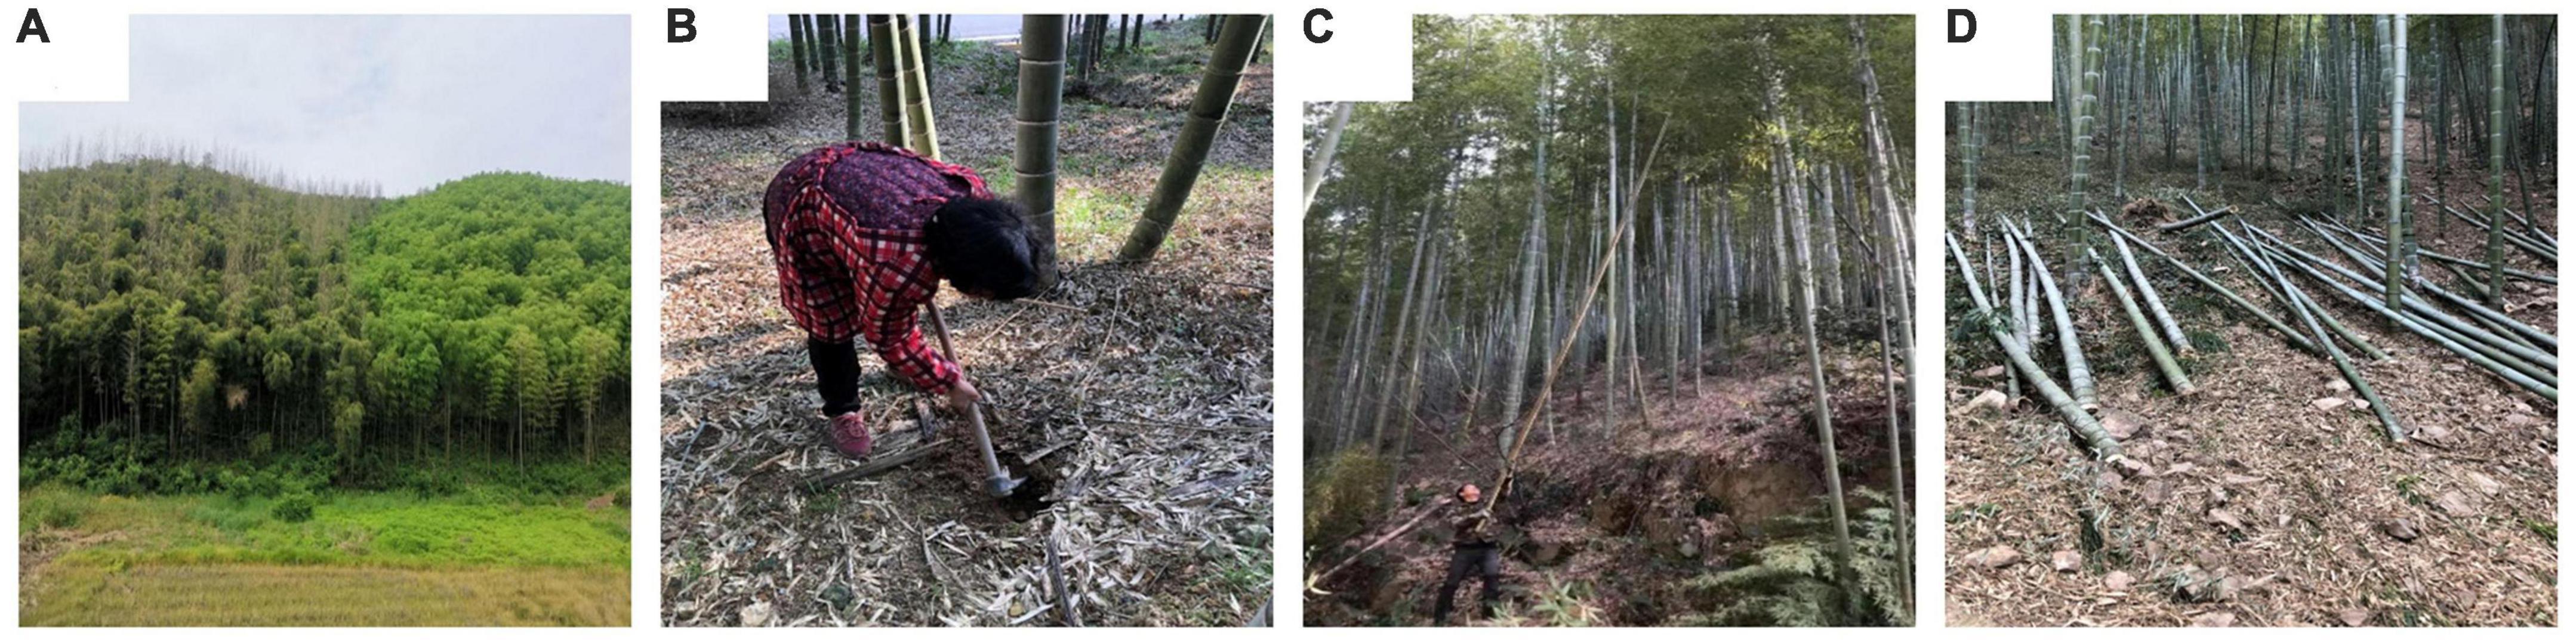
Figure 1. Unique phenological characteristics of Moso bamboo forests (MBFs) under human-nature interactions. (A) On-year bamboo (left) vs. off-year bamboo (right), (B) digging bamboo shoots in spring, (C) hooking off the top tips in fall, (D) logging old bamboos in winter.
Remote sensing technology has been widely used in the monitoring of agroforestry production activities due to its wide scope, period imaging and comprehensiveness. In recent bamboo resource monitoring studies, some scholars have used Landsat or Sentinel-2 images to successfully map the spatial distribution of bamboo forests due to their data availability (Linderman et al., 2010; Guan et al., 2013; Han et al., 2014; Li et al., 2016; Ying et al., 2016; Chen et al., 2019; Zhang et al., 2019; Qi et al., 2022), and some scholars have used MODIS images to extract bamboo forest information on a large scale (e.g., East Africa, Southeast Asia, and globally), which has proven effective (Du et al., 2018; Cui et al., 2019). However, there are fewer related studies on the mapping of on-year and off-year MBFs. Based on a comparison of Landsat-8 and Sentinel-2 data, Li et al. (2019, 2022) analyzed the temporal spectral differences between on-year and off-year bamboo forests and proposed a multitemporal remote sensing index to map the on-year and off-year spatial distribution information of MBFs, which confirmed the use of remote sensing to accurately measure the spatial variation of MBFs.
In this study, we proposed three hypotheses and quantitatively tested them: (1) Is there a spatial pattern of on-year and off-year boundary lines in MBFs? (2) How can the spatial differentiation of the on-year and off-year characteristics of MBFs be characterized? (3) Is there a direct correlation between the occurrence of on/off-years and human activities?
The study area is located in Anji County and covers 1,886 km2 in western Zhejiang Province (Anji Forestry Bureau, 2018), with Anhui Province to the northwest (Figure 2A). This region has a subtropical monsoon climate, with an annual average temperature of 15–18°C and an annual average precipitation of approximately 1,400 mm (Li et al., 2019). The topography of Anji County is high in the southwest and low in the northeast, undulating with an average elevation of 782 m and an average slope of 40°. The lowest elevation point of 0 m is located in the northeast, and the highest elevation point of 1587.4 m (Longwang Mountain) is in the south (Figure 2B).
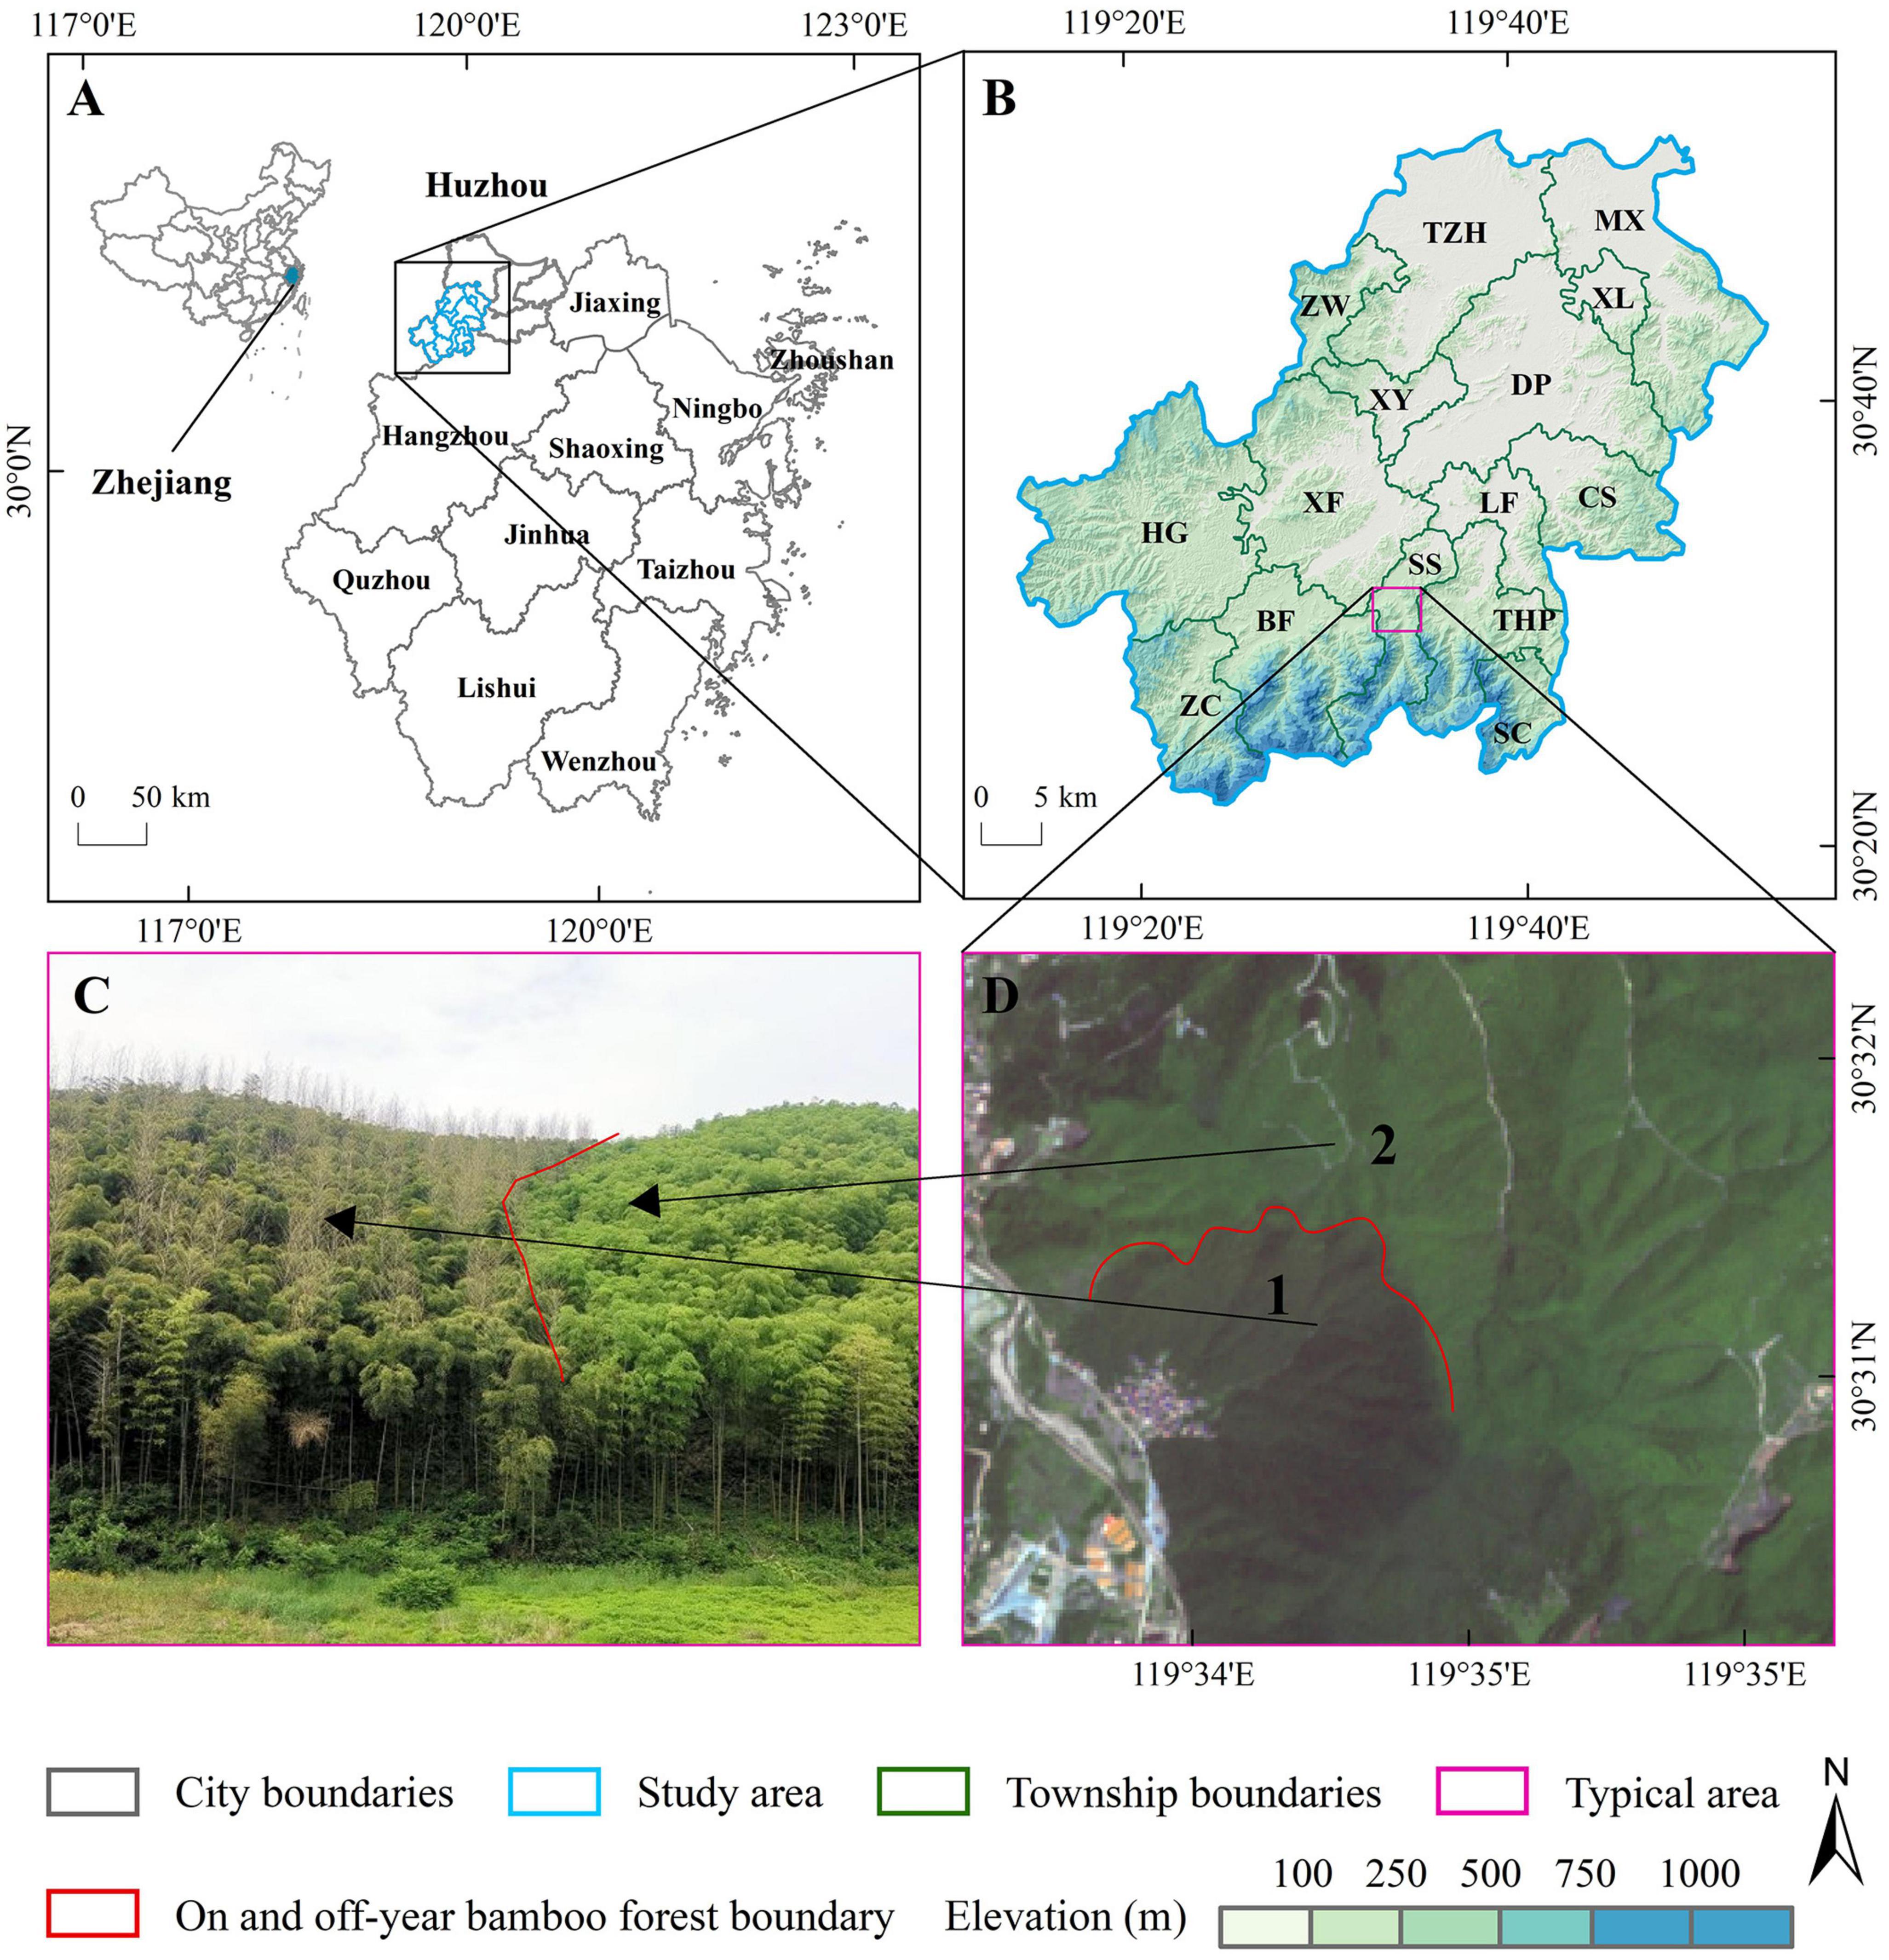
Figure 2. Study area. (A) Zhejiang Province, China. (B) Anji County, Huzhou City, Zhejiang Province. (C) Photo of on-year (number 1) and off-year (number 2) spatial phenomena taken on May 04, 2018. (D) True color composites of Sentinel-2 data, 4 May 2018: on-year (left), off-year (right).
The county has a forest cover rate of 70% (Anji Forestry Bureau, 2018). The vegetation zone of Anji County belongs to the subzone of subtropical eastern evergreen broad-leaved forest. This region has obvious vertical biome zonality: from low to high elevation, the forests change from sundry bamboo to Moso bamboo and deciduous broadleaf to evergreen coniferous. The main tree species of MBFs include evergreen broad-leaved trees (such as sawtooth oak and Schima superba) and conifers (such as Masson pine and Chinese fir). Anji County is famous as the hometown of bamboo, especially Moso bamboo. The bamboo industry is developing rapidly, with an annual output value of 15.4 billion Yuan (Anji Forestry Bureau, 2018). Because of the combination of humans and nature, the on-year and off-year phenomenon (Figure 2C) is very evident in this region (Figure 2D).
The datasets used in this study are listed in Table 1, including multitemporal Sentinel-2 imagery, digital elevation model (DEM), validation sample and impervious surface (GISA) data. All data were processed for the same projection system (Universal Transverse Mercator 50N).
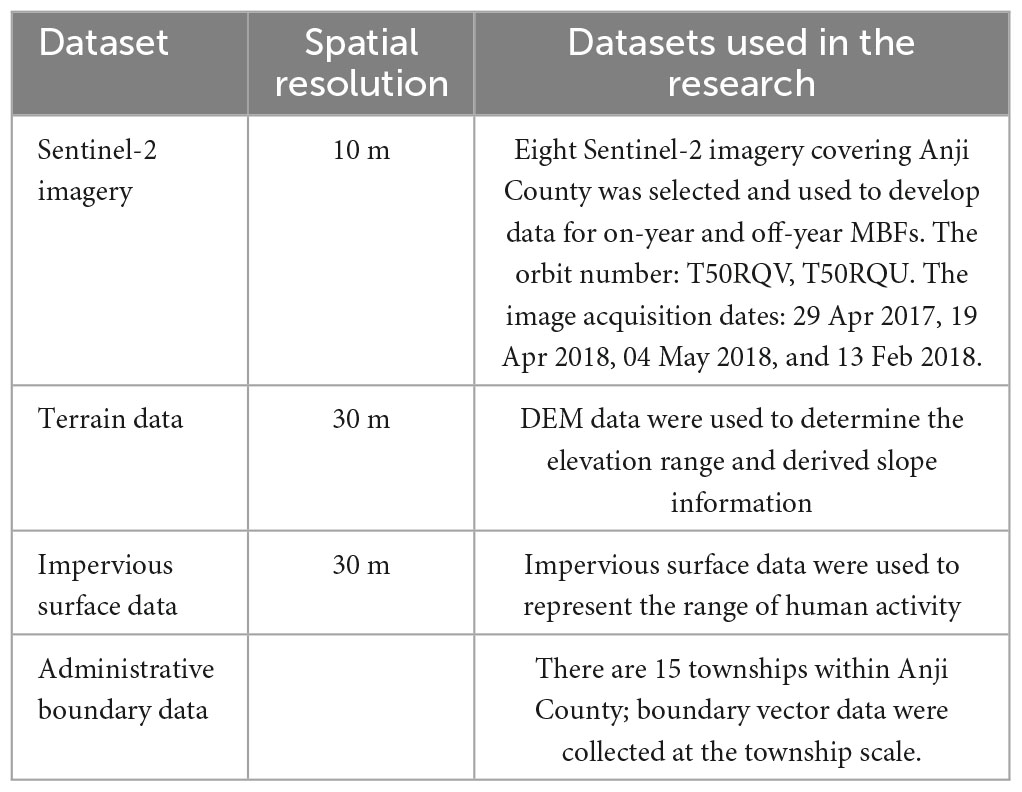
Table 1. Dataset used in this research.
The Sentinel-2 surface reflectance data (Level-2A) were downloaded from the ESA website.1 Images were acquired for December-February and May 2017–2018, and these images were processed for cloud removal, mean synthesis, mosaic cropping, and resampling to a spatial resolution of 10 m to create the image dataset. DEM data with a spatial resolution of 30 m were downloaded from the Geospatial Data Cloud,2 and elevation and slope were generated.
The 2017–2018 images were viewed through Google Earth, and the boundary lines of the on-year and off-year MBFs were mapped, with a total of 180 lines recorded as validation data.
Impervious surface data with a spatial resolution of 30 m were downloaded from the Institute of Remote Sensing Information Processing of Wuhan University (Huang X. et al., 2021)3 and combined with Google Earth imagery to extract data on settlements adjacent to the boundary lines of on-year and off-year MBFs.
The framework of this study is illustrated in Figure 3, and the major steps include the following:

Figure 3. Framework of mapping on-year and off-year MBFs under human intervention.
(1) Data collection (e.g., field survey data, administrative units, terrain data, and Sentinel-2 data) and preprocessing (geometric corrections among different data sources); (2) on-year and off-year MBF mapping using Sentinel-2 images and a hierarchy classifier; (3) development of boundaries between on-year and off-year MBFs and accuracy assessment; (4) spatial pattern analysis of MBF on-year and off-year boundaries at the elevation and slope levels; and (5) a comparison of three spatial heterogeneity indices at the township level.
Sentinel-2 data are effective data source for mapping vegetation because of the advantages of spatiotemporal resolution and data availability (Li et al., 2019, 2022; Ji et al., 2021; Liu et al., 2021; Huang et al., 2022). In this research, eight scenes of Sentinel-2 images covering Anji County were used for mapping on/off-year MBFs and on/off-year boundaries. The multitemporal bamboo forest index has been shown to distinguish on-year MBFs and off-year MBFs while having good regional transferability (Li et al., 2019, 2022). For this study, the multitemporal bamboo forest index, hierarchy classifier and edge filtering were selected to map on-year/off-year status and its boundaries in MBFs in Anji. The main steps were as follows: (1) develop a multitemporal bamboo forest index based on seasonal spectral analysis between bamboo forest and other evergreen vegetation types; (2) use a hierarchy classifier to classify the NDVI, YCBI, and MCBI into four major types: on-year MBFs, off-year MBFs, other evergreen vegetation and non-vegetation (water bodies, impervious surfaces, cropland, etc.); (3) extract the boundaries between on-year and off-year MBFs using cluster analysis and edge filtering; and (4) evaluate the on-year status, off-year status and boundaries of the MBF mapping results based on high-spatial-resolution images.
To effectively map on-year and off-year MBFs, the selection of suitable variables is critical (Li et al., 2022). In this research, the NDVI in winter was first selected to distinguish evergreen land and non-evergreen land, reducing the influence of deciduous vegetation, the pixels with an NDVI value lower than 0.5 were considered as non-vegetation land, the pixels higher than 0.5 were considered as evergreen land. The monthly change bamboo index (MCBI) and the yearly change bamboo index (YCBI) were chosen based on spring images of the two consecutive years to map on-year and off-year MBFs, the pixels with an MCBI and YCBI greater than 1.1 were considerd as off-year MBFs, the pixels with an MCBI and YCBI lower than 0.9 were considerd as on-year MBFs. A detailed description of on-year and off-year mapping is provided in Li et al. (2019).
A field survey was conducted from 2017 to 2018 using a handheld GPS to obtain photographs information of MBF and other vegetation, and to outline polygons of different forest types on Google Earth. Field data and polygon records were used as validation samples. A total of 1,000 samples with a minimum of 300 MBFs were collected to evaluate the on-year and off-year mapping accuracy, and a stratified random sampling technique was used to allocate the sample plots. Each sample plot was visually checked to decide whether it was an on-year or off-year MBF or another landcover type. An error matrix (Foody, 2002) and the F1 score were used to assess the on-year and off-year MBF mapping performance (Yang et al., 2021).
During the growth of MBFs, the phenomenon of on-year and off-year alternation gradually differentiates, resulting in obvious boundary lines, which have hardly been studied. The perspective of boundary lines is a new way to better understand the distribution patterns of MBFs, hypothese (1) “Is there a spatial pattern of on-year and off-year boundary lines in MBFs” were tested by elevation and slope factor. Topography is an important factor in MBF spatial patterns, but previous research did not pay much attention to it. In this research, we obtained the developed on-off boundaries for 2018 and then examined the impacts of elevation and slope on the on-off boundary distribution in Anji County.
The quantitative distribution and cumulative frequency were first used to analyze the data patterns of the boundary lines in terms of elevation and slope. In the second step, we categorized and analyzed each boundary line combined with Sentinel-2 true color images and stereoscopic images.
The buffer zone-based approach has been used to analyze the spatial patterns of MBFs. Because the spatial patterns of MBFs influenced by external factors such as topography, it is necessary to examine the spatial patterns of MBFs at different aspects. Therefore, we divided this study area into eight directions–east, southeast, south, southwest, west, northwest, north, and northeast–with buffer zones of 100 m intervals within a radius of 900 m in elevation and buffer zones of 5° intervals within a radius of 60° in slope.
Li et al. (2022) proposed the Moso bamboo on-/off-year Differentiation Index (MODI) to reflect the spatial variation in on-year and off-year MBFs. The calculation of the MODI was relatively crude, and it needed to be combined with other indices to represent the MBF spatial patterns. In this research, we create three new indices, named the Integrated Moso bamboo On-off year Differentiation Index (IMODI), Absolute Moso bamboo On-off year Differentiation Index (AMODI), and Opposite Moso bamboo On-off year Differentiation Index (OMODI), to characterize the spatial differentiation performance of the on-year and off-year MBFs (Figure 4). The OMODI was then developed but was judged to have a high differentiation correlation when the area of Moso bamboo stands was equal in on/off years. To solve both problems, the IMODI was finally created to specifically characterize the degree of on- and off-year Moso bamboo stand differentiation.
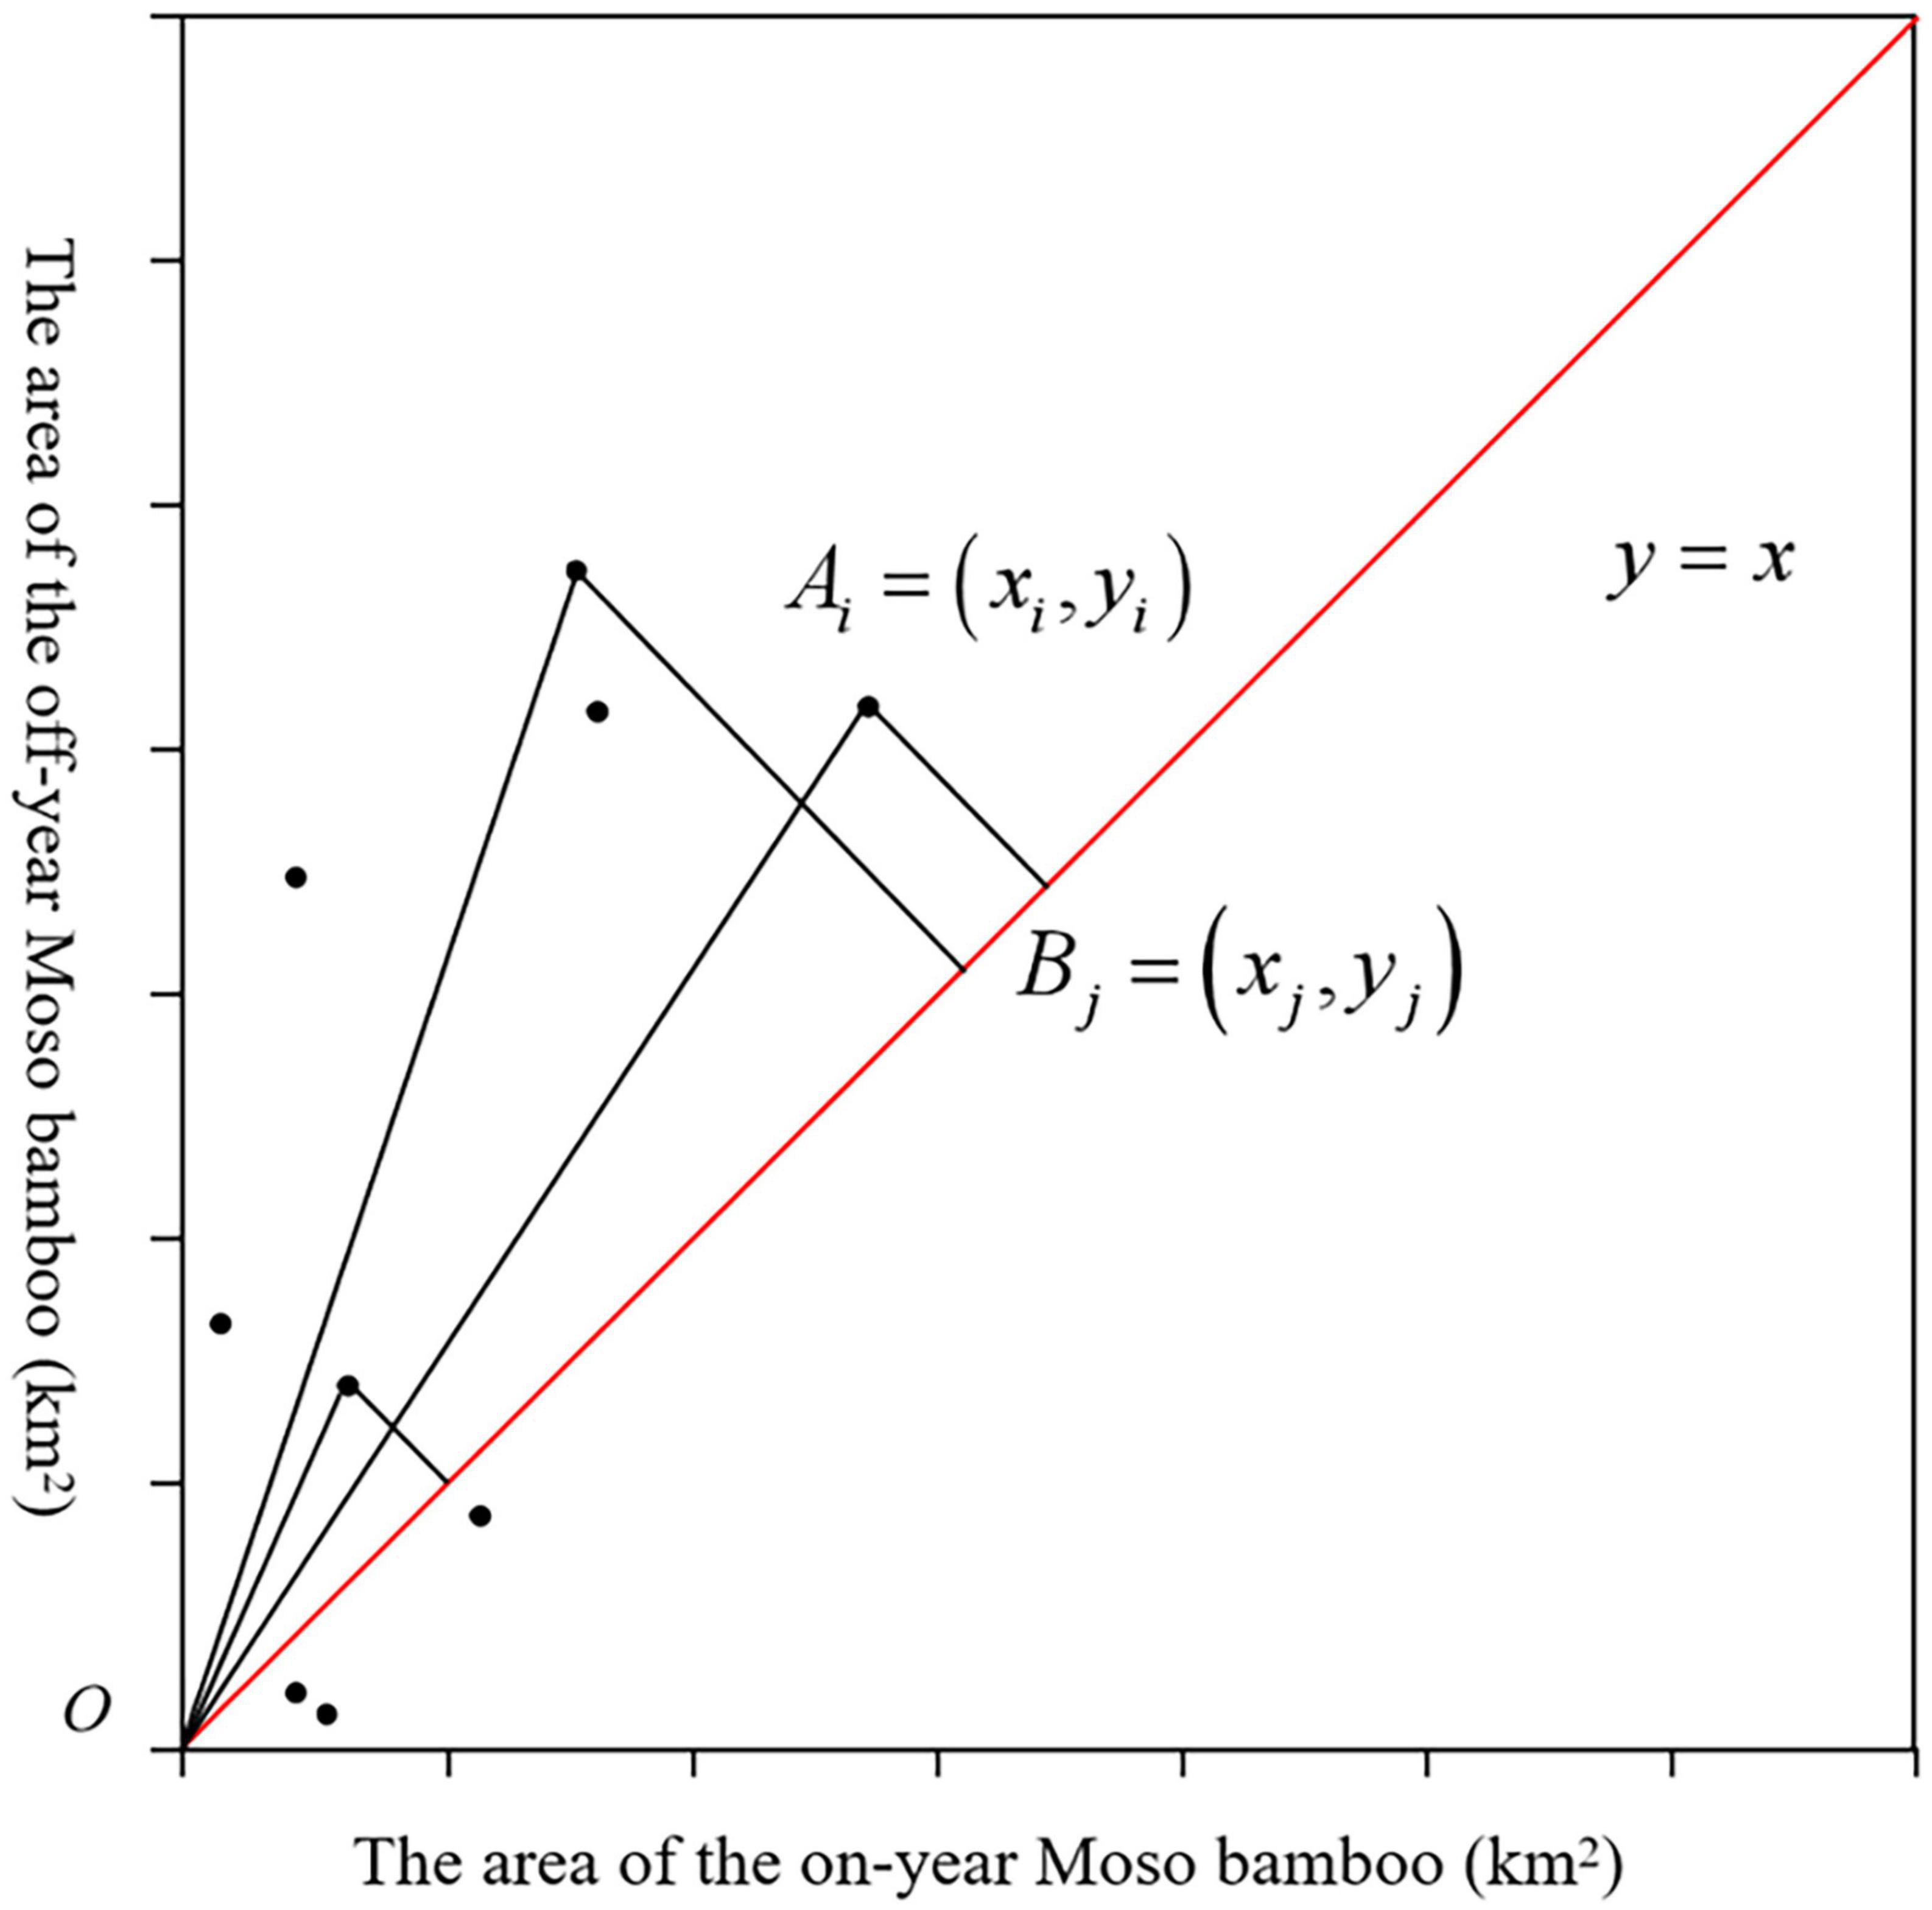
Figure 4. Diagram of the calculation of the OMODI.
The values for the three indices were classified into five levels: extremely low (0 ≤ Index < 0.2), low (0.2 ≤ Index < 0.4), normal (0.4 ≤ Index < 0.6), high (0.6 ≤ Index < 0.8), and extremely high (0.8 ≤ Index ≤ 1). The AMODI/IMODI/OMODI values of the zones at the township level were mapped and comparatively analyzed. The final value of the IMODI was used to assess the degree of on- and off-year Moso bamboo differentiation in the townships of Anji County.
The Sentinel-2 MBF maps show the on-year and off-year MBF distributions in Anji County (Figure 5). We calculated the number of individual pixels covered by on-year and off-year MBFs. A total of 6,314,982 pixels (631.5 km2) were classified as MBFs, of which 2,505,409 pixels (250.54 km2) were on-year MBFs and 3,809,573 pixels (380.96 km2) were off-year MBFs. Based on the third-party validation samples (Figure 5), the accuracies of the sentinel-2 MBFs were high, the overall accuracy was ∼96%, the user accuracy was 92 to 97%, the producer accuracies was 93.3 to 98.5%, and the F1 scores of on-year and off-year MBFs were 93 and 93.5%, respectively (Supplementary material A). The on-year MBF map for 2018 had a slightly higher accuracy than the off-year MBF map, which was expected because the spectral difference of on-year MBFs in spring is more obvious. On-year MBFs were mainly distributed in the southeast and northwest of Anji County, while off-year MBFs were distributed in the southwest.
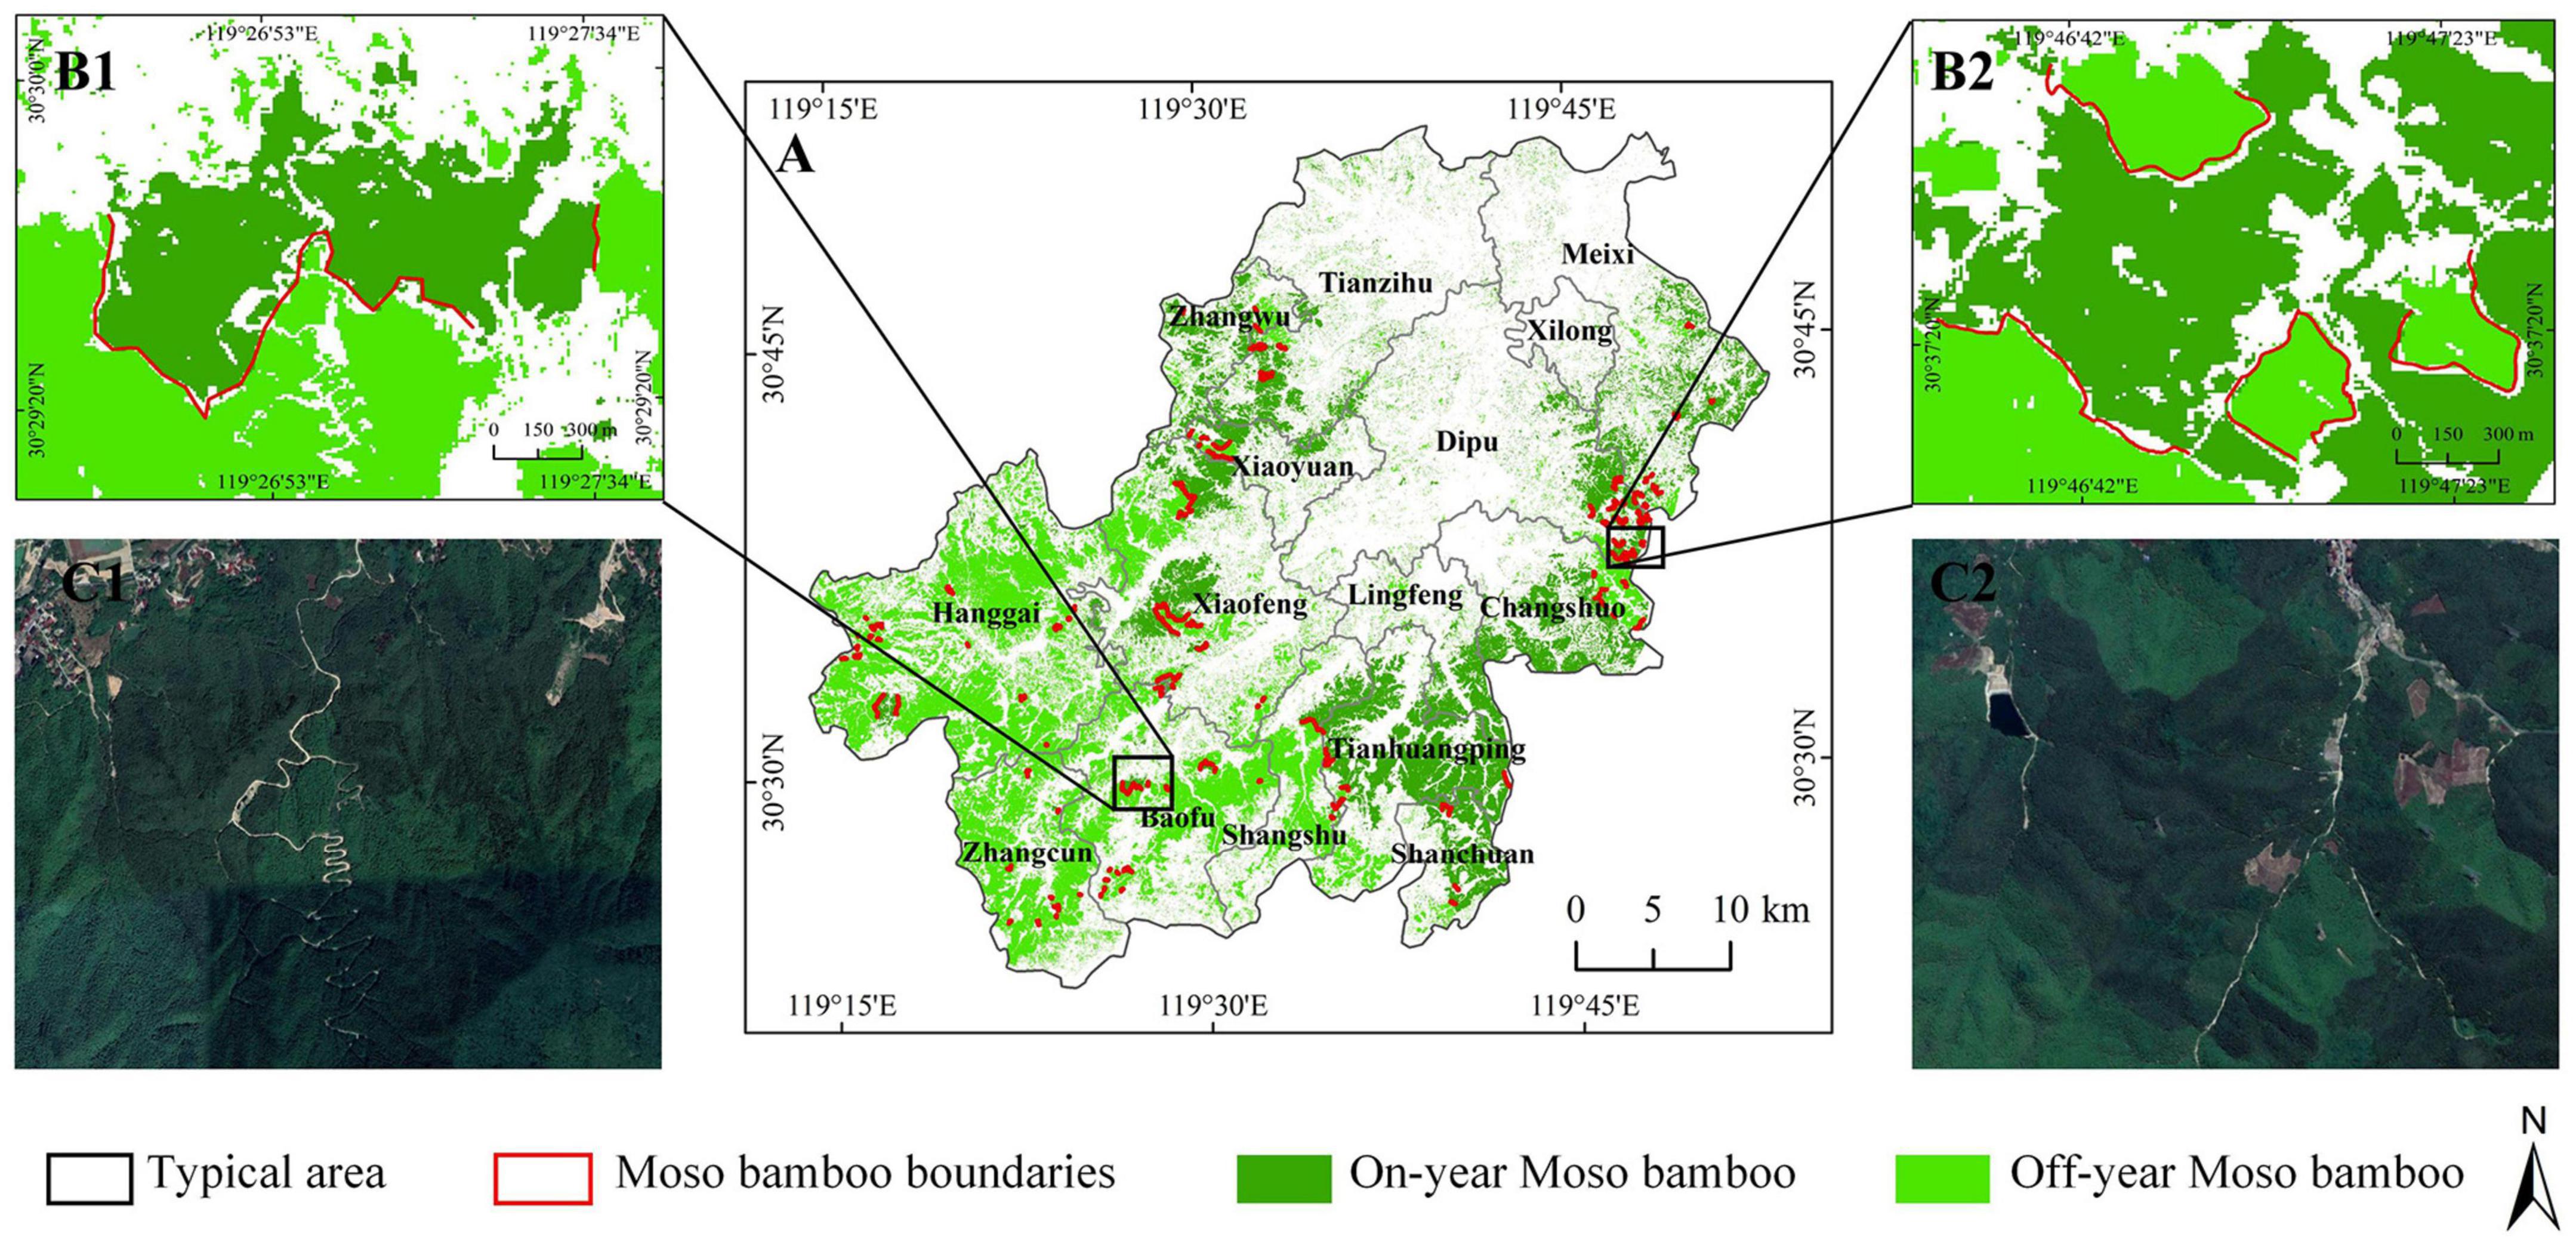
Figure 5. Moso bamboo forest on/off-year and boundary line maps for 2018 based on Sentinel-2 data, (A) MBFs maps in Anji County, (B1) and (B2) typical on/off-year maps and boundary lines (solid red line), (C1) and (C2) Sentinel-2 data and boundary lines.
Based on MBF on/off-year maps and edge filtering, a total of 140 MBF boundary lines (Figure 5A) were obtained in Anji County for 2018. These boundary lines are understandably distributed between on-year and off-year MBFs. The total length of these boundary lines on the plane is 83,548 meters, the longest boundary line is 3,639 m, distributed in the northwest, and the shortest boundary line is 102 m, distributed in the southeast. The average length of the boundary line is 597 m.
The boundary lines of the 140 MBFs showed different statistical characteristics in terms of elevation and slope. As shown in Figure 6A, the boundary lines were distributed between elevations of 79 and 856 m. Within the elevation range of 100–200 m, the number of boundary lines showed an overall increasing trend. The distribution was most concentrated near an elevation of 200 m and showed a decreasing trend above 200 m. The cumulative percentage of the boundary line distribution frequency within 500 m increased rapidly, that between 500 and 900 m slowly increased. Ninety-five percent of the MBFs were distributed in the range of 100 to 600 m.
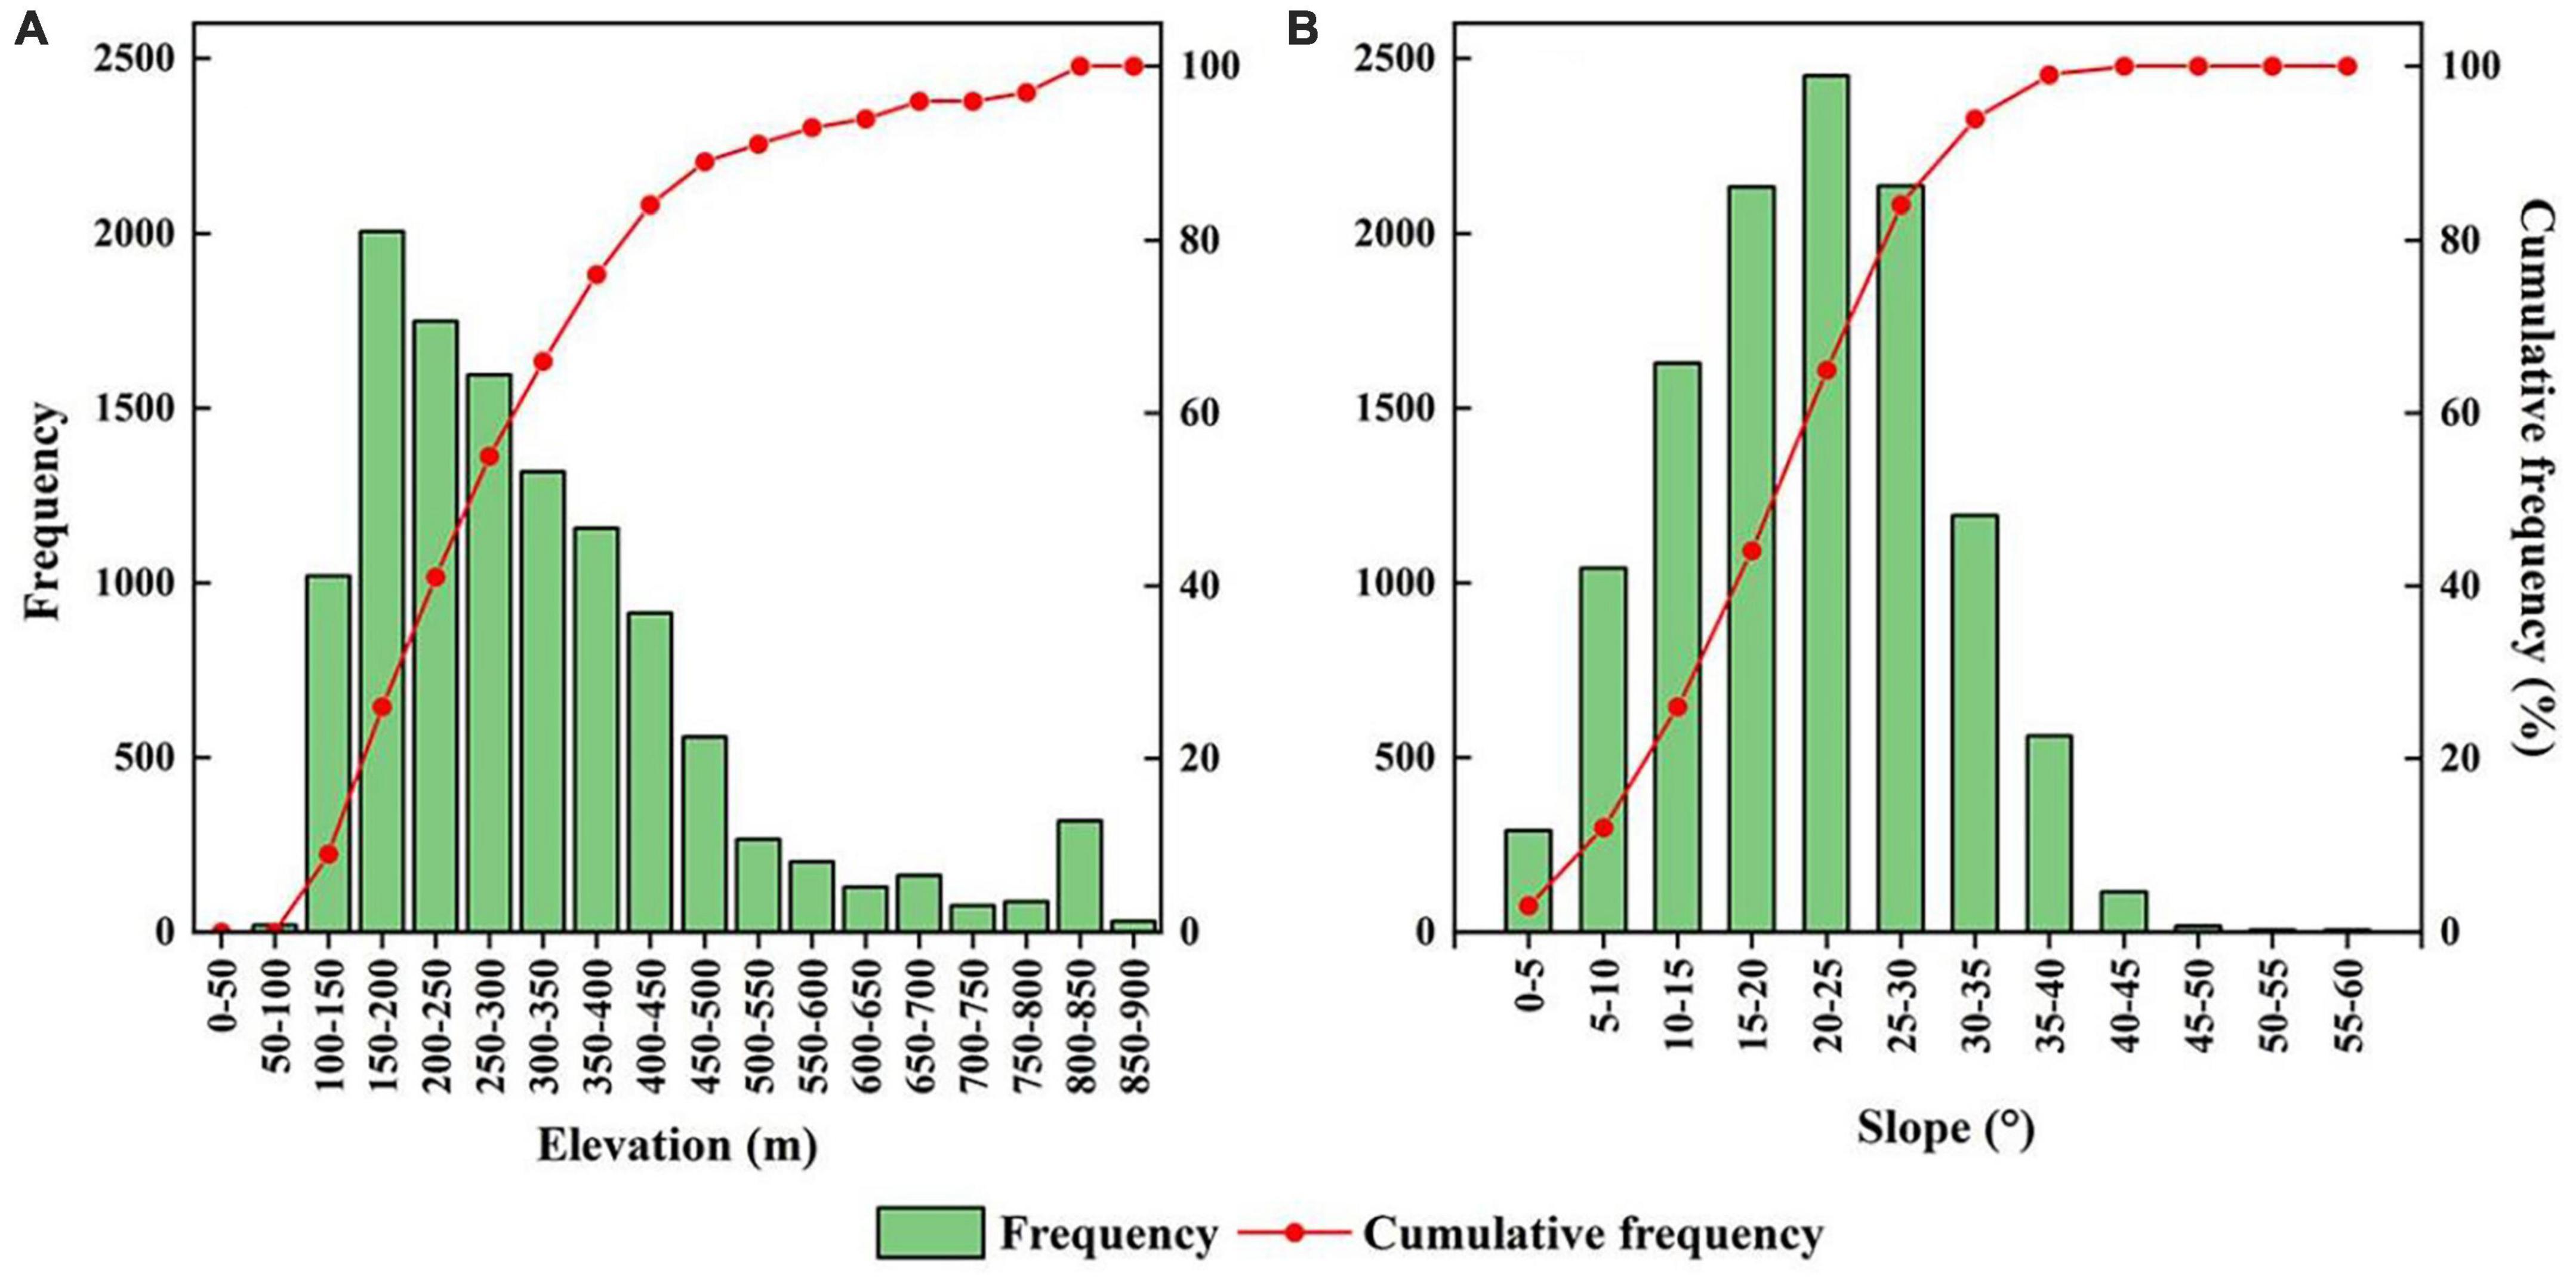
Figure 6. Frequency of the on-off boundary line distribution. (A) Elevation, (B) slope.
In terms of slope (Figure 6B), the boundary lines are distributed between 0 and 60°, concentrated between 15 and 30°, and the most concentrated near 25°. At a 0–25° slope, there was an overall increasing trend, and after a 35° slope, there was an overall decreasing trend. The cumulative percentage of the frequency of the boundary line distribution within a 30° of slope increased slowly.
A total of 140 boundary lines were calculated and mapped in terms of elevation and slope. Observation and analysis of the boundary lines generally revealed four forms as defined by elevation, namely, the stable type (Figure 7A1), single-change (ascending or descending) type (Figure 7B1), ascending then descending type (Figure 7C1), and descending then ascending type (Figure 7D1). Each type of change could be observed in the 2D scene and the 3D scene (Figure 7). There were some differences among the four overall patterns (Figure 7), and these typical sample patterns fluctuated and changed around the overall trend range line.
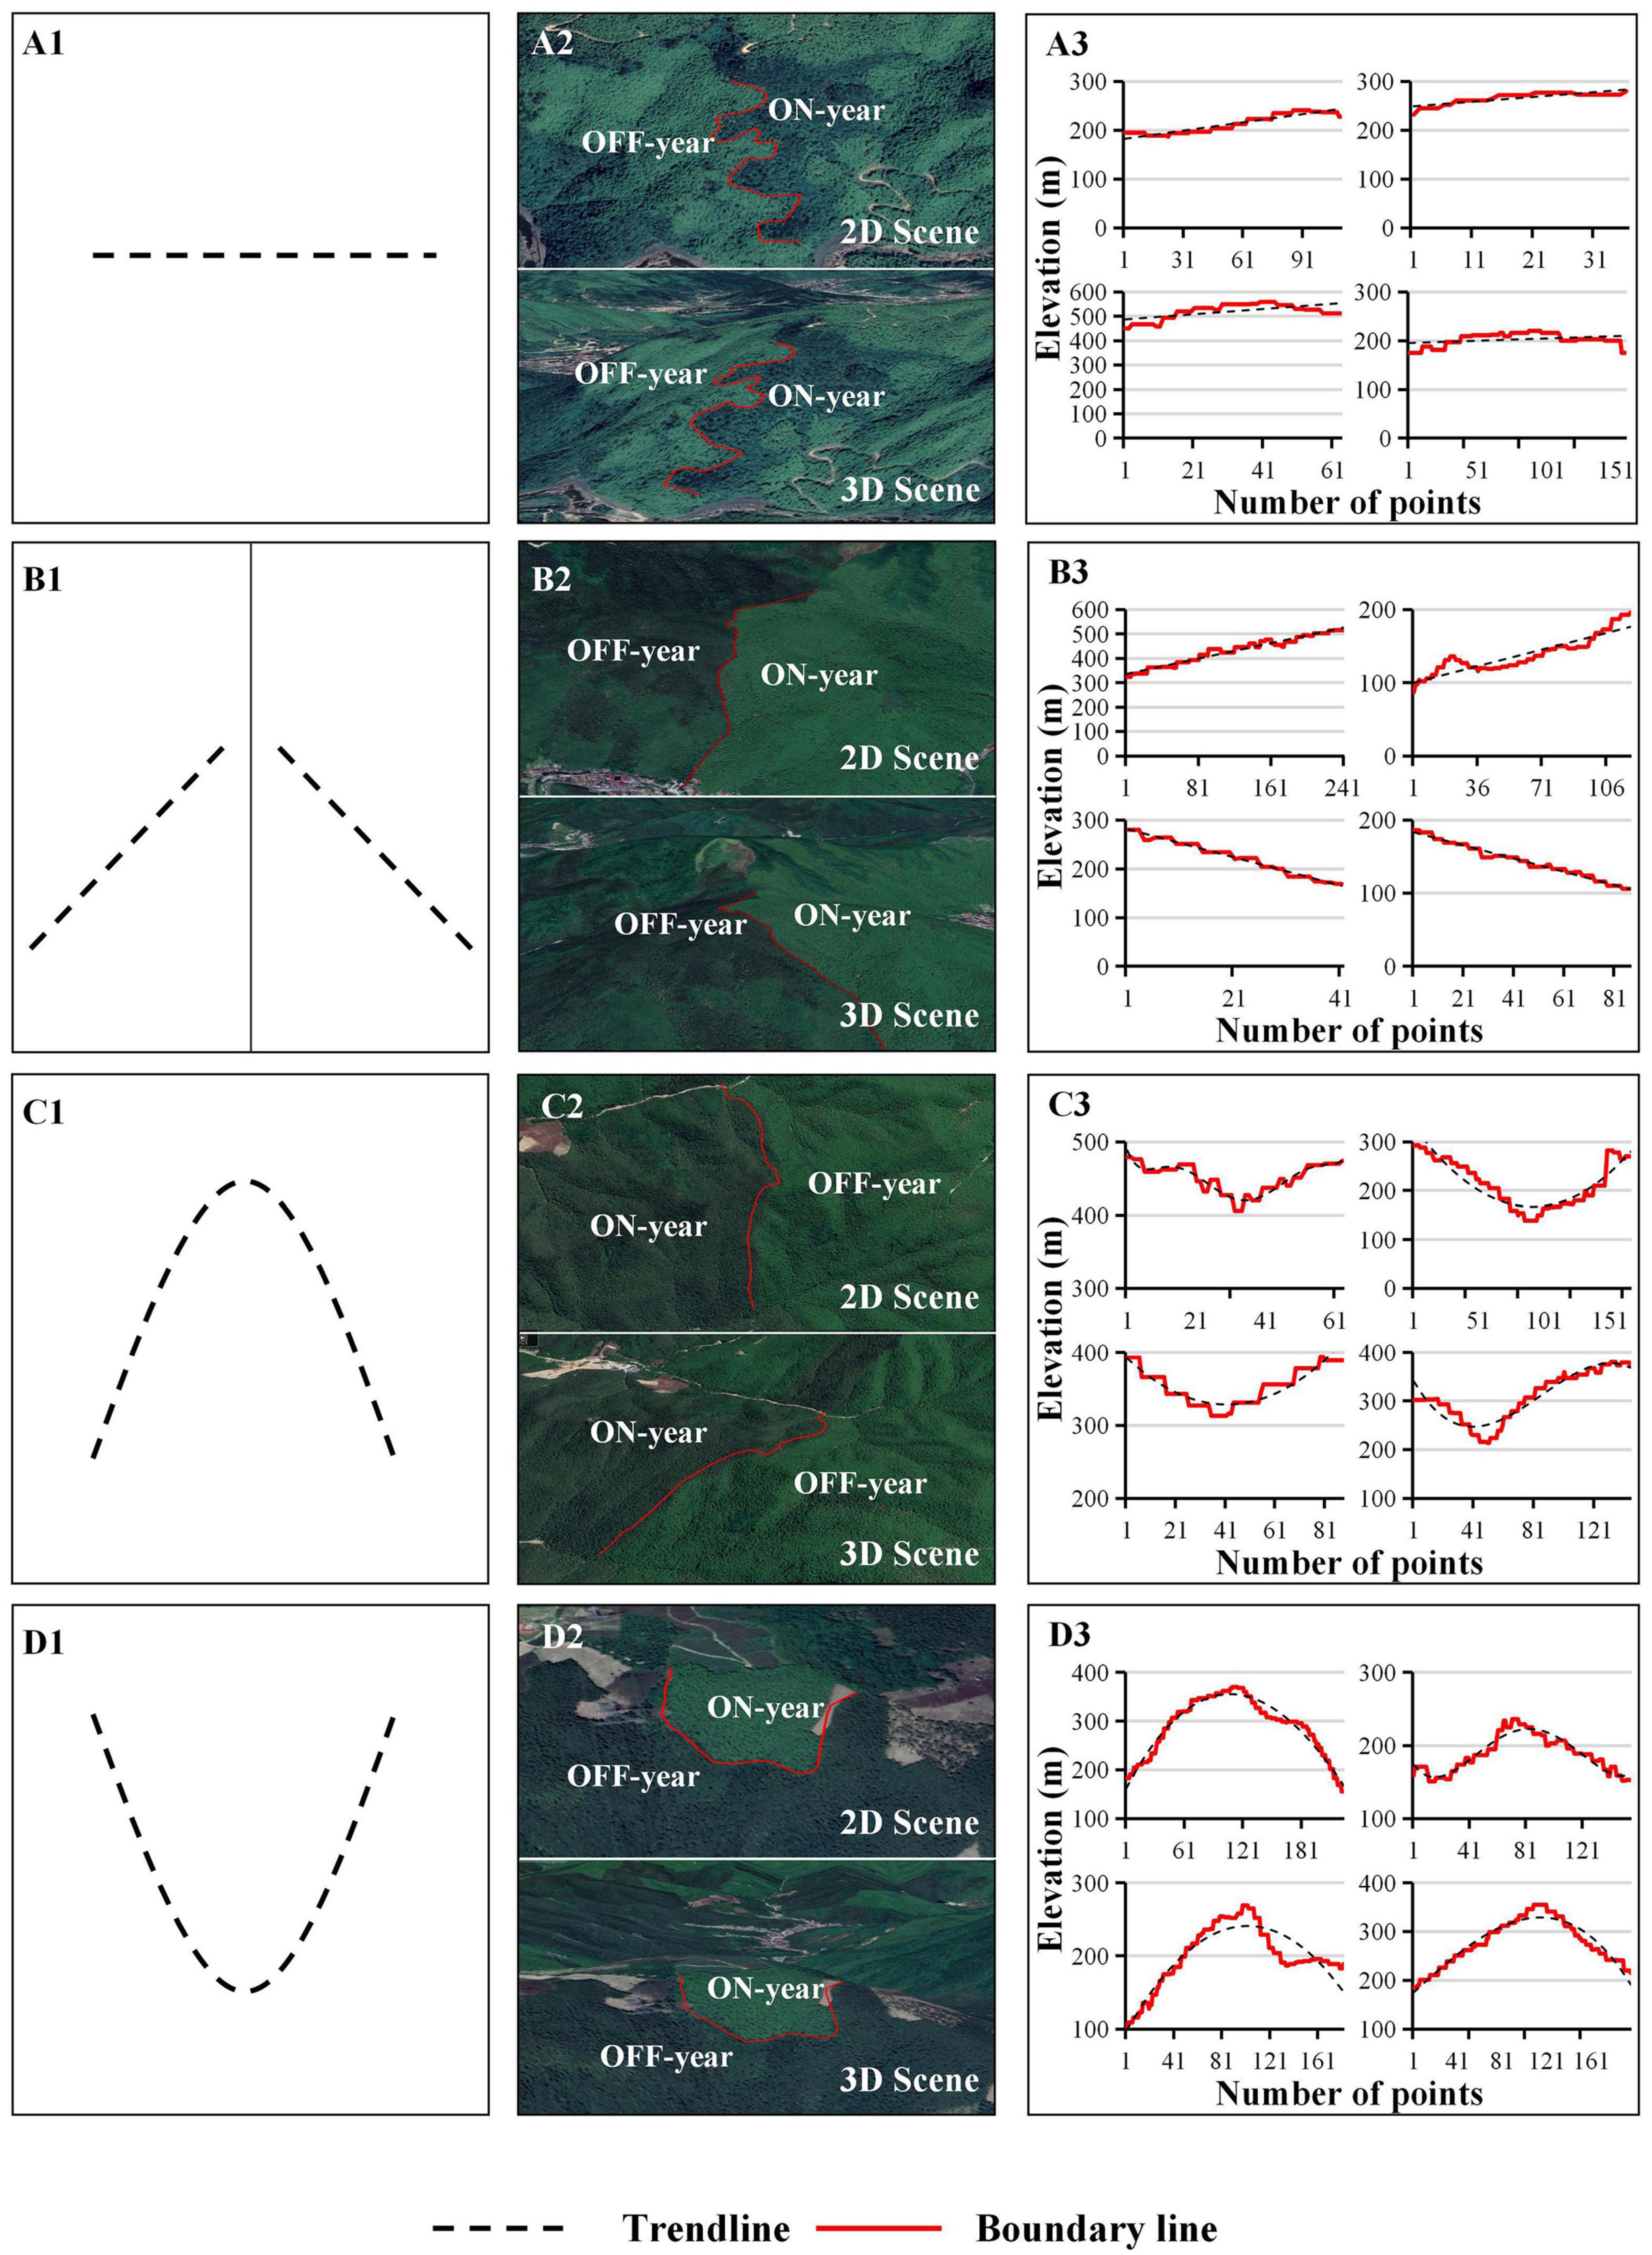
Figure 7. Horizontal view of the on-/off-year boundary variation in elevation. (A1–A3) Series represent stable type, (B1–B3) series represent single-change (ascending or descending) type, (C1–C3) series represent ascending then descending type, (D1–D3) series represent descending then ascending type. Series1 represent spatial type, series2 represent 2D/3D Scene, series3 represent diagram of typical boundary changes.
The regular changes in the slope of the boundary line also showed three trends, which were the stable (Figure 8A1), single-change (ascending or descending) (Figure 8B1), and trapezoidal (Figure 8C1) types. This is different from the regular change in elevation of the boundary line. According to the image distribution and the line graph results (Figure 8), the change in the boundary line on the slope did not fluctuate greatly, but compared with the elevation change, the data fluctuation was more obvious. However, the general rule remained the same, the regularity of the boundary line distribution in terms of slope can be clearly found, and the overall trend remains unchanged, which can be recognized as the stable, single-change (ascending or descending), and trapezoidal types.
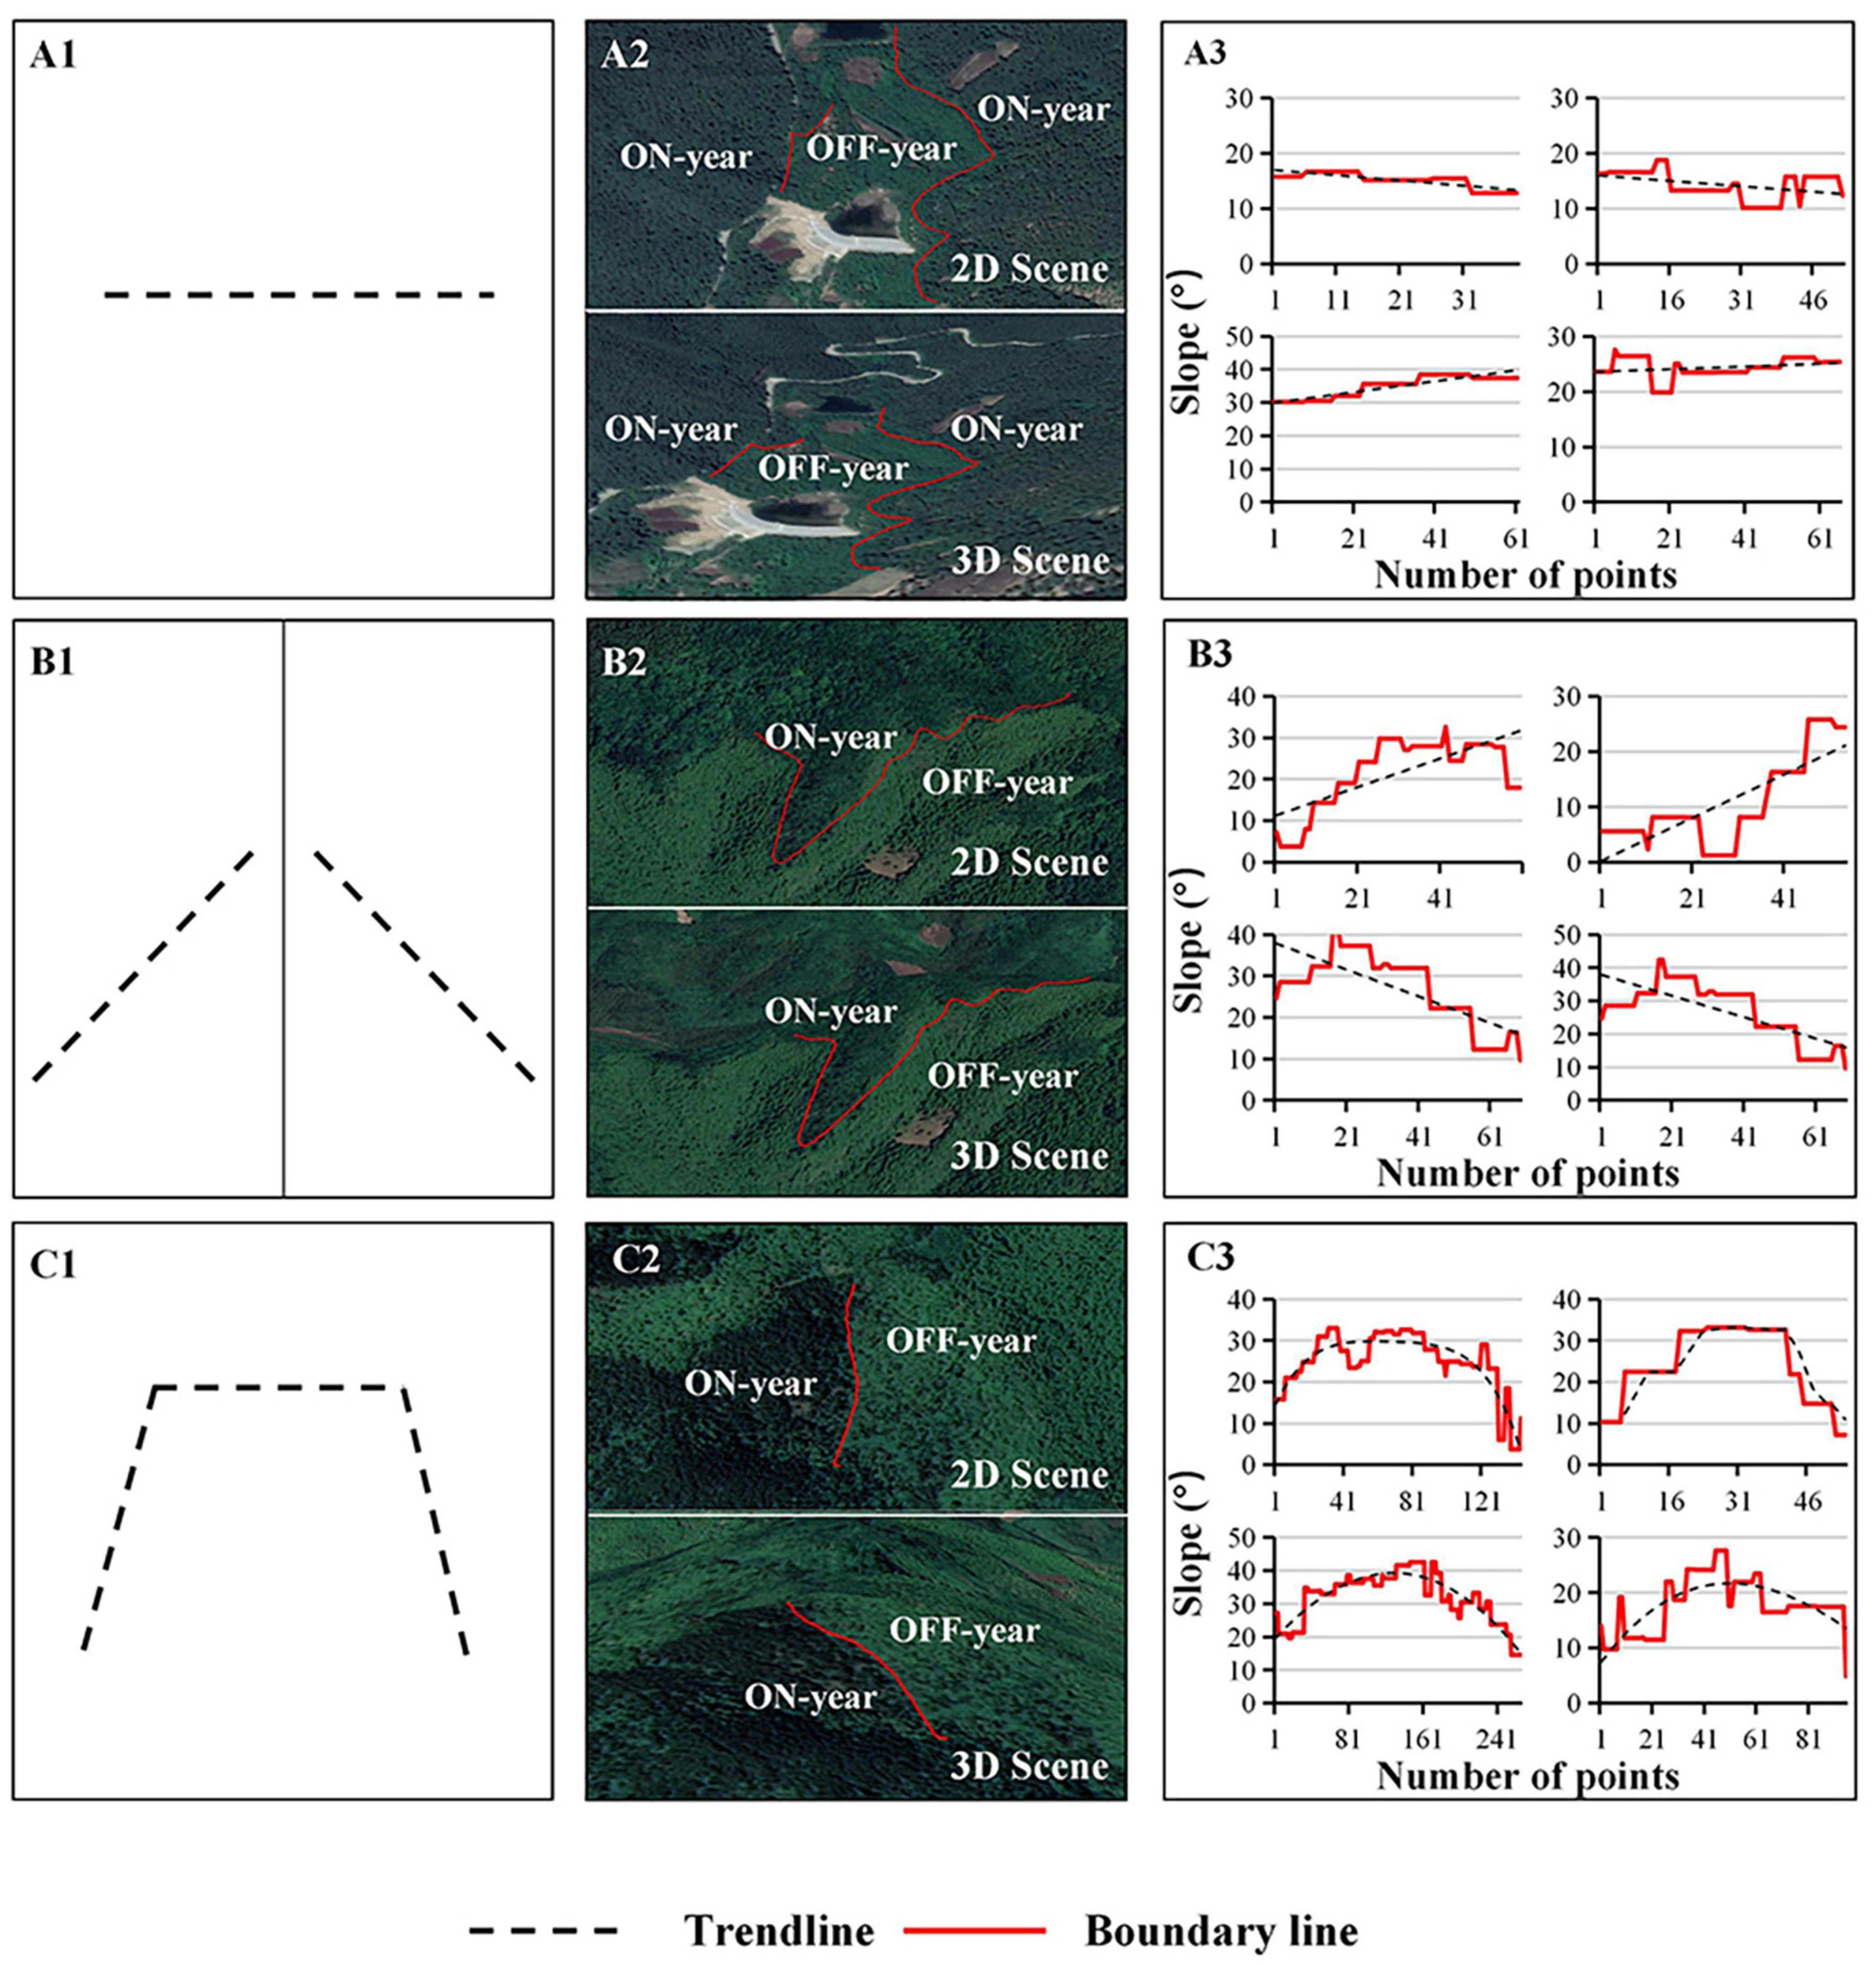
Figure 8. Horizontal view of the on-/off-year boundary variation in slope. (A1–A3) Series represent stable type, (B1–B3) series represent single-change (ascending or descending) type, (C1–C3) series represent trapezoidal type. Series1 represent spatial type, series2 represent 2D/3D Scene, series3 represent diagram of typical boundary changes.
Based on the obtained spatial distribution data of MBF on-/off-year maps, we focused on spatial heterogeneity insights at the township level. The areas of on-year and off-year MBFs in 15 townships were calculated and included in the variability analysis. Meanwhile, the spatial heterogeneity values of on-year and off-year MBFs based on three indices (AMODI, OMODI, and IMODI) were calculated and mapped (Figure 9).
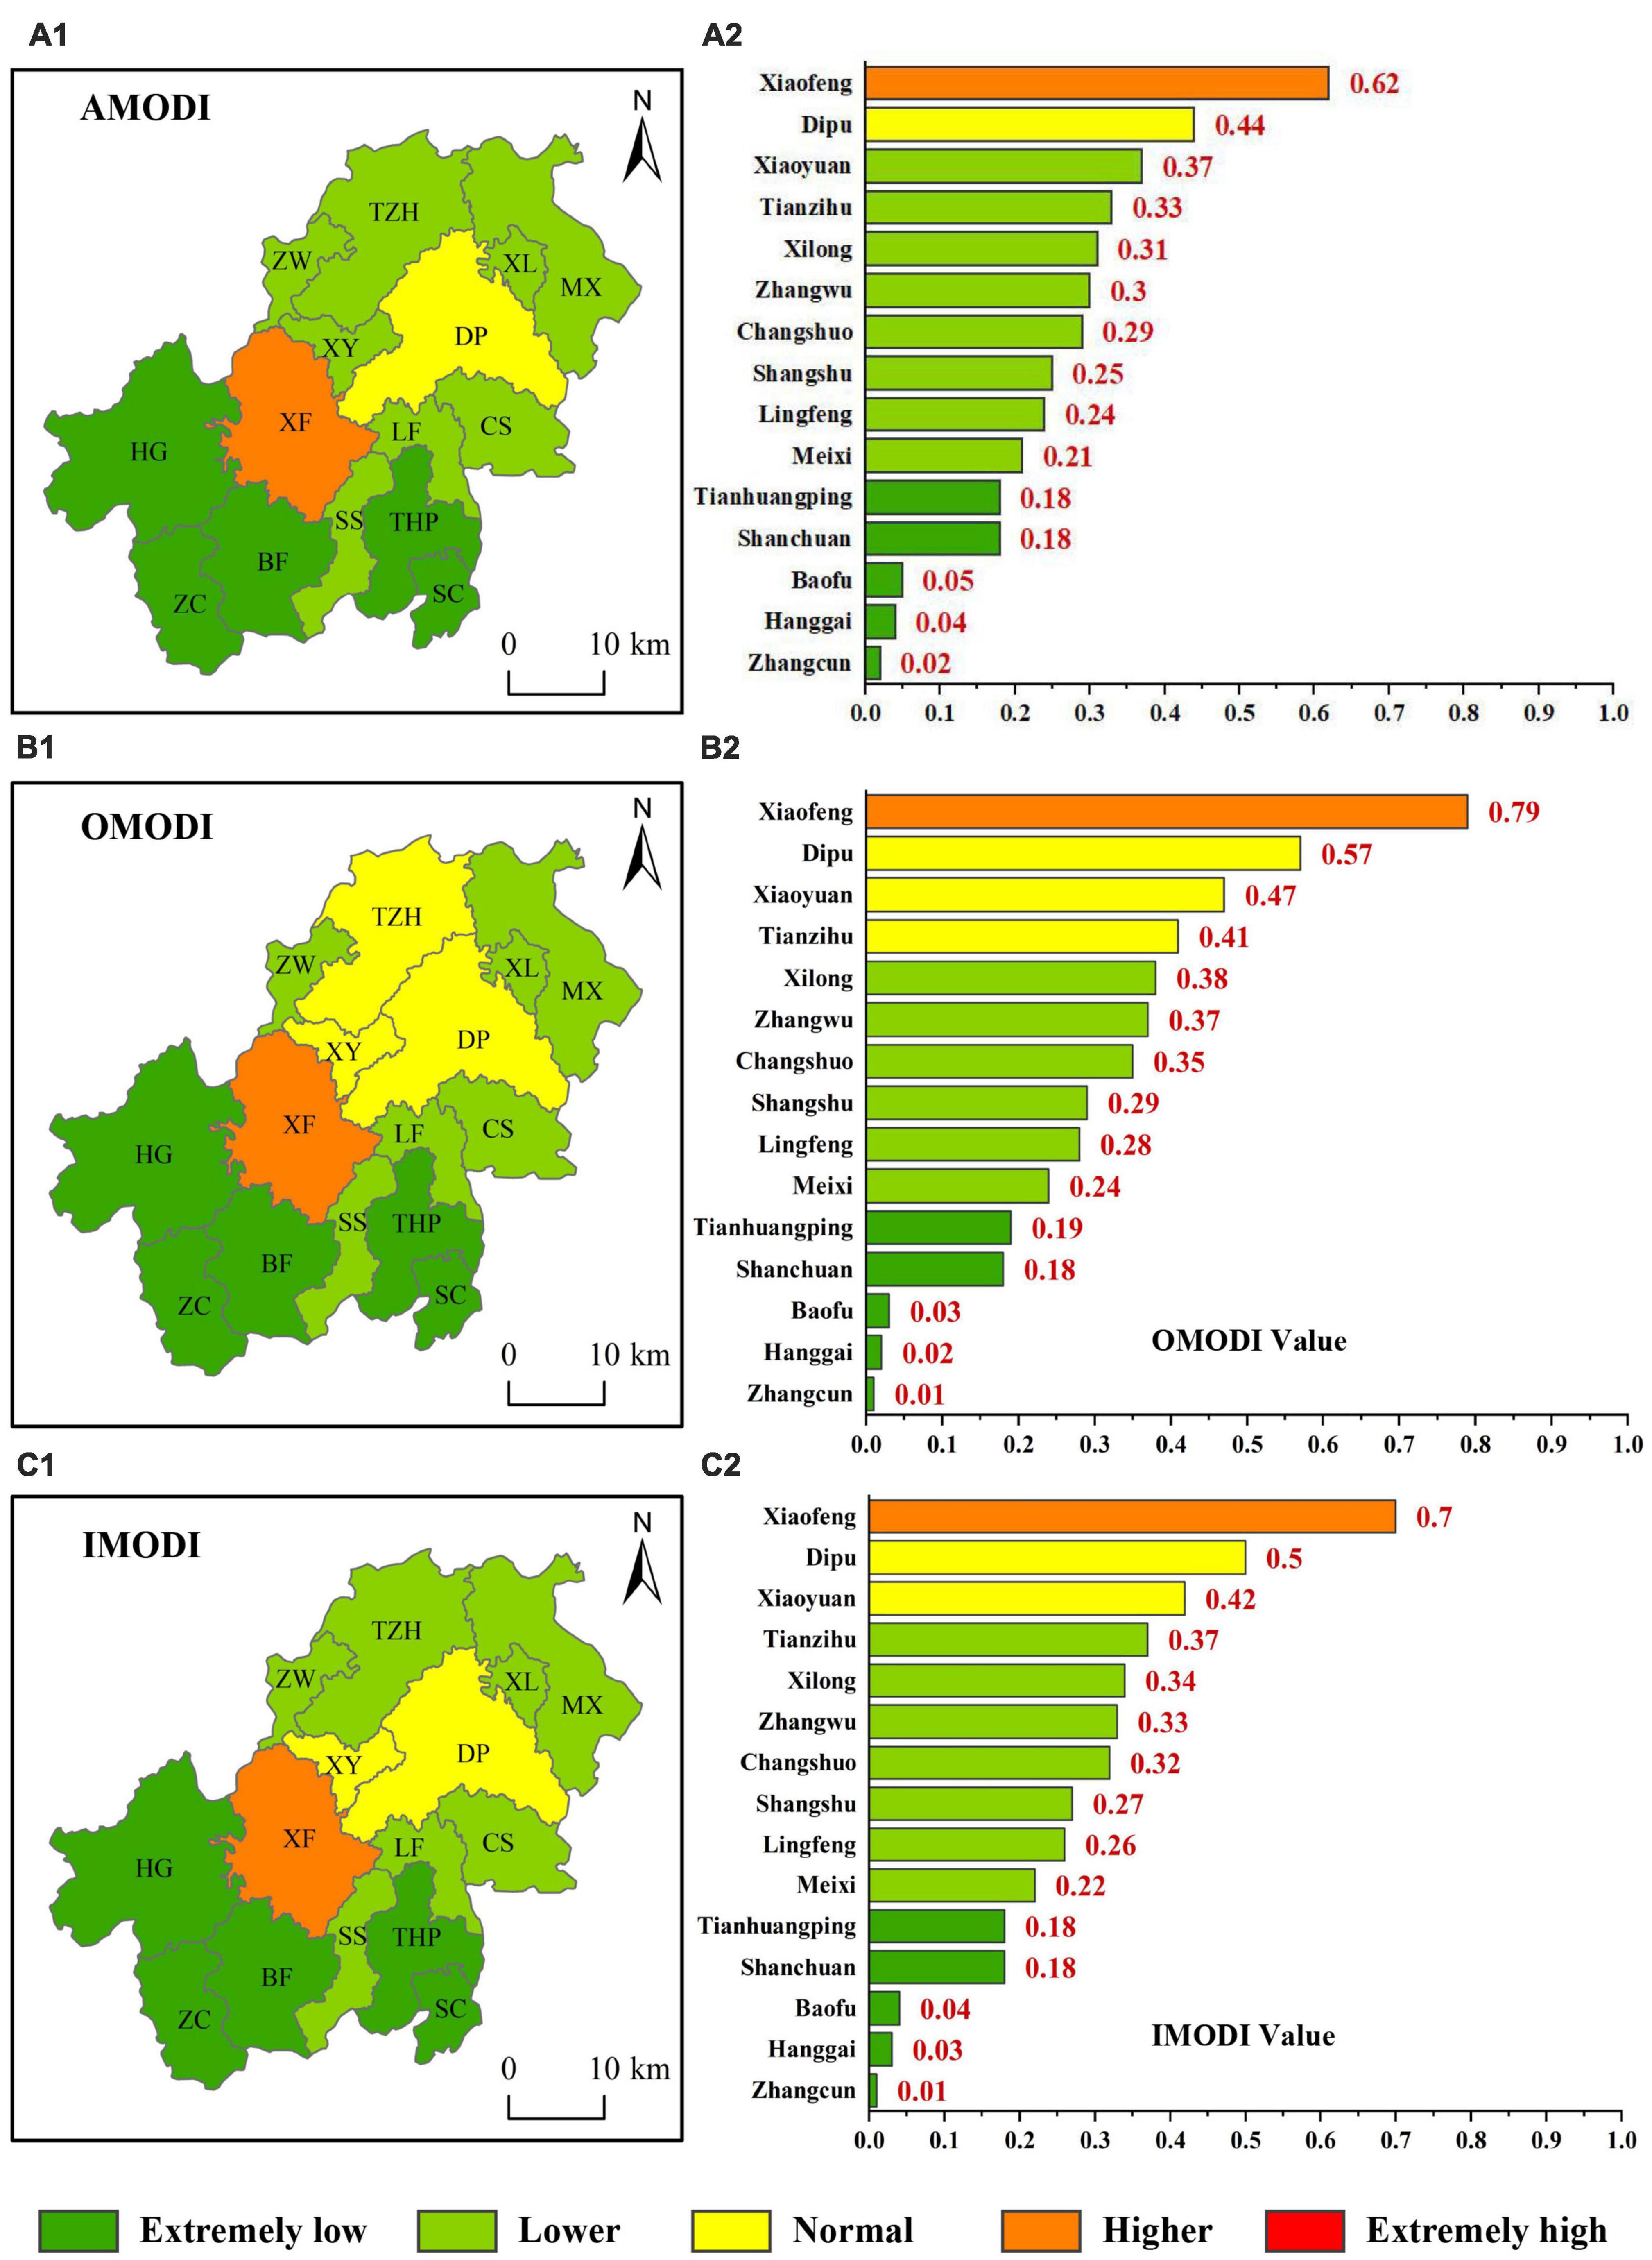
Figure 9. Spatial heterogeneity map of the AMODI, OMODI, and IMODI in Anji County. (A1,A2) Series represent map results of AMODI, (B1,B2) series represent map results of OMODI, (C1,C2) series represent map results of IMODI. Series1 represent spatial heterogeneity map, series2 represent index value for each township.
The AMODI, OMODI, and IMODI values of Xiaofeng township were 0.62, 0.79, and 0.70, respectively, making it the township with the highest differentiation degree of on-year and off-year MBFs in Anji County. The AMODI, OMODI, and IMODI values of Zhangcun township were 0.02, 0.01, and 0.01, respectively, and were judged to be extremely low, making this township that with the lowest degree.
The AMODI, OMODI, and IMODI values of the MBF in Zhangcun, Hanggai, and Gifu towns, located in southwestern Anji County, were all extremely low, with the IMODI of the three towns being 0.01, 0.03, and 0.04, respectively (Figure 9). These three towns had the lowest degree of annual variation in MBF in Anji County. The values of AMODI, OMODI, and IMODI in Xiaoyuan Street, Dipu Street, and Xiaofeng Township in central Anji County were all high or very high, with IMODI values of 0.42, 0.50, and 0.70, respectively, which were the three townships with the highest degree of annual variation in MBF in Anji County.
Accurate data on the spatial and temporal distribution of bamboo forests are essential to support sustainable ecosystem management and biodiversity conservation. Current studies have used sensors with different resolutions to map bamboo forests from spectral, phenological, textural, and morphological perspectives and with different classifiers (Liu et al., 2018; Zhao et al., 2018; Qi et al., 2022; Lv et al., 2023; Xiang et al., 2023; Li et al., 2019). Most of these studies focused on the overall distribution of bamboo forests, this study analyzed the distribution of on/off-year bamboo forests from phenological patterns. The timing of image observations and cloud occlusion are tricky issues for bamboo forest mapping, as most bamboo forest distributions in China are currently distributed in humid and warm climates, which suggests a large cloud frequency (Feng et al., 2023), May is the best month to distinguish on-year and off-year MBFs (Li et al., 2019). In this paper, we obtained the total bamboo forest area of Anji County over 600 km2, and the on/off-year MBF areas were 250.54 km2 and 380.96 km2. In addition to the spatial distribution of on-year and off-year MBFs, boundary lines were also developed. The boundaries of on-year and off-year MBFs exhibit a certain degree of regularity in elevation and slope, such as the single-change (ascending or descending) type (Figures 7A1, B1), ascending then descending type (Figure 7C1), and descending then ascending type (Figure 7D1). In addition to the above types, there are also some irregular patterns, such as bimodal morphology and multimodal wave patterns see details in Supplementary material A. We also aimed to analyze the variation rules of these boundary lines in different directions (Figure 10). 3D scene maps containing elevation and slope levels, proportions, and eight directions are shown in Figure 10.
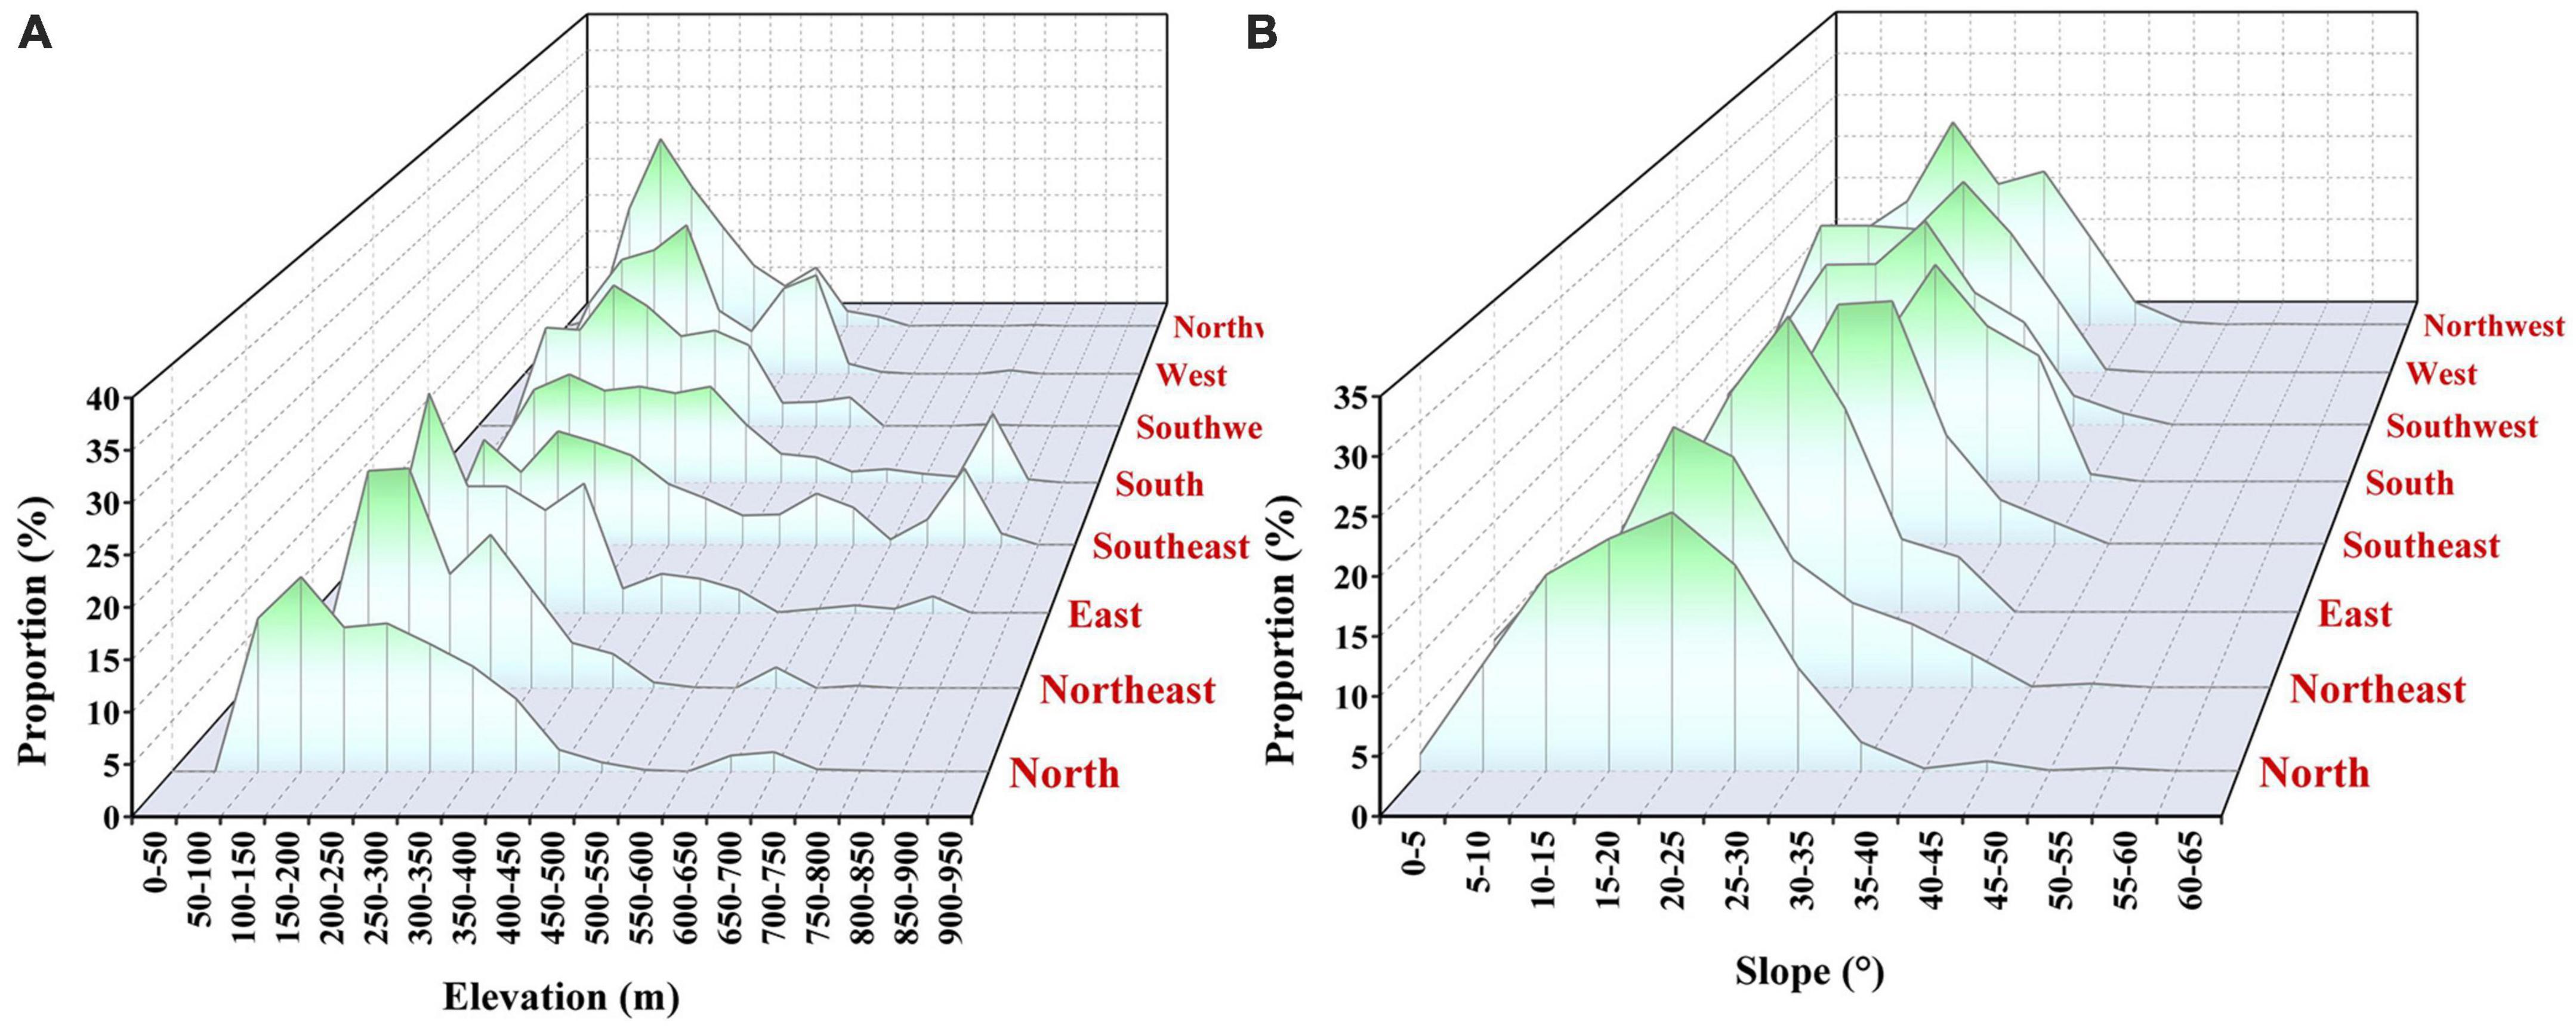
Figure 10. Frequency distribution of boundary line elevation and slope along different slope directions. (A) Elevation proportion at different direction, (B) slope proportion at different direction.
The distribution of boundary lines (see details in Supplementary material B) also correspond to the overall distribution of MBFs, related studies analyzed the changes in spatial patterns of bamboo forests from the perspectives of topographic differentiation, climate, soil, Moso bamboo age, diameter at breast height, and univariate distance (Zhang and Xue, 2018; You et al., 2020; Li et al., 2022; Jin et al., 2023; Zheng and Lv, 2023). The spatial distribution of bamboo forests is mainly reflected in the topography, which is the combined effect of the biological characteristics of bamboo forests and the site conditions (Guan et al., 2012). The boundary lines of on-year and off-year MBFs in this study area were slightly more distributed on the north and southeast slopes than on other slopes (Figure 10), but the elevation on each slope reached 700 m (Figure 10A). The elevation distribution in each direction showed a certain degree of regularity (Figure 10A). The boundary lines on the northeast, east and west slopes were mainly distributed between 150 and 250 m, while those on the west and southwest slopes were mainly distributed between 150 and 250 m. The boundary lines were mainly distributed between 100 and 300 m. In addition, according to the frequency analysis results for the slope of the boundary line among different slopes (Figure 10B), the slope could reach 35°. The slope distribution of the boundary line on the west and east slopes was lower, and the slope distributions of the boundary line on the north, northwest, and northeast slopes were higher. The boundary lines on the north, east, southeast, southwest, and south slopes were mainly distributed at 20–25°, and the boundary lines on the northeast and northwest slopes are mainly distributed at 15–20°.
Spatial heterogeneity is an inherent, pervasive, and critical property of ecosystems that provided critical information and insights in various fields such as ecology, resource management, and urban planning to help better understand and address spatial variability and pattern (Wu et al., 2000; Carey, 2001; Frazer et al., 2005; Zhang et al., 2023). Effective forest resource management required considering the spatial heterogeneity of biomass and growth rates to develop appropriate forestry management plans (Klooster, 2002). Spatial heterogeneity represent spatial complexity and variation of ecosystem characteristics caused by the distribution of forest vegetation (Pickett and Cadenasso, 1995; Beckage and Clark, 2003; Ngao et al., 2012; Assal et al., 2016; Brazhnik and Shugart, 2017). Most studies in bamboo forests focused on the overall distribution of MBFs (including the relationship with biomass) or the spatial effects of neighboring trees. For example, Han analyzed the spatial and temporal heterogeneity of Moso bamboo carbon stocks at different scales (Han et al., 2013). Zheng and Lv (2023) analyzed the spatial distribution of bamboo along the transition gradient and the competition with neighboring trees. This study constructed the IMODI index to quantitatively assess the spatial variation of MBF from the phenological characteristics of on-year and off-year. It showed that the low value of IMODI distributed at the northern townships of Anji, while the high IMODI value mainly distributed at the northwestern townships (Figure 5). Xiaofeng township had the highest spatial variance values, indicating that its distribution areas of on-year and off-year MBFs were similar, which could reduce the concern about the reduction on bamboo forest economy. It is speculated that this phenomenon has some connection with the economic development of XiaoFeng. Studies have shown that regional location characteristics, demographic characteristics and GDP characteristics will also influence the evolution and distribution of Moso bamboo forest landscapes in China (Yu et al., 2023). Xiaofeng is the economic town of Anji, with the largest number of factory enterprises in the county and the second largest bamboo industry in the county.
To better explore the scalability of the index, we added the MODI from Li et al. (2022) for comparison and conducted quantitative analysis at four different scales (township level, 500, 250, and 100 m). It shows that in Figure 11: (1) The variation range of the MODI is larger than that of the IMODI proposed in this study. (2) When the degree of differentiation is low, the differences in the differentiation indices are not significant, showing almost identical trends. (3) When the degree of differentiation is very high, the IMODI can better reflect the level of differences between the AMODI and OMODI. (4) A pixel scale that is too low or too high can lead to a downward trend in the average differentiation level in the region. The present study focused on the physiological characteristics of on and off-year MBFs, however, on and off-year differentiation is an integrated and complex bamboo forest growth factors, which will have direct or indirect complex and far-reaching effects on the on-year and off-year MBFs. And in the future, constructing complex models under the framework of integrated factor research, while expanding the research scale (including temporal and spatial scale), these deserve further analysis and research.
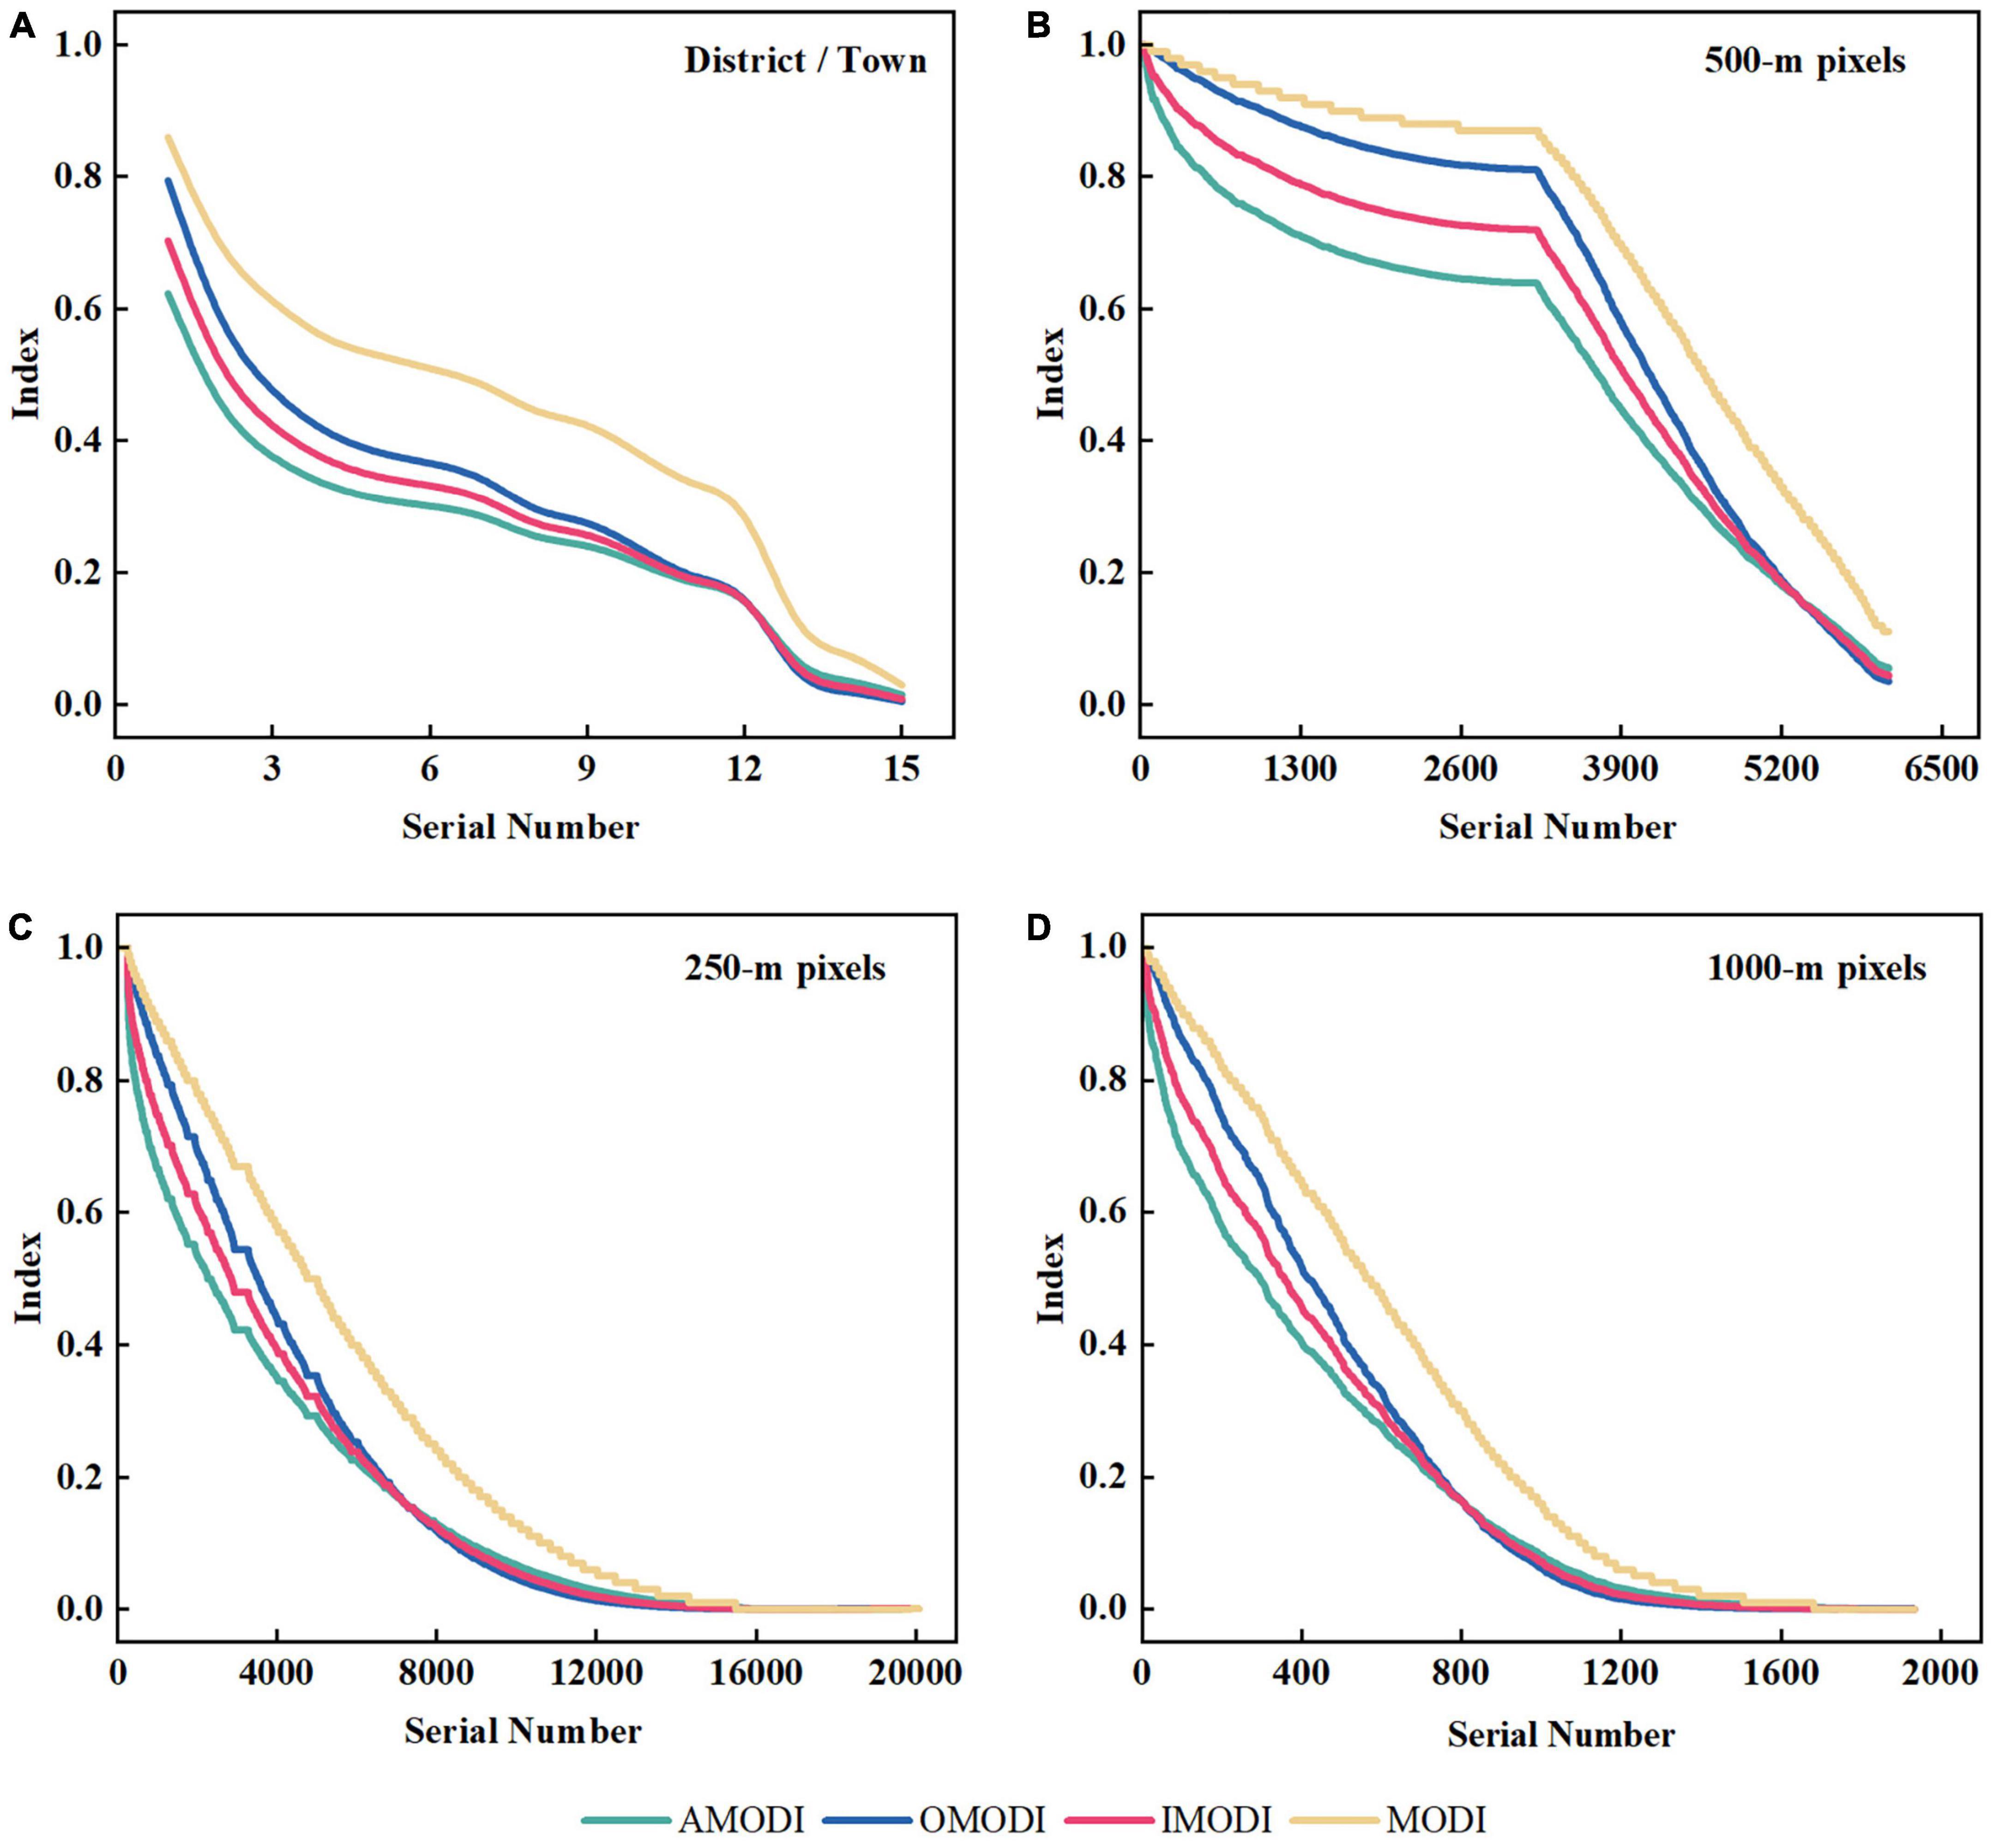
Figure 11. Performance of the four indices at the township scale and 500, 250, and 100 m scales. (A) District/township scale, (B) 500 m scale, (C) 250 m scale, (D) 1000 m scale.
Frequently, socioeconomic forces and biogeographic aspects influence landscape change (Ren et al., 2014; Liang and Liu, 2022). As the economy grows, human disturbances change the stability of the landscape patterns. Water systems, roads, and distances from urban center directly influence the accessibility of forests, which affects the transformation of forest landscapes (Garbarino et al., 2013; Ferrara et al., 2017). Moso bamboo is an important forest resource, and humans are constantly involved in the exploitation of bamboo forests, such as planting, cutting, and digging shoots, establishing bamboo industry factories, and enacting development policies to enhance the ecological and economic benefits of expanding bamboo forests (Li et al., 2019). Benoit analyzed the environmental, infrastructural, and economic development factors driving the expansion of bamboo industry (Benoit et al., 2008). Liu et al. (2020) mentioned that humans have established well-managed and mature bamboo plantations. The expansion of Moso bamboo forests is considered to be of concern and human involvement in controlling the expansion of bamboo forests. Human intervention is the key to explore the regulatory mechanism of Moso bamboo expansion, because human factors such as fertilization under intensive management will strongly influence the success of Moso bamboo expansion, long-term Moso bamboo forests without any management will inhibit the growth of other tree species and are not suitable for new forest establishment (Xu et al., 2020). This study attempts to use impervious surface data to represent the activity scope of humans and assess the quantitative impact of human activity based on the spatial distribution of MBF boundary lines and impervious surface data. In the analysis of the horizontal distance distribution results from the lowest elevation point of the boundary line to the village (Figure 12A), the horizontal distance between the two was mostly within 2 km, mainly distributed in the range of 0–1 km and, to a lesser extent, in the range of 700–800 m. From the scatter plot results of the distribution of relative height differences and horizontal distances (Figure 12B), the results were concentrated in a relative height difference range of 0–200 m and horizontal distance range of 0–1 km, and they were positively correlated.
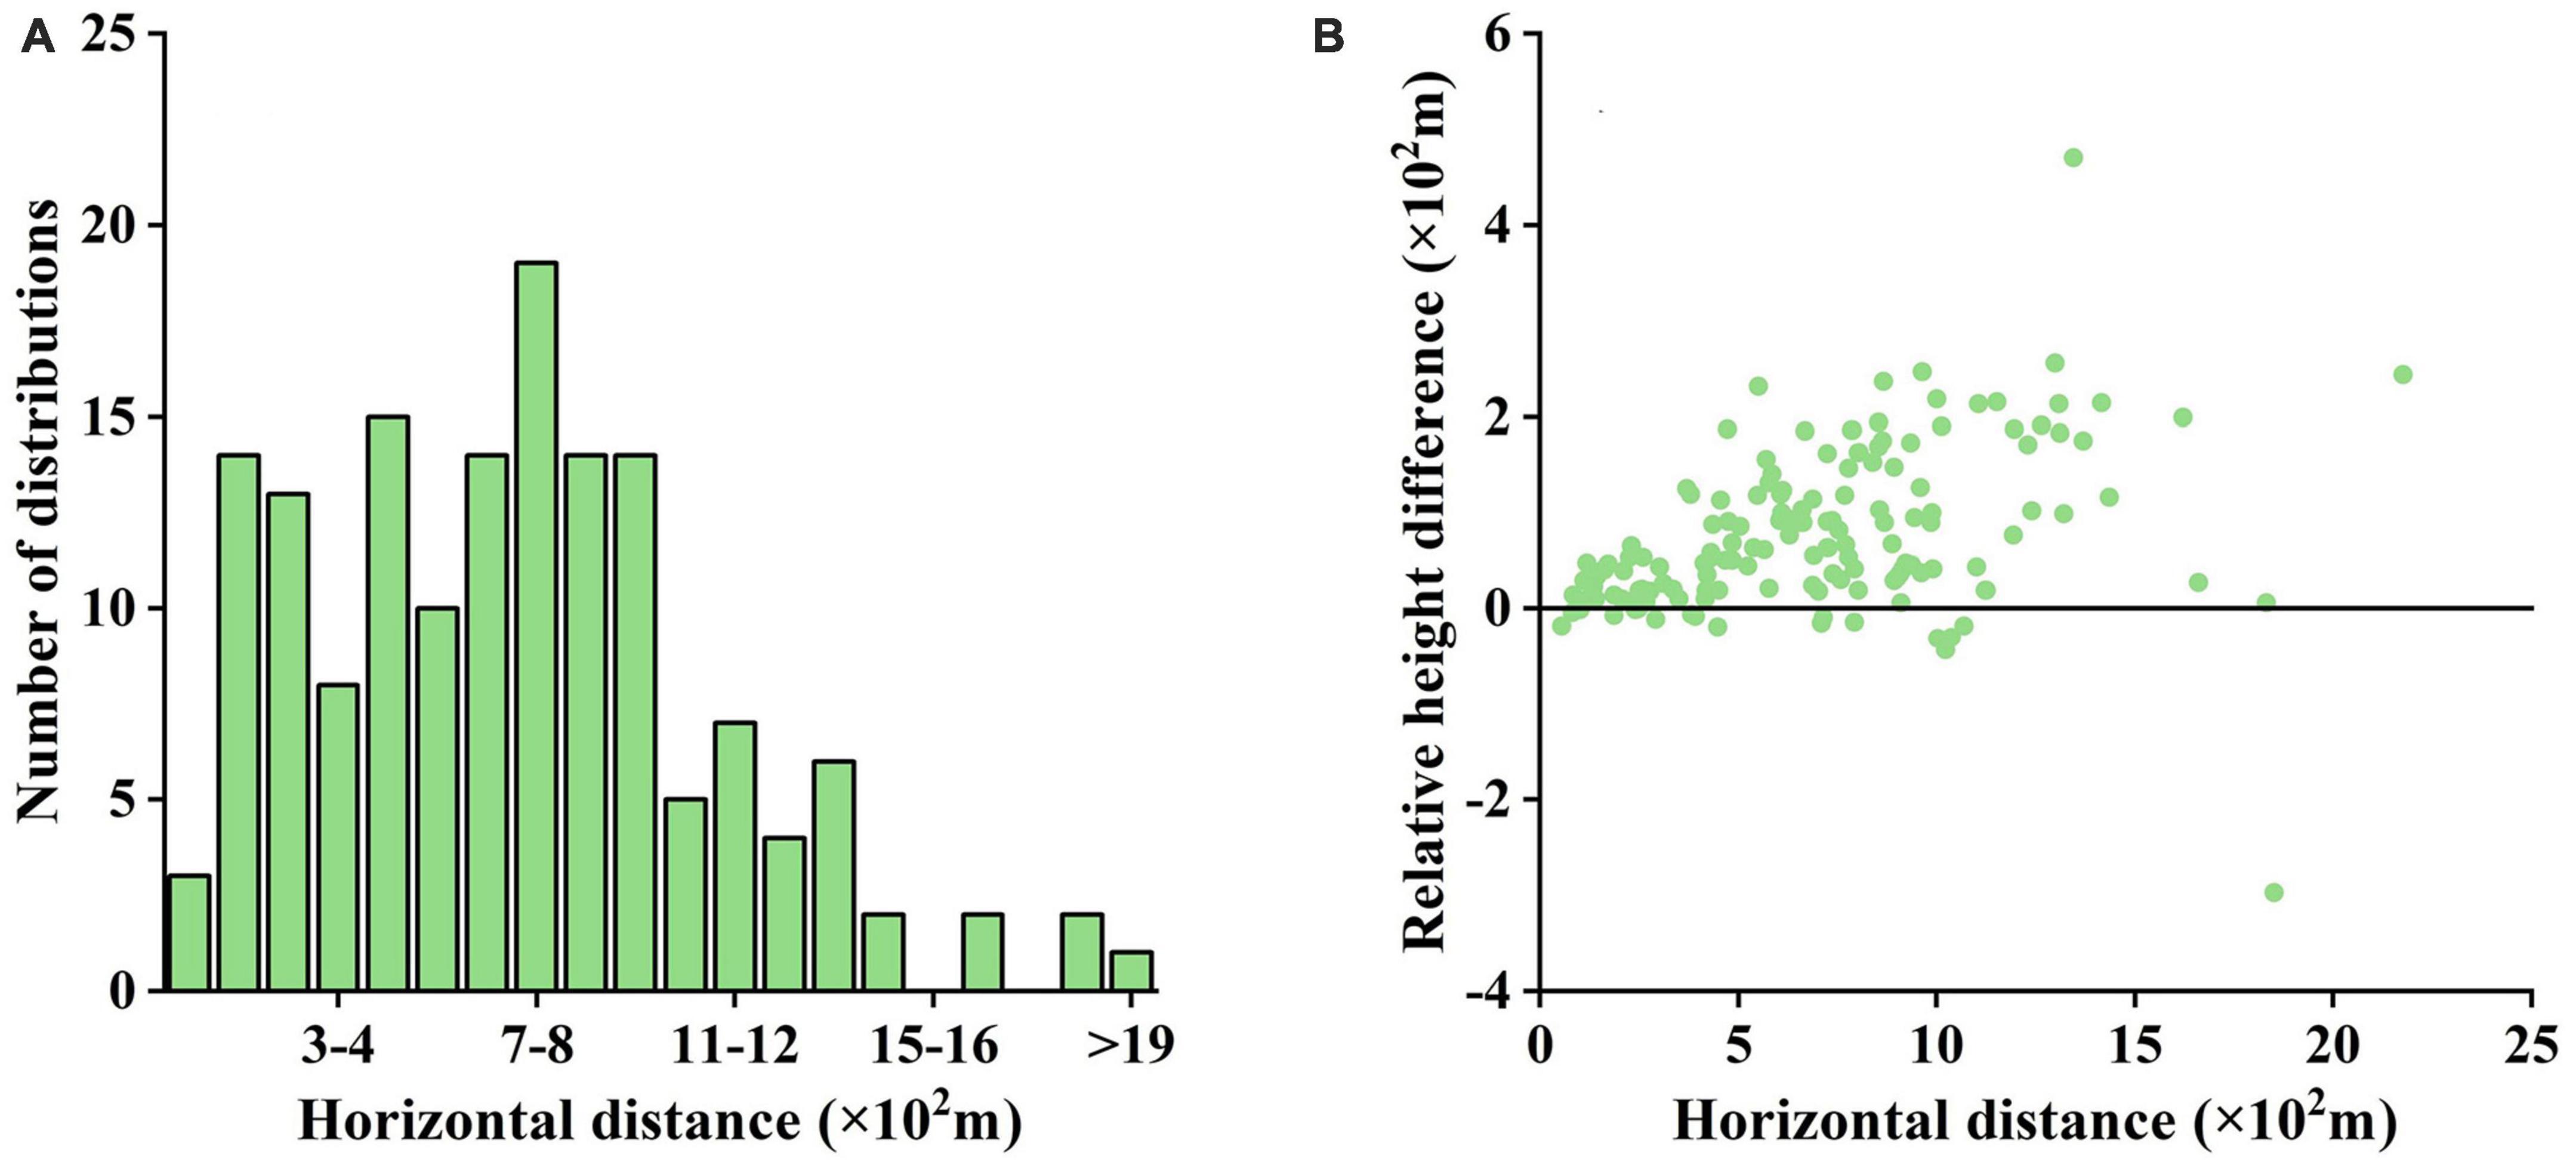
Figure 12. Distance analysis between locations of human activity and on-/off-year boundary lines. (A) Horizontal distance distribution results from the lowest elevation point of the boundary line to the village, (B) the scatter plot of the distribution of relative height differences and horizontal distances.
The above calculation results reflected that the distance does not exist far between the distribution of the boundary lines of on/off-year MBFs and the human settlement, it can be used as one of the bases for the spatial distribution of on and off-year MBFs affected by human activities. To explore the distribution of MBFs landscape from the perspective of human activities, in addition to the distance analysis method in this paper, the relationship between the distribution of MBFs and human activities can also be further analyzed from the perspective of regional economic development, land use change, forest harvesting, and transportation. There are more elements affecting the natural landscape, besides human activities there are also factors such as topography, climate, soil, water source, etc. Topography can respond to the type of substratum and the degree of difference in indexing due to soil differences, climate images are mainly expressed in solar radiation, precipitation, temperature and other conditions, while different vegetation landscapes will be formed under different soils, and MBFs growth will be accompanied by changes in soil nutrients (Xia et al., 2022).
Spatial and temporal on-/off-year phenomena in MBFs play an important role in material accumulation or production and consumption. Combining multisource data and a hierarchy classifier, on-year/off-year MBFs and its boundaries were accurately obtained. Based on the spatial pattern analysis and spatial heterogeneity analysis, the following conclusions were drawn: (1) Under the interaction of human activities and nature evolution, on-year and off-year MBFs boundaries showed obvious spatial patterns and spatial differentiation. (2) The on-year and off-year exploration provide a new perspective to understand landscape of MBFs and the integrated management of carbon sequestration and sinks. (3) High intensity of human management in this study area cause the variability of on-year and off-year, it is need to fully consider local management policies and phenological differences in other region, to better quantify the on-year and off-year phenomenon.
The original contributions presented in this study are included in this article/Supplementary material, further inquiries can be directed to the corresponding author.
LL and HZ contributed to the conception and design of the study and organized the database. HZ, TW, and LW performed the statistical analysis. HZ wrote the first draft of the manuscript. LL, HZ, TW, LW, and NL wrote sections of the manuscript. All authors contributed to manuscript revision, read, and approved the submitted version.
This study was financially supported by the National Natural Science Foundation of China (Grant No. 42101387), the Anhui Provincial Natural Science Foundation (Grant No. 2108085QD155), the Chuzhou University Research and Development Fund for the Talent Startup Project (ID Nos. 2020qd45 and 2022XJZD08), the Anhui Province Key Laboratory of Physical Geographic Environment (ID No. 2022PGE004), and the National College Student Innovation and Entrepreneurship Training Program (ID No. 202210377001).
The authors declare that the research was conducted in the absence of any commercial or financial relationships that could be construed as a potential conflict of interest.
All claims expressed in this article are solely those of the authors and do not necessarily represent those of their affiliated organizations, or those of the publisher, the editors and the reviewers. Any product that may be evaluated in this article, or claim that may be made by its manufacturer, is not guaranteed or endorsed by the publisher.
The Supplementary Material for this article can be found online at: https://www.frontiersin.org/articles/10.3389/ffgc.2023.1204329/full#supplementary-material
Anji Forestry Bureau (2018). Anji county forestry resources survey results report. Anji: Anji Forestry Bureau.
Assal, T. J., Anderson, P. J., and Sibold, J. (2016). Spatial and temporal trends of drought effects in a heterogeneous semi-arid forest ecosystem. For. Ecol. Manag. 365, 137–151. doi: 10.1016/j.foreco.2016.01.017
Beckage, B., and Clark, J. S. (2003). Seedling survival and growth of three forest tree species: The role of spatial heterogeneity. Ecology 84, 1849–1861. doi: 10.1890/0012-9658(2003)084[1849:SSAGOT]2.0.CO;2
Benoit, M., Liu, H., Brian, B., Fu, M. Y., and Yang, X. S. (2008). Spatial patterns and processes of bamboo expansion in Southern China. Appl. Geogr. 28, 16–31. doi: 10.1016/j.apgeog.2007.07.012
Brazhnik, K., and Shugart, H. (2017). Model sensitivity to spatial resolution and explicit light representation for simulation of boreal forests in complex terrain. Ecol. Model. 352, 90–107. doi: 10.1016/j.ecolmodel.2017.02.026
Carey, A. B. (2001). Experimental manipulation of spatial heterogeneity in douglas-fir forests: Effects on squirrels. For. Ecol. Manag. 152, 13–30. doi: 10.1016/S0378-1127(00)00613-7
Chen, S., Jiang, H., Cai, Z. J., Zhou, X. L., and Peng, C. H. (2018). The response of the net primary production of moso bamboo forest to the On and Off-year management: A case study in Anji County, Zhejiang, China. For. Ecol. Manag. 409, 1–7. doi: 10.1016/j.foreco.2017.11.008
Chen, X. A. (2010). Discussion on the growth regulation of on-year and off-year moso bamboo. Cent. South Forest Invent. Plan. 29, 21–23.
Chen, Y. Y., Li, L. W., Lu, D. S., and Li, D. Q. (2019). Exploring bamboo forest aboveground biomass estimation using Sentinel-2 data. Remote Sens. 11:7. doi: 10.3390/rs11010007
Cui, L., Du, H. Q., Zhou, G. M., Li, X. J., Mao, F. J., Xu, X. J., et al. (2019). Combination of decision tree and linear spectral unmixing for extracting bamboo forest information in China. J. Remote Sens. 23, 166–176. doi: 10.11834/jrs.20187155
Du, H. Q., Mao, F. J., Zhou, G. M., Li, X. J., Xu, X. J., Ge, H. L., et al. (2018). Estimating and analyzing the spatiotemporal pattern of aboveground carbon in bamboo forest by combining remote sensing data and improved BIOME-BGC model. IEEE J. Sel. Top. Appl. Earth Obs. Rem. Sens. 11, 2282–2295. doi: 10.1109/JSTARS.2018.2817344
Fang, W., Gui, R. Y., Ma, L. F., Jin, A. W., Lin, X. C., Yu, X. J., et al. (2015). China economic bamboo. Beijing: Science Press.
Feng, X. L., Tan, S., Dong, Y., Zhang, X., Xu, J. M., Zhong, L. H., et al. (2023). Mapping large-scale bamboo forest based on phenology and morphology features. Remote Sens. 15:515. doi: 10.3390/rs15020515
Ferrara, C., Carlucci, M., Grigoriadis, E., Corona, P., and Salvati, L. (2017). A comprehensive insight into the geography of forest cover in Italy: Exploring the importance of socioeconomic local contexts. For. Policy Econ. 75, 12–22. doi: 10.1016/j.forpol.2016.11.008
Foody, G. M. (2002). Status of land cover classification accuracy assessment. Remote Sens. Environ. 80, 185–201. doi: 10.1016/S0034-4257(01)00295-4
Frazer, G. W., Wulder, M. A., and Niemann, K. O. (2005). Simulation and quantification of the finescale spatial pattern and heterogeneity of forest canopy structure: A lacunarity-based method designed for analysis of continuous canopy heights. For. Ecol. Manag. 214, 65–90. doi: 10.1016/j.foreco.2005.03.056
Garbarino, M., Lingua, E., Weisberg, P. J., Bottero, A., Meloni, F., and Motta, R. (2013). Land-use history and topographic gradients as driving factors of subalpine Larix decidua forests. Landsc. Ecol. 28, 805–817. doi: 10.1007/s10980-012-9792-6
Guan, F. Y., Fan, S. H., and Xiao, F. M. (2012). Rasearch on the distribution of bamboo and dynamics change of terrain in North Fujian. Remote Sens. Technol. Appl. 27, 623–628.
Guan, F. Y., Fan, S. H., Gao, Y. F., Xiao, F. M., and Cai, H. L. (2013). Different classification methods in the application of remote sensing information identification of bamboo. Chin. Agric. Sci. Bull. 29, 47–52.
Han, N., Du, H. Q., Zhou, G. M., Sun, X. Y., Ge, H. L., and Xu, X. J. (2014). Object-based classification using SPOT-5 imagery for moso bamboo forest mapping. Int. J. Rem. Sens. 35, 1126–1142. doi: 10.1080/01431161.2013.875634
Han, N., Du, H., Zhou, G., Xu, X., Cui, R., and Gu, C. (2013). Spatiotemporal heterogeneity of moso bamboo aboveground carbon storage with landsat thematic mapper images: A case study from Anji County China. Int. J. Rem. Sens. 34, 4917–4932. doi: 10.1080/01431161.2013.782115
Huang, B. H., Zhu, J. Q., Mei, W. Y., and Cai, R. Q. (1980). Exploration of the causes of the formation of on off year moso bamboo. Zhejiang For. Sci. Technol. 2, 14–18.
Huang, X. Y., Zhang, Q., Hu, L., Zhu, T. T., Zhou, X., Zhang, Y. W., et al. (2022). Monitoring damage caused by pantana phyllostachysae Chao to moso Bamboo Forests Using Sentinel-1 and Sentinel-2 Images. Remote Sens. 14:5012. doi: 10.3390/rs14195012
Huang, X., Li, J. Y., Yang, J., Zhang, Z., Li, D. R., and Liu, X. (2021). 30 m global impervious surface area dynamics and urban expansion pattern observed by Landsat satellites: From 1972 to 2019. Sci. China Earth Sci. 64, 1922–1933. doi: 10.1007/s11430-020-9797-9
Huang, Z. Y., Zhong, Z. K., Zhang, X. P., Bian, F. Y., Gai, X., and Li, Q. L. (2021). Formation mechanism and regulation measures of on-year and off-year of moso bamboo forest: A review. Wor. For. Res. 34, 20–25.
Ji, J. Y., Li, X. J., Du, H. Q., Mao, F. J., Fan, W. L., Xu, Y. X., et al. (2021). Multiscale leaf area index assimilation for moso bamboo forest based on Sentinel-2 and MODIS data. Int. J. Appl. Earth. Obs. 104:102519. doi: 10.1016/j.jag.2021.102519
Jin, W. H., Tu, J. Y., Wu, Q. F., Peng, L. Y., Xing, J. J., Liang, C. F., et al. (2023). Moso bamboo expansion decreased soil heterotrophic respiration but increased arbuscular mycorrhizal mycelial respiration in a subtropical broadleaved forest. For. Ecol. Manag. 10:100116. doi: 10.1016/j.fecs.2023.100116
Klooster, D. J. (2002). Toward adaptive community forest management: Integrating local forest knowledge with scientific forestry. Econ. Geogr. 78, 43–70. doi: 10.2307/4140823
Li, L. W., Li, N., Lu, D. S., and Chen, Y. Y. (2019). Mapping moso bamboo forest and its on-year and off-year distribution in a subtropical region using time-series Sentinel-2 and Landsat 8 data. Remote Sens. Environ. 231:111265. doi: 10.1016/j.rse.2019.111265
Li, L. W., Li, N., Zang, Z., Lu, D. S., Wang, G. X., and Wang, N. (2020). Examining phenological variation of on-year and off-year bamboo forests based on VENμS time series data. Int. J. Rem. Sens. 42, 2203–2219. doi: 10.1080/01431161.2020.1851802
Li, L. W., Wu, T. Z., Zhu, H. Z., Zhang, W., Gong, Y., Yang, C. C., et al. (2022). Characterizing the spatial patterns of on- and off-year moso bamboo forests with multisource data in Southeast China. Remote Sens. Appl. 27:100781. doi: 10.1016/j.rsase.2022.100781
Li, M. N., Li, C. C., Jiang, H., Fang, C. Y., Yang, J., Zhu, Z. L., et al. (2016). Tracking bamboo dynamics in Zhejiang, China, using time-series of Landsat data from 1990 to 2014. Int. J. Rem. Sens. 37, 1714–1729. doi: 10.1080/01431161.2016.1165885
Liang, G. F., and Liu, J. Z. (2022). Integrated geographical environment factors explaining forest landscape changes in Luoning County in the middle reaches of the Yiluo River watershed, China. Ecol. Indic. 139:108928. doi: 10.1016/j.ecolind.2022.108928
Linderman, M., Liu, J., Qi, J., An, L., Ou-Yang, Z., Yang, J., et al. (2010). Using artificial neural networks to map the spatial distribution of understorey bamboo from remote sensing data. Int. J. Remote Sens. 25, 1685–1700. doi: 10.1080/01431160310001598971
Liu, C., Xiong, T. W., Gong, P., and Qi, S. H. (2018). Improving large-scale moso bamboo mapping based on dense Landsat time series and auxiliary data: A case study in Fujian Province, China. Remote Sens. Lett. 9, 1–10. doi: 10.1080/2150704X.2017.1378454
Liu, M. X., Liu, J. H., Atzberger, C., Jiang, Y., Ma, M. F., and Wang, X. M. (2021). Zanthoxylum bungeanum maxim mapping with multi-temporal Sentinel-2 images: The importance of different features and consistency of results. ISPRS J. Photogramm. Remote Sens. 174, 68–86. doi: 10.1016/j.isprsjprs.2021.02.003
Liu, Y. Y., Wu, P. F., Liu, J., Han, X. L., and Yang, Y. Q. (2020). Surface elevation data evaluation in Hilly areas based on oblique photography by Unmanned aerial vehicle (UAV). Water Power 46, 22–26.
Lv, Y., Han, N., and Du, H. Q. (2023). Estimation of bamboo forest aboveground carbon using the RGLM model based on object-based multiscale segmentation of SPOT-6 imagery. Remote Sens. 15:2566. doi: 10.3390/rs15102566
Ngao, J., Epron, D., Delpierre, N., Bréda, N., Granier, A., and Longdoz, B. (2012). Spatial variability of soil CO2 efflux linked to soil parameters and ecosystem characteristics in a temperate beech forest. Agric. For. Meteorol. 154, 136–146. doi: 10.1016/j.agrformet.2011.11.003
Noble, A. E., Rosenstock, T. S., Brown, P. H., Machta, J., and Hastings, A. (2018). Spatial patterns of tree yield explained by endogenous forces through a correspondence between the ising model and ecology. Proc. Natl. Acad. Sci. U.S.A. 115, 1825–1830. doi: 10.1073/pnas.1618887115
Pickett, S. T., and Cadenasso, M. L. (1995). Landscape ecology: Spatial heterogeneity in ecological systems. Science 269, 331–334. doi: 10.1126/science.269.5222.331
Qi, S. H., Song, B., Liu, C., Gong, P., Luo, J., Zhang, M. N., et al. (2022). Bamboo forest mapping in China using the dense Landsat 8 Image archive and google earth engine. Remote Sens. 14:762. doi: 10.3390/rs14030762
Ren, Y., Deng, L. Y., Zuo, S. D., Luo, Y. J., Shao, G. F., Wei, X. H., et al. (2014). Geographical modeling of spatial interaction between human activity and forest connectivity in an urban landscape of southeast China. Landsc. Ecol. 29, 1741–1758. doi: 10.1007/s10980-014-0094-z
Shalom, L., Samuels, S., Zur, N., Shlizerman, L., Zemach, H., Weissberg, M., et al. (2012). Alternate bearing in citrus: Changes in the expression of flowering control genes and in global gene expression in on- versus off-crop trees. PLoS One 7:e46930. doi: 10.1371/journal.pone.0046930
Shi, M., Zhang, J. B., Sun, J. L., Li, Q., Lin, X. C., and Song, X. Z. (2022). Unequal nitrogen translocation pattern caused by clonal integration between connected ramets ensures necessary nitrogen supply for young Moso bamboo growth. Environ. Exp. Bot. 200:104900. doi: 10.1016/j.envexpbot.2022.104900
Wu, J. G., Jelinski, D. E., Luck, M., and Tueller, P. T. (2000). Multiscale analysis of landscape heterogeneity: Scale variance and pattern metrics. Geogr. Inf. Sci. 6, 6–19. doi: 10.1080/10824000009480529
Xia, E. L., Nong, J. Q., Wei, S. P., Liu, X. Z., and Liu, G. L. (2022). Changes in soil nutrient characteristics in moso bamboo forest expanding into broadleaved forest. Ecol. Environ. Sci. 31, 1110–1117.
Xiang, S. Y., Xu, Z. H., Shen, W. L., Chen, L. Y., Hao, Z. B., Wang, L., et al. (2023). Mapping of bamboo forest bright and shadow areas using optical and SAR satellite data in Google Earth Engine. Geocarto Int. 38:2203105. doi: 10.1080/10106049.2023.2203105
Xu, Q. F., Liang, C. F., Chen, J. H., Li, Y. C., Qin, H., and Fuhrmann, J. J. (2020). Rapid bamboo inva-sion (expansion) and its effects on biodiversity and soilprocesses. Glob. Ecol. Conserv. 21:e00787. doi: 10.1016/j.gecco.2019.e00787
Xu, Y., Liu, F. Q., and Hu, H. Y. (2013). Reasons and technical measures for on off year bamboo forests to flourish and not decline. Shanghai Agric. Sci. Technol. 336, 95–96.
Yang, Z. Q., Dong, J. W., Kou, W. L., Qin, Y. W., and Xiao, X. M. (2021). Mapping panax notoginseng plantations by using an integrated Pixel- and object-based (IPOB) approach and ZY-3 imagery. Remote Sens. 13:2184. doi: 10.3390/rs13112184
Yao, X. S., Lin, J. Z., Lin, B., Cao, L. Q., Su, L. L., Xiong, J. J., et al. (2015). The growth differences of bamboo forests in on off-year. Hunan For. Sci. Technol. 42, 111–118.
Ying, W., Jin, J. X., Jiang, H., Zhang, X. Y., Lu, X. H., Chen, X. F., et al. (2016). Satellite-based detection of bamboo expansion over the past 30 years in Mount Tianmushan, China. Int. J. Rem. Sens. 37, 2908–2922. doi: 10.1080/01431161.2016.1186851
You, S. X., Zheng, Q. M., Lin, Y., Zhu, C. M., Li, C. L., Deng, J. S., et al. (2020). Specific bamboo forest extraction and long-term dynamics as revealed by landsat time series stacks and google earth engine. Remote Sens. 12:3095. doi: 10.3390/rs12183095
Yu, L. S., Wei, J., Li, D. L., Zhong, Y. D., and Zhang, Z. H. (2023). Explaining landscape levels and drivers of Chinese moso bamboo forests based on the PLUS model. Forests. 14:397. doi: 10.3390/f14020397
Yuen, J. Q., Fung, T., and Ziegler, A. D. (2017). Carbon stocks in bamboo ecosystems worldwide: Estimates and uncertainties. For. Ecol. Manag. 393, 113–138. doi: 10.1016/j.foreco.2017.01.017
Zhang, D. Z. (2016). On off-year moso bamboo forest transformation test. J. Fujian For. Sci. Technol. 43, 65–67+76.
Zhang, H. N., and Xue, J. H. (2018). Spatial pattern and competitive relationships of moso bamboo in a native subtropical rainforest community. Forests 9:774. doi: 10.3390/f9120774
Zhang, M. N., Gong, P., Qi, S. H., Liu, C., and Xiong, T. W. (2019). Mapping bamboo with regional phenological characteristics derived from dense Landsat time series using google earth engine. Int. J. Rem. Sens. 40, 9541–9555. doi: 10.1080/01431161.2019.1633702
Zhang, X. L., Chen, G. Q., Liu, C. X., Fan, Q. L., Li, W. F., Wu, Y., et al. (2023). Spatial effects analysis on individual-tree aboveground biomass in a tropical Pinus kesiya var. langbianensis natural forest in Yunnan. Southwestern China. Forests 14:1177. doi: 10.3390/f14061177
Zhao, Y. Y., Feng, D., Jayaraman, D., Belay, D., Sebrala, H., Nguai, J., et al. (2018). Bamboo mapping of Ethiopia, Kenya and Uganda for the year 2016 using multi-temporal Landsat imagery. Int. J. Appl. Earth Obs. Geoinf. 66, 116–125. doi: 10.1016/j.jag.2017.11.008
Zheng, A. Y., and Lv, J. H. (2023). Spatial patterns of bamboo expansion across scales: How does moso bamboo interact with competing trees? Landsc Ecol. doi: 10.1007/s10980-023-01669-z
Zheng, M. Z., Lin, X. S., and Feng, C. Y. (1996). Comparison test on bamboo shoot and Timbe yield of On off-year and constant management. J. Bamboo Res. 2, 39–46.
Zheng, Y. X., Fan, S. H., Guan, F. Y., Xia, W., Wang, S. M., and Xiao, X. (2022). Strip clearcutting drives vegetation diversity and composition in the moso bamboo forests. For. Sci. 68, 27–36. doi: 10.1093/forsci/fxab044
Keywords: Moso bamboo forests, on-year and off-year phenomenon, human activities, landscape, remote sensing
Citation: Li L, Zhu H, Wu T, Wei L and Li N (2023) New landscape-perspective exploration of Moso bamboo forests under on/off-year phenomena and human activities. Front. For. Glob. Change 6:1204329. doi: 10.3389/ffgc.2023.1204329
Received: 12 April 2023; Accepted: 10 July 2023;
Published: 26 July 2023.
Edited by:
Upama Ashish Koju, Kathmandu Forestry College, NepalReviewed by:
Til Prasad Pangali Sharma, Nepal Open University, NepalCopyright © 2023 Li, Zhu, Wu, Wei and Li. This is an open-access article distributed under the terms of the Creative Commons Attribution License (CC BY). The use, distribution or reproduction in other forums is permitted, provided the original author(s) and the copyright owner(s) are credited and that the original publication in this journal is cited, in accordance with accepted academic practice. No use, distribution or reproduction is permitted which does not comply with these terms.
*Correspondence: Nan Li, bGluYW5AY2h6dS5lZHUuY24=
†These authors have contributed equally to this work and share first authorship
Disclaimer: All claims expressed in this article are solely those of the authors and do not necessarily represent those of their affiliated organizations, or those of the publisher, the editors and the reviewers. Any product that may be evaluated in this article or claim that may be made by its manufacturer is not guaranteed or endorsed by the publisher.
Research integrity at Frontiers
Learn more about the work of our research integrity team to safeguard the quality of each article we publish.