
95% of researchers rate our articles as excellent or good
Learn more about the work of our research integrity team to safeguard the quality of each article we publish.
Find out more
ORIGINAL RESEARCH article
Front. For. Glob. Change , 01 June 2023
Sec. Forest Growth
Volume 6 - 2023 | https://doi.org/10.3389/ffgc.2023.1203626
This article is part of the Research Topic Forest Phenomics: How Does Developing Sensor Technology Improve the Growth of Forest Plantations? View all 5 articles
 Teng Long1,2,3,4,5†
 XiaoLiang Che1,6†
 Wenbin Guo6Yubin Lan2,3,4,5
 Ziran Xie2,3,4Wentao Liu2,3,4Jinsheng Lv2,3,4Yongbing Long2,3,4,5*Tianyi Liu1*Jing Zhao1,2,3,4,5*
Introduction: Pinus elliottii × P. caribaea is one of the major tree species in commercial forest bases in developed countries. However, in the process of sapling cultivation, nutrients cannot be accurately detected and supplied to individual saplings, resulting in reduced yield and quality.
Methods: In this paper, visible-near-infrared (Vis-NIR) hyperspectral imaging (HSI) combined with ensemble learning (EL) was used to solve this problem. The content and distribution of nitrogen (N), phosphorus (P), and potassium (K) in the canopy needles of Pinus elliottii × P. caribaea saplings were obtained through HSI data analysis, and the nutritional needs of individual plants were reflected to provide a basis for nutritional supply decisions. The saplings were treated with deficient, sufficient, and excessive N, P, and K single-element fertilizers. After collecting the Vis-NIR hyperspectral images of these saplings, a variety of pre-processing, feature selection, and ensemble learning algorithms were used to establish predictive models. The R2 and RMSE were used to evaluate the performance of the prediction models.
Results: The results showed that the multiple scattering correction-competitive adaptive reweighted sampling-Stacking (MSC-CARS-Stacking) model had the best results among the three nutrient elements prediction models (Rp2-N = 0.833, RMSEP = 0.380; Rp2-P = 0.622, RMSEP = 0.101; Rp2-K = 0.697, RMSEP = 0.523). When studying the sensitive bands of N, P, and K, we found that the common characteristic wavelengths were 675.3 and 923.9 nm, while the non-common characteristic wavelengths were located at 550 nm (green peak), 680 nm (red valley), and 960 nm (water peak). In studying the generalization ability of the model, only the nitrogen group data were used to train the MSC-CARS-Stacking model for nitrogen prediction, which was then used to predict the nitrogen content in the phosphorus and potassium groups, obtaining good results (Rc2-N = 0.841, Rp2-P = 0.814, Rp2-K = 0.801). It showed a strong generalization ability for the prediction of nitrogen, and similarly, phosphorus and potassium.
Discussion: In conclusion, this study verifies that the Vis-NIR HSI combined with EL is indeed a reliable and stable method to predict the contents of N, P, and K in the needles of Pinus elliottii × P. caribaea sapling canopy.
Pinus elliottii × P. caribaea is a hybrid progeny of P. elliottii var. elliottii and P. caribaea. It has the advantages of strong stress resistance, rapid growth, and high economic benefits (Yang et al., 2015; William et al., 2019, 2020). Nitrogen (N), phosphorus (P), and potassium (K) are the three essential nutritive elements for P. elliottii × P. caribaea saplings and play an important role in maintaining sapling growth status and improving plant growth (Liu et al., 2006; Dong et al., 2010; Wang et al., 2013; Yuan et al., 2015). Due to the high demand for these three elements in saplings and the limited nutrients provided by the soil, additional fertilizers are often applied to saplings (Gökkaya et al., 2015). However, excessive fertilization leads to sapling burning and environmental pollution, and insufficient fertilization leads to yield reduction. Therefore, it is vital to master the nutrient content in the sapling accurately and apply fertilizer to the sapling precisely. The traditional chemical determination technique is destructive to the sample, with low observation continuity, high instrument and reagent costs, and time-consuming and labor-intensive, thus it is difficult to promote in actual large-scale forestry production (Liu et al., 2020; Huang et al., 2021). In this paper, Visible near-infrared (Vis-NIR) hyperspectral imaging (HSI) was used for nutritive elements detection.
Visible near-infrared HSI is a technique developed in recent years and has received increasing attention in forestry due to its rapid and accurate non-destructive detection of plants. It integrates images and spectral information into a hyper-cube. Without pre-processing the sample, we can collect the full-band spectrum and image of the object, and at the same time obtain detailed information such as quantitative data and spatial distribution of the chemical composition of the sample (Zhang et al., 2013; Heo et al., 2021). Currently, hyperspectral imaging-based nutritional diagnosis technology has been applied to analyze the content of large and trace elements in different plants, including some important woody plants such as lychee, tea, fir, Norway spruce, slash pine, and loblolly pine (Ferwerda and Skidmore, 2007; Schlerf et al., 2010; Bian et al., 2013; Masaitis et al., 2013; Chen et al., 2018; Li et al., 2018, 2022; Vanguelova and Pitman, 2019; Sanaeifar et al., 2020; Wan et al., 2020; Wang et al., 2020). Studies have shown that there is a relationship between the spectral characteristics of leaves and their physiological status and that the content of various biochemical components in leaves can be predicted by measuring the spectral reflectance of canopy leaves, which can be used as the basis for plant nutrition diagnosis (Liang et al., 2010). Therefore, this paper proposed that the spectral reflectance of sapling canopy leaves can be measured to predict the nutrient composition of the sapling canopy, and then the nutritional status of the whole sapling can be assessed.
However, due to the inclination angle of saplings’ canopy needles, the top and bottom of the same needles vary greatly, which will affect the accuracy of the prediction model. To address this problem, the following measures were used. In the aspect of data collection, small depth-of-field and canopy focus techniques were adopted to ensure clear and reliable canopy needle leaf images; For image processing, the methods of threshold segmentation and cluster segmentation were used to select clear areas of needle leaf imaging; In terms of spectral pre-processing, normalization, multivariate scattering correction (MSC), and differentiation (D1) algorithms were used to eliminate the influence of large sample spectral differences caused by inconsistent image brightness and darkness. High-quality data were obtained in vivo for nutrition level classification via these methods.
The ensemble learning approach was used to further exploit the spectral information of canopy needles. This method combines multiple existing individual learners through a certain strategy to build a new learner, and takes the mean or weighted mean of the prediction results of multiple base learners as the final prediction result, which has better generalization ability than a single basic learner (Cheng et al., 2021). Among EL methods, the Stacking ensemble learning strategy is a technique used to assemble heterogeneous learners, which has higher accuracy, robustness, and overall induction ability than assembling homogeneous learners. It has shown good predictive ability in research such as retrieval of chlorophyll content in mangrove canopy leaves (Zhen et al., 2022), detection of nitrogen in rice canopy leaves (Zhang et al., 2022), etc. Given the strong feature learning ability of the Stacking ensemble learning strategy, it is expected to achieve the prediction of N, P, and K content in the canopy needles of P. elliottii × P. caribaea saplings by combining ensembling learning strategy with hyperspectral imaging technology.
The purpose of this study was to explore the potential of Vis-NIR hyperspectral imaging for the detection of N, P, and K contents in canopy needles of P. elliottii × P. caribaea saplings. To this end, the specific objectives were to (1) extract the characteristic wavelengths of N, P, and K by using competitive adaptive reweighted sampling (CARS), successive projections Algorithm (SPA), principal component analysis weight (PCA_Weight), and principal component analysis (PCA); (2) establish prediction models for the N, P, and K content in the canopy needles of P. elliottii × P. caribaea saplings using random forests (RF), gradient boosting decision tree (GBDT), and Stacking, and evaluate the accuracy and generalization ability of the models; (3) map the visualization distribution map of N, P, and K content in the canopy needles of P. elliottii × P. caribaea saplings based on the MSC-CARS-Stacking prediction model, and analyze the distribution characteristics of N, P, and K content.
The canopy needles of 1 year-old P. elliottii × P. caribaea cuttings were taken as the research object in this study. The experimental site was located at Hongling Seed Garden Nursery, Taishan, Guangdong, China (22.164769°N, 112.822761°E) (Figure 1). A total of 360 saplings were selected by experts and planted in potted plants in April 2020, with a soil matrix consisting of loess and light matrix (6:4), 16 cm high. After 11 months, three different levels of urea, superphosphate, and potassium chloride were applied to the soil matrix of the saplings twice every 15 days. The effective components of corresponding fertilizers were calculated by molecular formula (Table 1). Among the three levels, level 2 (N2, P2, K2) was the sufficient fertilization level. Each of the three single-element fertilizers was applied in groups of three different levels, plus the control group, for a total of 10 groups. The sequence of test samples was designed by the Random Complete Block method. The experimental site was divided into three blocks, and each block was divided into 10 plots. Each treatment was treated once in each block (complete block) (1−10), the ranking order within each block is randomized (randomization). 278 saplings survived after 1 year of cultivation. Hyperspectral images of the saplings’ canopy needles and samples required for chemical determination of N, P, and K content were collected. In this paper, the groups treated with nitrogen fertilizer, phosphorus fertilizer, and potassium fertilizer were referred to as the N group, P group, and K group, respectively.
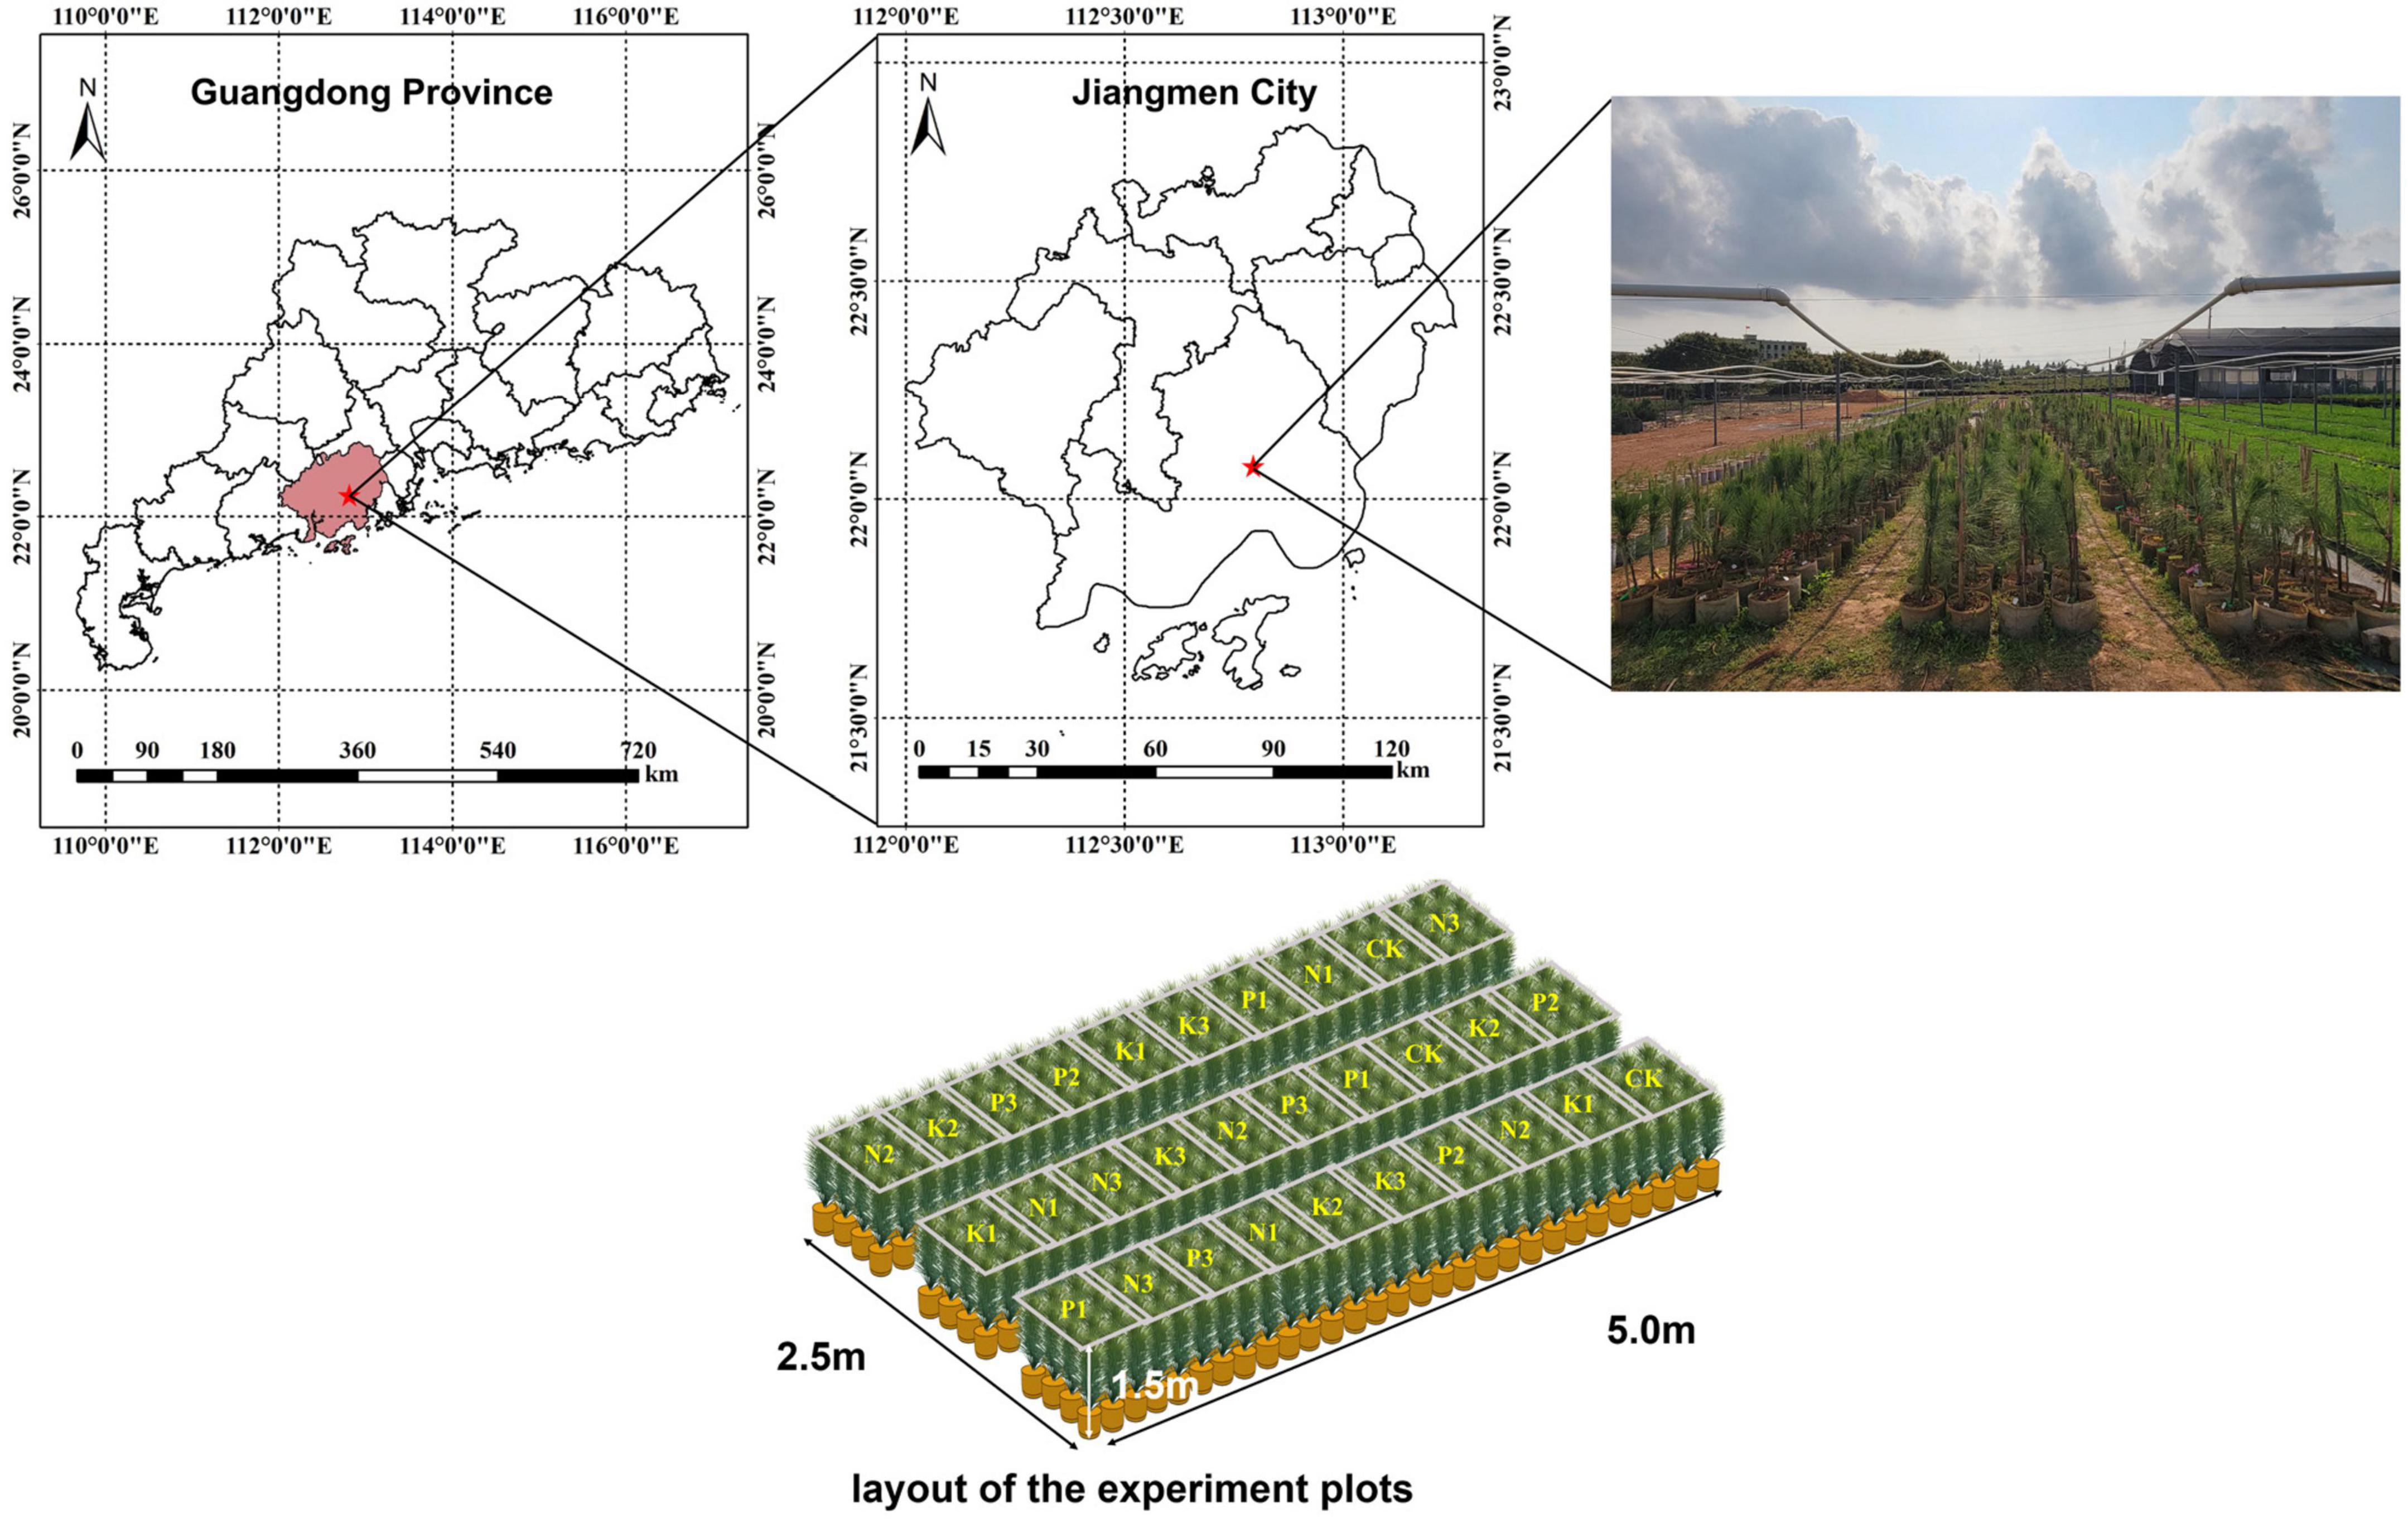
Figure 1. On the top, the seed garden where the study area is located. On the lower, the sample sequence is designed by random complete block method.

Table 1. The application amount of N, P, and K fertilizers and their effective components at different levels.
After cultivating the samples for 11 months, the Vis-NIR hyperspectral camera (Gaiafield Pro-V10, Jiangsu Shuangli Hepu, Nanjing, China) was used for hyperspectral image acquisition (Figure 2A). The camera mainly consisted of a built-in push-broom transmission grating (ImSpector-V10, Specim Imaging Oy Ltd, Oulu, Finland) and a 16-bit CCD grayscale camera (Lt365R, Lumenera, Ottawa, ON, Canada). The spectral resolution was 3.5 nm @ 750 nm. The spectral range was 402.6–1005.5 nm with 176 spectral bands. The angle between the light source and the platform was 45°. The photosynthetic photon flux density (PPFD) was measured at the center of the camera’s field and four points at the field boundary using a plant light analyzer (OHSP-350P, Hangzhou Rainbow Spectrum Photochromic Technology, Hangzhou, China). The PPFD range was 88–95 μmol/(m2s) with an illumination uniformity of 7.6%. Set the aperture to 2.8 to get the minimum depth of field to blur the background. After the light source was warmed up for 30 min, paper with black and white grids was placed flat at a distance of 25 cm from the lens for focusing. A standard white reference plate (HSIA-CT-400×400, Jiangsu Shuangli Hepu, Nanjing, China) was placed horizontally on the same plane for the exposure setting. The exposure time of the camera was 3 ms, the gain was 1, and the image resolution was 991 × 960. After collecting the white reference image, the dark noise reference image was obtained by covering the lens cap. Cuttings were placed at the bottom of a dark box, and the distance between the center of the canopy needles and the lens was adjusted to 25 cm by lifting jack to collect hyperspectral images of the samples.
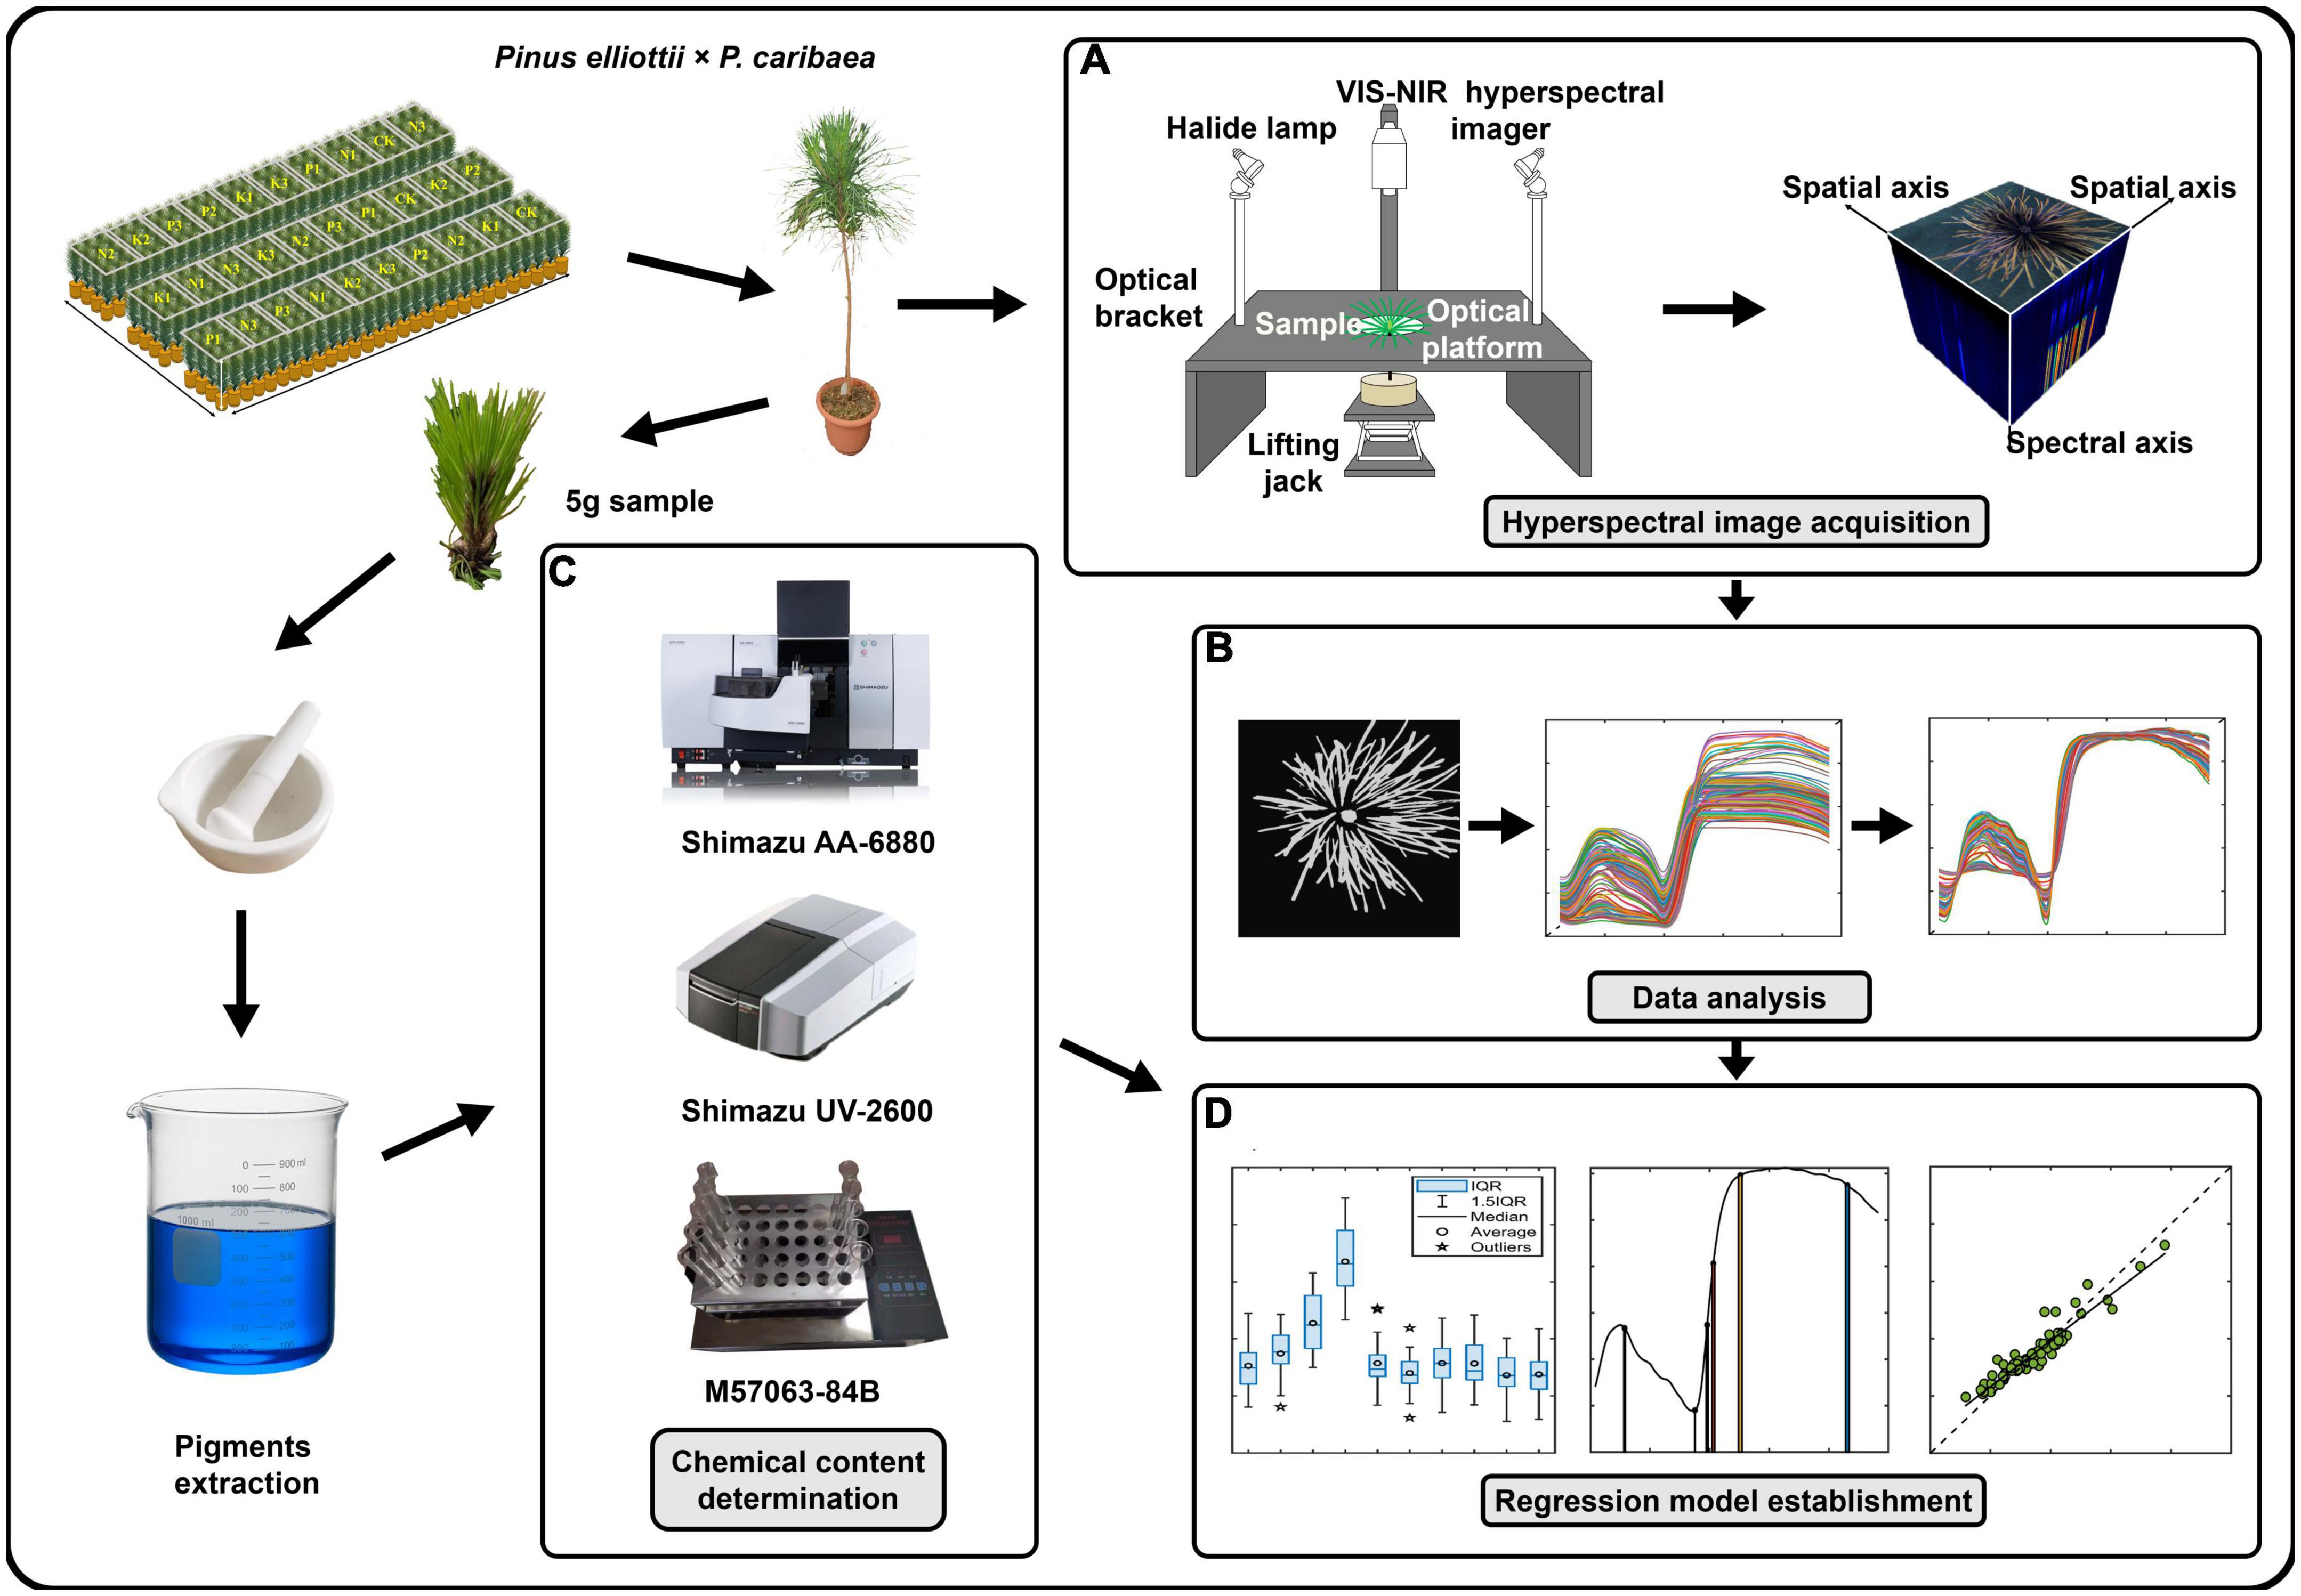
Figure 2. Experimental process. (A) Collected visible-near-infrared (Vis-NIR) hyperspectral images of the top needles of Pinus elliottii × P. caribaea seedlings. (B) Hyperspectral image pre-processing. Selected the region of interest (ROI) of the hyperspectral image to obtain the spectral curve, and performed spectral pre-processing after removing noise points and noise bands. (C) Got 5 g sample to obtain the N, P, and K content. (D) Built regression models based on spectral data and chemical data.
Then, the reflectance calibration was performed by formula (1).
where, λ is any band in the hyperspectral image; Rs (λ) is the corrected reflectance image; Rraw (λ) is the original gray value image; Rblack (λ) is the gray value image of dark noise; Rwhite (λ) is the white reference image.
After obtaining the hyper-cube, the original spectrum was obtained by averaging the spectra of the region of interest. A total of 270 hyper-cubes were obtained.
Among the 176 bands, the wavelengths at both ends have low responses in the sensor and were greatly affected by noise and water vapor, so they needed to be removed. In this paper, the noise wavelength was removed by calculating the correlation coefficient of two adjacent band images. If their correlation coefficient was less than 0.7, these two wavelengths were considered noise wavelengths (Hasan et al., 2021).
After removing the noise bands, hyperspectral images at 800 nm were taken for thresholding (Figure 3C). The band shows the greatest difference in reflectance between the canopy needles and the background (Figures 3A, B). Firstly, the general area of the canopy needles was extracted from the background using the threshold segmentation algorithm, and the threshold was set to 0.21. Then use the open algorithm to get the region of interest (ROI). Finally, the raw spectrum is obtained by averaging the spectrum of each pixel in the ROI (Figure 3D).
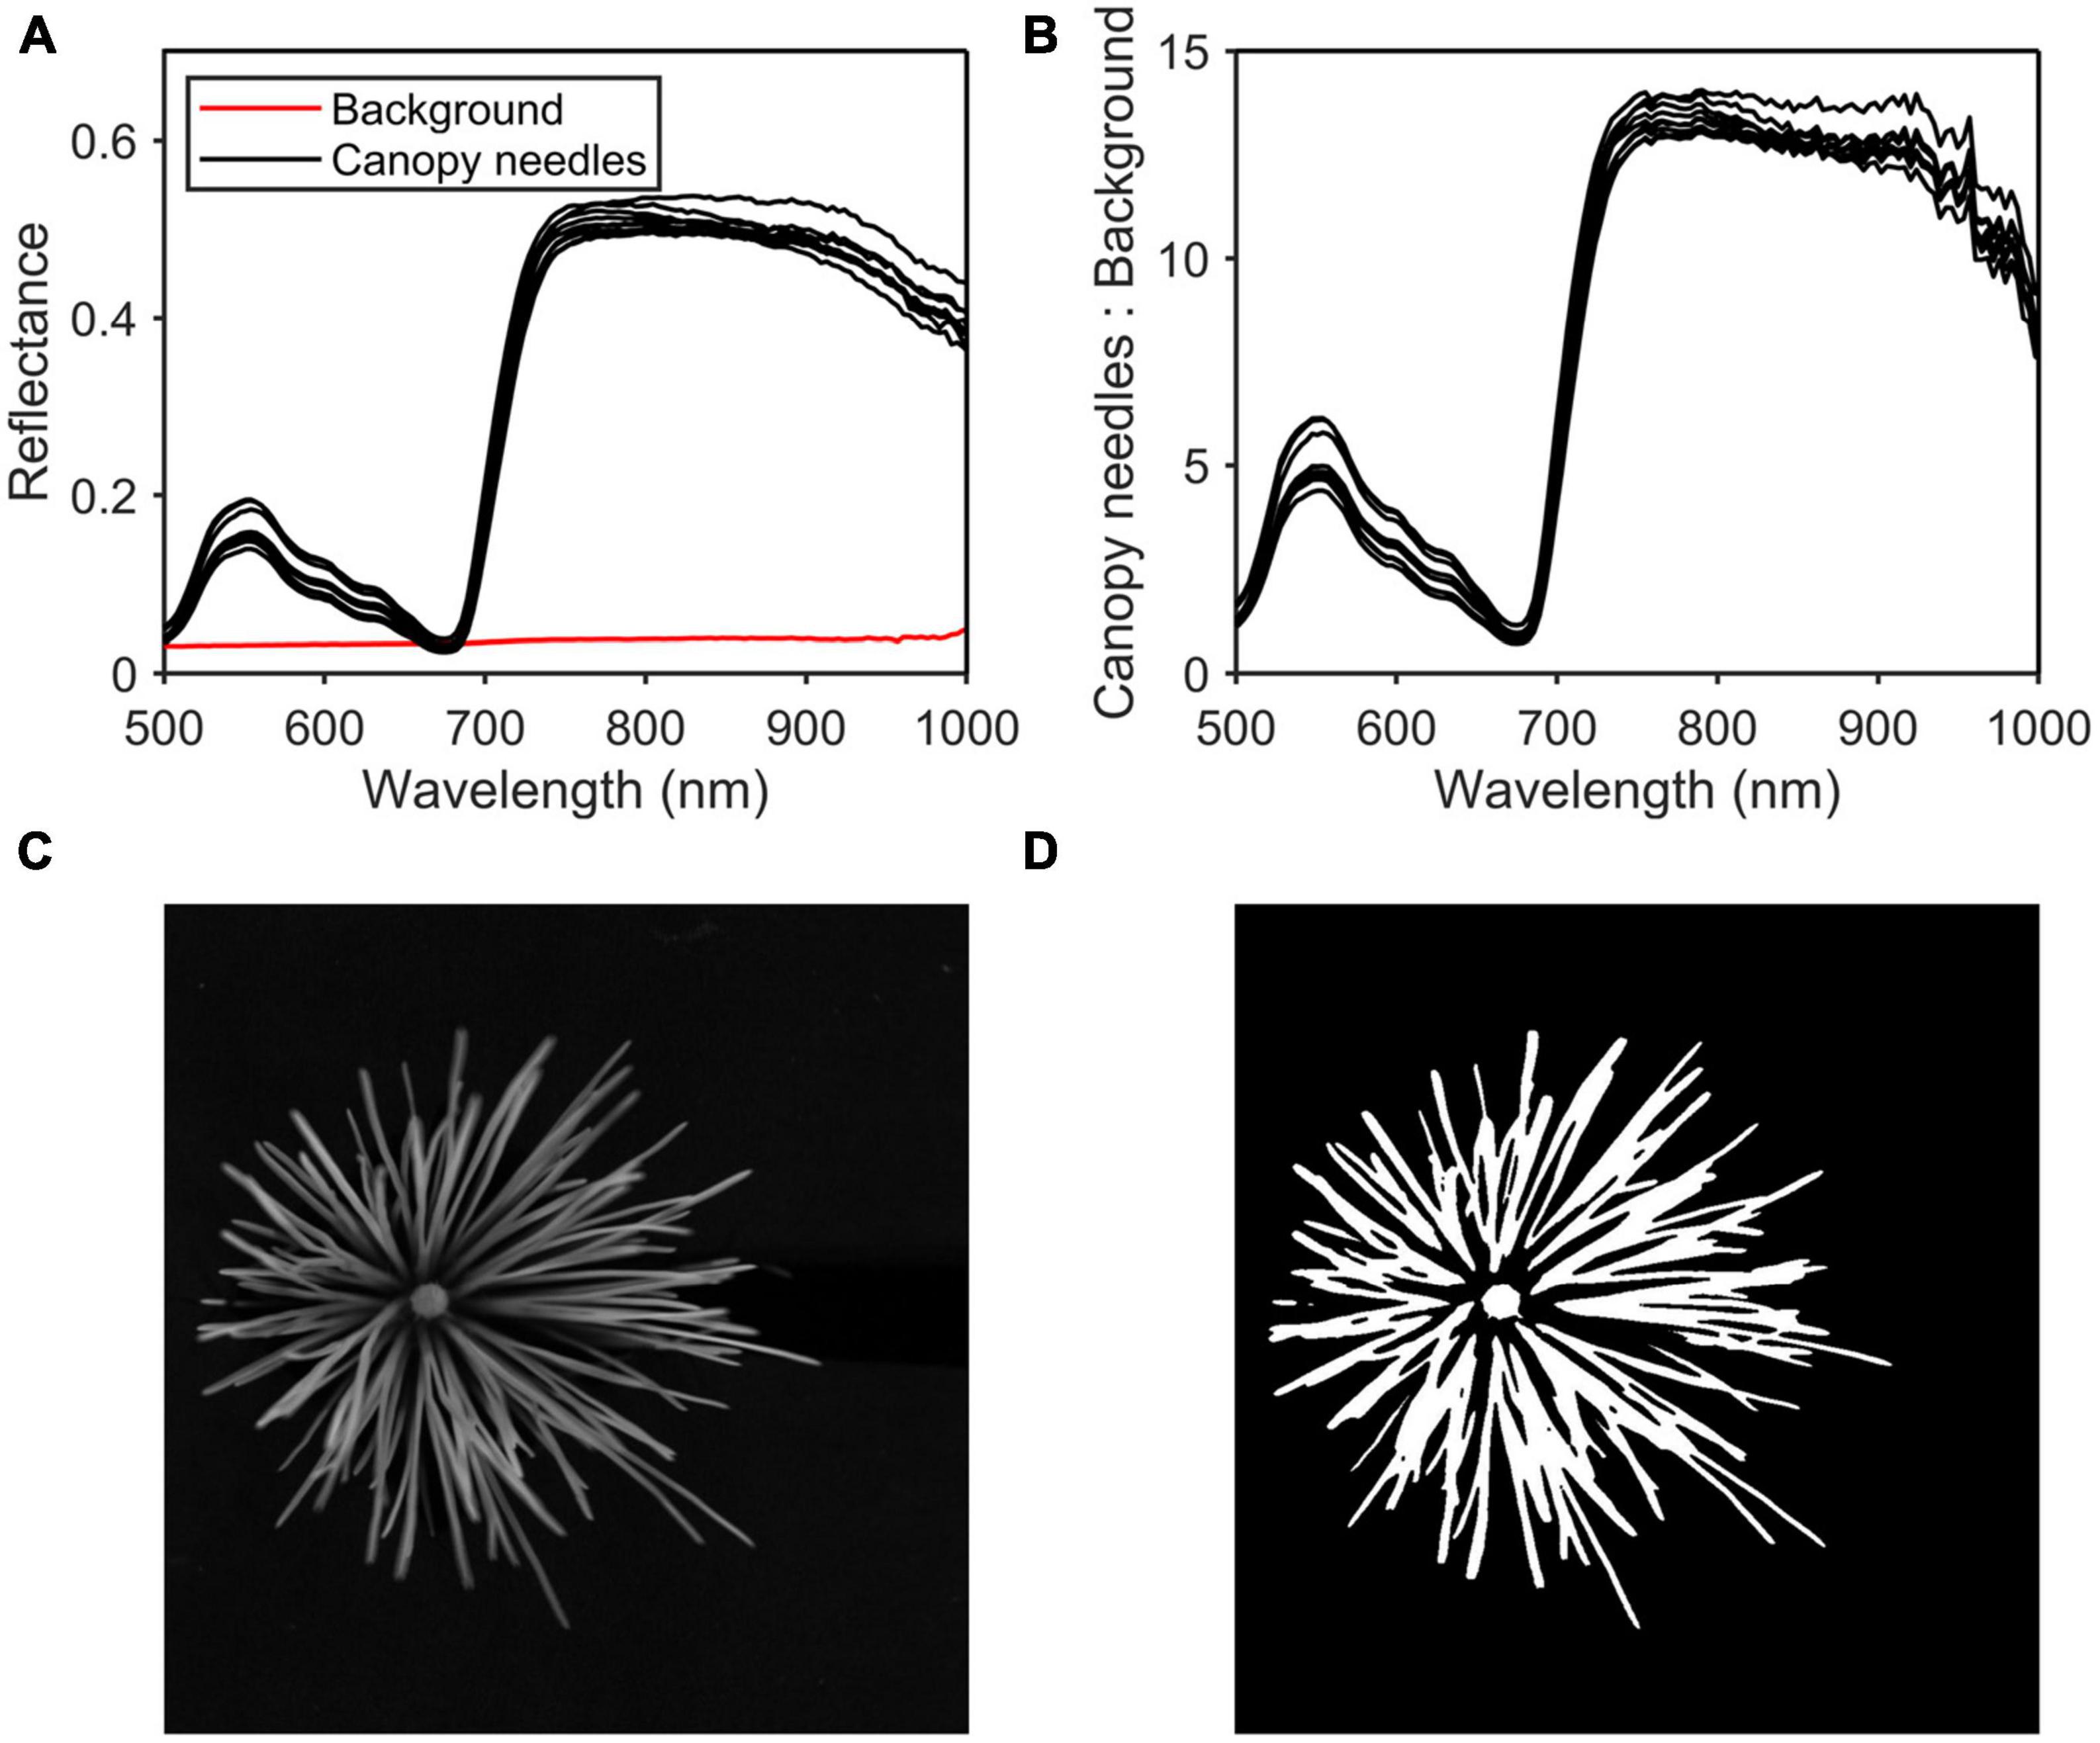
Figure 3. Region of interest (ROI) selection process. (A) Reflectance of the canopy needles and the background. (B) Reflectance of the canopy needles: reflectance of the background. (C) Hyperspectral image at 800 nm. (D) ROI.
To reduce noise and baseline drift caused by uneven lighting, normalization, MSC, and D1 algorithms were used (Vidal and Amigo, 2012; Figure 2B). Normalization expanded the spectral value from 0 to 1, which not only widened the difference between effective spectral wavelengths but also eliminated the invalid spectral wavelengths (Amigo, 2010). MSC can not only effectively eliminate baseline shift and offset between samples due to scattering, but also retain chemically related information in the original spectrum as much as possible (Taghizadeh et al., 2011). D1 is often used to eliminate limit drift and spectral band overlap (Rinnan et al., 2009).
The adjacent wavelengths of spectral data were highly correlated, so it was necessary to extract characteristic wavelengths to reduce the information redundancy in the spectrum. In this paper, PCA, PCA_Weight, SPA, and CARS were used to extract characteristic wavelengths (Figure 2D).
Principal component analysis is a linear transformation algorithm (Huang et al., 2021). The high-dimensional vector set is mapped to a low-dimensional space through linear projection and the variance of the new vector set is maximized in the new dimension.
PCA_Weight algorithm is similar to PCA. After reducing the dimension of the original spectrum using PCA, the wavelengths with the largest mutation in the weight coefficient of the first four principal components with the largest contribution rate are selected as the characteristic wavelengths.
Successive projections Algorithm is a forward iterative search method (Li and Guo, 2021). The projection analysis of the vector is used to compare the size of the projection vector by projecting the wavelength onto other wavelengths. The wavelength with the largest projection vector is used as the wavelength to be selected, and then the final characteristic wavelength is selected based on the correction model.
Competitive adaptive reweighted sampling algorithm is an algorithm combining adaptive reweighted sampling (ARS) technology and partial least squares (PLS) (Zheng et al., 2019). The ARS algorithm retains the points with the higher weights of the absolute value of the regression coefficient in the PLS model as a new subset while removing the points with lower weights. Then the PLS model is built based on the new subset. After several calculations, the wavelengths in the subset with the minimum root mean square error (RMSE) of PLS model interactive verification is selected as the characteristic wavelengths.
Both the PCA and PCA_Weight algorithms aimed to maximize the variance between the data to increase the variance. They only needed to be run once and the characteristic wavelengths selected for N, P, and K were consistent. The feature wavelengths selected by SPA and CARS algorithms were not completely consistent. Therefore, the two algorithms were run 500 times each to reduce the impact of algorithm fluctuations (Li et al., 2009). The frequency of each wavelength was counted, and the wavelengths with the higher frequency were used as the characteristic wavelengths. After setting the running times of the algorithms to 200, 500, and 1,000 times, it was found that the frequency of wavelength occurrences was not affected.
A tital of 5 g of canopy needles were picked and stored in paper envelopes. The samples were dried and ground through a 0.425 mm stainless steel sieve. The pretreated samples were digested with a sulfuric acid-hydrogen peroxide solution. The contents of the N, P, and K content in the samples were determined by the Kjeldahl nitrogen (KN) method (Beijing Zhongxihuada Science and Technology Co., Ltd., M57063-84B), Molybdenum blue colorimetric method (Shimazu UV-2600), and flame spectrophotometry (Shimazu AA-6880) (Laclau et al., 2009; Figure 2C).
In this paper, ensemble learning algorithms such as: Boosting-GBDT, Bagging-RF, and Stacking were used to build the prediction models.
Random forests is the typical representative of the Bagging algorithm cluster (Peng et al., 2021). It is an algorithm that connects multiple decision trees to reduce the risk of overfitting. It consists of multiple uncorrelated decision trees, and each decision tree in the forest is regressed separately when a new sample is an input. Each decision tree gets its regression result, and the random forest takes the average of these results as its final result. In this article, the number of decision trees was set to 100 and the number of leaves on each tree was set to 20. The number of max features was set to zero, meaning that all features are selected.
Gradient boosting decision tree is a typical representative of the Boosting algorithm cluster (Tian et al., 2022). The algorithm consists of multiple decision trees that are not independent of each other but have a serial relationship. When building a subtree, the residuals formed after the results of the previous subtree construction are used as input for constructing the next subtree. The final prediction is made according to the order of subtree construction and the prediction is averaged as the results. In this paper, the parameters of the decision tree were optimized using the negative gradient of the loss function. In this paper, the number of decision trees was set to 100. To suppress model overfitting and reduce model complexity, the max depth is set to 2 and the learning rate is set to 0.01.
The Stacking ensemble learning framework is different from the above two algorithm clusters (Lu et al., 2021). It is generated by a variety of base learners and is called heterogeneous integration. First, it divides the original dataset into several sub-datasets and feeds them to each base learner in the first layer. Each base learner outputs prediction results. Then, to achieve the induction of the output characteristics of the previous layer, the output of the first layer is used as the input value of the second layer metalearner. In this paper, GBDT, RF, extra trees (ET), and ada boost (AB) were selected as the first layer of the Stacking ensemble learning model framework and DT was selected as the meta learner in the second layer. Cross-validation was used to generate training samples for the secondary learning algorithm.
The determination coefficient (R2) and RMSE of 10-fold cross-validation calculations were used to evaluate the accuracy of the model. The calculation method was shown in formulas (2–5).
where, nc is the number of the training set samples; ycal,i is the regression value of the training set; is the actual measured value of the training set; is the average of ; np is the number of the prediction set samples; ypre,i is the regression value of the prediction set; is the actual measured value of the prediction set; is the average value of . The closer R2 is to 1 and RMSE is to 0, the higher the prediction accuracy of the model is.
By calculating the correlation coefficients of images of hyperspectral adjacent wavelengths of 270 samples (Figure 4), wavelengths with correlation coefficients less than 0.7 (<505.0 and >986.8 nm) were removed. Finally, 138 wavelengths of 505.0–986.8 nm were left.
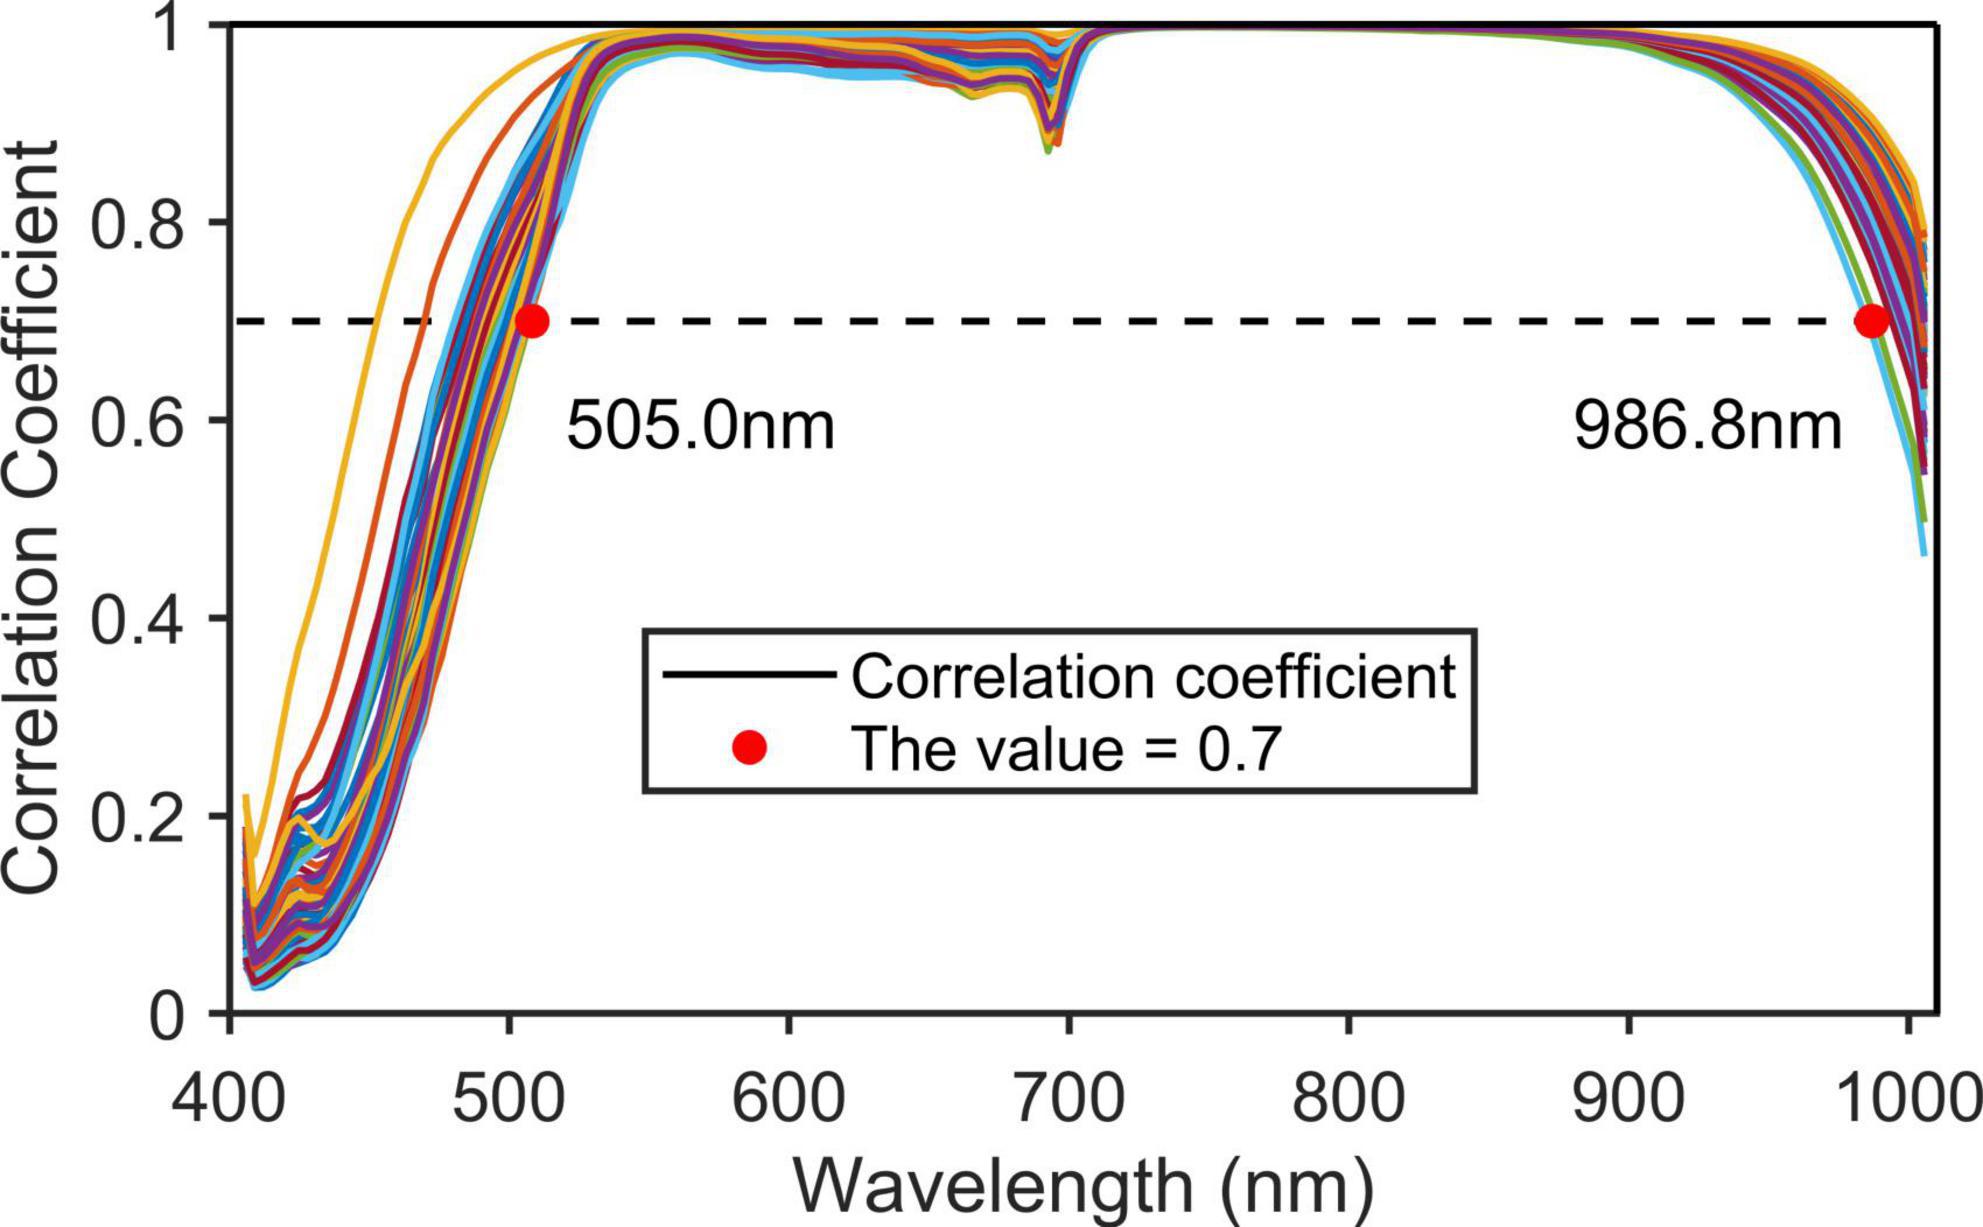
Figure 4. The correlation coefficient of adjacent wavelengths.
The spectrum of the N group was used as an example for comparison. As shown in Figure 5, the original average spectral curves of four levels of the N group after variable normalization, MSC, and D1 pre-processing were depicted. Between 500 and 680 nm, the reflectance spectra of the samples at four levels differ significantly and the reflectance decreases with the increasing nitrogen level (CK > N1 > N2 > N3). This was because when the nitrogen content in the plant increased, the chlorophyll content in the leaves also increased. As the light absorption of the leaves between 430–470 and 630–670 nm increased, the reflectivity of the corresponding spectral band decreased and widened, resulting in a decrease in the green peak at 550.8 nm.
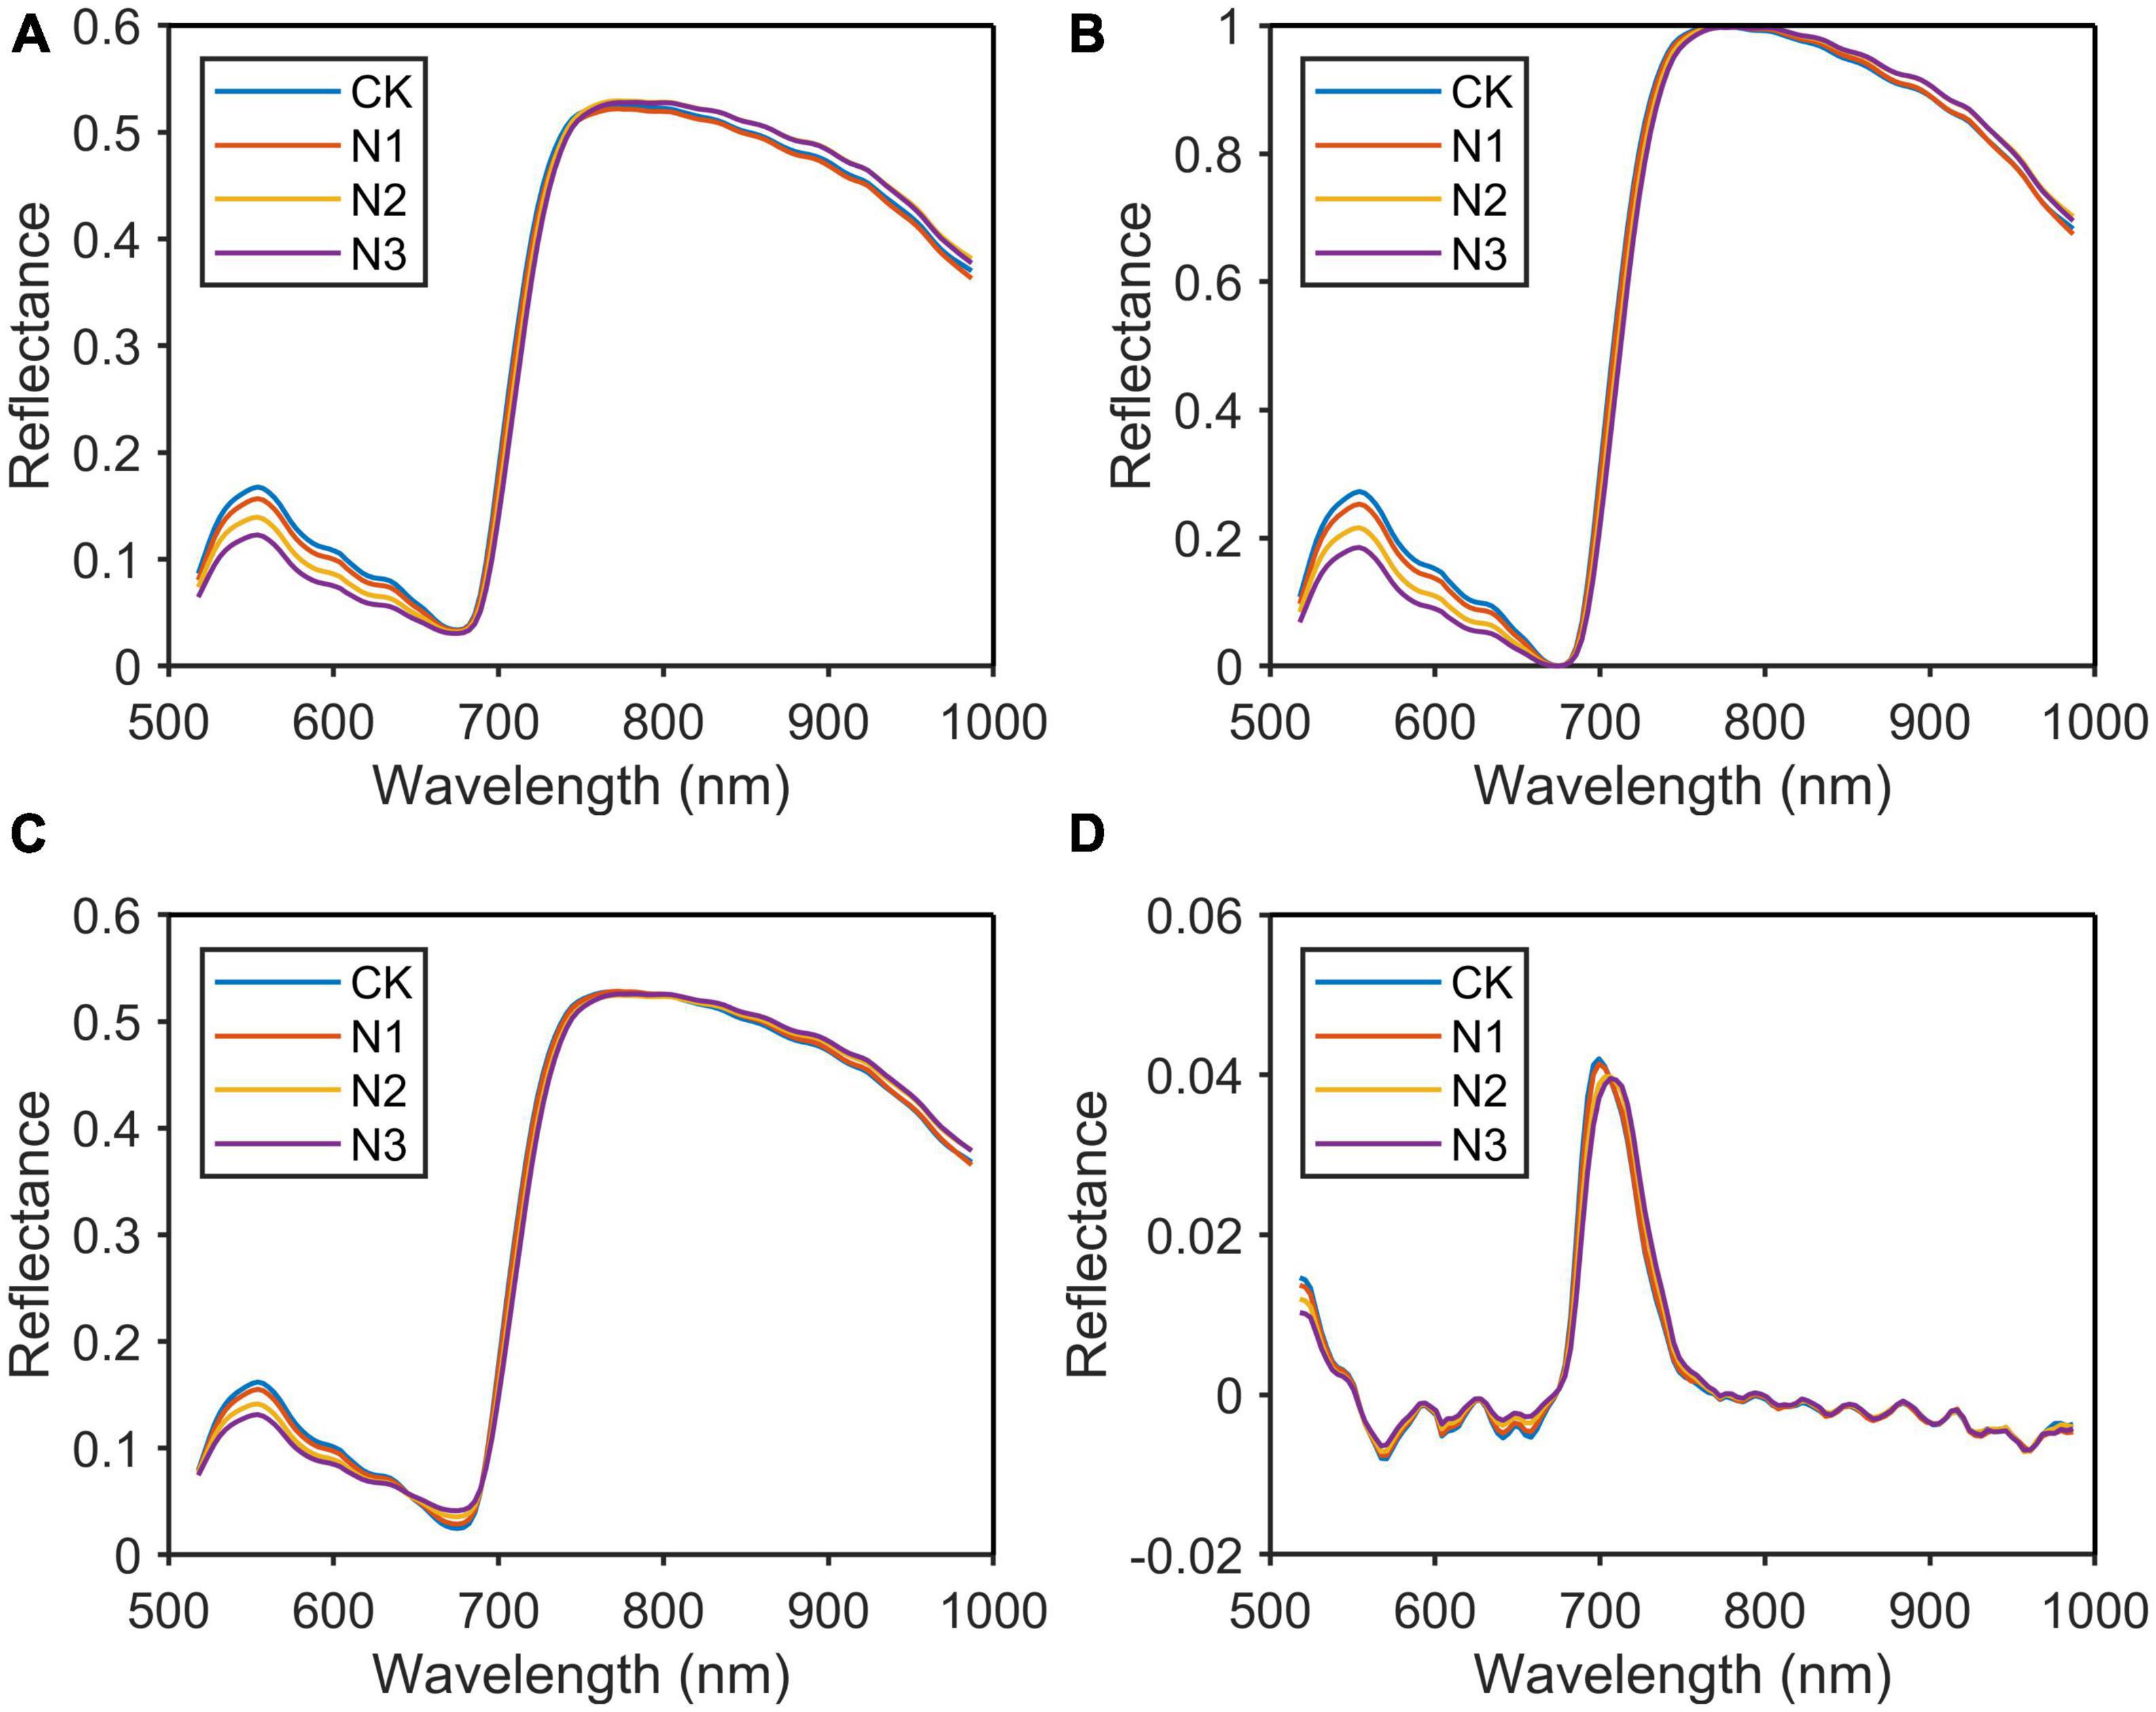
Figure 5. Original spectrum and spectral curve after pre-processing. (A) Original spectrum; (B) normalization; (C) multivariate scattering correction (MSC); (D) differentiation (D1).
As shown in Figure 5B, the spectral difference between 550 and 680 nm was further expanded after normalization pre-treatment, while the spectral difference between 800 and 1,000 nm was reduced. These wavelengths with small spectral differences and high correlation would be removed in the feature extraction. As shown in Figure 5A, the spectral absorption peak of chlorophyll was between 665 and 675 nm. The reflectivity of each sample in this spectral band was small and close, so these wavelengths might be ignored in the selection of the characteristic wavelengths. MSC highlighted these wavelengths by calculating the average spectrum and correcting the original spectrum by offset (Figure 5C). In the subsequent feature wavelength selection process, we found that these wavelengths did contain a very important wavelength. In Figure 5D, the processing of the original spectrum using this method highlighted the bands with large rates of change, reducing the spectral difference between 800 and 987 nm. In this paper, MSC was the most suitable method for sample pre-processing by comparing the results of the prediction models.
After determining the nutrient content by chemical method, data outliers were removed by box chart, and finally 270 valid data were obtained (Figure 6). In all groups, the corresponding nutrient element content of saplings in the N group and P group increased substantially. In particular, the nitrogen content in the N group increased the most, with 7.06, 7.49, 8.55, and 10.71 mg/g for the four treatments, respectively. However, the corresponding potassium content in the K group did not increase significantly. In addition, the application of fertilizer of one element on the saplings resulted in a significant decrease in the content of the other two elements in the sapling. This phenomenon was very obvious in the N group.
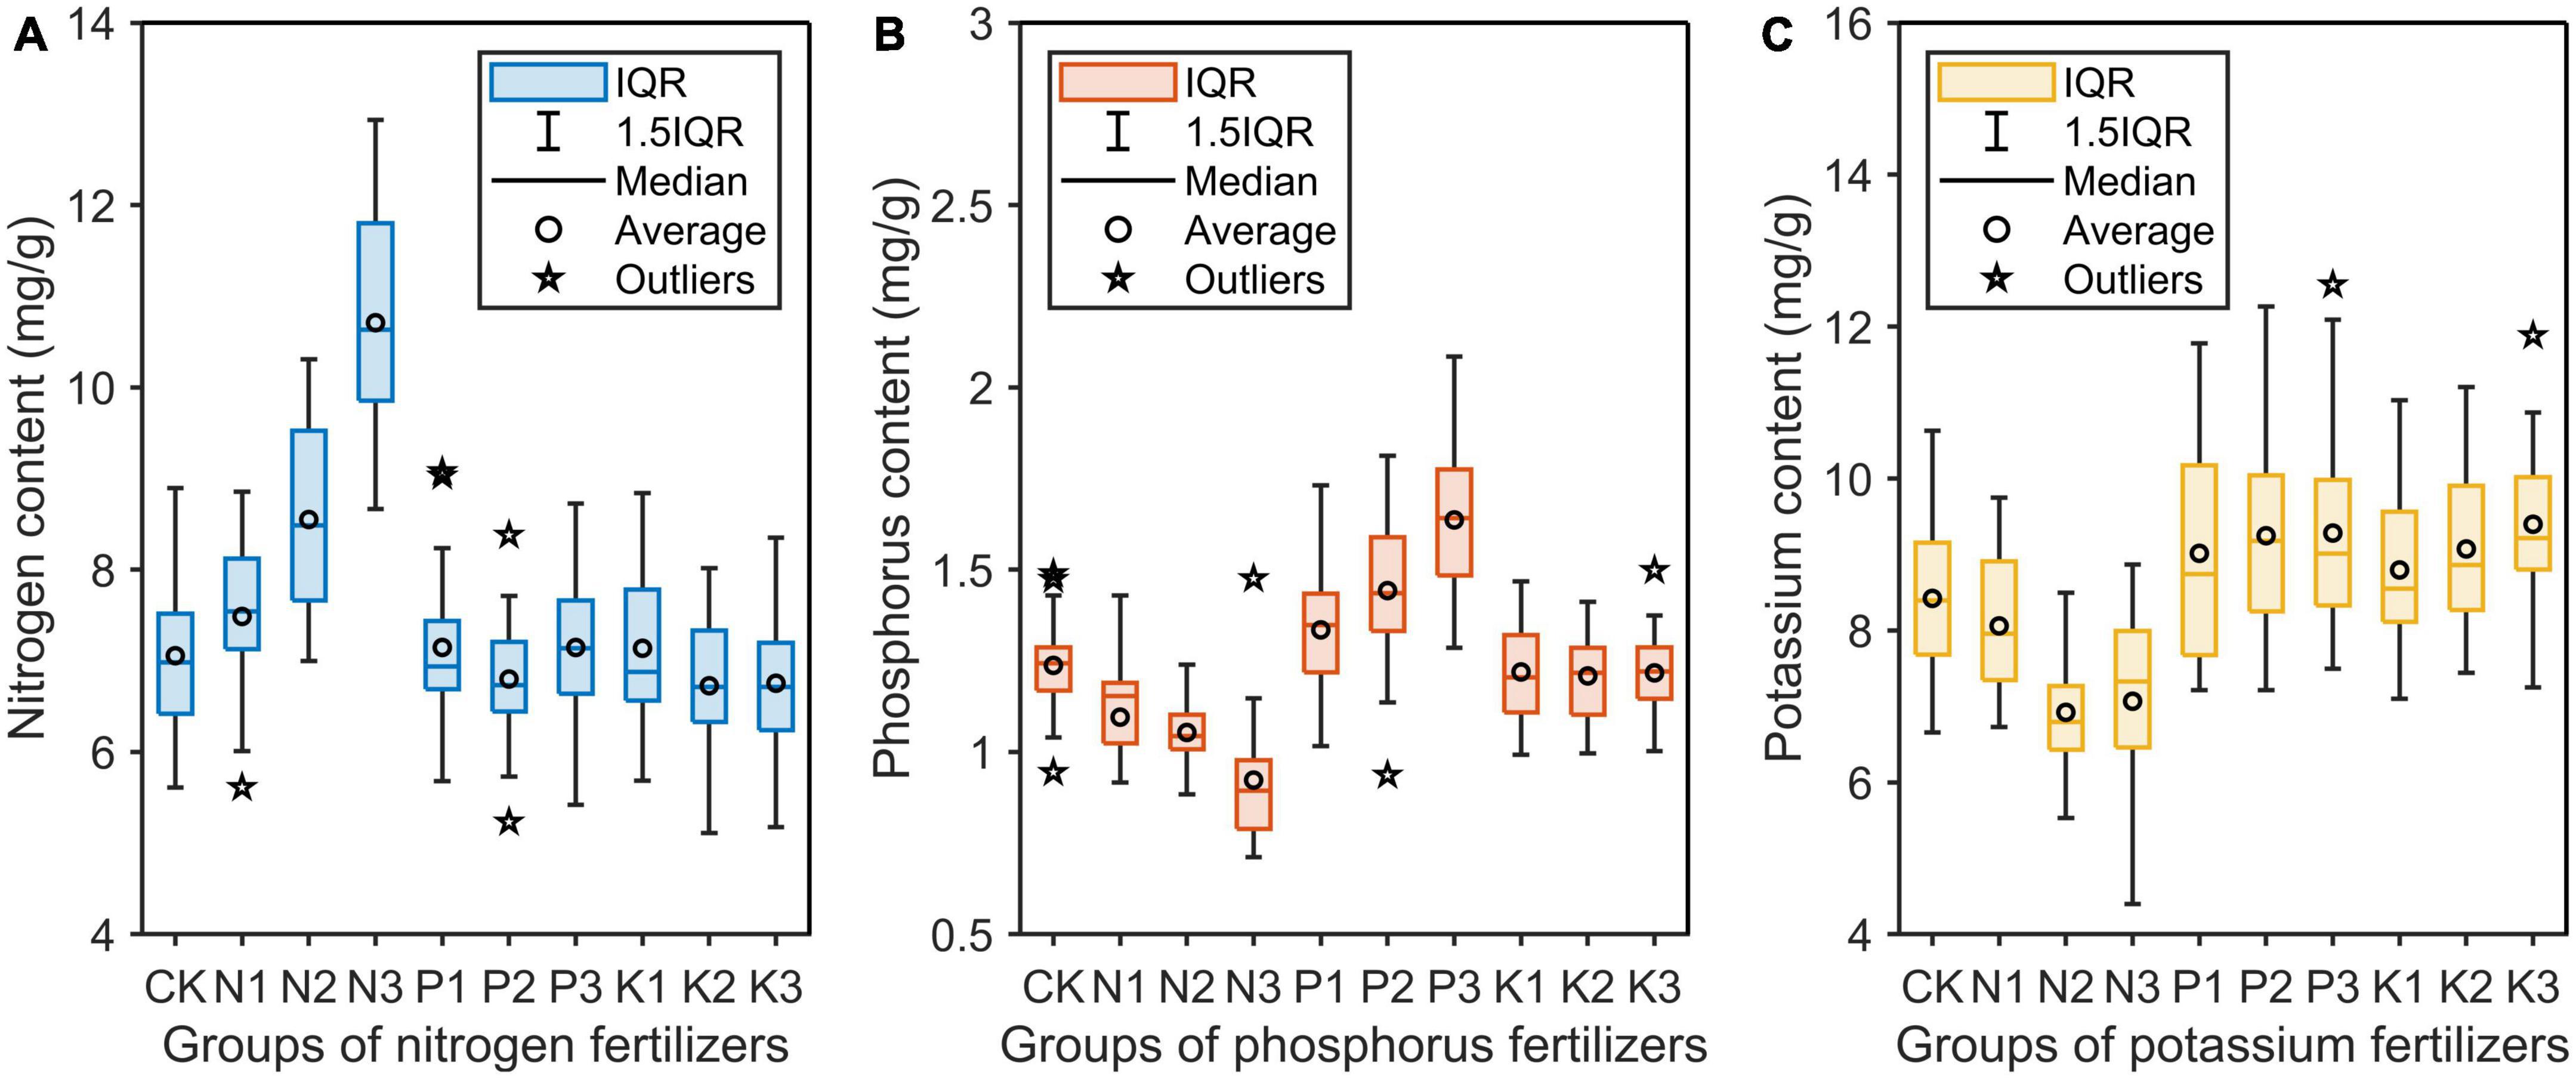
Figure 6. Nitrogen (A), phosphorus (B), and potassium (C) contents in the needles of saplings treated with three different levels of three single-element fertilizers. IQR, interquartile range between 25th and 75th percentile.
In this paper, PCA, SPA, CARS, and PCA_Weight were used to remove redundant information in hyperspectral wavelengths and to improve the detection accuracy and speed of the models. Four algorithms were used to extract the characteristic wavelengths of the original spectrum. After the original spectrum was pre-processed by MSC, the characteristic wavelengths were extracted by SPA (Figure 7A), CARS (Figure 7C), and PCA_Weight (Figure 7E) algorithms. The SPA and CARS algorithms each runs 500 times to eliminate fluctuations in the algorithms and to count the frequency of each wavelength. The width of the bar represented the frequency of occurrence of the characteristic wavelength (Figures 7B, D). The algorithm of PCA_Weight, like PCA, only needed to be run once. As shown in Figure 7E, the weight coefficient curves and curve mutation points for the first four principal components were plotted. The width of the rectangle represented the absolute value of the weight coefficient of the characteristic wavelength. The wider the rectangle was, the more important the characteristic wavelength was. Finally, the positions of the characteristic wavelengths were marked in the original spectrum (Figure 7F). According to the principle of the SPA algorithm, the root mean square error was used to determine the quality of the model. The smaller the root mean square error was, the more stable and accurate the model was. During the operation of the CARS algorithm, Monte Carlo sampling was set to 50 times, and the minimum RMSECV corresponding to the PLSR model established by 50 times sampling was used as the optimal result of the 10 times cross-validation method. When running the PCA algorithm, the wavelengths with a large sudden change in the weight coefficient of the first two principal components of the PCA were selected as the characteristic wavelengths. Then, the characteristic wavelengths for phosphorus (Figure 8) and potassium (Figure 9) were selected using the MSC-CARS algorithm.
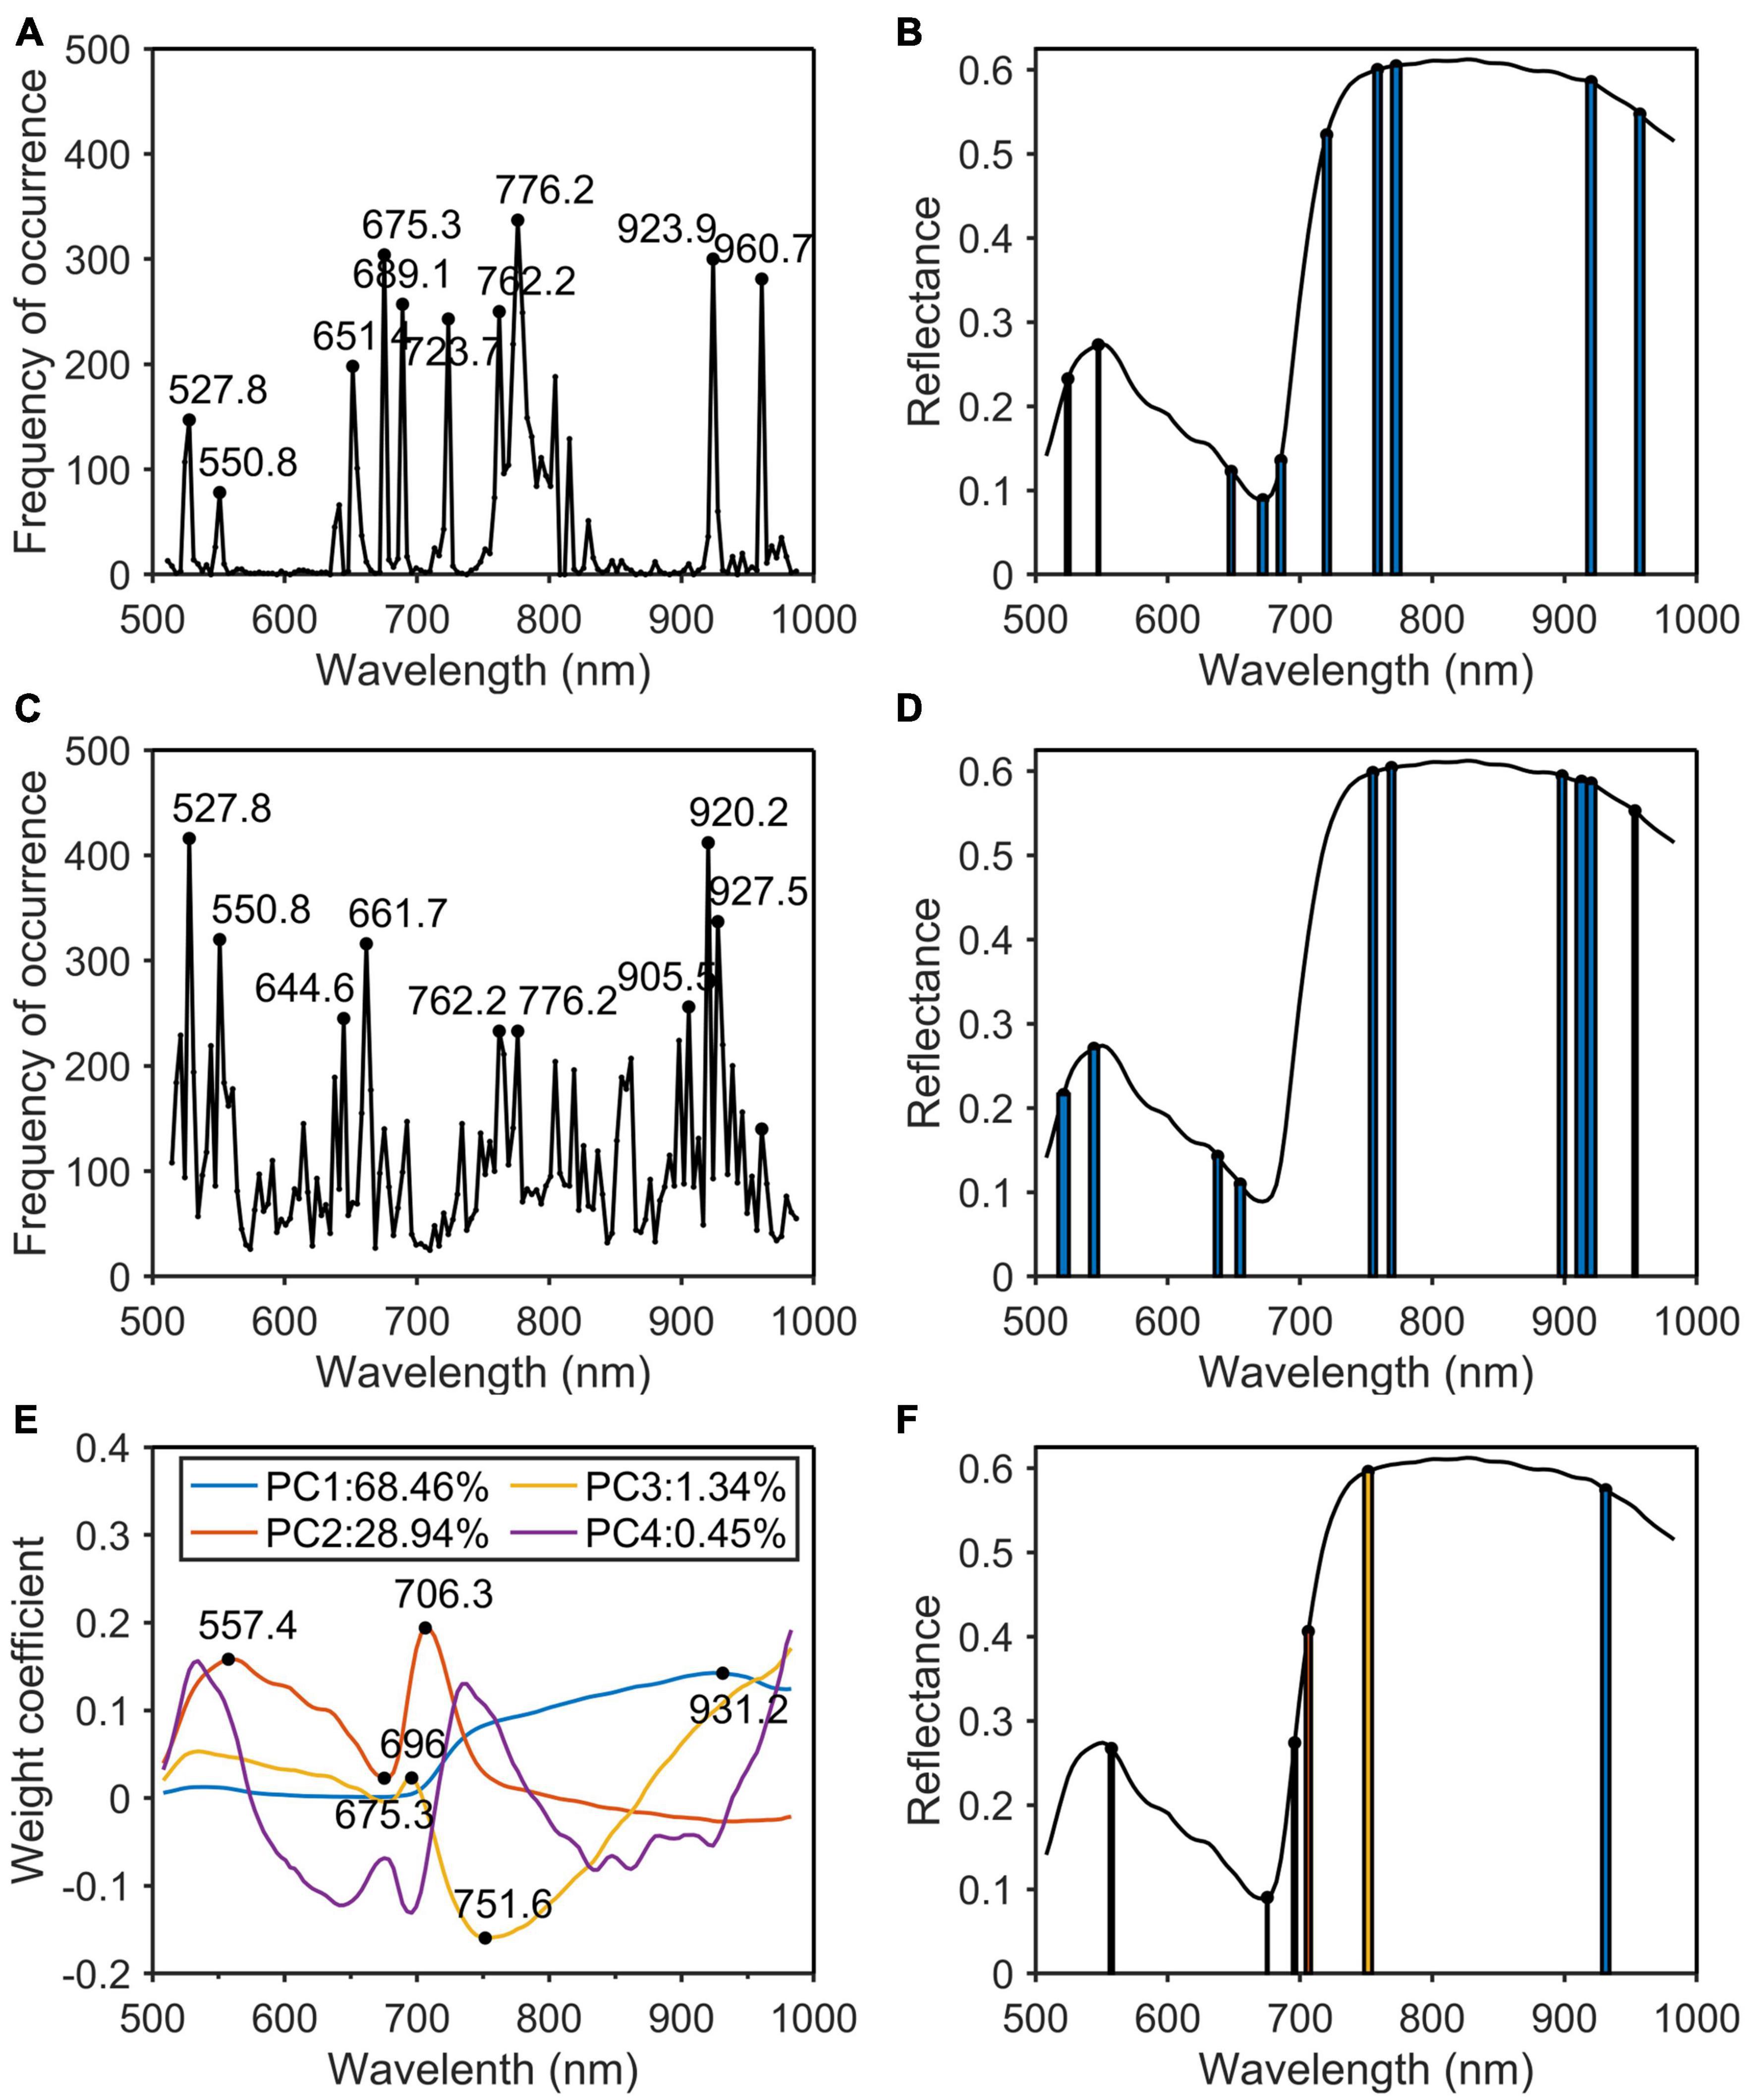
Figure 7. Characteristic wavelengths selection of nitrogen. (A) Occurrence frequency of each wavelength multivariate scattering correction (MSC); (B) the selected wavelengths; (C) occurrence frequency of each wavelength successive projections algorithm (SPA); (D) the selected wavelengths; (E) the first four principal component weight coefficients; (F) the selected wavelengths.
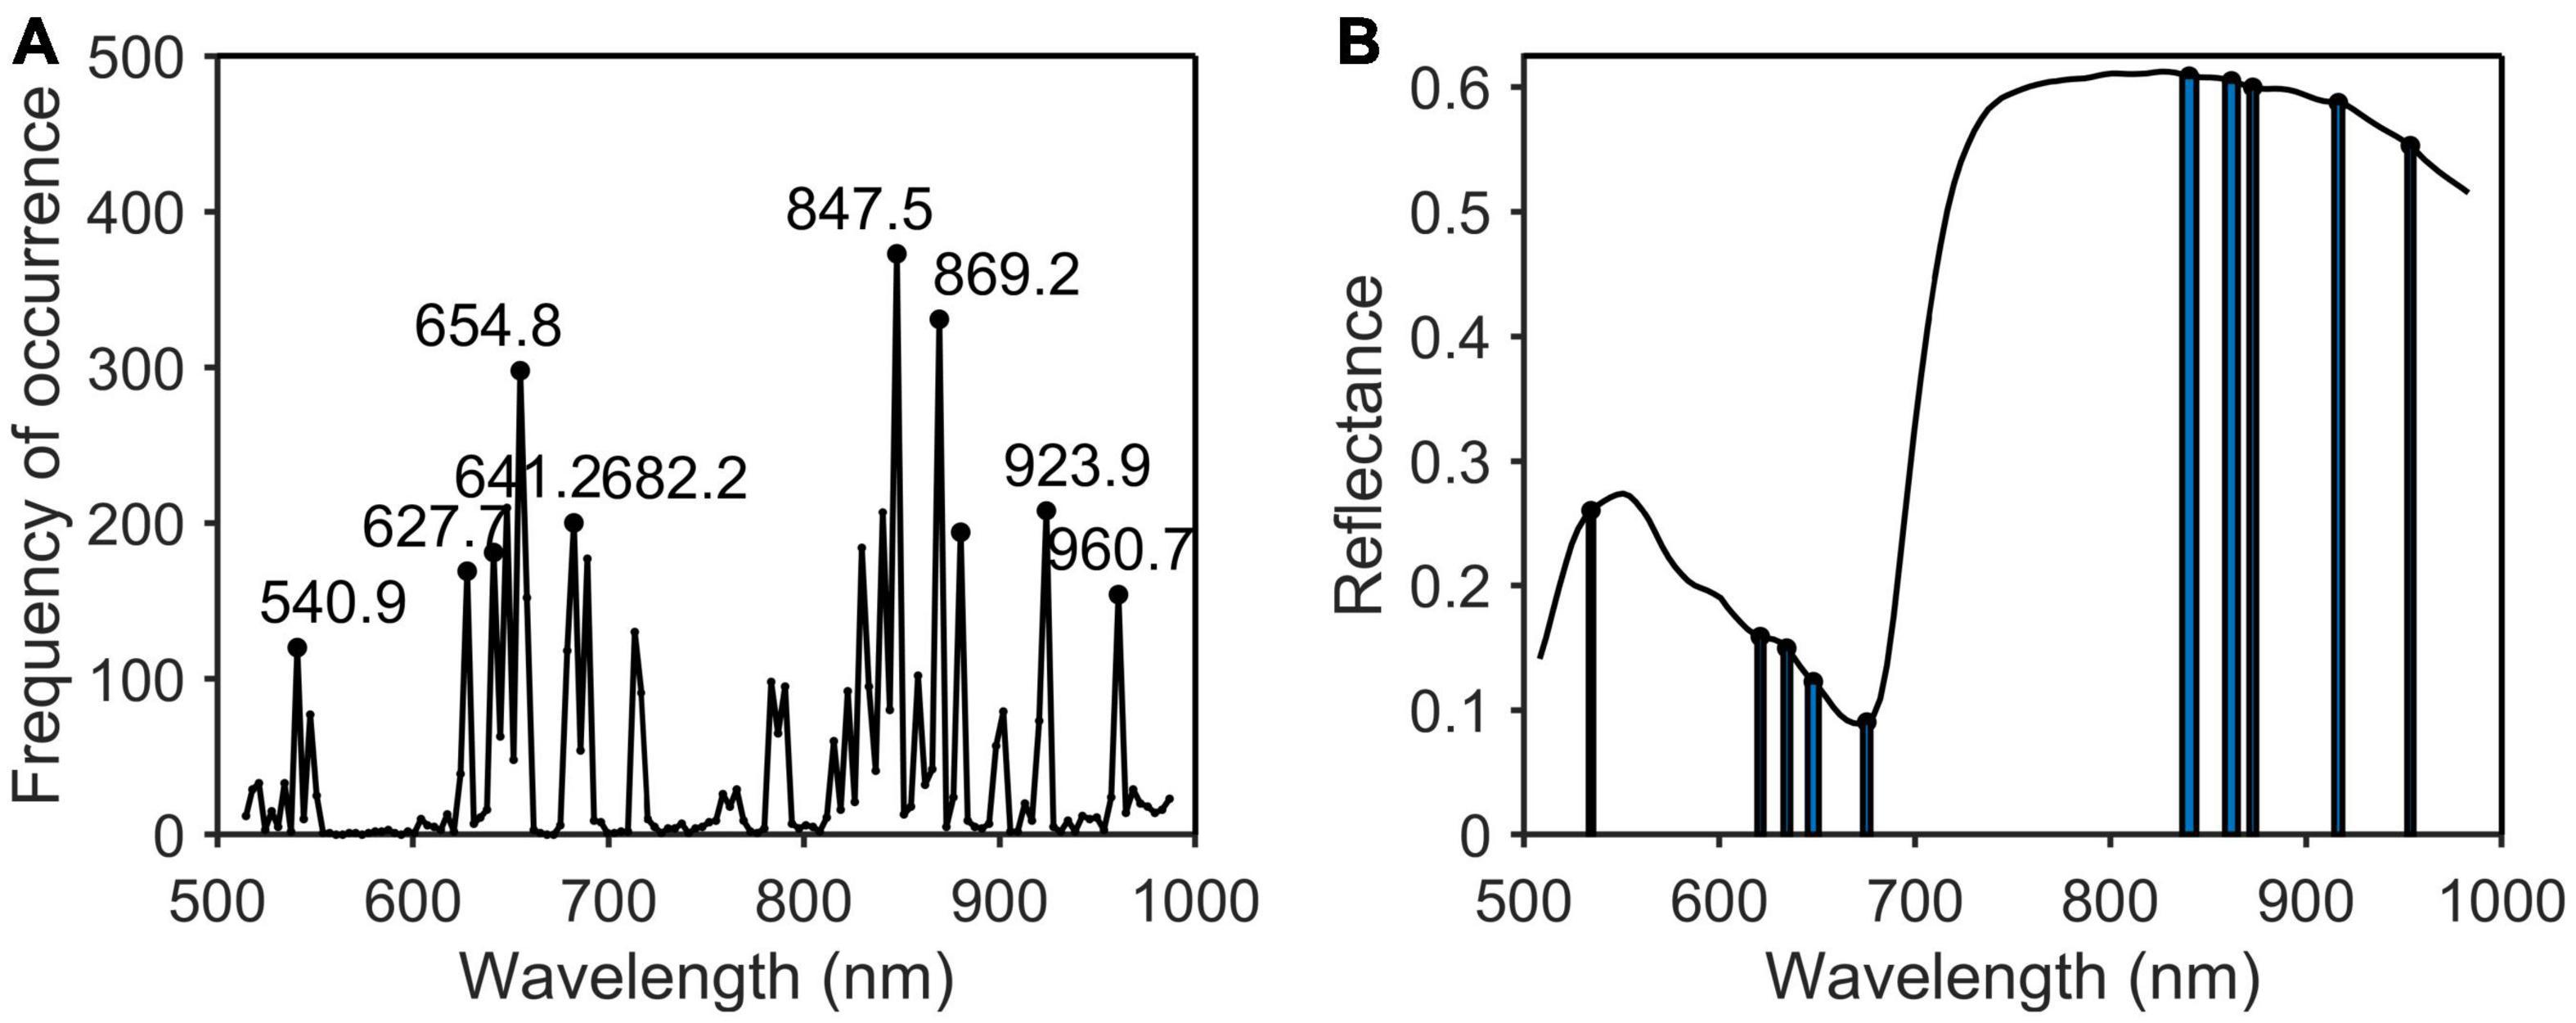
Figure 8. Characteristic wavelengths selection of phosphorus. (A) Occurrence frequency of each wavelength multivariate scattering correction (MSC); (B) the selected wavelengths.
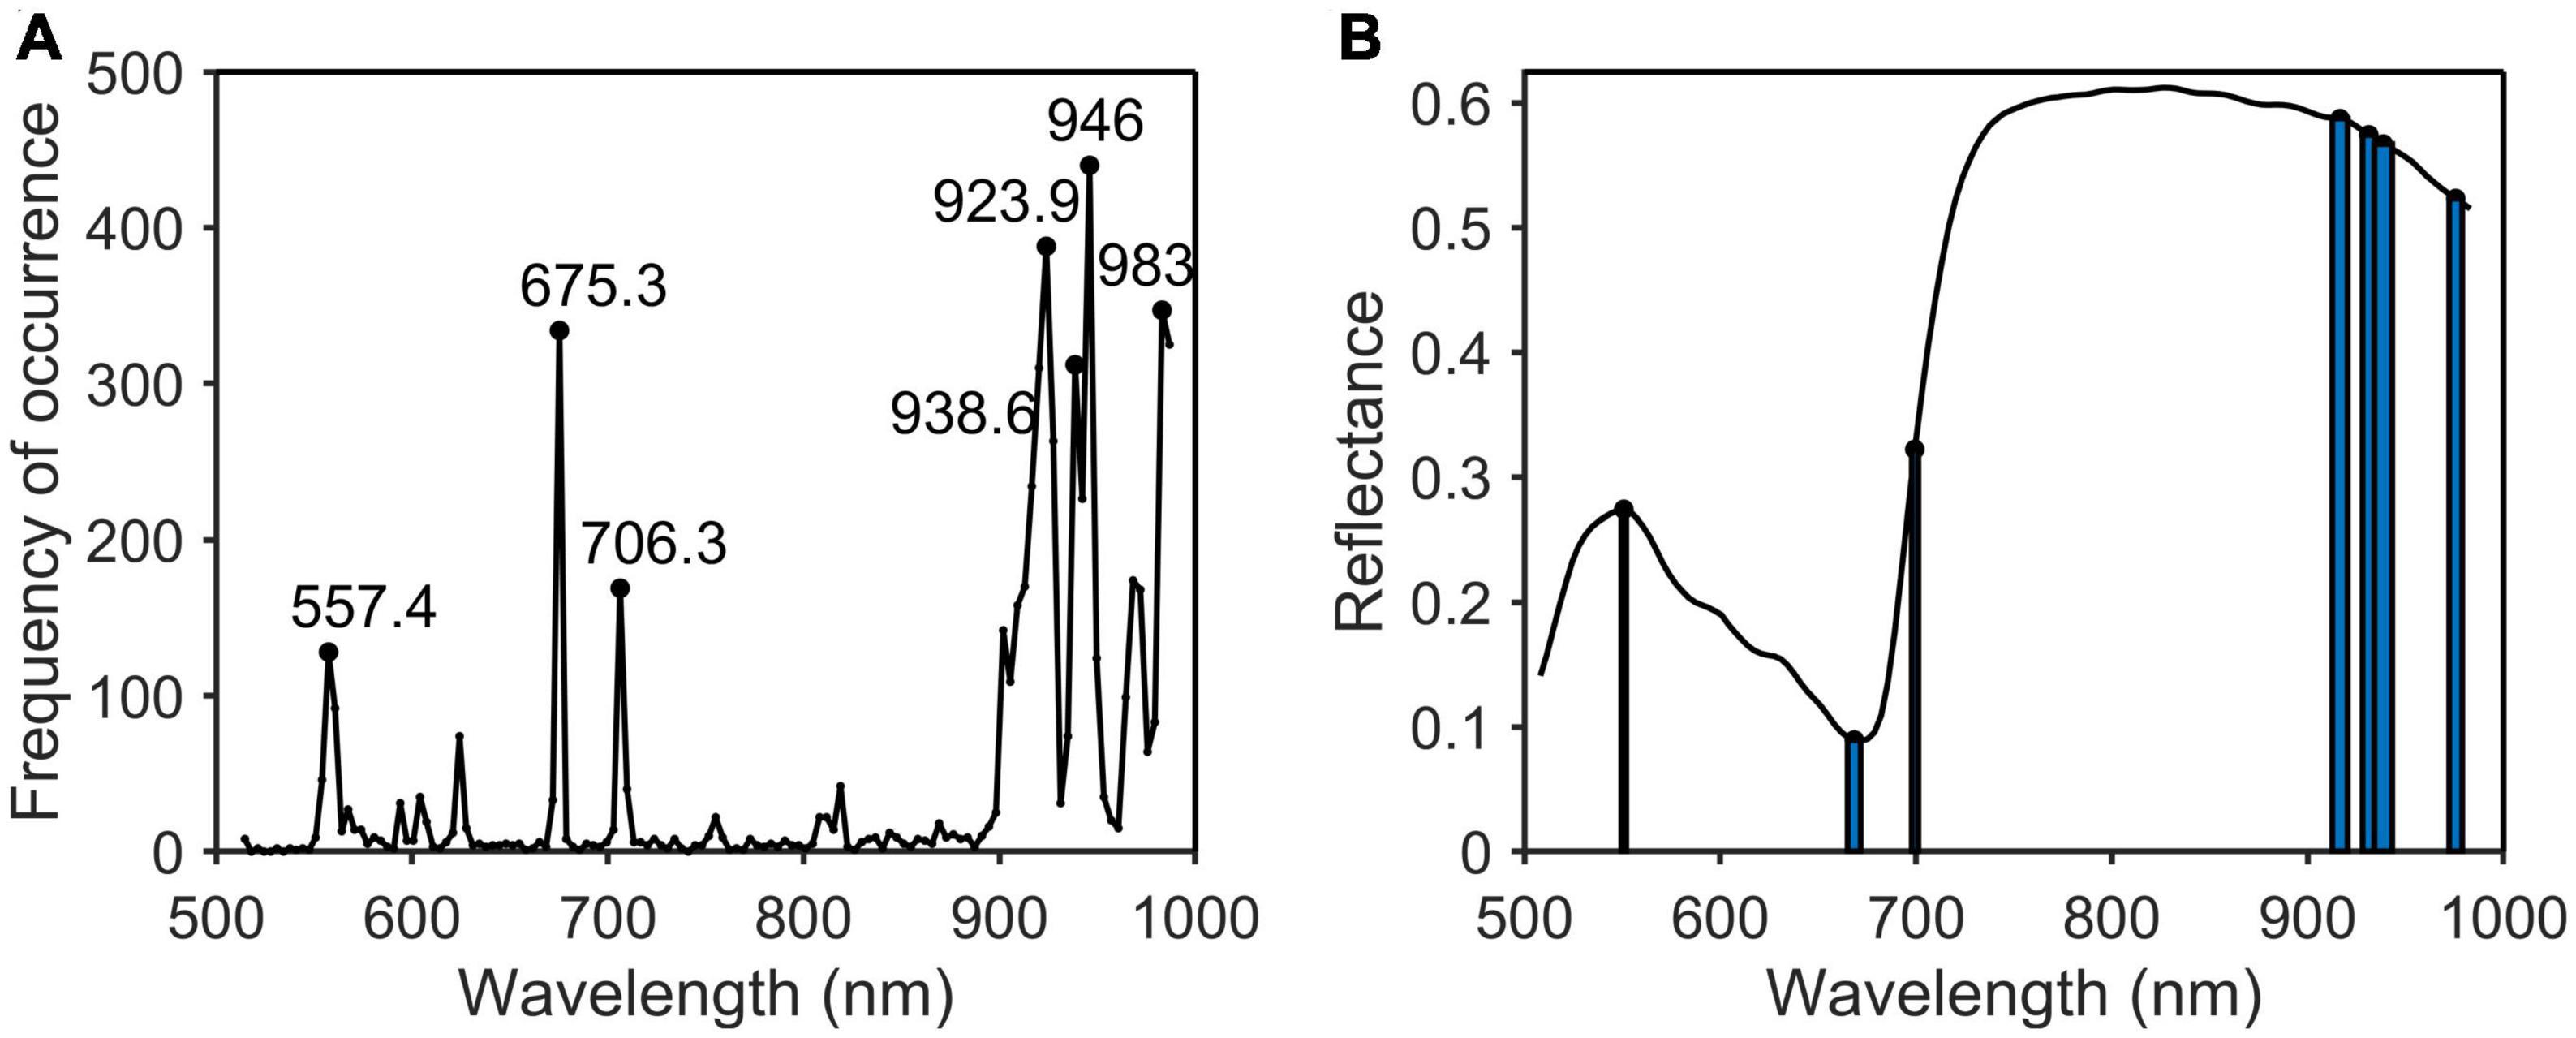
Figure 9. Characteristic wavelengths selection of potassium. (A) Occurrence frequency of each wavelength multivariate scattering correction (MSC); (B) the selected wavelengths.
As shown in Table 2, the characteristic wavelengths of nitrogen were mainly concentrated in chlorophyll, “red edge” and “water peak,” which were 527.8, 550.8 (green peak of chlorophyll a), 651.4 (absorption peak of chlorophyll b), 675.3 (“red valley”), 762.2 (“red edge”), 776.2, 923.9, and 960.7 nm (“water peak”), respectively. This was because nitrogen was an important element of chlorophyll, so the reflectivity of wavelengths related to chlorophyll a and b varied with the amount of nitrogen content in the plant (Yang et al., 2021). The characteristic wavelengths of phosphorus were essentially the same as those of nitrogen. The main reason was that phosphorus was not directly involved in photosynthesis in plants, but indirectly promoted nitrogen utilization and photosynthesis through the synthesis of enzymes required for photosynthesis (Khan et al., 2014). The common characteristic wavelengths of the three nutrient elements were 675.3 and 923.9 nm, respectively. The former was close to the absorption peak of chlorophyll a and the latter was located at NIR.
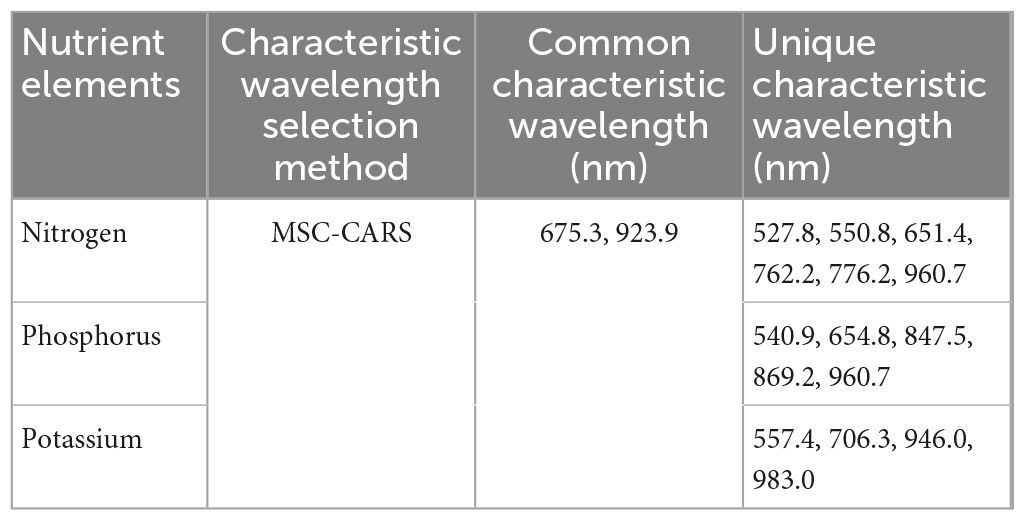
Table 2. Characteristic wavelengths selected for N, P, and K.
Based on the comparative analysis of the prediction results of different spectral pre-processing methods, characteristic wavelength extraction methods, and regression methods, it was found that the MSC-CARS-Stacking model performed the best (Rc2-N = 0.832 and Rp2-N = 0.833; Rc2-P = 0.621 and Rp2-P = 0.622; Rc2-K = 0.695 and Rp2-K = 0.697). Overall, the performance order of the three spectral pre-processing methods was: MSC > Normalization > D1. Compared to different spectral characteristic extraction methods, the prediction accuracy of the models was significantly improved after CARS and SPA processing. The performance ranking of the four spectral feature extraction methods was as follows: CARS > SPA > PCA_Weight > PCA. Compared to different regression modeling methods (Table 3), the Stacking model performed the best. The performance of the three regression models was ranked as: Stacking > GBDT > RF.
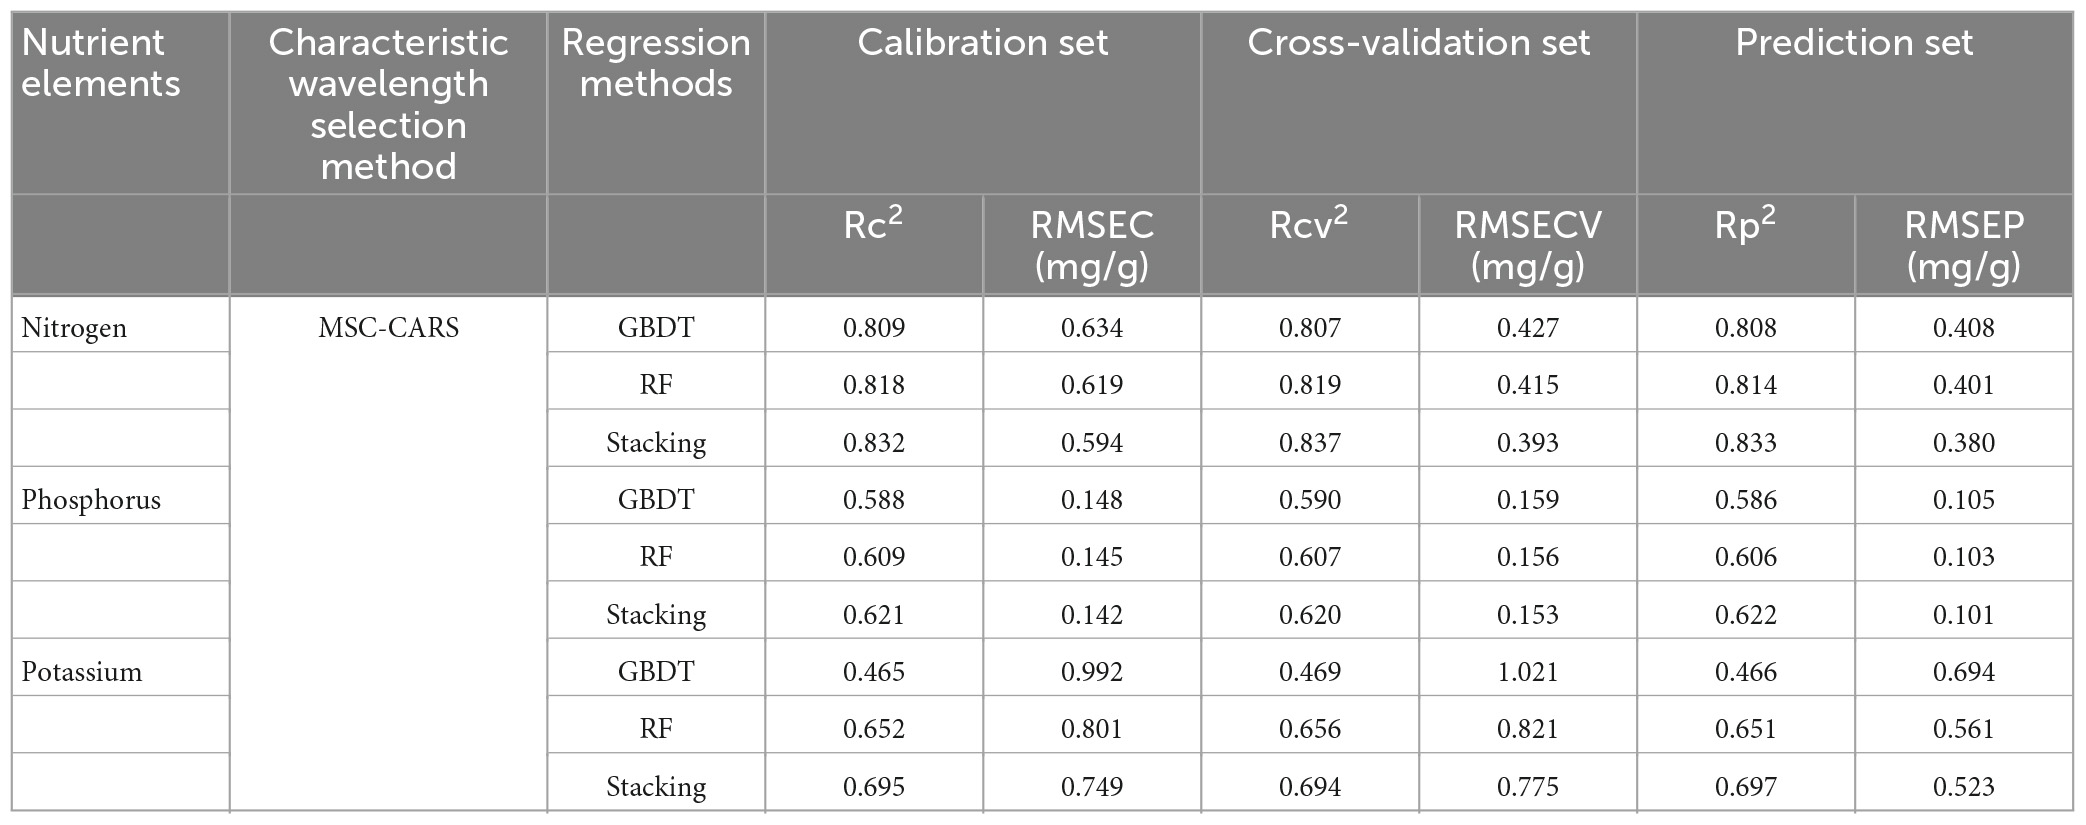
Table 3. Prediction model results of N, P, and K content based on multiple scattering correction-competitive adaptive reweighted sampling (MSC-CARS) pre-processing and three regression methods.
Among the models predicting nitrogen content, the MSC-CARS-Stacking model had the highest R2 value and the lowest RMSE value (Rc2 = 0.832, Rcv2 = 0.837, Rp2 = 0.833; RMSEC = 0.594, RMSECV = 0.393, RMSEP = 0.380) in the calibration set, validation set, and prediction set. This finding was the same when predicting phosphorus content and potassium content (Rc2 = 0.621, Rcv2 = 0.620, Rp2 = 0.622, RMSEC = 0.142, RMSECV = 0.153, RMSEP = 0.101; Rc2 = 0.695, Rcv2 = 0.694, Rp2 = 0.697, RMSEC = 0.749, RMSECV = 0.775, RMSEP = 0.523). The above results showed that Stacking had better prediction ability than other ensemble learning models.
As shown in Figure 10, the best results of the prediction models for each nutrient content were depicted. The x and y axes were the measured and predicted values, respectively. It could be seen that the model predicting nitrogen content was the best, followed by phosphorus, and the worst was potassium.
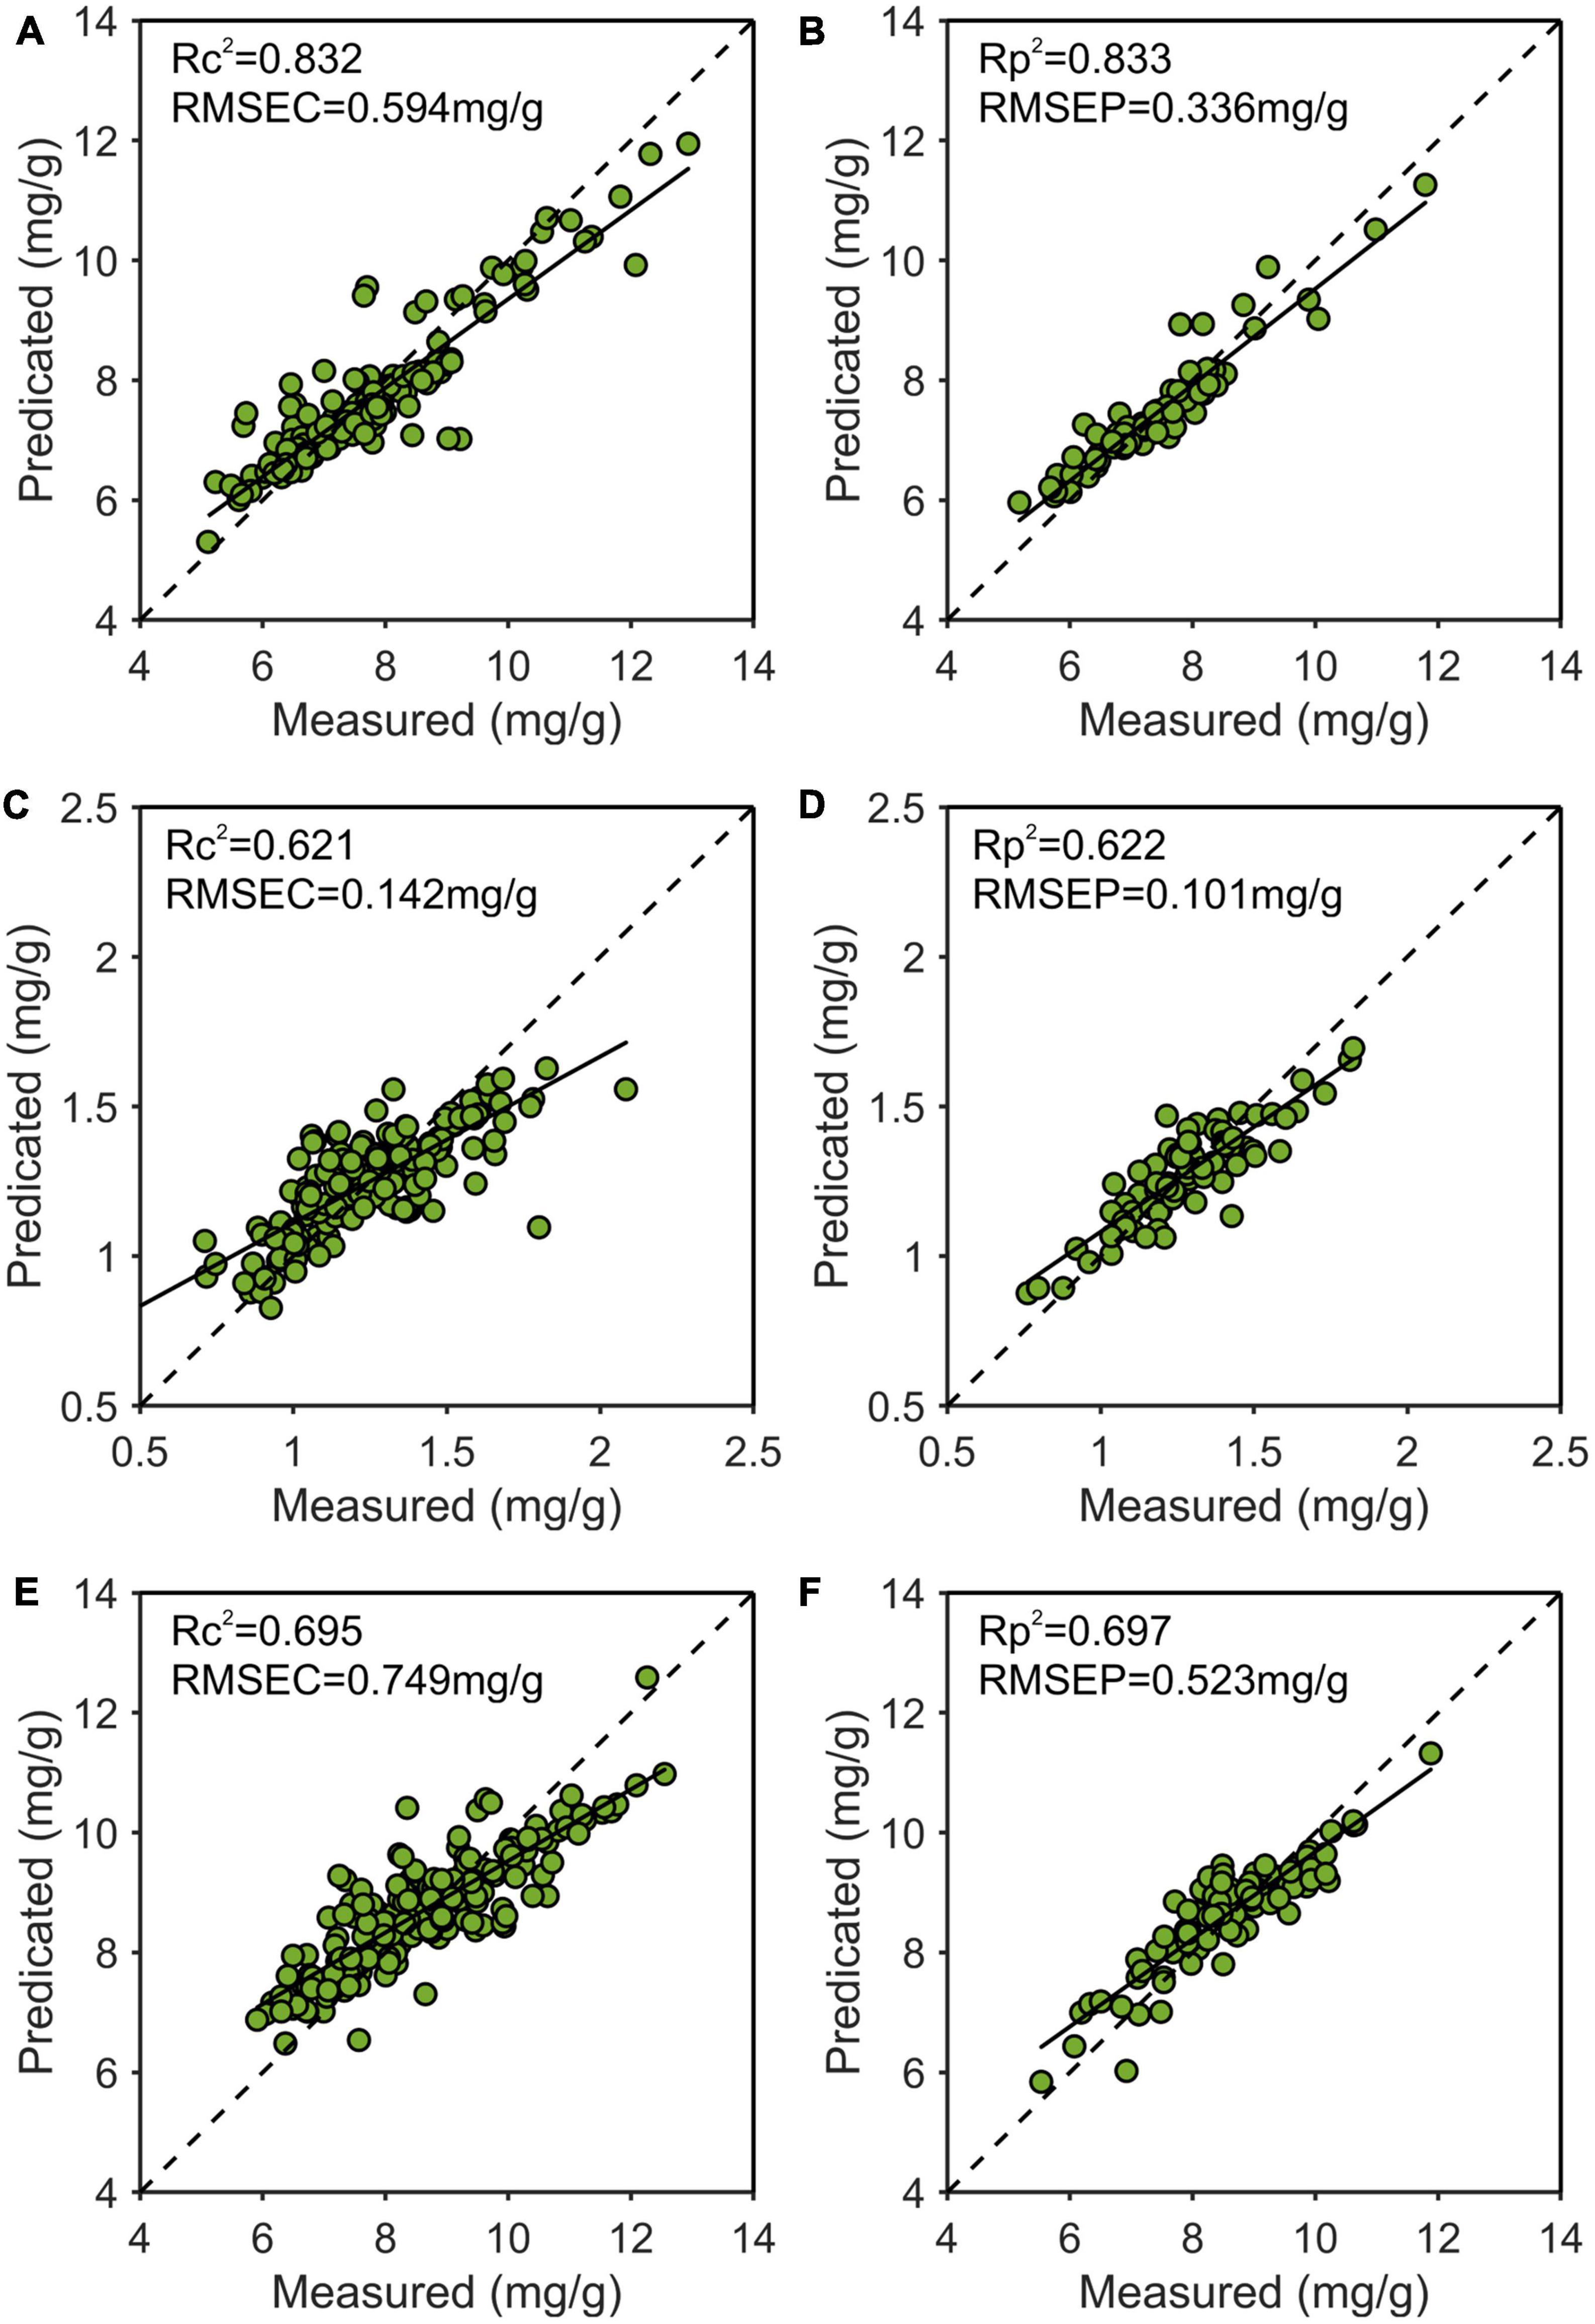
Figure 10. Use the multiple scattering correction-competitive adaptive reweighted sampling-Stacking (MSC-CARS-Stacking) model to predict the best training set and prediction set results of nitrogen (A,B), phosphorus (C,D), and potassium (E,F). R2, determination coefficient; RMSE, root mean square error.
In this paper, we also explored the strength of the generalization ability of the model. For this purpose, we first divided the saplings cultured with the three nutrients into separate groups, then established a prediction model between VIS-NIR spectrum and nitrogen content using N group samples, and finally used this model to predict the nitrogen content in the P group and K group samples. If the results of the training set (N group) and the test set (P group and K group) were similar, it indicated that the prediction model could well predict the nitrogen content of various P. elliottii × P. caribaea canopy sapling needle samples. That was, the generalization performance of the model was good. Otherwise, the poor generalization performance of the model was demonstrated.
The prediction models were developed by combining MSC-CARS and three regression algorithms. The model for predicting nitrogen content was used as an example (Figure 11A). The horizontal, right, and left diagonal bars represented the prediction results of nitrogen content in groups N, P, and K. Among all the models, the Stacking model had the highest R2 of 0.841, 0.814, and 0.801, respectively. The small gap between the three showed that the generalization performance of the model was good. Similarly, in the models predicting phosphorus content (Figure 11B) and potassium content (Figure 11C), the R2 of the Stacking model was 0.597, 0.648, 0.583, and 0.679, 0.652, 0.728, respectively, indicating that these two prediction models also had strong generalization abilities. In conclusion, the Stacking model had better generalization ability than the other ensemble learning models.
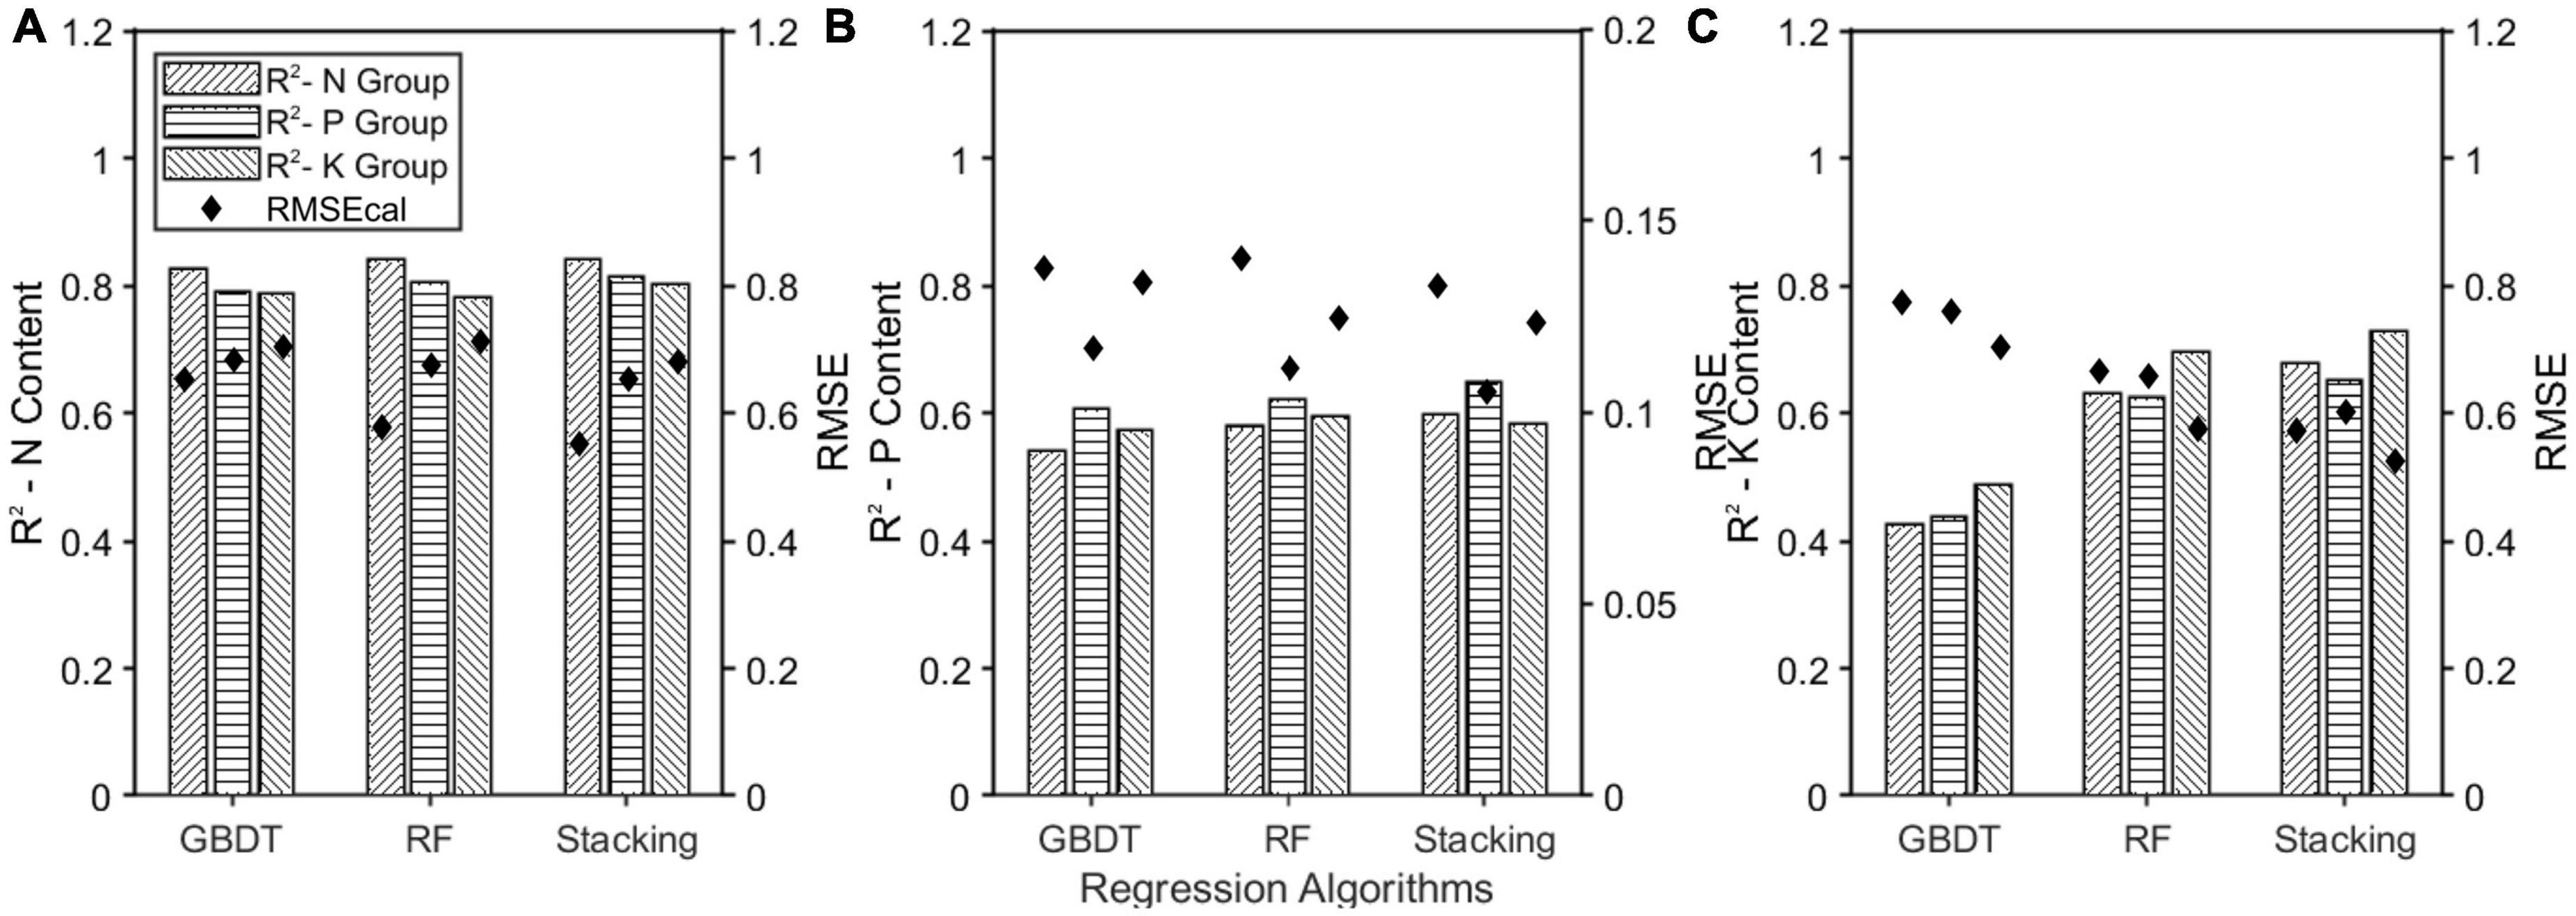
Figure 11. Effect of single element fertilizer on model generalization ability. (A) The model trained by N group was used to predict nitrogen content in P and K groups; (B) the model trained by P group was used to predict nitrogen content in N and K groups; (C) the model trained by K group was used to predict nitrogen content in N and P groups.
In this paper, heat maps were used to show the spatial distribution of N, P, and K contents in canopy needles. We randomly selected 1 sapling from 10 groups as a sample. The spectra of all pixels in the hyperspectral image of canopy needles were extracted. The established prediction model was used to obtain the contents of N, P, and K of each pixel corresponding to the research object, and then the thermal map was drawn as shown in Figure 12. The pseudo-color images of 460, 560, and 660 nm in the sample spectrum cube were synthesized. The contents of nitrogen, phosphorus, and potassium obtained from the prediction model formed a heat map. From left to right, there were CK, level 1, level 2, and level 3 fertilization levels, respectively.
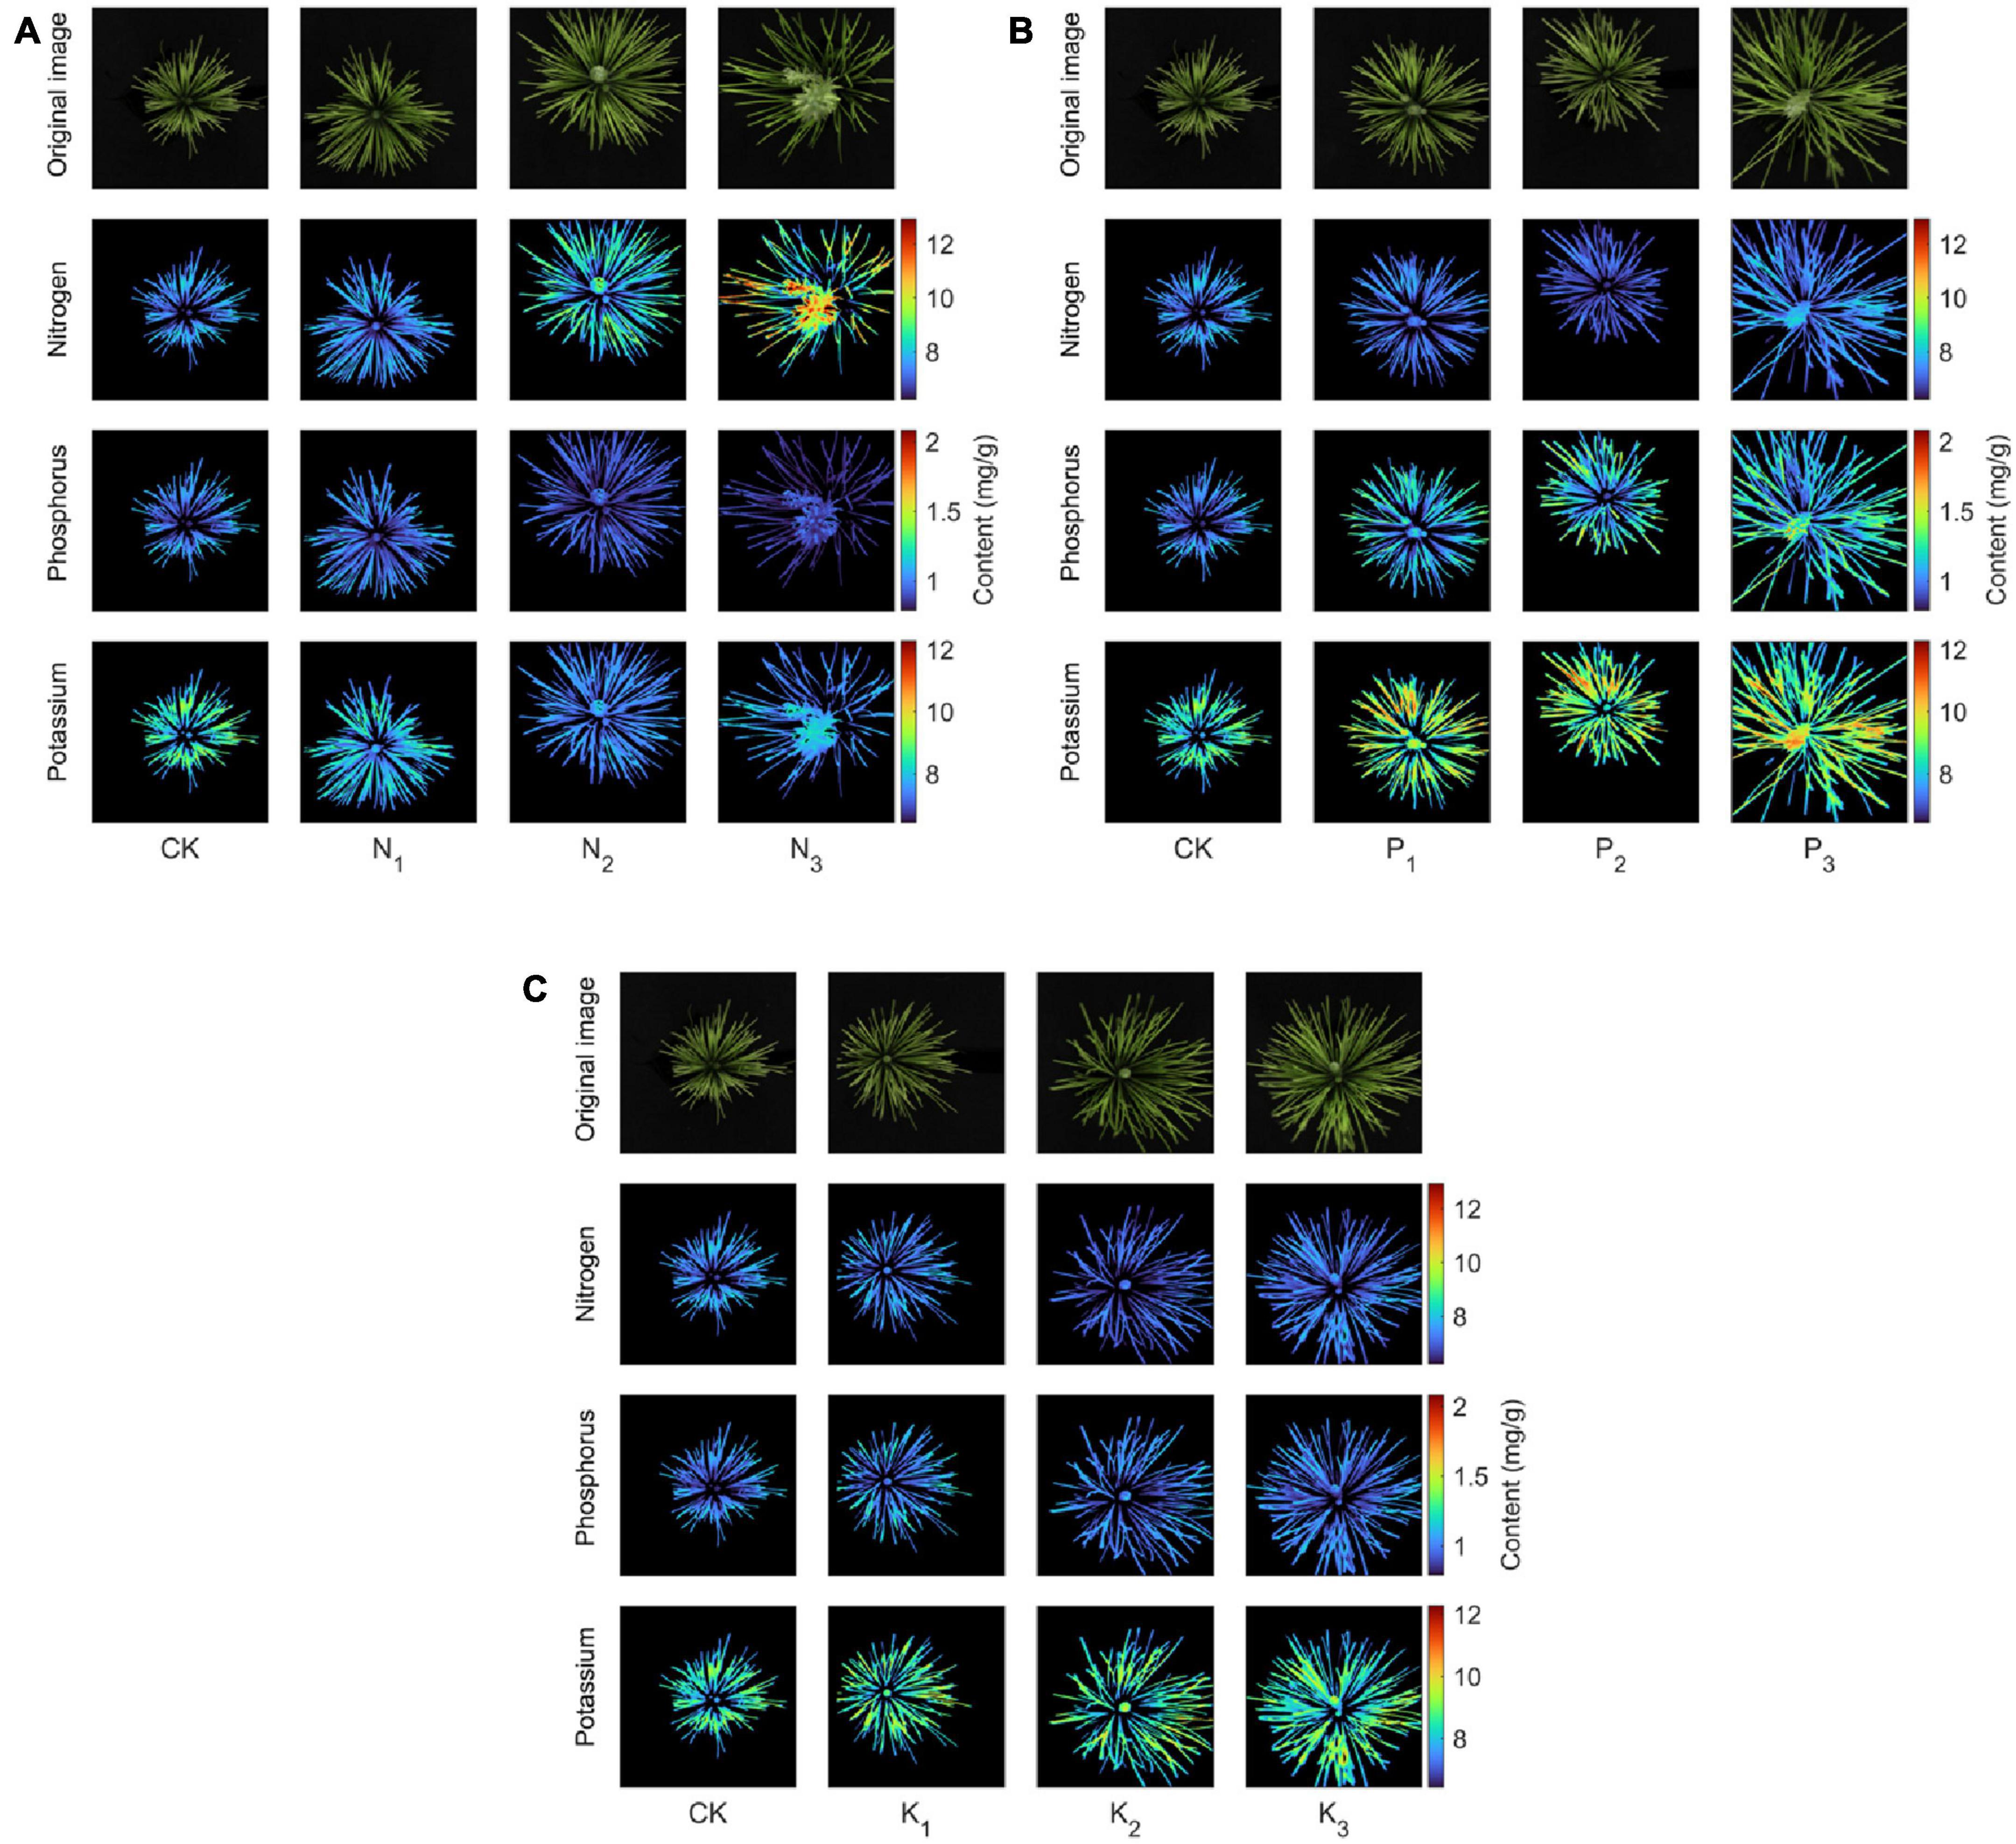
Figure 12. Heat map of the spatial distribution of nitrogen, phosphorus, and potassium contents in the coniferous leaves of the sapling canopy with nitrogen (A), phosphorus (B), and potassium (C) fertilizers applied.
First, in the canopy needles of the N group (Figure 12A), the red highlights in the heat map of nitrogen content in the saplings’ canopy increased with increasing nitrogen concentration. In contrast, the heat maps of phosphorus and potassium contents showed increasingly dim blue areas, especially between N2 (normal) and N3 (supersaturated) levels. This implies that the canopy nitrogen content in the N group increased significantly (CK–N2) with increasing nitrogen concentration. However, excessive nitrogen (N3) antagonized other nutrients in saplings, resulting in a significant decrease in phosphorus and potassium content. Secondly, in the canopy needles of the P group (Figure 12B), the red highlights in the heat map of phosphorus and potassium contents in the saplings’ canopy increased with increasing phosphorus concentration. This means that the application of phosphorus fertilizer to saplings increases both phosphorus and potassium contents. This is closely related to the ability of phosphorus to promote cell division during the early stage of sapling development. Phosphorus is mainly distributed in the root tip cells, whereas the growth of root tip cells can promote water absorption of saplings, and ionic potassium can move rapidly into the leaves, which can significantly increase the needle potassium content in the shoot canopy. Finally, in the canopy needles of the K group (Figure 12C), the highlighted part of the heat map of N, P, and K content in the canopy of saplings hardly changed with increasing potassium fertilizer concentration, implying that potassium application did not significantly promote the growth of saplings. This is because there is little difference in phosphorus content in the K group and phosphorus controls the root tip cell division, so saplings have the same ability to absorb potassium in the soil (Kou et al., 2016). In addition, potassium is poorly mobile in the soil, so the potassium content in the K group is almost unchanged and only a small amount of potassium is introduced into the plant through osmotic pressure.
In conclusion, the contents of N, P, and K in the sapling canopy were affected by three factors: (1) the method of application of N, P, and K fertilizer; (2) the effects of N, P, and K on sapling growth; and (3) the different forms of N, P, and K in saplings. First of all, nitrogen fertilizer had strong mobility in the soil and had a quick chasing effect. Therefore, only the shallow application was needed to penetrate the root distribution layer and be absorbed by saplings. However, potassium fertilizer was less mobile in the soil, and phosphorus fertilizer was even worse and had a slow fertilizer effect. Therefore, both methods needed to penetrate deep into the most widely distributed part of the sapling’s root system. Second, nitrogen was an important component of chlorophyll. The reflectivity of the wavelengths related to chlorophyll a and b changed significantly when the nitrogen content was altered. Phosphorus controlled the cell division in the root tips at the early stage of saplings and indirectly promoted the growth of saplings by facilitating the absorption of nitrogen. Potassium did not directly constitute organic compounds, but participated in some metabolic processes and played a regulatory role. It existed mainly in the ionic state and had great mobility in vivo. It was usually distributed in the most vigorous parts, such as buds, young leaves, and root tips.
Therefore, the content of macromolecules such as chlorophyll could be detected indirectly in needles by Vis-NIR hyperspectral imaging to detect the nitrogen content. However, phosphorus was mainly distributed in the root, and potassium mainly existed in the plant in an ionic state. The content of both was more difficult to detect, which led to weak reliability in predicting the content of phosphorus and potassium.
The purpose of this study was to explore the potential of Vis-NIR hyperspectral imaging in detecting nitrogen, phosphorus, and potassium content in the canopy needles of P. elliottii × P. caribaea saplings. The correlation coefficient method was used to remove 38 wavelengths at both ends, and MSC-CARS was used to extract the characteristic wavelengths related to nitrogen, phosphorus, and potassium from the full bands. Based on these characteristic wavelengths, several ensemble learning regression algorithms were compared. Among the prediction models for nitrogen, phosphorus, and potassium content, the MSC-CARS Stacking model performed the best (Rp2-N = 0.833, RMSEP = 0.380; Rp2-P = 0.622, RMSEP = 0.101; Rp2-K = 0.697, RMSEP = 0.523). The concentrations of nitrogen from 5.110 to 12.936 mg/g, phosphorus from 0.317 to 2.084 mg/g, and potassium from 4.40 to 12.55 mg/g can be accurately predicted.
This paper showed that the Vis-NIR hyperspectral imaging could be used for rapid and non-destructive nutritional diagnosis of P. elliottii × P. caribaea saplings because spectral information was related to the content of internal compounds composed of nutrient elements. In contrast to observing significant phenotypic changes, this technology could display the distribution of target nutrient content in organs and could continuously show the process of nutrient content changes. This indicates that hyperspectral imaging technology can be used as a screening tool to study physiological processes and functional expression of genes in plants. It can improve the accuracy of sampling location and timing of transcriptome and metabolome, thereby reducing the workload and cost of the experiment and obtaining more accurate experimental results.
The datasets presented in this study can be found in online repositories. The names of the repository/repositories and accession number(s) can be found below: https://github.com/LongTengshuai/visnir.
TLo and XC: experimental design, data curation, and writing. TLo and JL: data processing, formal analysis, and software. YLo, TLi, and JZ: conceptualization, methodology, and writing—review. XC: plant cultivation. WG: experimental design modification and funding acquisition. All authors read and agreed to the published version of the manuscript.
This study was funded by the Laboratory of Lingnan Modern Agriculture Project (No. NT2021009), Forestry Science and Technology Innovation Project of Guangdong Academy of Forestry (No. 2023KJCX018), and Key-Area Research and Development Program of Guangdong Province (No. 2020B020215001).
We thank Liu Yu for collecting data. We thank for their assistance with the spectral collection and nematode counting. We also thank Taishan Hongling Seed Orchard for providing and cultivating the seedings.
The authors declare that the research was conducted in the absence of any commercial or financial relationships that could be construed as a potential conflict of interest.
All claims expressed in this article are solely those of the authors and do not necessarily represent those of their affiliated organizations, or those of the publisher, the editors and the reviewers. Any product that may be evaluated in this article, or claim that may be made by its manufacturer, is not guaranteed or endorsed by the publisher.
Amigo, J. M. (2010). Practical issues of hyperspectral imaging analysis of solid dosage forms. Anal. Bioanal. Chem. 398, 93–109. doi: 10.1007/s00216-010-3828-z
Bian, M., Skidmore, A. K., Schlerf, M., Wang, T., Liu, Y., Zeng, R., et al. (2013). Predicting foliar biochemistry of tea (Camellia sinensis) using reflectance spectra measured at powder, leaf and canopy levels. ISPRS J. Photogramm. Remote Sens. 78, 148–156. doi: 10.1016/j.isprsjprs.2013.02.002
Chen, Y., Nguyen, T. H. N., Qin, J., Jiao, Y., Li, Z., Ding, S., et al. (2018). Phosphorus assimilation of Chinese fir from two provenances during acclimation to changing phosphorus availability. Environ. Exp. Bot. 153, 21–34. doi: 10.1016/j.envexpbot.2018.04.013
Cheng, J., Xu, Y., and Kong, L. (2021). Hyperspectral imaging classification based on LBP feature extraction and multimodel ensemble learning. Comput. Electr. Eng. 92:107199. doi: 10.1016/j.compeleceng.2021.107199
Dong, H., Kong, X., Li, W., Tang, W., and Zhang, D. (2010). Effects of plant density and nitrogen and potassium fertilization on cotton yield and uptake of major nutrients in two fields with varying fertility. Field Crops Res. 119, 106–113. doi: 10.1016/j.fcr.2010.06.019
Ferwerda, J. G., and Skidmore, A. K. (2007). Can nutrient status of four woody plant species be predicted using field spectrometry? ISPRS J. Photogramm. Remote Sens. 62, 406–414. doi: 10.1016/j.isprsjprs.2007.07.004
Gökkaya, K., Thomas, V., Noland, T., McCaughey, H., Morrison, I., and Treitz, P. (2015). Prediction of macronutrients at the canopy Level using spaceborne imaging spectroscopy and LiDAR data in a mixedwood boreal forest. Remote Sens. 7, 9045–9069. doi: 10.3390/rs70709045
Hasan, M. M., Sood, V., Erkinbaev, C., Paliwal, J., Suman, S., and Rodas-Gonzalez, A. (2021). Principal component analysis of lipid and protein oxidation products and their impact on color stability in bison longissimus lumborum and psoas major muscles. Meat Sci. 178:108523. doi: 10.1016/j.meatsci.2021.108523
Heo, S., Choi, J. Y., Kim, J., and Moon, K. D. (2021). Prediction of moisture content in steamed and dried purple sweet potato using hyperspectral imaging analysis. Food Sci. Biotechnol. 30, 783–791. doi: 10.1007/s10068-021-00921-z
Huang, H., Hu, X., Tian, J., Jiang, X., Luo, H., and Huang, D. (2021). Rapid detection of the reducing sugar and amino acid nitrogen contents of Daqu based on hyperspectral imaging. J. Food Compost. Anal. 101:103970. doi: 10.1016/j.jfca.2021.103970
Khan, F., Khan, S., Fahad, S., Faisal, S., Hussain, S., Ali, S., et al. (2014). Effect of different levels of nitrogen and phosphorus on the phenology and yield of maize varieties. Am. J. Plant Sci. 05, 2582–2590. doi: 10.4236/ajps.2014.517272
Kou, L., Wang, H., Gao, W., Chen, W., Yang, H., and Li, S. (2016). Nitrogen addition regulates tradeoff between root capture and foliar resorption of nitrogen and phosphorus in a subtropical pine plantation. Trees 31, 77–91. doi: 10.1007/s00468-016-1457-7
Laclau, J. P., Almeida, J. C., Goncalves, J. L., Saint-Andre, L., Ventura, M., Ranger, J., et al. (2009). Influence of nitrogen and potassium fertilization on leaf lifespan and allocation of above-ground growth in Eucalyptus plantations. Tree Physiol. 29, 111–124. doi: 10.1093/treephys/tpn010
Li, D., Wang, C., Jiang, H., Peng, Z., Yang, J., Su, Y., et al. (2018). Monitoring litchi canopy foliar phosphorus content using hyperspectral data. Comput. Electron. Agric. 154, 176–186. doi: 10.1016/j.compag.2018.09.007
Li, H., Liang, Y., Xu, Q., and Cao, D. (2009). Key wavelengths screening using competitive adaptive reweighted sampling method for multivariate calibration. Anal. Chim. Acta 648, 77–84. doi: 10.1016/j.aca.2009.06.046
Li, L., and Guo, S. (2021). A wavelength selection model based on successive projections algorithm for pH detection of water by VIS-NIR spectroscopy. J. Phys. Conf. Ser. 1813:012002. doi: 10.1088/1742-6596/1813/1/012002
Li, Y., Sun, H., Tomasetto, F., Jiang, J., and Luan, Q. (2022). Spectrometric prediction of nitrogen content in different tissues of Slash Pine trees. Plant Phenomics 2022:9892728. doi: 10.34133/2022/9892728
Liang, S.-Z., Shi, P., Ma, W.-D., Xing, Q.-G., and Yu, L.-J. (2010). Relational analysis of spectra and red-edge characteristics of plant leaf and leaf biochemical constituent. Chinese J. Ecoagric. 18, 804–809. doi: 10.3724/sp.J.1011.2010.00804
Liu, K., Li, L., and Luan, S. (2006). Intracellular K+ sensing of SKOR, a Shaker-type K+ channel from Arabidopsis. Plant J. 46, 260–268. doi: 10.1111/j.1365-313X.2006.02689.x
Liu, S., Yang, X., Guan, Q., Lu, Z., and Lu, J. (2020). An ensemble modeling framework for distinguishing nitrogen, phosphorous and potassium deficiencies in winter oilseed rape (Brassica napus L.) using hyperspectral data. Remote Sens. 12, 4060–4076. doi: 10.3390/rs12244060
Lu, W., Cai, M., Zhang, Q., and Li, S. (2021). Fast classification method of Black Goji Berry (Lycium Ruthenicum Murr.) based on hyperspectral and ensemble learning. Spectrosc. Spect. Anal. 41, 2196–2204. doi: 10.3964/j.issn.1000-0593202107-2196-09
Masaitis, G., Mozgeris, G., and Augustaitis, A. (2013). Spectral reflectance properties of healthy and stressed coniferous trees. Iforest 6, 30–36. doi: 10.3832/ifor0709-006
Peng, J., Manevski, K., Kørup, K., Larsen, R., and Andersen, M. N. (2021). Random forest regression results in accurate assessment of potato nitrogen status based on multispectral data from different platforms and the critical concentration approach. Field Crops Res. 268:108158. doi: 10.1016/j.fcr.2021.108158
Rinnan, Å, Berg, F. V. D., and Engelsen, S. B. (2009). Review of the most common pre-processing techniques for near-infrared spectra. Trends Anal. Chem. 28, 1201–1222. doi: 10.1016/j.trac.2009.07.007
Sanaeifar, A., Huang, X., Chen, M., Zhao, Z., Ji, Y., Li, X., et al. (2020). Nondestructive monitoring of polyphenols and caffeine during green tea processing using Vis-NIR spectroscopy. Food Sci. Nutr. 8, 5860–5874. doi: 10.1002/fsn3.1861
Schlerf, M., Atzberger, C., Hill, J., Buddenbaum, H., Werner, W., and Schüler, G. (2010). Retrieval of chlorophyll and nitrogen in Norway spruce (Picea abies L. Karst.) using imaging spectroscopy. Int. J. Appl. Earth Obs. Geoinf. 12, 17–26. doi: 10.1016/j.jag.2009.08.006
Taghizadeh, M., Gowen, A. A., and O’Donnell, C. P. (2011). The potential of visible-near infrared hyperspectral imaging to discriminate between casing soil, enzymatic browning and undamaged tissue on mushroom (Agaricus bisporus) surfaces. Comput. Electron. Agric. 77, 74–80. doi: 10.1016/j.compag.2011.03.010
Tian, X., Wang, J., Wen, Y., and Ma, H. (2022). Multi-attribute scientific documents retrieval and ranking model based on GBDT and LR. Math. Biosci. Eng. 19, 3748–3766. doi: 10.3934/mbe.2022172
Vanguelova, E. I., and Pitman, R. M. (2019). Nutrient and carbon cycling along nitrogen deposition gradients in broadleaf and conifer forest stands in the east of England. For. Ecol. Manag. 447, 180–194. doi: 10.1016/j.foreco.2019.05.040
Vidal, M., and Amigo, J. M. (2012). Pre-processing of hyperspectral images. Essential steps before image analysis. Chemometr. Intell. Lab. Syst. 117, 138–148. doi: 10.1016/j.chemolab.2012.05.009
Wan, F., Ross-Davis, A. L., Davis, A. S., Song, X., Chang, X., Zhang, J., et al. (2020). Nutrient retranslocation in Larix principis-rupprechtii Mayr relative to fertilization and irrigation. New For. 52, 69–88. doi: 10.1007/s11056-020-09783-5
Wang, M., Zheng, Q., Shen, Q., and Guo, S. (2013). The critical role of potassium in plant stress response. Int. J. Mol. Sci. 14, 7370–7390. doi: 10.3390/ijms14047370
Wang, Y.-J., Jin, G., Li, L.-Q., Liu, Y., Kianpoor Kalkhajeh, Y., Ning, J.-M., et al. (2020). NIR hyperspectral imaging coupled with chemometrics for nondestructive assessment of phosphorus and potassium contents in tea leaves. Infrared Phys. Technol. 108:103365. doi: 10.1016/j.infrared.2020.103365
William, L., Adam, R., Jeff, W., Henri, B., and David, J. L. (2019). Radial permeability of the hybrid pine (Pinus elliottii × Pinus caribaea) in Australia. Bioresourcess 14, 4358–4372. doi: 10.15376/biores.14.2.4358-4372
William, L., Maryam, S., Robert, L. M., Kerri, C., Mark, K., Lydia, K., et al. (2020). Influence of wood’s anatomical and resin traits on the radial permeability of the hybrid pine (Pinus elliottii × Pinus caribaea) wood in Australia. Bioresources 15, 6851–6873. doi: 10.15376/biores.15.3.6851-6873
Yang, H., Liu, T., Xu, B., Liu, C., Zhao, F., and Huang, S. (2015). QTL detection for growth and form traits in three full-sib pedigrees of Pinus elliottii var. elliottii × P. caribaea var. hondurensis hybrids. Tree Genet. Genomes 11:130. doi: 10.1007/s11295-015-0954-y
Yang, Z., Tian, J., Feng, K., Gong, X., and Liu, J. (2021). Application of a hyperspectral imaging system to quantify leaf-scale chlorophyll, nitrogen and chlorophyll fluorescence parameters in grapevine. Plant Physiol. Biochem. 166, 723–737. doi: 10.1016/j.plaphy.2021.06.015
Yuan, H. J., Ma, Q., Wu, G. Q., Wang, P., Hu, J., and Wang, S. M. (2015). ZxNHX controls Na(+) and K(+) homeostasis at the whole-plant level in Zygophyllum xanthoxylum through feedback regulation of the expression of genes involved in their transport. Ann. Bot. 115, 495–507. doi: 10.1093/aob/mcu177
Zhang, J., Xu, B., Feng, H., Jing, X., Wang, J., Ming, S., et al. (2022). Monitoring nitrogen nutrition and grain protein content in rice based on ensemble learning. Spectrosc. Spect. Anal. 42, 1956–1964. doi: 10.3964/j.issn.1000-0593202206-1956-09
Zhang, X., Liu, F., He, Y., and Gong, X. (2013). Detecting macronutrients content and distribution in oilseed rape leaves based on hyperspectral imaging. Biosyst. Eng. 115, 56–65. doi: 10.1016/j.biosystemseng.2013.02.007
Zhen, J., Jiang, X., Zhao, D., Wang, J., Miao, J., and Wu, G. (2022). Retrieving canopy nitrogen content of mangrove forests from Sentinel-2 super-resolution reconstruction data. Natl. Remote Sens. Bull. 26, 1206–1219. doi: 10.11834/jrs.20221461
Keywords: Pinus elliottii × P. caribaea sapling, canopy needles, nitrogen, phosphorus and potassium, hyperspectral imaging, ensemble learning
Citation: Long T, Che X, Guo W, Lan Y, Xie Z, Liu W, Lv J, Long Y, Liu T and Zhao J (2023) Visible-near-infrared hyperspectral imaging combined with ensemble learning for the nutrient content of Pinus elliottii × P. caribaea canopy needles detection. Front. For. Glob. Change 6:1203626. doi: 10.3389/ffgc.2023.1203626
Received: 11 April 2023; Accepted: 18 May 2023;
Published: 01 June 2023.
Edited by:
Yanjie Li, Chinese Academy of Forestry, ChinaReviewed by:
Guiping Jin, South China University of Technology, ChinaCopyright © 2023 Long, Che, Guo, Lan, Xie, Liu, Lv, Long, Liu and Zhao. This is an open-access article distributed under the terms of the Creative Commons Attribution License (CC BY). The use, distribution or reproduction in other forums is permitted, provided the original author(s) and the copyright owner(s) are credited and that the original publication in this journal is cited, in accordance with accepted academic practice. No use, distribution or reproduction is permitted which does not comply with these terms.
*Correspondence: Jing Zhao, emhhb2pzY2F1QDE2My5jb20=; Tianyi Liu, dGlhbnlpbGl1MDIwMkAxMjYuY29t; Yongbing Long, eW9uZ2Jpbmdsb25nQDEyNi5jb20=
†These authors have contributed equally to this work and share first authorship
Disclaimer: All claims expressed in this article are solely those of the authors and do not necessarily represent those of their affiliated organizations, or those of the publisher, the editors and the reviewers. Any product that may be evaluated in this article or claim that may be made by its manufacturer is not guaranteed or endorsed by the publisher.
Research integrity at Frontiers
Learn more about the work of our research integrity team to safeguard the quality of each article we publish.