 Yonghong Zhao
 Weijun Zhao3*
94% of researchers rate our articles as excellent or good
Learn more about the work of our research integrity team to safeguard the quality of each article we publish.
Find out more
ORIGINAL RESEARCH article
Front. For. Glob. Change, 10 July 2023
Sec. Forests and the Atmosphere
Volume 6 - 2023 | https://doi.org/10.3389/ffgc.2023.1193221
This article is part of the Research TopicDynamics of Asia's and Australasia's forests in a changing worldView all 22 articles
Analyzing the physiological response of trees to climate change in the Qilian Mountains region is key to studying the impact of global change on forest ecosystems in the semiarid alpine region of Northwest China. The leaf area index (LAI) of the canopy of a forest is an important input parameter for simulating carbon and water cycles in forest ecosystems. Studying the relationship between LAI and environmental factors can provide a scientific basis for accurately describing the structure, function, and ecohydrological processes of forest ecosystems and theoretically guide for sustainable management of water conservation in forests. Methods: In this study, the LAI of the Picea crassifolia canopy was monitored for 2 years (2015–2016) by field observations, and its dynamic changes were analyzed. The relations between LAI and air temperature (AT), precipitation (P), soil temperature (ST), and soil water content (SWC) were studied using Pearson's correlation and multiple regression analyses. The results were as follows: seasonal variations in LAI showed a single-peak curve, which first increased, reached a maximum, remained relatively stable, and then decreased. The maximum value was 4.02 and 4.18 relatively observed in mid-August 2015 and 2016. The LAI of the P. crassifolia canopy in different months was positively correlated with AT and P. It was correlated between the LAI of the canopy with ST40−60 in May and June (p < 0.05) and was also highly positively correlated between the LAI of the canopy with ST60−80, STmean, and SWC60−80 in July and August (p < 0.01). There was a positive correlation between the LAI of the canopy with SWC0−60 and SWCmean in July and SWC0−60 and SWCmean in August (p < 0.05). The LAI of the canopy was affected by AT and ST in May and July, AT and P in June, P in August, and P and ST in September. Our study implied that the rapid increase period of the LAI of the canopy was from late May to early July. The LAI of the canopy was more influenced by temperature and water in July and August. In addition, the LAI of the canopy has significant seasonal variation although it is evergreen coniferous tree species.
Leaf area index (LAI), the ratio of the surface area of a plant leaf to the surface area of land LAI, is used to quantitatively describe changes in leaf growth and density at the community level (Watson, 1958). LAI is an important input parameter for simulating the carbon and water cycles in forest ecosystems (Weiss et al., 2004; Wang et al., 2005); (Bequet et al., 2011) and is the key factor in explaining the variation in the net primary productivity of aboveground vegetation (Leuschner et al., 2006; Kinane et al., 2022), which is an important factor in describing the structural characteristics of forest canopies. It controls many physiological and ecological processes within forest ecosystems, such as plant photosynthesis and transpiration, canopy interception of precipitation, and exchange of matter and energy between the atmosphere and canopy (Dermody et al., 2006; Liu et al., 2013). LAI is closely related to ecological processes in forests, and accurate determination of seasonal changes in LAI is conducive to simulating the response of vegetation to climate change and predicting forest growth status (Liu, 2015). LAI plays an important role in studying energy cycles of the ecosystem at the forest stand, landscape, and regional scales.
At present, the methods to measure forest LAI include the indirect measurement method and the direct measurement method (Bréda, 2003; Cerný et al., 2020). The former is simple and convenient; however, its accuracy of measurement must be calibrated. However, some optical instrument methods based on radiometric measurements need to assume uniform canopy, random leaf distribution, and elliptical leaf angle distribution, such as LAI-2000, while Tracing Radiation and Architecture of Canopies (TRAC) can effectively address the agglomeration effect by measuring the agglomeration index and without needing to assume a random leaf distribution in space (Chen, 1996; Zhao et al., 2009a; Behera et al., 2010; Cerný et al., 2020). The latter technology is mature and accurate, and its measured value is usually considered a real LAI; however, it is time-consuming, laborious, and destructive (Yan et al., 2019; Cerný et al., 2020; Fang, 2021). Optical instruments mainly include digital hemispherical photography, LAI-2000/2200 plant canopy analyzer, TRAC, CI-110 LICOR DEMON, and other equipment, among which digital hemispherical photography and LAI-2200 plant canopy analyzer are widely used to simultaneously observe the structural parameters of the canopy at different zenith angles (Behling et al., 2016; Fang et al., 2021). Direct measurement methods mainly include the destructive sampling method (Chason et al., 1991), the allometric growth equation method (Vyas et al., 2010), the oblique point sampling method (Wilson, 1960), and the litter method (Sprintsin et al., 2011).
The leaf area index is affected by several factors and exhibits varying degrees of temporal and spatial heterogeneity (Luo et al., 2011). The relationship between LAI and climatic factors (temperature, precipitation, and soil moisture) can efficiently reflect the interactions between vegetation and the environment and is suitable for studying the ecohydrological processes under climate change (Huang et al., 2016; Karimi et al., 2020; Kinane et al., 2022). Li et al. (2012) used a simple biological model, the SiB2 method, to calculate LAI and to study the annual and interannual variations in different vegetation cover types of LAI in the Poyang Lake Basin and their relation with precipitation and air temperature (AT). They highlighted that the responses of LAI to precipitation and air temperature have, respectively, a time lag of 3 months and 1 month in the annual variation, and the interannual variation of LAI is mainly affected by the precipitation between May and July (Li et al., 2012). Wang et al. (2008) analyzed the influence of hydrothermal conditions on vegetation LAI in the Qinghai–Tibet Plateau at temporal and spatial scales using remote sensing data and showed that LAI is correlated with temperature, soil moisture, and precipitation. Shao and Zeng (2011) compared potential LAI simulated by the dynamic vegetation model (CLM3.0-DGVM) with LAI derived from moderate-resolution imaging spectroradiometer (MODIS) and analyzed the spatial and temporal relations between LAI of different plant functional types on the current different types and climatic factors on the interannual scale. In addition, studies on Hippophae rhamnoides Linn and Caragana intermedia on the Loess Plateau indicated that LAI increased rapidly when precipitation and the water supply were sufficient, leading to a significant increase in the total amount of transpiration (Guo et al., 2007). However, an analysis of the US East Texas Pinus taeda stand canopy showed no significant relation between LAI and actual evapotranspiration (r2 = 0.06) (Hebert and Jack, 1998), and plants from different biomes tended to grow relatively small leaves in arid environments to reduce the total leaf area, thereby reducing transpiration (Meier and Leuschner, 2008). In general, the main factors affecting vegetation LAI are temperature, water, and species.
Several studies have been conducted on vegetation LAI measurement methods and dynamic spatial and temporal (seasonal and interannual dynamics) changes in LAI; however, the relation between vegetation LAI and hydrothermal factors is not well understood. In particular, the relations between LAI of P. crassifolia, soil temperature (ST), and soil water content (SWC) in the Qilian Mountains of Northwest China are largely unexplored. Therefore, this study investigated the influence of hydrothermal factors on coniferous forest canopies in the semiarid alpine region of Northwest China. We monitored air temperature(AT), precipitation, ST, and SWC in the study area from 2015 to 2016 in this study. The objectives of this study are as follows: (1) to observe accurate monthly LAI dynamics using an LAI-2200C in coniferous stands; (2) to estimate the maximum stand LAI within the growing season indirectly using an LAI-2200C; and (3) to study the relation between LAI and AT, P, ST, and SWC in the Qilian Mountains.
The study area is located in the Xishui Forest Area of the Qilian Mountains Natural Reserve. The geographical coordinates are approximately between 38°32′-38°33′ N and 100°17′-100°18′ E. These areas have the climate of alpine mountain forest grassland, with an annual P of 290–468 mm. The rainy season is mainly distributed from May to September, accounting for ~85% of annual P. The climatic characteristics were an average annual evaporation capacity of 1,082.7 mm, an annual average temperature of −0.6 to 2.1°C, and an annual average sunshine of 1,895 h. The average daily solar radiation intensity in 2015 and 2016 was 79.2 W·m−2·d−1.
P. crassifolia is distributed in patches on shady and semi-shady slopes at altitudes of 2,500–3,300 m. The sunny slope is dominated by grasslands with scattered Sabina przewalskii and shrubs. The herbs mainly include Carex lancifolia, Stipa purpurea, Agropyron cristatum, Leontopodium longifolium, Taraxacum monogolicum, Potentilla bifurca, and Pedicularis. The shrubs in the basin mainly include alpine shrubs such as Caragana tangutica and Berberis diaphana Maxin. Under the forest, moss is more developed; however, a few species, mainly Abietinella abietina, are scattered with Bryoerythrophyllum tecurvirestrum and Tortula longimcronata.
Three pure forest sample plots with P. crassifolia (25 ×25 m) were selected to observe the LAI of P. crassifolia in the study area in the growing season from May to October in 2015 and 2016 at an altitude of 2,700 m (38°33′14.8″ N, 100°17′5.4″ E). The selected plots were pure forests containing P. crassifolia, which originated from a natural secondary forest belonging to semi-mature forests. The horizontal distance between the three sample plots was ~50 m. Height and diameter at the breast of all trees with a diameter at breast height > 5 cm were measured with a wooden ruler in the sample plots during the stable growth period in 2016. The surveyed parameters included tree height, diameter at breast height, crown width, canopy closure, and forest age.
An LAI-2200C plant canopy analyzer (LICOR, Lincoln, Nebraska, USA) was used to measure the canopy LAI of P. crassifolia sample plots every 10 days from May to October in 2015 and 2016. The measurement frequency was appropriately increased because of the rapid growth and change in the new branches of P. crassifolia at the beginning of the growing season, which means, the LAI of P. crassifolia canopy was measured every 6 days in May. A total of 25 points were measured in each sample plot according to a fixed S-shaped route, and the average value was taken as the characteristic LAI of the canopy layer of the sample plot. To ensure that the canopy layer outside the sample plot was not detected, the distance from the observation point to the upper and lower edges of the sample plot was 3 m (slope length), and the left and right edges were 2.5 m each. Two LAI-2200C plant canopy analyzers were used for synchronous and accurate measurement; one was placed in an open space outside the forest to measure the A value, and the other was placed in the sample plot to measure the value under the canopy (B value). A camera (D80, Nikon) was used to obtain hemispherical images of the vegetation canopy and to calculate the LAI of the forest canopy (Chen, 1996; Zhao et al., 2009a).
We used an automatic weather station (Campbell Scientific, Inc., Logan, Utah, USA) above 15 m height in the third sample plot to continuously obtain the data of P (P/mm) with a rain gauge (TE525MM, Campbell Sci., Logan, USA), solar radiation intensity (Rs/w·m−2) with a solar radiation sensor (Li200X, LICOR, Lincoln, Nebraska, USA), AT (T/°C) with a temperature sensor (HMP115A, Campbell Sci., Logan, USA), and relative humidity of the air (RH/%) with a humidity sensor (HMP45A, Campbell Sci., Logan, USA). The interval of data collection was 10 min.
A HOBO U30 sensor (Campbell Scientific, Inc. Logan, Utah, USA) was installed in 0–10, 10–20, 20–40, 40–60, and 60–80 cm soil layers in each different sample plot to monitor ST (°C) and SWC (m3·m−3). The interval of data collection was 30 min.
A correction coefficient was required to adjust the measured LAI, which was low owing to the clustering effect of the coniferous forest. The measured LAI value used to calculate the correction coefficient was 0.996 (Le). The aggregation coefficient (ΩE) of P. crassifolia forest was 0.93 measured by Tracing Radiation and Architecture of Canopies (TRAC, Canada Center For Remote Sensing, Ottawa, Canada) (Zhao et al., 2009a), and the adjustment coefficient was calculated according to formula (1):
where Le is the effective LAI (acquired by instrumental observation), γE is the ratio of the total area of coniferous leaves to the cluster area, the conifer species is 1.4, and α, the ratio of non-leaf factors, such as the trunk, to total leaf area, was 0.12 (Chen, 1996). The adjustment coefficient was calculated as 1.32, which was multiplied by LAI measured by the LAI−2000C canopy analyzer to adjust the canopy LAI value according to formula (1).
Data were plotted using R version 4.2.1 software (AT&T Bell Laboratories, New Jersey, USA) and WPS Office 2021(Kingsoft, Beijing, PRC). The relations between LAI of P. crassifolia and P, AT, ST, and SWC were analyzed using SPSS v.21.0 (SPSS Inc., Chicago, IL, USA) with Pearson correlation. Multiple stepwise linear regressions were used to examine the relation of LAI with hydrothermal factors. The multiple linear regression model mainly studies the relationship between a dependent variable and multiple independent variables, and its general form can be expressed as formula (2):
where y is the dependent variable, x is the independent variable, β1, ... βk are model parameters, and ε is Stochastic error. In this study, LAI is used as the dependent variable, and AT, P, ST, and SWC are used as independent variables to explore the relationship between them through this model.
Figure 1 shows that the thermal and water of three sample plots in the study site were synchronization. P and high temperature were all concentrated in the growing season (May to September). The maximum monthly P was 97.4 and 103.3 mm, respectively, in July 2015 and September 2016. The maximum monthly average AT was 13.7 and 21.8°C, respectively, in July 2015 and July 2016. The maximum monthly average ST was 8.5 and 8.6°C, respectively, in August 2015 and August 2016. The maximum monthly average SWC was 0.16 and 0.15, respectively, in October 2015 and October 2016.
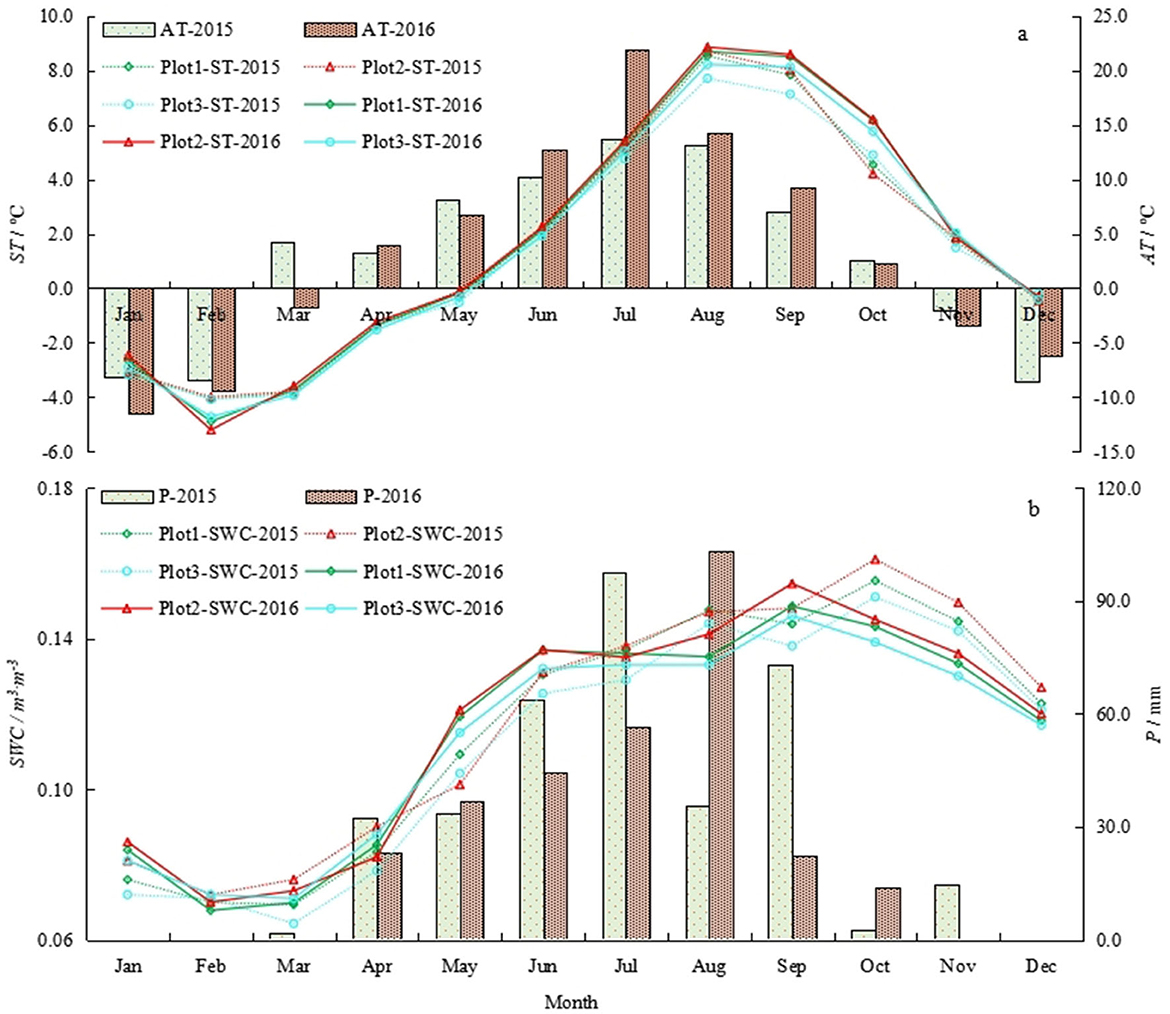
Figure 1. (a, b) Monthly average ST, AT, P, and SWC of three sample plots in 2015 and 2016.
As shown in Figure 2, the LAI of P. crassifolia in the three sample plots initially increased and then decreased during the two growth seasons (from May to September) in 2015 and 2016. The period from late May to early July was characterized by the rapid growth of LAI. Several withered and yellow coniferous leaves fell off in September, even though P. crassifolia is an evergreen coniferous forest, and LAI started decreasing. According to our field observations, over 2 consecutive years, these fallen leaves were old perennial or diseased withered leaves. In addition, the average, minimum, and maximum LAI values of the 1# sample plot were 3.39, 2.57, and 3.99, respectively. The average, minimum, and maximum LAI values of the 2# sample plot were 3.51, 2.73, and 4.10, respectively. The average, minimum, and maximum LAI values of the 3# sample plot were 3.17, 2.37, and 3.84, respectively. The LAI of the 1# and 2# sample plots was similar and higher than the LAI of the 3# sample plot. This result is consistent with the surveyed parameters summarized in Table 1.
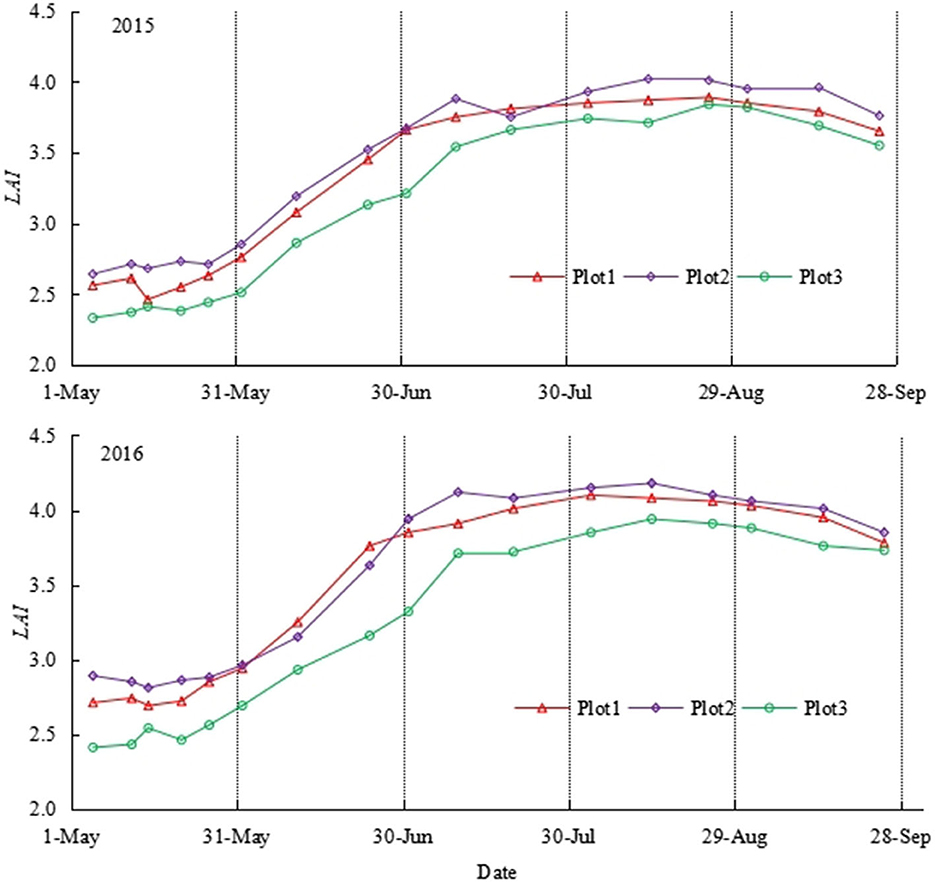
Figure 2. Seasonal variation of monthly average LAI in different sample plots in 2015 and 2016.
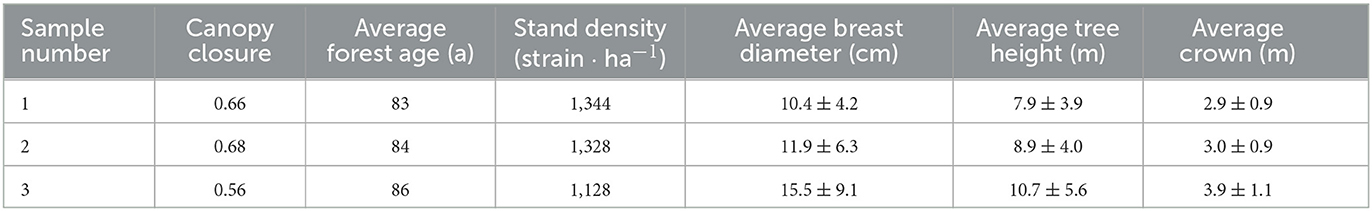
Table 1. Investigation of sample sites.
Table 2 shows the results of the Pearson correlation analysis between the LAI of P. crassifolia and AT. LAI was positively correlated with AT, and a significant positive correlation (p < 0.05) was observed between LAI and AT during July–August 2015. LAI was positively correlated with AT in July and August of 2016 (p < 0.05).
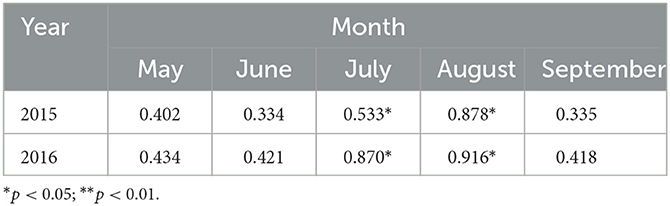
Table 2. Pearson's correlation coefficient between LAI and AT in 2015 and 2016.
As shown in Figure 3, P. crassifolia LAI was positively correlated with ST in 2015 and 2016. In 2015, LAI was correlated with ST0−40 and STmean in May, ST0−20 and STmean in June, and ST0−80 and STmean in September (p > 0.05). It was positively correlated with ST40−80 in May, ST20−80 in June, ST0−60 and STmean in July, and ST0−60 and STmean in August (p < 0.05). It was significantly positively correlated with ST60−80 in July and August (p < 0.01). In 2016, LAI was correlated with ST0−20 and STmean in May and June, and ST0−80 and STmean in September (p > 0.05). It was positively correlated with ST20−80 in May and July and ST0−80 in July and August (p < 0.05). It was significantly positively correlated with STmean in July and August (p < 0.01).
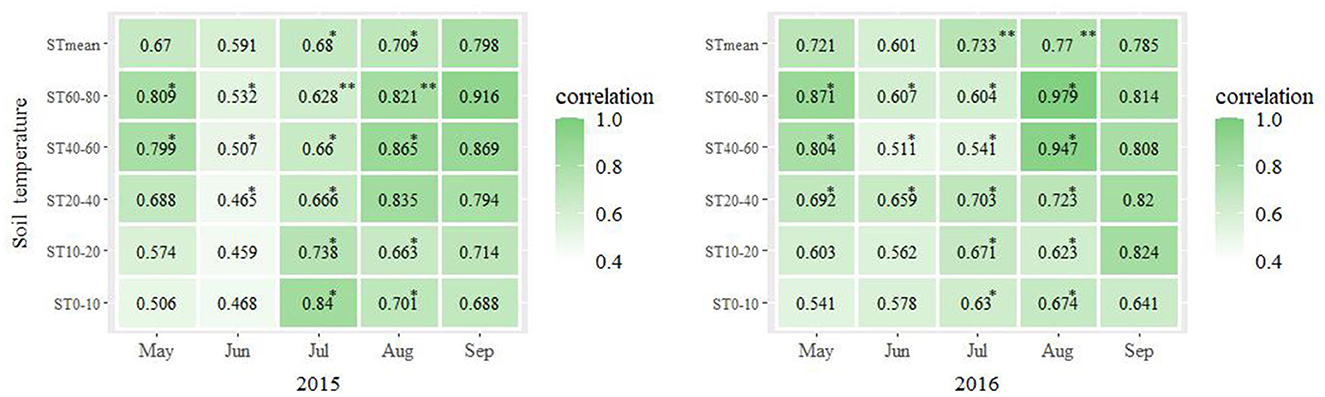
Figure 3. Pearson's coefficient of correlation between the monthly average LAI and monthly average ST across the three plots calculated for each month of the years 2015 and 2016. *p < 0.05; **p < 0.01.
The results in Table 3 show that the relation between the LAI of P. crassifolia and P in 2015 was consistent with that of 2016. P. crassifolia LAI was correlated (p > 0.05) with P in May 2015 and 2016. It was positively correlated (p < 0.05) with P in June, July, and August. It was negatively correlated (p > 0.05) with P in September. The rainfall distribution showed a large amount of P in July and August, during which the values of LAI were relatively larger. The maximum LAI was 4.02 and 4.18, respectively, which appeared in August 2015 and 2016.
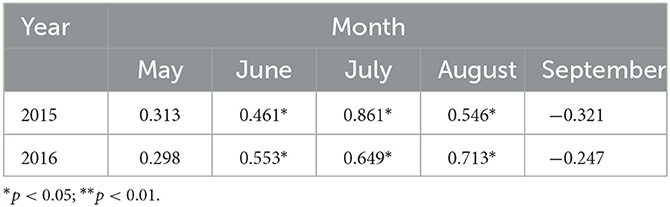
Table 3. Pearson's correlation coefficient between LAI and P in 2015 and 2016.
The results of a Pearson correlation analysis between the LAI of P. crassifolia and SWC in different soil layers are presented in Figure 4. The LAI of P. crassifolia was correlated with SWC, which was different between months. In 2015, it was correlated with SWC0−10, SWC20−80, and SWCmean in May, SWC0−80 and SWCmean in June, and SWC0−80 and SWCmean in September (p > 0.05). It was positively correlated with SWC0−80 and SWCmean in July and August (p < 0.05). It was negatively correlated with SWC10−20 in May (p > 0.05). In 2016, the LAI of P. crassifolia was correlated with SWC0−20, SWC40−80, and SWCmean in May, SWC0−80 and SWCmean in June, and SWC0−40, SWC60−80, and SWCmean in September (p > 0.05). It was positively correlated with SWC0−60 and SWCmean in July and SWC0−60 and SWCmean in August (p < 0.05). It was significantly positively correlated with SWC60−80 in July and August (p < 0.01). It was negatively correlated with SWC20−40 in May and SWC40−60 in September (p > 0.05).
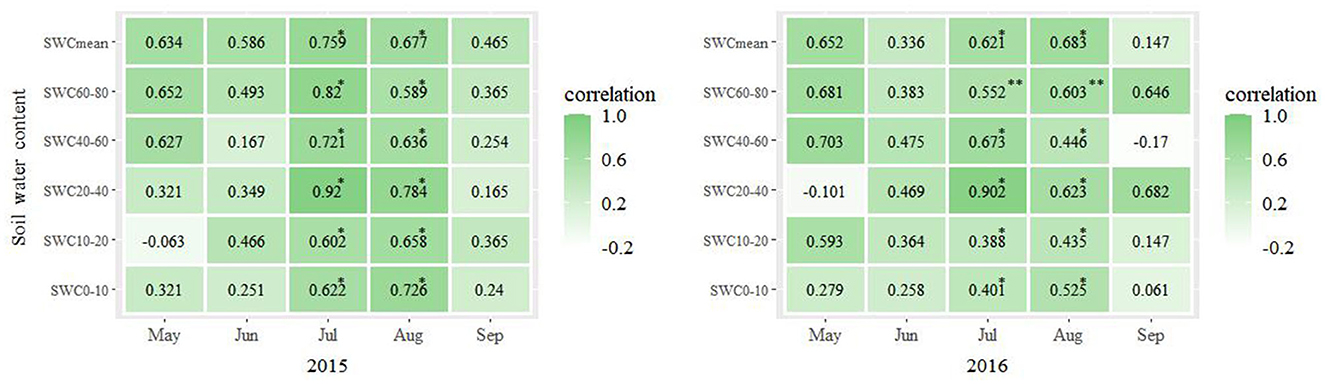
Figure 4. Pearson's coefficient of correlation between the monthly average LAI and monthly average SWC across the three plots calculated for each month of the years 2015 and 2016. *p < 0.05; **p < 0.01.
Multiple linear regression analysis was performed between the LAI of P. crassifolia and AT, P, ST, and SWC during different months of the growing season in 2015 and 2016. The results of the multiple linear regression equations are presented in Table 4. The multiple linear regression model fits the relations between LAI and AT, P, ST, and SWC. The model passed this test and was statistically significant.

Table 4. Multiple linear regression models of LAI with hydrothermal factors in 2015 and 2016.
The leaf area index was affected by AT and ST in May 2015 and 2016. AT and P mainly affected LAI in June 2015 and 2016. LAI was affected by AT, ST, and SWC in July 2015 but was affected by AT and ST in July 2016. LAI was affected by P and ST in August 2015 but was affected by AT, P, and SWC in August 2016. LAI was affected by P, ST, and SWC in September 2015 but was affected by P and ST in September 2016. On a monthly average, AT increased by 1°C and LAI changed by 2.30. P increased by 1 mm, and LAI changed by 5.39. ST increased by 1°C, and LAI changed by 3.18. SWC increased by 1, and LAI changed by 5.24. Overall, the main hydrothermal factors affecting the canopy LAI of P. crassifolia differed in July, August, and September.
Canopy LAI often shows highly complex temporal and spatial variations (Zhao et al., 2009b; Liu et al., 2017), even in pure forests of the same age with a single stand structure (Bequet et al., 2012) because of many common environmental factors, such as forest structure, soil factors (moisture and physical and chemical properties), topographical factors (altitude, slope, and aspect) (Bequet et al., 2011; Kinane et al., 2022), and meteorological conditions (Luo et al., 2011; Li et al., 2012). Therefore, attention has been paid to temporal variations in the canopy LAI of different vegetation types in different regions.
Our study showed that LAI of P. crassifolia exhibited significant seasonal variation. LAI reached its maximum value in early August and slightly declined during late September. The large number of new shoots of P. crassifolia caused LAI to increase in the early growing season, and the fallen leaves led to a slight decrease in LAI throughout the growing season. LAI in 2016 was slightly larger than that in 2015, which may be because the newly accumulated branches contributed to certain LAI based on our field observations. Our study suggests that the LAI of evergreen coniferous forests shows significant seasonal variation.
The annual and interannual variations in pure oak forest LAI were studied in the Champenoux forest in France. The results showed that oak LAI increased with the growth of new branches at the beginning of the annual growth season; however, the interannual changes were not significant (Bréda and Granier, 1996). The annual and interannual dynamics of vegetation LAI were also analyzed using the simple biosphere model (SiB2) method for the Poyang Lake Basin. The results showed that overall LAI of different vegetation cover types did not increase or decrease for 20 years but showed an alternating increasing or decreasing trend every 2–3 years, and the variation of evergreen coniferous forest LAI was significant (Li et al., 2012), which was consistent with our study. A seasonal dynamic study in the Liupan Mountains of North China showed that larch LAI increased linearly with an increase in canopy density, and the change in LAI in the growing season presented a single-peak curve (Han et al., 2015).
As three sample plots were selected at the same altitude and slope, only the seasonal variation in the canopy LAI of P. crassifolia was studied. However, the spatial distribution of canopy LAI of P. crassifolia in the Qilian Mountains has been studied. The results showed that the LAI of P. crassifolia initially increased and then decreased with altitude in the Tianlaochi Basin of Sidalong Forestland in the Qilian Mountains because the limiting factors for the growth of P. crassifolia are mainly controlled by water at the low altitude and by the temperature at the high altitude (Zhao et al., 2009b). The spatial variability of canopy LAI in dark coniferous forests has also been studied in subalpine western Sichuan. The results indicated that altitude is an important factor affecting LAI. The difference in LAI between different altitude gradients is extremely significant, and the LAI of subalpine dark coniferous forests in western Sichuan increases with altitude (Lǔ et al., 2007). Analysis of the variogram of fir forest LAI in the Daxing'an Mountains showed that LAI depended on the spatial heterogeneity of months. The spatial heterogeneity of LAI in July and November was mainly induced by spatial autocorrelation and accounted for 99.8% and 66.9% of the total spatial heterogeneity, respectively (Liu et al., 2013).
The response of vegetation to hydrothermal conditions is a key process in understanding the terrestrial carbon–water cycle, and attention has been paid to the relationship between vegetation LAI and environmental factors (Hebert and Jack, 1998; Meier and Leuschner, 2008; Luo et al., 2011; Shao and Zeng, 2011).
The leaf area index of the different vegetation types was highly correlated with P in the preceding 3 months and with an average temperature in the preceding 1 month in the Poyanghu Basin, and both of them were 95% significant. Interannual changes in LAI of different vegetation types were highly influenced by interannual changes in P in the Poyanghu Basin from May to July (Li et al., 2012). P mainly affected the seasonal variation in LAI, as was noticed by studying the relation between LAI and climatic factors in a Quercus variabilis plantation at the southern foot of Taihang Mountain between 2001 and 2019 (Huang et al., 2022). The LAI of beech has been found to be mainly controlled by physiological factors related to forest age, while the effects of chemical properties of soil and P are relatively low (Bequet et al., 2011). The CMIP5 model was used to study the response of LAI to drought, and LAI showed irregular increases and decreases with decreasing soil water content (Huang et al., 2016).
Our study implied that the LAI of P. crassifolia was positively correlated with P and highly positively correlated with SWC60−80. This may be related to the root distribution of P. crassifolia. LAI was negatively correlated with P in September, probably because of the decrease in P in September in the alpine region.
Leaf area index data from remote sensing were used to study the response of global vegetation LAI to temperature, which indicated that the season and interannual changes in temperature on a global scale were significantly different in different ecosystems (Zhang et al., 2002). The effect of the slope scale on the LAI of Larix principis-rupprechtii was studied in the small basin of Liupan Mountain, which showed that the main influencing factors in May were solar radiation and air temperature (Wang et al., 2016; Liu et al., 2017). The monthly maximum temperature was found to be the most influential factor in the dynamics of LAI in loblolly pine plantations (Kinane et al., 2022). The correlation between LAI and hydrothermal conditions was positive on a time scale and a spatial scale in most regions on the Tibetan Plateau (Wang et al., 2008).
Our study implies that LAI is influenced more by temperature and water in July and August in alpine Northwest China. Therefore, an accurate understanding of the temporal and spatial variability of forest canopy LAI is highly significant for evaluating forest productivity at multiple scales and for studying the energy and water balance from the basin to the region.
The rapidly increasing period of LAI of P. crassifolia canopy was from late May to early July. The maximum LAI of P. crassifolia occurred in mid-August. LAI of P. crassifolia forests also has significant seasonal variation although it is an evergreen coniferous tree species. The main hydrothermal factors affecting the canopy LAI of P. crassifolia differed in July, August, and September. The LAI of P. crassifolia was more influenced by temperature and water in July and August. The LAI-2200 and TRAC methods are valid for measuring the LAI of P. crassifolia canopy forests. This study may provide a scientific basis for studying the impact of global change on forest ecosystems.
The raw data supporting the conclusions of this article will be made available by the authors, without undue reservation.
YZ and WZ contributed to the conception and design of the study. WZ wrote sections of the manuscript. YZ and HF organized the database and performed the statistical analysis. YZ wrote and revised the first draft of the manuscript. All authors approved the submitted version.
This study was financially supported by the National Natural Science Foundation of China (91425301 and 32060247) and the central government of Gansu province guides local science and Technology Development Fund projects (22ZY2QG001).
We thank Jian Ma, Shunli Wang, Liying Chen, Hui Zhang, and Kehai Zhang for supporting our field observations. Rongxin Wang for data acquisition and two independent reviewers' comments for improving our manuscript.
The authors declare that the research was conducted in the absence of any commercial or financial relationships that could be construed as a potential conflict of interest.
All claims expressed in this article are solely those of the authors and do not necessarily represent those of their affiliated organizations, or those of the publisher, the editors and the reviewers. Any product that may be evaluated in this article, or claim that may be made by its manufacturer, is not guaranteed or endorsed by the publisher.
Behera, S. K., Srivastava, P., Pathre, U. V., and Tuli, R. (2010). An indirect method of estimating leaf area index in Jatropha curcas L. using LAI-2000 Plant Canopy Analyzer. Agric. For. Meteorol. 150, 307–311. doi: 10.1016/j.agrformet.2009.11.009
Behling, A., Sanquetta, C. R., Corte, A. D., Netto, S. P., Rodrigues, A. L., Caron, B. O., et al. (2016). Tracking leaf area index and coefficient of light extinction over the harvesting cycle of black wattle. J. For. Res. 27, 1–7. doi: 10.1007/s11676-016-0279-1
Bequet, R., Campioli, M., Kint, V., Muys, V., Bogaert, J., and Ceulemans, R. (2012). Spatial variability of leaf area index in homogeneous forests relates to local variation in tree characteristics. For. Sci. 58, 633–640. doi: 10.5849/forsci.10-123
Bequet, R., Campioli, M., Kint, V., Vansteenkiste, D., Muys, B., and Ceulemans, R. (2011). Leaf area index development in temperate oak and beech forests is driven by stand characteristics and weather conditions. Trees Struct. Funct. 25, 935–946. doi: 10.1007/s00468-011-0568-4
Bréda, N. J. (2003). Ground-based measurements of leaf area index: a review of methods, instruments and current controversies. J. Exp. Bot. 54, 2403–2417. doi: 10.1093/jxb/erg263
Bréda, N. J., and Granier, A. (1996). Intra-and interannual variations of transpiration, leaf area index and radial growth of a sessile oak stand(Quercus petraea). Ann. For. Sci. 53, 521–536. doi: 10.1051/forest:19960232
Cerný, J., Haninec, P., and Pokorný, R. (2020). Leaf area index estimated by direct, semi-direct, and indirect methods in European beech and sycamore maple stands. J. For. Res. 31, 827–836. doi: 10.1007/s11676-018-0809-0
Chason, J. W., Baldocchib, D. D., and Huston, M. A. (1991). A comparison of direct and indirect methods for estimating forest canopy leaf area. Agric. For. Meteorol. 57, 107–128. doi: 10.1016/0168-1923(91)90081-Z
Chen, J. M. (1996). Optically-based methods for measuring seasonal variation of leaf area index in boreal conifer stands. Agric. For. Meteorol. 80, 135–163. doi: 10.1016/0168-1923(95)02291-0
Dermody, O., Long, S. P., and Delucia, E. H. (2006). How does elevated CO2 or ozone affect the leaf-area index of soybean when applied independently? New. Phytol. 169, 145. doi: 10.1111/j.1469-8137.2005.01565.x
Fang, H. L. (2021). Advances in measurement and remote sensing of forest vertical structure parameters: a case study of leaf area index and aggregation index. Chin. Sci. Bull. 66, 3141–3153. doi: 10.1360/TB-2020-1057
Fang, H. L., Baret, F., Plummer, S., and Schaepman-Strub, G. (2021). An overview of global leaf area index (LAI): methods, products, validation, and applications. Rev. Geophys. 57, 739–799. doi: 10.1029/2018RG000608
Guo, W. H., Li, B., Zhang, X. S., and Wang, R. Q. (2007). The impact of water stress on transpiration indices in Hippophae rhamnoides and Caragana intermedia. Acta. Ecol. Sin. 27, 4132–4140. doi: 10.3321/j.issn:1000-0933.2007.10.021
Han, X. S., Deng, L. L., Wang, Y. H., Xiong, W., Li, Z. H., Liu, Q., et al. (2015). Variation of aboveground biomass Larix principis-rupprechtii plantation along slopes in the Diediegou basin of Liupan Mountains. Scientia Silvae Sinicae. 51:132–139. doi: 10.11707/j.1001-7488.20150317
Hebert, M. T., and Jack, S. B. (1998). Leaf area index and site water balance of loblolly pine (Pinus taeda L.) across a precipitation gradient in East Texas. For. Ecol. Manag. 105, 273–282. doi: 10.1016/S0378-1127(97)00287-9
Huang, H., Zheng, C. L., Meng, P., Zhang, J. S., Tong, X. J., and Cheng, X. F. (2022). Relationship between leaf area index and climate factors in a Querus variabilis plantation at the southern foot of Taihang Mountain from 2001 to 2019. Acta. Ecol. Sin. 43, 4. doi: 10.5846/stxb202112173576
Huang, Y. Y., Gerber, S., Huang, T. Y., and Lichstein, J. W. (2016). Evaluating the drought response of CMIP5 models using global gross primary productivity, leaf area, precipitation, and soil moisture data. Glob. Biogeochem. Cy. 30, 1827–1846. doi: 10.1002/2016GB005480
Karimi, S., Nazemi, A. H., Sadraddini, A. A., Xu, T. R., Bateni, S. M., and Fard, A. F. (2020). Estimation of forest leaf area index using meteorological data: assessment of heuristic models. J. Environ. Inform. 36, 119–132. doi: 10.3808/jei.202000430
Kinane, S. M., Montes, C. R., Zapata, M., Bullock, B. P., Cook, R. L., and Mishra, D. R. (2022). Influence of environmental variables on leaf area index in loblolly pine plantations. For. Ecol. Manag. 523, 120445. doi: 10.1016/j.foreco.2022.120445
Leuschner, C., Vo,ß, S, Foetzki, A., and Clases, Y. (2006). Variation in leaf area index and stand leaf mass of European beech across gradients of soil acidity and precipitation. Plant Ecol. 186, 247–258. doi: 10.1007/s11258-006-9127-2
Li, X. H., Zhang, Q., and Shao, M. (2012). Spatial and temporal variability of leaf area index in the Poyang lake basin and it's relationship with climatic factors. Resour. Environ. Yangtze Basin. 21, 296–301.
Liu, Y., Liu, R. G., Chen, J. N., Cheng, X., and Zheng, G. (2013). Current status and perspectives of leaf area index retrieval from optical remote sensing data. J. Geo-Inf. Sci. 15, 734–743. doi: 10.3724/SP.J.1047.2013.00734
Liu, Z. (2015). Spatia and temporal dynamics of leaf area index in typical forest in the northeast China. Doctor's degree, Northeast Forestry University, Haerbin, Heilongjiang Province, China.
Liu, Z. B., Wang, Y. H., Liu, Y., Tian, A., Wang, Y. R., and Zuo, H. J. (2017). Spatiotemporal variation and scale effect of canopy leaf area index of larch plantation on a slope of the semi-humid Liupan Mountains, Ningxia, China. Chin. J. Plant Ecol. 41, 749–760. doi: 10.17521/cjpe.2016.0288
Lǔ, Y. L, Liu, S. R., Sun, P. S., Zhang, G. B., and Zhang, R. P. (2007). Seasonal and spatial variation of leaf area index of sub-alpine dark coniferous forest during growing season in Western Sichuan. Scientia Silvae Sinicae. 43:1–7. doi: 10.11707/j.1001-7488.20070801
Luo, Y. X., Xiang, H. Q., Zheng, X. B., Chen, J., and Zhou, C. X. (2011). The response of leaf area index of MODIS to mountainous meteorological conditions in Guizhou. Ecol. Environ. Sci. 20, 19–23. doi: 10.3969/j.issn.1674-5906.2011.01.004
Meier, I. C., and Leuschner, C. (2008). Leaf size and leaf area index in fagus sylvatica forests: competing effects of precipitation, temperature, and nitrogen availability. Ecosystems 11, 655–669. doi: 10.1007/s10021-008-9135-2
Shao, P., and Zeng, X. D. (2011). Spatiotemporal relationship of leaf area index simulated by CLM3.0-DGVM and climatic factors. Acta Ecol. Sin. 31, 4725–4731. doi: 10.1093/mp/ssq070
Sprintsin, M., Cohen, S., Maseyk, K., Rotenberg, E., Grünzweig, J., Karnieli, A., et al. (2011). Long term and seasonal courses of leaf area index in a semi-arid forest plantation. Agric. For. Meteorol. 151, 565–574. doi: 10.1016/j.agrformet.2011.01.001
Vyas, D., Mehta, N., Dinakaran, J., and Krishnayya, N. S. R. (2010). Allometric equations for estimating leaf area index (LAI) of two important tropical species (Tectona grandis and Dendrocalamus strictus). J. For. Res. 21,197–200. doi: 10.1007/s11676-010-0032-0
Wang, X. Q., Ma, L. Y., and Jia ZK Xu, C. Y. (2005). Research and application advances in leaf area index (LAI). Chin. J. Ecol. 24, 537–541. doi: 10.1360/biodiv.050022
Wang, Y. N., Deng, X. X., Wang, Y. H., Cao, G. X., Yu, P. T., Xiong, W., et al. (2016). The slope scale effect of canopy LAI of Larix principis-rupprechtii plantation at the south side of Liupan Mountains. Acta. Ecol. Sin. 36, 3564–3571. doi: 10.5846/stxb201409301940
Wang, Y. Q., Shi, J. C., Jiang l, M., Du, J. Y., Sun, R. J., and Tian, B. S. (2008). The application of remote sensing date to analyzing the influence of water thermal conditions on LAI of Qinghai-tibet plateau. Rem. Sens. Land Resour. 4, 81–86. doi: 10.6046/gtzyyg.2008.04.19
Watson, D. J. (1958). The dependence of net assimilation rate on leaf-area index. Ann. Bot. 22, 37–54. doi: 10.1093/oxfordjournals.aob.a083596
Weiss, M., Baret, F., Smith, G. J., Jonckheere, I., and Coppin, P. (2004). Review of methods for in situ leaf area index (LAI) determination Part II: estimation of LAI, errors and sampling. Agric. For. Meteorol. 121, 37–53. doi: 10.1016/j.agrformet.2003.08.001
Wilson, J. W. (1960). Inclined point quardrats. New Phytol. 59, 1–7. doi: 10.1111/j.1469-8137.1960.tb06195.x
Yan, G. J., Hu, R. H., Luo, J. H., Weiss, M., Jiang, H. L., Mu, X. H., et al. (2019). Review of indirect optical measurements of leaf area index: recent advances, challenges, and perspectives. Agric. For. Meteorol. 265, 390–411. doi: 10.1016/j.agrformet.2018.11.033
Zhang, J. H., Fu, C. B., Yan, X. D., Seita, E., and Hiroshi, K. (2002). Global respondence analysis of LAI vs. surface air temperature and precipitation variations. Chin. J. Geophys. 45, 631–637. doi: 10.1002/cjg2.280
Zhao, C. Y., Shen, W. H., and Peng, H. H. (2009a). Methods for determining canopy leaf area index of Picea crassifolia forest in Qilian Mountain, China. Chin. J. Plant Ecol. 33, 860–869. doi: 10.3773/j.issn.1005-264x.2009.05.004
Keywords: leaf area index, air temperature, soil temperature, precipitation, soil water content, Qilian Mountains
Citation: Zhao Y, Zhao W and Fang H (2023) Influence of hydrothermal factors on a coniferous forest canopy in the semiarid alpine region of Northwest China. Front. For. Glob. Change 6:1193221. doi: 10.3389/ffgc.2023.1193221
Received: 24 March 2023; Accepted: 12 June 2023;
Published: 10 July 2023.
Edited by:
Marcus Schaub, Snow and Landscape Research (WSL), SwitzerlandReviewed by:
Astrid Moser-Reischl, Technical University of Munich, GermanyCopyright © 2023 Zhao, Zhao and Fang. This is an open-access article distributed under the terms of the Creative Commons Attribution License (CC BY). The use, distribution or reproduction in other forums is permitted, provided the original author(s) and the copyright owner(s) are credited and that the original publication in this journal is cited, in accordance with accepted academic practice. No use, distribution or reproduction is permitted which does not comply with these terms.
*Correspondence: Yonghong Zhao, emhhb3loMDMwM0AxMjYuY29t; Weijun Zhao, emhhb3dlaWp1bjEwMTlAMTI2LmNvbQ==
Disclaimer: All claims expressed in this article are solely those of the authors and do not necessarily represent those of their affiliated organizations, or those of the publisher, the editors and the reviewers. Any product that may be evaluated in this article or claim that may be made by its manufacturer is not guaranteed or endorsed by the publisher.
Research integrity at Frontiers
Learn more about the work of our research integrity team to safeguard the quality of each article we publish.