 Michael S. Watt
 John R. Moore
- 1Scion, Christchurch, New Zealand
- 2Timberlands Limited, Rotorua, New Zealand
Wind is a significant disturbance agent in forests that is likely to become more prevalent as plantation forests are increasingly grown at high stand density to maximize yields and carbon sequestration. Although research has used models to characterize plantation wind risk at discrete sites, little research has regionally scaled these predictions under both current and future climate. Stem slenderness, or height/diameter ratio, has been found to be a useful proxy for stand stability in the widely grown species, radiata pine (Pinus radiata), which constitutes 90% of the New Zealand plantation area. Stands with a slenderness that exceed 80 m m–1 are likely to be at risk when exposed to strong winds. In this study, slenderness was derived from 4,004 radiata pine permanent growth monitoring plots, that covered the spatial distribution of the species, and matched with stand density, age and key climatic and edaphic variables derived from surfaces. Using these data, the objectives of this study were to (i) develop a model to predict slenderness using machine learning and partition the impacts of key factors on slenderness, (ii) use this model to spatially predict slenderness throughout New Zealand for three contrasting silvicultural regimes, under current and future climate, and (iii) identify any regions that may be particularly vulnerable to wind risk. The final model of slenderness developed using the random forest algorithm included, in order of importance, stand density, stand age, mean annual air temperature and total annual rainfall. Predictions made on a withheld independent dataset (n = 401) were both unbiased and accurate (R2 = 0.85). Spatial predictions of slenderness under current climate showed wide regional variation with mean slenderness at age 30 years increasing from 62.1 m m–1 for low stand density clearwood regimes to 73.5 m m–1 for medium stand density structural grade regimes and 79.5 m m–1 for high stand density carbon regimes. Mean changes in slenderness were relatively low to 2040 and 2090 within the North Island. In contrast, within the South Island there were moderate increases in slenderness for the three silvicultural regimes that were markedly higher for 2090 than 2040.
1. Introduction
Forests are a major carbon sink and play a significant role in the carbon cycle. The substantial deforestation of tropical forests over the last three decades has been partially offset by the rapid expansion of the global plantation area (Keenan et al., 2015; FAO, 2020). Plantations within the temperate climatic zone constitute 20% of the global forest area (Keenan et al., 2015) and afforestation using fast growing species within these regions provides an effective means of reaching CO2 emission targets and mitigating the effects of climate change (Keenan et al., 2015; Payn et al., 2015).
New Zealand lies within the temperate zone and has extensive plantations that cover 1.8 M hectares or 7% of the total land area (NZFOA, 2022). Radiata pine (Pinus radiata D. Don) is the most widely planted species and a key component of New Zealand’s response to climate change as it is fast growing and can be grown across a wide variety of climatic conditions (Watt et al., 2021). There are 51 carbon pricing initiatives throughout the world that recognize and reward carbon sequestration by plantation crops (World Bank, and Ecofys, 2018). Within New Zealand, the Emissions Trading Scheme (ETS) is the primary mechanism used for reducing greenhouse gases and meeting domestic and international climate change commitments. Through placing a value on carbon, the ETS encourages carbon sequestration through activities such as afforestation.
The price of carbon within the ETS has increased markedly over the last decade and these high values have stimulated rates of afforestation using fast growing plantation species, such as radiata pine. In contrast to afforestation in the past, a large proportion of these new forests have been managed as carbon regimes which often involves a single thinning to a high final crop stand density (ca. 900 stems ha–1). This silvicultural regime maximizes the production of carbon, and as carbon payments are made regularly throughout the rotation, can offset the land purchase cost in a relatively short timeframe. These regimes favor sequestration of carbon over wood products, which contrasts with structural grade (thinned to ca. 450–650 stems ha–1) and clearwood regimes (thinned to between 250 and 400 stems ha–1), that combine the capture of timber products with lower rates of carbon sequestration.
Despite the potential benefits of carbon regimes, stands that are grown at high density are at greater risk of uprooting or stem breakage from wind (Castedo-Dorado et al., 2009). Wind is a significant disturbance agent that causes considerable financial loss within New Zealand’s planted forests with most significant events occurring from enhanced westerly air flows or extra-tropical depressions (Martin and Ogden, 2006; Moore et al., 2013). The susceptibility of stands to wind is governed by the wind climate, forest structure, site and soil conditions and tree and stand characteristics (Quine, 1995). Among these factors, stand and tree characteristics are a very important determinant of stand vulnerability to wind damage (Gardiner et al., 1997; Hanewinkel et al., 2011) and changes to these using silviculture is one of the main methods that forest managers can use to mitigate wind damage (Moore and Watt, 2015).
Empirical observations and statistical models generally show that wind damage increases as trees become more slender, with greater height/diameter ratio (H/D ratio) (Cremer et al., 1982; Peltola et al., 2000; Scott and Mitchell, 2005) and these findings have been supported by mechanistic model simulations (Peltola and Kellomäki, 1993; Peltola et al., 1999; Gardiner et al., 2000). Changes in slenderness occur across sites in response to environmental gradients (Watt and Kirschbaum, 2011) or within sites most typically as a result of variation in stand density (Waghorn et al., 2007). Increases in stand density induce higher slenderness as diameter is reduced but tree height is relatively unaffected as density increases (Cremer et al., 1982; Castedo-Dorado et al., 2009; Moore and Watt, 2015).
Slenderness has been identified as an important index that can be used to predict wind damage in a range of species. Using information acquired from a severe storm event, Becquey and Riou-Nivert (1987) developed a framework with three categories. Damage of less than 10% occurred within a stable category with slenderness ranging from ca. 80 to ca. 55 m m–1 as height increased from ca. 10 to 26 m. In contrast, high damage exceeding 50% was noted for stands with slenderness ranging from ca. 100 to 85 m m–1 as height increased from 14 to 34 m. A transition category was defined between these two classes. Similarly, slenderness has been identified as an important index that can be used to predict wind damage in radiata pine when height exceeds a threshold of 12–14 m (Prior, 1959; Cremer et al., 1982; Carter, 1989; Studholme, 1995). For instance, empirical observations following a cyclone event in Australia showed that stands with slenderness < 70 m m–1 suffered little or no damage (Cremer et al., 1982). However, rates of damage were found to increase linearly in stands with slenderness above this threshold, reaching a maximum in stands with slenderness of 100 m m–1 where 60–100% of trees were broken or severely bent (Cremer et al., 1982). Although it is somewhat subjective, these results suggest that in mature radiata pine stands, which exceed the height threshold, stands with slenderness values exceeding 80 and 100 m m–1 are likely to be, respectively, at moderate and high risk from wind damage.
Climate change is likely to exacerbate the impact of wind damage on planted forests. Predictions of critical wind speeds and the annual probability of damage were made for radiata pine at seven discrete locations in New Zealand under current and future climate, through coupling growth predictions from a process-based growth model with estimates of wind vulnerability using the ForestGALES wind damage model (Moore and Watt, 2015). This study showed that the risk of wind damage increases markedly under climate change as tree height is favored over diameter growth at higher air temperatures and CO2 concentrations. The annual probability of damage under climate change was found to be much greater in highly stocked carbon regimes than stands with lower density managed for timber production. The annual probability of damage reached a maximum of 0.922 for 30-year-old stands managed for carbon that were growing in 2090 under the most extreme climate change scenario (Moore and Watt, 2015). As this research was undertaken at discrete locations, findings provide insight into overall patterns, but do not characterize spatial variation in tree stability under current and future climate.
Development of a spatial model that can predict slenderness, and the impact of stand density on this variable, provide a means of characterizing wind risk under a range of silvicultural regimes. Previous research has shown slenderness in radiata pine to be positively related to stand age, air temperature, stand density, soil carbon: nitrogen ratio and topographical exposure (Watt and Kirschbaum, 2011). Although previous model predictions of slenderness have not been spatial, geospatial surfaces describing these predictor variables could be used to characterize slenderness and wind damage risk at regional and national scales.
Using data obtained from an extensive set of radiata pine permanent growth monitoring plots, the objectives of this research were to (i) develop a model to predict slenderness and partition the impacts of key factors on slenderness, (ii) use this model to spatially predict slenderness throughout New Zealand for three contrasting silvicultural regimes, under current and future climate and (iii) identify any regions that may be particularly vulnerable to wind damage risk.
2. Materials and methods
2.1. Study area
New Zealand is designated by the Köppen classification as having a temperate oceanic climate (Cfb) that is characterized by mild air temperatures with warm summers and little seasonal variation in rainfall (Peel et al., 2007). Within this classification, there is considerable climatic complexity that is predominantly attributable to the relatively large latitude span covered by the country and the high mountain ranges in both islands (refer to hillshade in Figure 1). Across areas with low-moderate elevation, in which most plantation forests occur, mean air temperature ranges from 8°C in the cool temperate south to 16°C in the sub-tropical north (Leathwick and Stephens, 1998). Rainfall throughout the country is markedly modified by mountain ranges that occur throughout New Zealand and act as a barrier to the prevailing westerly wind. As a consequence, the west coast of the South Island is the wettest region of New Zealand receiving up to 5,000 mm year–1 while areas east of the main South Island mountains are the driest, with rainfall as low as 500 mm year–1 (Leathwick and Stephens, 1998).
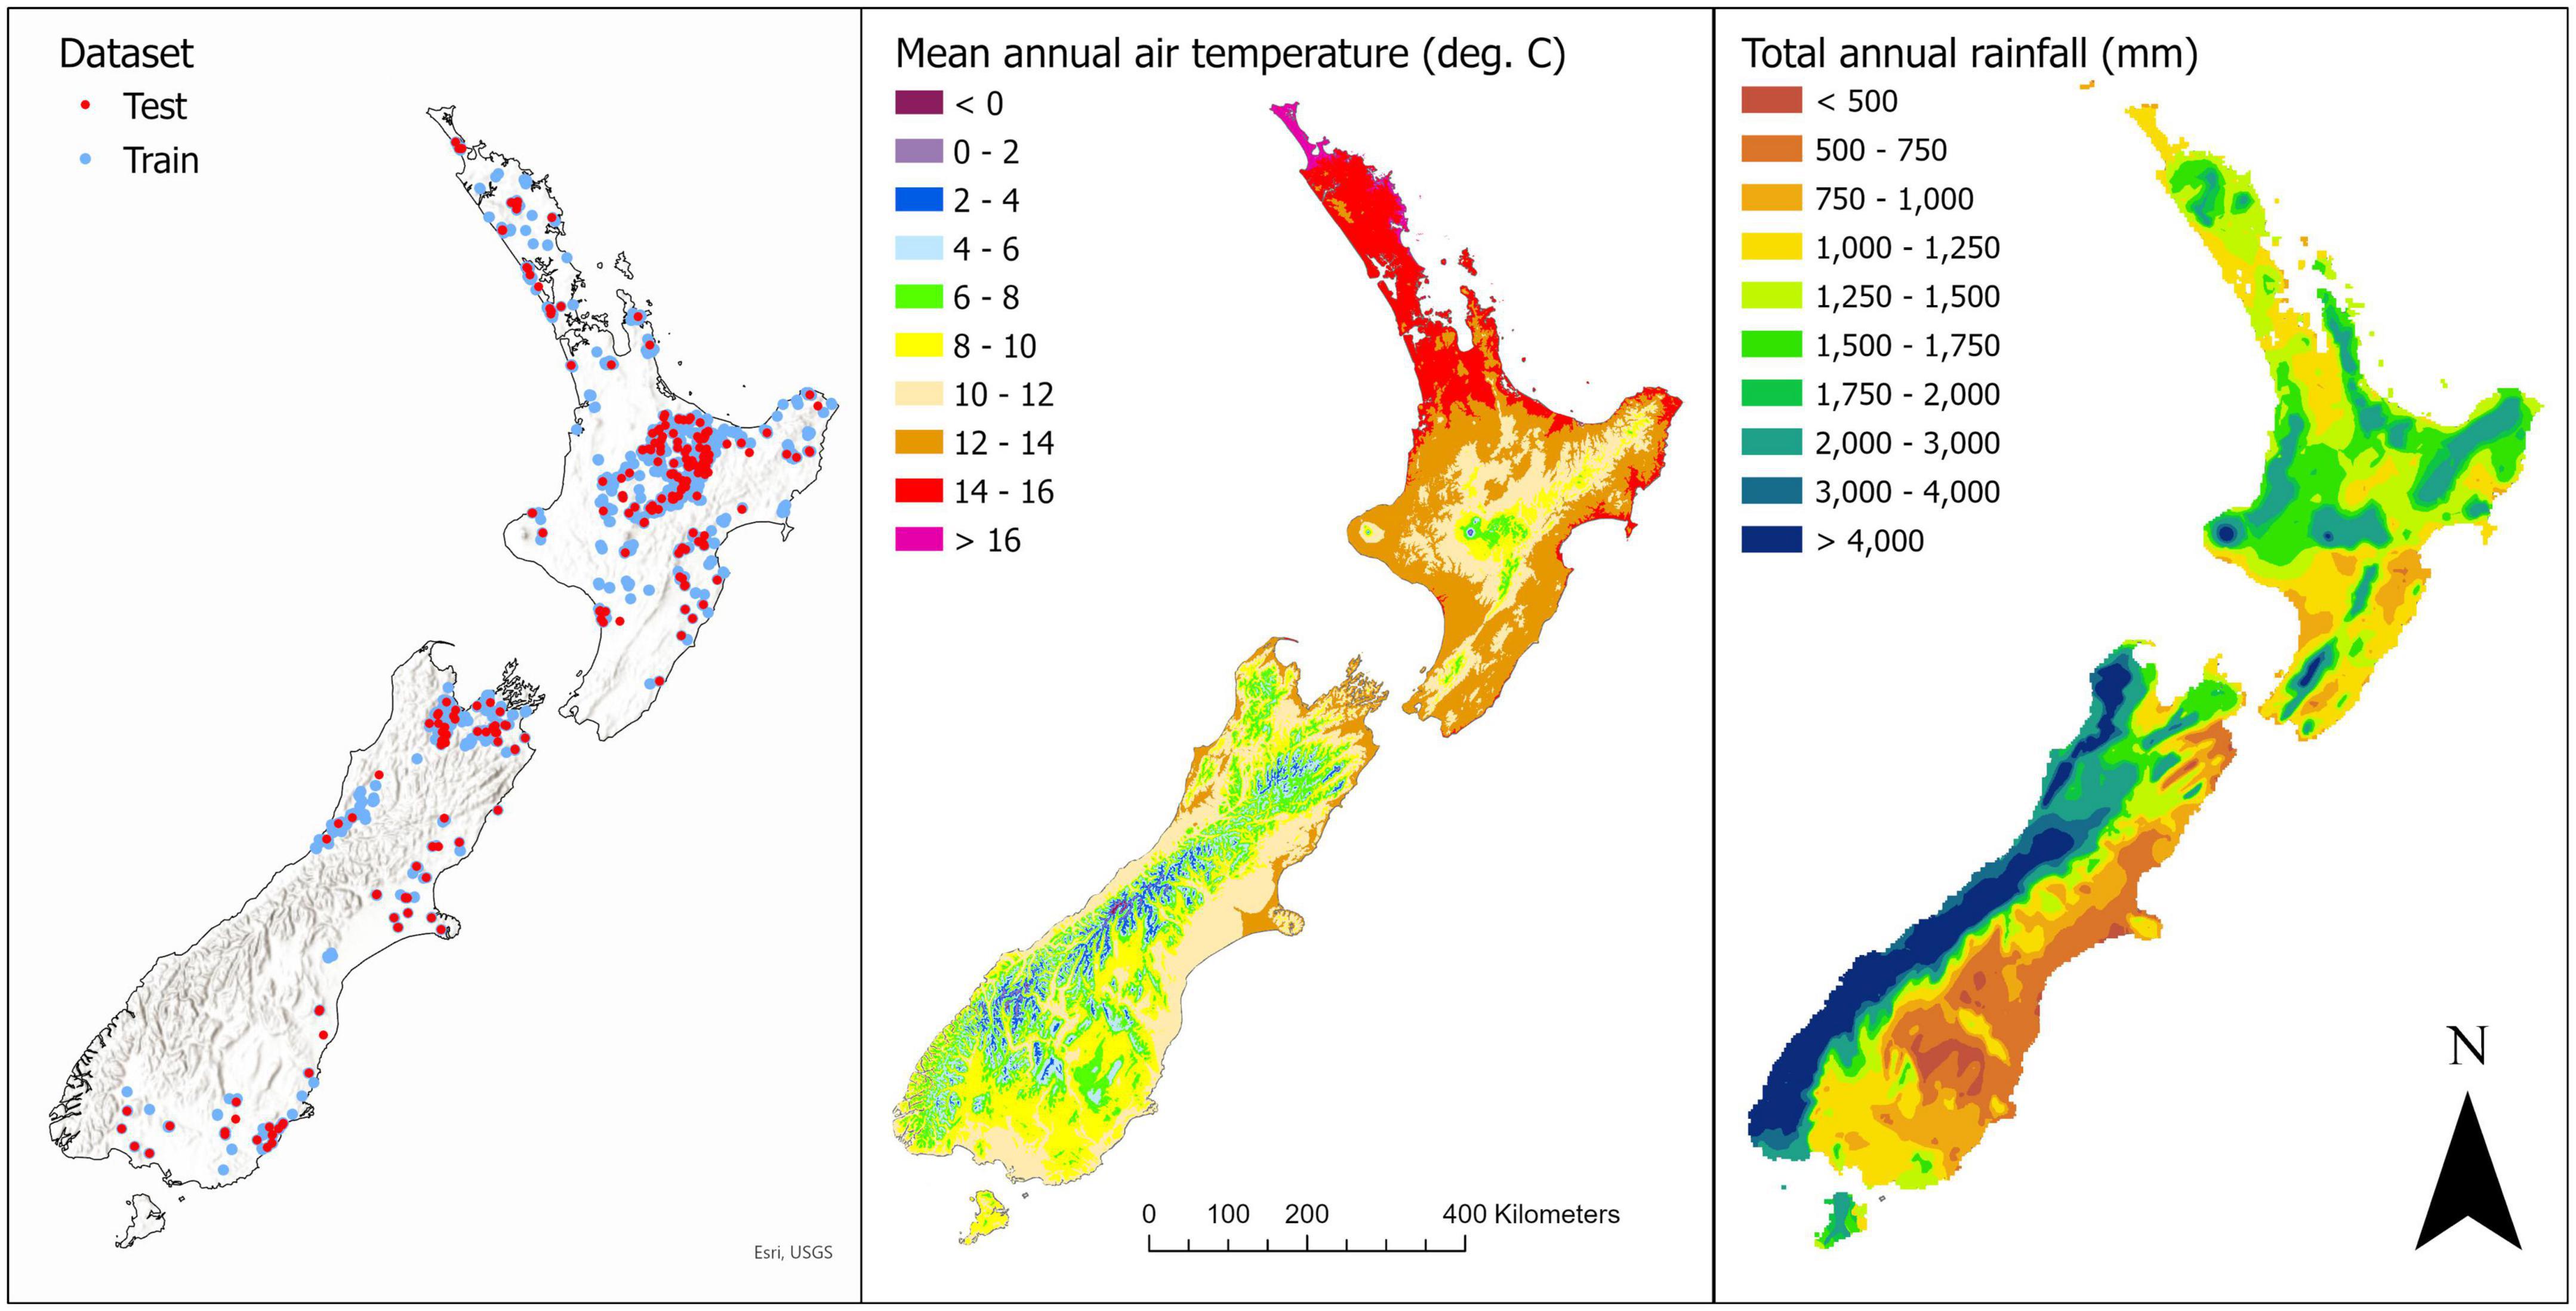
Figure 1. Map showing (left) the location of the training and test datasets, and spatial variation in (center) mean annual air temperature and (right) total annual rainfall. On the left panel the background hillshade highlights the location of high elevation areas within New Zealand.
The regions with the greatest mean wind speed occur in the south-west of the South Island and south-east and north-east of the North Island. Extreme wind speeds that cause damage to forests are often the result of major ex-tropical cyclones that have a return period of ca. 10 years and mainly affect the forests of the North Island (Shaw, 1983; Martin and Ogden, 2006). Wind speeds during these ex-tropical cyclones reach speeds of up to 175 km h–1 (Conway, 1959). High wind speeds also result from the passage of westerly air flows over mountain ranges in the South Island. Recorded wind speeds of over 160 km h–1 from these air flows have caused considerable wind-throw to forests located on the east coast of the South Island (Hill, 1979).
2.2. Dataset preparation
Data used in this study were obtained from 4,103 permanent sample plots that were extracted from the New Zealand Permanent Sample Plot database (Pilaar and Dunlop, 1990). As measurements for most of these plots were repeated over time the data was filtered to include only the latest plot measurement. In each of these plots tree diameter at breast height (DBH) was measured for all trees while stand heights were measured on a randomly selected sub-set of trees. Within each plot slenderness was determined for all trees with measured heights as tree height/DBH after converting diameter into the same units as height (m). Plots with less than four measured trees were discarded, to ensure a robust plot estimate was obtained, and slenderness was then averaged from these tree level measurements to the plot level. Following this filtering, 4,004 plot measurements of slenderness were available for modeling. The observations were randomly split, with 90% (3,603 plots) used for training the model while the remaining 10% (401 plots) were retained for a test dataset that was not used for the model fitting.
2.3. Predictor variables
A total of 11 variables were initially used to predict slenderness. Stand density and age were extracted from all plots. Environmental data were extracted for the plot locations from climatic, landform and edaphic surfaces. Climatic variables included annual means for the following variables: total rainfall, mean air temperature, global daily irradiance, mean wind speed (at 10 m), Penman potential evapotranspiration, relative humidity and the number of days of soil moisture deficit per year. These surfaces were developed by the National Institute of Water and Atmospheric Research (NIWA) at a 500 m resolution and used data collected from 1991 to 2020. Also extracted were the carbon: nitrogen ratio (C:N ratio) from 0 to 10 cm (Watt and Palmer, 2012) and topographical exposure (topex) as both these variables have been previously shown to be useful predictors of slenderness (Watt and Kirschbaum, 2011). Plots covered a wide range in mean annual air temperature and total annual rainfall (Figure 1).
There was wide variation in all stand characteristics across the dataset that was used for analysis (Table 1). Stem slenderness averaged ca 71 m m–1 in both datasets (i.e., training and test) and ranged five-fold from 26.9 to 128 m m–1. In both datasets the mean stand age at the time of measurement was ca. 23 years with a six-fold range of 7–39 years. Stand density averaged 385 stems ha–1 between the two datasets and across datasets ranged from 40 to 2,500 stems ha–1 (Table 1). When pooled across the training and test datasets slenderness was markedly higher within the North Island (mean = 73.5 m m–1; standard deviation (SD) = 14.0 m m–1) than the South Island (mean = 64.3 m m–1; SD = 12.1 m m–1).
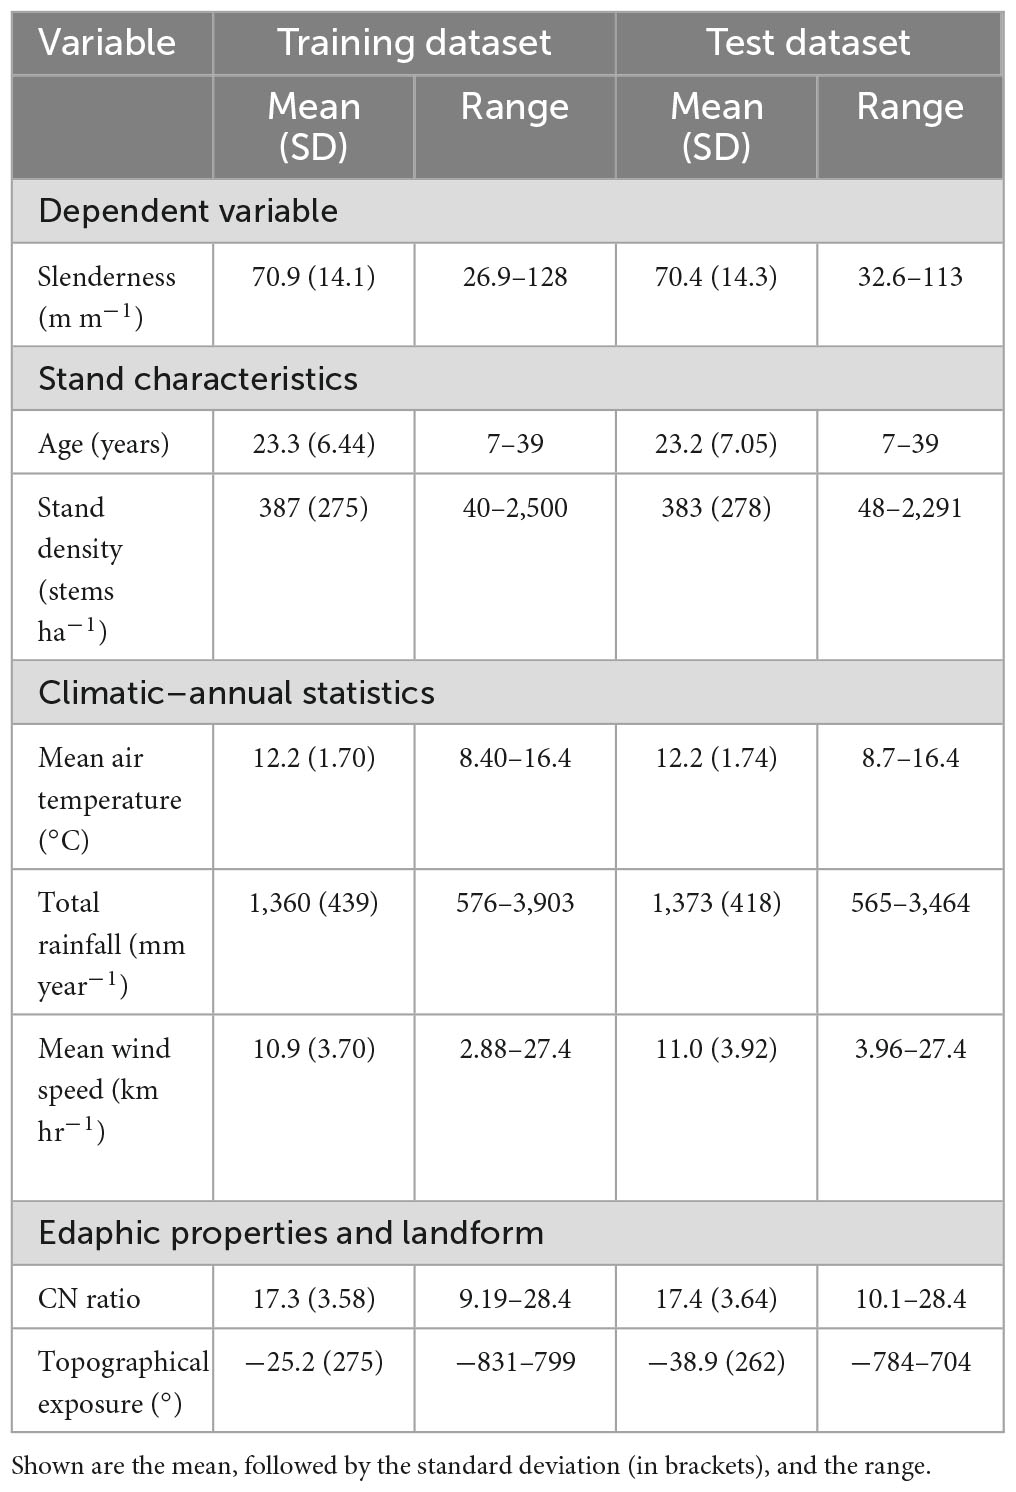
Table 1. Variation in slenderness and key stand characteristics, climatic, edaphic and landform variables within the training (n = 3,603) and test (n = 401) datasets.
Environmental conditions varied widely across the plots and covered the climatic variation and range in edaphic conditions under which radiata pine is grown in New Zealand. Total annual rainfall averaged 1,360 and 1,373 mm year–1, respectively in the training and test datasets and across these datasets ranged seven-fold from 565 to 3,903 mm year–1 (Table 2). Mean annual air temperature, was almost identical between the two datasets, respectively, averaging 12.2°C and ranged two-fold from 8.4 to 16.4°C. Variation was wider for mean annual wind speed which averaged 10.95 km h–1 and ranged 10-fold from 2.88 to 27.4 km h–1. The mean C:N ratio ranged three-fold across datasets averaging ca. 17.4. Topographical exposure varied from sites that were very exposed (topex = −831°) through to those that were very sheltered (topex = 799°).
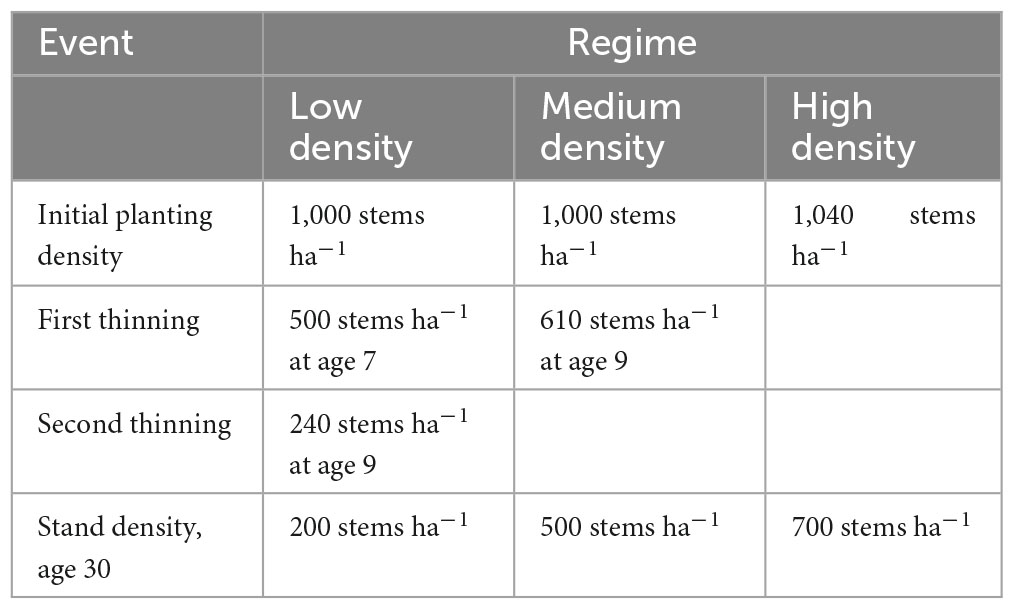
Table 2. Characteristics of the three radiata pine silvicultural regimes.
2.4. Model development
2.4.1. General approach
All model development was undertaken in R (R Core Team, 2023) using the Caret (Classification And Regression Training) package, which is a set of functions that streamline the creation of predictive models (Kuhn, 2008). Models of slenderness were created through the ranger package which is an efficient implementation of random forest in R (Wright and Ziegler, 2015). The models were fitted to the training dataset using a five-fold cross validation with five repeats. Five-fold cross validation divides the training dataset randomly into five equal groups. During each round, four groups are used for model training while the fifth group is set aside for model validation. This process is then repeated five times until each of the five groups has been used for validation (James et al., 2021). As there were five repeats, this entire process was repeated five times and the model evaluation statistics were averaged across all 25 subsampled (five folds x five repeats) validation datasets. The final tuned model was then used to predict slenderness on the withheld test dataset to obtain an independent assessment of model fit.
Random forest was used as it is one of the most widely used machine learning methods (Breiman, 2001; Liaw and Wiener, 2002) is easy to implement and capable of describing non-linear relationships. Random forest is a tree-based method that creates a large number of decision trees with the final predictions constituting the average predictions from individual trees. The two random elements include random sampling, with replacement, of training observations for each individual tree, which originates from bootstrap aggregating or bagging (Breiman, 1996). The second random element is the use of a random subset of predictors at each split (node) within the tree.
Using the ranger package the split rule and two hyperparameters were tuned during the model fitting process on the training dataset. The two split rules included variance and extremely randomized trees which is commonly abbreviated to extra-trees. The variance split rule minimizes the total variance in the target variable within the two new nodes that result from the split. In other words, it chooses the split that leads to the most homogeneous (in terms of the target variable) child nodes (Hastie et al., 2009). In extra-trees, a random split point is chosen for each feature in the randomly chosen subset, which introduces more randomness into the model building process (Geurts et al., 2006). The hyperparameter mtry refers to the number of random predictors that are used while the minimum node size specifies the minimum number of observations in a terminal node, which controls the depth of the tree. These hyperparameters and split rules were tuned using an iterative grid search approach, whereby each subsequent step refined the search radius until subsequent changes did not improve model accuracy.
2.4.2. Model accuracy and bias
Model accuracy was determined on the test and training datasets using the root mean square error (RMSE) and the coefficient of determination (R2), which were calculated, respectively, as
where yi is the observed value, is the predicted value in plot i, is the average of the observed values, and n is the number of plots. The model bias was estimated using the mean bias error (MBE), which was determined as
Model predictions of slenderness were plotted against observed values to check for bias across the range in predicted values. Residual values from the model () were plotted against predicted values and all predictor variables in the final model to determine the degree of bias across the range of each variable.
2.4.3. Partial response functions
The partial dependence plot (pdp) function (Friedman, 2001; Goldstein et al., 2015) was used to plot the functional form of all variables to gain an overview of how slenderness changed in response to the four variables in the final model (stand density, stand age, mean annual air temperature and total annual rainfall). A more detailed inspection of the partial response functions was also undertaken to characterize the influence of combinations of key variables in the final model on slenderness under current and future climate. These predictions of slenderness were generated using an input file that included the range of mean annual air temperature and total annual rainfall under current and future climate, by three contrasting stand densities at age 30 years. The extent to which predictions of slenderness were extrapolated beyond current climate for mean annual air temperature and total annual rainfall was determined from climate change scenarios described by NIWA (Ministry for the Environment, 2018).
2.5. Model predictions of slenderness under current and future climate
2.5.1. Silvicultural regimes
Predictions of slenderness were made across New Zealand under current and future climate for three contrasting radiata pine silvicultural regimes at age 30 (Table 2). These silvicultural regimes included three final crop stand densities at age 30, that will be termed hereafter low density (200 stems ha–1), medium density (500 stems ha–1) and high density (700 stems ha–1) regimes. The lower stand density regime (200 stems ha–1) is representative of a pruned regime that targets production of clearwood timber. The medium density regime is typical of an unpruned regime grown for structural grade timber. Although all three regimes can accumulate carbon, the high density regime is a typical of a regime that aims to maximize carbon. Further details of these regimes, including the initial planting densities, thinning operations and stand densities at age 30 are given in Table 2.
2.5.2. Surfaces describing future climate
Surfaces describing future mean annual air temperature and total annual rainfall were developed by NIWA at a 0.05° resolution (Ministry for the Environment, 2018). The climate change surfaces were based on the representative concentration pathways (RCPs) developed from the IPCC Fifth Assessment. The four RCPs include one mitigation pathway (RCP2.6), two stabilization pathways (RCP4.5, RCP6.0), and one pathway (RCP8.5), that reflects “business as usual” and results in very high greenhouse gas concentrations by the year 2100 and beyond.
Projected changes for each of these RCPs were developed for 2040 (2031–2050) and 2090 (2081–2100) relative to the IPCC current-climate “baseline” of 1986–2005. As described previously in detail (Ministry for the Environment, 2018) the temperature and rainfall projections were derived from statistical (up to 41 models) and dynamical downscaling approaches (six models) and each of the four RCP projections represents the mean from these models.
Projections show, by 2040, mean annual air temperature will increase by on average 0.7°C (RCP2.6), 0.8°C (RCP4.5), 0.8°C (RCP6.0), and 1.0°C (RCP8.5). By 2090, mean annual air temperatures are projected to increase by 0.7°C (RCP2.6), 1.4°C (RCP4.5), 1.8°C (RCP6.0), and 3.0°C (RCP8.5) and there was little regional variation for both projection periods (Ministry for the Environment, 2018). Projections of total annual rainfall were highly variable between regions, models and projection periods. The overall trend in total annual rainfall was a reduction in the north and east of the North Island and increases in all other regions. These increases were most marked on the west coast of the South Island, which is currently the wettest region in New Zealand, and total annual rainfall in this region is projected to increase to 2090 by 5% (RCP2.6), 7% (RCP4.5), 9% (RCP6.0), and 11% (RCP8.5) (Ministry for the Environment, 2018).
2.5.3. Spatio-temporal projections of slenderness
The final model of slenderness was used to generate predictions of slenderness across New Zealand under current climate for the three silvicultural regimes. Projections were also made under future climate using the factorial combination of the four RCPs, two time periods (2040, 2090) and three silvicultural regimes (i.e., 24 projections). All these projections were made using a constant value raster of 30 years for stand age as this is the typical harvest age for radiata pine in New Zealand and also a period of high vulnerability to wind damage. Constant value rasters for stand densities of 200, 500, and 700 stems ha–1 were used for model projections as these represent, respectively, the density at age 30 years for the selected low, medium and high density regimes (Table 2). An additional 24 surfaces were created describing the percentage difference in slenderness between the eight climate change projections and current climate for all three silvicultural regimes.
Mean slenderness across New Zealand were determined for all 27 projections (3 current climate projections; 24 projections under climate change) and tabulated. Regional variation in slenderness was determined through extracting mean slenderness predictions by Island (North and South Island of New Zealand) for the 27 projections. Mean values of percentage change were determined over all 24 projections, by Island, and also averaged across New Zealand.
The visual display of spatial predictions and distributions of predicted slenderness, by Island, focussed on projections made using RCP6.0. Research predicts RCP6.0 and RCP8.5 have probabilities of being surpassed of, respectively, 42% and 12% (Capellán-Pérez et al., 2016). Consequently, projections under the RCP6.0 scenario were given more weight within the results as this scenario has a reasonable chance of occurring but at the same time is a relatively high emission scenario, that illustrates the upper level of potential change in slenderness.
3. Results
3.1. Model of slenderness
3.1.1. Final model selection and fit to data
Using all 11 predictor variables, predictions of slenderness on the test dataset had an RMSE of 5.21 m m–1 and an R2 of 0.87. The sequential removal of variables, starting with those that were least important, or made the least physiological sense, had little effect on the model accuracy for the first four removals (global radiation, relative humidity, potential evapotranspiration, and soil moisture deficit days) and the RMSE of the model was virtually unchanged after the fourth removal (RMSE = 5.22 m m–1). Compared to the full model, the sequential removal of the next three variables, that included topex, C:N ratio, and mean annual wind speed also had little influence on RMSE; values for these reduced models on the test dataset were, respectively, 5.20, 5.26, and 5.56 m m–1. However, removal of total annual rainfall and mean annual air temperature, substantially increased RMSE, to, respectively, 6.22 and 8.48 m m–1 and these two reduced models had R2 of, respectively, 0.81 and 0.65.
Given the high sensitivity of the model to removal of these last two variables the final random forest model included stand density, stand age, mean annual air temperature and total annual rainfall. The four variables within the final model exhibited little collinearity with R2 values between pairs of variables ranging from 0 to 0.16. The fitted hyperparameters on the final model included a minimum node size of five (min.node.size = 5), two randomly selected predictors (mtry = 2) and the default setting within ranger of 500 trees. The final model used the extra-trees split rule.
The cross-validation on the training dataset had an R2 of 0.93, RMSE of 3.82 m m–1 and MBE of −0.035 m m–1. Predictions of slenderness from this model using the withheld test dataset were accurate and unbiased, with an R2 of 0.85, RMSE of 5.56 m m–1 and MBE of −0.12 m m–1. A plot of predicted against actual slenderness using the test dataset showed little apparent bias across the range of predicted values or with respect to stand density (Figure 2). Residual slenderness was also relatively unbiased when plotted against predicted values or any of the four variables in the final model (data not shown).
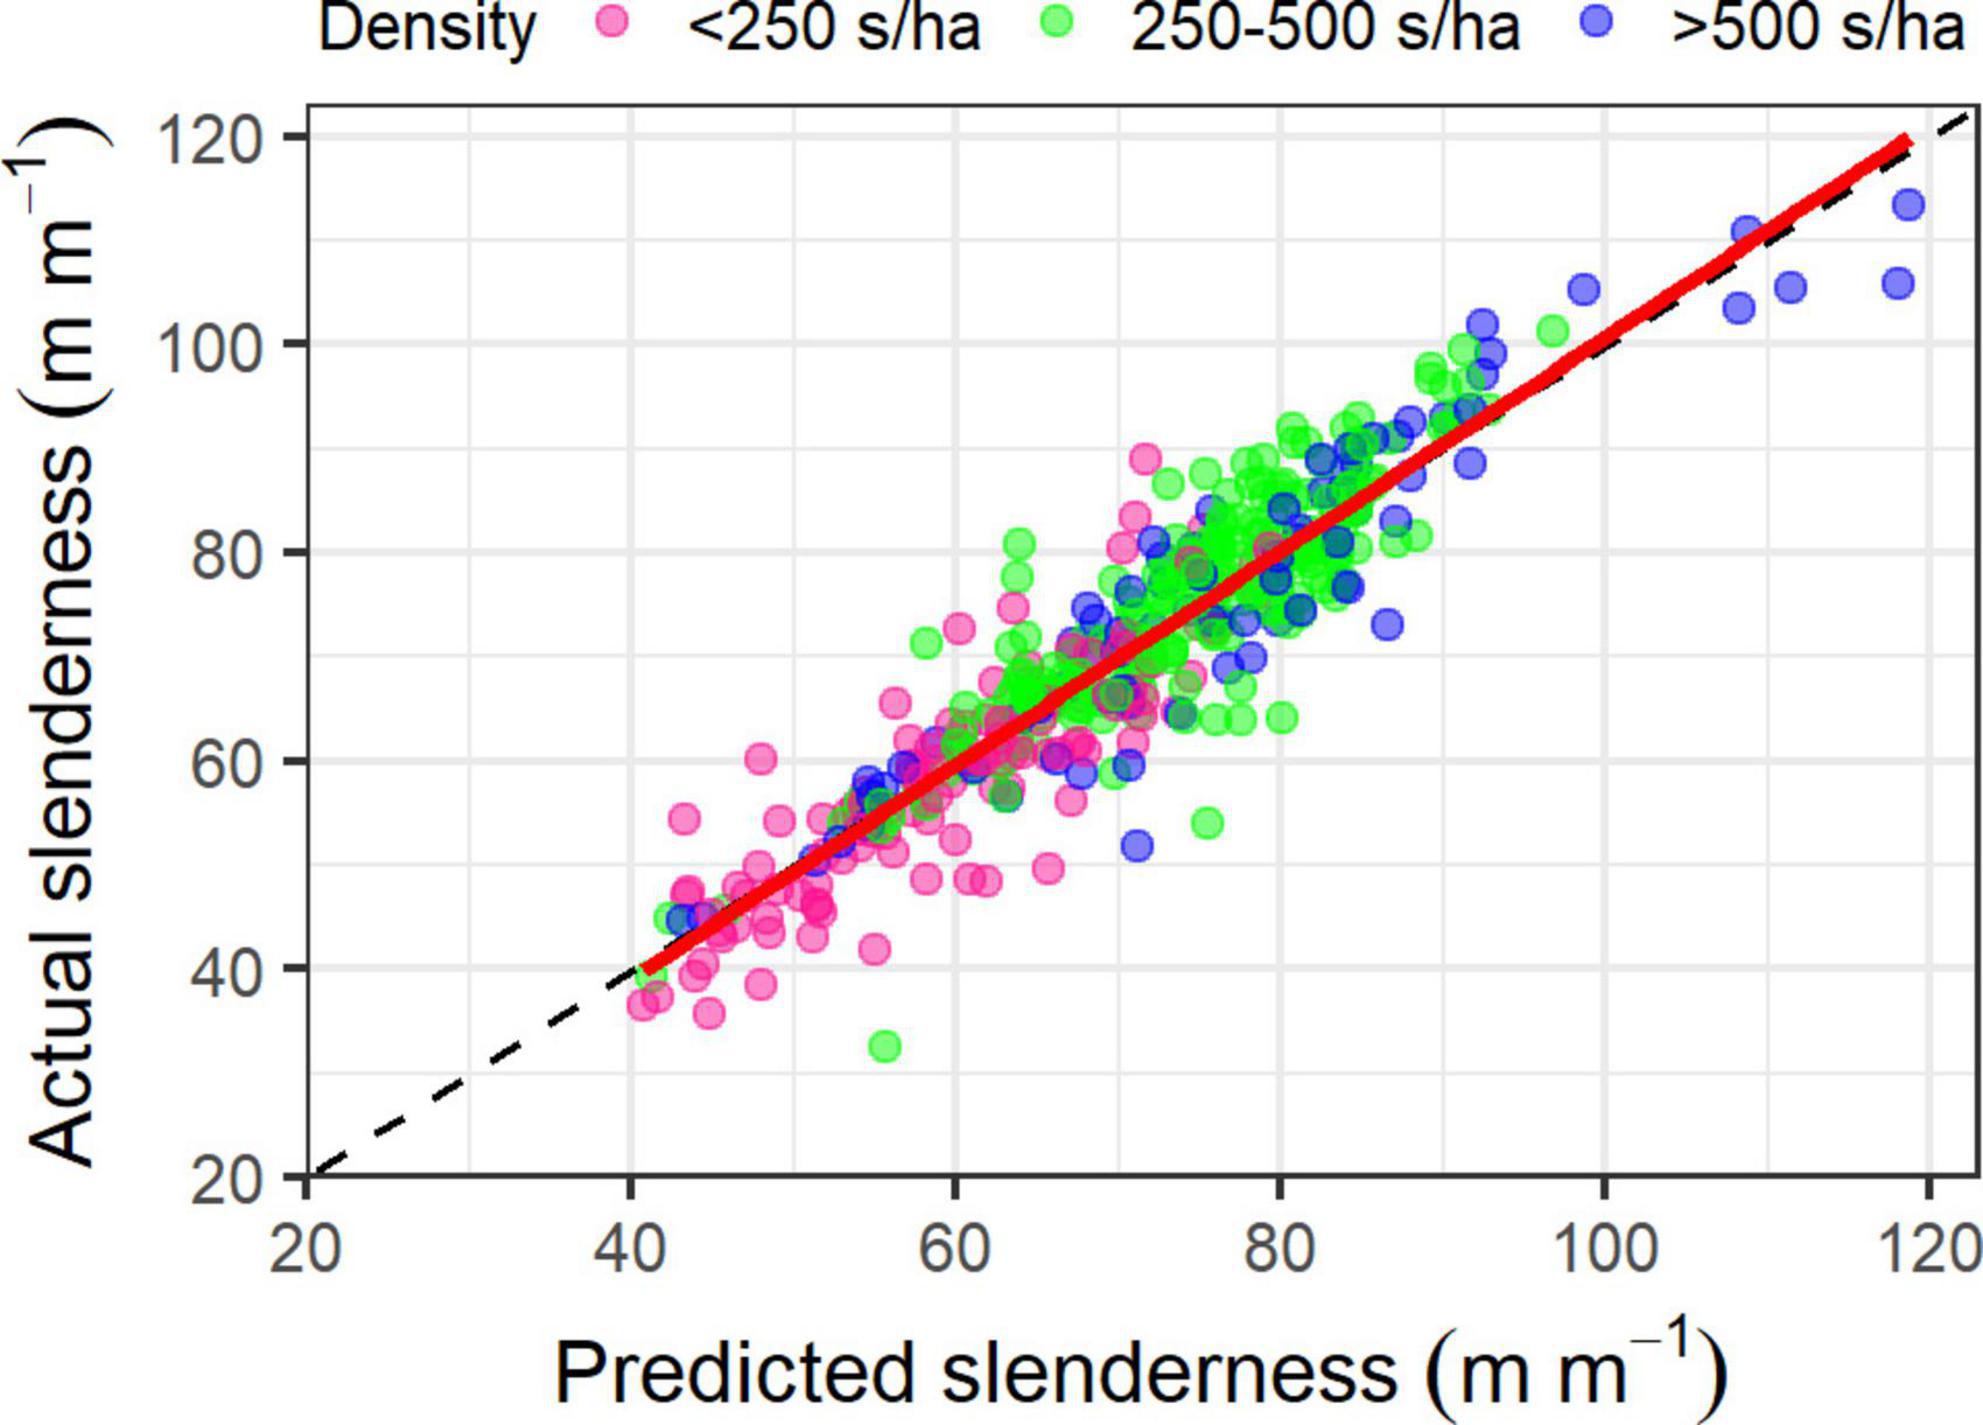
Figure 2. Relationship between predicted and actual slenderness for stands with a density of <250 stems ha1 (pink circles), 250–500 stems ha1 (green circles) and >500 stems ha1 (blue circles). The displayed predictions were made on the test dataset (n = 401 plots). The 1:1 line is shown as a dashed black line and the solid red line is a linear line of best fit.
3.1.2. Variable importance and partial response functions
Partial response functions for the four predictor variables in the model showed that slenderness was most responsive to stand density, followed by stand age, mean annual air temperature and then total annual rainfall (Figure 3). Slenderness increased rapidly with stand density from 100 to 250 stems ha–1, then at a moderate rate up to 750 stems ha–1, and more slowly to 1,500 stems ha–1 after which point values remained constant. Slenderness increased at a high rate between stand ages of 7–20 years, with the rate slowing at ages above 20 years. Increases in slenderness with mean annual air temperature were greatest up to 9°C with further slower increases to ca. 12°C but remained relatively constant at mean air temperatures above 12°C (Figure 3). Slenderness increased rapidly with total annual rainfall to a maximum at ca. 1,800 mm year–1 before declining (Figure 3).
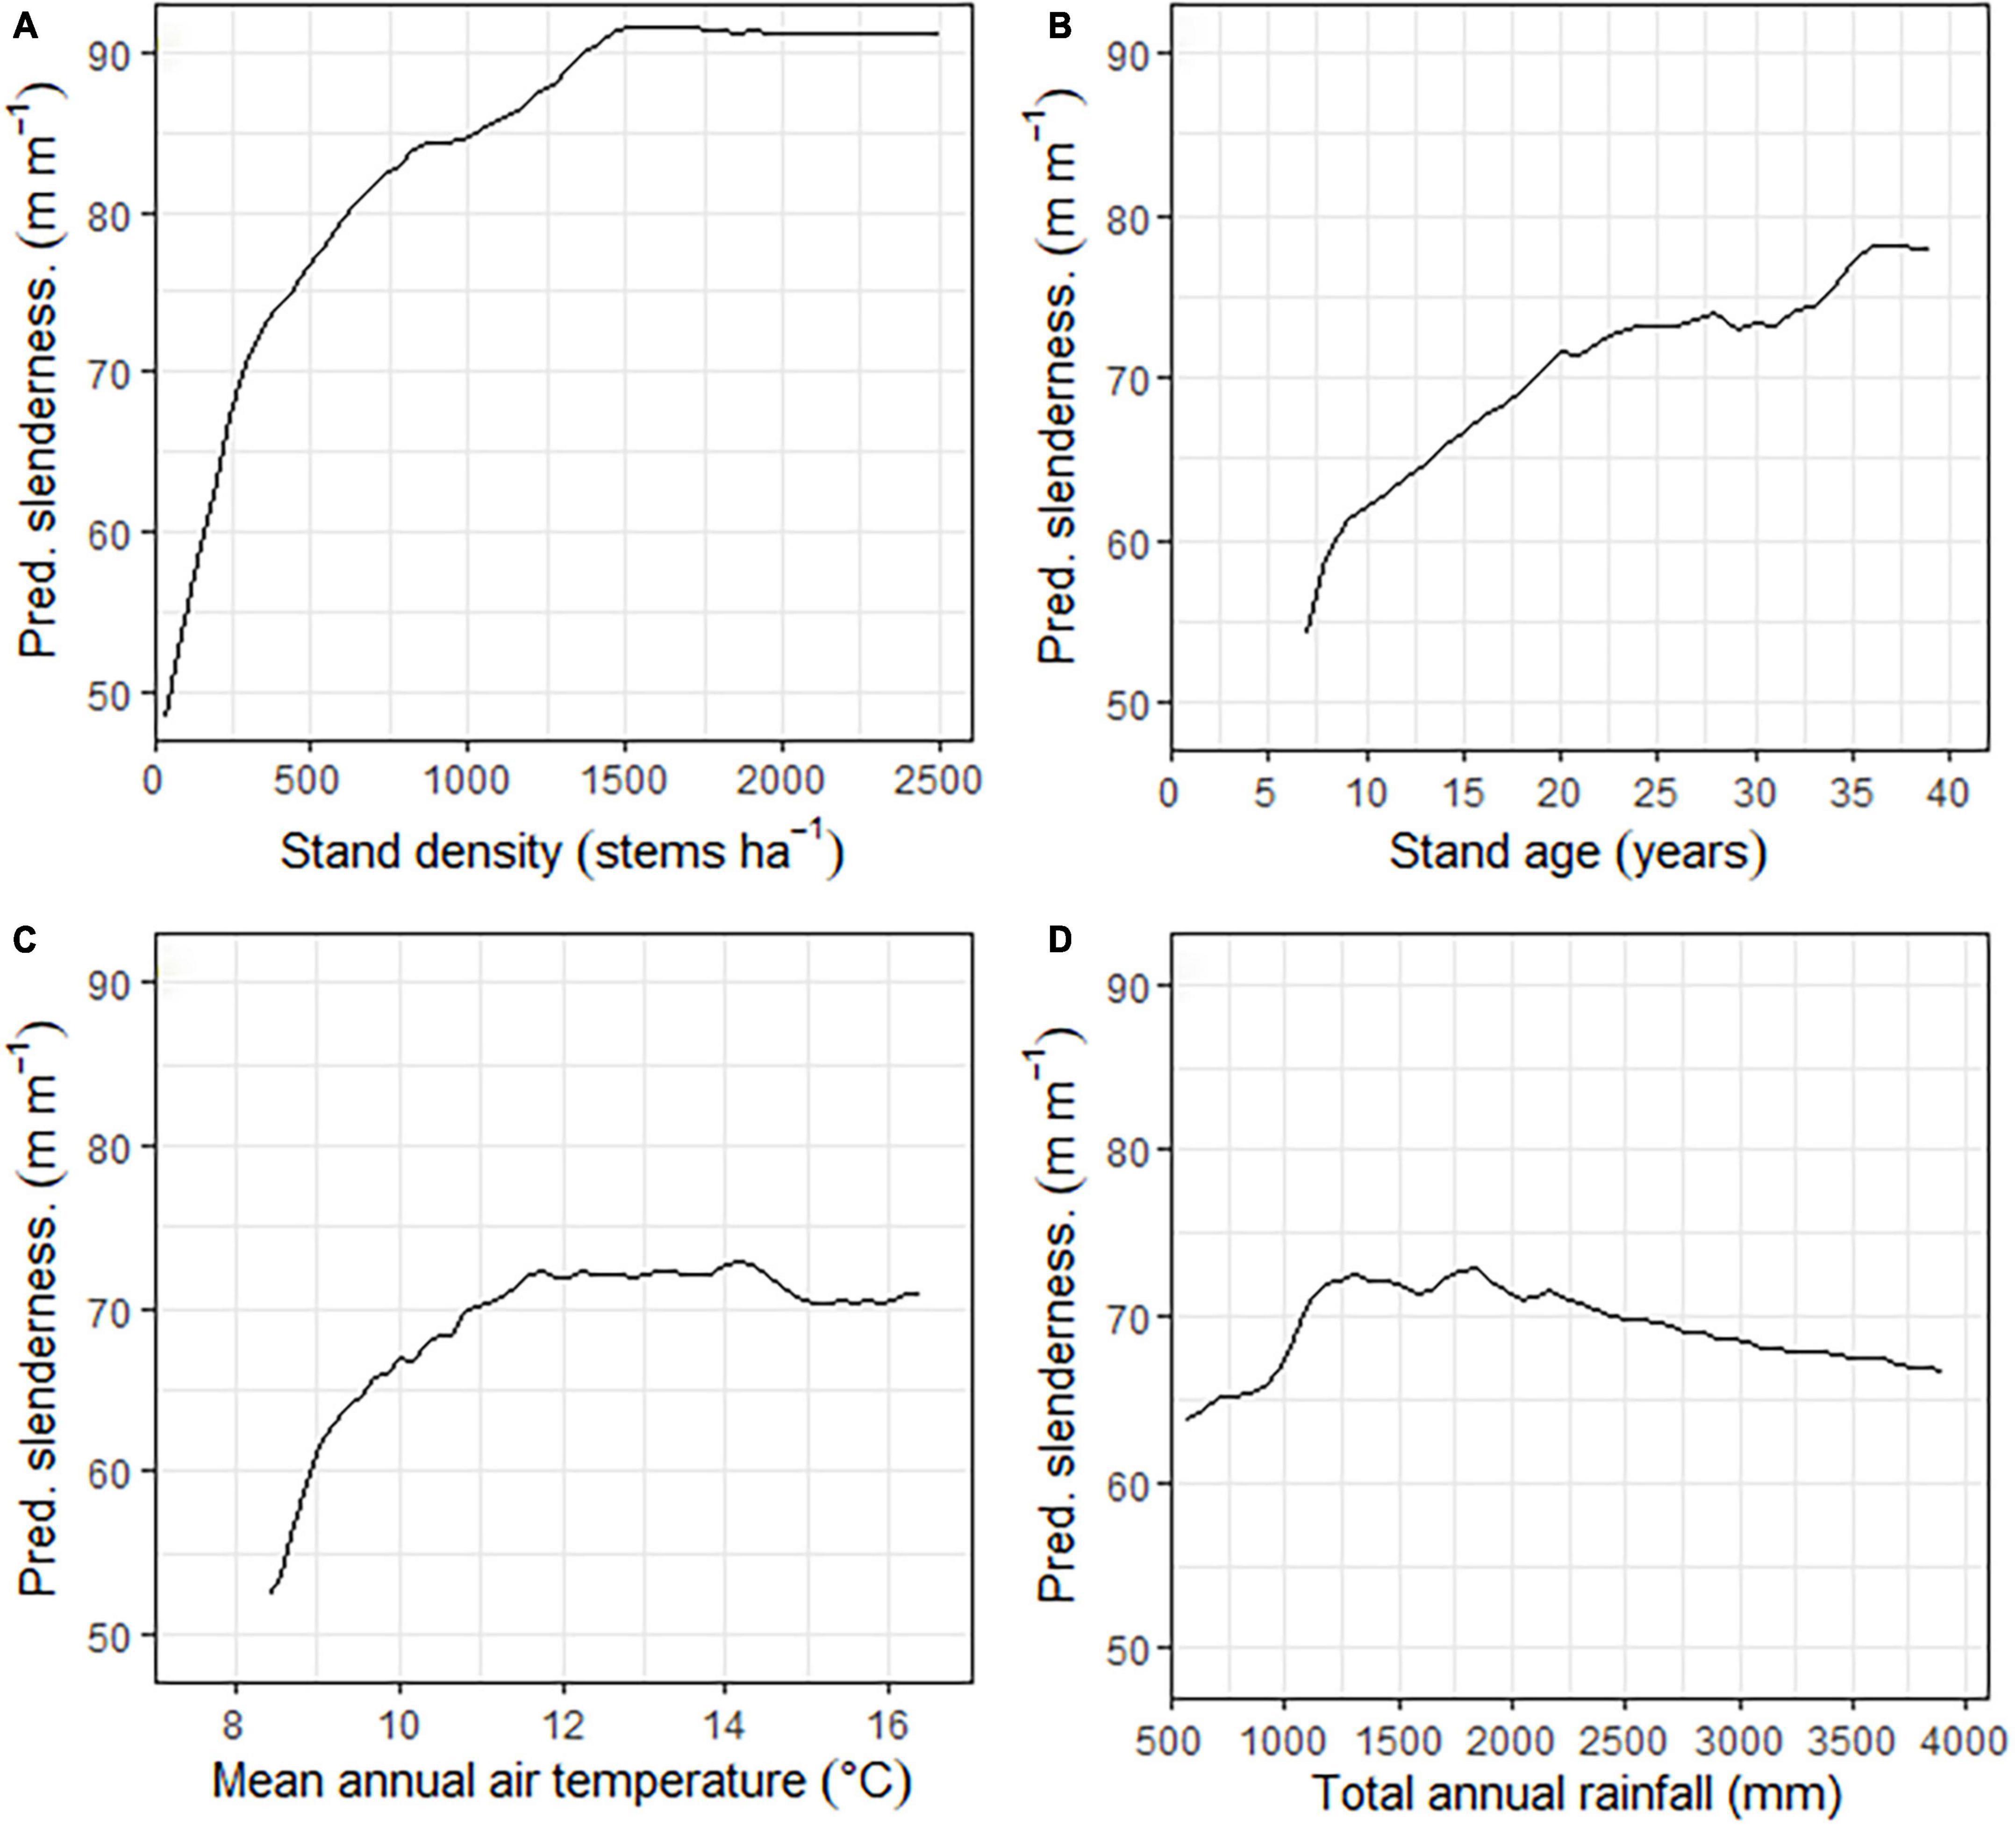
Figure 3. Partial response functions for the final model showing the response of predicted slenderness to (A) stand density (B) stand age, (C) mean annual air temperature and (D) total annual rainfall.
A more detailed illustration of the partial response functions under different combinations of mean annual temperature, total annual rainfall, and stand density is shown in Figure 4. Changes in slenderness with mean annual air temperature generally showed increases to a maximum at between 12 and 15°C with the rate of change depending on the stand density and total annual rainfall. Slenderness increased more rapidly with air temperature for the two higher stand densities. Slenderness was also more responsive to air temperature as total annual rainfall increased, for all three stand densities, with values of slenderness reaching a maximum at total annual rainfalls of 1,500 and 2,000 mm year–1 above which point, slenderness increased at a lower rate. However, regardless of the stand density or rainfall, changes in slenderness stabilized above 15°C and the partial response functions had very low slope between this point and the highest mean annual air temperature of 16.4°C within the dataset. The maximum extrapolation of slenderness under the four RCPs aligned with the form of the partial response function between 15 and 16.4°C that had stabilized for all combinations of rainfall and stand density (Figure 4).
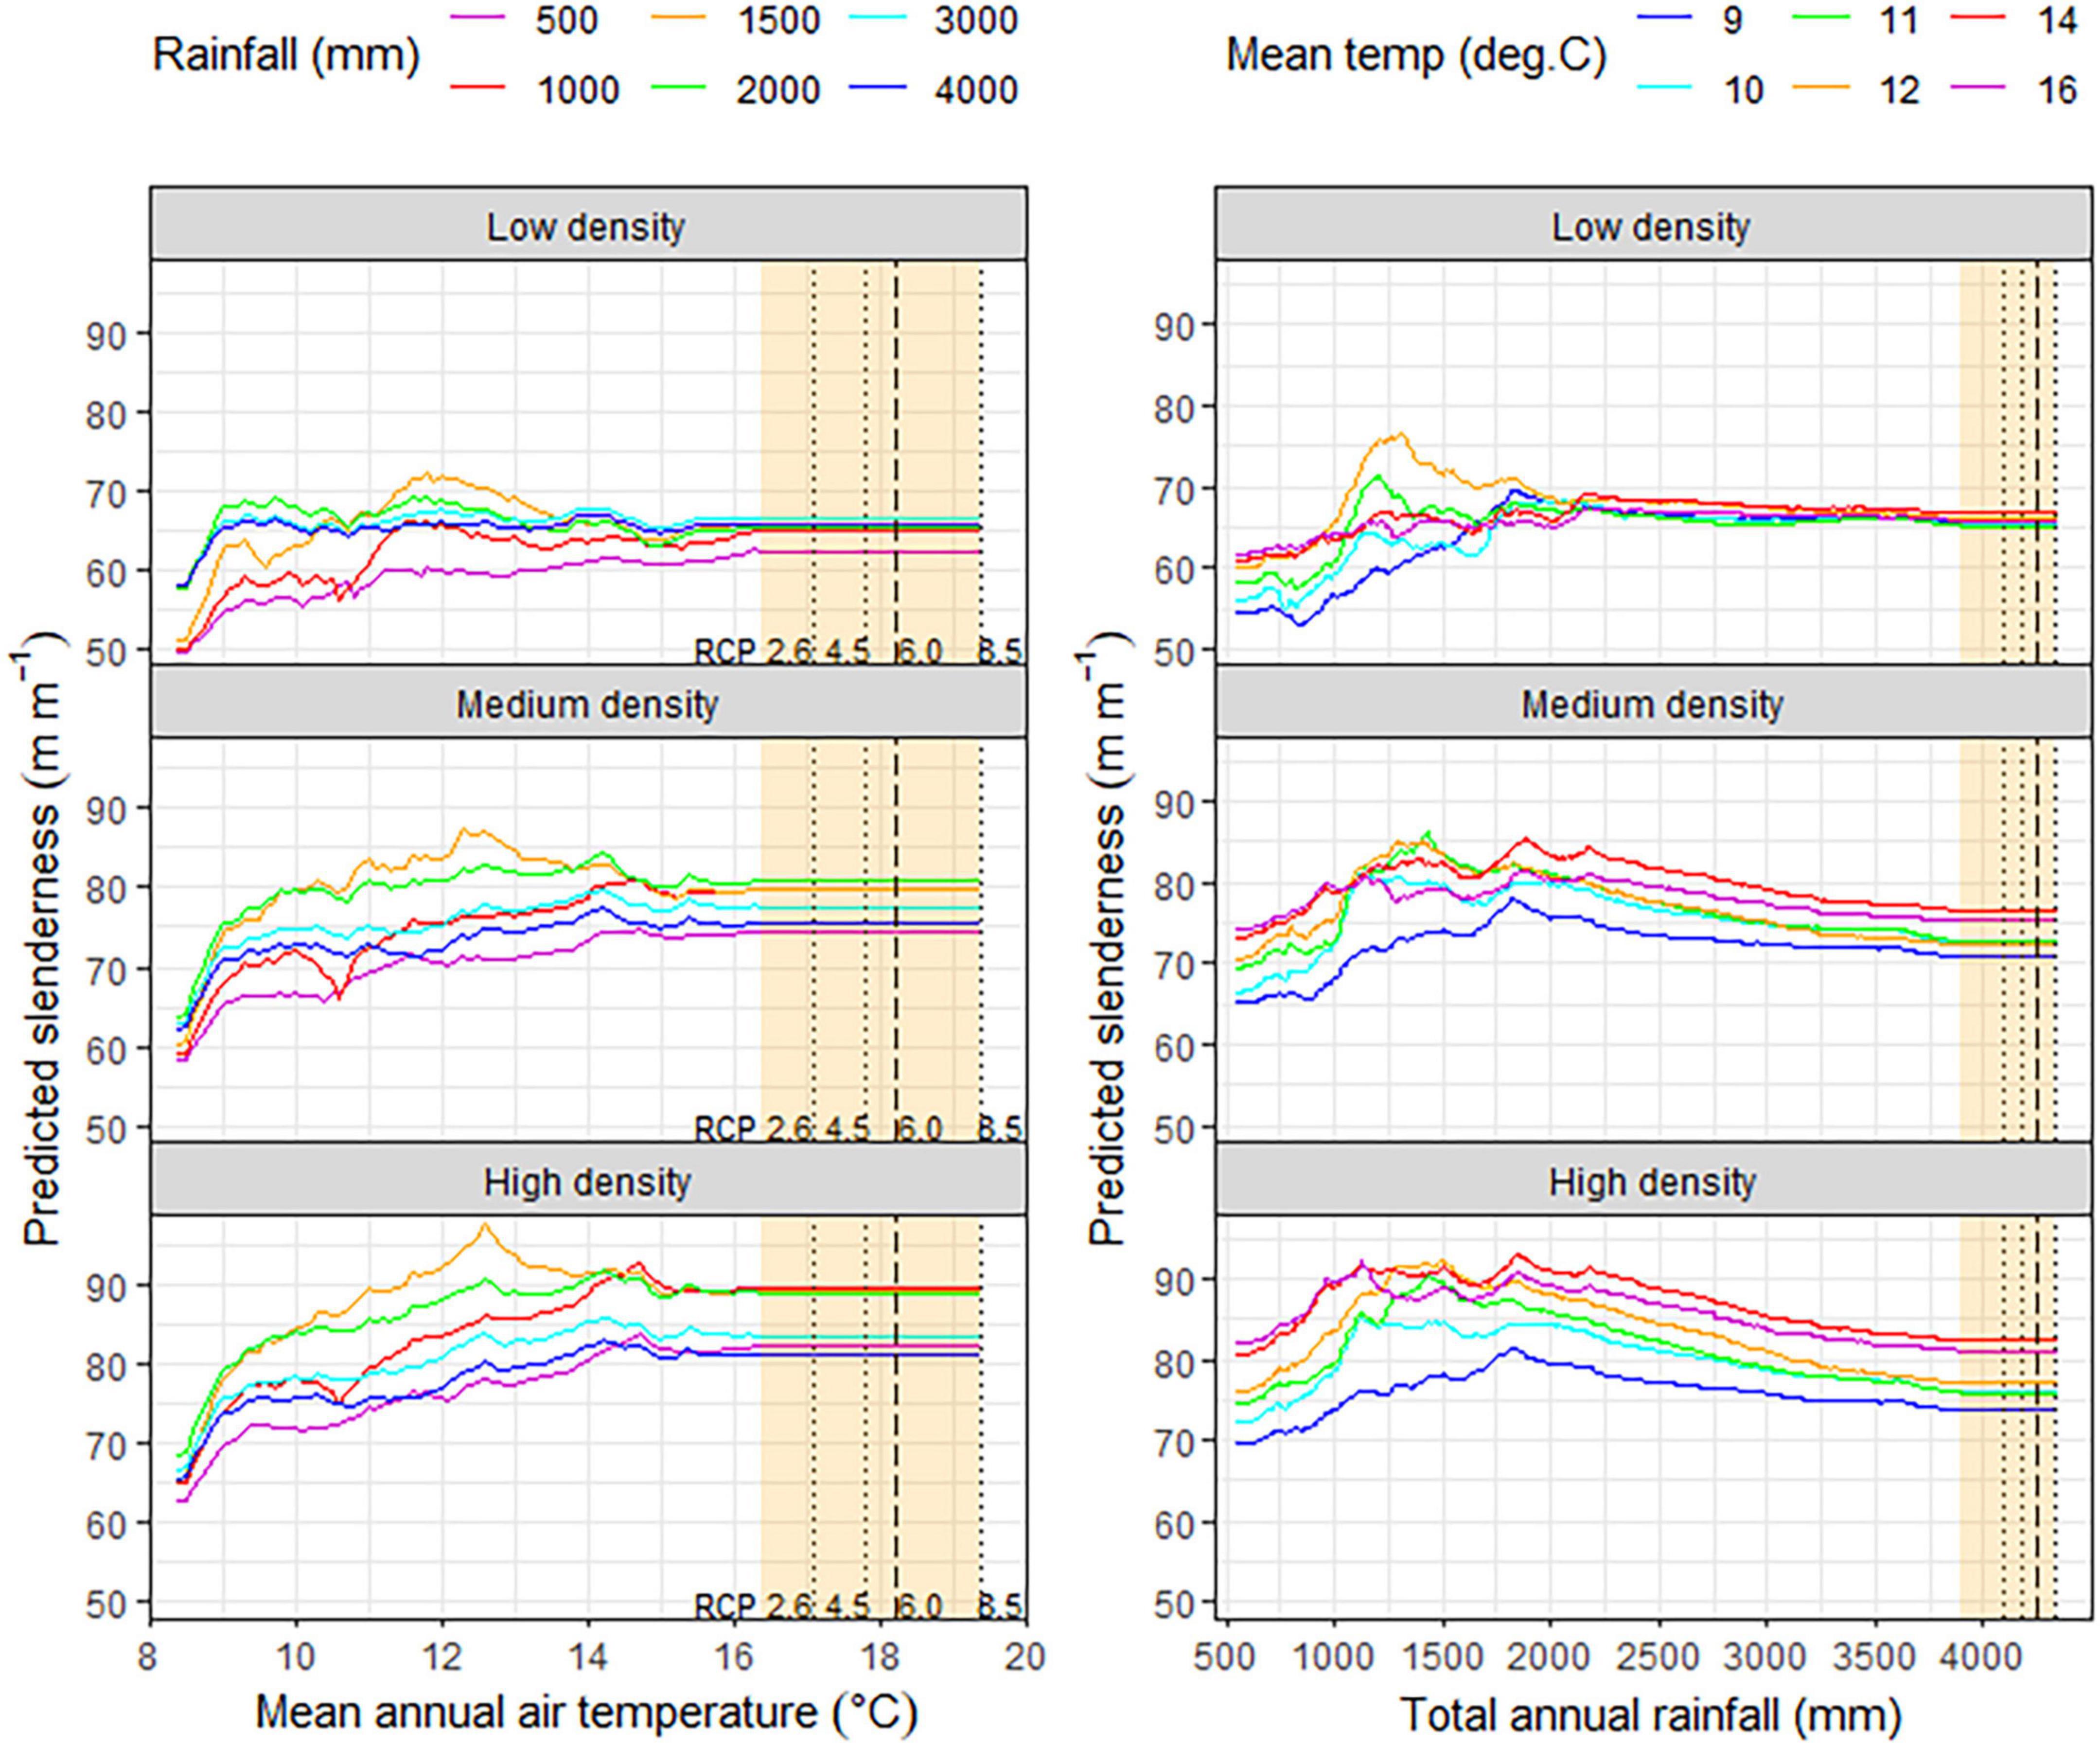
Figure 4. Partial response functions from the final model showing variation in predicted slenderness in response to (left panels) mean annual air temperature, by total annual rainfall for the three density scenarios. Also shown is variation in predicted slenderness in response to (right panels) total annual rainfall by mean annual air temperature for the three density scenarios. The maximum extent to which predictions were extrapolated for the plot data, under the four RCPs, is shown in orange on all panels. Within this orange region maximum changes in total annual rainfall and mean annual air temperature for RCP 2.6, 4.5, and 8.5 are shown as dotted lines, while RCP 6.0 is shown as a long dashed line.
Predictions show that slenderness generally increases to a constant value at a total annual rainfall of ca. 2,000 mm year–1 for the low density regime, except at two mid-range air temperatures (11, 12°C), where slenderness peaked earlier at ca. 1,250 mm year–1 but then declined to a constant value above ca. 2,250 mm year–1. In contrast, for both the medium density and high density regimes, slenderness reached a peak for all air temperatures at between 1,000 and 2,000 mm year–1, above which it declined to a relatively constant state with low slope above 3,500 mm year–1. The maximum extent to which slenderness predictions were extrapolated beyond current climate for total annual rainfall are shown on Figure 4 for predictions to 2090 under the four RCPs. Extrapolation of model predictions to this point appear to be relatively consistent with the remainder of the model predictions, under current climate, for all stand density x air temperature combinations (Figure 4).
3.2. Model predictions
3.2.1. Current climate
Under current climate the model predictions showed significant differences in slenderness among silvicultural regimes. Average slenderness values across New Zealand were 62.1 m m–1 for low density regimes, 73.5 m m–1 for medium density regimes and 79.5 m m–1 under high density regimes (Table 3). Values were markedly higher for all three regimes within the North than the South Island (Figure 5) and these regional differences diverged as stand density increased from low density regimes (66.8 vs. 59.0 m m–1) to high density carbon regimes (88.1 vs. 73.6 m m–1). Similarly, the percentage of areas, likely to be at risk of wind, with slenderness values >80 m m–1, was markedly higher within the North than the South Island, for medium (65 vs. 5%) and high density regimes (95 vs. 19%), but no areas with slenderness >80 m m–1 were noted for the low density regime (Figure 5). Within all three regimes the areas with the highest values were in warm areas with moderately high rainfall, such as the central North Island (Figure 5). In contrast, the lowest values of predicted slenderness were located at cold, dry eastern regions in the South Island (Figure 5).
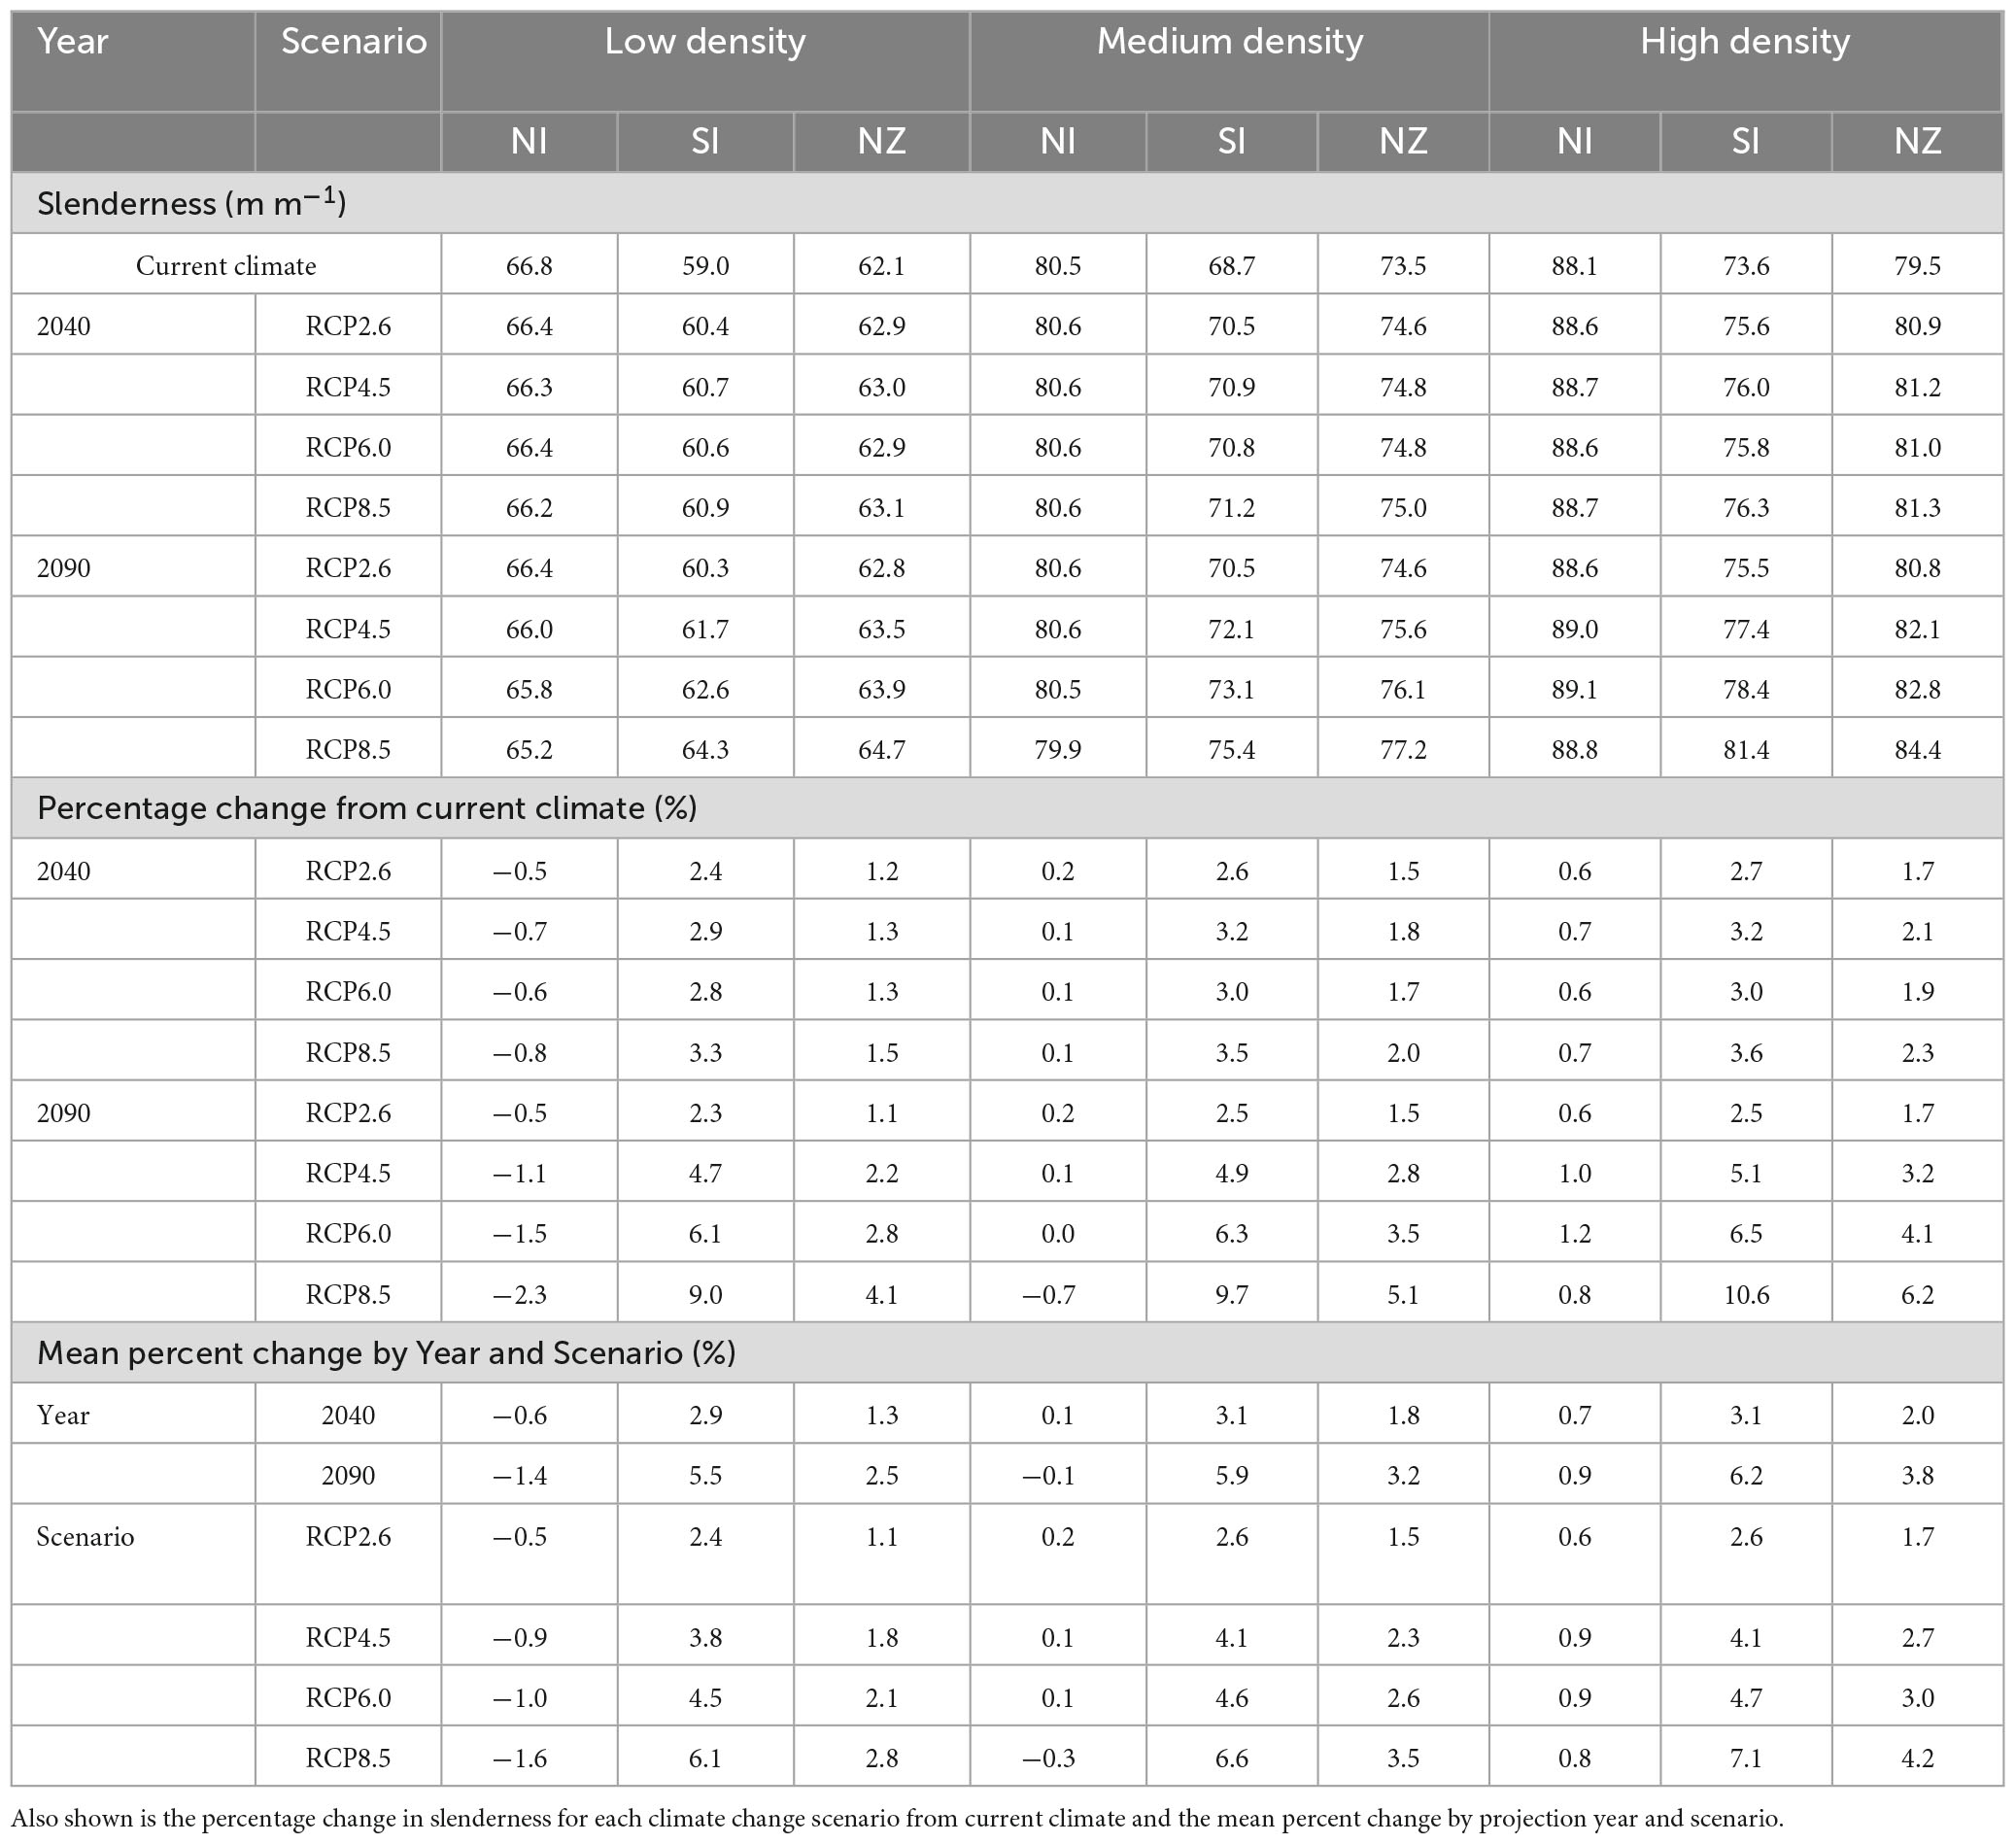
Table 3. Mean slenderness under current and future climate for the three regimes in the North Island (NI), South Island (SI), and across New Zealand (NZ).
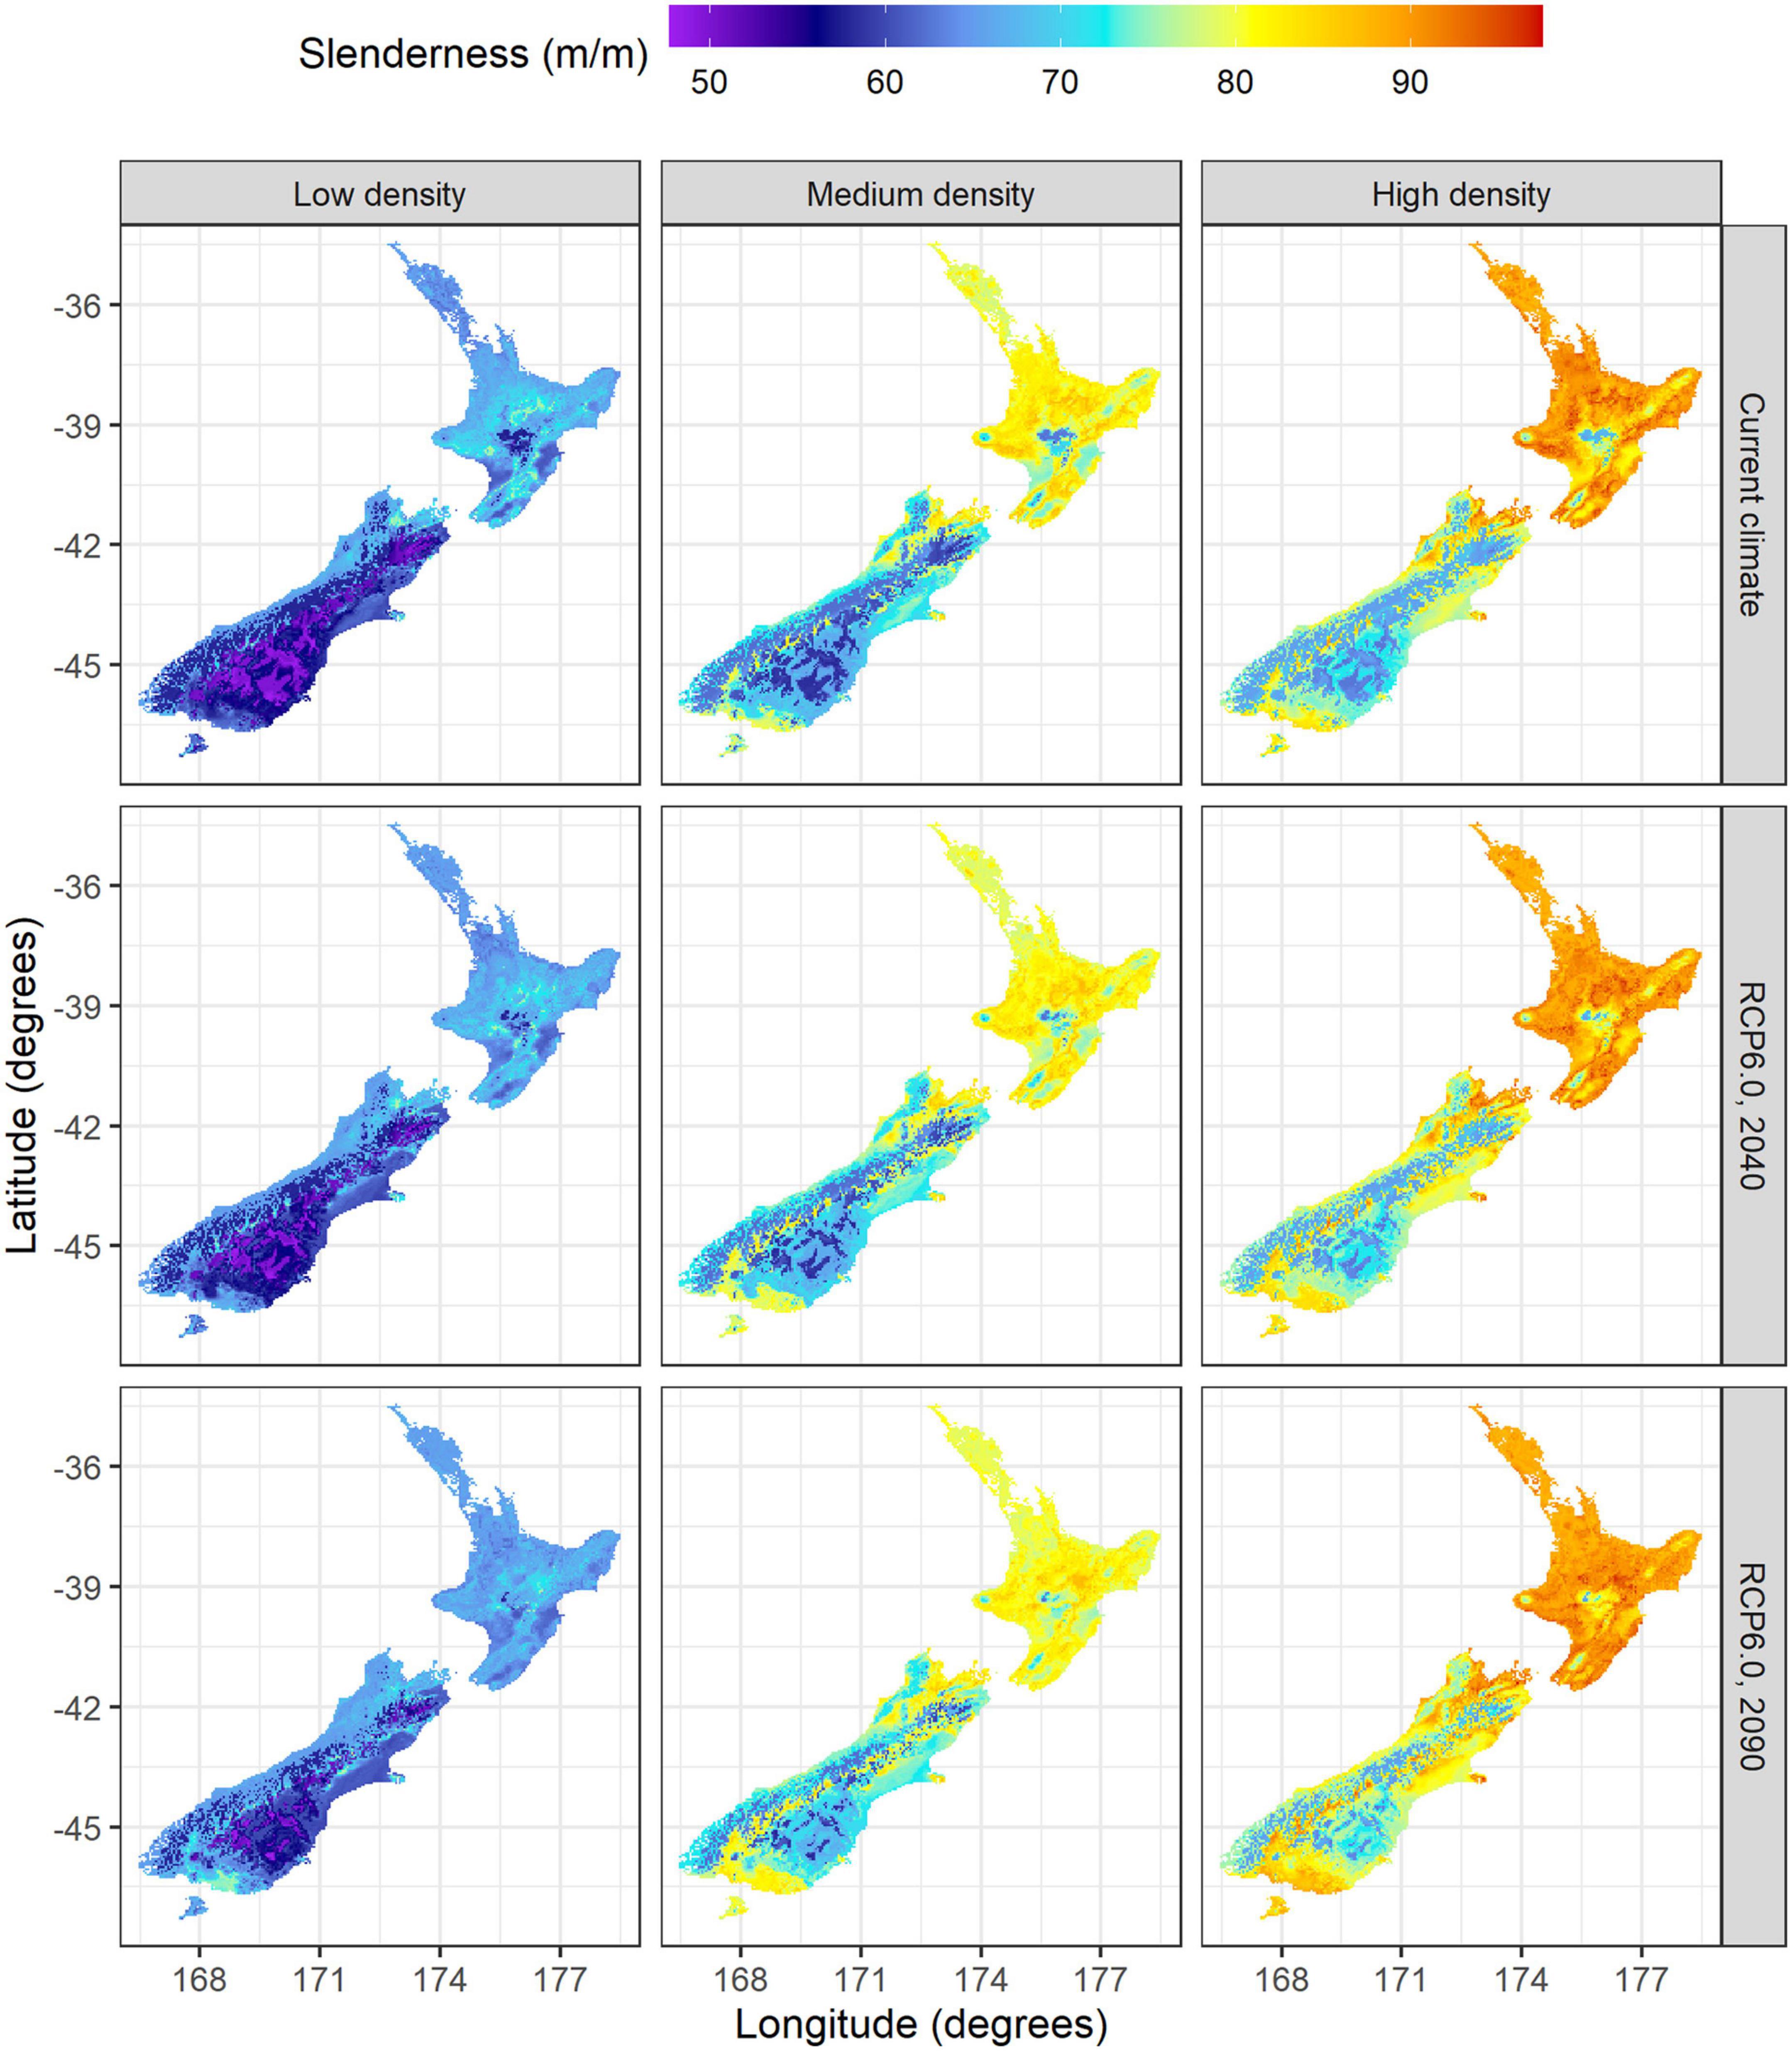
Figure 5. Spatial variation in slenderness across low (left), medium (center) and high density regimes (right) under current climate (top) and during 2040 (middle) and 2090 (bottom) for the RCP6.0 scenario.
3.2.2. Future climate
3.2.2.1. Influence of scenario and year
Compared to current climate, the projected slenderness for the low density regime increased by on average, respectively, 1.3% and 2.5% to 2040 and 2090 within New Zealand (Table 3). These mean increases were similar between the four climate change scenarios to 2040 (1.2–1.5%) with more marked changes occurring to 2090 (range of 1.1 to 4.1%). Slenderness increased with the projected severity of climate change with the highest mean slenderness of 64.7 m m–1 occurring under the RCP8.5 scenario in 2090 (Table 3).
Percentage changes in slenderness, relative to current climate, were more marked for the medium density regime, with the mean value increasing by 1.8% and 3.2% to 2040 and 2090, respectively (Table 3). Changes in slenderness were greater between scenarios for the 2090 projections (1.5–5.1%) than 2040 projections (1.5–2.0%). More marked increases in slenderness were noted under climate change projections with higher RCPs, with the highest value of 77.2 m m–1 occurring during 2090 under the RCP8.5 scenario (Table 3).
Amongst the three scenarios, percentage changes in slenderness were greatest for the high density regime with mean values for New Zealand increasing by 2.0% and 3.8% to 2040 and 2090, respectively (Table 3). Although there was slight interchange between RCP4.5 and RCP6.0, increases generally followed the severity of the climate change projections, with percentage changes ranging from 1.7 to 2.3% for 2040 scenarios and 1.7–6.2% for the 2090 scenarios. The highest mean slenderness of 84.4 m m–1 occurred during 2090 under the RCP8.5 scenario (Table 3).
3.2.2.2. Regional variation
Changes in slenderness under future climate varied markedly between the North and South Island. Within the North Island mean changes in slenderness were relatively low to 2040 and 2090 across all four scenarios for the three silvicultural regimes. Slight reductions in slenderness occurred for the low density regime, with values reduced by on average 0.6% and 1.4% to 2040 and 2090 (Table 3). Little overall mean change in slenderness was noted for the medium density regime while there was a slight increase in slenderness for the high density regime, which showed mean increases of 0.7% and 0.9% to 2040 and 2090, respectively (Table 3). Generally, increases in the RCPs resulted in slight reductions in mean projected slenderness within the North Island for all three regimes (Table 3).
Projections using the RCP6.0 scenario showed moderate spatial variation in slenderness (Figure 5) and percentage changes in slenderness under future climate for the North Island (Figure 6). The most marked increases in slenderness within the North Island occurred within colder central regions or in high elevation areas and were greatest for the high density regime in 2090 (Figure 6). The areas where slenderness increased, relative to current climate, were lowest for the low density regime, with this area, respectively, comprising 42 and 38% of the North Island for projections to 2040 and 2090 (Figure 6). The percentage of North Island areas with increases in slenderness scaled positively with stand density and comprised 59% in 2040 and 56% in 2090 for the high density regime. A frequency distribution of slenderness shows that, compared to predictions under current climate, the range in slenderness narrowed for all three regimes under climate change within the North Island and these changes were most marked for the 2090 scenario (Figure 7).
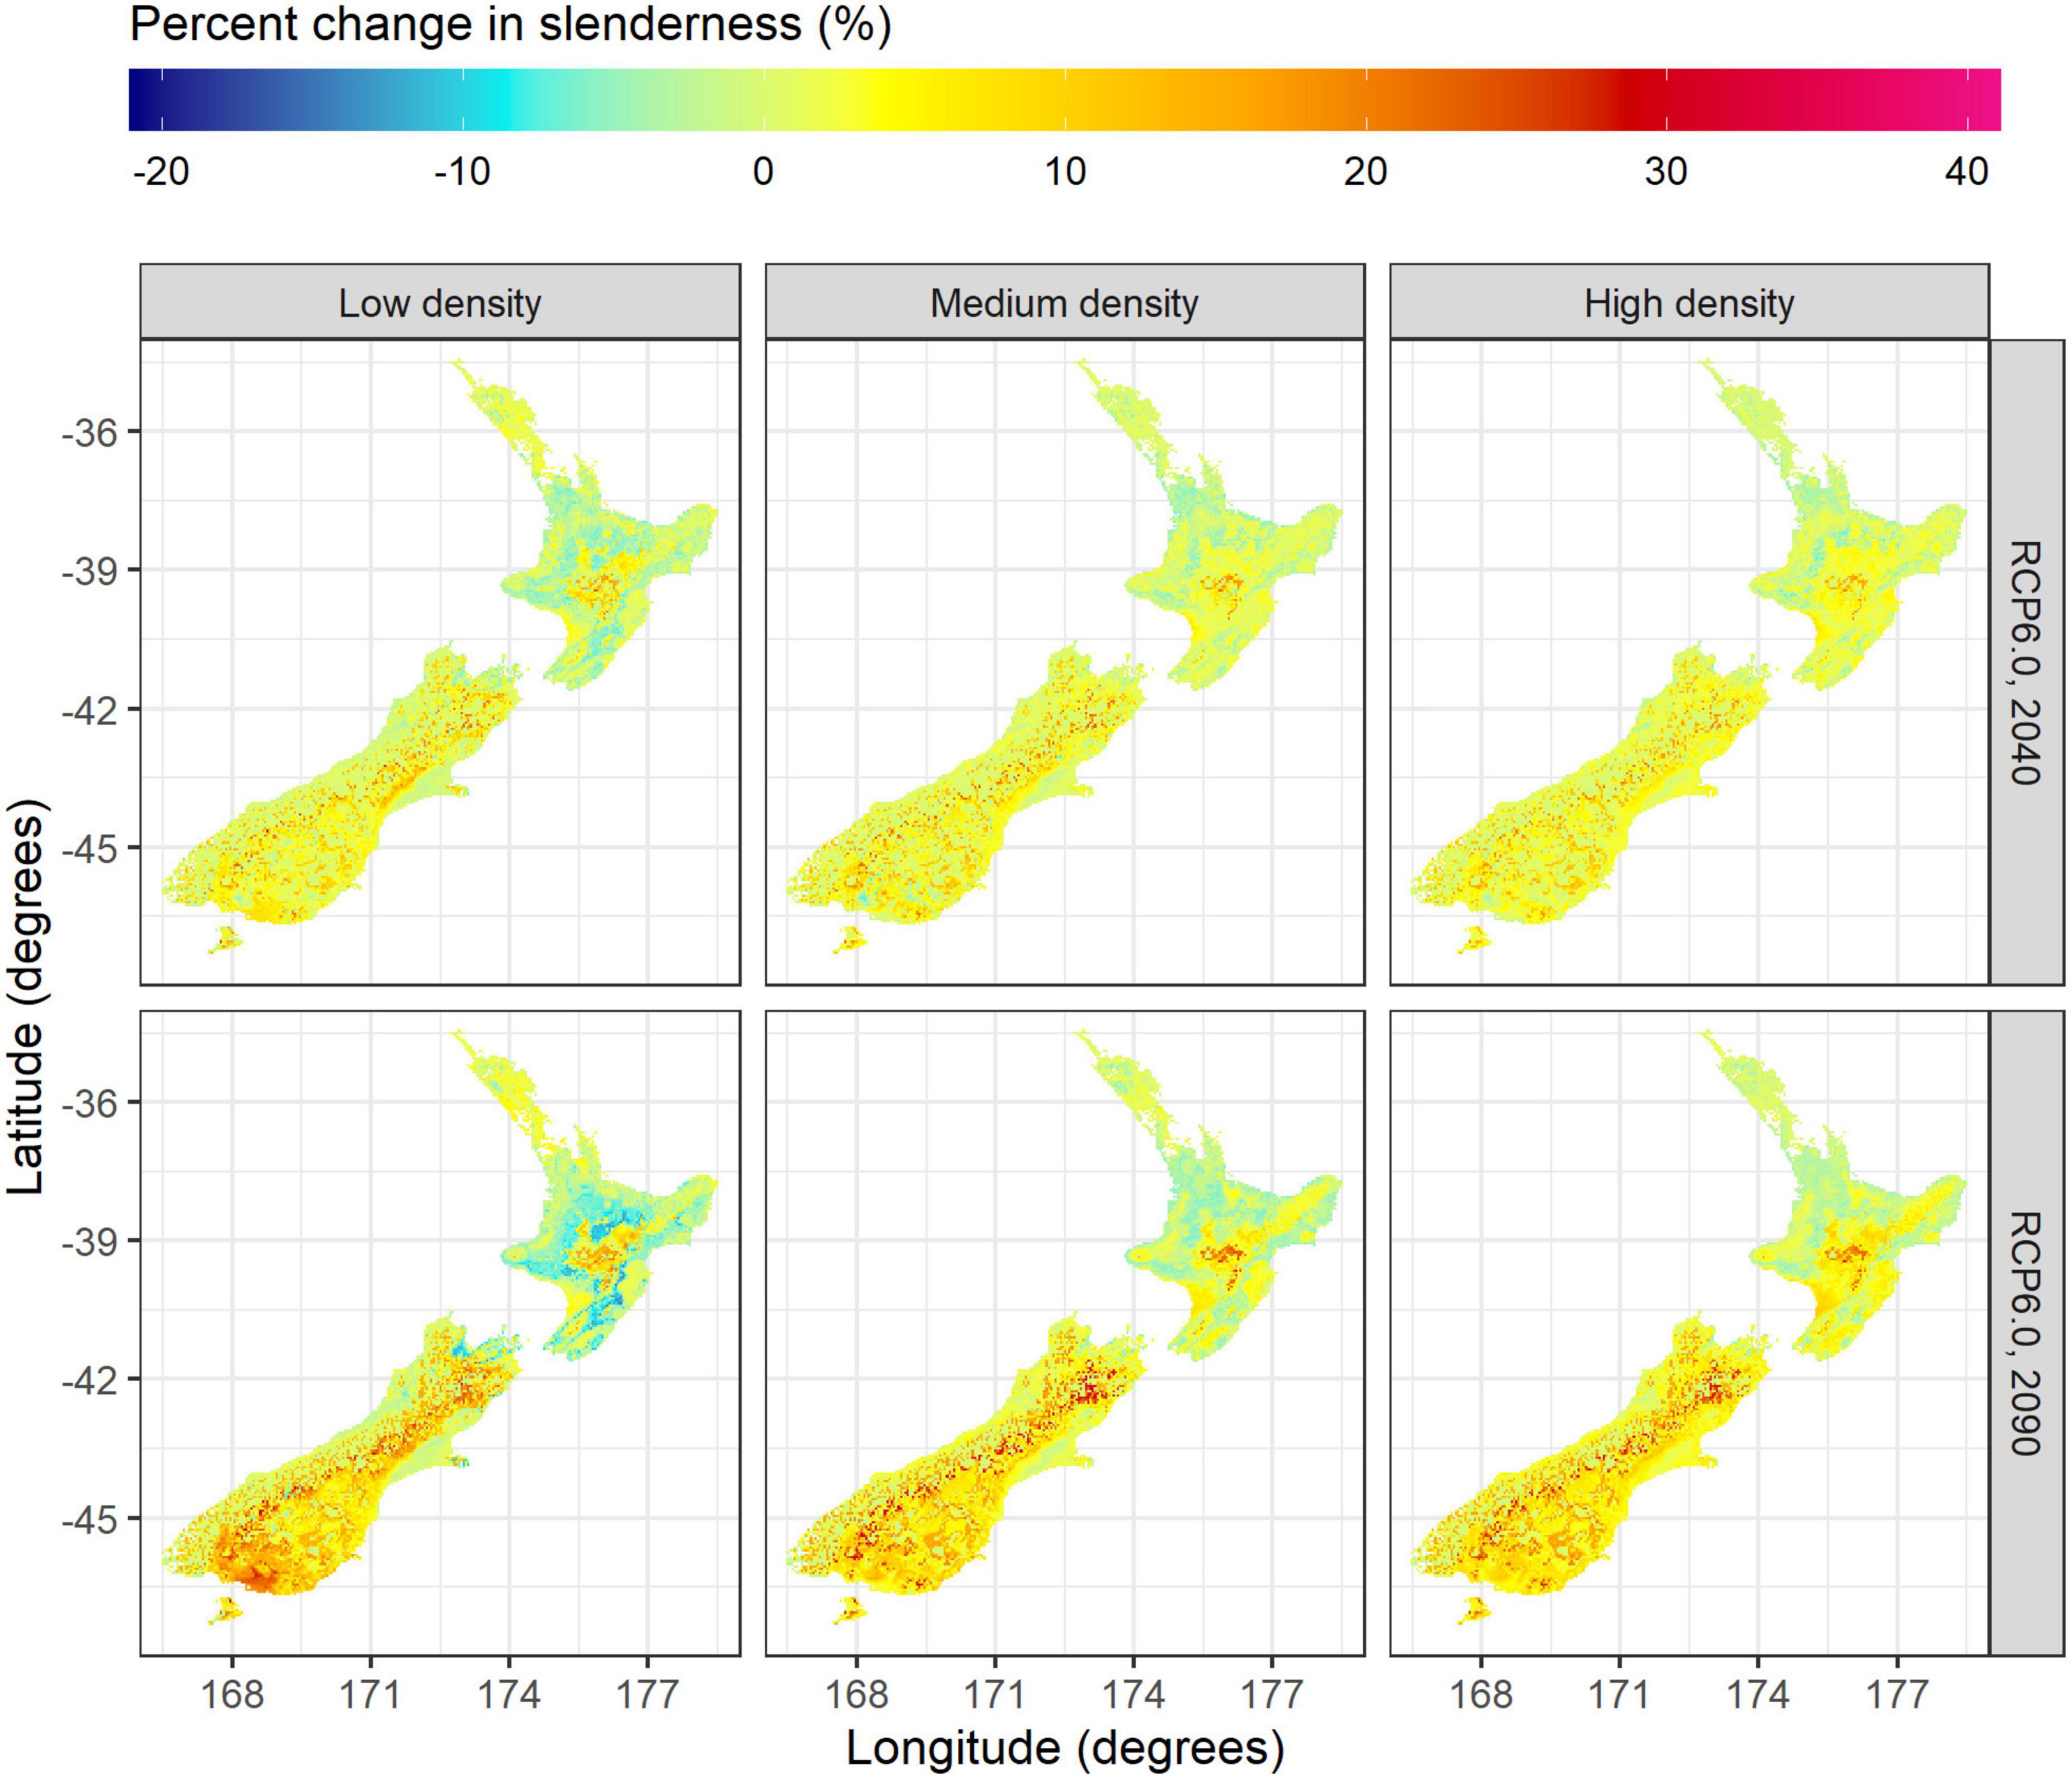
Figure 6. Spatial variation in the percentage change of slenderness between future and current climate, across low (left), medium (center) and high density regimes (right) during 2040 (top) and 2090 (bottom) for the RCP6.0 scenario.
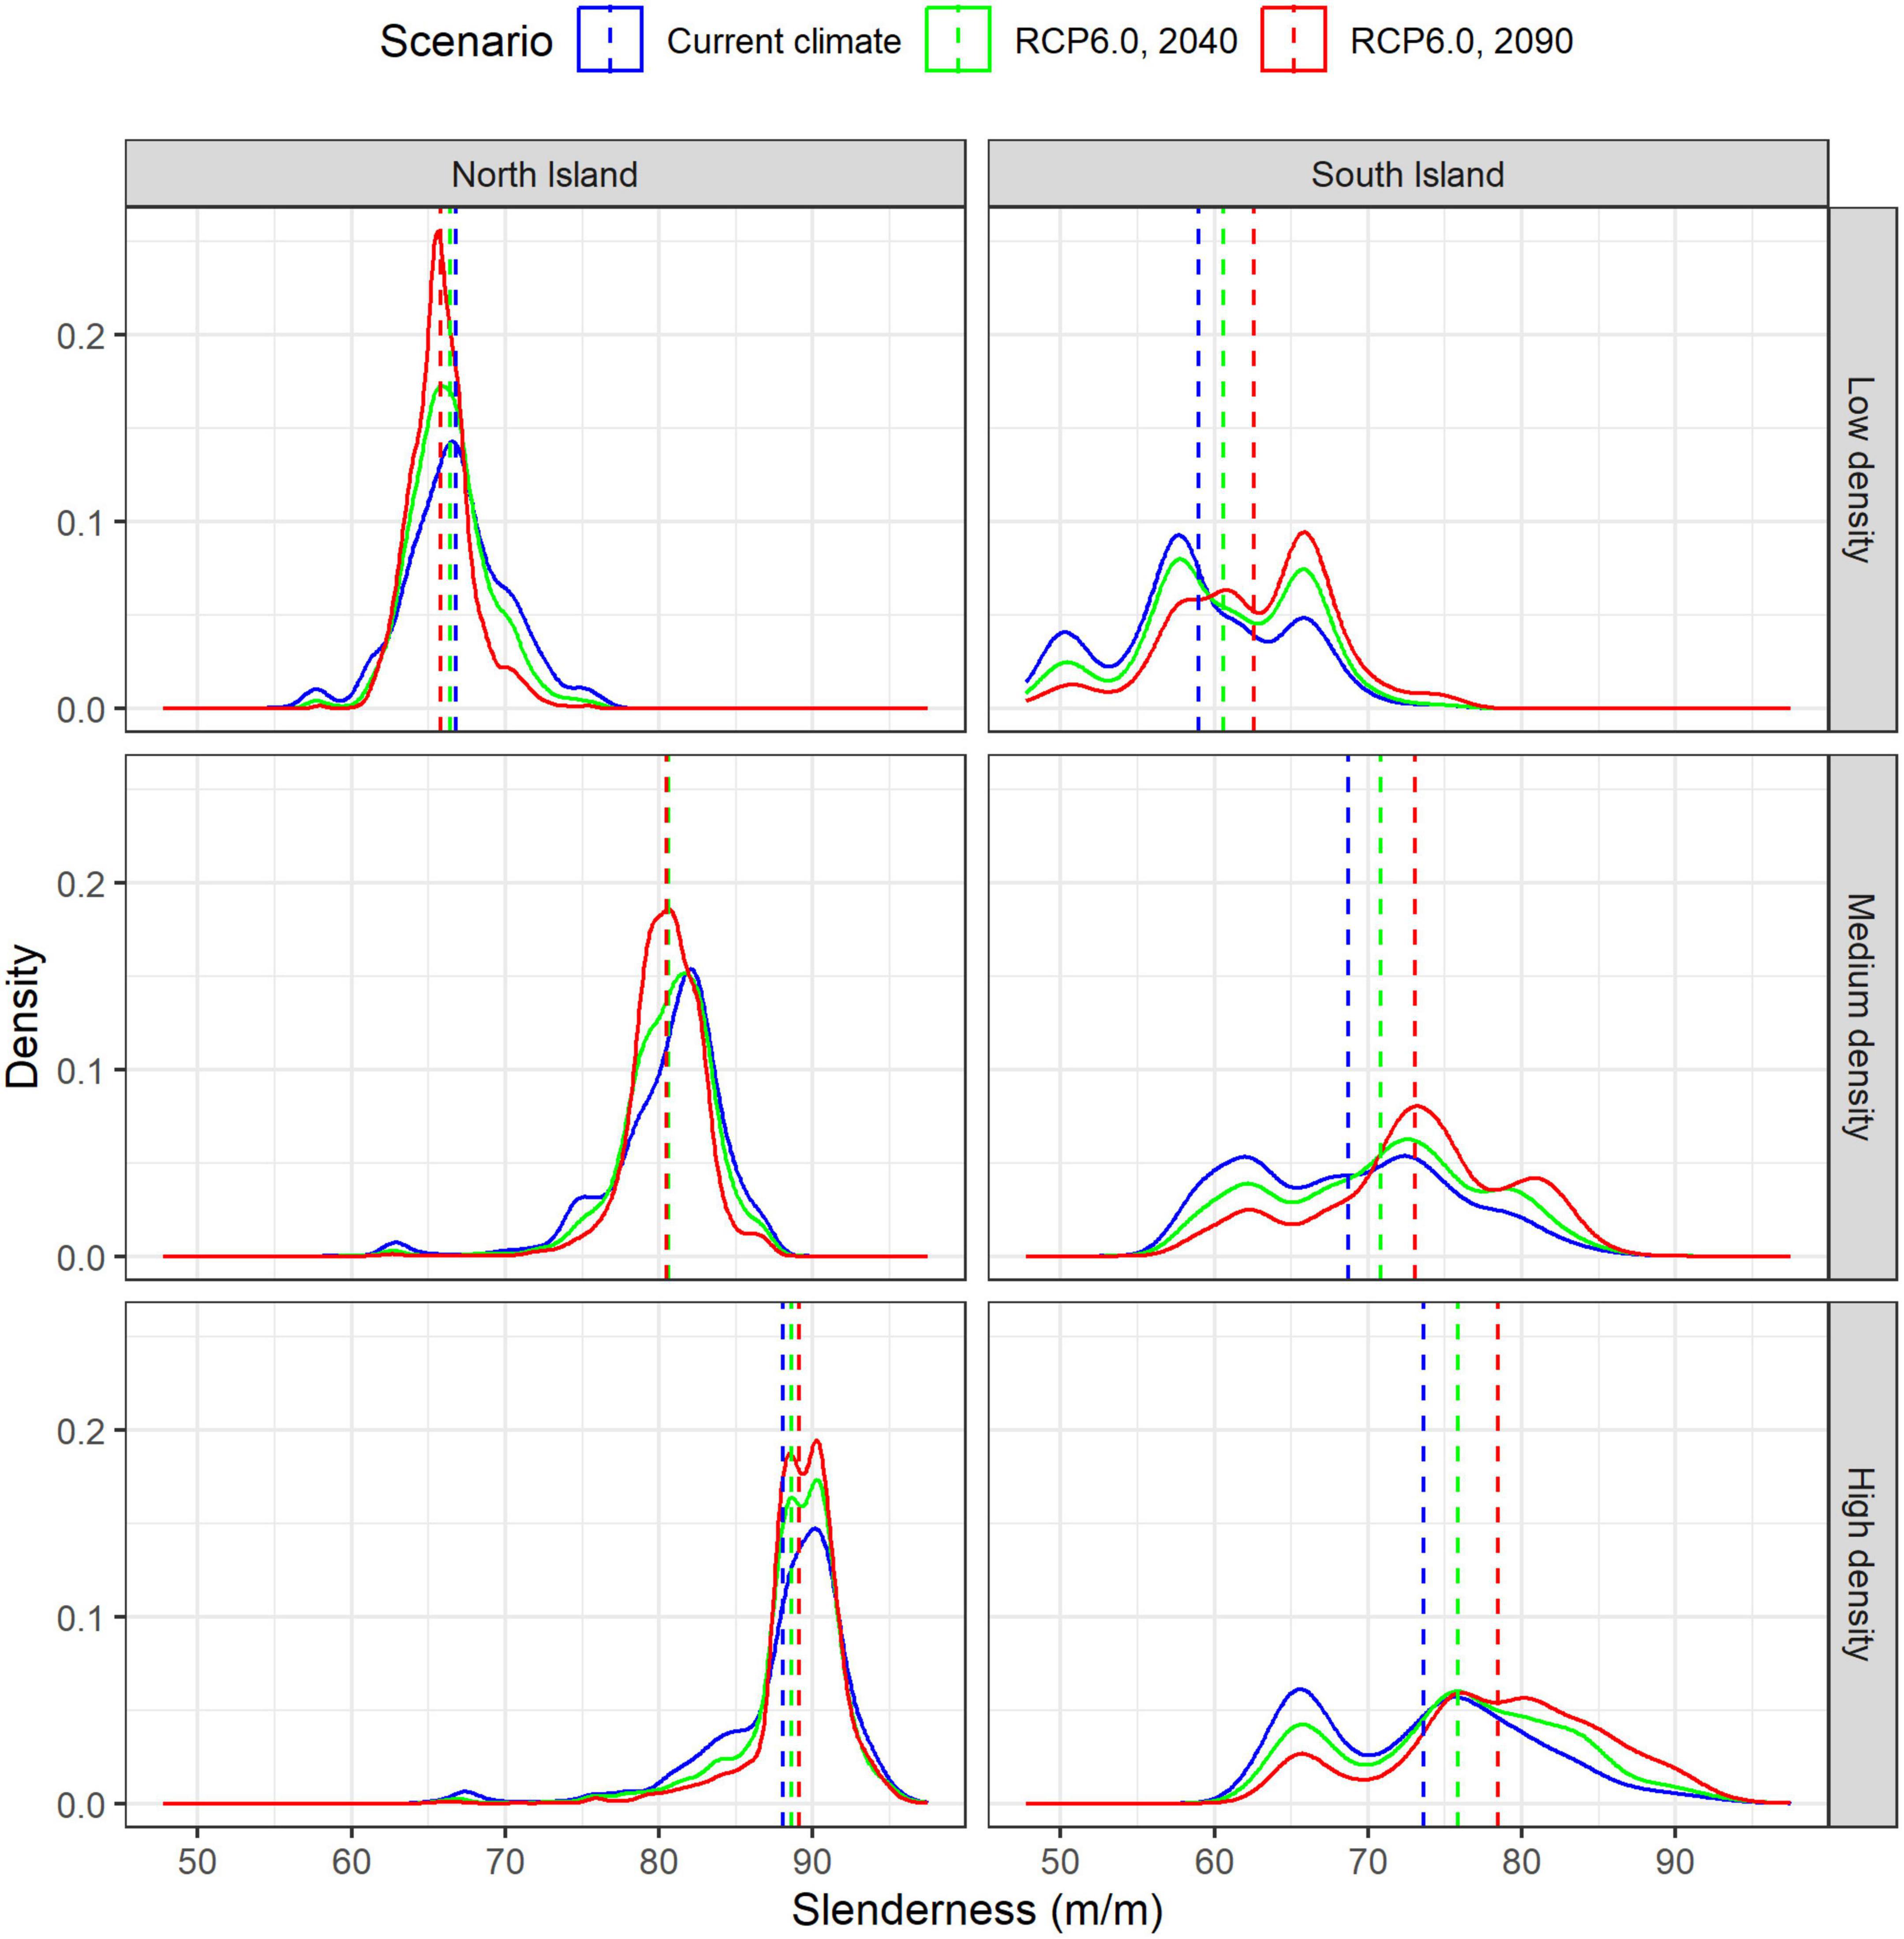
Figure 7. Frequency distribution in slenderness across low (top), medium (center) and high density regimes (bottom) within the North (left) and South Island (right) under current climate and future climate under the RCP6.0 scenario. Overlaid on the frequency distributions are dashed lines denoting mean values under current climate and the two climate change scenarios. The two dashed lines that are not visible on the figure for the left hand middle panel (i.e., current climate and RCP6.0, 2040) underlay the RCP 6.0, 2090 line.
In contrast, moderate increases in slenderness were projected throughout most of the South Island. Averaged across scenarios, mean percentage increases, were relatively similar for all three silvicultural regimes with gains ranging from 2.9 to 3.1% by 2040 and 5.5–6.2% by 2090 (Table 3). The magnitude of gains in slenderness increased with the RCP. For RCP8.5 projected increases in slenderness were 3.3, 3.5, and 3.6% to 2040 and 9.0, 9.7, and 10.6% to 2090 for the low, medium and high density regimes, respectively (Table 3).
Projections under the RCP6.0 scenario show increases in slenderness across the majority of the South Island. The area with increases in slenderness expanded over the two projection periods and with greater stand density, ranging from 68% of the South Island under the low density regime in 2040 to 88% of the South Island for the high density regime in 2090. Increases in slenderness were most marked within the dry east coast of the South Island (Figure 6). Mean increases within this region were relatively consistent between regimes and reached values of up to 35% during 2090 in cold areas, located in the south or at high elevation areas close to the Southern Alps (Figure 6).
Climate change resulted in a substantial right-hand shift of the slenderness distribution within the South Island for both projection periods (Figure 7) which suggests wind-risk is likely to increase in this region. For instance, the percentage of areas with slenderness >80 m m–1 for the medium density regime increased from 5% under current climate to 9% and 17%, respectively, for RCP6.0 projections to 2040 and 2090. Changes were even more marked for the high density regime, where this percentage increased from 19% under current climate to 30% and 43%, respectively, for RCP6.0 projections to 2040 and 2090 (Figure 7).
4. Discussion
This study shows the wide range in slenderness present in New Zealand radiata pine plantations with plot level measurements displaying a five-fold range from 26.9 to 128 m m–1. A very high proportion of this variation could be predicted by the model and, importantly, most of this variation was attributable to stand density and stand age, which can both be controlled by forest managers. Model predictions showed that older stands grown under high density carbon regimes in the North Island to be at most risk of windthrow as slenderness values of almost all predictions in this region exceeded the threshold of 80 m m–1.
Stand density had the strongest influence on slenderness and vulnerability to windthrow. The substantial impact of stand density on slenderness or H/D ratio has long been recognized in a range of conifer species (Sjolte-Jorgensen, 1967), including radiata pine (Waghorn et al., 2007; Castedo-Dorado et al., 2009). Under current climate, carbon regimes with high slenderness are likely to be at moderate to high risk from windthrow, in most North Island areas, particularly as rotation lengths for these regimes are typically longer than those of stands managed for timber. In contrast, predicted slenderness for the low density clearwood regime was relatively low throughout New Zealand and these stands are expected to be less vulnerable to windthrow, all other factors being equal. The slenderness of medium density structural grade regimes was intermediate between these two extremes and there is considerable potential for mitigating risk to these stands through appropriate silvicultural management.
Thinning to lower final crop stand density at a young age is a silvicultural intervention that can markedly reduce wind vulnerability, but this mitigation needs to be balanced against potential reductions in crop value. For instance, the optimal final crop stand densities for medium density structural grade regimes have been found to regionally vary, but average 603 stems ha–1 across New Zealand plantations (Watt et al., 2017a). Although the internal rate of return declines when final crop stand densities are reduced below this optimal value (Watt et al., 2017b) it may be prudent to reduce these stand densities in some areas to mitigate wind risk. This silvicultural intervention is likely to be most effective in areas with high slenderness (i.e., >80 m m–1) that are periodically subject to damaging storms with high wind speed and intense rainfall, such as north-eastern and central parts of the North Island.
The strong influence of age in the final model demonstrates that reductions in rotation length are also an important tool for managing wind risk. The age related increases in slenderness, found here, align with increases in wind damage probabilities simulated by mechanistic models at higher ages for Sitka spruce (Gardiner and Quine, 2000), Maritime pine (Cucchi et al., 2005), and radiata pine (Moore and Gardiner, 2001).
The two environmental variables included within the final model made physiological sense and are aligned with previous growth responses of radiata pine. The rapid increases in slenderness from cold dry sites to warm regions with adequate rainfall show that height growth is far more responsive to air temperature and rainfall than diameter growth, over this sub-optimal region, which is consistent with previous research (Watt and Kirschbaum, 2011; Watt et al., 2021). Further increases in air temperature and rainfall resulted in, respectively, little change and reductions in slenderness. Growth of radiata pine has been shown to decline under these conditions (Watt et al., 2021) and findings from this study suggest that these reductions in height and diameter are equivalent at high air temperatures, but that diameter growth is reduced more than height at high rainfall, which is supported by previously developed models (Watt et al., 2021).
Climate change impacts on slenderness and wind risk were relatively low within the North Island but moderate to high within the South Island. This disparity occurred as the model predictions showed that most changes in slenderness occurred up to 12°C (Figures 3, 4), which is a mean annual air temperature that separates most regions within the South Island from the majority of lower elevation areas in the North Island (Figure 1). Consequently, the changes in slenderness under climate change within the North Island were highest within higher elevation central North Island areas where mean annual air temperatures are currently lower than 12°C. Similarly, the substantial increases in slenderness within the South Island were mainly attributable to increases in air temperature under climate change which shifted values toward this value of 12°C. While air temperature was the main determinant of changes in slenderness, values were further modified by rainfall shifts under climate change, which are generally predicted to decline in the north and east of the North Island but increase within other areas (Ministry for the Environment, 2018).
Previous research has highlighted the limitations of random forest when used for extrapolating beyond the data to which the model is fitted (Sabatia and Burkhart, 2014; González-Rodríguez and Diéguez-Aranda, 2021). Specifically, random forest models cannot predict outside the maximum observed range for the response variable and it can be difficult to obtain reliable predictions beyond the combinations of independent variables used to fit the model. This is an issue when the model is fitted to a relatively low combination of environmental conditions (e.g., cold-dry) and predictions are then made for a different combination of environmental conditions (e.g., warm-dry or warm-wet conditions) through either, spatial or temporal extrapolation, or a combination of both. Despite these potential limitations, it does not appear that either of these constraints were limiting in this study as the dataset and fitted model had features, described in more detail below, that suited the random forest algorithm.
Partial response functions showed that slenderness stabilizes at mean annual air temperatures of ca. 12.0–15.0°C and significant further changes were not noted up to the maximum current air temperature of 16.4°C. Predictions of slenderness above this air temperature by random forest maintain this stationary phase as this is a feature of the algorithm. Assuming that RCP6.0 is a relatively likely climate change scenario, mean annual air temperature is likely to increase by 1.8°C to 2090 (Ministry for the Environment, 2018) and forests in the far north of New Zealand would reach air temperatures of 18.2°C. Compared to the mean annual air temperature range of 8°C, over which radiata pine occurs within New Zealand, an extrapolation of 1.8°C is not large, particularly when slenderness appears to stabilize at high air temperatures. Even if slenderness does not stabilize, only 11% of plantation forests in the far north of the North Island (NZFOA, 2022) would be subject to any prediction error beyond the range of current temperatures.
Similarly, slenderness appears to show clear stationary behavior at high values of total annual rainfall. Little change in slenderness was noted above a total annual rainfall of 3,500 mm, which is within the range of model predictions under current climate. Under climate change, total annual rainfall is only projected to increase above the current range where plantations occur, to values of 4,252 mm by 2090 for RCP6.0 (Ministry for the Environment, 2018). However, even if this assumed stabilization is incorrect, any errors in these climate change predictions would be limited to forests on the west coast of the South Island that constitute only 2% of the total plantation resource (NZFOA, 2022). Climate change projections to 2090 using all RCPs (Ministry for the Environment, 2018) show that total annual rainfall to 2090 will not be reduced below the lowest values under current climate within the fitting dataset, so extrapolation to drier conditions under climate change was not required.
As projections did not extend greatly beyond the range of the current data, the vast majority of climate change impacts on slenderness shifted values to a different set of air temperature x rainfall combinations, which were currently found in New Zealand plantation forests. This extrapolation to conditions found on other sites could be a limitation under circumstances when only a small set of environmental conditions are present within the training dataset, as has been previously noted (Sabatia and Burkhart, 2014; González-Rodríguez and Diéguez-Aranda, 2021). However, as the model described here was built on an extensive dataset that included almost every possible combination of air temperature x rainfall present within New Zealand plantations (cold-dry, cold-wet, warm-dry, warm-wet), it is likely that climate change predictions shifted slenderness to a set of conditions, already characterized elsewhere by the model within the training dataset.
Similarly, given this comprehensive environmental range, predictions in areas without plot data are likely to be reasonably robust, as was evidenced through the high accuracy of predictions on the withheld test dataset. Caution should be exercised when applying the model to areas well outside of the fitted dataset, with extremely cold (<7°C) and or wet conditions (>5,000 mm), such as the southwest of the South Island and areas close to the Southern Alps. Although predictions were generally reasonable in these regions (i.e., low slenderness was predicted) there were some high altitude areas where slenderness was slightly higher than expected. However, is worth noting that forests are unlikely to be established in these areas, either now or in the future, so from a practical perspective this is not likely to be a significant limitation of the model approach or predictions.
Under the circumstances described here the random forest algorithm had advantages over other modeling methods. Random forest provided very accurate and unbiased predictions of slenderness under current climate. Given that partial response functions show slenderness predictions stabilize at high values of air temperature and rainfall, random forest was a useful modeling methodology in this instance, as extrapolations of slenderness were maintained in this stationary zone. This feature of the random forest model prevented unexpected predictions beyond the range of the fitted data (e.g., negative values) as often occur for parametric functions (e.g., polynomial, exponential) that are extended beyond this range without consideration of a mechanism for their behavior over these unfitted regions. Predictions of slenderness made here were not markedly higher than the values under current climate as slenderness stabilized at moderate to high air temperatures and as a result the measured slenderness range, which was very wide (26.9–128 m m–1), did not limit model predictions.
Although our predictions did not use a mechanistic model to characterize wind risk two advantages of the empirical approach used here were that it was simpler to implement and predictions covered broad spatial extent at a fine resolution. Using a more process-based approach, a mechanistic wind damage model (ForestGALES) utilized predictions from a process based growth model (CenW) to estimate wind damage for radiata pine under current and future climate at seven discrete locations within New Zealand (Moore and Watt, 2015). Consistent with results described here, this earlier research showed wind risk was greatest for carbon regimes under more extreme climate change scenarios. This increased risk under climate change was mediated through the higher slenderness predicted from CenW as radiata pine height was predicted to increase with little corresponding increase in diameter. While there was alignment between this study and these previous results, Moore and Watt (2015) do show wind risk will be higher within the North Island under climate change. Although the effects of changing air temperature and rainfall on slenderness were integrated into predictions made here, the empirical model did not account for the impacts of increasing [CO2] on growth and slenderness. However, there is considerable uncertainty around how plants will respond to [CO2] (Nowak et al., 2004; Körner, 2006; Körner et al., 2007; Hickler et al., 2015) and it is possible that there will be little response, if photosynthesis is downregulated over time (Gunderson and Wullschleger, 1994; Long et al., 1996), preferentially allocated to belowground processes (Hickler et al., 2015) or increased carbon gain cannot be matched with similarly increased nutrient supply (Kirschbaum et al., 1998; Nowak et al., 2004; LeBauer and Treseder, 2008). Further research should focus on quantifying the long-term response of radiata pine to increased [CO2] to characterize how important it is to include this effect in model predictions.
As wind speed is a critical determinant of damage, further research should better integrate predictions made here with a spatial description of the current and future wind climate as additional information becomes available. One potentially useful source of data for describing extreme wind speeds is the 99th percentile of daily average wind speeds. Although these values are lower than wind gust speeds, and as such do not represent a true extreme, the pattern of projected future changes are likely to be closely related to the true extreme (Mullan et al., 2011). Within the upper half of the North Island extreme winds are projected to decrease under climate change while only small increases are projected within the lower part of the North Island (Ministry for the Environment, 2018). In contrast, extreme wind speeds are projected to increase throughout almost all of the South Island. The largest increases in extreme daily wind speed occur in eastern parts of the South Island, with increases of up to 13% by 2090 under RCP8.5 (Ministry for the Environment, 2018). Given that this South Island region aligns with the area we have projected to have the highest increase in slenderness, further afforestation in this area should carefully consider wind risk mitigation options.
A better understanding of the intensity and the trajectory that cyclones take as they pass across New Zealand will also aid in understanding the implications of climate change on the risk of wind damage. In general terms there is likely to be a poleward shift in the track of cyclones under climate change (Mullan et al., 2011). Within the New Zealand context, previous analyses suggest this will result in a reduction in cyclone frequency over the North Island in winter and a reduction in cyclone intensity over both summer and winter (Mullan et al., 2011). However, even if cyclone frequency and intensity are reduced, any shift in storm tracks may strongly impact the extent to which forests are affected particularly if this changing trajectory intersects with previously unexposed plantations.
5. Conclusion
Using an extensive dataset, that covered a wide environmental range, a very accurate random forest model of slenderness was developed using stand density, age, mean annual air temperature and total annual rainfall. Using this model spatial predictions show wide variation in slenderness, with mean New Zealand values at age 30 years ranging from 62.1 m m–1 for the low density regime to 73.5 m m–1 for the medium density regime and 79.5 m m–1 for the high density regime. Under current climate, the highest slenderness and wind risk for all three regimes occurred in warm areas within the North Island that have moderately high rainfall. High density carbon regimes within the North Island are likely to be most at risk as 95% of predictions for this regime have a slenderness exceeding 80 m m–1 which is likely to be a damage threshold.
Within the North Island, projected slenderness under climate change increased within cool high elevation areas but exhibited little change elsewhere and overall mean changes across all scenarios and regimes, relative to current climate, ranged from -2.3%–1.2%. Projected changes in slenderness in the South Island were of a greater magnitude with mean increases over the two projection periods, four RCPs and three silvicultural regimes ranging from 2.3 to 10.6%. Increases in slenderness were highest within the east coast of the South Island which is an area in which extreme wind speeds are also projected to increase under climate change. Future studies should more fully integrate our findings with spatial variation in storm trajectory and intensity, under current and future climate, which are known at a broad regional level but require greater spatial definition. The spatial intersection of storm information with stand susceptibility will allow more accurate delineation of regions most at risk of wind damage.
Data availability statement
The datasets presented in this article are not readily available because the plot data used to generate results are not freely available but require permissions for use from multiple forest owners. Requests to access the datasets should be directed to bWljaGFlbC53YXR0QHNjaW9ucmVzZWFyY2guY29t.
Author contributions
MW: conceptualization, data curation, investigation, formal analysis, methodology, visualization, roles/writing—original draft, and writing—review and editing. JM: conceptualization and writing—review and editing. Both authors contributed to the article and approved the submitted version.
Funding
This research was supported by the Scion’s Strategic Science Investment Fund (SSIF). We also appreciate financial support from the Ministry of Business, Innovation and Employment (MBIE), programme entitled “Seeing the forest for the trees: transforming tree phenotyping for future forests” (programme grant number C04X2101).
Acknowledgments
We are grateful to numerous forestry companies for supporting this research and providing the permission to use the PSP data. We also appreciate the assistance of John-Mark Woolley from the National Institute of Water and Atmospheric Research Ltd. (NIWA) who supplied us with climatic surfaces used in this study. We are grateful to two reviewers for very useful comments that greatly improved the manuscript.
Conflict of interest
JM is currently employed by Timberlands Limited. MW declares that the research was conducted in the absence of any commercial or financial relationships that could be construed as a potential conflict of interest.
Publisher’s note
All claims expressed in this article are solely those of the authors and do not necessarily represent those of their affiliated organizations, or those of the publisher, the editors and the reviewers. Any product that may be evaluated in this article, or claim that may be made by its manufacturer, is not guaranteed or endorsed by the publisher.
References
Becquey, J., and Riou-Nivert, P. (1987). L’existence de “zones de stabilité” des peuplements. Conséquences sur la gestion. Rev. For. Française 39, 323–334. doi: 10.4267/2042/25804
Capellán-Pérez, I., Arto, I., Polanco-Martinez, J. M., González-Eguino, M., and Neumann, M. B. (2016). Likelihood of climate change pathways under uncertainty on fossil fuel resource availability. Energy Environ. Sci. 9, 2482–2496.
Carter, P. (1989). “Wind damage in Kinleith forest-effects of Cyclone Bola,” in Wind damage in New Zealand exotic forests, Alan Somerville, Stephen Wakelin and Lesley Whitehouse, eds A. Somerville, S. Wakelin, and L. Whitehouse (Rotorua: FRI Bulletin), 146.
Castedo-Dorado, F., Crecente-Campo, F., Álvarez-Álvarez, P., and Barrio-Anta, M. (2009). Development of a stand density management diagram for radiata pine stands including assessment of stand stability. Forestry 82, 1–16. doi: 10.1093/forestry/cpm032
Cremer, K. W., Borough, C. J., McKinnell, F. H., and Carter, P. R. (1982). Effects of stocking and thinning on wind damage in plantations. N. Z. J. For. Sci. 12, 245–268.
Cucchi, V., Meredieu, C., Stokes, A., de Coligny, F., Suarez, J., and Gardiner, B. A. (2005). Modelling the windthrow risk for simulated forest stands of Maritime pine (Pinus pinaster Ait.). For. Ecol. Manag. 213, 184–196.
Friedman, J. H. (2001). Greedy function approximation: A gradient boosting machine. Ann. Statist. 29, 1189–1232. doi: 10.1214/aos/1013203451
Gardiner, B. A., and Quine, C. P. (2000). Management of forests to reduce the risk of abiotic damage - a review with particular reference to the effects of strong winds. For. Ecol. Manag. 135, 261–277. doi: 10.1016/S0378-1127(00)00285-1
Gardiner, B. A., Stacey, G. R., Belcher, R. E., and Wood, C. J. (1997). Field and wind tunnel assessments of the implications of respacing and thinning for tree stability. Forestry 70, 233–252. doi: 10.1093/forestry/70.3.233
Gardiner, B., Peltola, H., and Kellomaki, S. (2000). Comparison of two models for predicting the critical wind speeds required to damage coniferous trees. Ecol. Model. 129, 1–23. doi: 10.1016/S0304-3800(00)00220-9
Goldstein, A., Kapelner, A., Bleich, J., and Pitkin, E. (2015). Peeking inside the black box: Visualizing statistical learning with plots of individual conditional expectation. J. Comput. Graph. Statist. 24, 44–65.
González-Rodríguez, M., and Diéguez-Aranda, U. (2021). Rule-based vs. parametric approaches for developing climate-sensitive site index models: A case study for Scots pine stands in northwestern Spain. Ann. For. Sci. 78:23. doi: 10.1007/s13595-021-01047-2
Gunderson, C. A., and Wullschleger, S. D. (1994). Photosynthetic acclimation in trees to rising atmospheric CO2: A broader perspective. Photosynth. Res. 39, 369–388. doi: 10.1007/BF00014592
Hanewinkel, M., Hummel, S., and Albrecht, A. (2011). Assessing natural hazards in forestry for risk management: A review. Eur. J. For. Res. 130, 329–351. doi: 10.1007/s10342-010-0392-1
Hastie, T., Tibshirani, R., Friedman, J. H., and Friedman, J. H. (2009). The elements of statistical learning: Data mining, inference, and prediction. Berlin: Springer.
Hickler, T., Rammig, A., and Werner, C. (2015). Modelling CO2 impacts on forest productivity. Curr. For. Rep. 1, 69–80. doi: 10.1007/s40725-015-0014-8
Hill, H. (1979). Severe damage to forests in Canterbury, New Zealand, resulting from orographically reinforced winds. Wellington: New Zealand Meteorological Service, Technical Information Circular, 169.
James, G., Witten, D., Hastie, T., and Tibshirani, R. (2021). An introduction to statistical learning: With applications in R. Berlin: Springer
Keenan, R. J., Reams, G. A., Achard, F., de Freitas, J. V., Grainger, A., and Lindquist, E. (2015). Dynamics of global forest area: Results from the FAO Global Forest Resources Assessment 2015. For. Ecol. Manag. 352, 9–20. doi: 10.1016/j.foreco.2015.06.014
Kirschbaum, M. U. F., Medlyn, B., King, D. A., Pongracic, S., Murty, D., Keith, H., et al. (1998). Modelling forest-growth response to increasing CO2 concentration in relation to various factors affecting nutrient supply. Global Change Biol. 4, 23–42. doi: 10.1046/j.1365-2486.1998.00103.x
Körner, C. (2006). Plant CO2 responses: An issue of definition, time and resource supply. New Phytol. 172, 393–411. doi: 10.1111/j.1469-8137.2006.01886.x
Körner, C., Morgan, J., and Norby, R. (2007). “CO2 fertilization: When, where, how much?,” in Terrestrical ecosystems in a changing world, eds J. Canadell, D. Pataki, and L. Pitelka (Berlin: Springer Verlag), 9–21.
Kuhn, M. (2008). Building predictive models in R using the caret package. J. Stat. Softw. 28, 1–26. doi: 10.18637/jss.v028.i05
Leathwick, J. R., and Stephens, R. T. T. (1998). Climate surfaces for New Zealand. Landcare Res. Contract Report LC9798/126. Lincoln: Landcare Research, 19.
LeBauer, D. S., and Treseder, K. K. (2008). Nitrogen limitation of net primary productivity in terrestrial ecosystems is globally distributed. Ecology 89, 371–379.
Liaw, A., and Wiener, M. (2002). Classification and regression by randomForest. R News 2, 18–22. doi: 10.1890/06-2057.1
Long, S. P., Osborne, C. P., and Humphries, S. W. (1996). “Photosynthesis, rising atmospheric carbon dioxide concentration and climate change,” in SCOPE 56–Global change: Effects on coniferous forests and grasslands, eds A. Breymeyer, D. Hall, J. Melillo, and G. Ågren (Chichester: John Wiley & Sons Ltd), 121–159.
Martin, T. J., and Ogden, J. (2006). Wind damage and response in New Zealand forests: A review. N. Z. J. Ecol. 30, 295–310.
Ministry for the Environment (2018). Climate change projections for New Zealand: Atmosphere projections based on simulations from the IPCC Fifth assessment, 2nd Edn. Wellington: Ministry for the Environment.
Moore, J. R., and Gardiner, B. A. (2001). Relative windfirmness of New Zealand-grown Pinus radiata and Douglas-fir: A preliminary investigation. N. Z. J. For. Sci. 31, 208–223.
Moore, J. R., and Watt, M. S. (2015). Modelling the influence of predicted future climate change on the risk of wind damage within New Zealand’s planted forests. Global Change Biol. 21, 3021–3035. doi: 10.1111/gcb.12900
Moore, J. R., Manley, B. R., Park, D., and Scarrott, C. J. (2013). Quantification of wind damage to New Zealand’s planted forests. Forestry 86, 173–183. doi: 10.1093/forestry/cps076
Mullan, B., Caray-Smith, T., Griffiths, G., and Sood, A. (2011). Scenarios of storminess and regional wind extremes under climate change. NIWA Client Report WLG2010-31 prepared for the Ministry of Agriculture and Forestry. Available online at: https://niwa.co.nz/sites/niwa.co.nz/files/slmacc_extremewinds_slew093_may2011.pdf (accesses July 3, 2023).
Nowak, R. S., Ellsworth, D. S., and Smith, S. D. (2004). Functional responses of plants to elevated atmospheric CO2–do photosynthetic and productivity data from FACE experiments support early predictions? New Phytol. 162, 253–280. doi: 10.1111/j.1469-8137.2004.01033.x
NZFOA (2022). New Zealand forestry industry, facts and figures 2021/2022. New Zealand plantation forest industry. Wellington: New Zealand Forest Owners Association.
Payn, T., Carnus, J.-M., Freer-Smith, P., Kimberley, M., Kollert, W., Liu, S., et al. (2015). Changes in planted forests and future global implications. For. Ecol. Manag. 352, 57–67. doi: 10.1016/j.foreco.2015.06.021
Peel, M. C., Finlayson, B. L., and McMahon, T. A. (2007). Updated world map of the Koppen-Geiger climate classification. Hydrol. Earth Syst. Sci. 11, 1633–1644. doi: 10.5194/hess-11-1633-2007
Peltola, H., and Kellomäki, S. (1993). A mechanistic model for calculating windthrow and stem breakage of Scots pines at stand edge. Silva Fenn. 27, 99–111.
Peltola, H., Kellomäki, S., Hassinen, A., and Granander, M. (2000). Mechanical stability of Scots pine, Norway spruce and birch: An analysis of tree-pulling experiments in Finland. For. Ecol. Manag. 135, 143–153.
Peltola, H., Kellomäki, S., Väisänen, H., and Ikonen, V. P. (1999). A mechanistic model for assessing the risk of wind and snow damage to single trees and stands of Scots pine, Norway spruce, and birch. Can. J. For. Res. 29, 647–661.
Pilaar, C. H., and Dunlop, J. D. (1990). The permanent sample plot system of the New Zealand Ministry of Forestry. Bull. Recherches Agron. Gembloux 25, 5–17.
Quine, C. P. (1995). Assessing the risk of wind damage to forests: Practice and pitfalls. Wind and trees. Cambridge: Cambridge University Press, 379–403.
R Core Team (2023). R: A language and environment for statistical computing. Vienna: R Foundation for Statistical Computing.
Sabatia, C. O., and Burkhart, H. E. (2014). Predicting site index of plantation loblolly pine from biophysical variables. For. Ecol. Manag. 326, 142–156.
Scott, R. E., and Mitchell, S. J. (2005). Empirical modelling of windthrow risk in partially harvested stands using tree, neighbourhood, and stand attributes. For. Ecol. Manag. 218, 193–209. doi: 10.1016/j.foreco.2005.07.012
Shaw, W. B. (1983). Tropical cyclones: Determinants of pattern and structure in New Zealand’s indigenous forests. Pac. Sci. 37, 405–414.
Sjolte-Jorgensen, J. (1967). The influence of spacing on the growth and development of coniferous plantations. Int. Rev. For. Res. 2, 43–94. doi: 10.1016/B978-1-4831-9976-4.50008-X
Studholme, W. P. (1995). “The experience of and management strategy adopted by the Selwyn Plantation Board, New Zealand,” in Wind and Trees, eds M. P. Coutts and J. Grace (Cambridge: Cambridge University Press), 468–476.
Waghorn, M. J., Watt, M. S., and Mason, E. G. (2007). Influence of tree morphology, genetics, and initial stand density on outerwood modulus of elasticity of 17-year-old Pinus radiata. For. Ecol. Manag. 244, 86–92.
Watt, M. S., and Kirschbaum, M. U. F. (2011). Moving beyond simple linear allometric relationships between tree height and diameter. Ecol. Model. 222, 3910–3916. doi: 10.1016/j.ecolmodel.2011.10.011
Watt, M. S., and Palmer, D. J. (2012). Use of regression kriging to develop a Carbon: Nitrogen ratio surface for New Zealand. Geoderma 183, 49–57. doi: 10.1016/j.geoderma.2012.03.013
Watt, M. S., Kimberley, M. O., Dash, J. P., and Harrison, D. (2017a). Spatial prediction of optimal final stand density for even-aged plantation forests using productivity indices. Can. J. For. Res. 47, 527–535. doi: 10.1139/cjfr-2016-0220
Watt, M. S., Kimberley, M. O., Dash, J. P., Harrison, D., Monge, J. J., and Dowling, L. (2017b). The economic impact of optimising final stand density for structural saw log production on the value of the New Zealand plantation estate. For. Ecol. Manag. 406, 361–369. doi: 10.1016/j.foreco.2017.07.044
Watt, M. S., Palmer, D. J., Leonardo, E. M. C., and Bombrun, M. (2021). Use of advanced modelling methods to estimate radiata pine productivity indices. For. Ecol. Manag. 479:118557. doi: 10.1016/j.foreco.2020.118557
World Bank, and Ecofys (2018). State and trends of carbon pricing 2018 (May). Washington, DC: World Bank, doi: 10.1596/978-1-4648-1292-7
Keywords: air temperature, climate change, Environment, H/D ratio, Pinus radiata, stocking, wind damage
Citation: Watt MS and Moore JR (2023) Modeling spatial variation in radiata pine slenderness (height/diameter ratio) and vulnerability to wind damage under current and future climate in New Zealand. Front. For. Glob. Change 6:1188094. doi: 10.3389/ffgc.2023.1188094
Received: 16 March 2023; Accepted: 24 July 2023;
Published: 10 August 2023.
Edited by:
Guillermo Trincado, Austral University of Chile, ChileReviewed by:
Milos Ivkovic, Commonwealth Scientific and Industrial Research Organisation (CSIRO), AustraliaMiguel Gonzalez, Guangzhou Institute of Geography, China
Copyright © 2023 Watt and Moore. This is an open-access article distributed under the terms of the Creative Commons Attribution License (CC BY). The use, distribution or reproduction in other forums is permitted, provided the original author(s) and the copyright owner(s) are credited and that the original publication in this journal is cited, in accordance with accepted academic practice. No use, distribution or reproduction is permitted which does not comply with these terms.
*Correspondence: Michael S. Watt, bWljaGFlbC53YXR0QHNjaW9ucmVzZWFyY2guY29t