 Zhongqian Cheng
 Tuomas Aakala3
- 1Key Laboratory for Earth Surface Processes of the Ministry of Education, Peking University, Beijing, China
- 2Institute of Ecology, College of Urban and Environmental Sciences, Peking University, Beijing, China
- 3Faculty of Science and Forestry, School of Forest Sciences, University of Eastern Finland, Joensuu, Finland
- 4Department of Forest Sciences, Faculty of Agriculture and Forestry, University of Helsinki, Helsinki, Finland
Elevation-for-latitude substitution offers a tool for studying the influence of temperature and precipitation variability on vegetation structure and composition. Understanding how elevation, aspect, and slope influence vegetation patterns may help in predicting how climate change influences human forest usage and in developing strategies for ensuring the sustained provision of ecosystem services. However, most ecological studies have been carried out in protected areas, leaving forest areas used by humans to lesser attention. Therefore, we asked how elevation, aspect, and slope impact the vegetation on a human-influenced mountain. We measured woody vegetation size, richness, and composition on a mountain with plots set systematically in four cardinal directions at 100-m elevational intervals from the peak, from 1900 to 4200 m above sea level, in the Hengduan Mountains in eastern Himalaya, southwestern China. We quantified how tree maximum height, basal area, aboveground biomass (AGB), tree and shrub species richness, and woody species composition changed with elevation, aspect, and slope. Based on generalized linear models, the maximum tree height, tree basal area, and woody species AGB followed a unimodal trend along elevational gradients, with tree height and basal area peaking at 3100 m, while AGB was highest at 3300 m and somewhat higher on the southern slope. Basal area increased with slope degree. Neither tree nor shrub species richness was influenced by elevation, aspect, or slope. According to canonical correspondence analysis and TWINSPAN classification, elevation and north-south orientation of the slope were major factors influencing woody species compositions, and vegetation was classified into five types of communities. Our results indicated that the influences of elevation, aspect, and slope on woody vegetation structure were similar in a human-influenced forested mountain area as in protected mountain landscapes based on the literature. However, as forests in this area are used more intensively at low and middle elevations of the southern and western slopes, where aridity restricts tree size and AGB, climate change is likely to challenge traditional harvesting practices and place pressure on moving forest usage to higher altitudes.
1. Introduction
Understanding how vegetation structure and dynamics depend on climate is a fundamental basis for predicting their phenotypes among various environmental conditions (Moritz and Agudo, 2013), and their fate under a changing climate (Bonan, 2008; Xu et al., 2019). Such predictions are important for understanding species range shifts and biodiversity more generally (Elsen and Tingley, 2015). These changes can have detrimental consequences, such as decreasing forest productivity and increasing risk of natural disturbances, for human communities that rely on forest ecosystems.
Studying how climate impacts vegetation by field sampling large areas using standardized field techniques is arduous and is often hampered by variation in confounding environmental factors (Sanders and Rahbek, 2012). An alternative is to set such studies in smaller areas with elevational variation, i.e., substituting elevation for latitude (Jump et al., 2009). As an example, a 5.2–6.5°C decrease in mean annual temperature every 1000 km toward a higher latitudinal in the temperate region corresponds to a mere 1000 m upslope elevation shift (Colwell et al., 2008). As this elevation-for-latitude substitution allows covering climate gradients over short distances (Sanders and Rahbek, 2012; Rahbek et al., 2019a), many confounding factors, such as biogeographical history, time since glaciation, and soil formation, which covary along latitudinal gradients may change less along elevational gradients (Körner, 2007). Mountains could consequently be treated as relatively uniform and continuous entities at a regional scale (Moeslund et al., 2013). Mountain topography can thus serve as an excellent substitution of a global environment for studying vegetation distributions and functions in the context of climate change (Sanders and Rahbek, 2012).
Topography, specifically elevation, slope, and aspect, influence vegetation structures and dynamics (Grytnes, 2003; Sanders and Rahbek, 2012). Of these, the effect of elevation on vegetation is the most studied topographic factor. Atmospheric pressure and air temperature consistently decrease while radiation under a cloudless sky and the fraction of ultraviolet-B uniformly increase with elevation, whereas other factors, such as precipitation, hours of sunshine, growing season length, geology, and human land use, are mountain-specific variables (Körner, 2007).
A combination of environmental factors at each elevational belt shapes the vegetation structure and composition by controlling the temperature, soil moisture, and light availably (Sanders and Rahbek, 2012; Moeslund et al., 2013). A low temperature at high elevations limits tree growth (Fan et al., 2009; Wang et al., 2014, 2021; Gaire et al., 2020), height (Kunwar et al., 2021), basal area (Acharya et al., 2011), and living biomass (Lin et al., 2012; Wang et al., 2014).
Species richness at the community level may vary with elevation in four ways: a monotonic decrease, a plateau before descent, and hump-shaped and inverse hump-shaped curves. These patterns commonly result from a combination of decreasing temperature and mountain-specific precipitation patterns along elevational gradients (Tang and Fang, 2004; Tang et al., 2012; Yang et al., 2016a).
In addition to the effect of elevation, the slope degree controls vegetation size, composition, and distribution by influencing wind speed, soil water and nutrient content, solar radiation intensity, and seed dispersal distance (Moeslund et al., 2013) and more indirectly by influencing fire severities and frequencies (Rogeau and Armstrong, 2017; Gowda et al., 2019). On steeper slopes, higher wind speeds lead to shorter trees (Gardiner et al., 2016). Deep-rooted species are potentially better adapted to steeper slopes because of wind conditions but also due to soil stability issues (Moore et al., 2018). Litter depth changes with slope degree due to sliding caused by wind and gravity, leading to spatial variations in soil moisture, nutrient status, and soil temperature (Dulamsuren and Hauck, 2008), which again indirectly influence fire regimes (Luo et al., 2021).
Aspect influences solar radiation, precipitation, and wind, which in turn impact vegetation composition, structure, and growth (Burnett et al., 2008; Moeslund et al., 2013; Qin et al., 2021). In the temperate region of the Northern Hemisphere, equator-facing aspects between the south and southwest experience a remarkably warmer microclimate than other slopes (Perring, 1959). This temperature difference has been demonstrated to influence species composition and diversity at various scales in several mountain ranges (Yang et al., 2016b; Heydari et al., 2021; Qin et al., 2021). The dryness of equator-facing slopes increases fire severity, consequently influencing vegetation (Beaty and Taylor, 2001). These could either change the vegetation structure and species richness (Gowda et al., 2019) or alter fire return intervals (Rogeau and Armstrong, 2017).
Studies on vegetation patterns show that less-human-impacted study sites are typically preferred to avoid the confounding factors caused by human influence. However, completely intact forest landscapes only covered 22% of forested land globally in 2000 (Potapov et al., 2017). Although many researchers have already emphasized the importance of understanding human impacts on forest ecosystems at local (Monge-González et al., 2019), regional (Qu et al., 2020; Ge et al., 2021), and global scales (Isbell et al., 2017), most ecological studies were nonetheless conducted in protected areas (Martin et al., 2012). Because of this systematic bias, studies in unprotected landscapes are especially valuable for understanding the current state of forested ecosystems of the world. More importantly, the management of managed landscapes benefits from evidence-based guidelines that can ensure the sustained provision of ecosystem services in the changing world.
To set up our research, we chose Wujing county, a sparsely populated (population density 12.2 people km–2) region in northwestern Yunnan, China. As in most of the world, most vegetation ecological research in northwestern Yunnan has been carried out in protected areas, but we selected a mountain where local people still utilize wood from the forests. We arranged the sample plots systematically and objectively along cardinal compass directions and contours, thereby avoiding a potential bias from restricting the sampling close to roads or trails. Specifically, we studied how three topographic factors, i.e., elevation, aspect, and slope, influence (1) vegetation structure, represented by maximum height, basal area, and aboveground biomass (AGB); (2) woody species richness; and (3) woody species composition in this human-impacted landscape. For each of these, we hypothesized that (1) vegetation structure and richness would follow a hump-shaped pattern along elevational gradients due to more frequent disturbances and a more xeric climate at lowest elevations, and cold temperatures at highest elevations that constrain vegetation growth; (2) these vegetation attributes would show a linear increase from cooler to warmer aspects along both north-south and east-west orientations; and (3) these attributes would also show an increase with slope steepness due to less human activity at steeper slopes; (4) Vegetation composition would be driven by elevation, aspect, and slope degree.
2. Materials and methods
2.1. Location and geography
We chose Shangri-La, Diqing Tibetan Autonomous Prefecture, in the northwestern corner of Yunnan Province in China as our study area. It is part of the eastern Himalaya-Hengduan Mountain region, which is characterized by dramatic topographical differences. This area is a globally recognized hotspot for biodiversity conservation (Myers et al., 2000; Sloan et al., 2014; Rahbek et al., 2019b) and a high-priority area for restoration efforts (Strassburg et al., 2020). For example, the area has the highest number of gymnosperm species in the world (Barthlott et al., 2007). The climate is controlled by the Indian southwest monsoon in the southwest and the southeast Pacific monsoon in the southeast (Li et al., 2011; Shen, 2016). Three parallel rivers, Jinsha River, Nu River, and Lancang River, running from north to south, are separated by the Hengduan Mountains. The area has distinct dry and wet seasons, with rainy summers and dry winters. The dramatic topography results in broad climatic gradients ranging from subtropical to polar along elevational gradients (Liu et al., 2016).
We narrowed down our study area to Wujing County in Shangri-La by balancing accessibility and remoteness, and by utilizing the digital elevation model (DEM) to locate the greatest elevational difference. To explore the area, we interviewed local people and conducted field visits to various mountains in Wujing. We tried to avoid recent major construction projects in the mountains and protected areas, ensuring that the selected mountain represented the region. Ultimately, we selected a mountain (27.66–27.73°N, 99.45–99.54°E) peaking at 4231 m. Its base reaches the Jinsha River, a tributary of the Yangtze River, at 1920 m above sea level to the west, while Wujing town is located nearby. The majority of settled villages are situated at approximately 3000 m on the western and southern slopes of the mountain. Although the land is owned by the state, the local community can use the forest with permission.
Before the Natural Forest Protection Program was launched in 1998 (Hua et al., 2018), large-scale logging operations were carried out in the region including the studied landscape. Significant tree harvesting has probably been carried out, and in the decades before this project, logs have been floating in the Yangtze river for transportation to eastern China (Isbell et al., 2017). Unfortunately, at the time of interviewing the local people and discussing the history of the mountain and residents’ livelihoods, we lacked scientific data on this harvesting history and on other impacts by people on these forests. Nowadays, villagers can apply for cutting permits from the local state-owned forest farm to log timber for building houses or to use as firewood. Meanwhile, when funding is available, the local forest farm calls on villagers to afforest the open land areas and along the roads, by seeding or planting seedlings. Villagers also used to grow crops at some distance from the village among the forests, but this practice was abandoned after the Grain for Green Project launched in 1999 (Hua et al., 2016). Three ethnic minorities live in the area. Naxi and Lisu peoples mainly cultivate lower-elevation land, while Tibetans additionally raise yaks and cattle at elevations above 3500 m.
During 1958–2021, the mean annual air temperature (MAT) of the closest meteorological station (28.02° N; 99.73°E) at 3290 m was 5.2°C and the mean annual precipitation (MAP) was 702 mm, with >90% of the precipitation falling from April to October according to climatic data derived from the National Meteorological Information Center of China.1 Soils at altitudes between 2000 and 4000 m can be classified as yellow cinnamon soil, mountain dark brown soil, mountain brown coniferous forest soil, or alpine meadow soil (Huang et al., 2020). In terms of IUCN Global Ecosystem Typology (Keith et al., 2020), the study area is tropical or subtropical lowland rainforests, boreal and temperate high montane forests and woodlands, deciduous temperate forests, and pastures.
2.2. Study design
To determine the sampling plots, we utilized the Advanced Land Observing Satellite (ALOS) DEM with 30-m resolution to locate the contours. The mountain’s highest point was identified as the primary reference point (Peak in Figure 1). Four transects were drawn at the cardinal north, east, south, and west of the peak, which continued until they intersected with a river or a significant incline where the subsequent plot would be higher than the previous plot. Circular plots were placed at the intersections of the contours and transects, except in the presence of a village, cropland, or road. In total, we established 50 plots: eight plots at 3500–4200 m in the north transect, four plots at 3900–4200 m in the east transect, twenty plots at 2200–4200 m in the south transect (excluding 2300 m due to a cliff), and eighteen plots at 2000–4200 m in the west transect (excluding 2100, 2200, 2300, 2600, and 2700 m due to the presence of villages). North and east transects were shorter because the mountain is asymmetric with longer slopes to deep valleys in the south and west. We derived plot information on elevation, aspect in azimuth degree, and slope degree from the DEM. All the procedures were carried out using ArcGIS 10.6 software (ESRI, USA).

Figure 1. Research area location and plot arrangement.
2.3. Field sampling
To maintain a relatively consistent number of trees across all plots, we calculated the radius of each circular plot based on the number of trees with a diameter at breast height (DBH) greater than 3 cm found within a 5-m radius plot centered around the plot’s midpoint. If more than 25 trees were counted, the plot radius was set at 5 m. If the plot contained between 11 and 25 trees, a 10-m radius was used. If the plot contained between 6 and 11 trees, a 15-m radius was used. If the plot contained less than 6 trees, a 20-m radius was used.
The plots were named based on a combination of the compass direction of each transect and the elevation of the plot. However, for three of the 50 plots, the standard radius could not be used. Plot S2200, located at the southernmost point of the transect, was situated on the edge of a riverbank that we wished to exclude. Therefore, we reduced the plot radius to 6 m. Plot S2600 was located on abandoned cropland that was surrounded by planted trees. To exclude the trees, we set the plot radius to 2.5 m, extending to the border of the planted area. Plot S3200 was located at a cliff edge, and we reduced the plot radius to 2.5 m to accommodate the terrain.
Starting from the north direction, trees with diameter at 1.3 m height (DBH) of more than 3 cm were counted clockwise, mapped, and measured. Trees that were forked below 1.3 m were counted as separate individuals. Each tree was numbered with an aluminum tag. Tree mapping was performed by recording the azimuth (measured by Garmin GPSMAP 66i) and distance (measured by Haglöf Vertex Laser Geo, Haglöf Ltd., Sweden) of the tree from the plot center. The DBH of all trees were measured with a DBH tape. To reduce the amount of fieldwork, the heights of the first five trees (measured with a Vertex Laser Geo or a 20-m fishing rod) were measured for each species in the plots, and subsequently the height was measured whenever the DBH of a tree was either larger or smaller than the first five trees. Heights for the remaining trees were estimated based on plot- and- species-specific height–DBH relationships. Dead standing trees with DBH >10 cm were recorded if they were in the early stage of decay, their heights were measured only if the remaining stem was more than half of their final height. Cut stumps were mostly shorter than 1.3 m, and they are not considered. The species, height, diameter, coverage of the plot in percentage, number, and distribution was recorded for shrubs with more than one main stem growing from the ground in the 2.5-m radius subplot with the same center. For herbaceous vascular plants, their species, height, cover, and number were recorded in the 1-m radius subplot with the same center. Species identification and their scientific name were checked using the Flora of China online edition (Institute of Botany, Chinese Academy of Sciences).
2.4. Statistical analysis
All statistical data analyses were computed in R language using R Studio (Crawley, 2013).
Non-linear regression analysis was carried out to estimate the heights of unmeasured trees. The relationship between height and DBH was expressed as the function (Zhang et al., 2020) (Eq. 1):
where x is DBH, y is height, respectively; a, b are the estimated parameters.
To obtain comparable values for plots of varying sizes for species richness and maximum height, we used the area from 5-m radius plots, namely 78.5 m2, as the basis for these two attributes. We used the actual measured value when plot radius was 5 m. Otherwise, we used the relationship between richness and area as the basic model, which also followed the same form as Eq. 1, where x was area computed based on the distance of the tree to the plot center and y was either the tree species richness or the maximum height, respectively (Scheiner, 2003; Lyman and Ames, 2007). All non-linear parameter analyses were carried out with the nls function in the dplyr package (Hadley et al., 2023). However, this function in R requires more than three observations. Thus, if a plot had two tree species, we recorded the number of species within a 5-m radius. For plots that had only one species, the estimated number was one.
For calculating the AGB of tree species (Mg ha–1), we first searched for species- and genus-specific allometric equations. However, for Quercus and Juglans these were parameterized with much smaller trees than what were growing on our plots. Therefore, instead of extrapolating, which could potentially have led to severe biases, we used a pantropical AGB model from Equation 4 in Chave et al. (2014):
where ρ is wood-specific gravity in g cm–3 derived from a wood density dataset in the BIOMASS package; D is DBH of a tree in cm; H is height in m. This calculation was carried out with the BIOMASS package (Rejou-Mechain et al., 2017).
We used species-, genus-, or community-specific allometric equations for calculating the AGB of shrub species (Zhang and Liu, 2010; Wang J. et al., 2012; Xie et al., 2018). We first investigated species-specific allometric equations, and if no matching ones were found, we used equations from the same genus. If no such equations were available, we used general equations from the vegetation community located in a region close by that contained similar species. The allometric equations for shrubs are in Supplementary Table 1.
In addition to estimating the maximum height of tree species, AGB, and tree species richness, BA per hectare was calculated based on individual DBH, plot area, and the number of trees. These values were then converted to hectares. Shrub species richness was determined by analyzing the data collected from a subplot with a 2.5-m radius.
Plot aspects in azimuth degrees were sine transformed to provide information of each plot’s east–west orientation (aspect EW), from west (sine = −1), north or south (sine = 0), to east (sine = 1). Similarly, they were cosine transformed to represent north–south orientation (aspect NS), from south (cosine = −1), east or west (cosine = 0), to north (cosine = 1) (Joly and Gillet, 2017).
Canonical correspondence analysis (CCA) was used to identify relationships with species and elevation, aspect EW, aspect NS, and slope. The proportions of each species out of the total AGB were used to estimate the importance of each species and was log (1 + x) transformed. ANOVA and Monte Carlo significance tests were used to check whether CCA ordination for both axes and for all environmental factors were significant. Multicollinearity between environmental factors was evaluated with variance inflation factors (VIFs). We used variation partitioning to distinguish the contribution proportion of these four environmental factors to the vegetation distribution pattern. TWINSPAN classification was implemented for grouping plots. Jaccard similarity index was used to classify vegetation community groups. A height 1.5 m was used where the hierarchical cluster of woody species shall be cut. Ordination was carried out with the vegan package (Oksanen et al., 2022), and classification was performed with packages vegan (Oksanen et al., 2022) and twinspanR (Zeleny, 2021).
Generalized linear models (GLM) were used to detect the responses of AGB per ha, the estimated maximum tree height in the 5-m radius, basal area per hectare, estimated tree species richness in the 5-m radius, and shrub species richness in the 2.5-m radius to elevation, aspect EW, aspect NS, and slope. Considering that the response variable to elevation could either be monotone or a second-order polynomial (Rowe and Lidgard, 2009), the testing environmental independent variables were second-order polynomial elevation, elevation, aspect EW, aspect NS, slope, interaction of elevation and aspect EW, interaction of elevation and aspect NS, interaction of elevation and slope, interaction of aspect EW and slope, and interaction of aspect NS and slope. We used a log-transformed value with Gaussian distribution for AGB, maximum tree height in the 5-m radius, and basal area per hectare, while we log transformed the number of species and used the Poisson distribution for tree and shrub species richness. Akaike information criterion (AIC) (Akaike, 1973) was used to select the best model. χ2 was defined as null deviance minus the residual deviance of the best model. The models were validated by checking whether the assumptions are met. The residuals plot for regression models were presented in Supplementary Figure 1. GLM was carried out using the lme4 package (Bates et al., 2015), and AIC evaluation was calculated with the MuMIn package (Bartoń, 2022).
3. Results
There were 42 plots with trees, including young forests, secondary forests after disturbance, and mature forests. The eight treeless plots were all located at least 3900 m above sea level in the west and south transects, except plot S2600, which was on abandoned cropland. We tagged 1225 trees, 34 of which were standing dead trees. The mean tree density of all plots was 1548 trees ha–1. Stand density was greatest in a pure Pinus yunnanensis forest in W2400 (6875 trees ha–1), followed by 5603 trees ha–1 in S3200, where Quercus aquifolioides and Pinus yunnanensis were the dominant tree species. The third highest density was found in N4200, 4170 trees ha–1, with Rhododendron beesianum the only species. Tree density was very low in W3600 and W3700, only 64 and 96 trees ha–1. We recorded 76 woody species, including 59 tree species, 22 shrub species, and 5 species that were either trees or shrubs. The five species were: Camellia yunnanensis, Juniperus squamata, Quercus aquifolioides, Rhododendron anthosphaerum, and Rhododendron beesianum. Their shrub form is defined as lacking a clear main stem.
In the 42 tree plots, the estimated maximum height in the 5-m radius plot ranged from a 3.5-m Rhododendron beesianum in N4200 to a 27.8 m Quercus aquifolioides in S3300 (Figures 2A1–A4). The tallest tree for which height was measured was an Abies georgei, 31.8 m in N3900. Elevation strongly influenced the estimated maximum height in the 5-m radius with a hump-shaped trend along the elevational gradient (Table 1 and Figure 2A1).
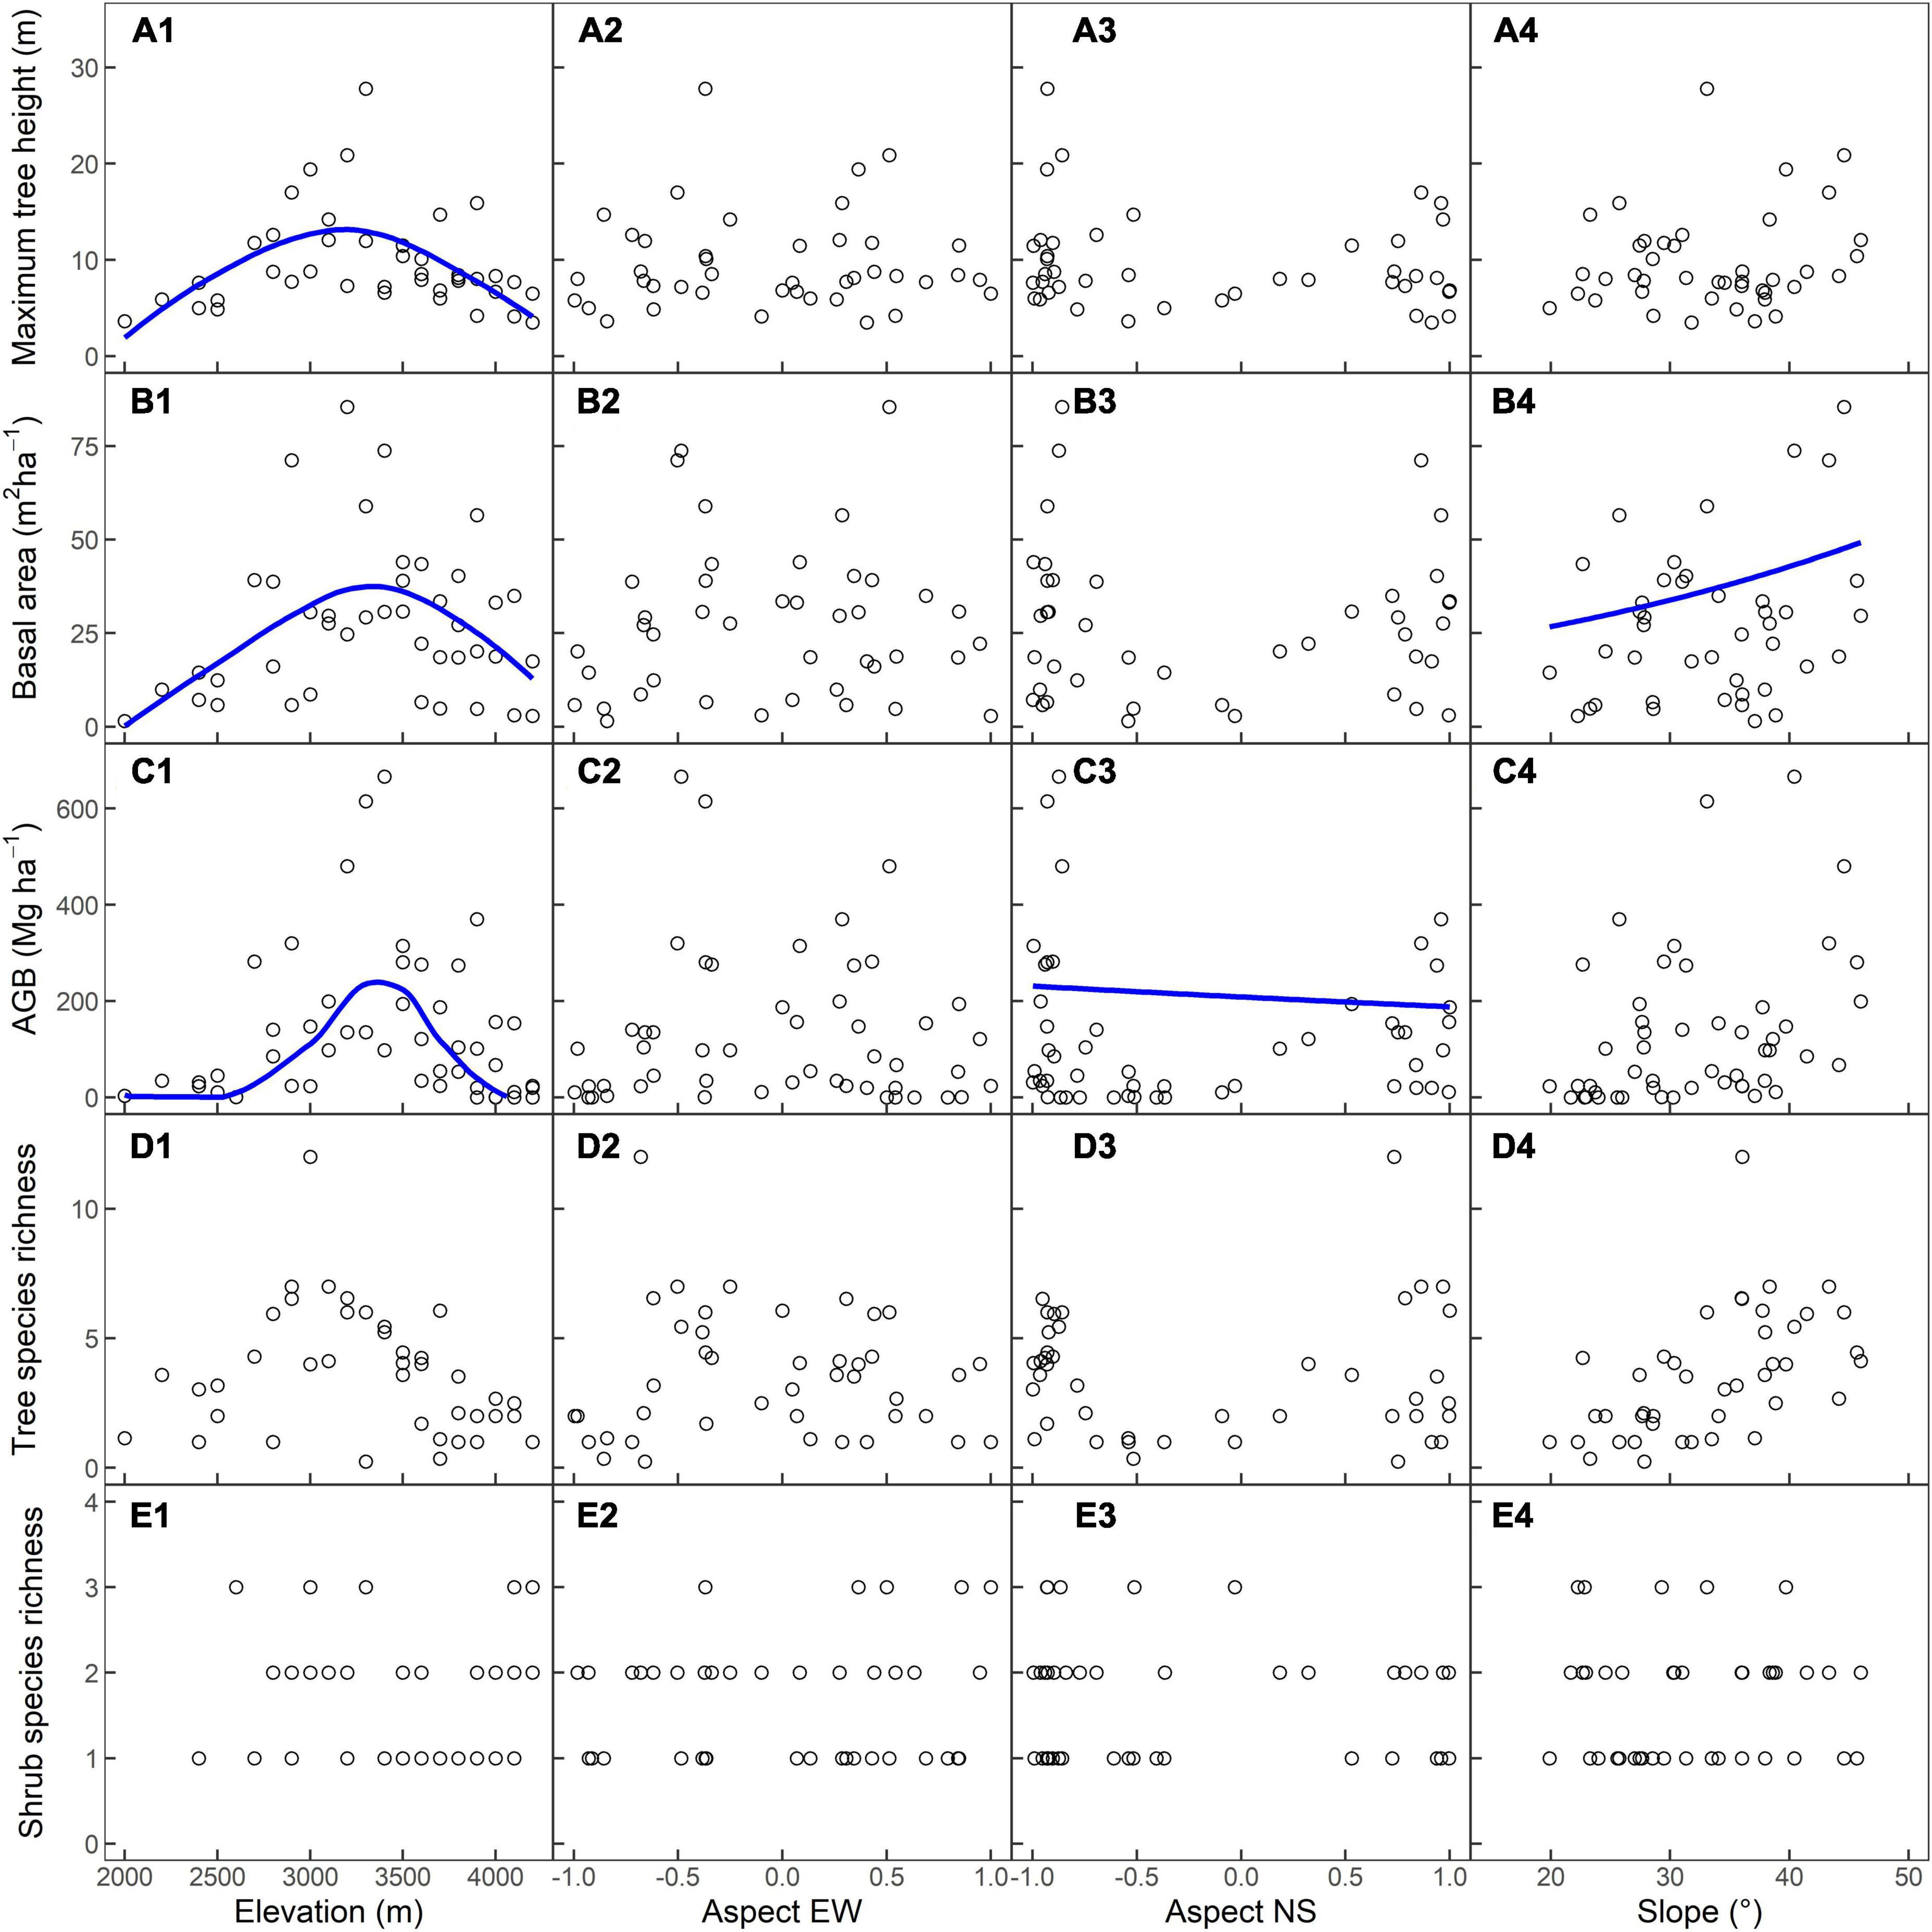
Figure 2. Relationship between elevation, aspect east–west orientation (EW), aspect north-south orientation (NS), slope, and (A1–A4) estimated maximum tree heights in the 5-m radius (m), (B1–B4) basal area (BA, m2⋅ha−1), (C1–C4) aboveground biomass (AGB; Mg⋅ha−1), (D1–D4) estimated tree species richness in the 5-m radius, and (E1–E4) shrub richness in the 2.5-m radius. Smoothing lines for one given environmental variable to the response variables were fitted by GLMs (p < 0.05), and median values of other variables were used.
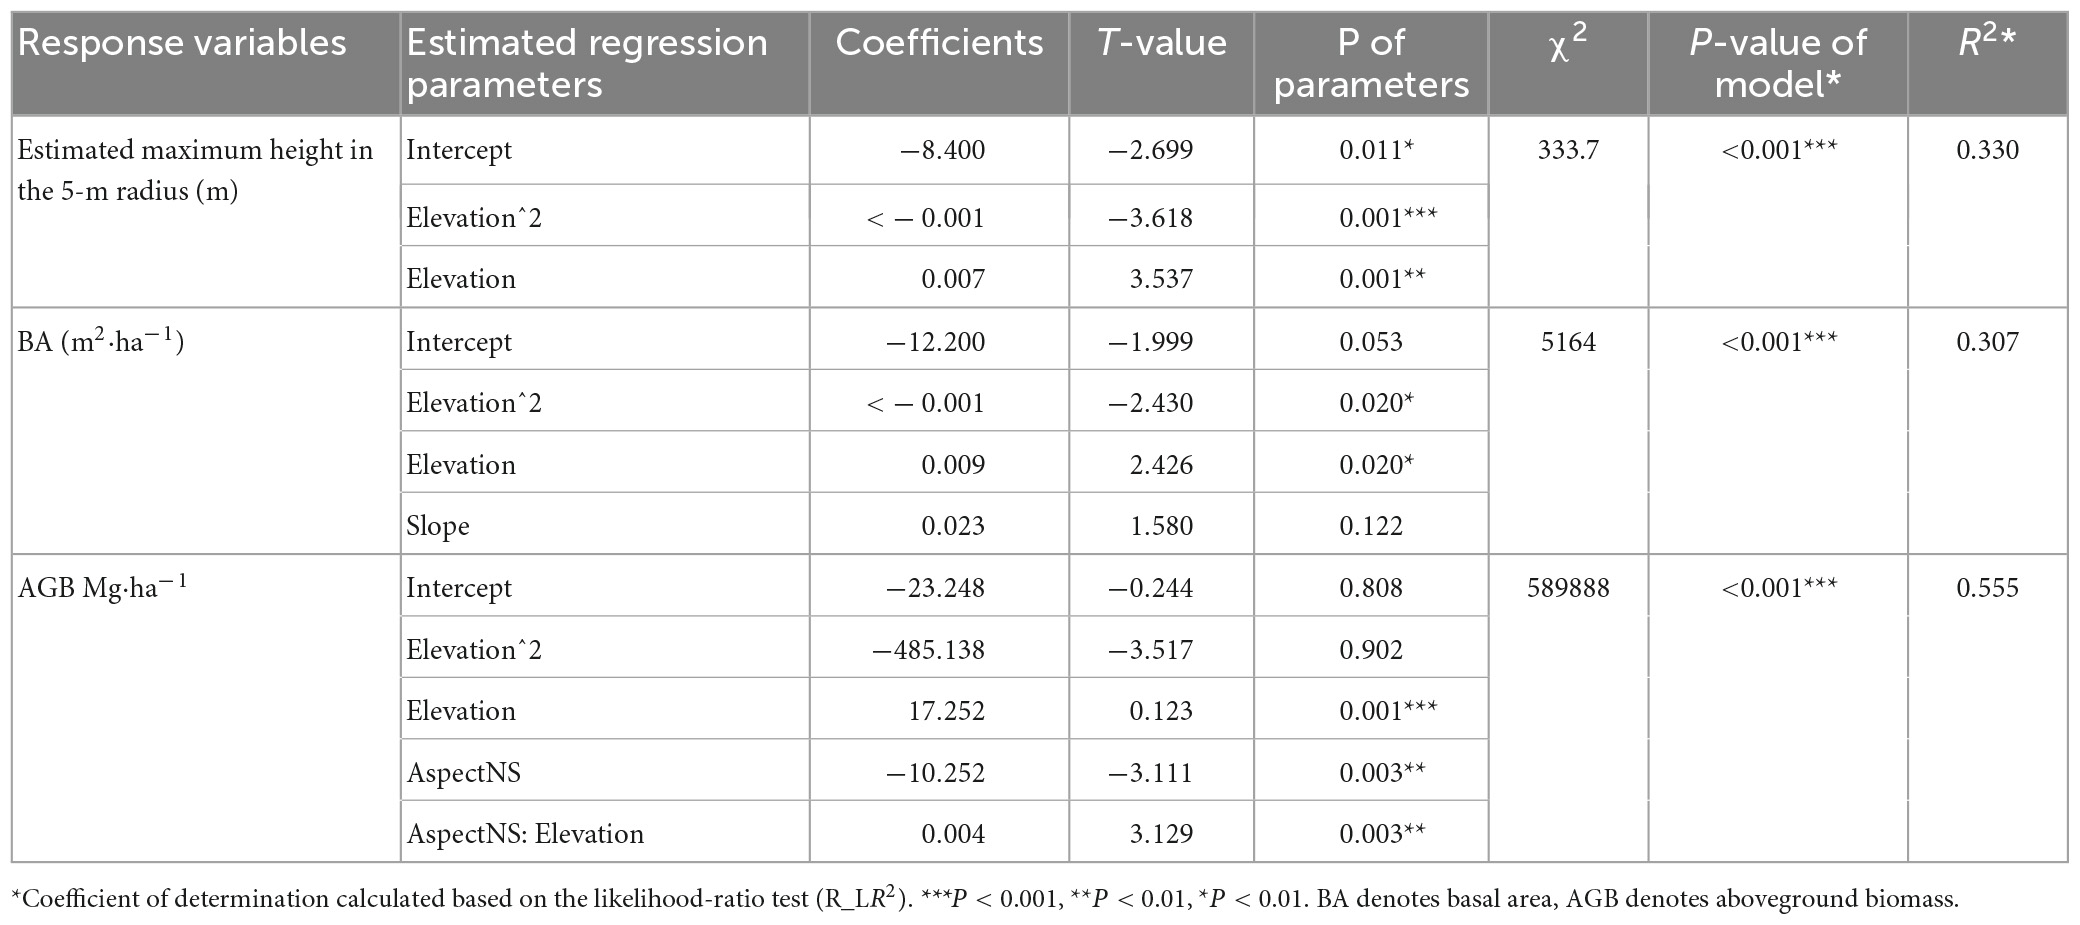
Table 1. Summary of GLM regression.
The BA for all 42 tree plots ranged from 1.5 to 85.4 m2 ha–1 (Figures 2B1–B4). The smallest BA occurred in W2000, which was just above the main road and the Yangtze River, dominated by Pistacia weinmanniifolia. The largest BA was recorded in S3200, with Quercus aquifolioides as the dominant species. Both elevation and slope had significant effects on BA (Table 1). BA was higher at medium elevations than at low and high elevations (Figure 2B1). According to the AIC score of the GLM model selection, slope showed one of the lowest AIC scores despite being insignificant in the full model (p = 0,122; Table 1), and BA increased with slope degree (Figure 2B4).
The AGB of woody species for all plots ranged from <0.1 to 656.3 Mg ha–1, with a mean value of 128.8 Mg ha–1 (Figures 2C1–C4). For the eight treeless plots, the total woody species AGBs were <1.0 Mg ha–1. The lowest AGB in the tree plots was W2000 (3.1 Mg ha–1). The highest AGBs were found in S3200, S3300, and W3400 (480.3, 602.9, and 656.3 Mg ha–1, respectively), which were all dominated by Quercus aquifolioides. The AGBs of the two deadwood-dominated plots, W3600 and W3700, were 34.4 and 23.1 Mg ha–1, respectively. AGB was significantly influenced by elevation (Table 1). The trend of AGB along elevational gradients followed a hump-shaped curve, which peaked at 3300 m (Figure 2C1). Even though the residuals of AGB against aspect NS showed heteroscedasticity, AGB decreased slightly from the south to the north aspect (Figure 2C3). Furthermore, AGB was significantly influenced by their interaction (Table 1 and Supplementary Figure 2).
W3000 had the highest estimated tree species richness with 12 tree species. S2700, S2800, and W3200 had 12, 10, and 11 tree species within the 10-m radius, which resulted in estimated 5-m radius plot values of 4.3, 6.0, and 6.6 species, respectively (Figures 2D1–D4). There were only 0.24 tree species in the 5-m radius in W3300, yet the plot’s actual tree species richness is 7 dues to the plot radius being 20 m. Similarly, the estimated tree richness in the 5-m radius was 0.36 species in W3700, while the measured number in the 20-m radius plot was 5. We observed no clear pattern of tree species richness in the 5-m radius along environmental gradients, except for a potential unimodal trend of tree species richness along elevational gradients (p = 0.0529; Figure 2 and Table 1).
Thirty-nine of the 50 plots contained shrubs. The number of species per plot ranged from one to three (Figures 2D1–D4). Tree plot E4200 had three shrub species: Rhododendron beesianum, Rhododendron rupicola var. chryseum, and Berberis yunnanensis. Fargesia spathacea, Rhododendron beesianum, and Asparagus miscanthus were found in S3000, and Fargesia spathacea, Rhododendron beesianum, and Cotoneaster franchetii grew in S3300. Three shrub species found in treeless plot S4100 were Rhododendron rupicola var. chryseum, Berberis yunnanensis, and Juniperus squamata. Like tree species richness, shrub species richness did not show any clear trends along environmental gradients (Figure 2 and Table 1).
Elevation, aspect EW, aspect NS, and slope showed significant effects on woody vegetation community composition in the study area, explaining 51.9% of the variation in vegetation composition data (F = 2.0669, p = 0.001). Elevation explained 27.9% of the variation, while aspect EW, aspect NS, and slope explained 11.2%, 19.3%, and 10.0% of the variation, respectively. The interactions between these topographic factors have less significant impacts than their individual effects (see Supplementary Figure 3).
The eigenvalue and proportion of explanatory variables in the selected CCA1 and CCA2 were 0.870 and 6.40% (F = 3.408, p = 0.001), and 0.563 and 4.14 (F = 2.205, p = 0.002), respectively. The first two axes of CCA accumulate explained 67.9% of the relationship between environmental factors and vegetation composition. Elevation and aspect EW were negatively correlated, and aspect NS and slope were positively correlated to CCA1. Elevation, aspect EW, and aspect NS were positively connected, and slope was negatively connected to CCA2 (Table 2). CCA1 was mainly constituted by elevation and slope, CCA2 was composed by aspect NS and aspect EW. Elevation and aspect NS were the most relevant variables in predicting vegetation community compositions, accounting for 9.88 and 7.14% of the variation, respectively.
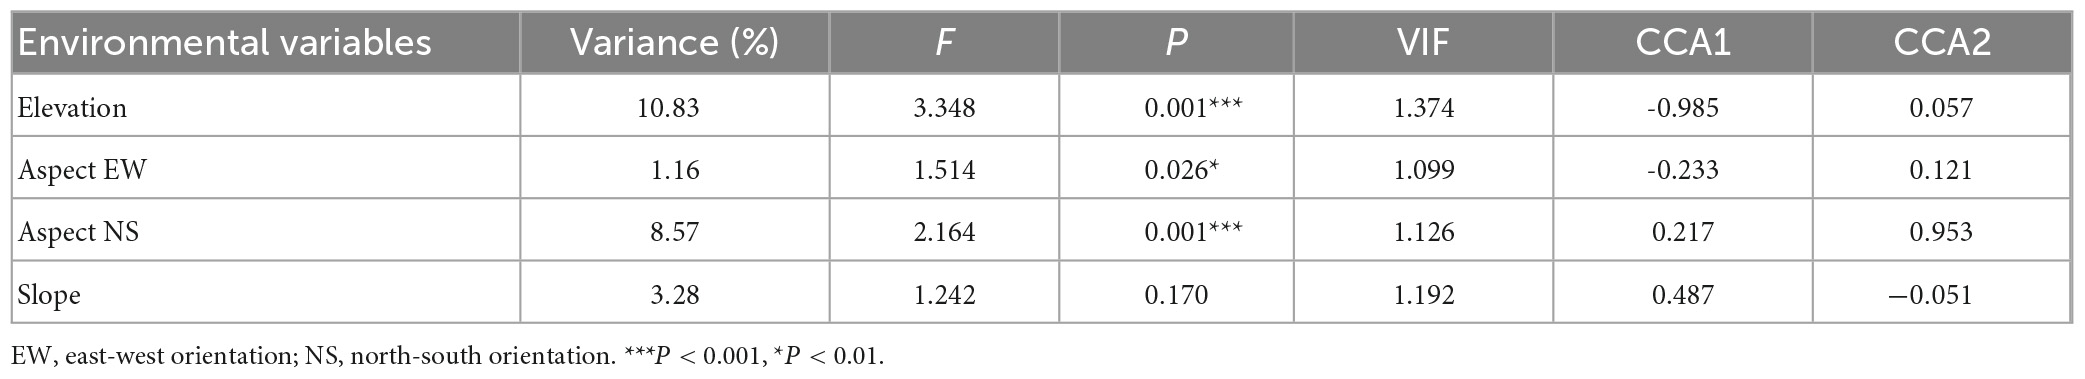
Table 2. Conditional effects table from canonical correspondence analysis (CCA) ordination showing the partial effect of each environmental factor, representing the F-value (and its significance) on woody vegetation community composition, its variance inflation factor (VIF), and its correlations with two CCA axes.
The ordination of 50 sample plots indicated that all studied plots can be divided into five groups based on their woody species biomass proportion (Figure 3). Both W2000 (green color in Figure 3), located close to the Yangtze River, and S2600 (sky blue color in Figure 3), which was on abandoned cropland, were isolated plots, as they did not correlate with the other plots. S2200–2500, S2700–3300, W2400–2800, and W3000–3100 (red color in Figure 3) were positively correlated, and they were mainly tree plots at medium to low elevation in the west and south transects. W2900, W3300–3900, S3400–3800, E3900–4100, and N3500–4200 (black color in Figure 3) illustrated positive correlations among each other and were in the medium to high elevation. S3900, S4000, S4100, S4200, W4000, W4100, W4200, and E4200 (navy blue in Figure 3) were positively correlated, representing alpine shrub and grassland in the south and west transects. Specifically, W2900, W3300–3600, and S3400 were placed in between two communities (red and black ones), meaning they shared some similar woody species compositions. Similarly, E4200 was located close to the tree plots at a high elevation in the north and east transects because it is in forested part of the tree and alpine grassland ecotone.
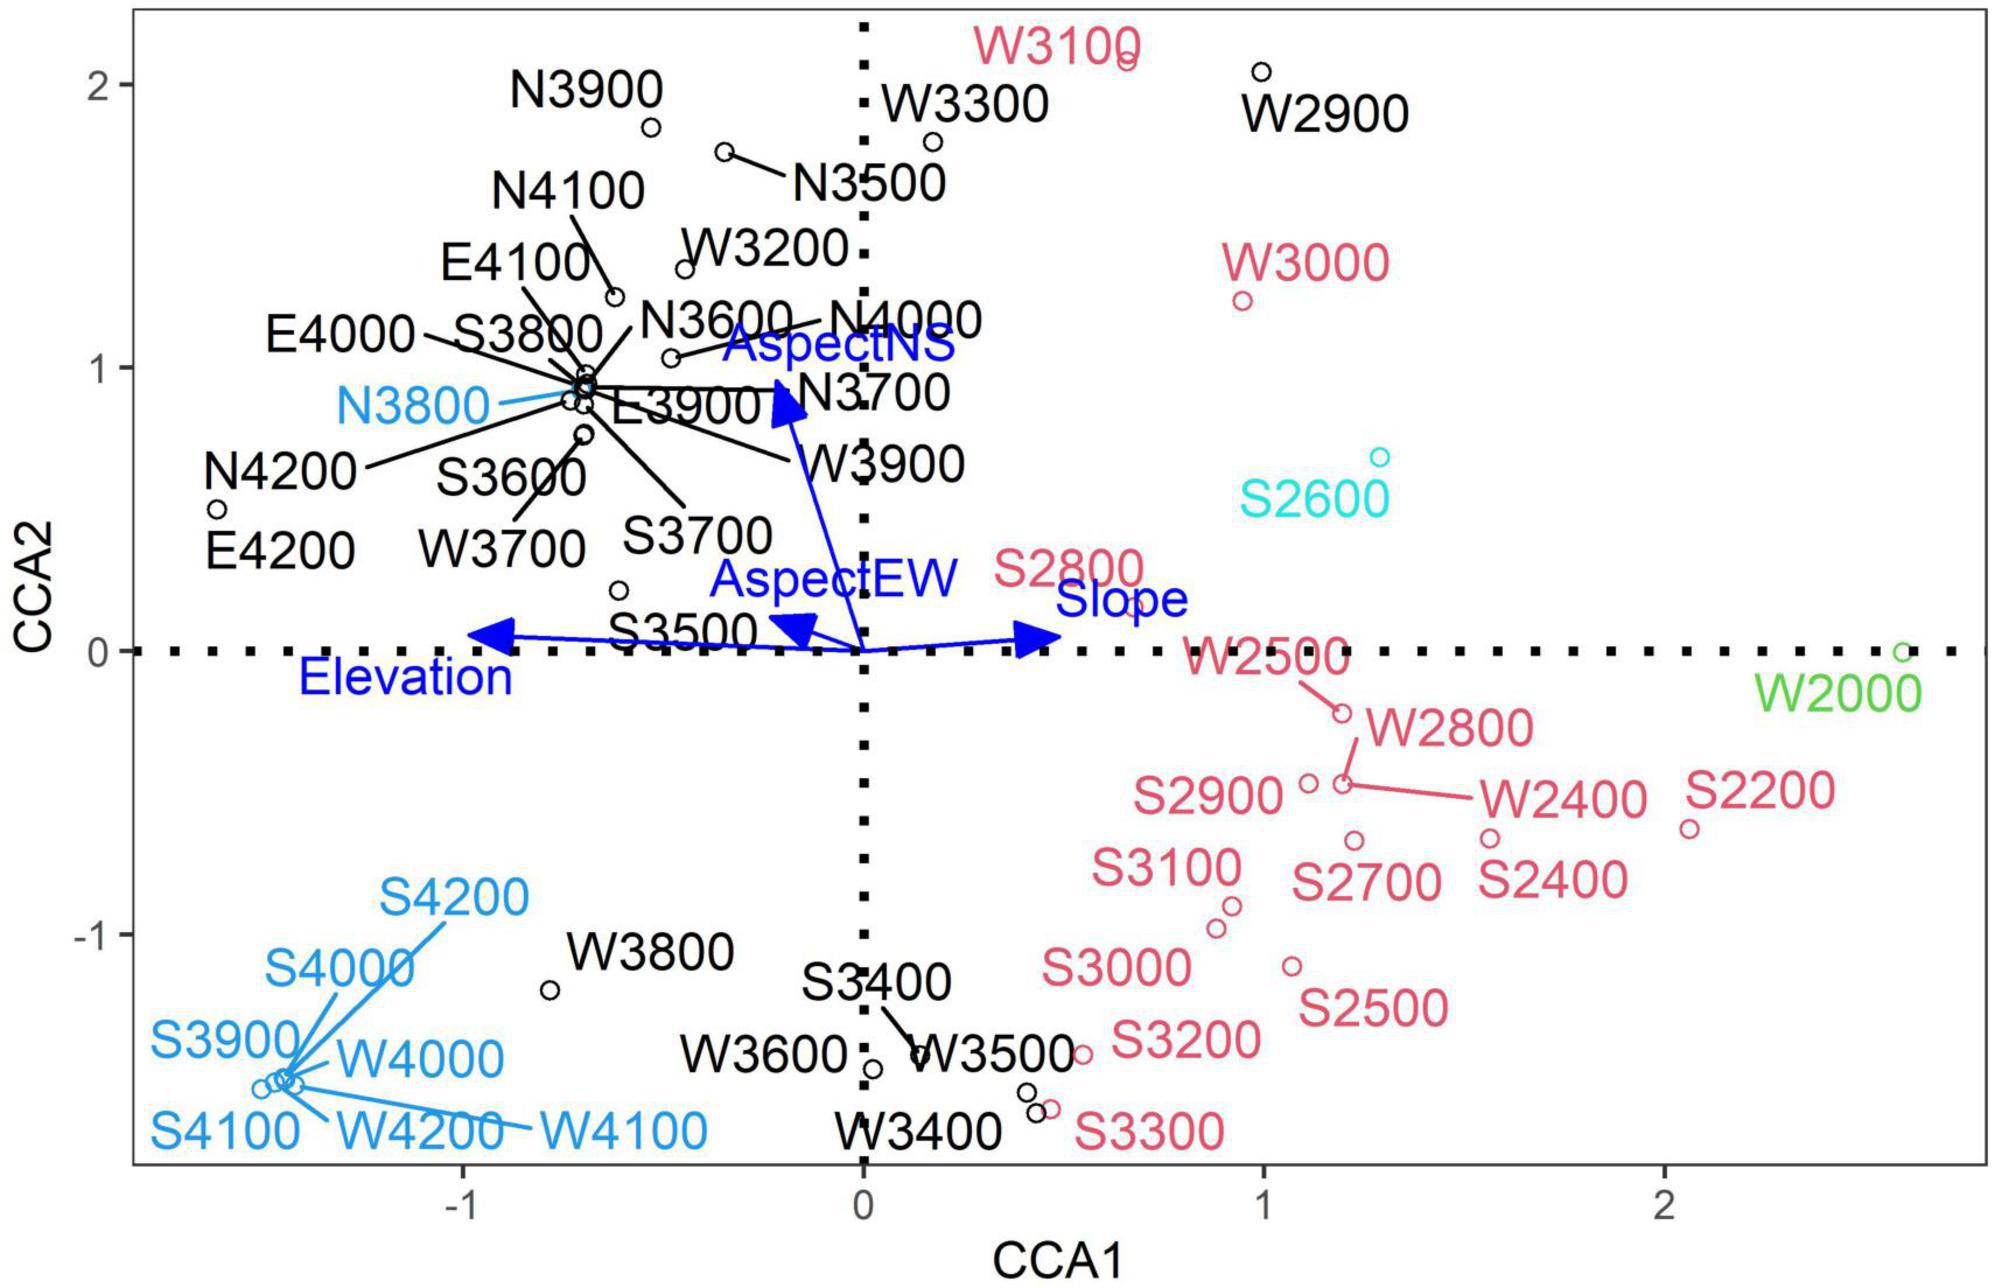
Figure 3. Canonical correspondence analysis (CCA) ordination of 50 plots classified into four vegetation communities using WA scores (calculate based on plot, same below) classified by TWINSPAN classification.
The ordination of 76 sample species illustrated five vegetation community types (Supplementary Figure 4, same below) with four distinct vegetation communities. Pseudotsuga, Padus, Camellia, Pinus, and Cinnamomum occurrences (green in Supplementary Figure 4) correlated positively with each other at medium elevation on a moderate slope. Castanopsis, Sophora, and Malus (navy blue in Supplementary Figure 4) had positive associations and were located at lower altitudes than the previous community, with a more southern or western aspect. The physical environment of Cornus, Acer, Machilus, Toxicodendron, etc. (red in Supplementary Figure 4) was quite similar to Castanopsis, Sophora, and Malus, but could still be divided into two distinct communities. Tilia, Tsuga, Rhododendron, Crataegus, Taxus, etc. (light blue in Supplementary Figure 4) were located at medium elevation on the southern or western aspect on a medium slope. The remaining species were positively connected to each other regardless of variations in their environmental factors, which could possibly be explained by their wide distributions in the study area.
4. Discussions
Our study demonstrated the influence of elevation, aspect, and slope on the woody vegetation in a human-impacted landscape. Consistent with previous research (Wang et al., 2014; Ullah et al., 2021), we found that elevation is a significant predictor of vegetation size. Specifically, the estimated maximum height, BA, and AGB followed a unimodal trend along the elevational gradient, peaking at 3100 m for maximum tree height and BA, and at 3300 m for AGB, before decreasing at higher elevations. However, we did not observe a clear relationship between species richness and any topographical attributes. Additionally, BA increased with slope steepness, while AGB decreased with a south to north aspect. We also generated separate visualizations of the five vegetation attributes along elevation for each of the four transects (see Supplementary Figure 5). The compositions and distributions of vegetation communities were primarily determined by elevation and north–south orientation.
Vegetation size and biomass largely influenced by climatic factors, e.g., mean annual temperature, total annual precipitation, and annual solar radiation that determine vegetation patterns along environmental gradients (Šímová et al., 2018; O’Brien et al., 2000). We found maximum tree height, BA, and AGB to each follow a unimodal pattern along the elevational gradients. The climate in our research area is reportedly dry at lower elevations of the valley in the west transect facing the Yangtze River (Shen, 2016; Yang et al., 2016a), making aridity one of the constraint factors limiting tree size (Munne-Bosch, 2018) and biomass accumulation (Muller-Landau et al., 2021) at lower elevations. If precipitation does not vary greatly, temperature becomes the most limiting climate factor in AGB. In northern Pakistan, for instance, forest AGB presented a monotonous decline from 850 to 8600 m, where mean annual precipitation is consistently lower than at 200 m while the mean annual temperature ranges from 40 to −10°C (Ullah et al., 2021).
Both natural and anthropogenic disturbances influence vegetation patterns in unprotected mountain landscapes. Villages are mainly located below 3000 m and activities such as wood harvesting, grazing, and igniting fires, both intentional and unintentional, have likely decreased tree size and AGB in lower elevations where human presence is more frequent, making it occasionally difficult to distinguish the climatic effects of elevation from human use of the forest. As an example, Acharya et al. (2011) found a unimodal pattern of BA from 300 m to 4700 m in the eastern Himalayas to be due to human disturbances from surrounding lower elevation villages. Occasionally ancient human-use of the forest can be inferred from vegetation structure and composition (Foster et al., 1992). In our study area, the shrub growth form of Quercus aquifolioides at low elevations was potentially one such indicator.
The range of elevation sampled may have influenced observed patterns of vegetation structure along elevational gradients. Our findings differ from those of Alves et al. (2010), who found AGB to increase with elevation up to 1100 m in a coastal Atlantic forest, and from those of Wang Y. et al. (2012) and Wang et al. (2014), who found that maximum tree height and AGB of Abies georgei decreased along elevational gradients, peaked at 3800 m and 3100 m, respectively, in the Tibetan Plateau. Our study covered an elevation range of 2000–4200 m above sea level, with structural attributes peaking around 3000 m and declining as elevation increased. This emphasizes the importance of sampling the entire elevational gradient to accurately describe the relationship between vegetation and the environment.
We observed a slightly higher AGB at the southern aspect than the northern aspect, which was consistent with a result focusing on the effects of elevation on vegetation, where a warmer climate in the southern aspect is conducive to AGB accumulation (Pepin et al., 2017).
The influence of elevation on aboveground biomass (AGB) can vary depending on the north-south orientation of aspect, and vice versa. In our study, we observed that AGB tends to be higher at mid-elevation on south-facing slopes.
In addition, BA increased slightly with slope degree, which is less straightforward to explain. However, one possible explanation is that steep slopes may reduce fire occurrence and spread due to a lack of fuel, allowing trees to grow taller and have larger basal area compared to areas with more frequent fires (Morandini et al., 2002; Gowda et al., 2019).
Although woody species richness appears to reach its highest values at mid-elevations, none of the trends of woody species richness along environmental gradients encompassed in the topographic variables were statistically significant. This is inconsistent with many studies conducted in protected forests located close to our research area (Wang et al., 2007; Xu et al., 2016; Yang et al., 2016a). However, this finding is consistent with earlier findings concerning the absence of β-diversity trends for tree and shrub species along elevational gradients in 46 mountains of China (Tang et al., 2012) that were well protected only from 1997 to 2008.
Topographic heterogeneity is strongly connected with species diversity (Stein et al., 2014). Other researchers have concluded from nearby protected areas that vascular plant richness along elevational gradients, ranging from either 3100–4300 m or from 2000 to 4300 m in the Hengduan Mountain presented a unimodal shape, with highest richness in the mid- elevational range (Wang et al., 2007; Yang et al., 2016b). We did not find a clear trend of woody species richness changes along EW or NS orientations. Yang et al. (2016b) found 300 vascular plant species on the western aspect compared with 501 vascular plant species on the eastern aspect of Baima Snow Mountain Reserves, very close to our study area. Our results demonstrated that tree species richness tended to increase with slope degree, although this was not statistically significant.
Elevation and NS aspect were the two dominant topographical factors determining woody species distributions in our study area. Slope had a relatively minor effect on these factors. The impact of the NS aspect was much greater than that of the EW aspect. Woody vegetation in the 50 sample plots could be grouped into five types: hot-dry valley shrub-like forests, abandoned cropland, mid-low warm aspect forests, high elevation forests, and alpine shrub and grassland. When considering the indicator woody species in the area, all woody species classified into five vegetation communities, four of which placed in their distinct environmental conditions. Pseudotsuga, Pinus, and Cinnamomum communities were placed at medium elevation, both the Acer community and Castanopsis community were at the medium-to-low elevation on a steeper slope, Tilia, Tsuga, Taxus, and Picea communities were in the medium elevation at a warm aspect. The remaining species, though grouped into one, presented little information of their environmental preferences.
Previous studies have indicated that topographic factors are major drivers of vascular plant distribution patterns (Moeslund et al., 2013). We found elevation and aspect to be the two most relevant variables defining vegetation composition, with slope degree playing a smaller role. Similarly, Fadl et al. (2021) reported the distribution of vascular plant species to be strongly affected by elevation and NS aspect at an elevation range from 1060 to 1240 m in Sarawat Mountain, Saudi Arabia. Bai et al. (2021) demonstrated elevation to be the primary driving factor of vascular plant distribution in a Larix gmelinii forest in northeast China, while aspect was the second most important factor and slope had only minor importance.
Our study had limitations that either constrained the external use of the results or called for further research. Firstly, our sampling design, based on contours, led to a slight overrepresentation of steep slopes. Secondly, our research was based on landscape-scale sampling, and the results should not be assumed to hold in other regions. Thirdly, earlier studies have shown that forests in southwestern China are commonly disturbed by fire (Han et al., 2015) and potentially other major natural disturbances, which should optimally be included in forest structure studies. Future research on disturbance history would therefore be valuable. Topographic attributes indirectly affected vegetation via different climatic variables at each site. Detecting climatic factors at each plot to link with the topographic attributes would be helpful for understanding the influence of the local climate on vegetation in mountainous regions. Despite these problems, our results are valuable for understanding vegetation structure changes along environmental gradients, but the picture would improve further with more information on these listed problems.
Our study highlights that differences in vegetation structure, richness, and composition were correlated with elevation, aspect, and slope degree, which can be used as a baseline for predicting AGB shifting under climate change. At higher elevations, close to the peak of our research area, AGB decreased with increasing elevation, suggesting an increase under a warming climate. While at elevations of 2000–3300 m in this study, warmer temperatures are likely to reduce AGB via increased disturbances, assuming that precipitation is not changing.
Our results on tree size and biomass could be used to provide recommendations for designing forest management plans including carbon sequestration objectives. As most settlements in this area are below 3000 m and harvesting Pinus and Quercus trunks currently occurs mainly at this range of elevation, increasing aridity caused by climate change is likely to cause challenges, eventually leading to a pressure to move human activities upward.
Data availability statement
The original contributions presented in this study are included in the article/Supplementary material, further inquiries can be directed to the corresponding authors.
Author contributions
ZC participated in the collection of field data, performed the statistical analyses, prepared the figures, and wrote the original manuscript. TA provided insight into the data used and the mathematical aspects of the methods. ML conceived the idea of the manuscript, applied for funding, planned the experiments, and participated in the collection of field data. All authors discussed the results, thoroughly revised the manuscript, contributed critically to the drafts, and gave final approval for publication.
Funding
This research was supported by the National Natural Science Foundation of China (No. 32171539).
Conflict of interest
The authors declare that the research was conducted in the absence of any commercial or financial relationships that could be construed as a potential conflict of interest.
Publisher’s note
All claims expressed in this article are solely those of the authors and do not necessarily represent those of their affiliated organizations, or those of the publisher, the editors and the reviewers. Any product that may be evaluated in this article, or claim that may be made by its manufacturer, is not guaranteed or endorsed by the publisher.
Supplementary material
The Supplementary Material for this article can be found online at: https://www.frontiersin.org/articles/10.3389/ffgc.2023.1187724/full#supplementary-material
Footnotes
References
Acharya, B. K., Chettri, B., and Vijayan, L. (2011). Distribution pattern of trees along an elevation gradient of Eastern Himalaya, India. Acta Oecol. 37, 329–336. doi: 10.1016/j.actao.2011.03.005
Akaike, H. (1973). “Information theory and an extension of the maximum likelihood principle,” in International symposium on information theory, eds B. N. Petrov and F. Csaki (Budapest: Akademiai Kiado), 267–281.
Alves, L. F., Vieira, S. A., Scaranello, M. A., Camargo, P. B., Santos, F. A. M., Joly, C. A., et al. (2010). Forest structure and live aboveground biomass variation along an elevational gradient of tropical Atlantic moist forest (Brazil). For. Ecol. Manag. 260, 679–691. doi: 10.1016/j.foreco.2010.05.023
Bai, X., Sadia, S., and Yu, J. (2021). Community composition and structure along environmental gradients of Larix gmelinii forest in northeast China. Pakistan J. Bot. 53, 1845–1850. doi: 10.30848/PJB2021-5(24)
Barthlott, W., Hostert, A., Kier, G., Küper, W., Kreft, H., Mutke, J., et al. (2007). Geographic patterns of vascular plant diversity at continental to global scales. Erdkunde 61, 305–315. doi: 10.3112/erdkunde.2007.04.01
Bartoń, K. (2022). MuMIn: multi-model inference. R package version 1.46.0. Available online at: https://CRAN.R-project.org/package=MuMIn (accessed January 20, 2022).
Bates, D., Maechler, M., Bolker, B., and Walker, S. (2015). Fitting linear mixed-effects models using lme4. J. Stat. Softw. 67, 1–48. doi: 10.18637/jss.v067.i01
Beaty, R. M., and Taylor, A. H. (2001). Spatial and temporal variation of fire regimes in a mixed conifer forest landscape, Southern Cascades, California, USA. J. Biogeogr. 28, 955–966. doi: 10.1046/j.1365-2699.2001.00591.x
Bonan, G. B. (2008). Forests and climate change: Forcings, feedbacks, and the climate benefits of forests. Science 320, 1444–1449. doi: 10.1126/science.1155121
Burnett, B. N., Meyer, G. A., and McFadden, L. D. (2008). Aspect-related microclimatic influences on slope forms and processes, northeastern Arizona. J. Geophys. Res. 113:F03002. doi: 10.1029/2007JF000789
Chave, J., Rejou-Mechain, M., Burquez, A., Chidumayo, E., Colgan, M. S., Delitti, W. B., et al. (2014). Improved allometric models to estimate the aboveground biomass of tropical trees. Glob. Change Biol. 20, 3177–3190. doi: 10.1111/gcb.12629
Colwell, R. K., Brehm, G., Cardelus, C. L., Gilman, A. C., and Longino, J. T. (2008). Global warming, elevational range shifts, and lowland biotic attrition in the wet tropics. Science 322, 258–261. doi: 10.1126/science.1162547
Dulamsuren, C., and Hauck, M. (2008). Spatial and seasonal variation of climate on steppe slopes of the northern Mongolian mountain taiga. Grassl. Sci. 54, 217–230. doi: 10.1111/j.1744-697X.2008.00128.x
Elsen, P. R., and Tingley, M. W. (2015). Global mountain topography and the fate of montane species under climate change. Nat. Clim. Change 5, 772–776. doi: 10.1038/nclimate2656
Fadl, M. A., Al-Yasi, H. M., and Alsherif, E. A. (2021). Impact of elevation and slope aspect on floristic composition in wadi Elkor, Sarawat Mountain, Saudi Arabia. Sci. Rep. 11:16160. doi: 10.1038/s41598-021-95450-4
Fan, Z.-X., Bräuning, A., Cao, K.-F., and Zhu, S.-D. (2009). Growth–climate responses of high-elevation conifers in the central Hengduan Mountains, southwestern China. For. Ecol. Manag. 258, 306–313. doi: 10.1016/j.foreco.2009.04.017
Foster, D. R., Zebryk, T., Schoonmaker, P., and Lezberg, A. (1992). Post-settlement history of human land-use and vegetation dynamics of a Tsuga canadensis (Hemlock) woodlot in central New England. J. Ecol. 80, 773–786. doi: 10.2307/2260865
Gaire, N. P., Fan, Z.-X., Bräuning, A., Panthi, S., Rana, P., Shrestha, A., et al. (2020). Abies spectabilis shows stable growth relations to temperature, but changing response to moisture conditions along an elevation gradient in the central Himalaya. Dendrochronologia 60:125675. doi: 10.1016/j.dendro.2020.125675
Gardiner, B., Berry, P., and Moulia, B. (2016). Review: wind impacts on plant growth, mechanics and damage. Plant Sci. 245, 94–118. doi: 10.1016/j.plantsci.2016.01.006
Ge, W., Deng, L., Wang, F., and Han, J. (2021). Quantifying the contributions of human activities and climate change to vegetation net primary productivity dynamics in China from 2001 to 2016. Sci. Total Environ. 773:145648. doi: 10.1016/j.scitotenv.2021.145648
Gowda, J. H., Tiribelli, F., Mermoz, M., Kitzberger, T., and Morales, J. M. (2019). Fragmentation modulates the response of dichotomous landscapes to fire and seed dispersal. Ecol. Modell. 392, 22–30. doi: 10.1016/j.ecolmodel.2018.10.014
Grytnes, J. A. (2003). Species-richness patterns of vascular plants along seven altitudinal transects in Norway. Ecography 26, 291–300. doi: 10.1034/j.1600-0587.2003.03358.x
Hadley, W., Romain, F., Lionel, H., Kirill, M., and Davis, V. (2023). dplyr: a grammar of data manipulation. R package version 1.1.0. Available online at: https://CRAN.Rproject.org/package=dplyr (accessed January 20, 2022).
Han, J., Shen, Z., Ying, L., Li, G., and Chen, A. (2015). Early post-fire regeneration of a fire-prone subtropical mixed Yunnan pine forest in Southwest China: effects of pre-fire vegetation, fire severity and topographic factors. For. Ecol. Manag. 356, 31–40. doi: 10.1016/j.foreco.2015.06.016
Heydari, M., Cheraghi, J., Omidipour, R., Mirab-balou, M., and Pothier, D. (2021). Beta diversity of plant community and soil mesofauna along an elevational gradient in a mountainous semi-arid oak forest. Commun. Ecol. 22, 165–176. doi: 10.1007/s42974-021-00046-7
Hua, F., Wang, X., Zheng, X., Fisher, B., Wang, L., Zhu, J., et al. (2016). Opportunities for biodiversity gains under the world’s largest reforestation programme. Nat. Commun. 7:12717. doi: 10.1038/ncomms12717
Hua, F., Xu, J., and Wilcove, D. S. (2018). A new opportunity to recover native forests in China. Conserv. Lett. 11:e12396. doi: 10.1111/conl.12396
Huang, B., Lu, S., and Zhang, G. (2020). Soil series of China: central and western regions vol., Yunnan vol. Beijing: Science press.
Isbell, F., Gonzalez, A., Loreau, M., Cowles, J., Diaz, S., Hector, A., et al. (2017). Linking the influence and dependence of people on biodiversity across scales. Nature 546, 65–72. doi: 10.1038/nature22899
Joly, D., and Gillet, F. (2017). Interpolation of temperatures under forest cover on a regional scale in the French Jura Mountains. Int. J. Climatol. 37, 659–670. doi: 10.1002/joc.5029
Jump, A. S., Matyas, C., and Penuelas, J. (2009). The altitude-for-latitude disparity in the range retractions of woody species. Trends Ecol. Evol. 24, 694–701. doi: 10.1016/j.tree.2009.06.007
Keith, D. A., Ferrer-Paris, J. R., Nicholson, E., and Kingsford, R. T. (2020). The IUCN global ecosystem typology 2.0: descriptive profiles for biomes and ecosystem functional groups. Gland: IUCN. doi: 10.2305/IUCN.CH.2020.13.en
Körner, C. (2007). The use of ‘altitude’ in ecological research. Trends Ecol. Evol. 22, 569–574. doi: 10.1016/j.tree.2007.09.006
Kunwar, S., Wang, L. Q., Chaudhary, R., Joshi, P. R., Ali, A., and Ward, D. (2021). Stand density of co-existing species regulates above-ground biomass along a local-scale elevational gradient in tropical forests. Appl. Veg. Sci. 24:e12577. doi: 10.1111/avsc.12577
Li, Z., He, Y., Wang, C., Wang, X., Xin, H., Zhang, W., et al. (2011). Spatial and temporal trends of temperature and precipitation during 1960–2008 at the Hengduan Mountains. China. Quat. Int. 236, 127–142. doi: 10.1016/j.quaint.2010.05.017
Lin, D., Lai, J., Muller-Landau, H. C., Mi, X., and Ma, K. (2012). Topographic variation in aboveground biomass in a subtropical evergreen broad-leaved forest in China. PLoS One 7:e48244. doi: 10.1371/journal.pone.0048244
Liu, Y., Li, P., Xu, Y., Shi, S., Ying, L., Zhang, W., et al. (2016). Quantitative classification and ordination for plant communities in dry valleys of Southwest China. Biodivers. Sci. 24, 378–388. doi: 10.17520/biods.2015241
Luo, Y., Zhao, X., Li, Y., Liu, X., Wang, L., Wang, X., et al. (2021). Wind disturbance on litter production affects soil carbon accumulation in degraded sandy grasslands in semi-arid sandy grassland. Ecol. Eng. 171:106373. doi: 10.1016/j.ecoleng.2021.106373
Lyman, R. L., and Ames, K. M. (2007). On the use of species-area curves to detect the effects of sample size. J. Archaeol. Sci. 34, 1985–1990. doi: 10.1016/j.jas.2007.01.011
Martin, L. J., Blossey, B., and Ellis, E. (2012). Mapping where ecologists work: biases in the global distribution of terrestrial ecological observations. Front. Ecol. Environ. 10:195–201. doi: 10.1890/110154
Moeslund, J. E., Arge, L., Bøcher, P. K., Dalgaard, T., and Svenning, J.-C. (2013). Topography as a driver of local terrestrial vascular plant diversity patterns. Nordic J. Bot. 31, 129–144. doi: 10.1111/j.1756-1051.2013.00082.x
Monge-González, M. L., Craven, D., Krömer, T., Castillo-Campos, G., Hernández-Sánchez, A., Guzmán-Jacob, V., et al. (2019). Response of tree diversity and community composition to forest use intensity along a tropical elevational gradient. Appl. Veg. Sci. 23, 69–79. doi: 10.1111/avsc.12465
Moore, J., Gardiner, B., and Sellier, D. (2018). “Tree mechanics and wind loading,” in Plant biomechanics, eds A. Geitmann and J. Gril (Berlin: Springer), 79–106. doi: 10.1007/978-3-319-79099-2_4
Morandini, F., Santoni, P. A., Balbi, J. H., Ventura, J. M., and Mendes-Lopes, J. M. (2002). A two-dimensional model of fire spread across a fuel bed including wind combined with slope conditions. Int. J. Wildland Fire 11, 53–63. doi: 10.1071/WF01043
Moritz, C., and Agudo, R. (2013). The future of species under climate change: resilience or decline? Science 341, 504–508. doi: 10.1126/science.1237190
Muller-Landau, H. C., Cushman, K. C., Arroyo, E. E., Martinez Cano, I., Anderson-Teixeira, K. J., and Backiel, B. (2021). Patterns and mechanisms of spatial variation in tropical forest productivity, woody residence time, and biomass. New Phytol. 229, 3065–3087. doi: 10.1111/nph.17084
Munne-Bosch, S. (2018). Limits to tree growth and longevity. Trends Plant Sci. 23, 985–993. doi: 10.1016/j.tplants.2018.08.001
Myers, N., Mittermeier, R. A., Mittermeier, C. G., da Fonseca, G. A., and Kent, J. (2000). Biodiversity hotspots for conservation priorities. Nature 403, 853–858. doi: 10.1038/35002501
O’Brien, E. M., Field, R., and Whittaker, R. J. (2000). Climatic gradients in woody plant (tree and shrub) diversity: water-energy dynamics, residual variation, and topography. Oikos 89, 588–600. doi: 10.1034/j.1600-0706.2000.890319.x
Oksanen, J., Simpson, G. L., Blanchet, F. G., Kindt, R., Legendre, P., Minchin, P. R., et al. (2022). vegan: Community Ecology Package. R package version 2.6-4. Available online at: https://CRAN.R-project.org/package=vegan (accessed December 20, 2021).
Pepin, N. C., Pike, G., Schaefer, M., Boston, C. M., and Lovell, H. (2017). A comparison of simultaneous temperature and humidity observations from the SW and NE slopes of Kilimanjaro: the role of slope aspect and differential land-cover in controlling mountain climate. Glob. Planet. Change 157, 244–258. doi: 10.1016/j.gloplacha.2017.08.006
Perring, F. (1959). Topographical gradients of chalk grassland. J. Ecol. 47, 447–481. doi: 10.2307/2257376
Potapov, P., Hansen, M. C., Laestadius, L., Turubanova, S., Yaroshenko, A., Thies, C., et al. (2017). The last frontiers of wilderness: tracking loss of intact forest landscapes from 2000 to 2013. Sci. Adv. 3:e1600821. doi: 10.1126/sciadv.1600821
Qin, Y., Feng, Q., Adamowski, J. F., Zhu, M., and Zhang, X. (2021). Community level response of leaf stoichiometry to slope aspect in a montane environment: a case study from the Central Qilian Mountains, China. Glob. Ecol. Conserv. 28:e01703. doi: 10.1016/j.gecco.2021.e01703
Qu, S., Wang, L., Lin, A., Yu, D., Yuan, M., and Li, C. A. (2020). Distinguishing the impacts of climate change and anthropogenic factors on vegetation dynamics in the Yangtze River Basin, China. Ecol. Indic. 108:105724. doi: 10.1016/j.ecolind.2019.105724
Rahbek, C., Borregaard, M. K., Antonelli, A., Colwell, R. K., Holt, B. G., Nogues-Bravo, D., et al. (2019a). Building mountain biodiversity: geological and evolutionary processes. Science 365, 1114–1119. doi: 10.1126/science.aax0151
Rahbek, C., Borregaard, M. K., Colwell, R. K., Dalsgaard, B., Holt, B. G., Morueta-Holme, N., et al. (2019b). Humboldt’s enigma: what causes global patterns of mountain biodiversity? Science 365, 1108–1113. doi: 10.1126/science.aax0149
Rejou-Mechain, M., Tanguy, A., Piponiot, C., Chave, J., and Herault, B. (2017). BIOMASS: an R package for estimating above-ground biomass and its uncertainty in tropical forests. Methods Ecol. Evol. 8, 1163–1167. doi: 10.1111/2041-210X.12753
Rogeau, M.-P., and Armstrong, G. W. (2017). Quantifying the effect of elevation and aspect on fire return intervals in the Canadian rocky mountains. For. Ecol. Manag. 384, 248–261. doi: 10.1016/j.foreco.2016.10.035
Rowe, R. J., and Lidgard, S. (2009). Elevational gradients and species richness: do methods change pattern perception? Glob. Ecol. Biogeogr. 18, 163–177. doi: 10.1111/j.1466-8238.2008.00438.x
Sanders, N. J., and Rahbek, C. (2012). The patterns and causes of elevational diversity gradients. Ecography 35, 1–3. doi: 10.1111/j.1600-0587.2011.07338.x
Scheiner, S. M. (2003). Six types of species-area curves. Glob. Ecol. Biogeogr. 12, 441–447. doi: 10.1046/j.1466-822X.2003.00061.x
Shen, Z. (2016). Plant diversity in the dry valleys of Southwest China: spatial deviation and determinants for flora and plant communities. Biodivers. Sci. 24, 363–366. doi: 10.17520/biods.2016049
Šímová, I., Violle, C., Svenning, J. C., Kattge, J., Engemann, K., Sandel, B., et al. (2018). Spatial patterns and climate relationships of major plant traits in the New World differ between woody and herbaceous species. J. Biogeogr. 45, 895–916. doi: 10.1111/jbi.13171
Sloan, S., Jenkins, C. N., Joppa, L. N., Gaveau, D. L. A., and Laurance, W. F. (2014). Remaining natural vegetation in the global biodiversity hotspots. Biol. Conserv. 177, 12–24. doi: 10.1016/j.biocon.2014.05.027
Stein, A., Gerstner, K., Kreft, H., and Arita, H. (2014). Environmental heterogeneity as a universal driver of species richness across taxa, biomes and spatial scales. Ecol. Lett. 17, 866–880. doi: 10.1111/ele.12277
Strassburg, B. B. N., Iribarrem, A., Beyer, H. L., Cordeiro, C. L., Crouzeilles, R., Jakovac, C. C., et al. (2020). Global priority areas for ecosystem restoration. Nature 586, 724–729. doi: 10.1038/s41586-020-2784-9
Tang, Z., and Fang, J. (2004). A review on the elevational patterns of plant species diversity. Biodivers. Sci. 20, 20–28. doi: 10.17520/biods.2004004
Tang, Z., Fang, J., Chi, X., Feng, J., Liu, Y., Shen, Z., et al. (2012). Patterns of plant beta-diversity along elevational and latitudinal gradients in mountain forests of China. Ecography 35, 1083–1091. doi: 10.1111/j.1600-0587.2012.06882.x
Ullah, F., Gilani, H., Sanaei, A., Hussain, K., and Ali, A. (2021). Stand structure determines aboveground biomass across temperate forest types and species mixture along a local-scale elevational gradient. For. Ecol. Manag. 486:118984. doi: 10.1016/j.foreco.2021.118984
Wang, G., Ran, F., Chang, R., Yang, Y., Luo, J., and Jianrong, F. (2014). Variations in the live biomass and carbon pools of Abies georgei along an elevation gradient on the Tibetan Plateau. China. For. Ecol. Manag. 329, 255–263. doi: 10.1016/j.foreco.2014.06.023
Wang, J., Ou, G., Tang, J., Zhenlong, L., Li, H., and Hui, X. (2012). Biomass estimation model of shrub community at Jatropha curcas growing area in Lincang of Yunnan. J. West China For. Sci. 41:167.
Wang, Y., Cufar, K., Eckstein, D., and Liang, E. (2012). Variation of maximum tree height and annual shoot growth of Smith fir at various elevations in the Sygera Mountains, southeastern Tibetan Plateau. PLoS One 7:e31725. doi: 10.1371/journal.pone.0031725
Wang, Z., Liu, X., Wang, H., Zheng, K., Li, H., Wang, G., et al. (2021). Monitoring vegetation greenness in response to climate variation along the elevation gradient in the three-river source region of China. ISPRS Int. J. Geo Informat. 10:193. doi: 10.3390/ijgi10030193
Wang, Z., Tang, Z., and Fang, J. (2007). Altitudinal patterns of seed plant richness in the Gaoligong Mountains, south-east Tibet, China. Divers. Distribut. 13, 845–854. doi: 10.1111/j.1472-4642.2007.00335.x
Xie, Z., Wang, Y., Tang, Z., and Xu, W. (2018). Handbook of biomass allometric models of shrubs in China. Beijing: Science press.
Xu, Y., Li, P., Liu, Y., Zhang, W., and Qin, S. (2016). Spatial patterns and determinants of species richness of alien and native plants in the Nujiang River valley. Biodivers. Sci. 24, 389–398. doi: 10.17520/biods.2015243
Xu, Y., Shen, Z., Ying, L., Zang, R., and Jiang, Y. (2019). Effects of current climate, paleo-climate, and habitat heterogeneity in determining biogeographical patterns of evergreen broad-leaved woody plants in China. J. Geogr. Sci. 29, 1142–1158. doi: 10.1007/s11442-019-1650-x
Yang, Y., Han, J., Liu, Y., Zhongyong, C., Shi, S., Sina, C., et al. (2016a). A comparison of the altitudinal patterns in plant species diversity within the dry valleys of the three parallel rivers region, northwestern Yunnan. Biodivers. Sci. 24, 440–452. doi: 10.17520/biods.2015361
Yang, Y., Shen, Z., Han, J., and Zhongyong, C. (2016b). Plant diversity along the eastern and western slopes of Baima Snow Mountain. China. Forests 7:89. doi: 10.3390/f7040089
Zeleny, D. (2021). twinspanR: TWo-way INdicator SPecies ANalysis (and its modified version) in R. R package version 0.22. Available online at: https://github.com/zdealveindy/twinspanR (accessed January 10, 2022).
Zhang, W., Zhao, L., Larjavaara, M., Morris, E. C., Sterck, F. J., and Wang, G. (2020). Height-diameter allometric relationships for seedlings and trees across China. Acta Oecol. 108:103621. doi: 10.1016/j.actao.2020.103621
Keywords: elevational gradients, aspect, slope degree, vegetation structure, vegetation composition
Citation: Cheng Z, Aakala T and Larjavaara M (2023) Elevation, aspect, and slope influence woody vegetation structure and composition but not species richness in a human-influenced landscape in northwestern Yunnan, China. Front. For. Glob. Change 6:1187724. doi: 10.3389/ffgc.2023.1187724
Received: 16 March 2023; Accepted: 19 May 2023;
Published: 14 June 2023.
Edited by:
Hubert Hasenauer, University of Natural Resources and Life Sciences, AustriaReviewed by:
Romà Ogaya, Ecological and Forestry Applications Research Center (CREAF), SpainMaría Leticia Monge-Gonzáelz, Instituto de Ecología (INECOL), Mexico
Copyright © 2023 Cheng, Aakala and Larjavaara. This is an open-access article distributed under the terms of the Creative Commons Attribution License (CC BY). The use, distribution or reproduction in other forums is permitted, provided the original author(s) and the copyright owner(s) are credited and that the original publication in this journal is cited, in accordance with accepted academic practice. No use, distribution or reproduction is permitted which does not comply with these terms.
*Correspondence: Zhongqian Cheng, emhvbmdxaWFuQHN0dS5wa3UuZWR1LmNu; Markku Larjavaara, bWFya2t1LmxhcmphdmFhcmFAaGVsc2lua2kuZmk=