 Zhuo Liu
 Mahmoud Al-Sarayreh
 Yanjie Li
 Zhilin Yuan
94% of researchers rate our articles as excellent or good
Learn more about the work of our research integrity team to safeguard the quality of each article we publish.
Find out more
ORIGINAL RESEARCH article
Front. For. Glob. Change , 05 May 2023
Sec. Forest Growth
Volume 6 - 2023 | https://doi.org/10.3389/ffgc.2023.1179910
This article is part of the Research Topic Forest Phenomics: How Does Developing Sensor Technology Improve the Growth of Forest Plantations? View all 5 articles
Hyperspectral imagery and machine learning have proven to be powerful, non-invasive, and chemical-free tools for studying tree symbiotic fungi. However, traditional machine learning requires manual feature extraction (feature engineering) of spectral and spatial features of tree symbiotic fungi. Deep convolutional neural networks (CNNs) can extract self and robust features directly from the raw data. In the current study, a deep CNN architecture is proposed to recognize the isolates of dark septate endophytic (DSE) fungal in hyperspectral images. The performance of different CNN approaches (two-dimensional and three-dimensional CNNs) was compared and evaluated based on two independent datasets collected using visible-near-infrared (VNIR) and short-wave-infrared (SWIR) hyperspectral imaging systems. Moreover, the impact of different spectral pre-processing techniques was investigated. The results show that a hybrid CNN architecture (3D-2D CNN), which combines three and two-dimensional CNNs, achieved the best performance for the classification of fungal isolates on SWIR hyperspectral data compared to the same architecture on VNIR hyperspectral data. The best performance is 100% for precision, recall, and overall accuracy. The results also demonstrate that combining different pre-processing techniques on raw SWIR spectra can significantly improve the performance of the CNN models for fungal classification. The hybrid CNN approach with SWIR hyperspectral data provides an efficient method for classifying fungal isolates, which can contribute to the development of accurate and non-destructive tools for evaluating the occurrence of fungal isolates on trees. Such tools can be beneficial for both sustainable agriculture and preserving fungal diversity.
Nowadays, more attention has been paid to the ecological significance and diversity of tree symbiotic fungi (Hagh-Doust et al., 2022), which inhabit healthy tree tissues and may influence tree growth. Thus, endophytic fungi have become an important component of the tree root mycobiome, which could potentially alleviate the host tree’s abiotic stresses (Qin et al., 2017). For example, Dark Septate Endophytes (DSEs), a subgroup of endophytic fungi characterized by melanized hyphae, colonize root epidermis and cortex both inter- and intracellularly, forming densely septated intracellular structures known as microsclerotia (Knapp et al., 2015). DSEs have been reported to form symbiotic associations with a wide range of plants, spanning diverse climatic regions and major biomes, and are notably abundant in extreme and nutrient-deprived environments like arid and semi-arid zones (Porras-Alfaro and Bayman, 2011).
Dark septate endophytics might play a role in breaking down organic matter in nutrient-scarce soils, similar to the function of ericoid mycorrhizal fungi–mutualistic partners that help host plants by processing complex substrates in environments lacking nutrients (Knapp et al., 2018). As a result, DSEs could potentially support host trees in coping with abiotic stress through the generation of melanized hyphae and microsclerotia while also acting as promoters of plant growth (Gostinèar et al., 2009). Enhancing fungal identification through hyperspectral data analysis may facilitate the concurrent detection of fungal isolates with physiological and ecological significance, thereby promoting the comprehensive evaluation of the multifaceted utility values of DSEs.
In recent years, the development of remote sensing techniques has provided reliable and promising technologies for characterizing the growth of trees and fungi over a wide period (Stone and Mohammed, 2017). The popular remote sensing techniques related to fungi classification and detection of fungal diseases mainly include hyperspectral imagery (Singh et al., 2007; Yao et al., 2008; Femenias et al., 2022) and red, green, blue (RGB) imagery (Marique et al., 2012; Ropelewska, 2019; Kirti et al., 2021).
Hyperspectral imaging (HSI) systems are considered robust tools for analyzing the chemical and physical properties of materials or objects. Compared to conventional imaging systems such as RGB imaging, HSI systems can collect reflected light at hundreds of narrow wavelengths over a wide range of bands in the electromagnetic spectrum, including the visible and near-infrared (VNIR) areas (400–1,100 nm) and the short-wave infrared (SWIR) area (1,100–2,500 nm) (Ghamisi et al., 2017). However, the large number of spectral bands and complex structure of hyperspectral images results in large data sizes, necessitating the use of efficient and reliable analysis methods.
RGB imagery covers only three wavelengths from the visible region of the electromagnetic spectrum (red, green, and blue), reflecting only the visible (or color) information of materials. Therefore, HSI systems have an advantage due to the wealth of spectral information they can collect for analyzing the internal (chemical) and external (physical) composition of target materials, such as fungi on trees (Goetz et al., 1985; Bioucas-Dias et al., 2013).
Traditional and laboratory-based techniques, such as cytochemical processing, time-lapse cameras, and photomicroscopy, have shown high accuracy in identifying fungi (Williams et al., 2012a). However, these techniques are time-consuming, not rapid, and can lead to biological or chemical contamination. In contrast, HSI technology is ideally suited for fungal identification due to its advantages of being high-throughput, chemical-free, rapid, and non-destructive.
Traditional machine learning algorithms have been widely used in analyzing HSI data in various remote sensing tasks. These algorithms include support-vector machines (SVMs) (Vapnik, 1999), random forests (RF) (Breiman, 2001), gradient boosting machines (GBMs) (Natekin and Knoll, 2013), and artificial neural network (ANN) (Nie and Linkens, 1992). SVM and RF are the most commonly used algorithms for plant fungi disease detection and fungal isolate classification using hyperspectral image data. For instance, Qiao et al. (2017) used SVM and SWIR hyperspectral images to identify fungi-contaminated peanuts from healthy peanuts, achieving an overall classification accuracy above 95%. Zhang et al. (2007) and Chu et al. (2020) also achieved promising results with SVM, with overall classification accuracies of 100% for the classification of three fungal species naturally infected on maize and 90% for three different fungal species on wheat, respectively. These studies demonstrate that SVM is a reliable and promising method for fungi disease detection and fungi species classification. Siedliska et al. (2018) proposed RF and ANN algorithms for the early stages detection of infections by two fungal species in two strawberry fruit species, achieving an overall discriminating accuracy between inoculated and control fruit higher than 97%.
Convolutional neural networks (CNNs), which belong to deep learning, were first developed in the late 1980s (LeCun et al., 1989), and recently have gained huge interest in computer vision tasks such as object recognition, detection, and segmentation. Three different CNN approaches have been proposed for analyzing HSI image data: one-dimensional (1D-CNN) for only spectral information, two-dimensional (2D-CNN) for spatial information of selected bands, and three-dimensional (3D-CNN) for combining both spectral and spatial information of HSI image data (Al-Sarayreh et al., 2018; Audebert et al., 2019; Paoletti et al., 2019; Soni et al., 2021).
The CNN approach is advantageous over the traditional machine learning algorithms by automatically extracting the required spatial and spectral features from the raw HSI image, while traditional machine learning depends on manually extracted features that are highly affected by the domain of expertise (Hedjazi et al., 2017).
The use of CNNs and hyperspectral imagery in fungi analysis mainly focuses on fungi species classification and disease identification tasks (Billones et al., 2020; Gaikwad, 2021; Kumar et al., 2021). Mansuri et al. (2022) compared 1D-CNN with Partial Least Squares-Discriminant Analysis (PLS-DA) and Artificial Neural Network (ANN) for detecting fungal contamination in maize kernels using hyperspectral imaging. The results showed that 1D-CNN achieved the best classification accuracy with average error rates of 3.15, compared to 5.71, and 4.94 for PLS-DA and ANN, respectively.
Jin et al. (2018) found that the combination of 2D-CNN and bidirectional-gated recurrent unit (GRU) neural network (2D-CNN-BidGRU) achieved the highest accuracy in the classification of wheat Fusarium head blight disease for early detection of plant viral disease, compared to the 1D-CNN methods, with an accuracy of 85%. Nguyen et al. (2021) compared the performance of SVM, RF, 2D-CNN, and 3D-CNN for the detection of grapevine viral disease in HSI images, and it was found that 2D-CNN and 3D-CNN outperformed the traditional machine learning models, achieving an accuracy of 71 and 75% on a small size dataset, respectively.
Furthermore, studies have investigated the impact of different spectral ranges of HSI systems on fungi species classification. For instance, Lu et al. (2020) reported that VNIR hyperspectral data and the SVM algorithm achieved the highest classification accuracy of 95.87% on five cereal fungi in different growth stages, while Williams et al. (2012b) found that PLS-DA and SWIR hyperspectral data can efficiently be used for the classification of different Fusarium spp. fungi species in the culture medium. This indicates that traditional machine learning and the right HSI system can achieve good results in the classification of fungi on the culture medium. However, limited research efforts have been devoted to the use of CNN methods and the full and wide spectral range of hyperspectral images for the classification of fungi isolates on the culture medium.
Laburnicola rhizohalophila sp. nov., a novel Dark Septate Endophyte (DSE) species, has been isolated from the healthy roots of S. salsa and shown to have phytobeneficial effects on host seedling growth (Yuan et al., 2020). The ability to identify different isolates of Laburnicola rhizohalophila sp. nov., which can enhance tree growth and bolster the salt stress tolerance of their host plants, is valuable. It is worth noting that the effects on tree growth and salt tolerance vary among the different ploidy levels and genetic diversification of these DSE strains. Therefore, the ability to identify these fungi during different growth stages can potentially have a significant impact on promoting future productivity.
The current study focuses on the classification of DSEs fungi isolates to demonstrate the effective analysis of CNN methods and hyperspectral images for the first time. This study considers five DSE fungal isolates and both the VNIR and SWIR hyperspectral images data with the aim of addressing the following four main objectives:
1. Investigate the performance of different CNN approaches (2D-CNN, 3D-CNN, and their hybrid) for fungi isolates classification.
2. Investigate the performance of different HSI spectral ranges (VNIR and SWIR) for the classification of the selected five fungi isolates.
3. Investigate the impact of different spectral pre-processing methods and the importance of wavelengths used for fungi isolates classification tasks.
4. Propose and evaluate a hybrid CNN architecture that can be used for fungi isolates classification and similar tasks.
In this study, we considered and generated five fungal isolates belonging to the Laburnicola rhizohalophila sp. nov. (named 8A, 44, r22, 19, 11A) (Yuan et al., 2020; He and Yuan, 2021), which were obtained from the China General Microbiological Culture Collection Center (CGMCC 3.19615). The fungi were first cultured in Potato Dextrose Agar (PDA) culture medium for purification, and the highly active fungi were then inoculated on new PDA culture medium at 22°C.
Two HSI systems, each consisting of a hyperspectral camera (push broom scan and reflectance mode) and six light sources: the GaiaSky-mini2 VNIR hyperspectral camera (176 wavelengths, 400–1,000 nm), the Gaiafield Pro-N25EXE SWIR hyperspectral camera (256 wavelengths, 1,000–2,500 nm) (Jiangsu Shuangli Hepu Technology Co., Ltd., Nanjing, China), and a set of Halogen lamps as the light source. The cameras and the light sources were warmed up for 30 min first. Then, black references (by covering the cameras with their caps) and white references (using a standard whiteboard) were collected for each VNIR and SWIR camera for calibration purposes and to reduce the impact of experiment-to-experiment variation.
After 24 h of fungal subculturing, all 120 fungi samples from different growth stages were used for VNIR and SWIR hyperspectral data collection. Each of the five fungal isolates had 24 replicates, and hyperspectral image collection began 1 day after the start of growth. Images were captured every 2 days, for a total of six times, resulting in a dataset of 720 hyperspectral images each for both VNIR and SWIR.
The camera was positioned approximately 50 cm above the culture plate to capture images of the fungi samples. All of the images were calibrated to extract the reflectance intensities, to remove the dark current effect and uneven illumination effect from the images using the dark and white reference by the following formula:
where RC is the calibrated image and R, D, and W represent the raw, dark, and white reference images, respectively (Geladi et al., 2004).
To remove the background noise and generate clean fungal colony images, as shown in Figures 1, 2, only the culture medium within the petri dish was selected by hand and marked as an area of interest (ROI). Then, the reflectance values at 649.6 nm for VNIR and 1,588 nm for SWIR were used to discriminate between the culture medium and fungal colonies. Thus, threshold values (below 0.1 for VNIR and greater than 0.07 for SWIR) were used to segment the regions of fungal growth from the culture medium as shown in Figures 1, 2.
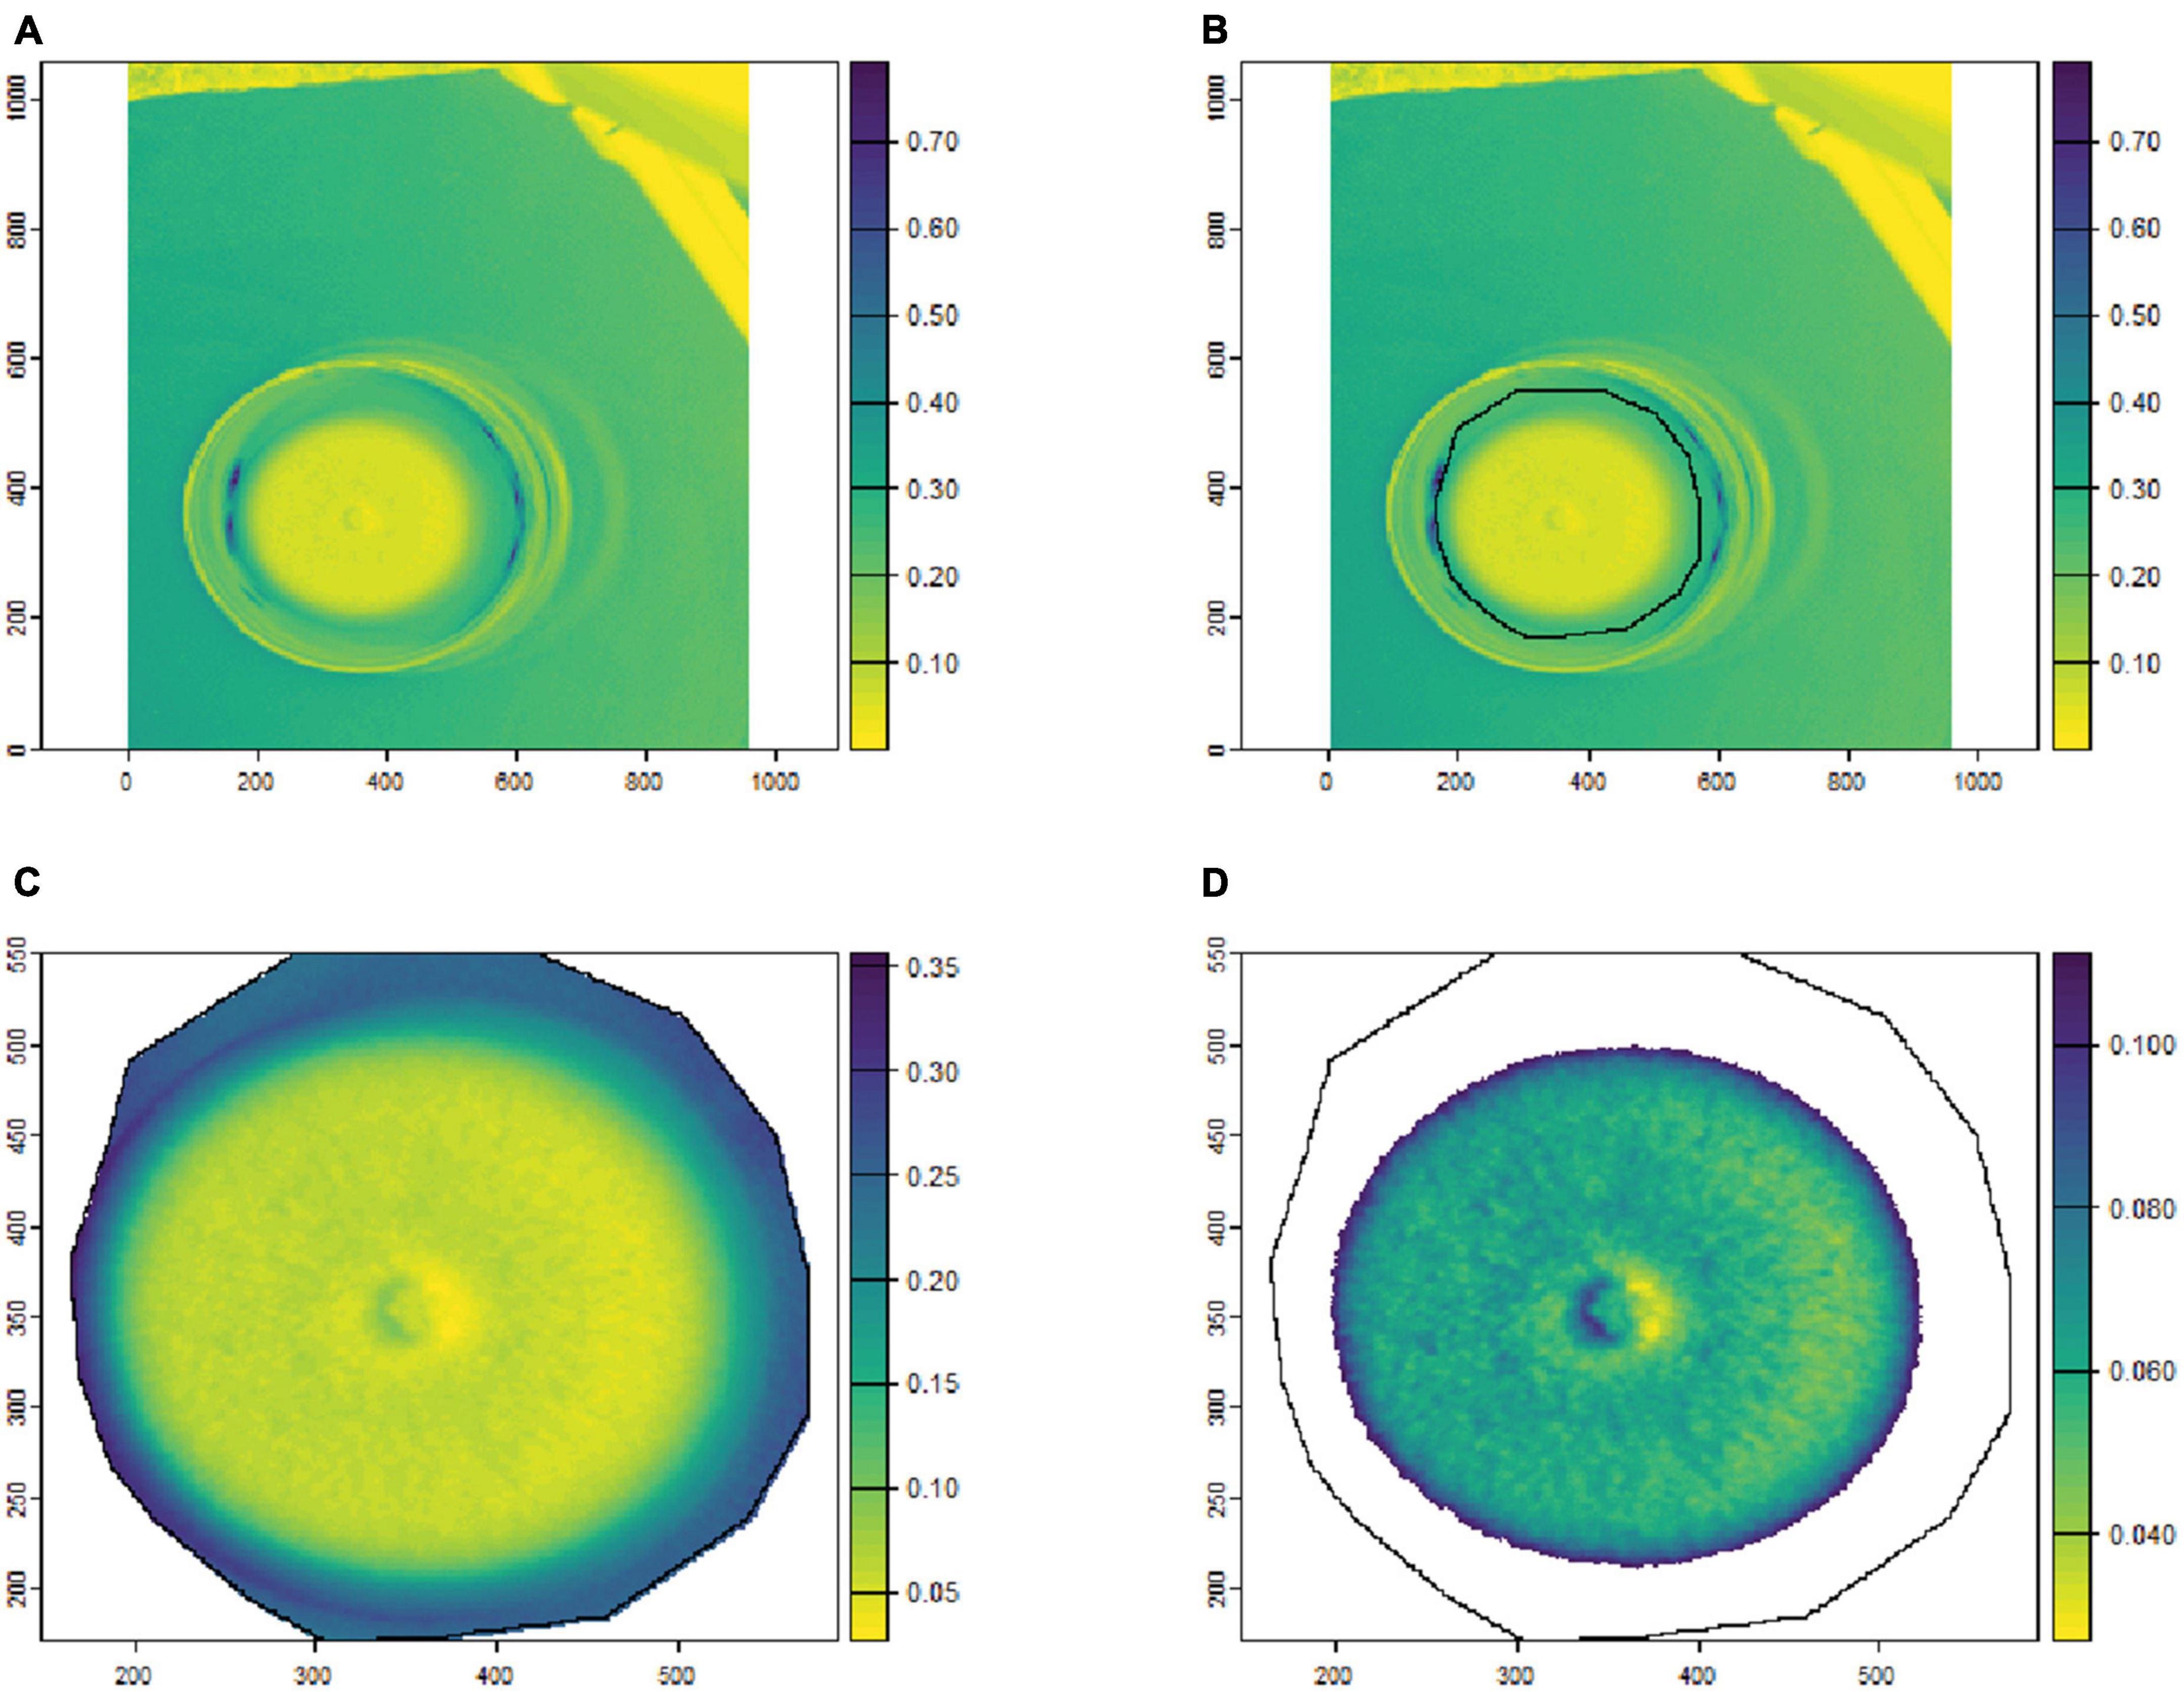
Figure 1. An example of fungal segmentation from VNIR hyperspectral images. The fungal colony area was manually labeled as an area of interest (ROI) and extracted by removing the values at 649.6 nm below 0.1. (A) The VNIR hyperspectral image (selected band); (B) the manually labeled ROI area; (C) the ROI area after cropping from the hyperspectral image; (D) the extracted fungal colonies area after thresholding at 649.6 nm. The horizontal and vertical coordinates indicate the image dimensions (in pixels), and the color bar represents the reflectance values.
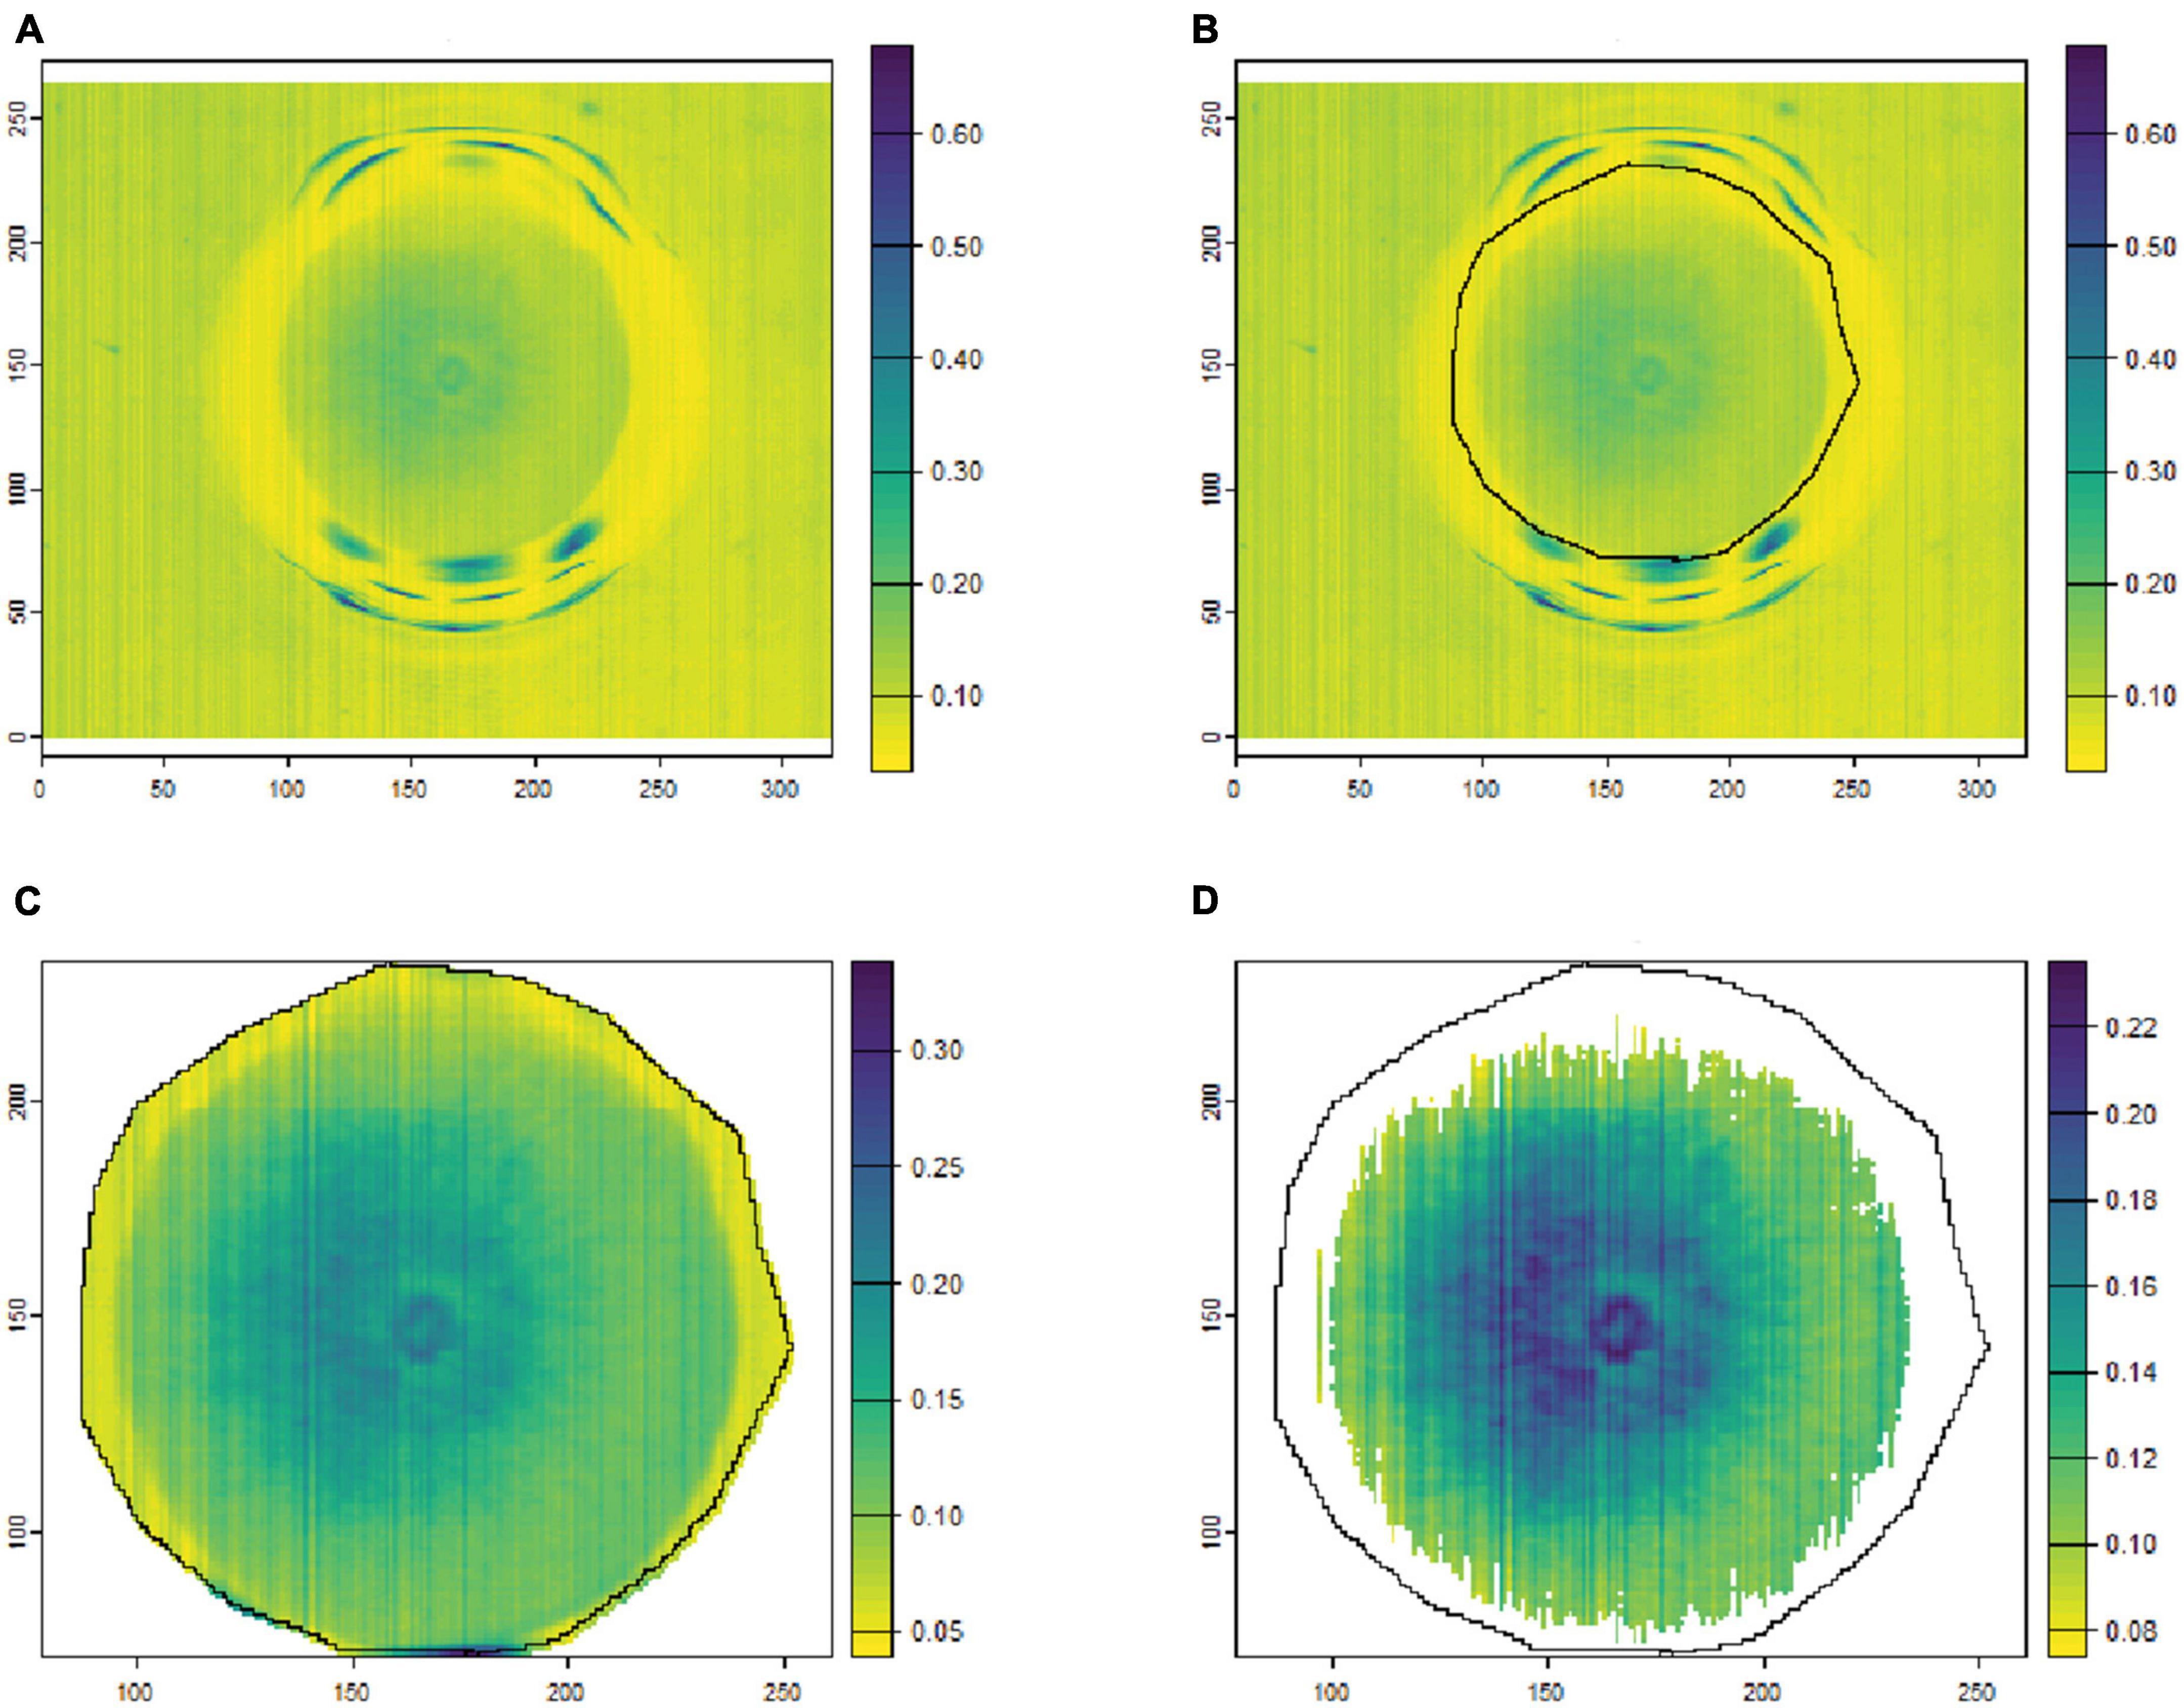
Figure 2. An example of fungal segmentation from SWIR hyperspectral images. The fungal colony area was manually labeled as an area of interest (ROI) and extracted by removing the values at 1588.6 nm below 0.07. (A) The SWIR hyperspectral image (selected band); (B) manually labeled ROI area; (C) the ROI area after cropping from the hyperspectral image; (D) the extracted fungal colony area after thresholding at 1,588 nm. The horizontal and vertical coordinates indicate the image dimensions (in pixels), and the color bar represents the reflectance values.
In the current study, the classification ability of 2D-CNN, 3D-CNN, and their hybrid methods on the five fungi isolates were investigated and evaluated. The detailed structure of these CNN models has been shown in Figure 3.
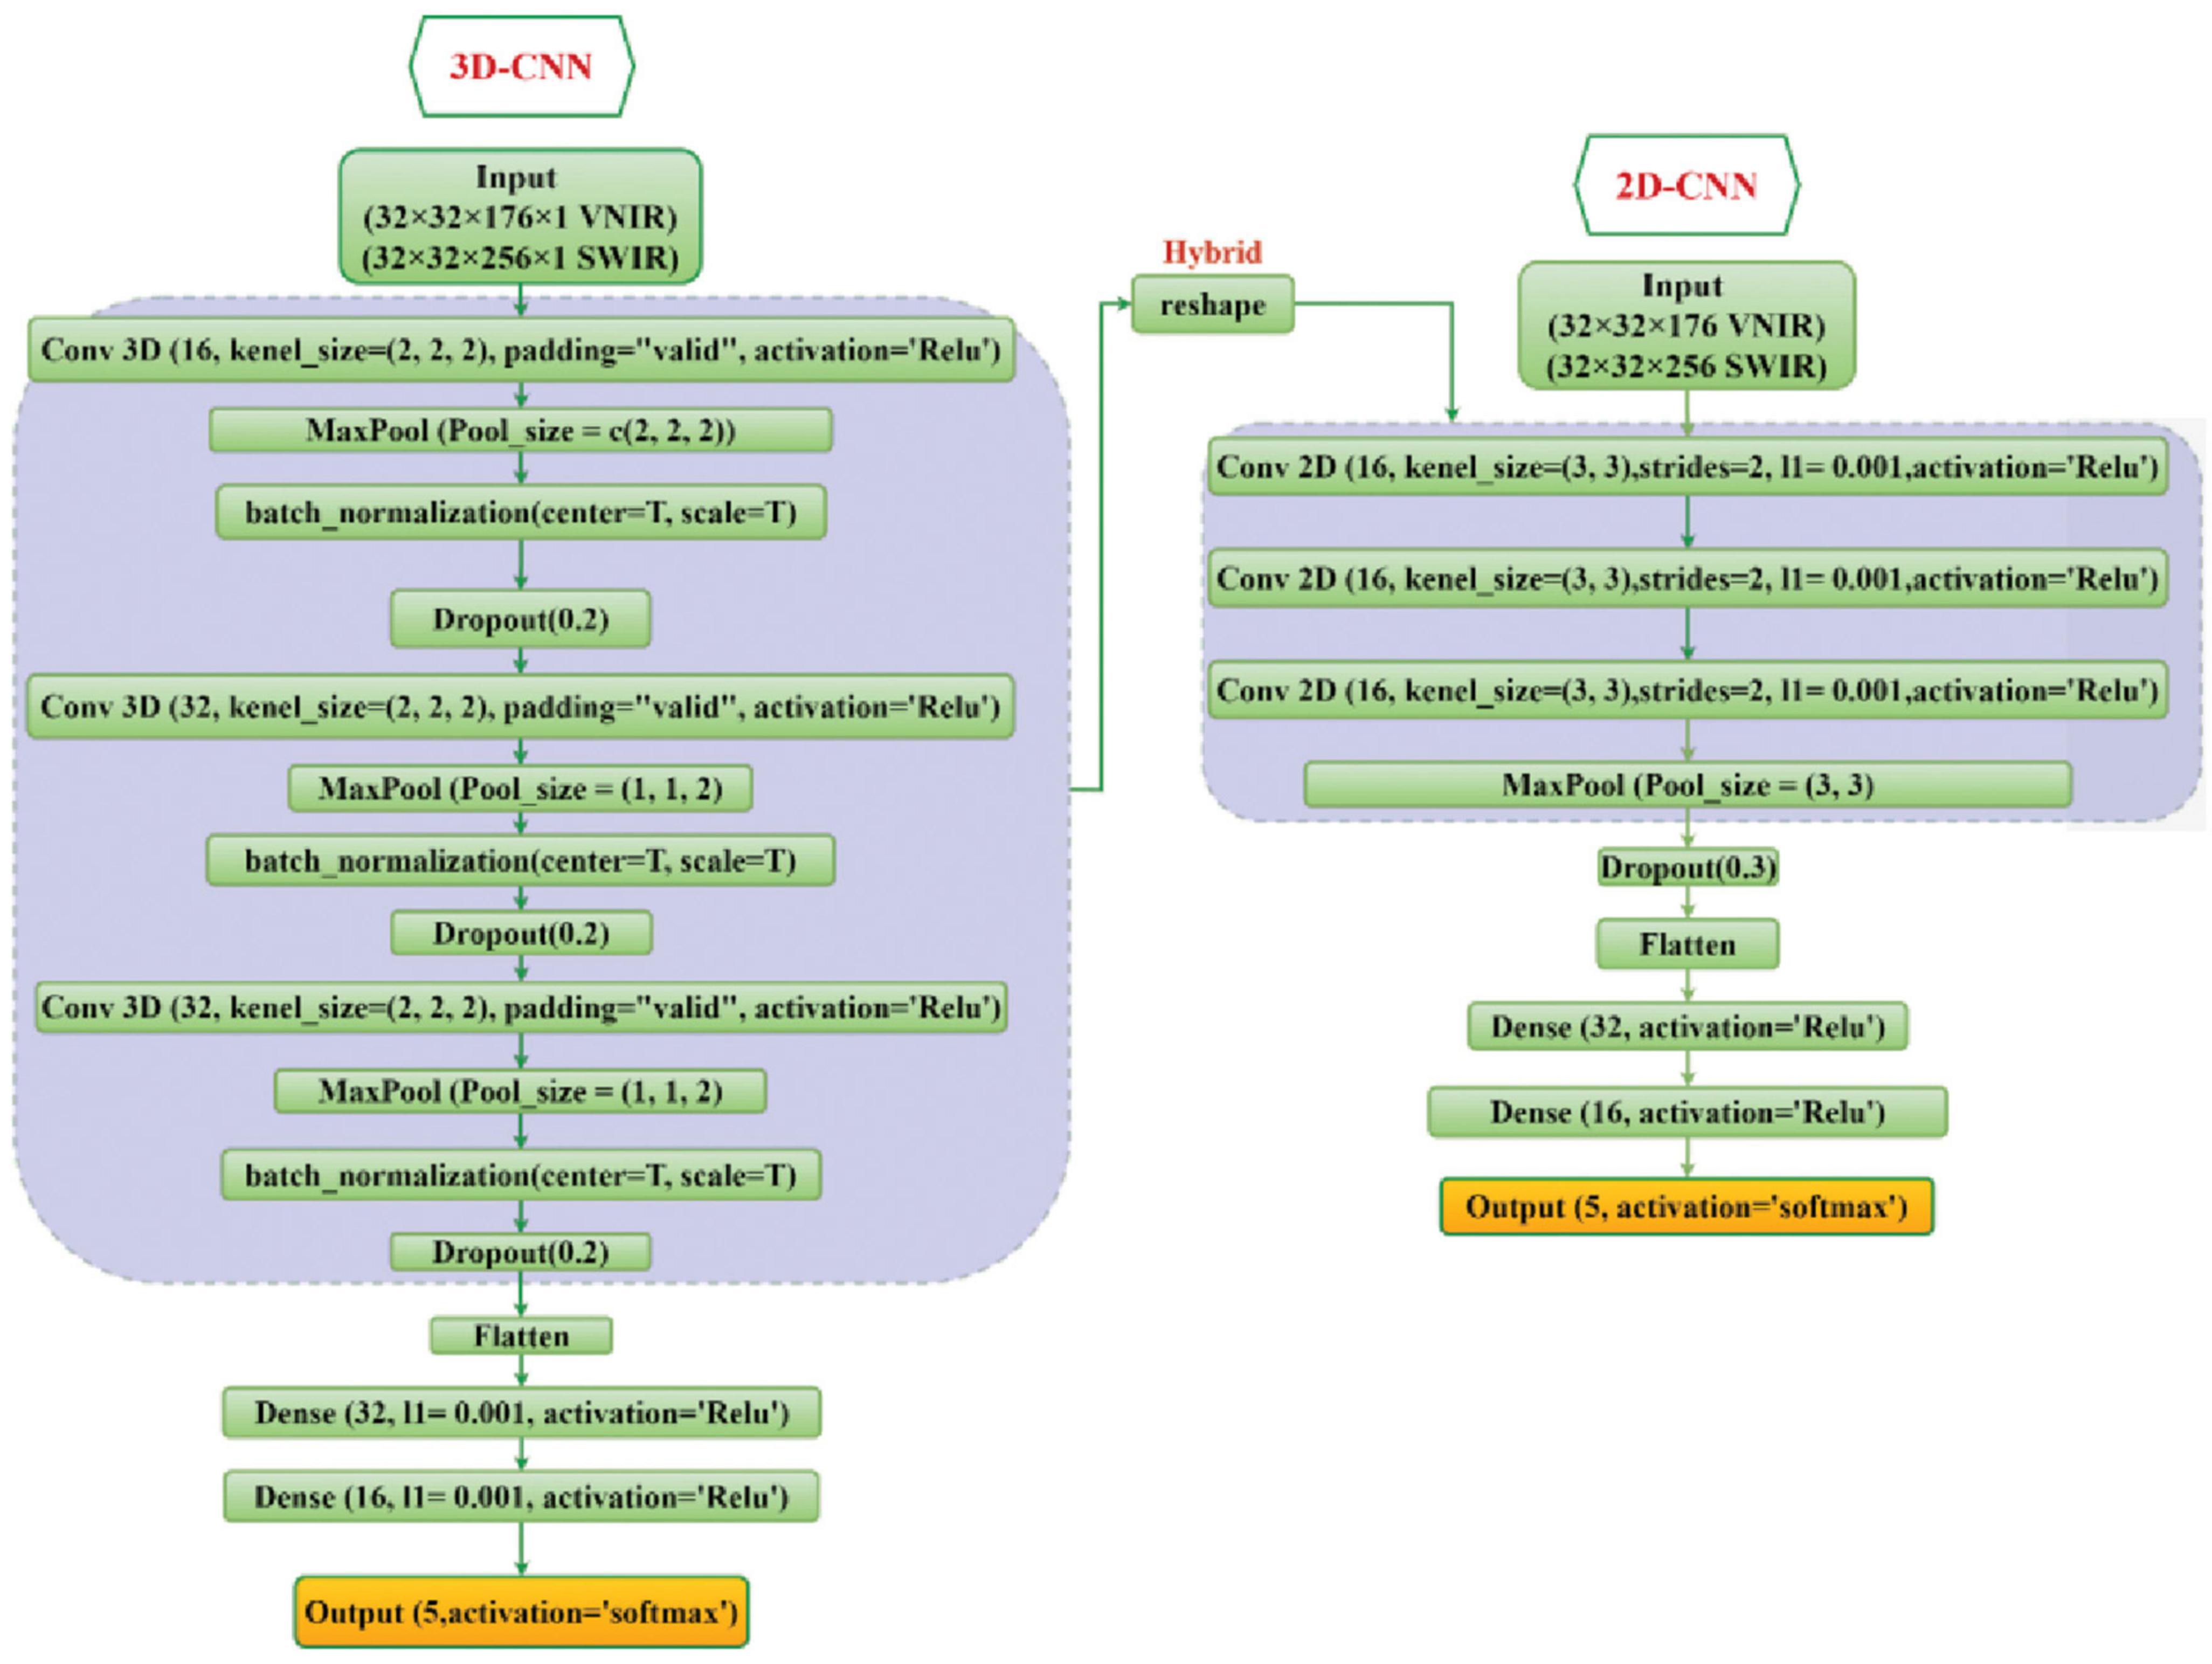
Figure 3. The overall framework of the 2D-CNN, 3D-CNN, and hybrid 3D-2D-CNN model. For VNIR images the used input layer is (32 × 32 × 176 × 1) and for SWIR images the input layer is (32 × 32 × 256 × 1).
For the 2D-CNN model, the fungi hyperspectral images were resized to (32 × 32 × 176) for VNIR data, with height, width, and wavelength, respectively, and similarly (32 × 32 × 256) for SWIR data as inputs. Three 2D CNN layers with two-dimensional kernels were used. The output of the last CNN layer was flattened into a vector and then connected to three fully connected layers. A stride of 2 and kernel size of (3, 3) were used for each convolutional layer. The ReLU activation function was used for all hidden layers, while the softmax function was used in the output layer.
For the 3D-CNN model, each fungi hyperspectral image was resized to 32 × 32 (height × width) to standardize the image input. The hyperspectral image cube for the input parameter of the 3D-CNN comprised height × width × wavelength × spatial, which included the spatial and spectral information. For the VNIR and SWIR 3D-CNN model, the input layer was set as 32 × 32 × 176 × 1 and 32 × 32 × 256 × 1, respectively, followed by three 3D convolutional layers (with three-dimensional kernels) and three fully connected layers. The spectral-spatial features were extracted by the CNN layers and continually used by the fully connected layer for the classification. Similar to the 2D-CNN model, the output of the last CNN layer is flattened before the fully connected layer is applied. We used a kernel size of (3, 3, 2) in the convolutional layers, and the ReLU function was used as the activation function in all hidden layers.
For both 2D-CNN and 3D-CNN models, the softmax function was used in the output layer. Moreover, batch normalization layers (Ioffe and Szegedy, 2015), dropout layers (Srivastava et al., 2014) of 0.2, and max pooling layer of (2, 2, 2) were added to the proposed models to accelerate the training process and controlling the probability of overfitting.
The hybrid 3D-2D CNN model is a combination of the proposed 3D and 2D-CNN models by utilizing the 3D convolutional layers first (similar to the single 3D-CNN model), and then a new reshape layer has been added to reshape the output of the last 3D-CNN into a two-dimension structure to be connected with the 2D convolutional layers. Then the output of the last 2D-CNN layer is flattened and connected with three fully connected layers. The neurons for each of these three fully connected layers were set to 64, 32, and 16, respectively. Finally, softmax activation was used in the output layer for the 5 fungal isolates classification. Figure 3 illustrates the proposed 2D-CNN, 3D-CNN, and the hybrid CNN model.
All of the CNN models (i.e., 2D-CNN, 3D-CNN, and 3D-2D hybrid CNN) were trained using the Adam optimizer (Loshchilov and Hutter, 2017) with the categorical_crossentropy loss function. The batch size and epochs were set to 32 and 300, respectively.
Several spectral pre-processing techniques were investigated and applied to the raw calibration spectra from the hyperspectral images in order to reduce the potential influences of overlapping or light noise around various spectra wavelengths (Alchanatis et al., 2005) and to evaluate the influence of different pre-processing methods on the classification of fungi species using CNNs. The pre-processing techniques included standard normal variate (SNV) (Barnes et al., 1989), continuum removal (CR) (Clark and Roush, 1984), De-trending (DET) (Barnes et al., 1989), and 1st (FST) derivatives (Cameron and Moffatt, 1987).
To prevent overfitting and generate a stable and robust classification model with a low number of training samples, a data augmentation methodology was proposed. The model was trained using only the raw hyperspectral data as input, and then the inputs were augmented by applying a combination of different pre-processing techniques on hyperspectral images during the training process.
For training and evaluation purposes, the collected dataset (720 samples) was randomly split into a calibration set of 576 samples (80%) and a validation set of 144 samples (20%) on all CNN models. The overall accuracy (OA) of the prediction, precision (P), and recall (R) were used for the final evaluation of the model performance on the validation set, which included completely new fungi samples. Precision evaluates the number of positive predictions for each group, while recall finds how many of the positive results were predicted correctly. These metrics can be calculated using the following formulas:
where true positives (TP) represent the number of samples that are originally measured as a positive class and the model predicts them as positive; true negatives (TN) represent the number of samples that are originally measured as a negative class and the model predicts them as negative; false negatives (FN) represent the number of samples that are originally measured as a positive class and the model predicts them as negative; false positives (FP) represent the number of samples that are originally measured as a negative class and the model predicts them as positive; N is the total number of samples.
All of the hyperspectral images data processing and CNN model calibration and validation was accomplished with R software version 4.2.3 (R Core Team, 2023) by using the RStudio platform (Allaire, 2012). The following packages were used: (1) prospectr package was used for spectral pre-processing; (2) EBImage (Pau et al., 2010), raster (Hijmans et al., 2015), and terra package (Hijmans, 2022) were used for hyperspectral image processing; (3) keras package (Allaire and Chollet, 2022) was used for CNN model calibration; (4) ggplot2 package (Wickham et al., 2016) was used for visualization.
Figure 4 illustrates an example of RGB, VNIR, and SWIR hyperspectral images of five fungal colonies (8A, 44, r22, 19, 11A) growing in the culture medium at the same growth stages (day 10). The results show that it was easy to distinguish the r22 fungi from others but hard to distinguish the other four fungi visually from the images. The r22 fungi produced less melanin than the other four fungi, which led to the r22 fungi appearing whiter than the other fungi. The VNIR and SWIR spectra show diversity in classifying fungi from the culture medium, the wavelength 649.6 nm for VNIR and 1,588 nm for SWIR show clear discrimination between the fungi and the PDA. However, some wavelengths cannot discriminate the fungi from the background.
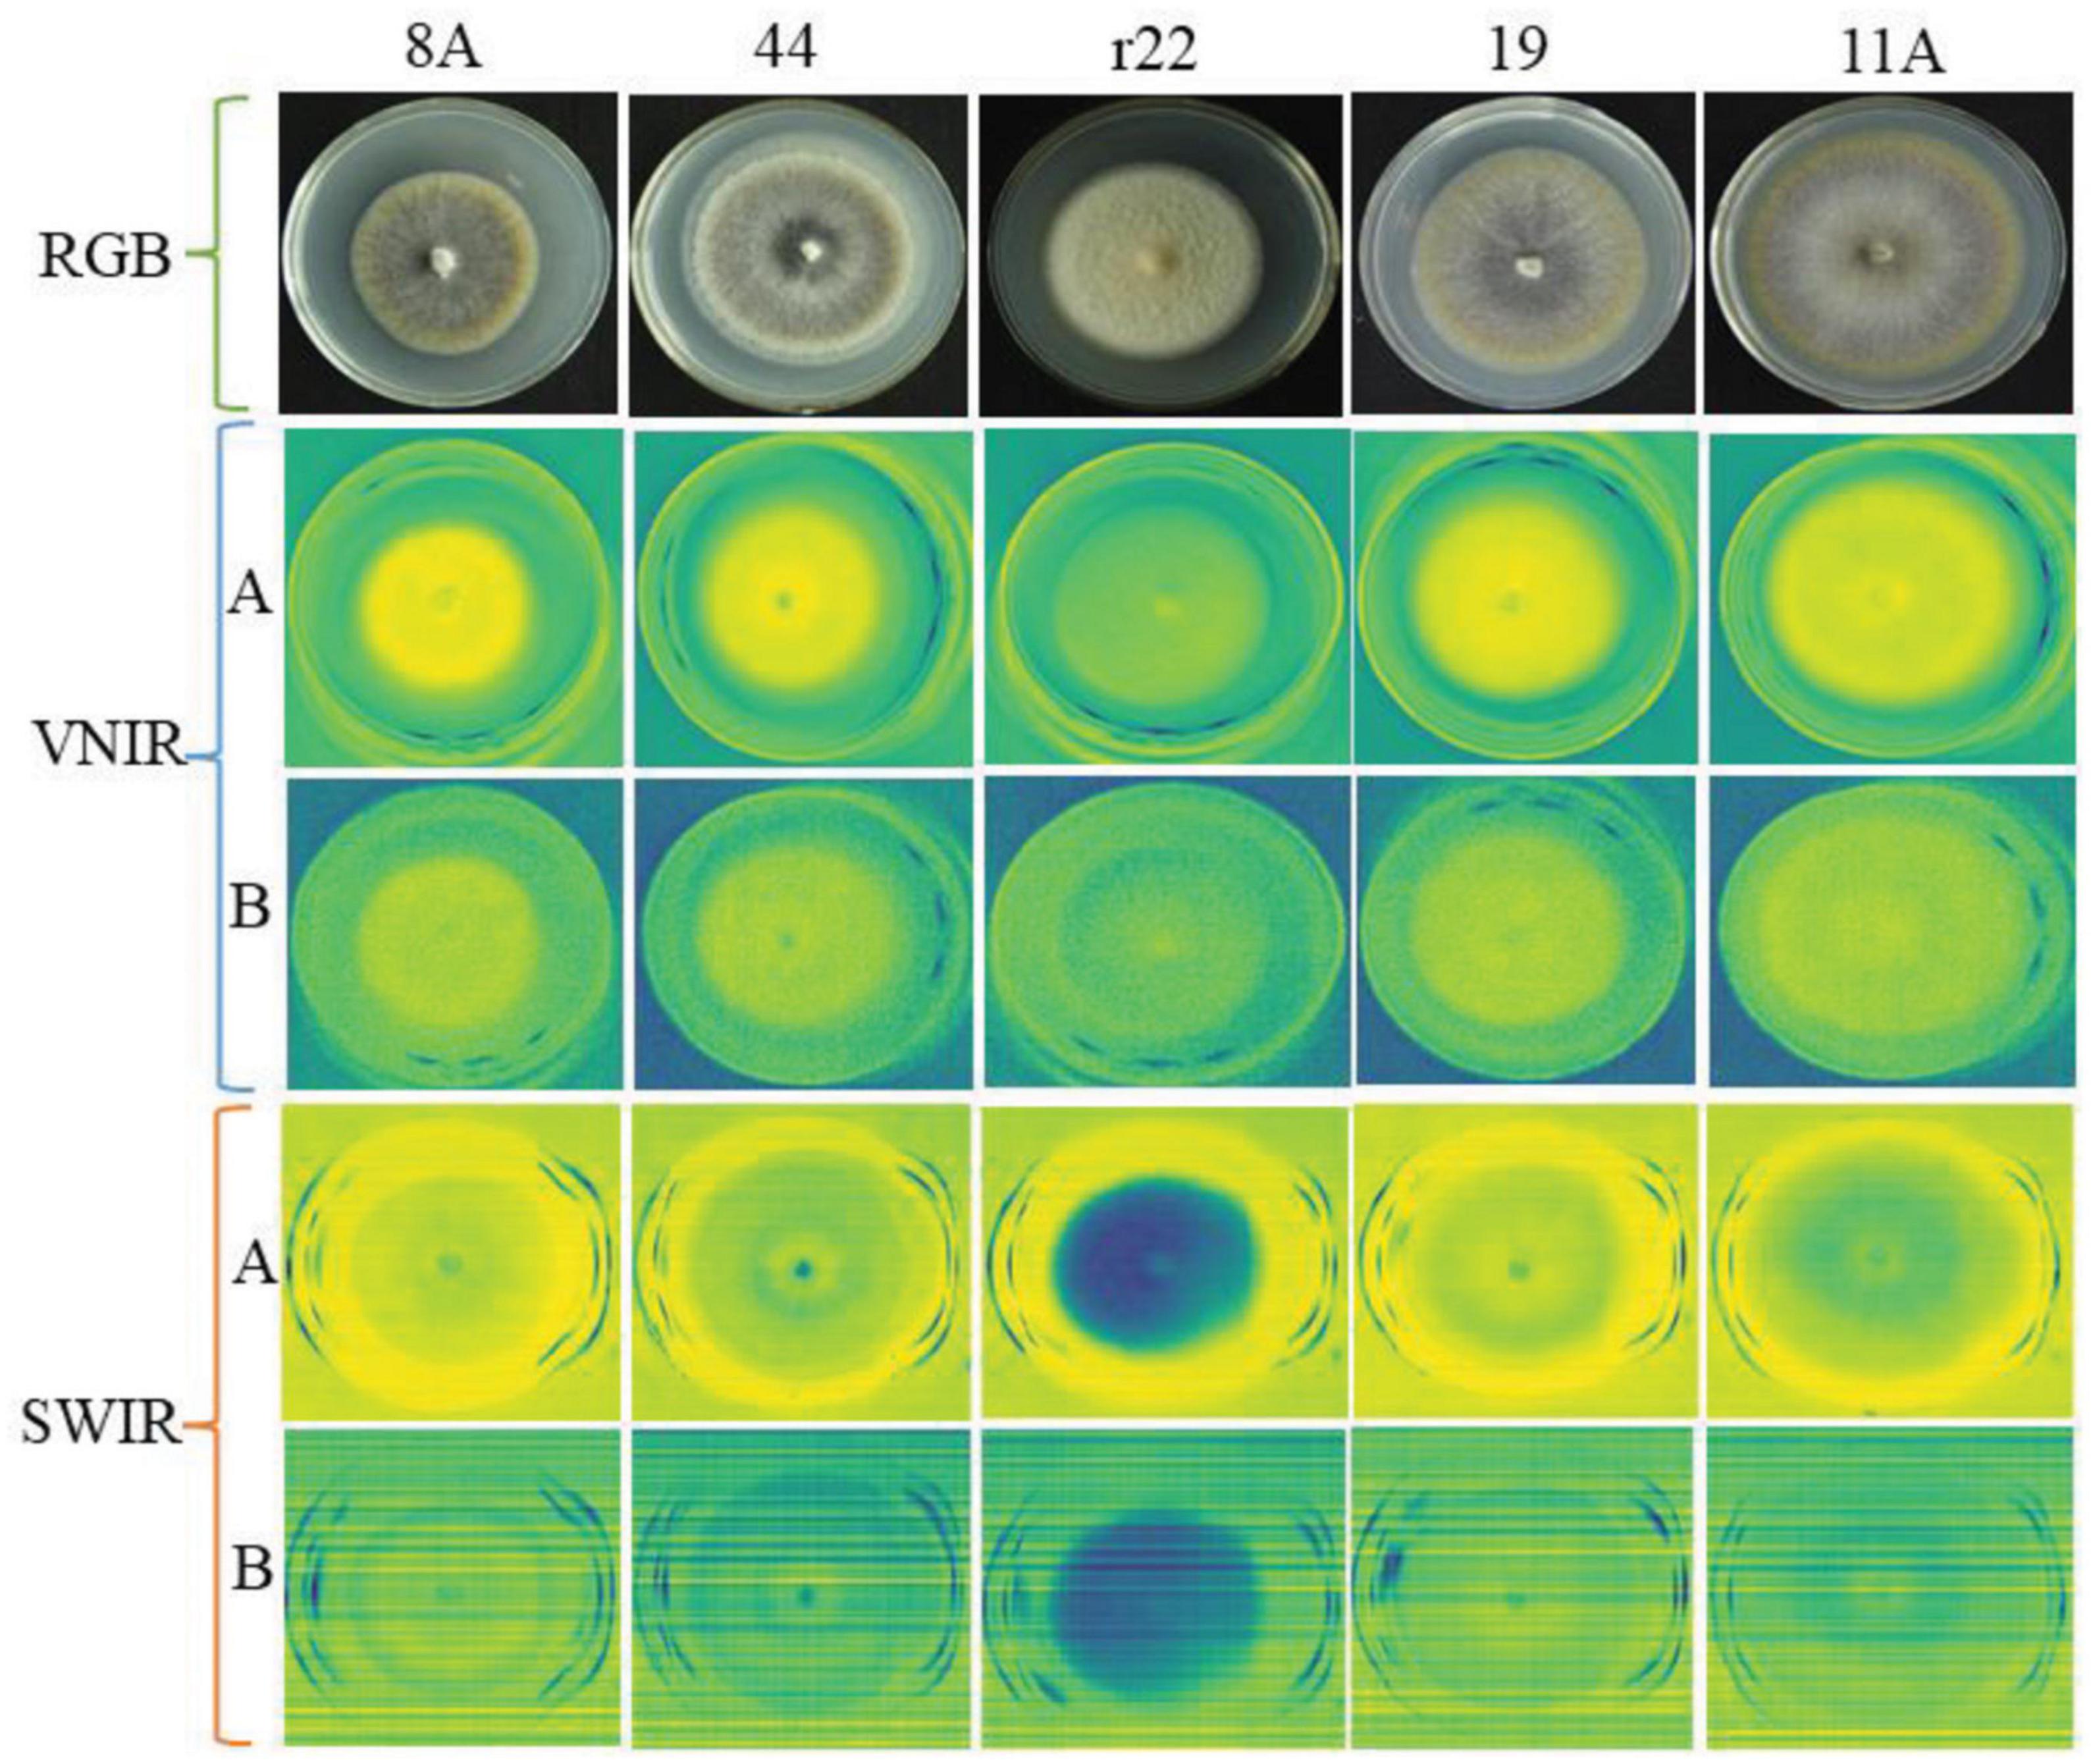
Figure 4. The RGB, VNIR, and SWIR images of five fungal colonies (named 8A, 44, r22, 19, 11A) in the same growth stage (day 10). For VNIR and SWIR images, (A) images using the optimal raw spectral band; (B) images using the bad raw spectral band.
In Figures 5, 6, the mean raw spectra of VNIR and SWIR at different pre-treatments (i.e., preprocessing) of five fungi were plotted. Regardless of the pre-treatments, the results show that the SWIR spectra are more discriminative for the five fungi compared to VNIR, with more discriminative peaks found in the SWIR band than in the VNIR spectra. In both the VNIR and SWIR spectra, there is a significant difference between the fungus named r22 and the others.
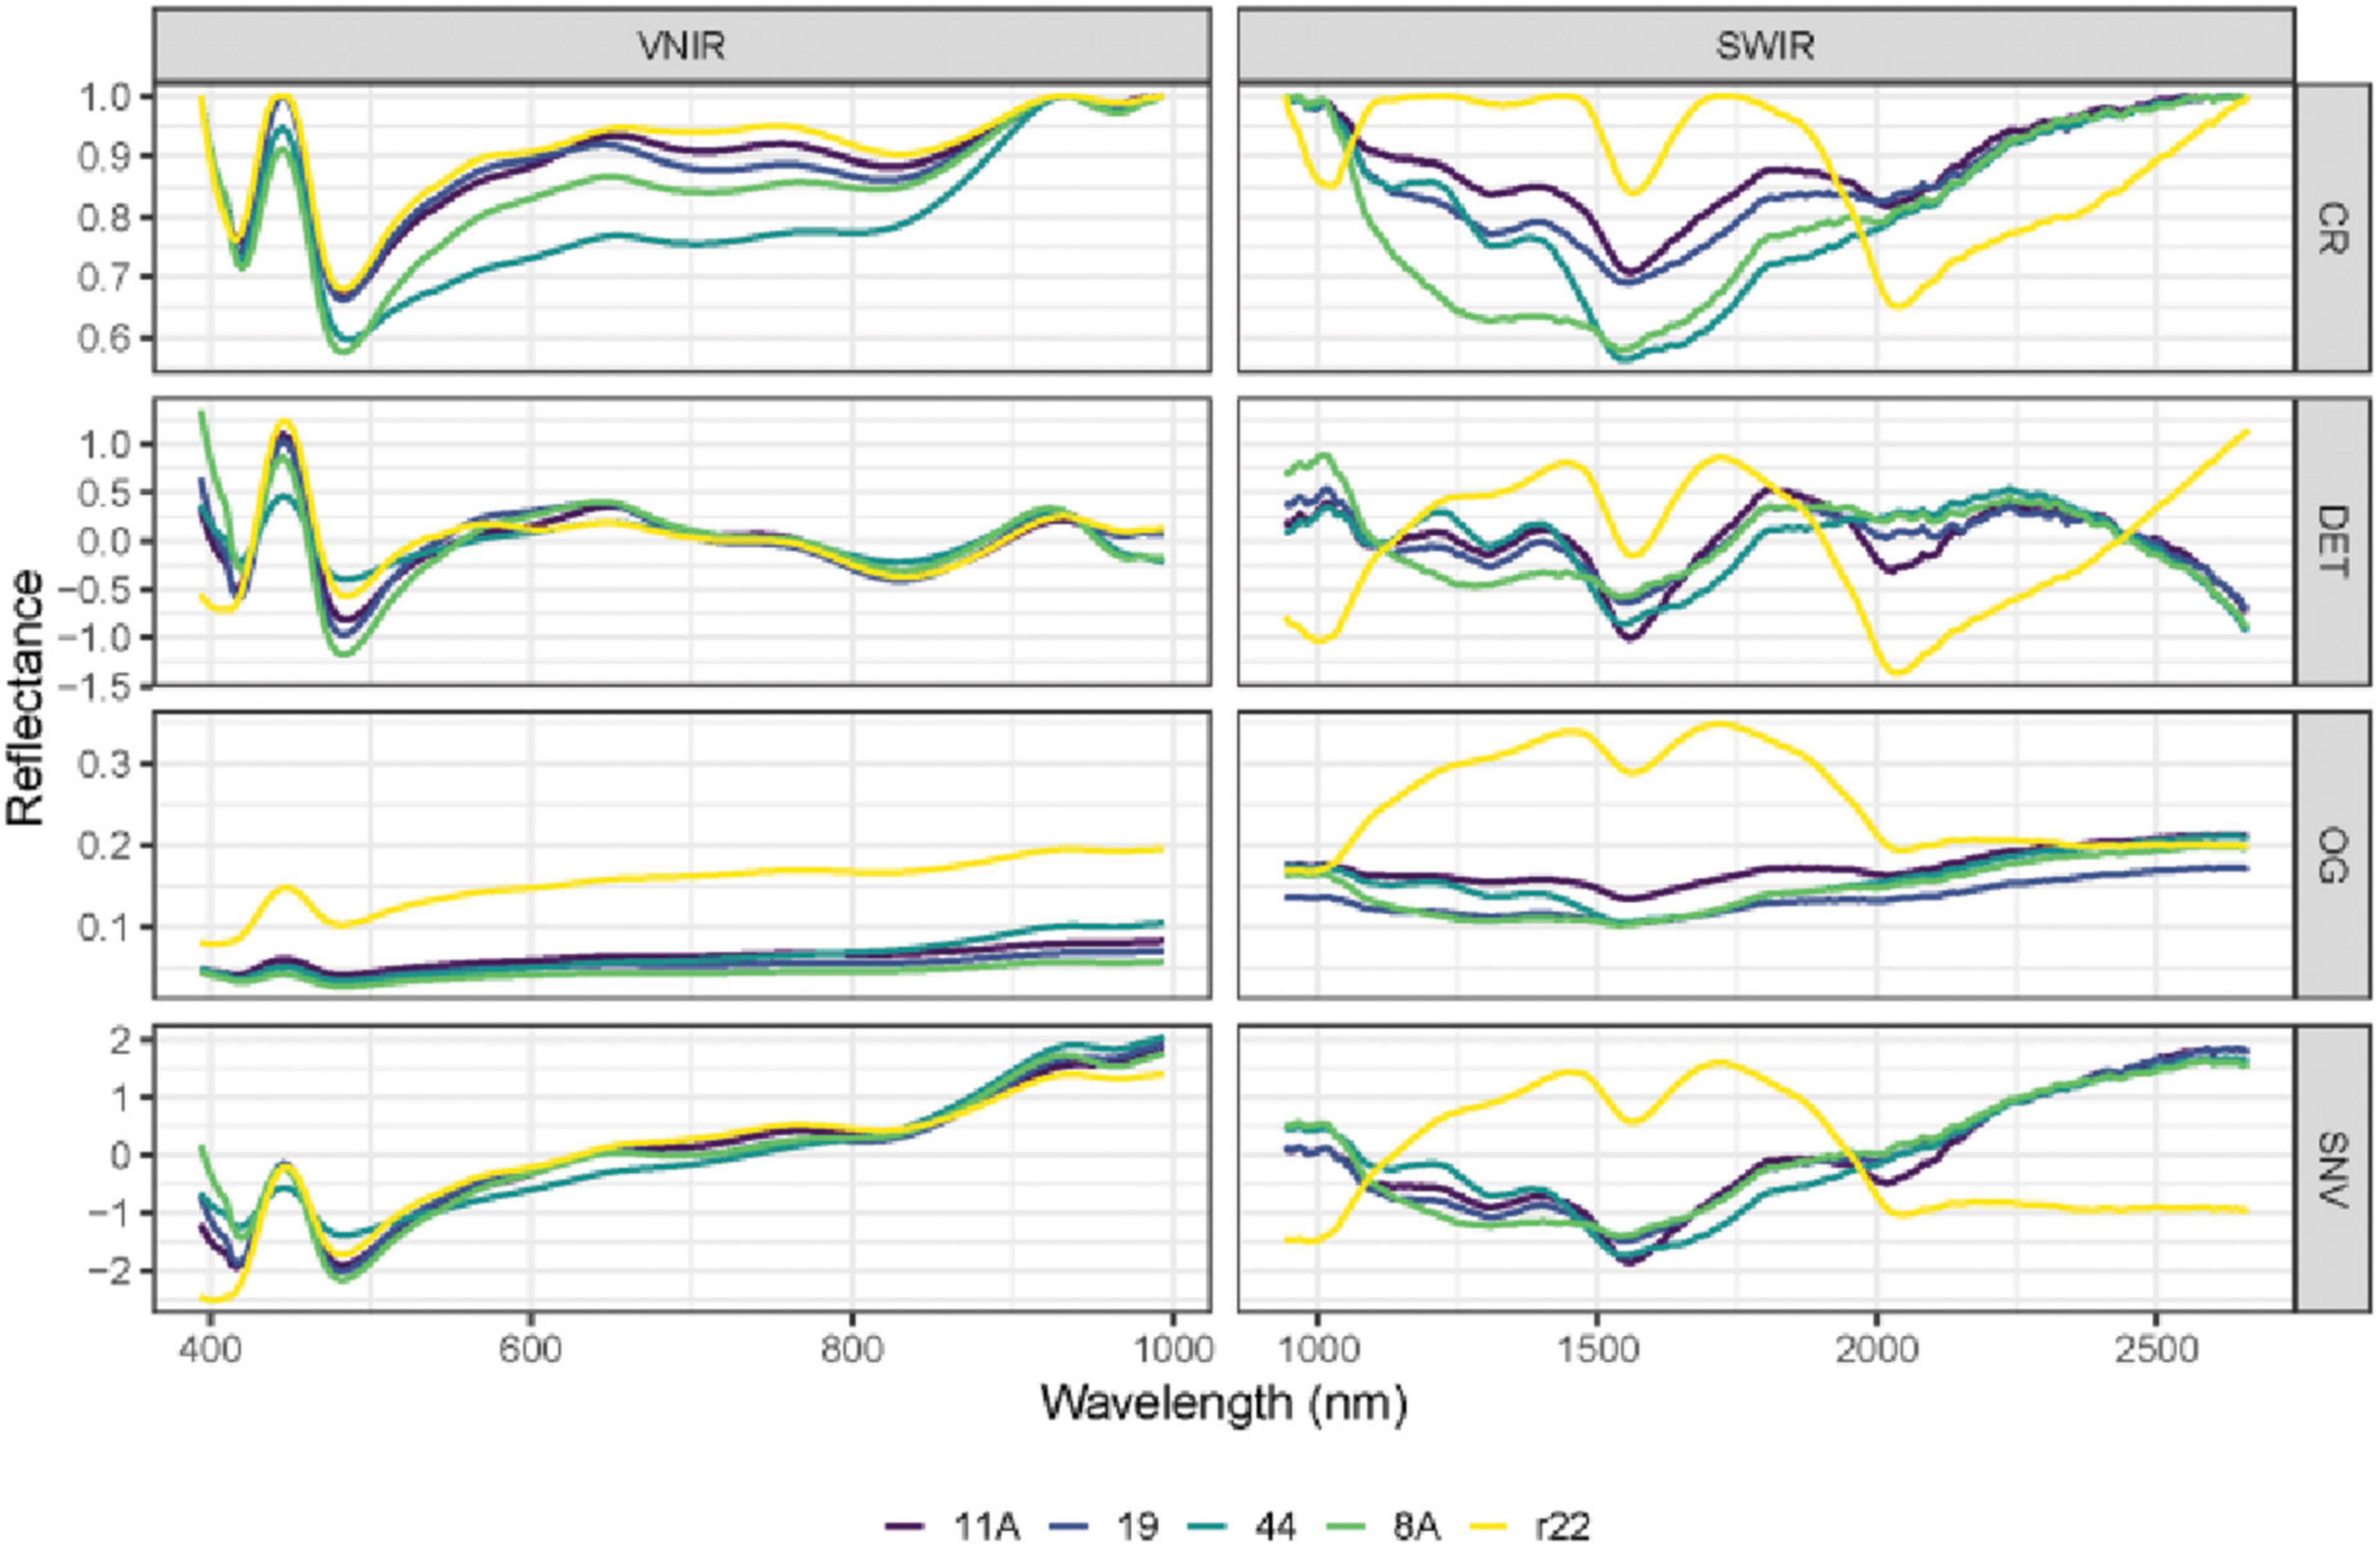
Figure 5. The mean raw (original) spectra of VNIR and SWIR, and various preprocessing techniques of the five fungi (8A, 44, r22, 19, 11A). OG: original spectra; CR: continuum removal spectra; DET: De-trending spectra; SNV: standard normal variate.
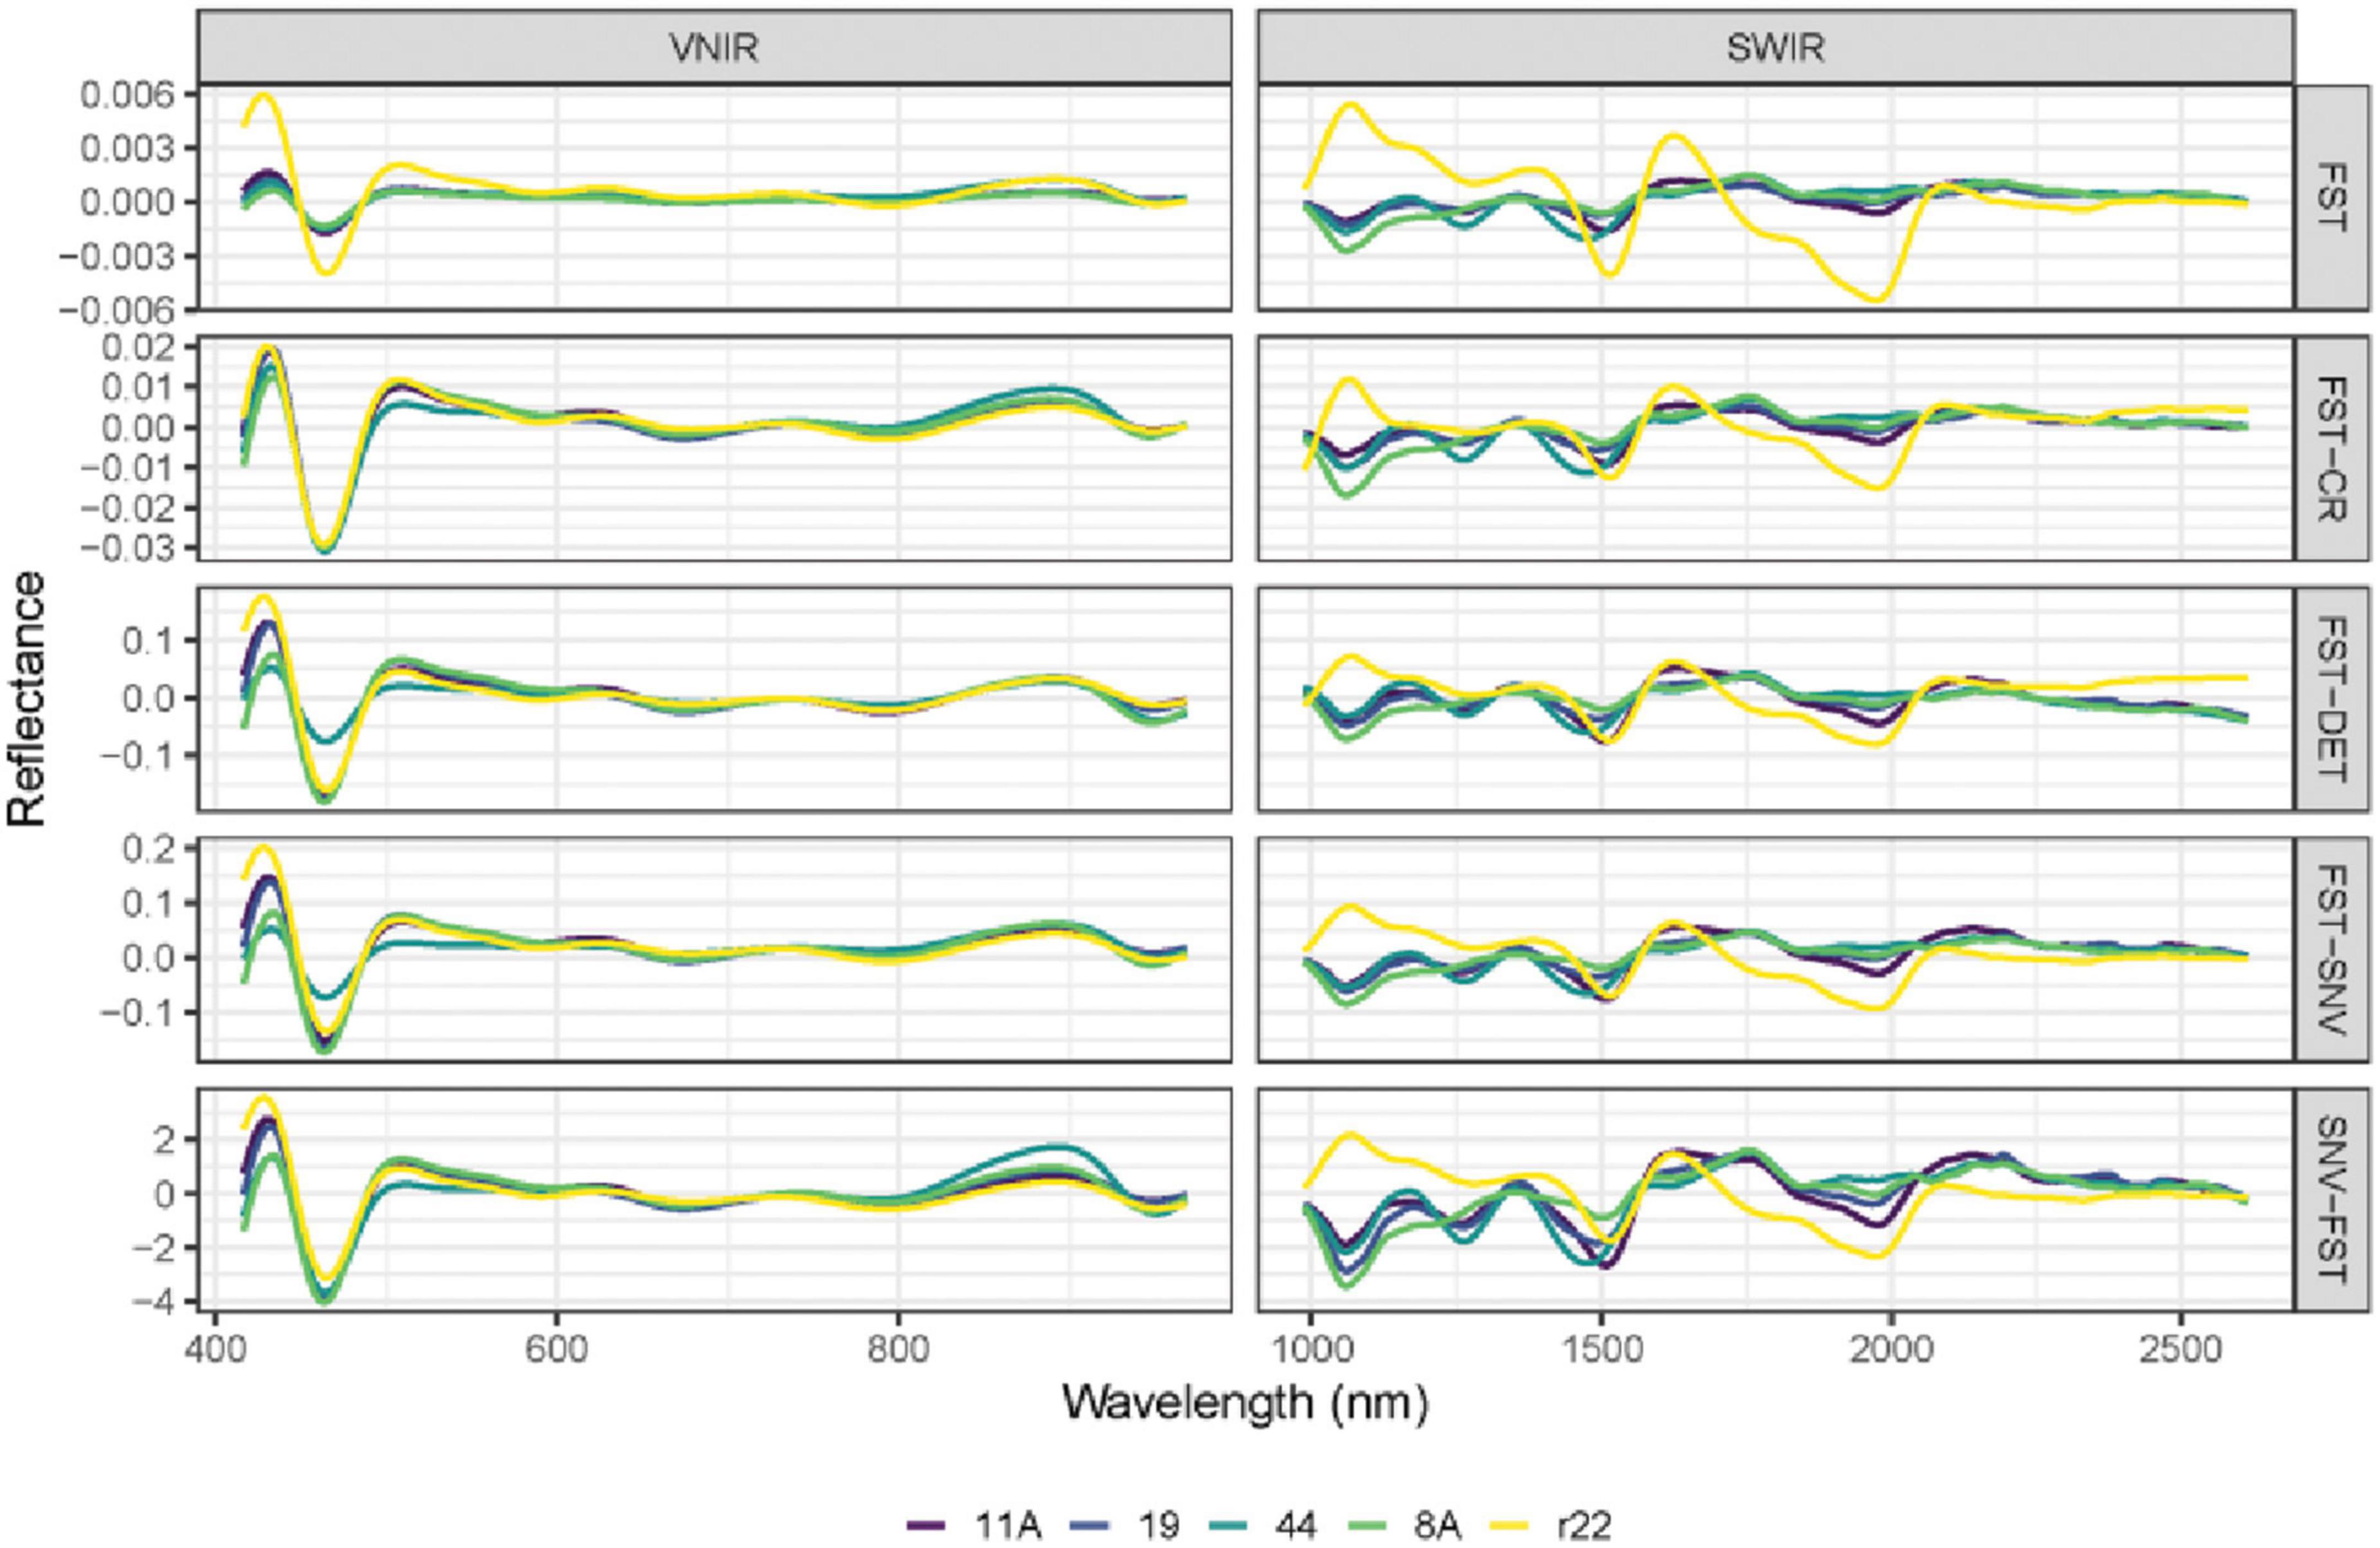
Figure 6. The mean spectra of VNIR and SWIR after combining different preprocessing techniques of the five fungi (8A, 44, r22, 19, 11A). FST: The first derivative; FST-CR: The first derivative combined with continuum removal spectra; FST-DET: The first derivative combined with De-trending spectra; FST-SNV: The first derivative combined with standard normal variate spectra; SNV-FST: SNV combined with the first derivative spectra.
The performance of different preprocessing methods varies for spectrum optimization. For instance, CR, DET, and SNV clearly distinguish the five fungi in the SWIR spectrum, while SNV gives slightly worse results for VNIR. Both the FST pre-treatment and additional pre-treatment have demonstrated impressive discrimination in SWIR spectra for the five fungi but are less evident in VNIR spectra.
Table 1 shows the classification results of the 2D-CNN model on the validation set, using VNIR and SWIR data that were pre-processed with different techniques. The performance of the 2D-CNN models varies depending on the spectral pre-processing method used. The best overall accuracy of 90% was achieved by the 2D-CNN model on VNIR data pre-processed with SNV + FST. On the other hand, using all pre-processing methods, including spectra smoothing (DET, CR, and SNV), led to the best performance for SWIR data, with an overall accuracy of 96%. The 2D-CNN models that used the raw spectra and various pre-processed spectra, such as FST, FST+CR, and FST+SNV, did not achieve satisfactory classification results for the five fungi. The overall accuracy was low, ranging from 14 to 62%.
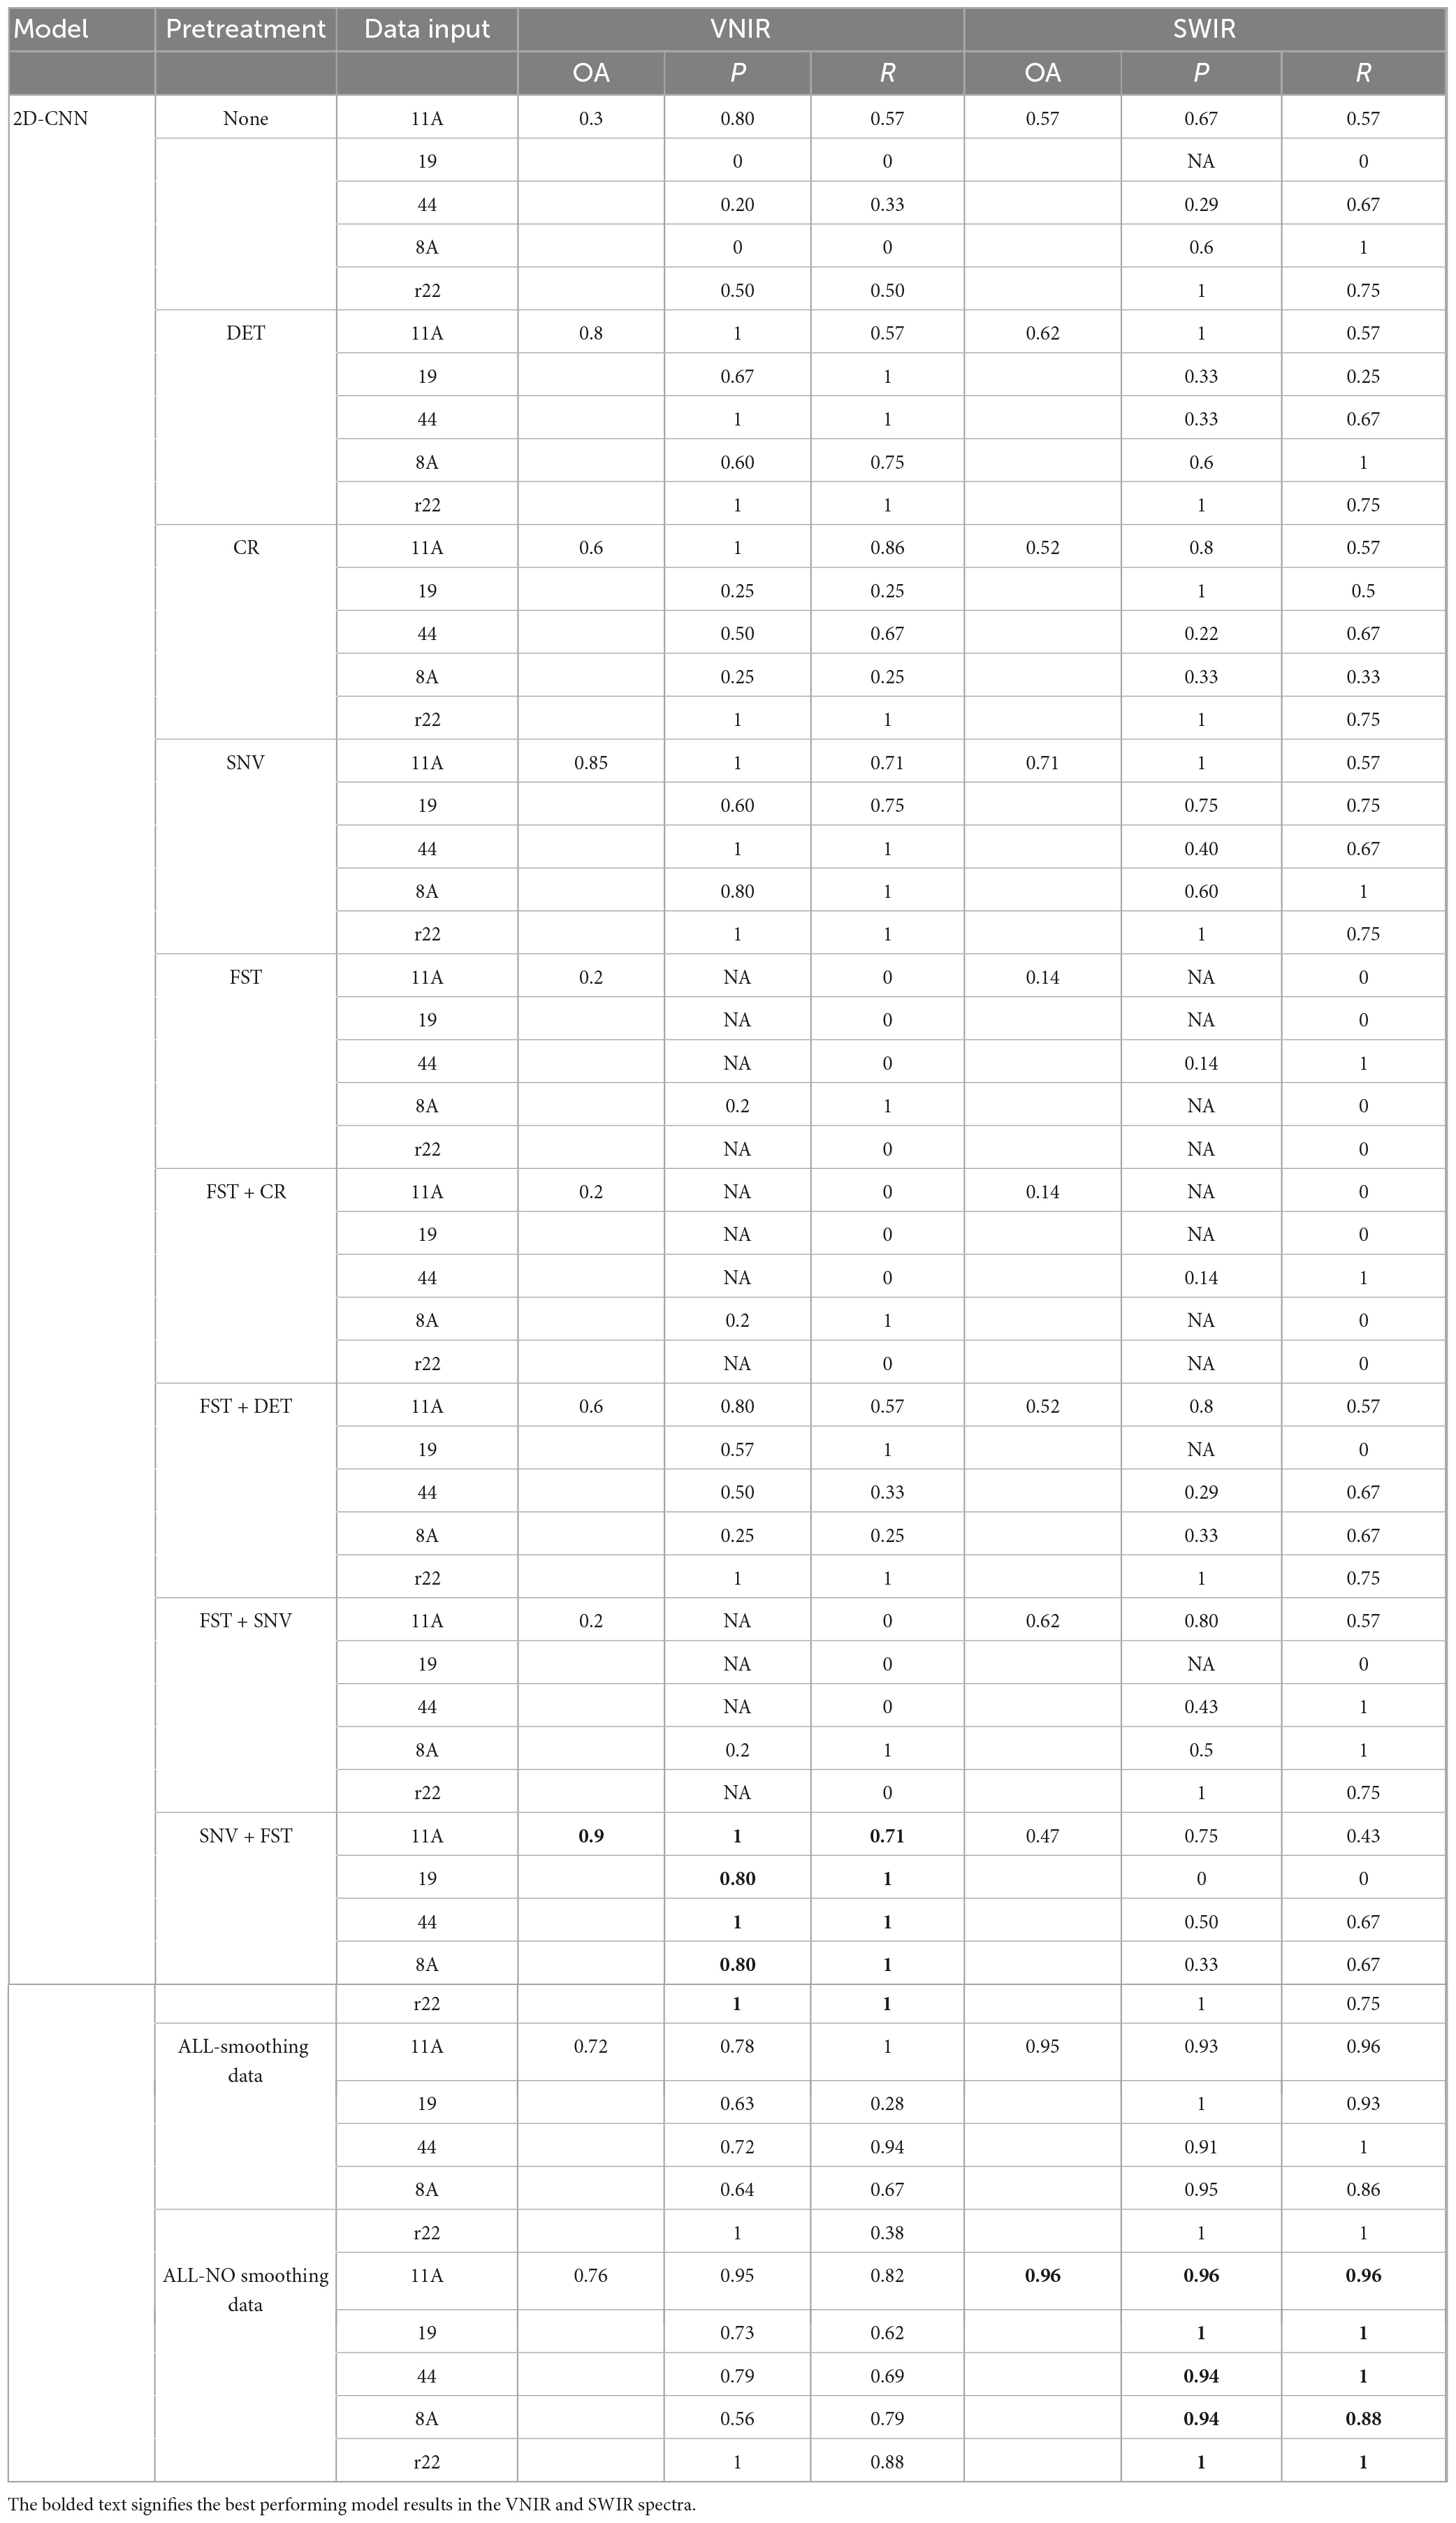
Table 1. Results of the 2D-CNN model on the validation set using different preprocessed VNIR and SWIR spectra.
The results of the 3D-CNN models, as shown in Table 2, shows comparable behavior to the 2D-CNN models on SWIR data, achieving an overall accuracy of 87% when all spectra preprocessing methods (including spectra smoothing) were applied. For VNIR data, DET and FST + SNV achieved the best performance, with an overall accuracy of 85% compared to the other of investigated preprocessing methods.
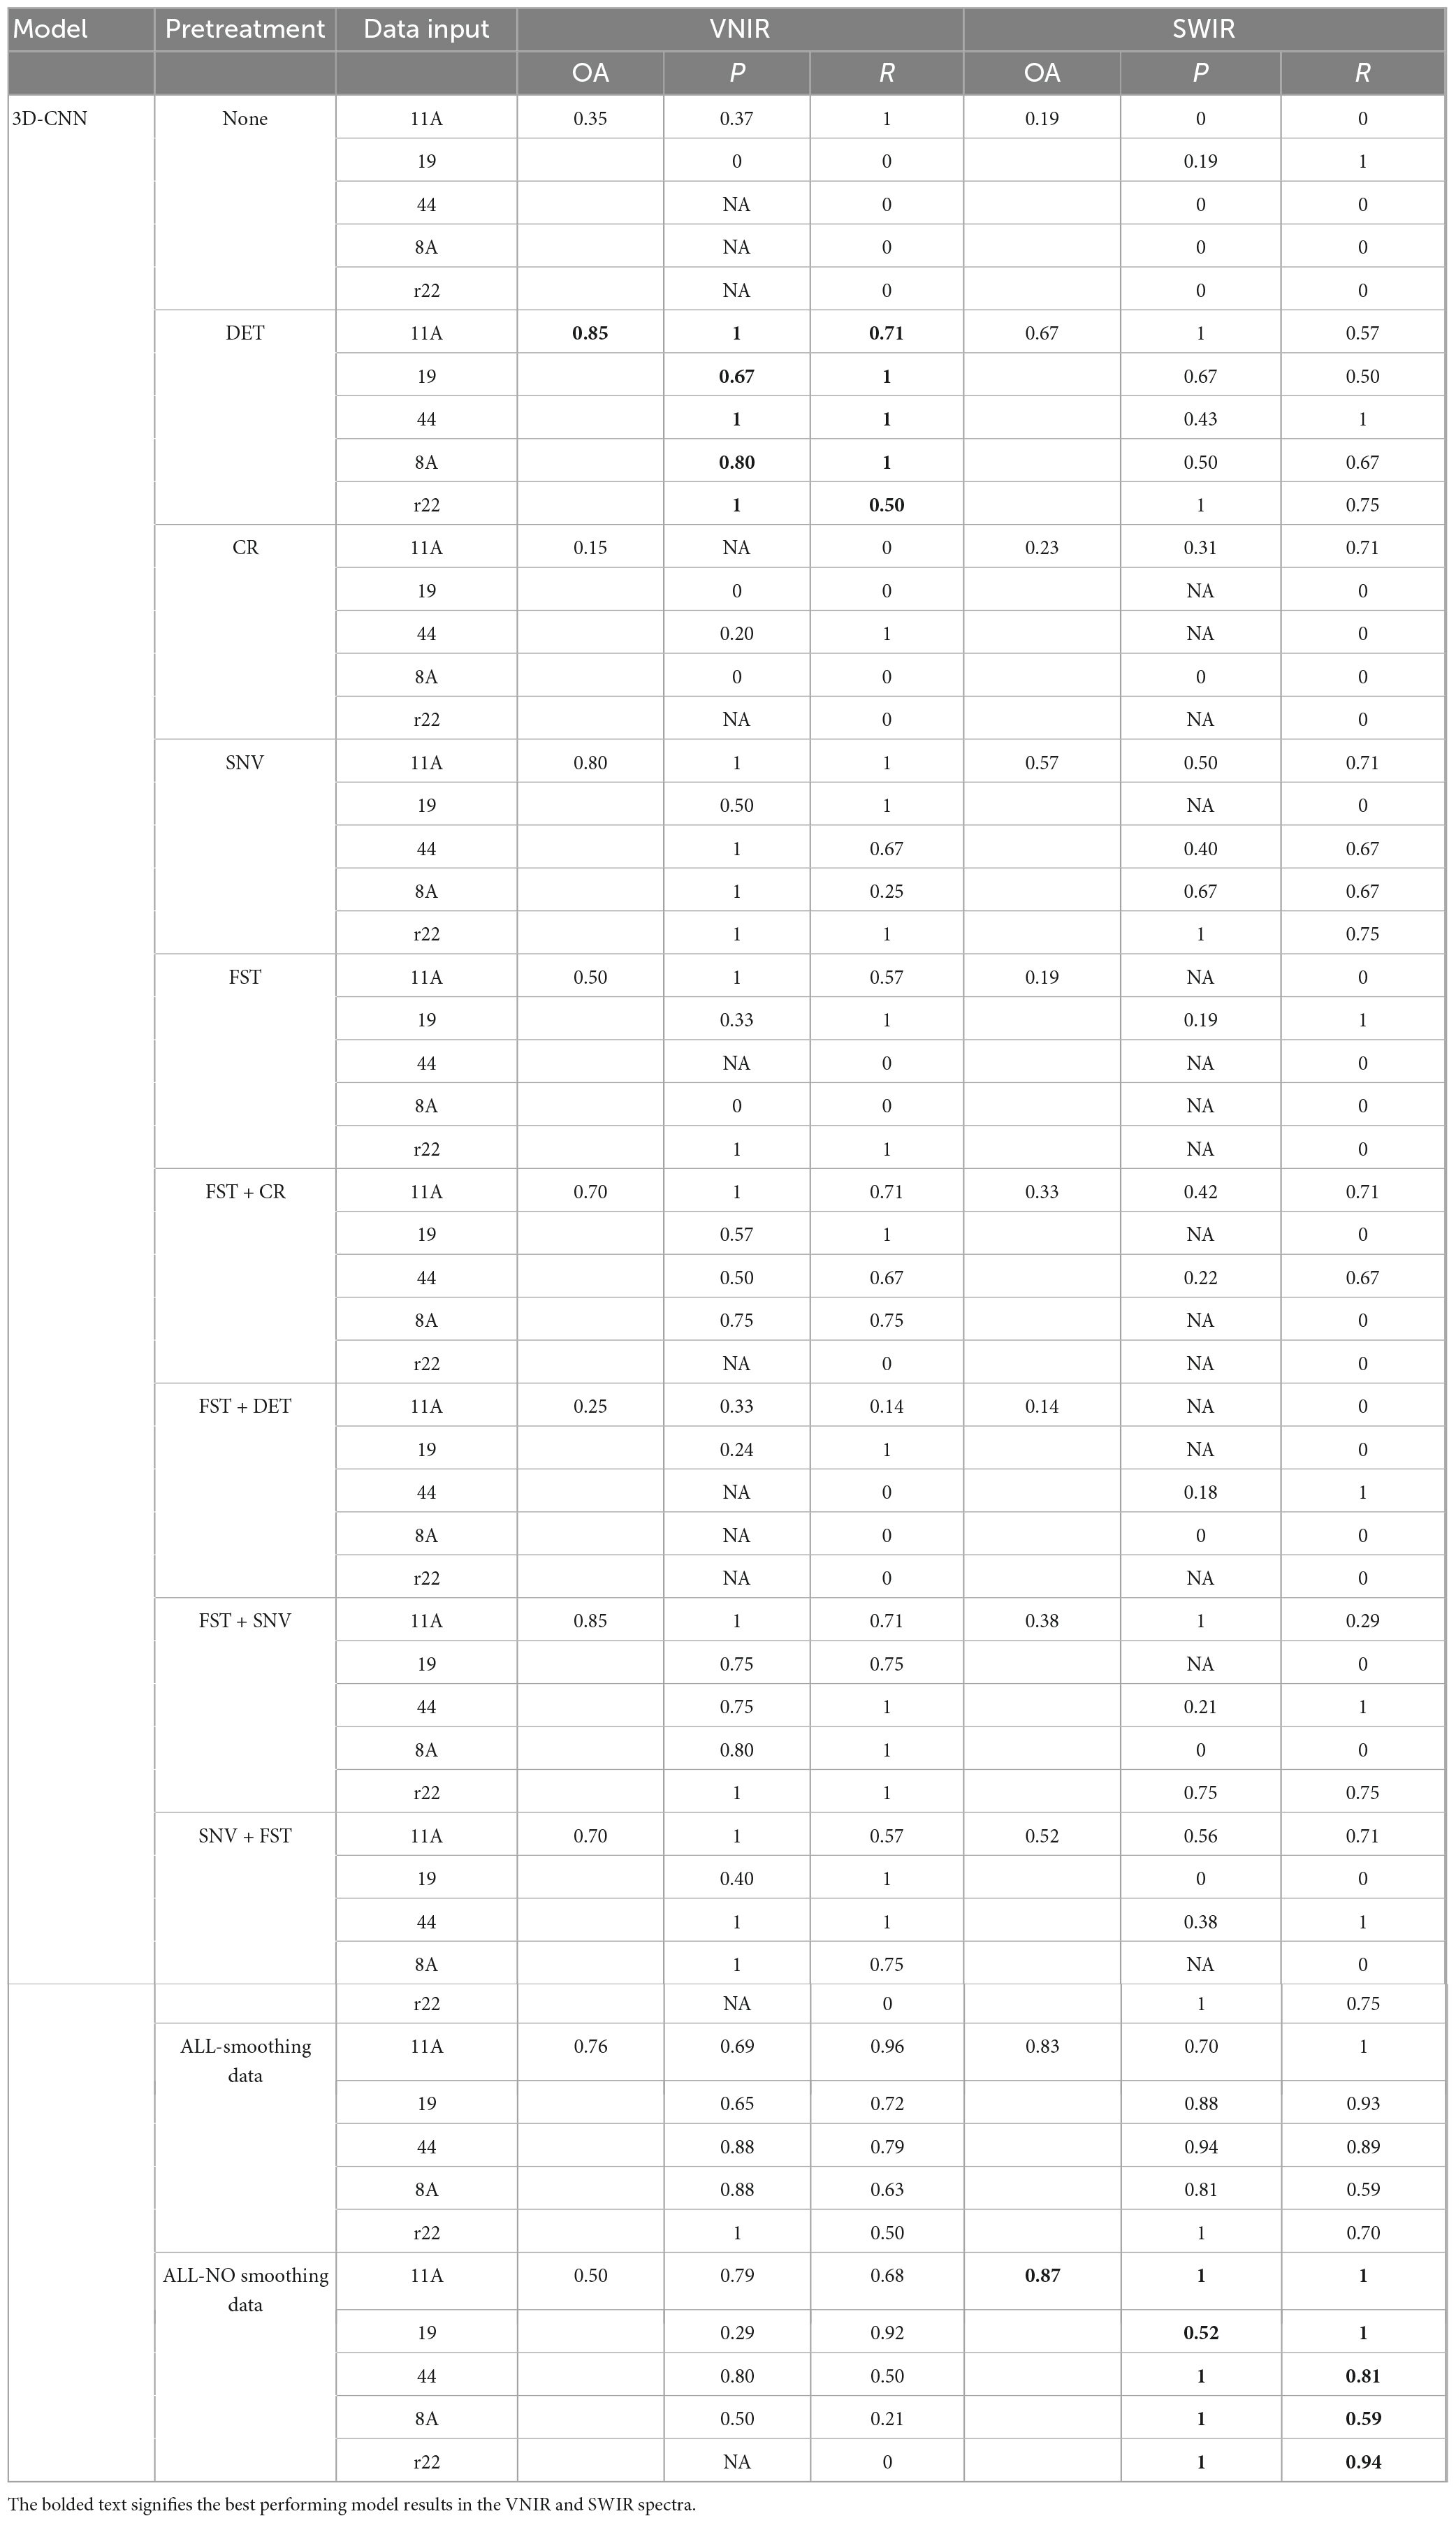
Table 2. Results of the 3D-CNN model on the validation set using different preprocessed VNIR and SWIR spectra.
The results presented in Table 3 demonstrate that the hybrid 2D-3D-CNN models outperformed both the 2D-CNN and 3D-CNN models. The most accurate classification for VNIR data, with an overall accuracy of 90%, was achieved using SNV + FST preprocessing. For SWIR data, the best results were obtained by applying all spectra preprocessing methods (without smoothing), resulting in a remarkable overall accuracy of 100%, outperforming other preprocessing methods.
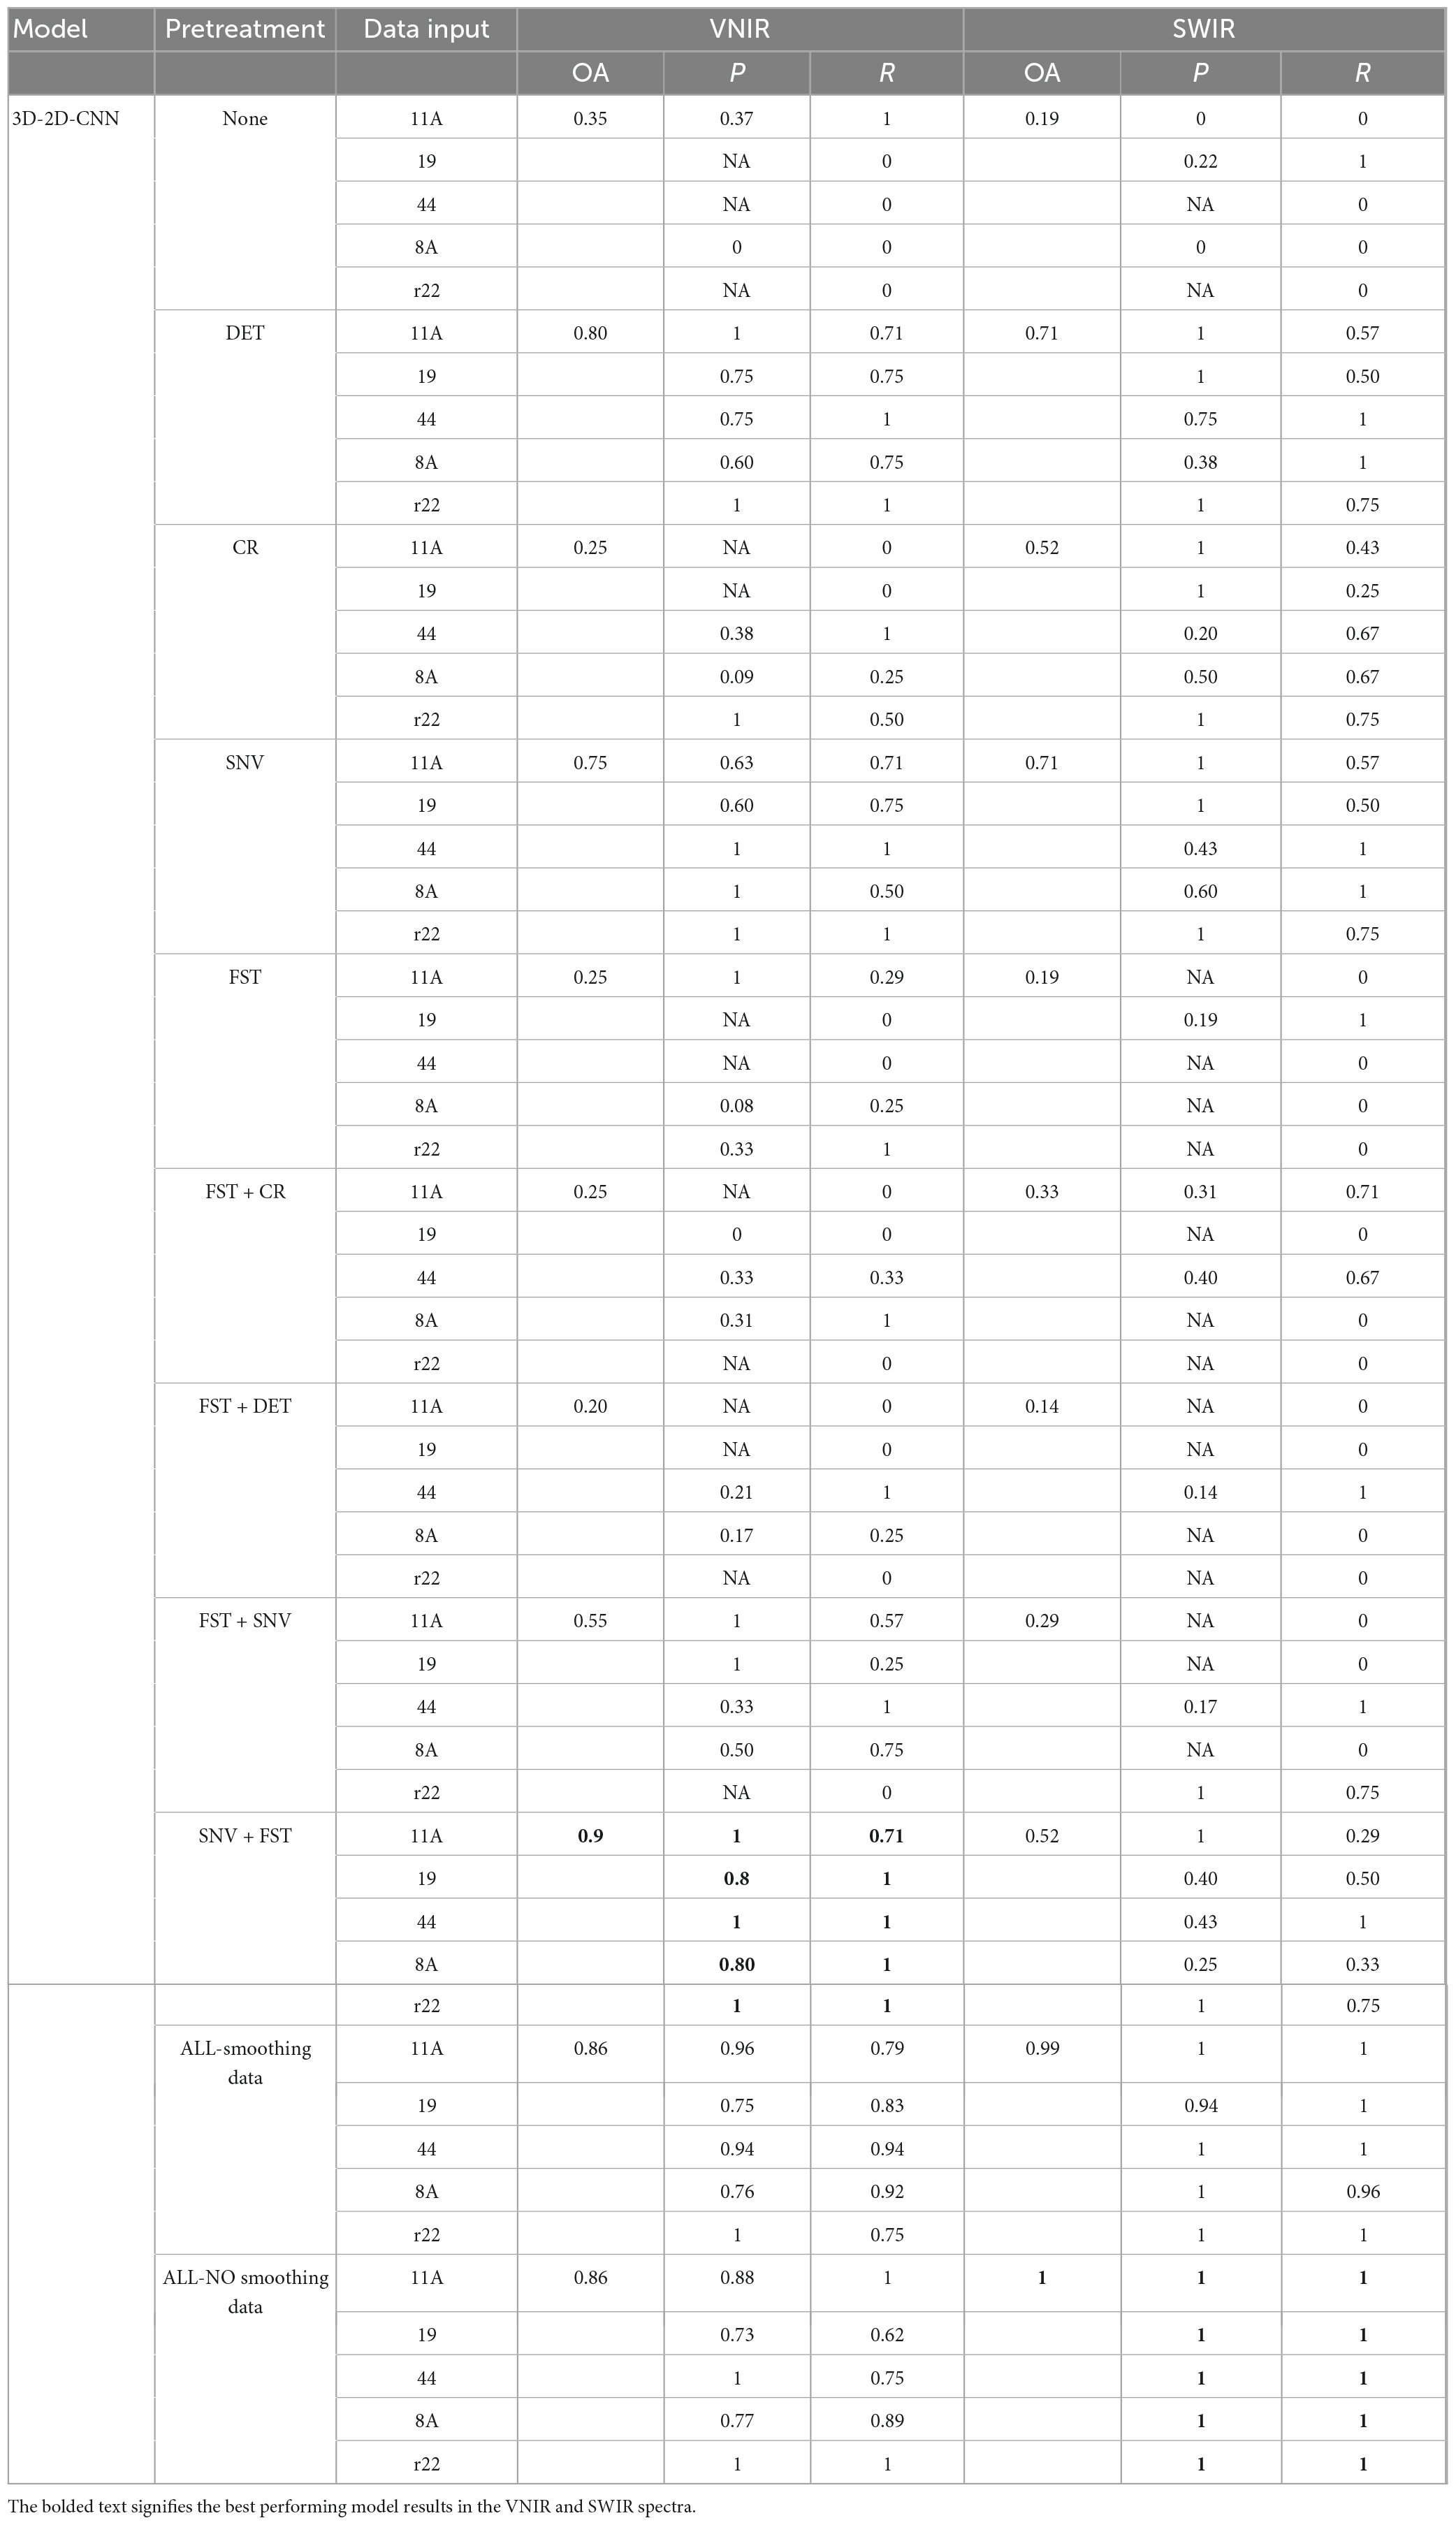
Table 3. Results of the hybrid 3D-2D-CNN model on the validation set using different preprocessed VNIR and SWIR spectra.
For the final evaluation, the selected best models were used to predict the classes of a new set of spectra (i.e., the validation dataset), which were not included in the training process. Figure 7 shows the confusion matrices for the CNN models using the best-preprocessed VNIR and SWIR spectra. Among all five fungi, the hybrid 3D-2D CNN model using the SWIR spectra achieved the best performance, with 100% classification accuracy, precision, and recall. The 3D CNN model performed relatively poorly on fungi 8A, with 10 out of 22 misclassified samples. Notably, r22 was the most easily classified fungus, with no misclassifications in any of the CNN models.
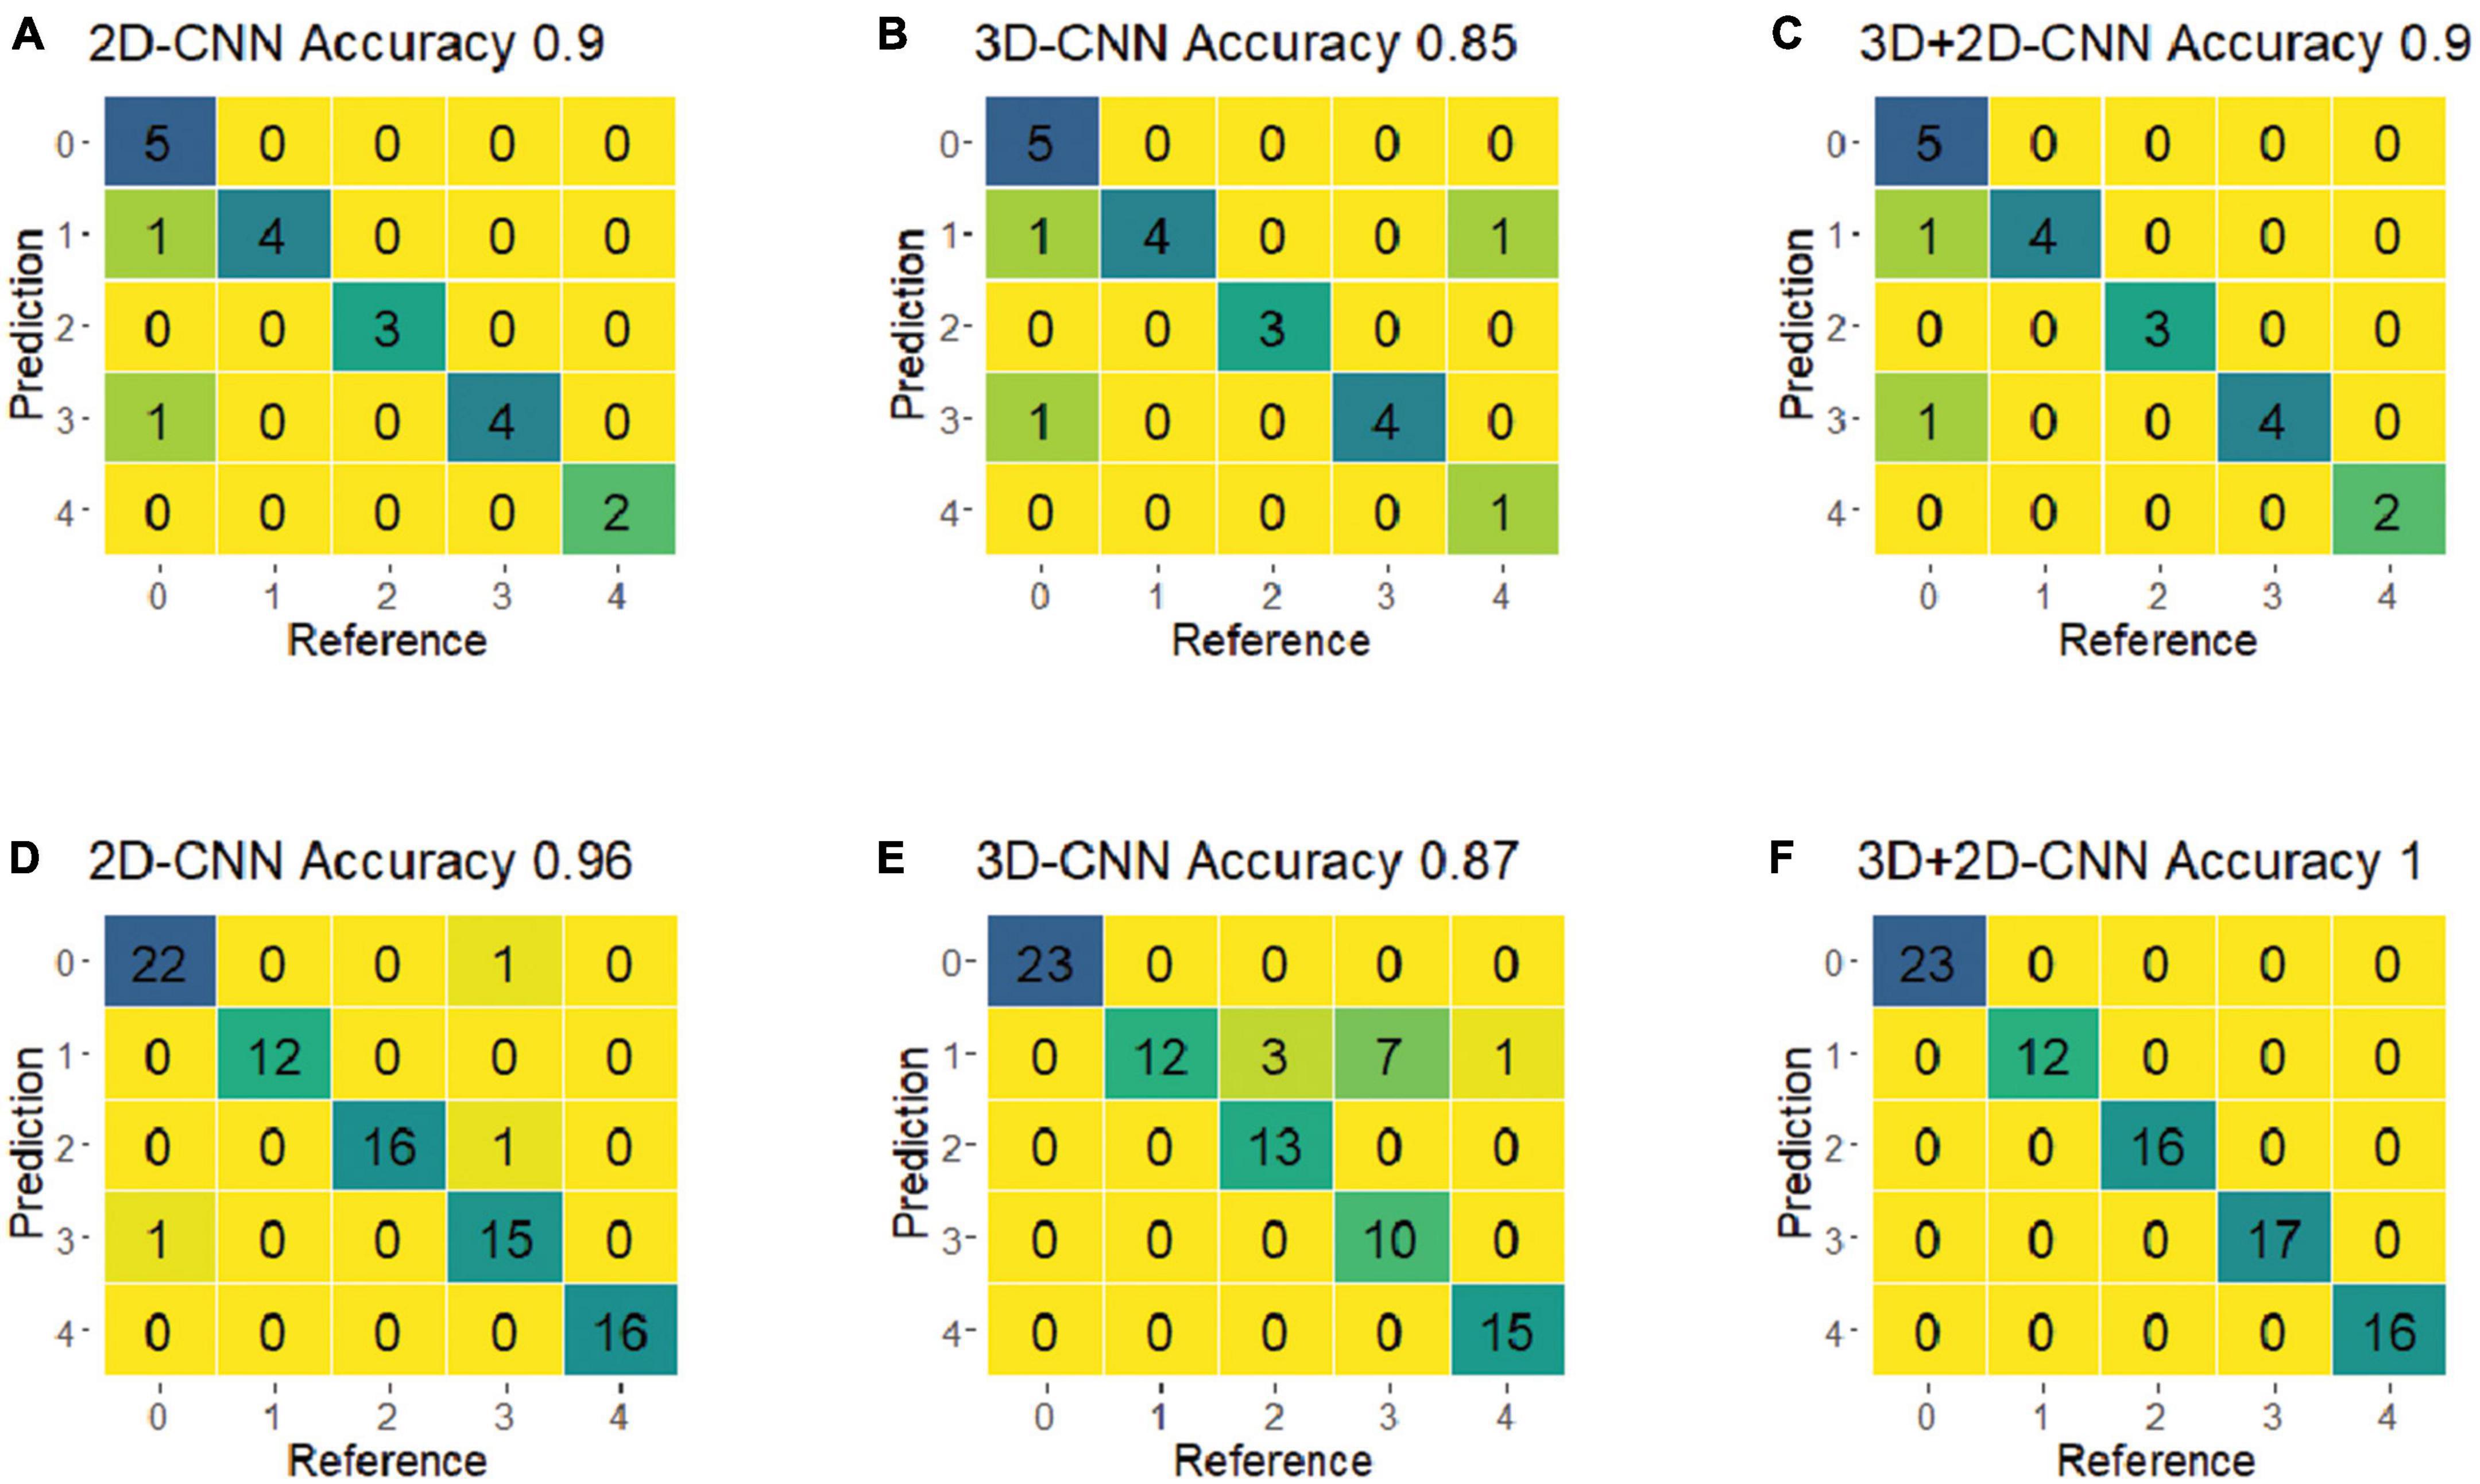
Figure 7. The confusion matrices of the optimal models of 2D-CNN, 3D-CNN, and hybrid 3D-2D-CNN on the validation set using the VNIR and SWIR spectra data. (A–C) Result from the VNIR data; (D–F) result from the SWIR data.
Symbiotic fungi play a crucial role in enhancing the growth and overall health of forest trees. These fungi form mutualistic associations with tree roots, enhancing nutrient uptake and providing protection against various biotic and abiotic stress factors. In this context, the application of Convolutional Neural Networks (CNN) and hyperspectral imaging for the rapid and accurate identification of fungal isolates is of paramount importance. By leveraging these advanced techniques, researchers and practitioners can effectively monitor and manage the complex interactions between symbiotic fungi and forest trees, ultimately contributing to improved forest health and productivity.
The combination of the hybrid CNN model and spectral preprocessing methods contributes to improving the ability of VNIR and SWIR hyperspectral images to classify the different fungi isolates. The current study evaluated the performance of two widely used deep learning techniques (2D-CNN and 3D-CNN) and their hybrid in classifying five fungi isolates grown on culture medium, utilizing various spectral preprocessing methods to enhance the quality of the hyperspectral images and improve the classification results.
The results show that the hybrid CNN model achieved the highest overall accuracy compared to other CNN methods. The model, which utilized SWIR hyperspectral images, was particularly effective in distinguishing between fungi isolates, offering a promising approach for fungi research. For all CNN models, single preprocessed spectra do not perform well compared to combining the preprocessed spectra on the classification of fungi. It has been suggested that sample size can significantly influence deep learning methods since a larger sample size provides more sample information for the CNN model to learn (Windrim et al., 2016).
To the best of our knowledge, no previous studies have utilized both VNIR and SWIR hyperspectral images and CNN models to classify fungi isolates on culture medium. However, Lu et al. (2020) used VNIR hyperspectral imaging and machine learning methods to classify five cereal fungi on culture medium, achieving an average classification accuracy of 99%, which is slightly higher than our hybrid model’s accuracy of 90% when using VNIR data.
In our study, the VNIR spectra yielded lower overall accuracy than the SWIR spectra. Similarly, Nguyen et al. (2021), reported the performance of 2D and 3D-CNN modeling for the detection of Grapevine vein-clearing virus (GVCV) in grapevine plants using VNIR spectra, which achieved accuracies of 71 and 75%, respectively. Similarly, Ru et al. (2019) reported that the entire bands of VNIR data showed lower accuracy than SWIR when using the SVM and partial least squares-discriminant analysis (PLS-DA) algorithms to classify the geographical origins of Rhizoma Atractylodis macrocephalaes, with classification accuracies of 85–87% and 92–94%, respectively.
Preprocessing methods can effectively remove spectral backgrounds, additive and multiplicative noises, and enhance the useful information related to the sample. This is critical for establishing a reliable model (Xiao et al., 2022). As observed in Tables 1–3, SNV+FST and no-smoothing (DET+CR+SNV) pre-treated spectra achieved the best performance in VNIR and SWIR, respectively. SNV increases cross-domain prediction performance and narrows spectral curve gaps (Li et al., 2021). DET and CR can reduce spectral noise and improve classification accuracy (Filippi and Jensen, 2007; Fanjul-Vélez et al., 2020). FST+SNV performs well in model calibration across different datasets and is effective in chlorophyll content prediction (Luo et al., 2017; Xiao et al., 2022). Our results based on the SNV+FST and DET+CR+SNV preprocessing in both VNIR and SWIR data are consistent with the above results of VNIR spectra based on SNV+FST preprocessing in this study.
The classification of fungi isolates was strongly influenced by the SWIR spectra, which covered a range from 1,100 to 2,500 nm. According to Schwanninger et al. (2011) narrow spectral absorption features at 1,370, 1,440, 1,666, and 2,272 nm are highly correlated with CH3 groups. Additionally, spectral features at 1,726, 1,811, and 2,080 nm have been shown to match the spectral features of C-H and C-O groups, which differ among fungi isolates with traits containing different C-H and C-O group contents.
This study presents a workflow for classifying fungi isolates from VNIR and SWIR hyperspectral imagery using various preprocessing methods. The study compares the performance of the 2D-CNN, 3D-CNN, and hybrid CNN models for fungi isolates classification. The results show that SWIR hyperspectral image data can be used for fungi classification with high accuracy. The hybrid 3D-2D-CNN model performs better than the 2D-CNN and 3D-CNN models, with promising classification accuracy. Developing these kinds of fungi classification models is essential for operationalizing big hyperspectral data in fungi diversity and ecosystem monitoring. This can lead to the development of powerful, non-invasive, and chemical-free tools for fungi isolates classification.
The original contributions presented in this study are included in the article/supplementary material, further inquiries can be directed to the corresponding authors.
ZL conducted the experiment and wrote the manuscript. YL, MA-S, and ZY designed the study and performed revisions of the manuscript. All authors read and approved the final manuscript.
This work was financially supported by the Fundamental Research Funds for the Central Non-profit Research of the Chinese Academy of Forestry (CAFYBB2020ZY002-1) and the Fundamental Research Funds of Chinese Academy of Forestry (CAFYBB2022QA001).
The authors declare that the research was conducted in the absence of any commercial or financial relationships that could be construed as a potential conflict of interest.
All claims expressed in this article are solely those of the authors and do not necessarily represent those of their affiliated organizations, or those of the publisher, the editors and the reviewers. Any product that may be evaluated in this article, or claim that may be made by its manufacturer, is not guaranteed or endorsed by the publisher.
Alchanatis, V., Schmilovitch, Z., and Meron, M. J. P. A. (2005). In-field assessment of single leaf nitrogen status by spectral reflectance measurements. Precis. Agric. 6, 25–39. doi: 10.1007/s11119-005-0682-7
Allaire, J. J., and Chollet, F. (2022). keras: R Interface to ‘Keras’, R package version 2.9.0.9000. Boston, MA: RStudio.
Al-Sarayreh, M., Reis, M. M., Yan, W. Q., and Klette, R. (2018). “Detection of adulteration in red meat species using hyperspectral imaging,” in Proceedings of the Image and Video Technology: 8th Pacific-Rim Symposium PSIVT 2017, Wuhan. doi: 10.1007/978-3-319-75786-5_16
Audebert, N., Le Saux, B., and Lefèvre, S. (2019). Deep learning for classification of hyperspectral data: A comparative review. IEEE Geosci. Remote Sens Magaz. 7, 159–173. doi: 10.1109/MGRS.2019.2912563
Barnes, R., Dhanoa, M. S., and Lister, S. J. (1989). Standard normal variate transformation and de-trending of near-infrared diffuse reflectance spectra. Appl. Spectroscopy 43, 772–777. doi: 10.1366/0003702894202201
Billones, R. K. C., Calilung, E. J., Dadios, E. P., and Santiago, N. (2020). “Aspergillus Species Fungi Identification Using Microscopic Scale Images,” in Proceedings of the 2020 IEEE 12th International Conference on Humanoid, Nanotechnology, Information Technology, Communication and Control, Environment, and Management (HNICEM), Piscataway, NJ. doi: 10.1109/HNICEM51456.2020.9400039
Bioucas-Dias, J. M., Plaza, A., Camps-Valls, G., Scheunders, P., Nasrabadi, N., and Chanussot, J. (2013). Hyperspectral remote sensing data analysis and future challenges. IEEE Geosci Remote Sens. Magaz. 1, 6–36. doi: 10.1109/MGRS.2013.2244672
Cameron, D. G., and Moffatt, D. J. (1987). A generalized approach to derivative spectroscopy. Appl. Spectroscopy 41, 539–544. doi: 10.1366/0003702874448445
Chu, X., Wang, W., Ni, X., Li, C., and Li, Y. (2020). Classifying maize kernels naturally infected by fungi using near-infrared hyperspectral imaging. Infrar. Phys. Technol. 105:103242. doi: 10.1016/j.infrared.2020.103242
Clark, R. N., and Roush, T. L. (1984). Reflectance spectroscopy: Quantitative analysis techniques for remote sensing applications. J. Geophys. Res. 89, 6329–6340. doi: 10.1029/JB089iB07p06329
Fanjul-Vélez, F., Pampín-Suárez, S., and Arce-Diego, J. L. (2020). Application of classification algorithms to diffuse reflectance spectroscopy measurements for ex vivo characterization of biological tissues. Entropy 22:736. doi: 10.3390/e22070736
Femenias, A., Gatius, F., Ramos, A., Teixido-Orries, I., and Marín, S. (2022). Hyperspectral imaging for the classification of individual cereal kernels according to fungal and mycotoxins contamination: A review. Food Res. Int. 155:111102. doi: 10.1016/j.foodres.2022.111102
Filippi, A. M., and Jensen, J. R. (2007). Effect of continuum removal on hyperspectral coastal vegetation classification using a fuzzy learning vector quantizer. IEEE Trans. Geosci. Remote Sens. 45, 1857–1869. doi: 10.1109/TGRS.2007.894929
Gaikwad, S. S. (2021). Fungi classification using convolution neural network. Turk. J. Comput. Math. Educ. 12, 4563–4569.
Geladi, P., Burger, J., and Lestander, T. (2004). Hyperspectral imaging: calibration problems and solutions. Chemometr. Intell. Lab. Syst. 72, 209–217. doi: 10.1016/j.chemolab.2004.01.023
Ghamisi, P., Plaza, J., Chen, Y., Li, J., and Plaza, A. (2017). Advanced spectral classifiers for hyperspectral images: A review. IEEE Geosci. Remote Sens. Magaz. 5, 8–32. doi: 10.1109/MGRS.2016.2616418
Goetz, A. F., Vane, G., Solomon, J., and Rock, B. (1985). Imaging spectrometry for earth remote sensing. Science 228, 1147–1153. doi: 10.1126/science.228.4704.1147
Gostinčar, C., Grube, M., de Hoog, S., Zalar, P., and Gunde-Cimerman, N. (2009). Extremotolerance in fungi: evolution on the edge. FEMS Microbiol. Ecol. 71, 2–11. doi: 10.1111/j.1574-6941.2009.00794.x
Hagh-Doust, N., Färkkilä, S. M. A., Hosseyni Moghaddam, M. S., and Tedersoo, L. (2022). Symbiotic fungi as biotechnological tools: methodological challenges and relative benefits in agriculture and forestry. Fungal Biol. Revi. 42, 34–55. doi: 10.1016/j.fbr.2022.06.001
He, X., and Yuan, Z. (2021). Near-chromosome-level genome assembly of the dark septate endophyte Laburnicola rhizohalophila: a model for investigating root-fungus symbiosis. Genome Biol. Evol. 13:evab026. doi: 10.1093/gbe/evab026
Hedjazi, M. A., Kourbane, I., and Genc, Y. (2017). “On identifying leaves: A comparison of CNN with classical ML methods,” in Proceedings of the 2017 25th Signal Processing and Communications Applications Conference (SIU), Piscataway, NJ. doi: 10.1109/SIU.2017.7960257
Hijmans, R. J., van Etten, J., Cheng, J., Mattiuzzi, M., and Sumner, M. (2015). Package ‘raster’. R package. Vienna: R Core Team.
Ioffe, S., and Szegedy, C. (2015). “Batch normalization: Accelerating deep network training by reducing internal covariate shift,” in Proceedings of the International conference on machine learning, Singapore.
Jin, X., Jie, L., Wang, S., Qi, H. J., and Li, S. W. (2018). Classifying wheat hyperspectral pixels of healthy heads and Fusarium head blight disease using a deep neural network in the wild field. Remote Sens. 10:395. doi: 10.3390/rs10030395
Kirti, K., Rajpal, N., and Yadav, J. (2021). “Black Measles Disease Identification in Grape Plant (Vitis vinifera) Using Deep Learning,” in Proceedings of the 2021 International Conference on Computing, Communication, and Intelligent Systems, Piscataway, NJ. doi: 10.1109/ICCCIS51004.2021.9397205
Knapp, D. G., Kovács, G., Zajta, E., Groenewald, J., and Crous, P. (2015). Dark septate endophytic pleosporalean genera from semiarid areas. Persoonia-Mol. Phylogeny Evol. Fungi 35, 87–100. doi: 10.3767/003158515X687669
Knapp, D. G., Németh, J., Barry, K., Hainaut, M., Henrissat, B., Johnson, J., et al. (2018). Comparative genomics provides insights into the lifestyle and reveals functional heterogeneity of dark septate endophytic fungi. Sci. Rep. 8:6321. doi: 10.1038/s41598-018-24686-4
Kumar, P., Ashtekar, S., Jayakrishna, S., Bharath, K., Vanathi, P., and Kumar, M. (2021). “Classification of mango leaves infected by fungal disease anthracnose using deep learning,” in Proceedings of the 2021 5th International Conference on Computing Methodologies and Communication (ICCMC), Piscataway, NJ. doi: 10.1109/ICCMC51019.2021.9418383
LeCun, Y., Boser, B., Denker, J., Henderson, D., Howard, R., Hubbard, W., et al. (1989). Backpropagation applied to handwritten zip code recognition. Neural Comput. 1, 541–551. doi: 10.1162/neco.1989.1.4.541
Li, X., Li, Z., Yang, X., and He, Y. (2021). Boosting the generalization ability of Vis-NIR-spectroscopy-based regression models through dimension reduction and transfer learning. Comput. Electron. Agric. 186:106157. doi: 10.1016/j.compag.2021.106157
Lu, Y., Wang, W., Huang, M., Ni, X., Chu, X., Li, C., et al. (2020). Evaluation and classification of five cereal fungi on culture medium using Visible/Near-Infrared (Vis/NIR) hyperspectral imaging. Infrar. Phys. Technol. 105:103206. doi: 10.1016/j.infrared.2020.103206
Luo, X., Ikehata, A., Sashida, K., Piao, S., Okura, T., and Terada, Y. (2017). Calibration transfer across near infrared spectrometers for measuring hematocrit in the blood of grazing cattle. J. Near Infrar. Spectroscopy 25, 15–25. doi: 10.1177/0967033516686658
Mansuri, S. M., Chakraborty, S., Mahanti, N., and Pandiselvam, R. (2022). Effect of germ orientation during Vis-NIR hyperspectral imaging for the detection of fungal contamination in maize kernel using PLS-DA, ANN and 1D-CNN modelling. Food Control 139:109077. doi: 10.1016/j.foodcont.2022.109077
Marique, T., Allard, O., and Spanoghe, M. (2012). Use of Self-Organizing Map to Analyze Images of Fungi Colonies Grown from Triticum aestivum Seeds Disinfected by Ozone Treatment. Int. J. Microbiol. 2012:865175. doi: 10.1155/2012/865175
Natekin, A., and Knoll, A. (2013). Gradient boosting machines, a tutorial. Front. Neurorobot. 7:21. doi: 10.3389/fnbot.2013.00021
Nguyen, C., Sagan, V., Maimaitiyiming, M., Maimaitijiang, M., Bhadra, S., and Kwasniewski, M. (2021). Early detection of plant viral disease using hyperspectral imaging and deep learning. Sensors 21:742. doi: 10.3390/s21030742
Nie, J., and Linkens, D. (1992). Neural network-based approximate reasoning: principles and implementation. Int. J. Control 56, 399–413. doi: 10.1080/00207179208934320
Paoletti, M., Haut, J. M., Plaza, J., and Plaza, A. (2019). Deep learning classifiers for hyperspectral imaging: A review. ISPRS J. Photogrammetry Remote Sens. 158, 279–317. doi: 10.1016/j.isprsjprs.2019.09.006
Pau, G., Fuchs, F., Sklyar, O., Boutros, M., and Huber, W. (2010). EBImage—an R package for image processing with applications to cellular phenotypes. Bioinformatics 26, 979–981. doi: 10.1093/bioinformatics/btq046
Porras-Alfaro, A., and Bayman, P. (2011). Hidden fungi, emergent properties: endophytes and microbiomes. Annu. Rev. phytopathol. 49, 291–315. doi: 10.1146/annurev-phyto-080508-081831
Qiao, X., Jiang, J., Qi, X., Guo, H., and Yuan, D. (2017). Utilization of spectral-spatial characteristics in shortwave infrared hyperspectral images to classify and identify fungi-contaminated peanuts. Food Chem. 220, 393–399. doi: 10.1016/j.foodchem.2016.09.119
Qin, Y., Pan, X., Kubicek, C., Druzhinina, I., Chenthamara, K., and Labbé, J. (2017). Diverse plant-associated pleosporalean fungi from saline areas: ecological tolerance and nitrogen-status dependent effects on plant growth. Front. Microbiol. 8:158. doi: 10.3389/fmicb.2017.00158
R Core Team (2023). R: A Language and Environment for Statistical Computing. Vienna: R Foundation for Statistical Computing.
Ropelewska, E. (2019). Classification of wheat kernels infected with fungi of the genus Fusarium using discriminative classifiers and neural networks. Chilean J. Agric. Res. 79, 48–55. doi: 10.4067/S0718-58392019000100048
Ru, C., Li, Z., and Tang, R. (2019). A hyperspectral imaging approach for classifying geographical origins of rhizoma atractylodis macrocephalae using the fusion of spectrum-image in VNIR and SWIR ranges (VNIR-SWIR-FuSI). Sensors 19:2045. doi: 10.3390/s19092045
Schwanninger, M., Rodrigues, J. C., and Fackler, K. A. (2011). Review of band assignments in near infrared spectra of wood and wood components. J. Near Infrar. Spectroscopy 19, 287–308. doi: 10.1255/jnirs.955
Siedliska, A., Baranowski, P., Zubik, M., and Mazurek, W. (2018). Detection of fungal infections in strawberry fruit by VNIR/SWIR hyperspectral imaging. Postharvest Biol. Technol. 139, 115–126. doi: 10.1016/j.postharvbio.2018.01.018
Singh, C., Jayas, D., Paliwal, J., and White, N. D. G. (2007). Fungal detection in wheat using near-infrared hyperspectral imaging. Trans. ASABE 50, 2171–2176. doi: 10.13031/2013.24077
Soni, A., Al-Sarayreh, M., Reis, M., and Brightwell, G. (2021). Hyperspectral imaging and deep learning for quantification of Clostridium sporogenes spores in food products using 1D-convolutional neural networks and random forest model. Food Res. Int. 147:110577. doi: 10.1016/j.foodres.2021.110577
Srivastava, N., Hinton, G., Krizhevsky, A., Sutskever, I., and Salakhutdinov, R. (2014). Dropout: a simple way to prevent neural networks from overfitting. J. Mach. Learn. Res. 15, 1929–1958.
Stone, C., and Mohammed, C. (2017). Application of remote sensing technologies for assessing planted forests damaged by insect pests and fungal pathogens: a review. Curr. For. Rep. 3, 75–92. doi: 10.1007/s40725-017-0056-1
Vapnik, V. (1999). The nature of statistical learning theory. Berlin: Springer science & business media. doi: 10.1007/978-1-4757-3264-1
Wickham, H., Chang, W., and Wickham, M. H. (2016). Package ‘ggplot2’. Create Elegant Data Visualisations Using the Grammar of Graphics. Version 2, 1–189.
Williams, P. J., Geladi, P., Britz, T., and Manley, M. (2012a). Growth characteristics of three Fusarium species evaluated by near-infrared hyperspectral imaging and multivariate image analysis. Appl. Microbiol. Biotechnol. 96, 803–813. doi: 10.1007/s00253-012-4380-x
Williams, P. J., Geladi, P., Britz, T., and Manley, M. (2012b). Near-infrared (NIR) hyperspectral imaging and multivariate image analysis to study growth characteristics and differences between species and strains of members of the genus Fusarium. Anal. Bioanalyt. Chem. 404, 1759–1769. doi: 10.1007/s00216-012-6313-z
Windrim, L., Ramakrishnan, R., Melkumyan, A., and Murphy, R. (2016). Hyperspectral CNN classification with limited training samples. arXiv [Preprint]. doi: 10.5244/C.31.4
Xiao, Q., Tang, W., Zhang, C., Zhou, L., Feng, L., Shen, J., et al. (2022). Spectral Preprocessing Combined with Deep Transfer Learning to Evaluate Chlorophyll Content in Cotton Leaves. Plant Phenom. 2022:9813841. doi: 10.34133/2022/9813841
Yao, H., Hruska, Z., Kincaid, R., Brown, R., and Cleveland, T. (2008). Differentiation of toxigenic fungi using hyperspectral imagery. Sens. Instr. Food Qual. Saf. 2, 215–224. doi: 10.1007/s11694-008-9055-z
Yuan, Z., Druzhinina, I., Wang, X., Zhang, X., Peng, L., and Labbé, J. (2020). Insight into a highly polymorphic endophyte isolated from the roots of the halophytic seepweed Suaeda salsa: Laburnicola rhizohalophila sp. nov. (Didymosphaeriaceae, Pleosporales). Fungal Biol. 124, 327–337. doi: 10.1016/j.funbio.2019.10.001
Keywords: dark septate endophytes (DSEs), 2D-CNN, 3D-CNN, deep learning, spectral pre-processing, hyperspectral imaging (HSI)
Citation: Liu Z, Al-Sarayreh M, Li Y and Yuan Z (2023) Classification of tree symbiotic fungi based on hyperspectral imagery and hybrid convolutional neural networks. Front. For. Glob. Change 6:1179910. doi: 10.3389/ffgc.2023.1179910
Received: 05 March 2023; Accepted: 20 April 2023;
Published: 05 May 2023.
Edited by:
Romà Ogaya, Ecological and Forestry Applications Research Center (CREAF), SpainReviewed by:
Anna O. Conrad, Northern Research Station, Forest Service (USDA), United StatesCopyright © 2023 Liu, Al-Sarayreh, Li and Yuan. This is an open-access article distributed under the terms of the Creative Commons Attribution License (CC BY). The use, distribution or reproduction in other forums is permitted, provided the original author(s) and the copyright owner(s) are credited and that the original publication in this journal is cited, in accordance with accepted academic practice. No use, distribution or reproduction is permitted which does not comply with these terms.
*Correspondence: Yanjie Li, YWo3MTA1QGdtYWlsLmNvbQ==; Zhilin Yuan, eXVhbnpsQGNhZi5hYy5jbg==
Disclaimer: All claims expressed in this article are solely those of the authors and do not necessarily represent those of their affiliated organizations, or those of the publisher, the editors and the reviewers. Any product that may be evaluated in this article or claim that may be made by its manufacturer is not guaranteed or endorsed by the publisher.
Research integrity at Frontiers
Learn more about the work of our research integrity team to safeguard the quality of each article we publish.