 Constance A. Harrington
 Peter J. Gould2
 Richard Cronn
- 1Pacific Northwest Research Station, USDA Forest Service, Olympia, WA, United States
- 2Mason, Bruce and Girard, Inc., Portland, OR, United States
- 3Pacific Northwest Research Station, USDA Forest Service, Corvallis, OR, United States
Phenology of diameter growth in trees has been studied for many years but generally using a limited number of sites and genotypes. In this project provenances of Douglas-fir (Pseudotsuga menziesii var. menziesii) planted across a wide range of environments were used to evaluate diameter growth and phenology to an extreme heat event and to seasonal conditions. Sampling was done in nine common gardens in western Oregon and Washington, USA that included a coastal site, a low elevation interior site, and high elevation interior site on three latitude bands. In 2021, three provenances at four sites were monitored for late-season diameter growth following an extreme heat event in June. In 2022, five provenances were evaluated for full-seasonal diameter growth at four growth intervals across all nine sites. Growth after the 2021 extreme heat event varied by planting site, with the greatest growth observed at mild (cooler/wetter) sites and the least growth observed at arid (hotter/drier) sites. Comparisons of diameter growth over the late season period (i.e., July–October) showed that 2022 growth was 1.25-fold to 3.70-fold higher, presumably due to premature growth cessation in 2021. In 2022, diameter growth rates showed significant variation by site and provenance; the interaction between site and provenance was significant in all but the first growth interval. Intra-seasonal growth rates were not consistent across sites; there was substantial diameter growth early in the season on sites with continental climates, little diameter growth by any provenance after early August at three high elevation sites, and most sources continued growth later in the season at coastal sites. One source differed more in phenology across sites than the others, apparently due to its susceptibility to a needle-cast disease. Cambial phenology varied with genetic and site factors that control the timing of growth and intrinsic growth rates. In addition, the interaction between genotype and site resulted in some provenances performing better than others on some sites as a function of disease susceptibility or response to environmental factors. Understanding phenology of seed sources under a range of site conditions should help predict diameter growth under different climate conditions in the future.
Introduction
Diameter growth of woody plants responds to temperature, photoperiod, moisture and other factors and phenological events such as the beginning of growth in the spring or growth cessation in the fall are tied to these factors (Fritts, 1976; Kramer and Kozlowski, 1979; Oliver and Larson, 1990; Ford et al., 2016, 2017; Taiz et al., 2022). Growth rates are also influenced by genotypic differences in phenology, local site conditions, and biotic and abiotic factors such as genotype susceptibility to insects and diseases or unusual heat or freeze events, droughts, or windstorms and many studies have examined factors influencing diameter growth. Douglas-fir (Pseudotsuga menziesii) is a major tree species in terms of its ecological and economic importance and many studies have examined factors influencing its diameter growth (St. Clair et al., 2005; Lavender and Hermann, 2014). Most studies of diameter growth by foresters focus on the effects of age, stand density, silvicultural practices, and site conditions (Talbert and Marshall, 2005; Curtis et al., 2007). These studies typically use natural stands or plantations with only one seed source and they have not been designed to evaluate the contributions of seed source or seed source-planting site interactions on diameter growth.
The vascular cambium produces phloem and xylem in trees, making it the tissue responsible for secondary (diameter) growth (Fischer et al., 2019). Cambial activity is regulated by external environmental cues and internal cues such as hormones (Fischer et al., 2019; Buttò et al., 2020). Cambial growth in temperate zone trees is influenced by the timing of spring cambial initiation and summer or fall cessation as well as growth rates throughout the season. Emmingham (1977) suggested that total diameter growth of P. menziesii for the season is primarily influenced by growth rates within the season rather than growth duration but that study noted differences in phenology between coastal (P. menziesii var. menziesii) and more inland sources (including those of P. menziesii var. glauca). Other work has shown that date of diameter growth initiation and cessation and within-season growth patterns can vary by genotype of P. menziesii or population of Picea abies (Li and Adams, 1994; Gould et al., 2012; Gričar et al., 2014). Although P. menziesii does not have an absolute chilling requirement for diameter growth initiation (i.e., it can begin growth without chilling), it initiates growth more rapidly if chilled, suggesting that differences in winter and spring temperatures will influence the date of growth initiation (Ford et al., 2016).
Most studies of diameter growth only measure trees at the end of the growing season or after several growing seasons and not during the growing season, however, growth rates during the season as well as the timing of growth during the season may be determinants of annual growth rates. Anatomical studies related to growth rates are limited. Cell division in the vascular cambium of P. menziesii trees of varying ages near Corvallis, OR begins in March, with rapid division in most trees in April, May and June, and division continuing into August and occasionally into early September (Grillos and Smith, 1959). Differentiation of cambial cells lags cell division and continues into early September and October. Changes in stem diameter late in the season are due to multiple factors, including late differentiation in fast growing trees in mild environments as well as shrinking and swelling in the bark (cork cambium) due to variation in moisture content (Lassoie, 1973; Intrigliolo and Castel, 2005; Zweifel, 2016). Emmingham (1977) documented trees from two sources adding more than 10% of the season’s growth after the end of August. In addition, cambial growth in relation to stress is more complex than previously appreciated as non-structural carbohydrates can accumulate during drought and support future stem growth (Anderson-Teixeira and Kannenberg, 2022; Martínez-Sancho et al., 2022).
Measurable climate change has occurred in recent decades and models predict additional changes such as climate warming and drying into the future (IPCC, 2021). To better understand how plant phenology may be altered due to future climate change, we can monitor short- and long-term changes in phenology to incremental changes in climate or extreme weather events, use controlled experiments to develop models to predict future changes, or move plants to new environments and record their responses. The Douglas-fir Seed-Source Movement Trial is a reciprocal transplant study with nine planting sites that has allowed us to evaluate several aspects of plant phenology (Gould et al., 2010, 2012; Ford et al., 2016, 2017; Harrington et al., 2016). In this report we evaluate diameter growth following a 2021 heat event, and growth during the complete 2022 growing season to gain additional understanding of the effects of provenance and planting site environment on tree growth responses. Evaluating growth of genotypes at non-local locations gives managers and scientists a unique perspective of how different seed sources are likely to respond to novel climates in the future.
Our network of reciprocal transplant common gardens allows us to evaluate how seed source provenance and growing site (i.e., different climates) influence the rate and magnitude of diameter growth. Recent European studies reported drought and heat events to have had little effect on current year diameter growth (Martínez-Sancho et al., 2022; Salomón et al., 2022). However, Ford et al. (2017) reported exposure to temperatures > 42°C during long photoperiods was associated with premature cessation of diameter growth in young P. menziesii. An unusual Pacific Northwest “heat dome” event in June 2021 (Still et al., 2023) impacted all our reciprocal common garden sites, yielding temperatures as high as 47°C at one location, and provided an independent test of the “summer cessation” hypothesis. In addition, preliminary analysis indicated that the growth rates of the CASierra provenance differed more across sites than did the other provenances. It has been previously documented (Wilhelmi et al., 2017) that this provenance is highly susceptible on moist sites to Rhabdocline needle cast (Stone, 1997), a foliage disease caused by several species of the fungal pathogens in the genus Rhabdocline (hereafter referred to as “Rhabdocline”).
Here we evaluate four questions related to cambial phenology in P. menziesii:
(1) Do extreme heat events alter the rate or magnitude of diameter growth?
(2) Does cambial phenology in P. menziesii differ between local and non-local provenances planted at different sites?
(3) If cambial phenology differs across planting sites, does it vary in the same manner for all provenances?
(4) Is there a relationship between past infection with Rhabdocline and current diameter growth rates?
Materials and methods
Study sites
The Douglas-fir Seed-Source Movement Trial (SSMT) includes nine common garden sites in western Washington and Oregon, USA (Figure 1). The planting sites were located on three latitude bands corresponding to southern Oregon (∼42°N), northern Oregon (∼44°N), and southern Washington (∼47°N), USA. Each latitude was represented by a coastal site, a low elevation inland site, and a high elevation inland site. These sites covered a wide range of climatic conditions (Table 1) with May to September precipitation ranging from 87 to 449 mm and the beginning of the frost-free period (minimum air temperature > 0°C) ranging from day 94 to day 141. Weather stations (Onset Hobo U-30) were installed in an open area of each site with smart sensors for air temperature (TEMP), relative humidity (THC), precipitation (RGB), and soil moisture (10HS SMD). Sites were each fenced to prevent animal browse and were managed to keep competition from other vegetation to a minimum during establishment. Planting of 2-year-old seedlings (plug/plug transplants) occurred after the 2008 growing season making the trees 15 (2021) and 16 (2022) years-old from seed at the time of measurement.
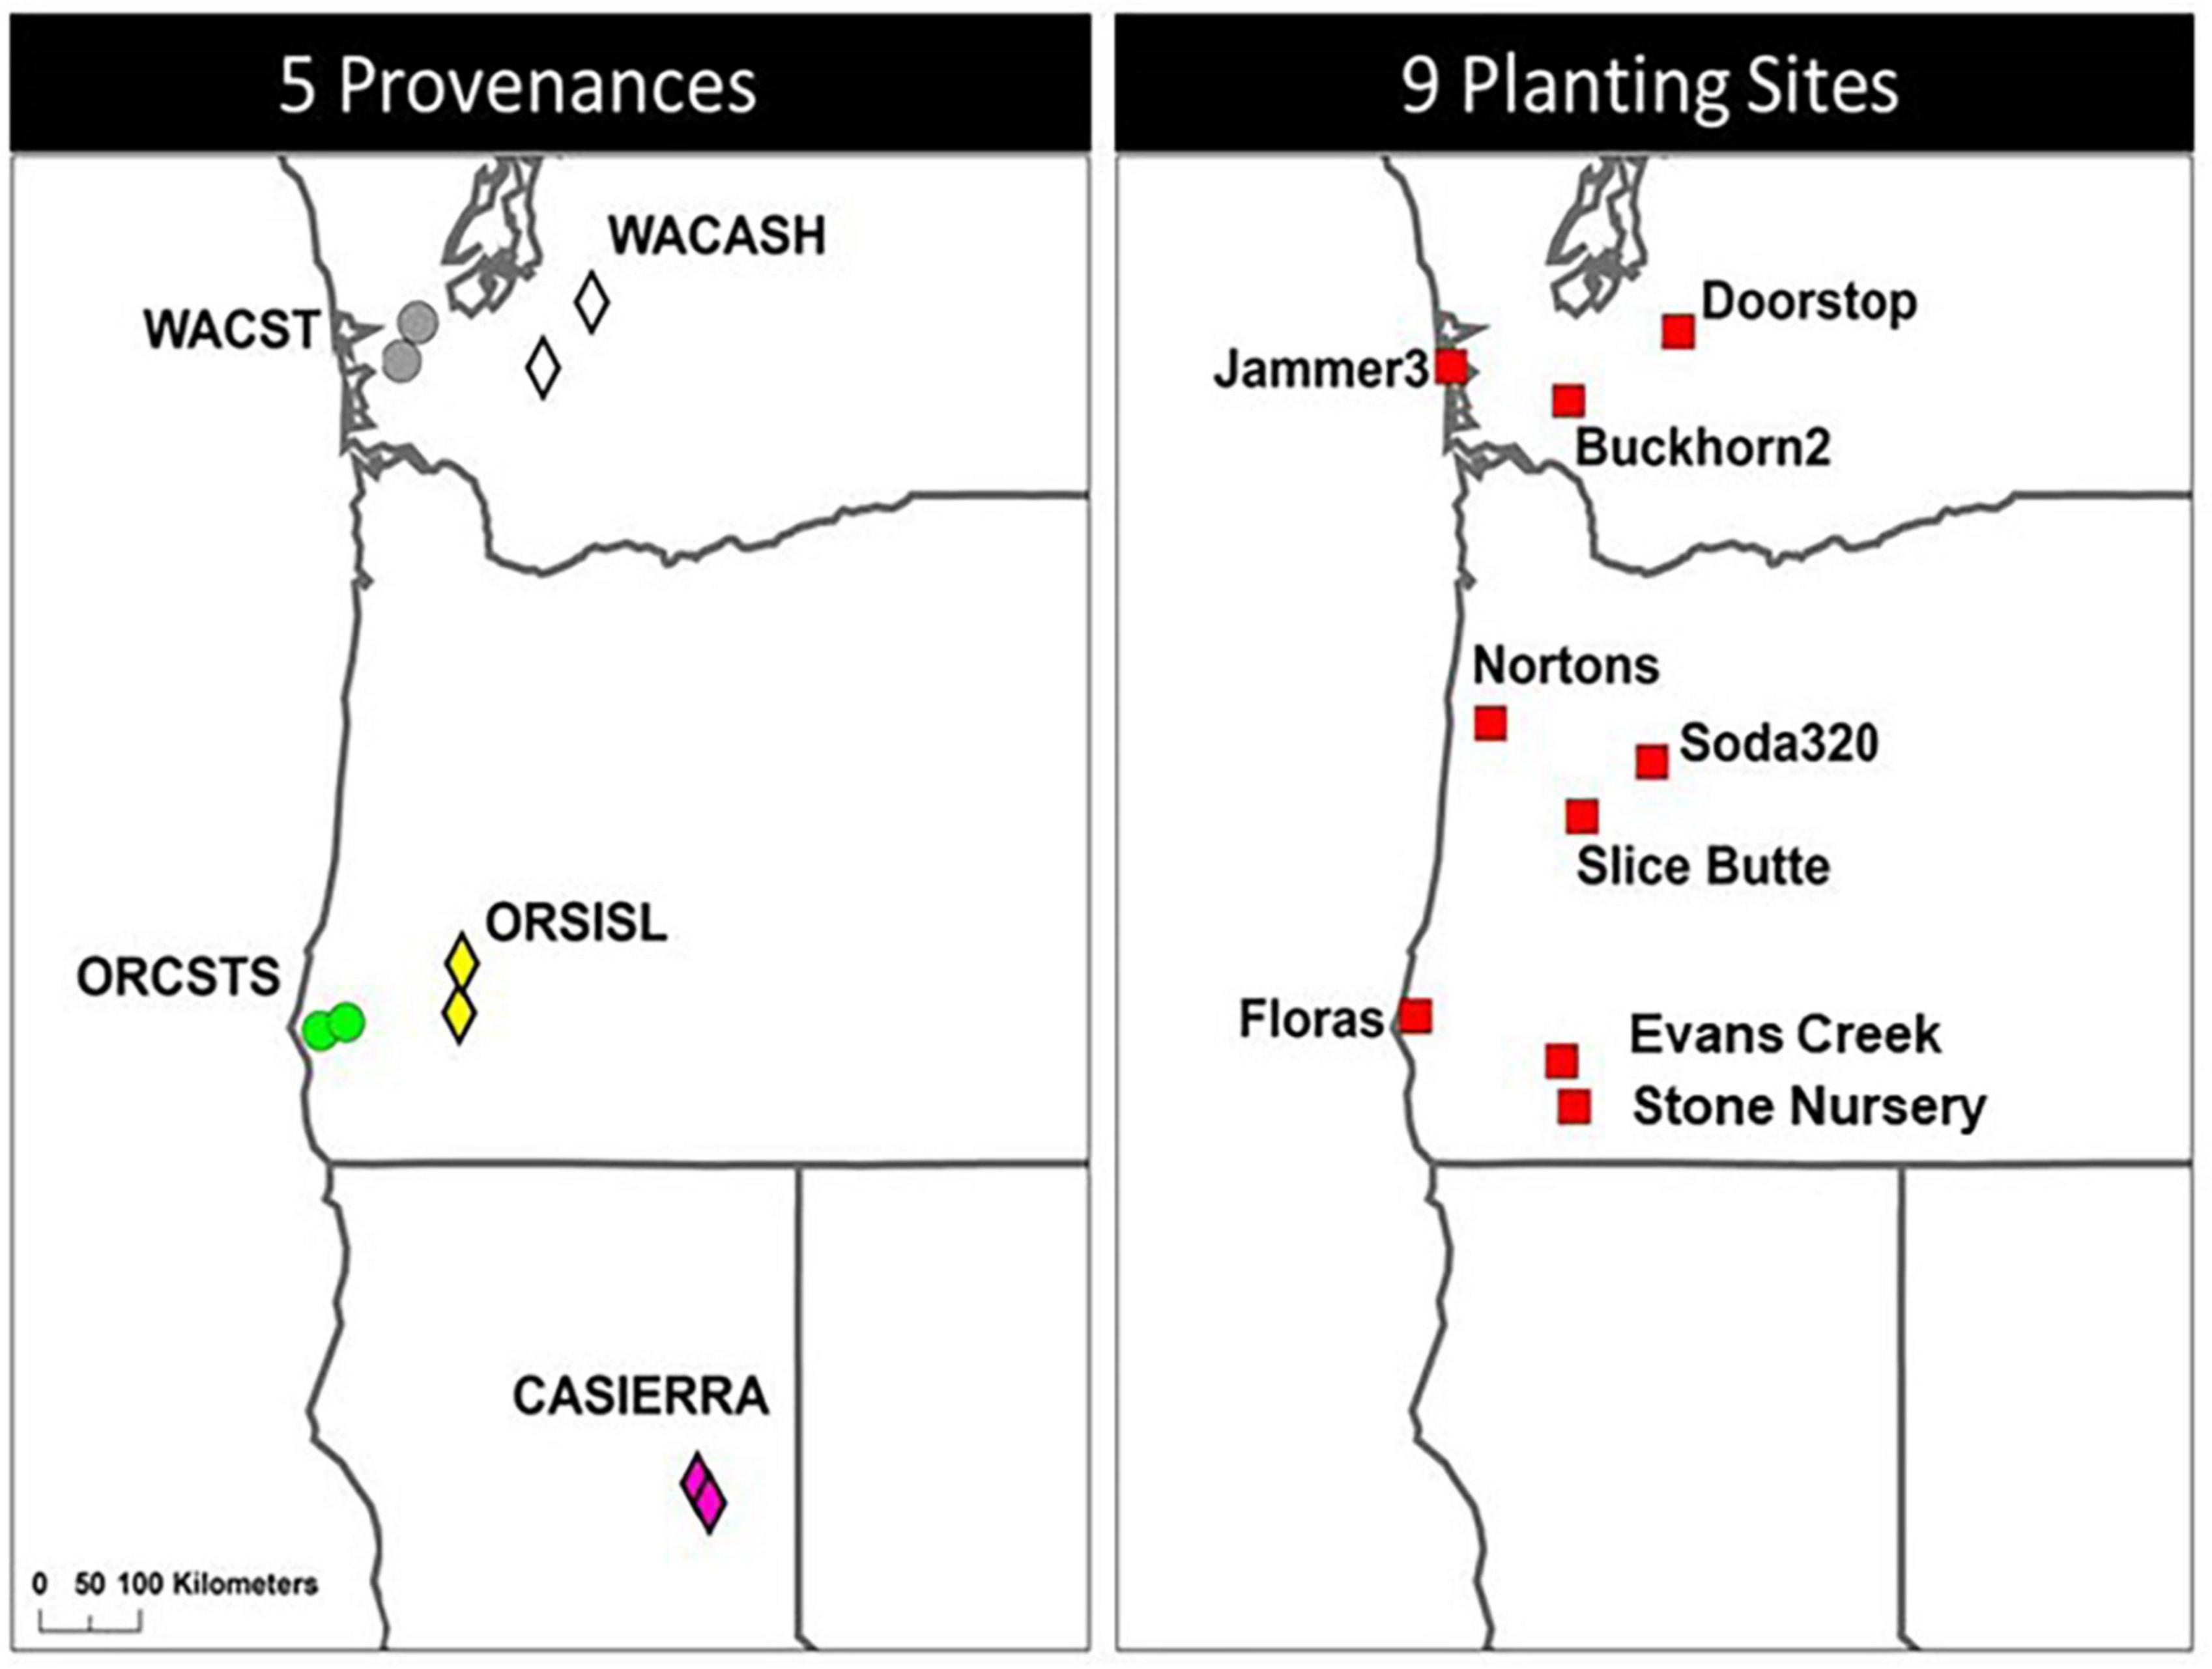
Figure 1. Location of five provenances (2 populations per provenance) and nine planting sites used in the study. Washington Coast (WACST), Washington Cascades high elevation (WACASH), and Oregon Siskiyou Mountains low elevation (ORSISL) were sampled in 2021; those three provenances plus Oregon Coast south (ORCSTS) and California Sierra Mountains (CASierra) were sampled in 2022.
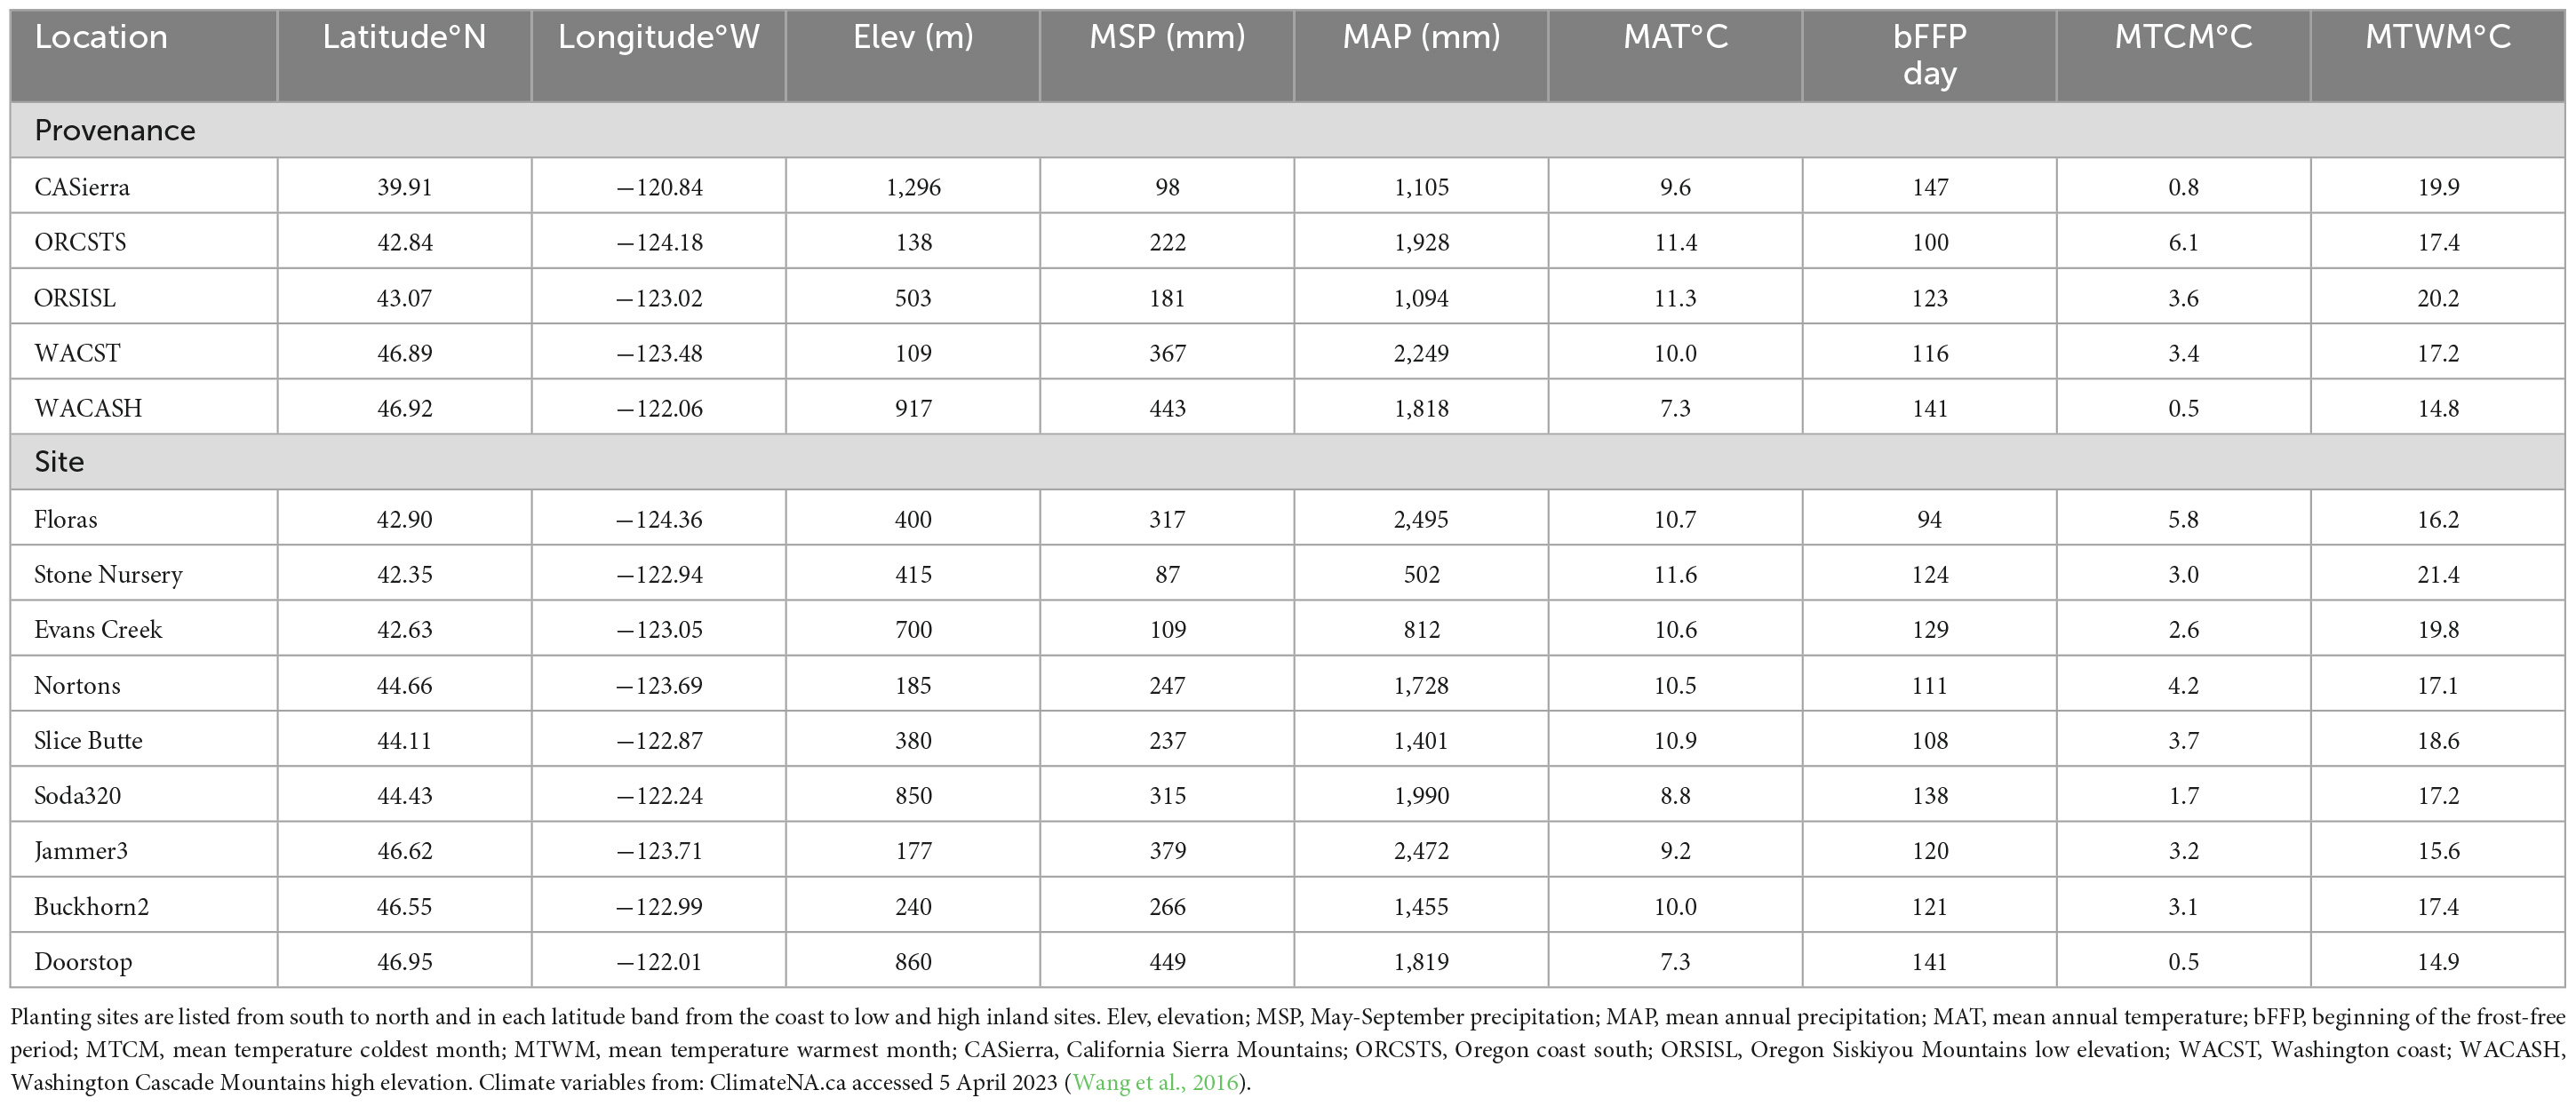
Table 1. Geographic location and climatic variables for seed source provenances and planting site locations based on 1960–1990 normal data.
Each site contains 48 plots divided into 4 blocks of 12 plots, with 1 plot for each of 12 provenances. The term “provenance” describes a general geographic region with a similar climate that is approximately equivalent to a seed zone; in this study, provenance is synonymous with “seed source.” Each provenance was further subdivided into 5 “population” zones that were in the same geographic area and exhibit reproductive connectivity. Each plot in the SSMT included 20 trees; 5 populations each represented by 2 half-sib families per population, with each family represented by 2 trees. The provenances and populations used in this study were subsampled as described below to represent a wide range of environmental conditions. The climates at the provenance locations vary substantially (Table 1), as do the sizes of the trees of the sampled provenances by site (Table 2). Mean tree diameter measured after the 2021 growing season (plantation age 13) ranged from a minimum of 4.7 cm for the California Sierra Mountains source at the Soda320 site (northern Oregon high elevation) to a maximum of 22.1 cm for the Washington coast provenance at the Nortons site (northern Oregon coast). Mean heights ranged from 3.4 to 14.0 m. The sites differed in the presence of fungal pathogens with moister sites having needle cast diseases present (as documented in 2015 surveys, Wilhelmi et al., 2017) and the most arid sites exhibiting stem and branch cankers (e.g., Diaporthe lokoyae) and beetles and wood boring insects associated with the cankers (Goheen and Willhite, 2021).
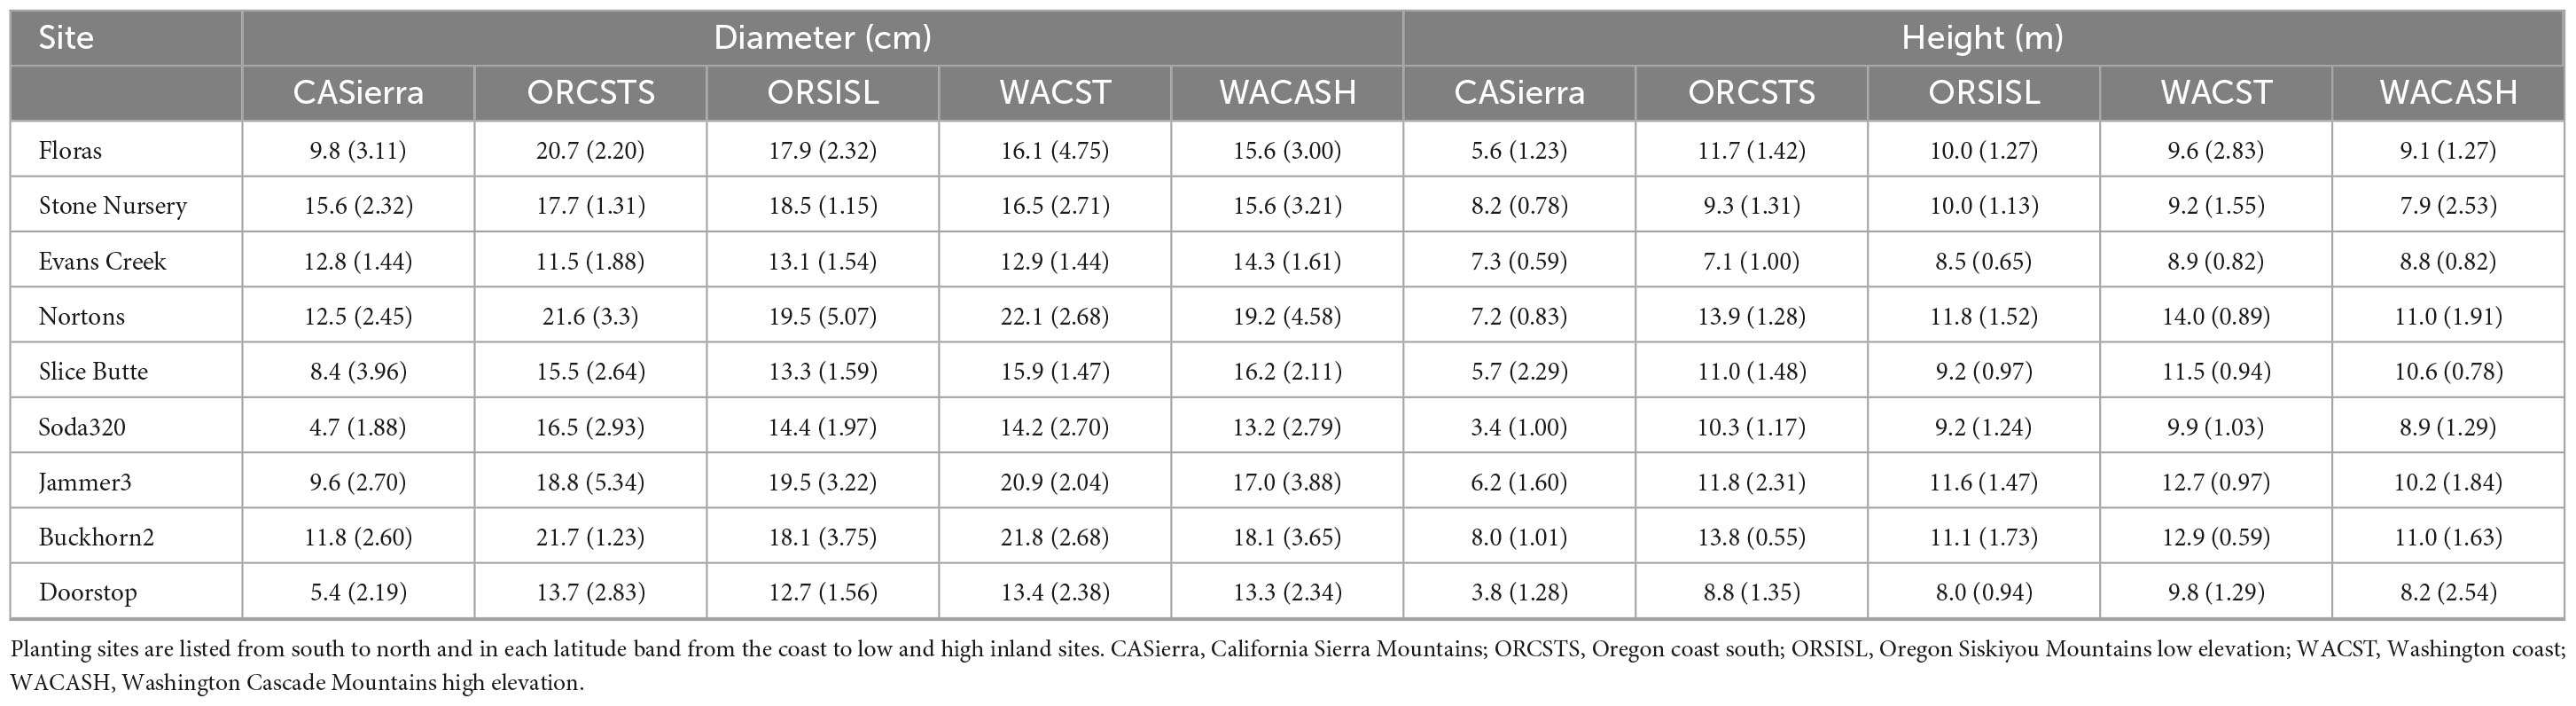
Table 2. Mean tree diameter and height (and standard deviation) at the end of the 2021 growing season by planting site and seed source provenance.
Measurements
In 2021, the Pacific Northwest “heat dome” event (June 26-28, 2021; Still et al., 2023) produced unusually high air temperatures exceeding 40°C (Table 3). Between 9 and 16 days following the heat dome event, we measured tree diameters of select trees and then remeasured again at the end of growing season. Trees from three provenances (and two populations per provenance) were selected for evaluation [Oregon Siskiyou Mountains low elevation (ORSISL), Washington coast (WACST), and Washington Cascades high elevation (WACASH)] based on previously characterized differences in budburst phenology (Gould et al., 2012), as these provenances might be expected to show different responses to an extreme heat event occurring in the growing season. We measured 12 trees (6 in each of 2 blocks) for 3 provenances at 2 sites in Oregon and 2 sites in Washington for a total of 36 trees per site. Only four sites and two blocks per site were measured due to limited resources. The two blocks closest to the gate in the fence were selected to minimize measurement time. For this substudy, trees were selected from the two best growing populations per provenance as measured across the entire study (to avoid extremely maladapted populations). Preference in individual tree selection was given to trees with single stems and no top die back.
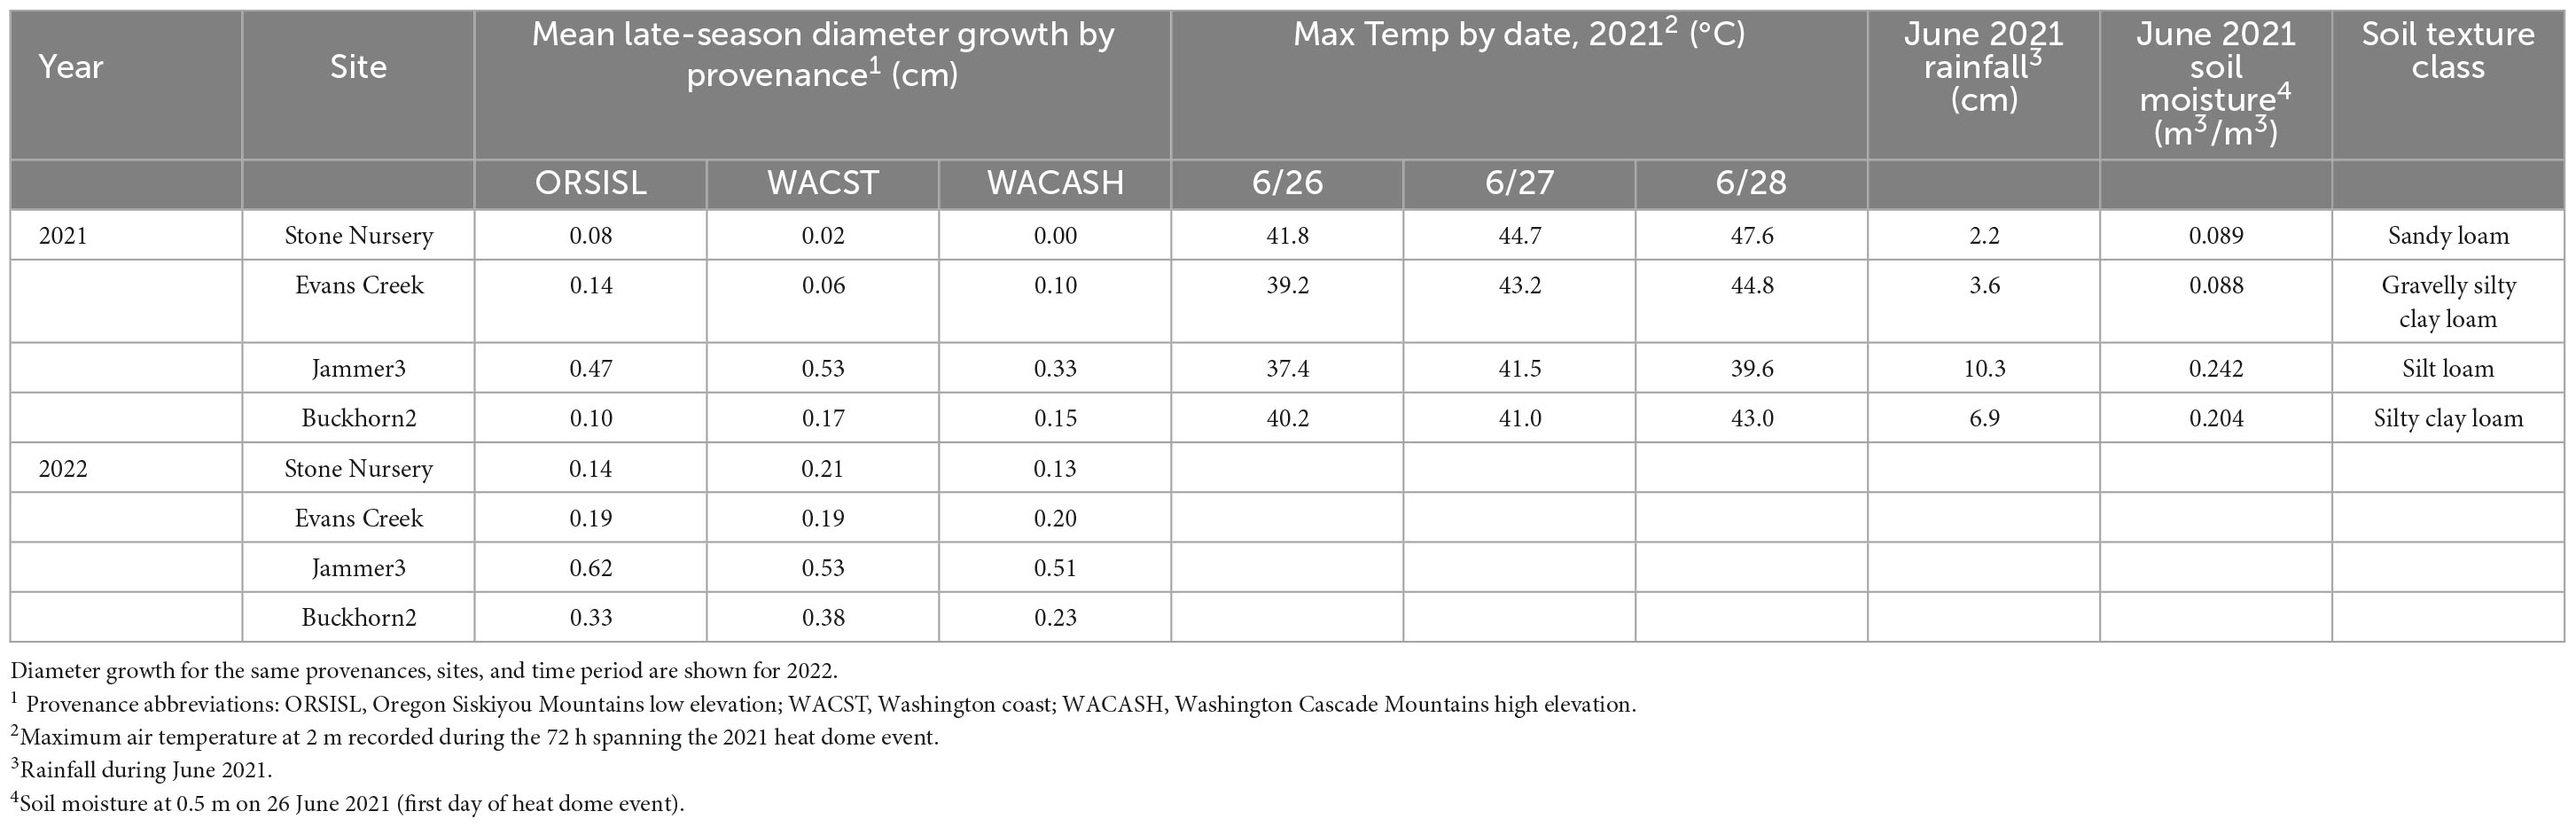
Table 3. Mean late-season diameter growth (July–October) after the Pacific Northwest June 2021 heat dome event (Still et al., 2023), maximum daily air temperatures during the heat event, June 2021 precipitation, soil moisture at 50-cm depth at the start of the heat dome event, and subsoil soil texture class based on laboratory analysis (Soil Survey Staff, 1975).
In 2022 we used a network of volunteers to expand measurements to five provenances [adding California Sierra (CASierra) and Oregon coast south (ORCSTS)] across all nine common garden sites. Each tree was measured at five dates: (1) end of the 2021 growing season (measured in fall, winter or early spring), (2) May (representing early spring growth) (3) late June to early July (close to the summer solstice), (4) early to mid-August, and 5) end of the growing season (October to early December). This resulted in four diameter growth intervals: early spring, late spring, early summer, and summer-fall on 60 trees at each site.
Diameter locations were marked with paint prior to the first measurement and each volunteer used a steel metric diameter tape for measurements. Volunteers were asked to record diameter to the nearest 0.1 cm (minimally) or interpolate to the nearest 0.05 cm if the reading was centered between 0.1 cm marks on the diameter tape. Volunteers were sent measurement files prior to the desired measurement date, and they returned copies of data files after each measurement for editing and data safety purposes. Light editing was used to correct obvious measurement or keypunch errors. Two of the low elevation sites initially measured in early October 2022 had several trees with reduced diameter from the previous measurement, presumably due to an extended summer drought; these were re-measured in November 2022 to account for bark shrinkage.
To compare late-season diameter growth in 2021 to equivalent growth in 2022, we measured late-season growth for 2021 after the heat dome event (July to October) and compared it to diameter growth from the same trees and same date intervals in 2022. We performed a linear mixed effects model using the lme function of the lme4 package (v1.1-29; Bates et al., 2015; R Core Team, 2021) to evaluate associations between late-season diameter growth and year (two levels: 2021, 2022), garden site (four levels: Buckhorn2, Evans Creek, Jammer3, Stone Nursery), and provenance source (three levels; ORSISL, WACASH, WACST). Year and site were used as fixed effects in the model without interaction terms. Random effects included intercepts for provenance and individual tree tag numbers. Values were estimated using Restricted Maximum Likelihood (REML). P-values were obtained using likelihood ratio tests of the full model with the effect in question against a model without the effect; these tests were conducted using the R function anova with the test parameter Chisq. Confidence Intervals (95% CIs) and P-values were computed using a Wald t-distribution approximation. Residual plots did not reveal obvious deviations from homoscedasticity or normality, but three diameter measures appeared anomalously high (Z-score > 5.85; two measurements) or low (Z-score < −3.428 one measurement). These values have a probability of occurrence in a normal distribution of less than 1 in 1,000, so they were considered as outliers and excluded from this analysis.
In 2022, the four growth intervals (early spring, late spring, early summer, and summer-fall) were analyzed separately using analysis of variance with site, provenance, and site × provenance as the effects (Neter et al., 1996). Linear models were fit with R using the lm function and ANOVA results were summarized with the anova function (R Core Team, 2021). Residuals were evaluated for lack of normality and heteroscedasticity. Treatment means were separated using the Tukey multiple comparison procedure implemented in the R package agricolae (de Mendiburu, 2021) with an overall type-one error rate of α = 0.05 for each set 199 of comparisons. Figures were created using the base plot R function and the ggplot function of the ggplot2 package (v3.4.1).
To evaluate the question if there is a relationship between past severity of Rhabdocline and current diameter growth, we plotted and also calculated the coefficient of determination (R2) between mean growth in growth intervals 1 and 2 in 2022 (late winter through spring, when spore dispersal occurs) versus the percentage of trees with moderate to severe Rhabdocline infection documented in the 2015 needle disease survey. Each point was based on 12 observations per site and provenance.
Results
The 2021 heat event was associated with significant differences in late-season diameter growth across the 2021 and 2022 growing seasons, with mean diameter increases between July to October significantly larger in 2022 than 2021 (Figure 2 and Table 3). This “year” effect is most pronounced at arid sites, as they showed the largest deficit in potential growth in 2021 relative to 2022. For example, mean late season diameter growth from the hot/dry Stone Nursery site showed a 3.70-fold increase from 2021 to 2022 (Supplementary Table 1); the similarly arid Evans Creek site also showed a 2.25-fold increase in late season diameter growth from 2021 to 2022. These differences contrast the less dramatic differences observed at the mesic Buckhorn2 site (1.56-fold increase from 2021 to 2022) and the wet/cool Jammer3 site (1.25-fold increase) (Supplementary Table 1).
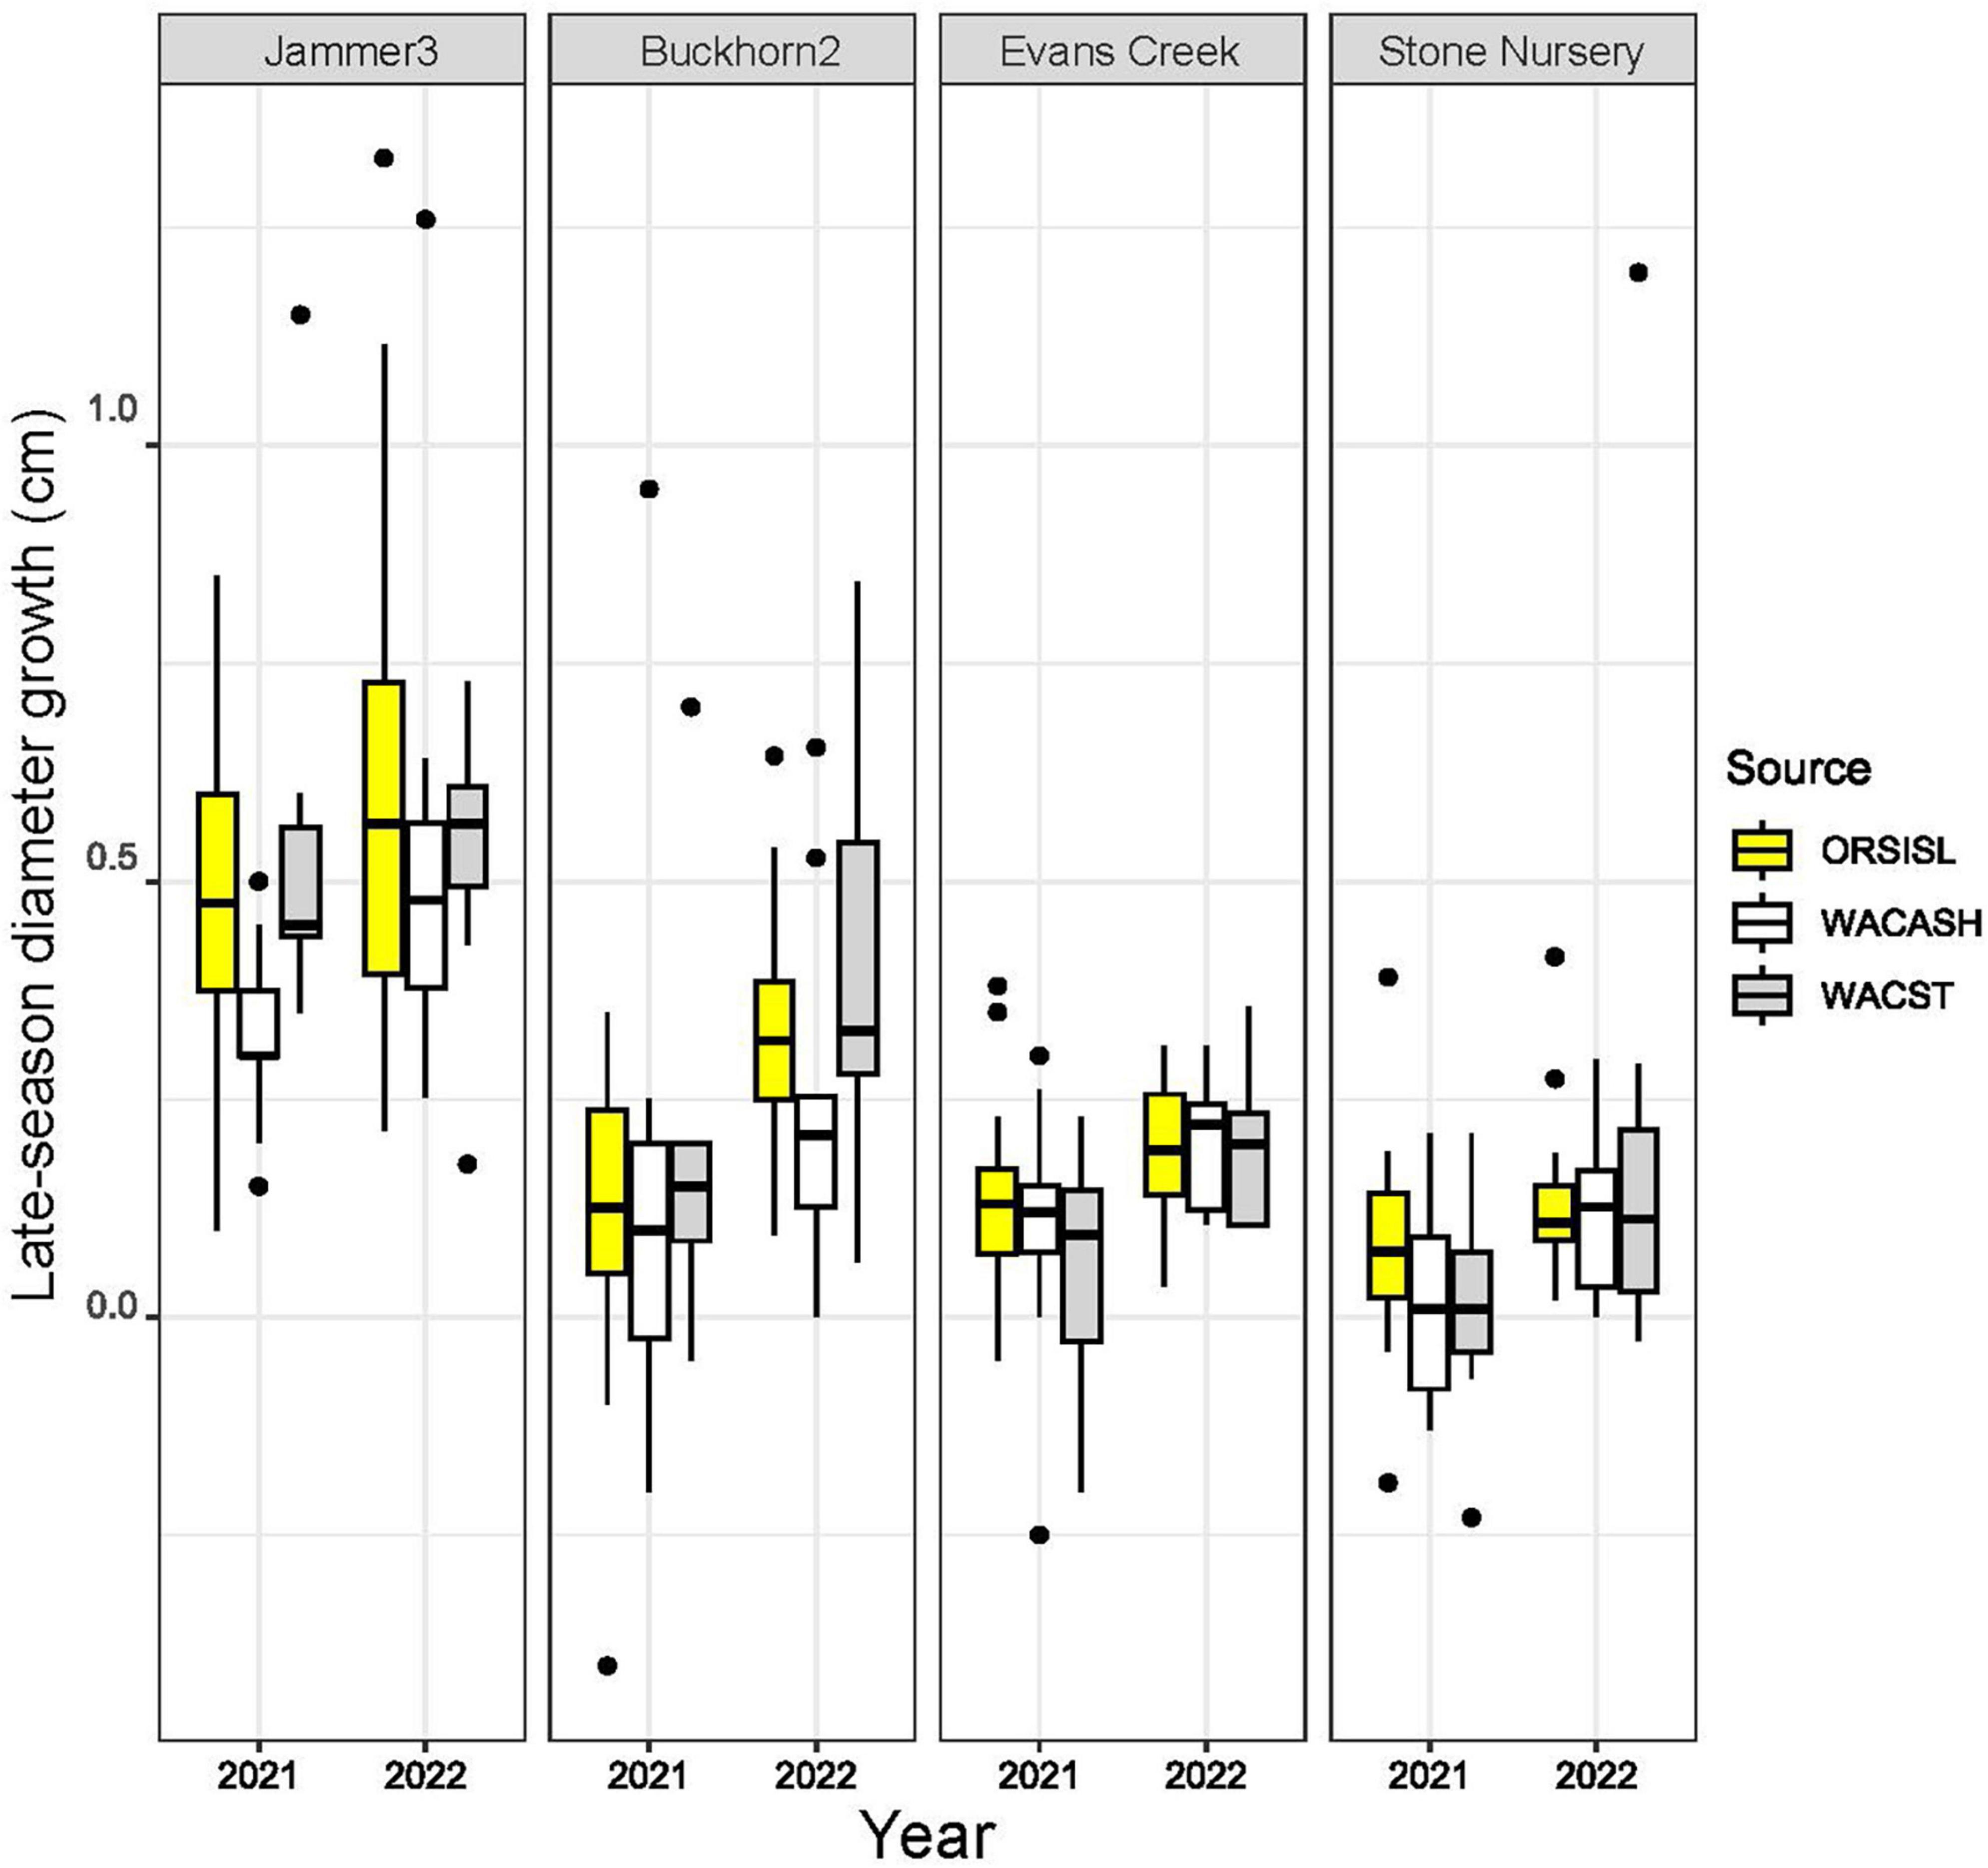
Figure 2. Boxplots of late-season diameter growth (in cm) from three provenances of Douglas-fir grown at four planting sites in 2021 and 2022. Late-season (early July to October) diameter changes in individual trees were made across two consecutive years following an extreme heat event in late June 2021. Boxplots show medians and interquartile ranges, with boxes colored by source provenance; mean values are provided in Table 3. Late-season growth was highest at cooler/wetter sites (e.g., Jammer3), and growth was lowest at warmer/arid sites (Evans Creek, Stone Nursery). Median and mean values were higher in 2022 relative to 2021 across all planting sites, with the largest differences observed at sites that were exposed to air temperatures exceeding 42°C (Buckhorn2, Evans Creek, Stone Nursery).
Diameter growth in 2022 varied by growing site (Figure 3), and by site, provenance, and measurement growth interval during the growing season (Figures 4, 5 and Supplementary Table 2). The clearest trend across all sites is that the CASierra provenance grew more poorly than the other four sources at seven of the sites (Figures 4, 5); it grew similarly to the other sources at Evans Creek and Stone Nursery, which are the two driest sites in our study (Table 1) and the only sites with no presence of Rhabdocline or Swiss needle cast diseases when surveyed in spring, 2015 (Wilhelmi et al., 2017). The relationship between early season growth and previous Rhabdocline infection was negative (Figure 6) with a coefficient of determination (R2) of 0.80 (p < 0.001).
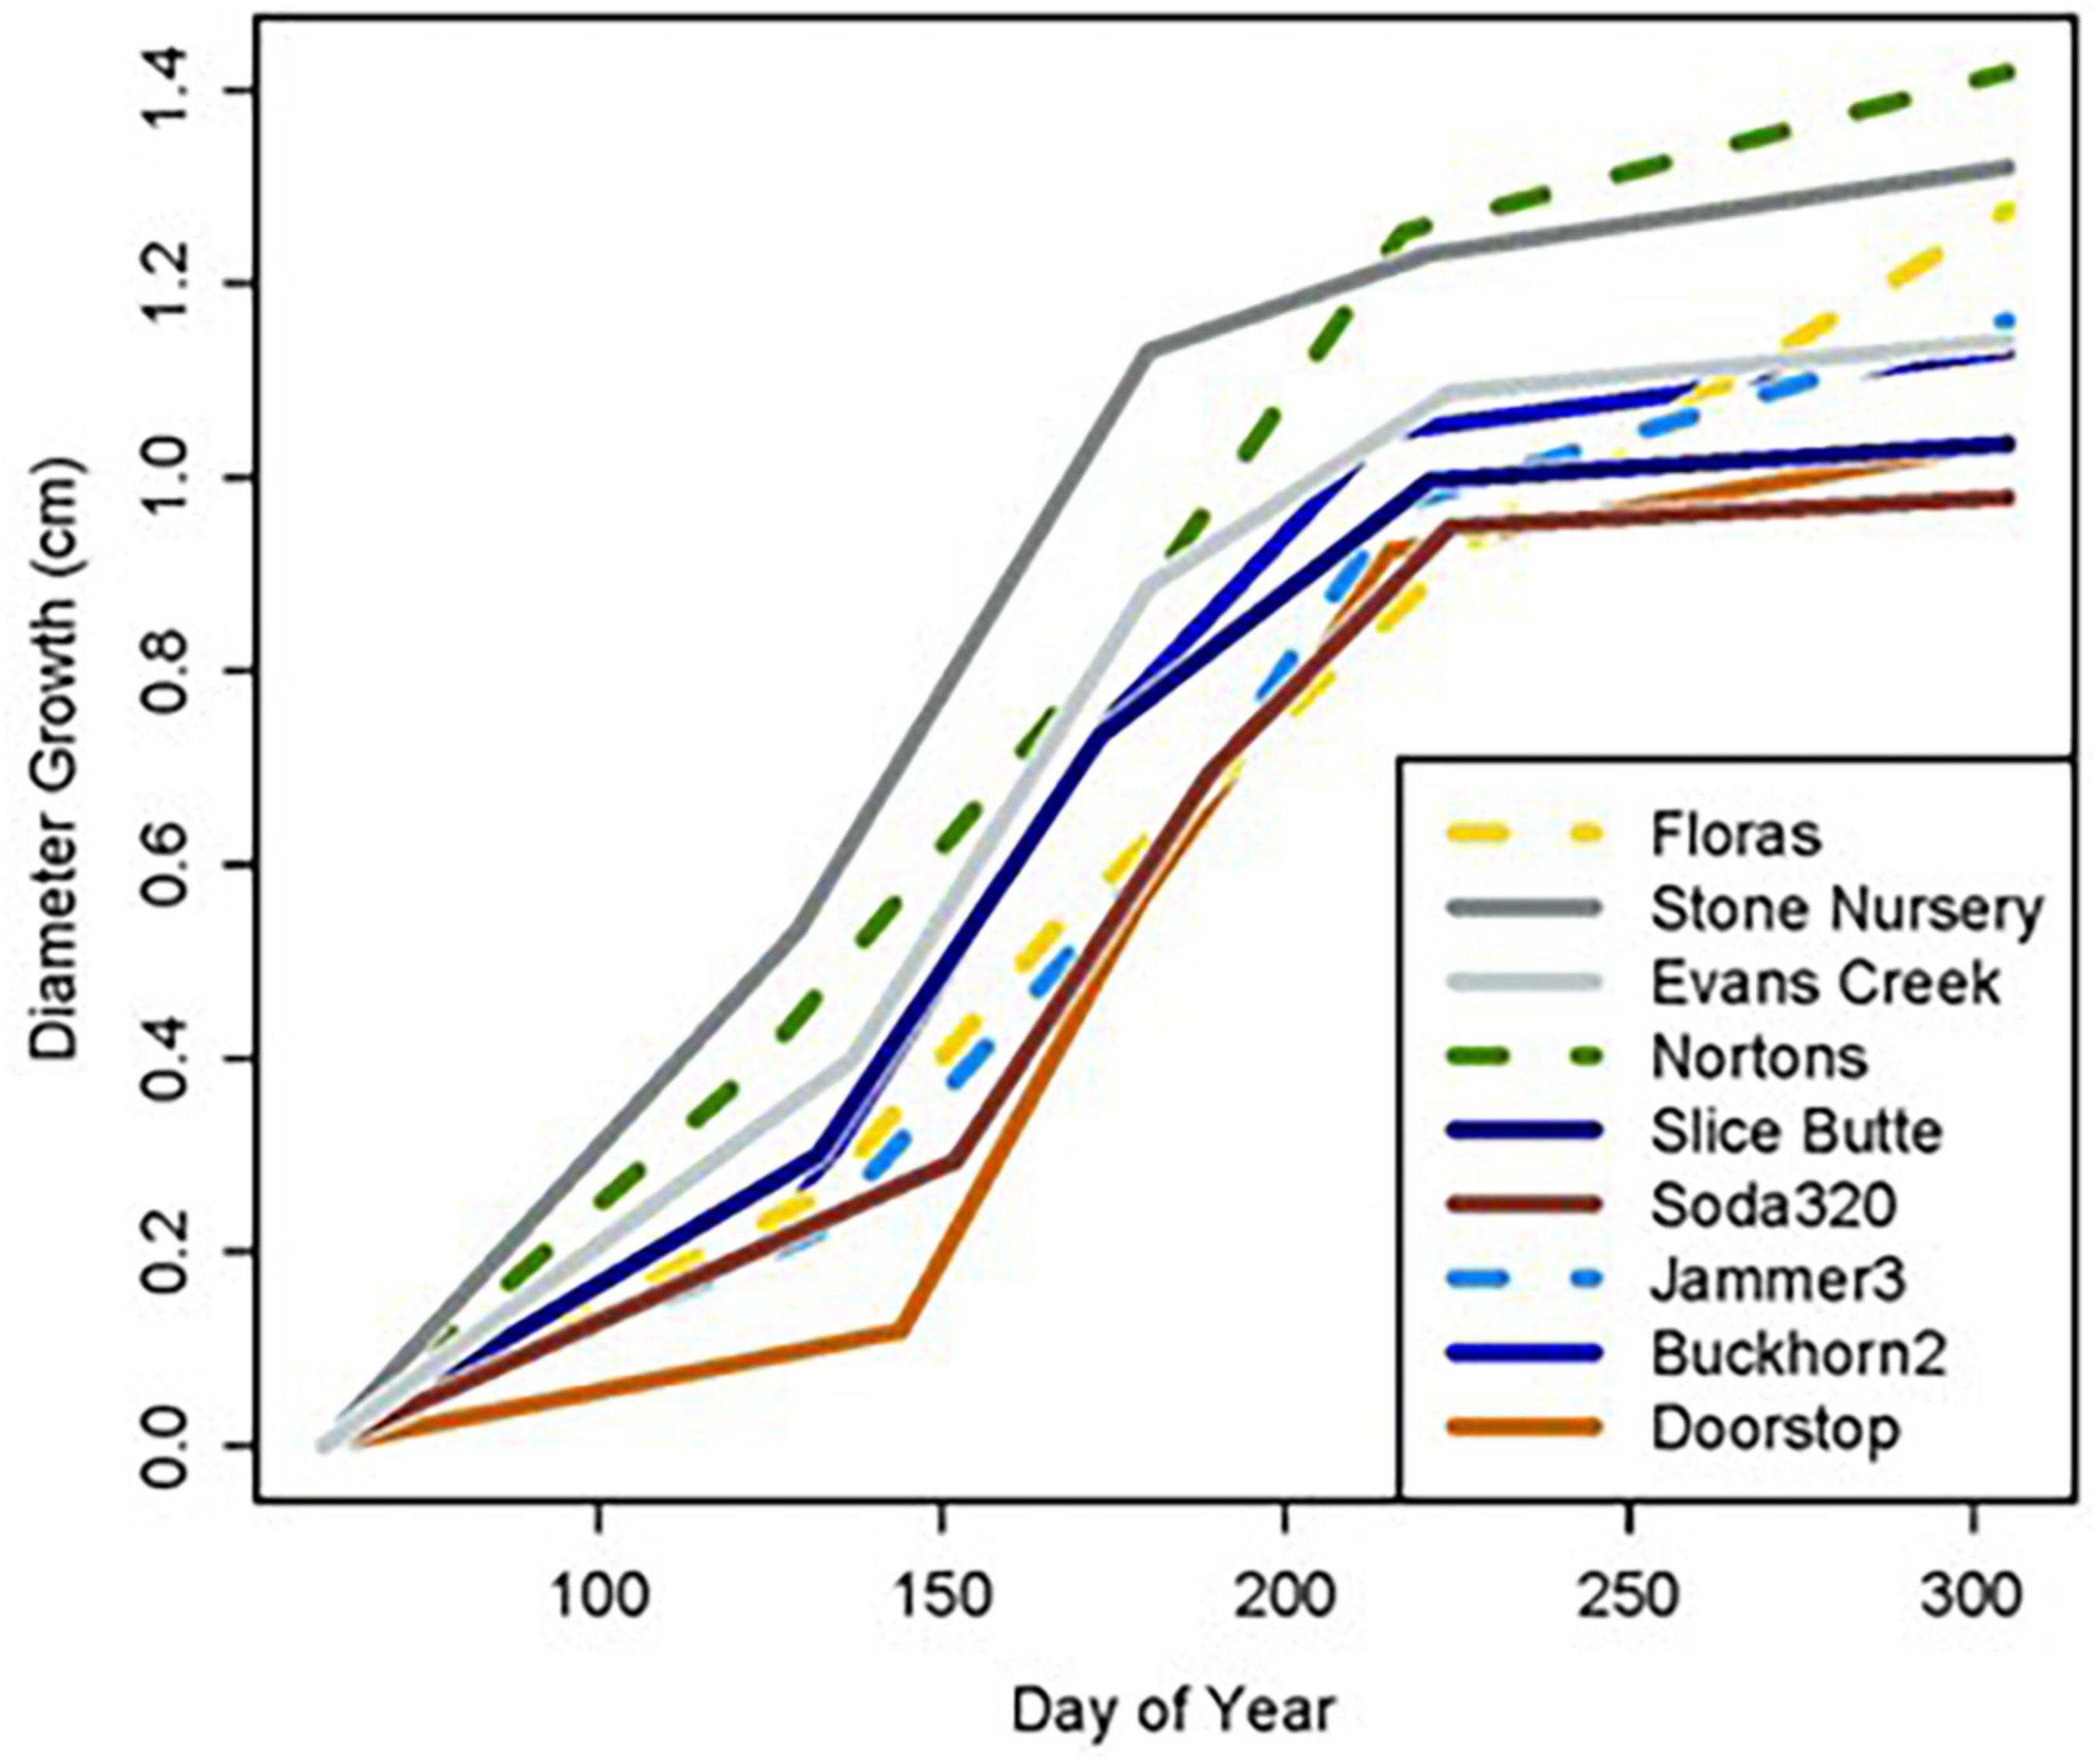
Figure 3. Cumulative diameter growth during the 2022 growing season at nine planting sites.
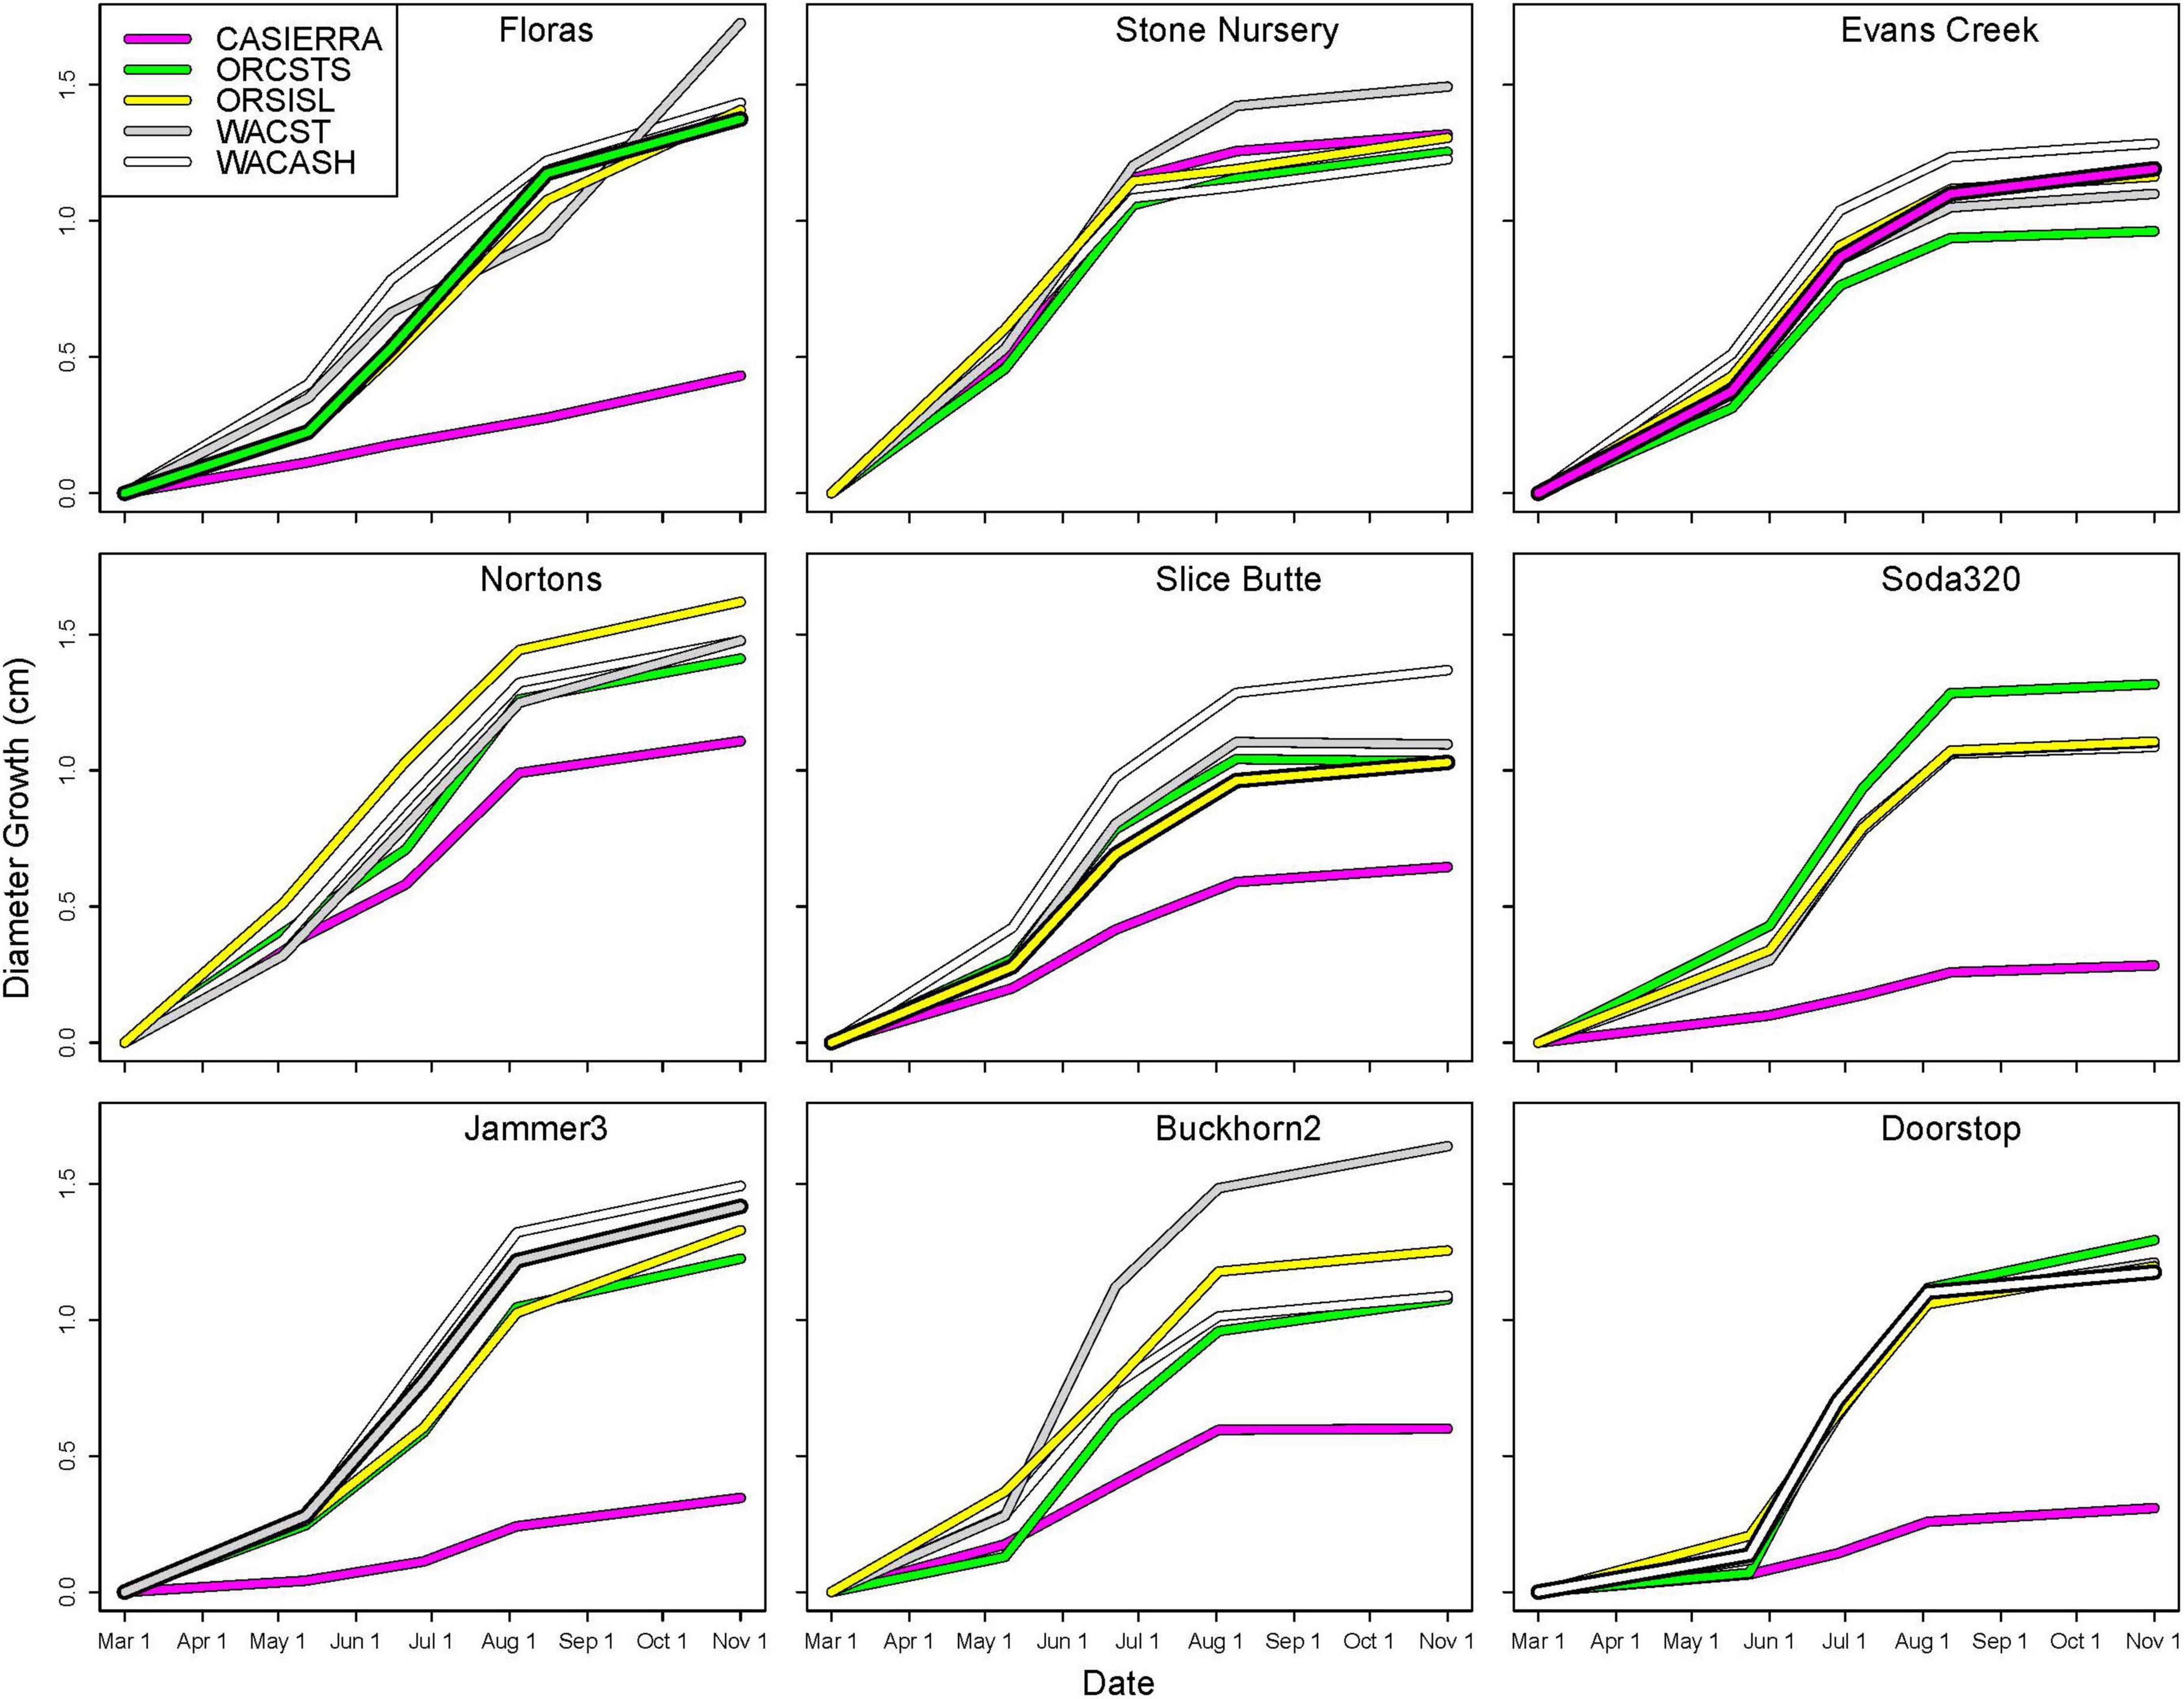
Figure 4. Cumulative diameter growth during the 2022 growing season by planting site and provenance. Figure panels are arranged vertically from south to north and horizontally from coast to low-, to high-elevation inland sites. The provenance that would be closest to the climate of the planting site is shown as a bold line (ORCSTS for Floras, CASierra for Evans Creek, ORSISKL for Slice Butte, WACST for Jammer3, and WACASH for Doorstop).
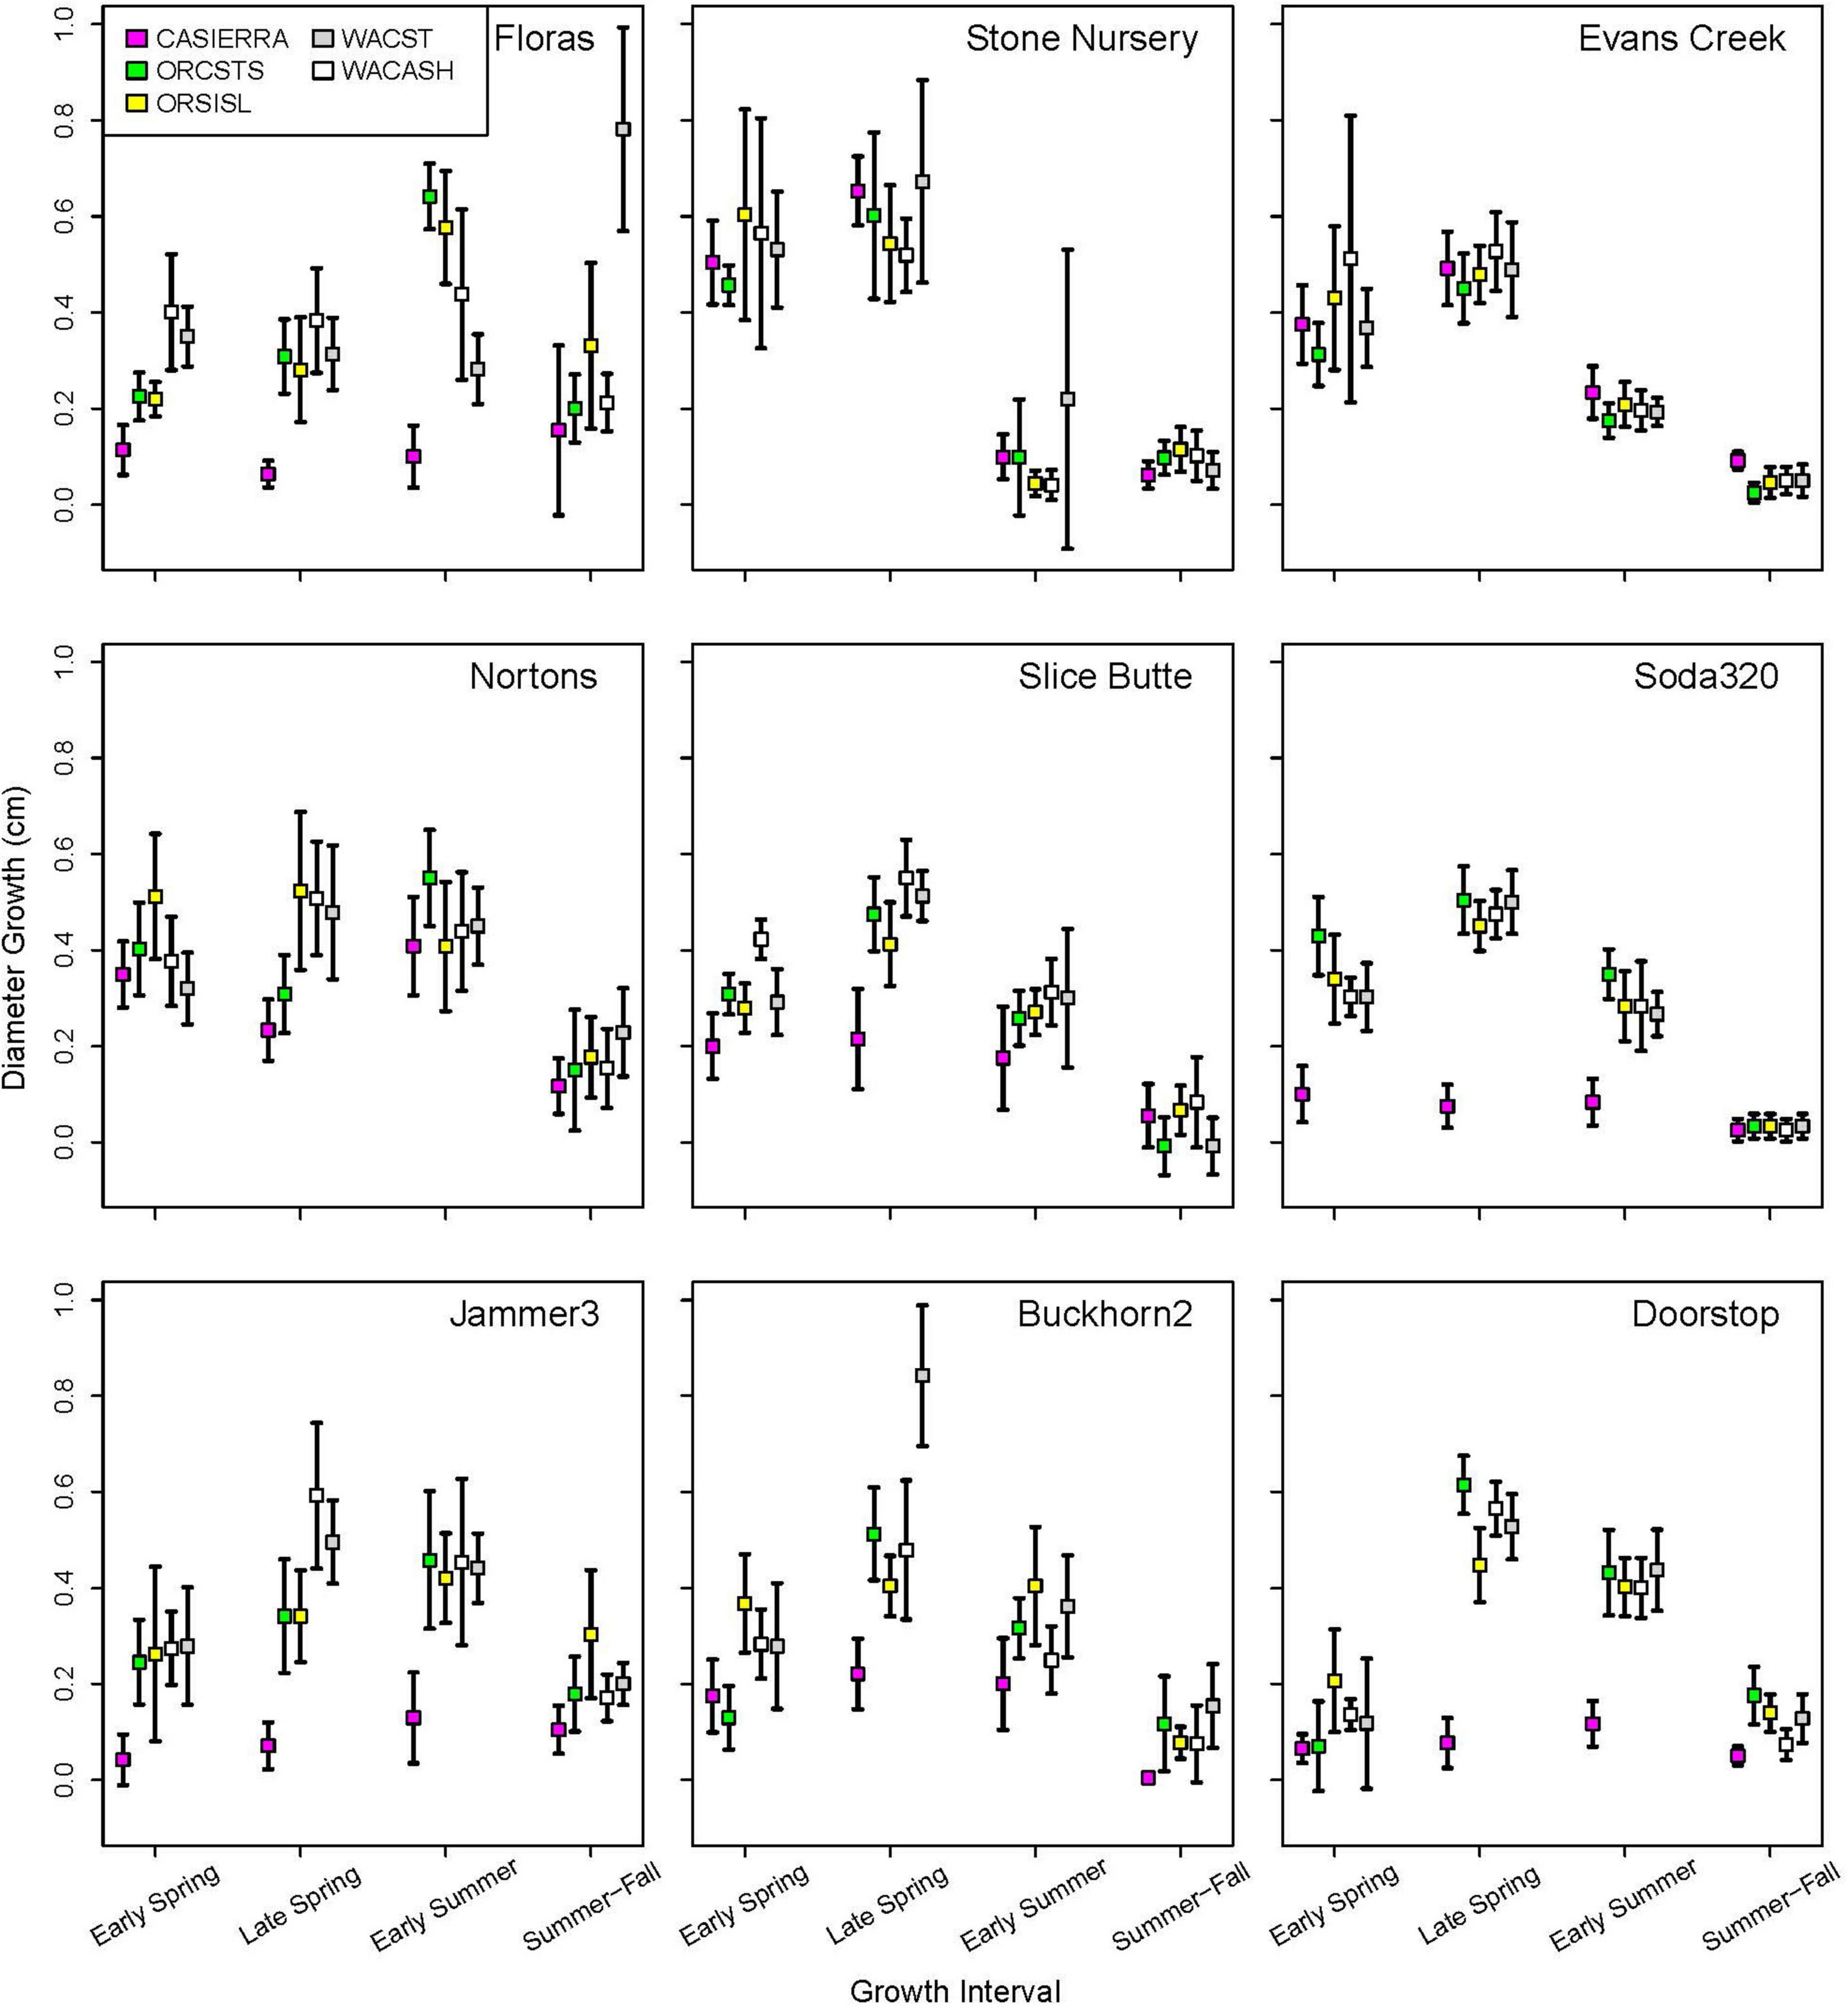
Figure 5. Diameter growth rates (and 95% confidence intervals) in each growth interval in 2022 by planting site and provenance. Figure panels are arranged vertically from south to north and horizontally from coast to low-, to high-elevation inland sites.
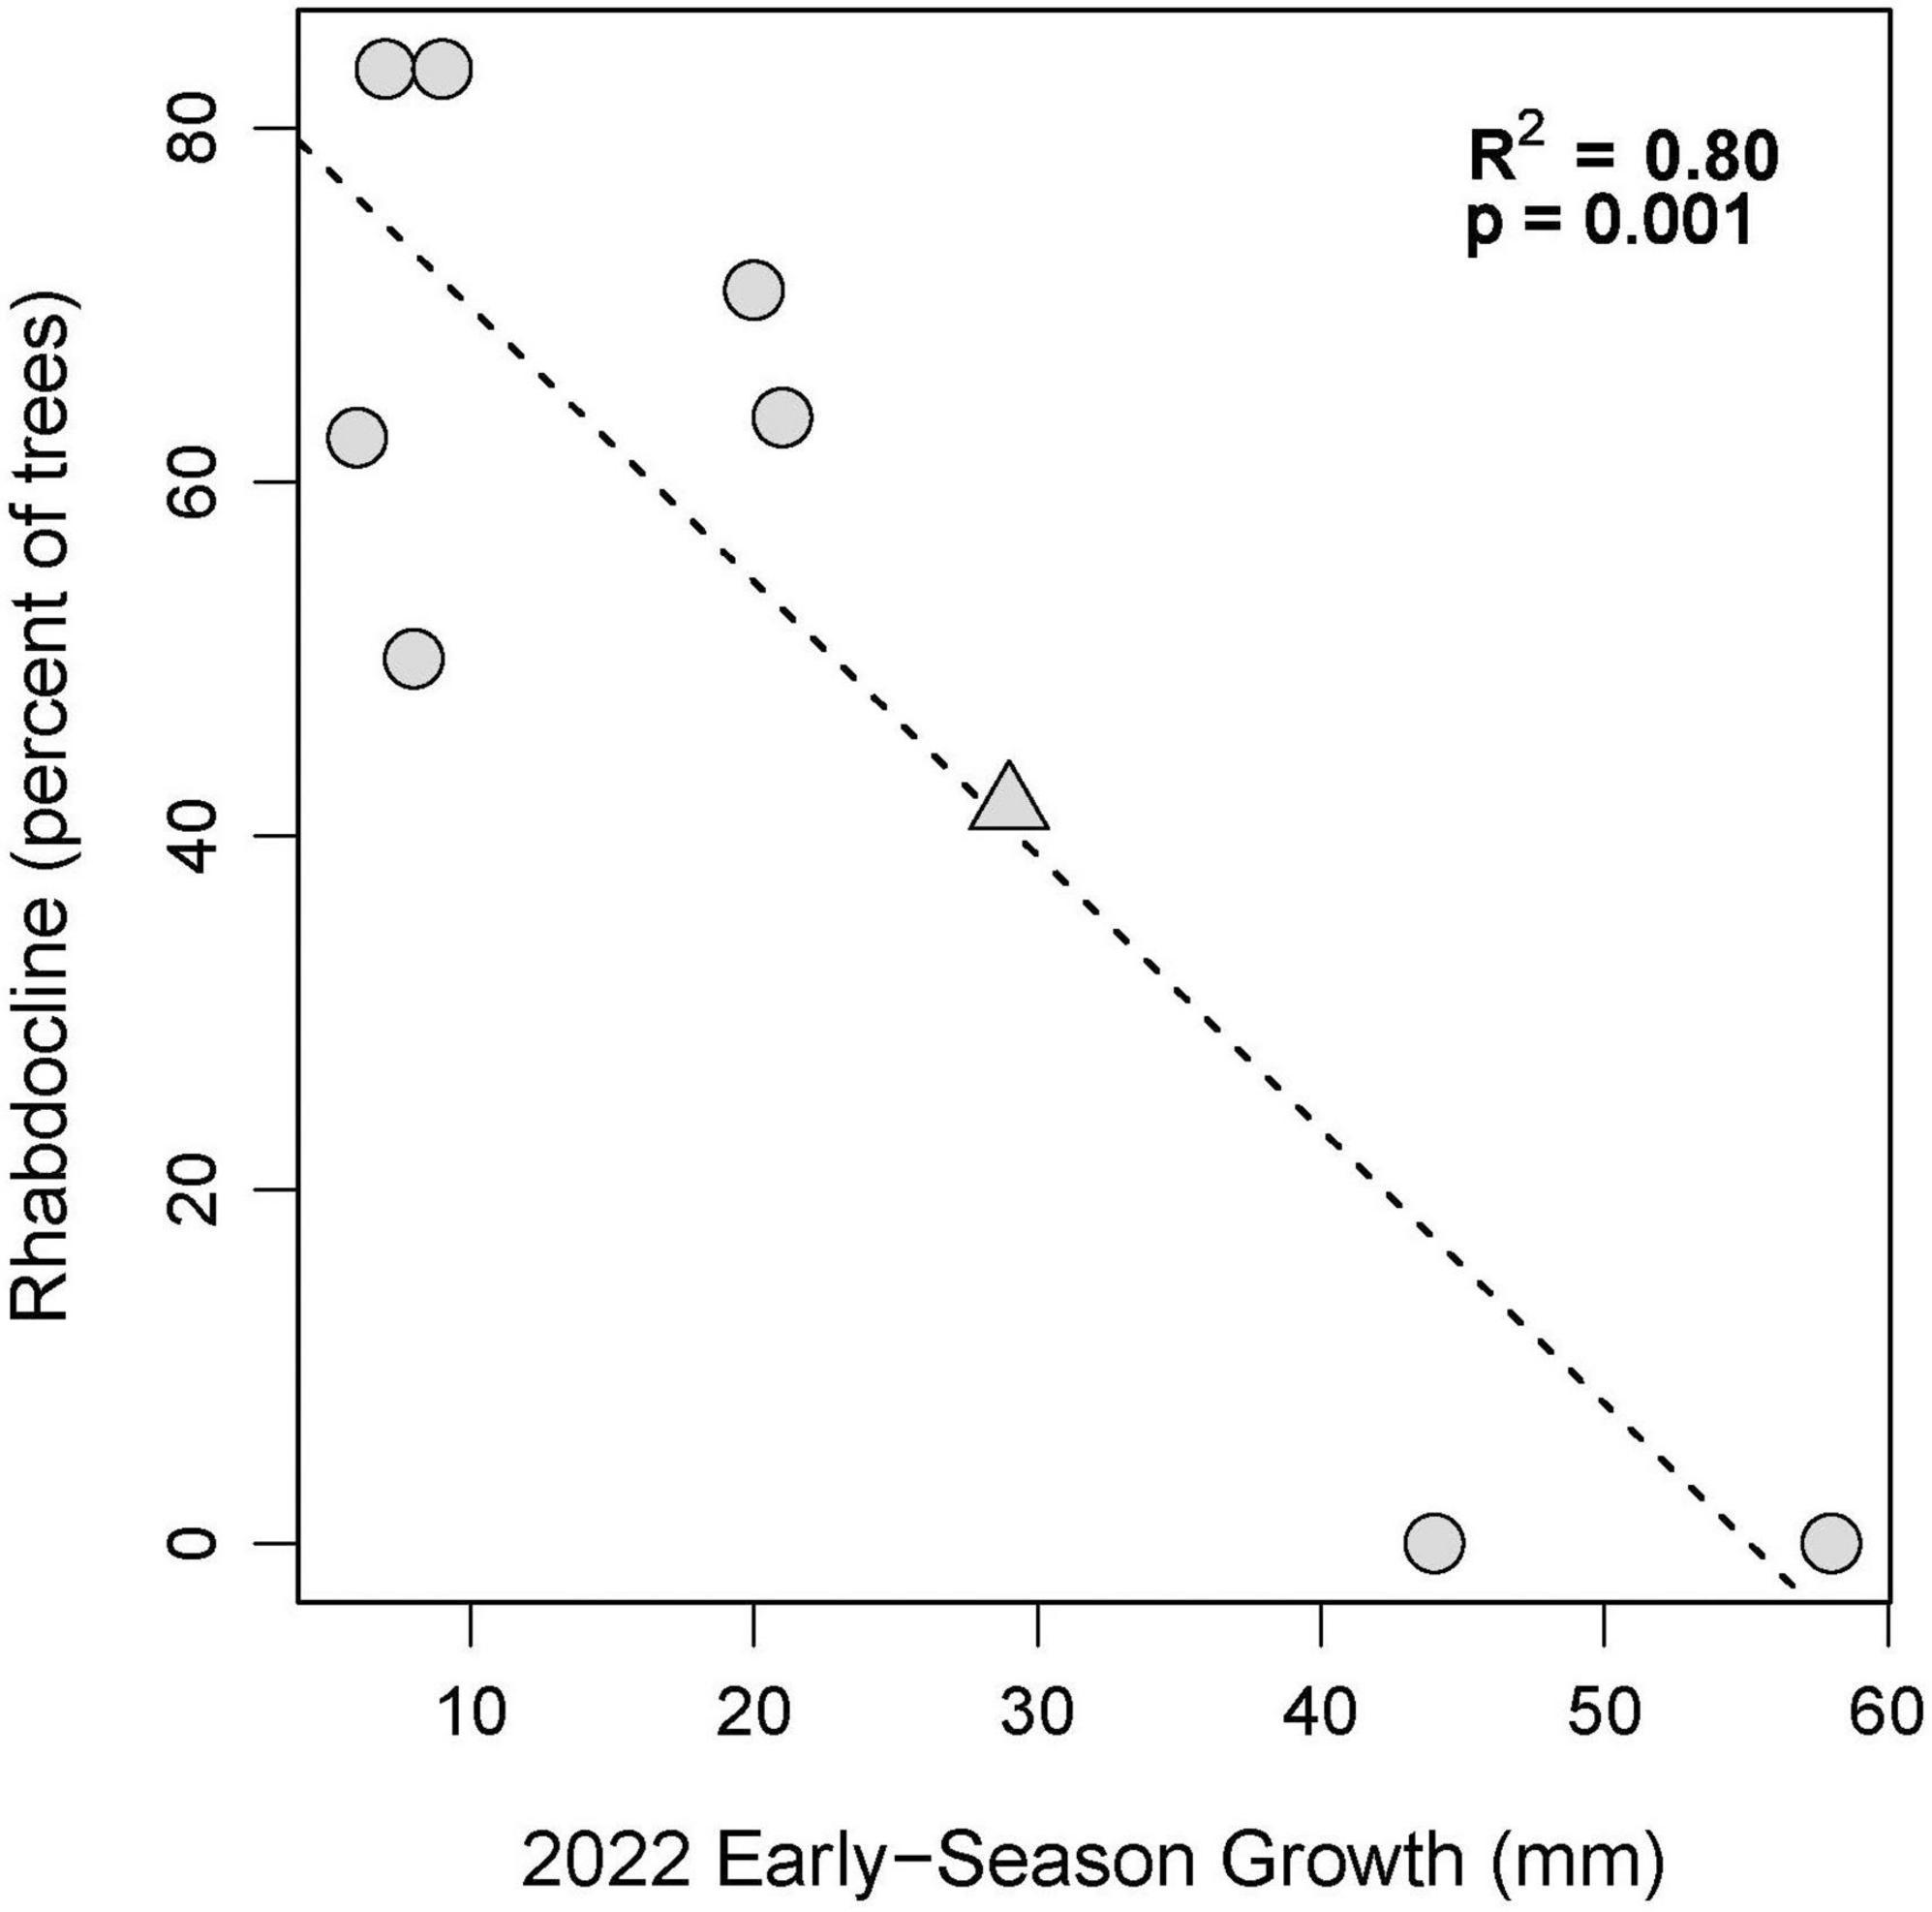
Figure 6. Early season growth (Spring and Early Summer) in 2022 versus the percentage of trees per site coded as having moderate to severe Rhabdocline in 2015 based on surveys by Wilhelmi et al. (2017). The Nortons site is indicated with a triangle.
Planting site and provenance both had significant effects on diameter growth at each of the four growth intervals and site-by-provenance interaction was significant for three of the four growth intervals (Table 4). The F-statistics from analysis of variance show that among-site differences explain the highest proportion of variance in diameter growth in three of the four seasonal intervals (early spring, early summer, and summer-fall). The late spring interval showed a different result with among-provenance differences explaining a greater proportion of variance than site.
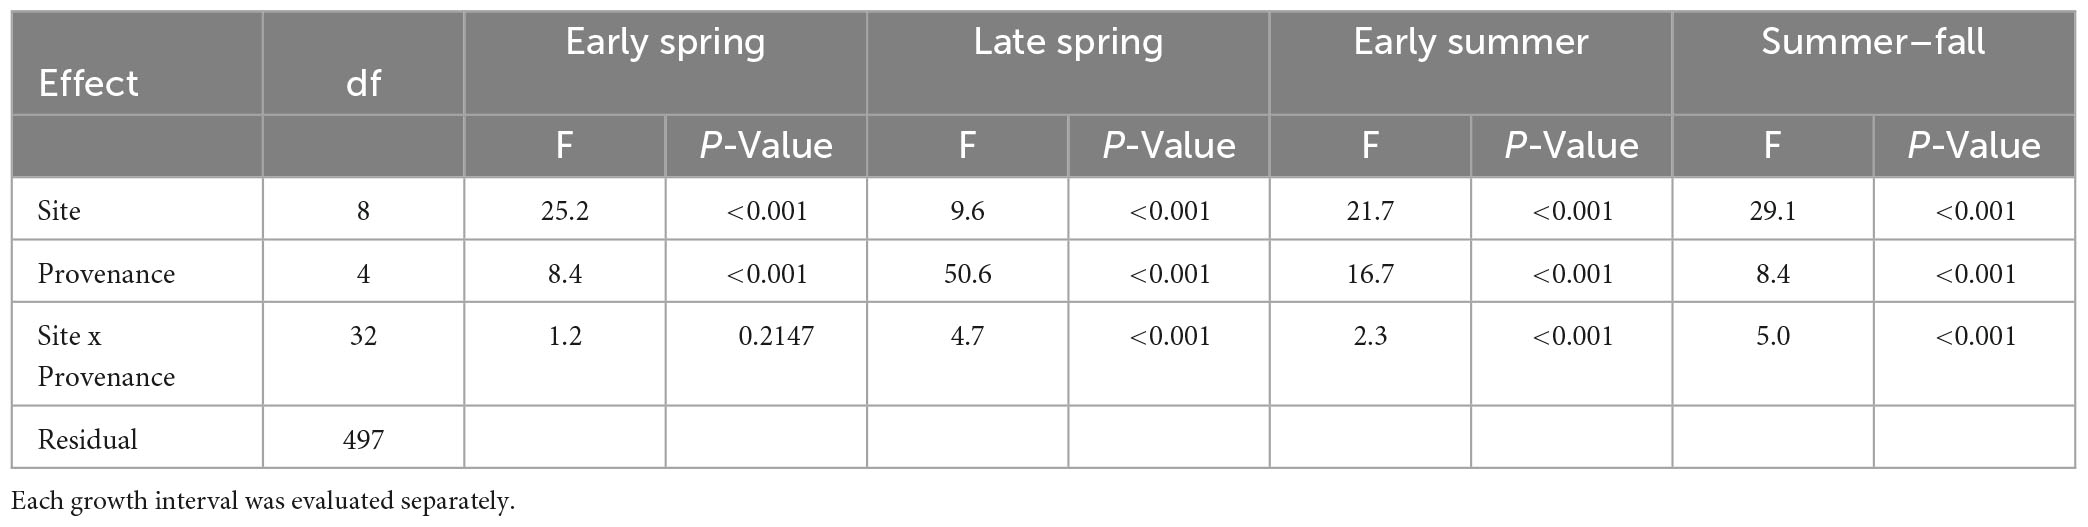
Table 4. Results of analysis of variance on diameter growth rates.
Each of the sites belonged to the “high-growth” group in at least one growth interval, i.e., the group with the significantly highest growth based on the results of means separation (Table 5). The coldest site, Doorstop, had the lowest diameter growth at the initial early spring interval (Figure 3 and Table 5), yet it also displayed some of the highest growth rates of any site at the next two measurement intervals (Figure 4 and Table 5). There were differences in absolute growth rates (Figure 5), for individual growth intervals and for the entire season across seed sources and sites with generally the best growth at the coastal sites (Floras, Nortons, Jammer3) and the low elevation inland Washington site (Buckhorn2). The smallest differences in within-season growth rates across seed sources occurred at the two hottest and driest sites Evans Creek and Stone Nursery) (Figure 5). The Washington Coast provenance was in the highest growth group in each growth interval (Table 6) and was unusual in that it diverged from the “typical” growth response at different times on three of the sites (early in the season at Buckhorn, midway in the season at Stone Nursery, and at the end of the season at Floras, Figure 5). Except for the CASierra and ORSISL provenances at Buckhorn2, trees at the six inland sites had their maximum growth at the second measurement interval (close to the summer solstice) while trees at the three coastal sites had their maximum growth rates at the third growth interval or the growth rates were similar at several growth intervals (Figure 5). Thus, while the inland sites had maximum growth rates in a particular growth interval that were as high or higher than those at the coastal sites, the coastal sites exhibited a longer time period of moderate to high growth rates.
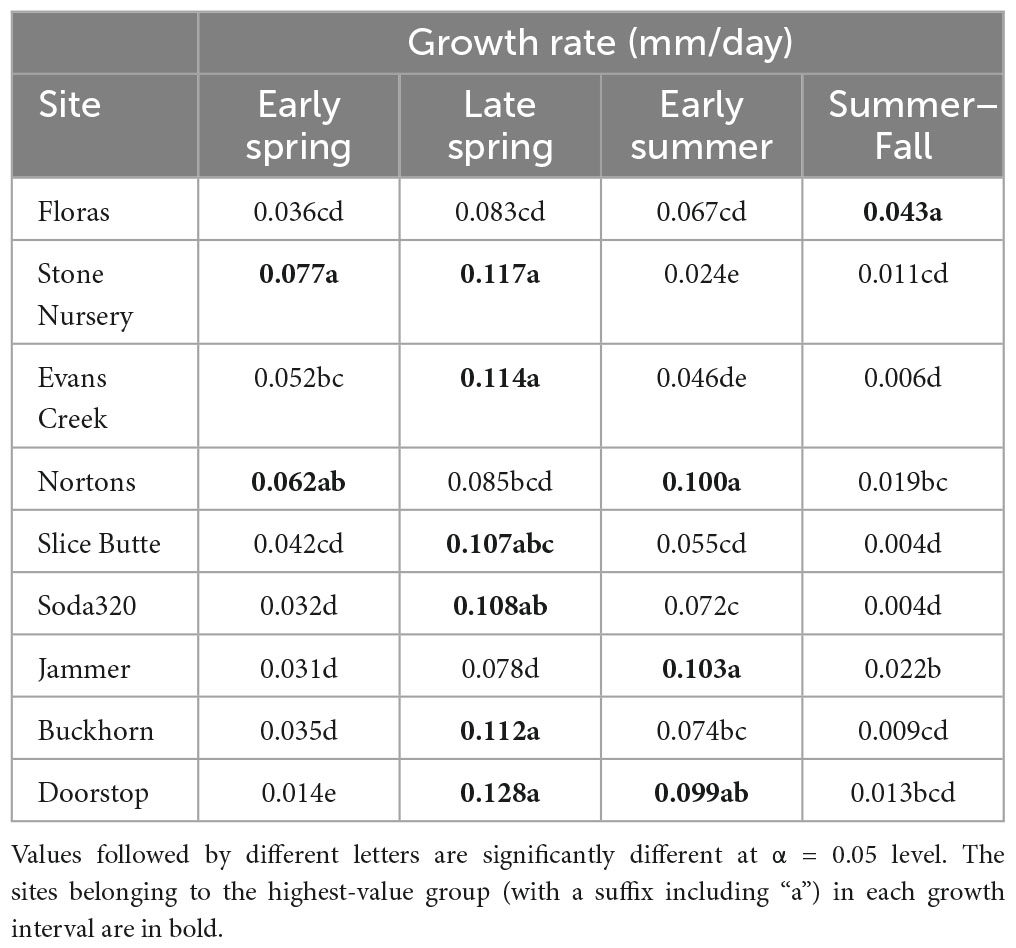
Table 5. Mean daily diameter growth rates at the nine planting sites during each of four growth intervals.
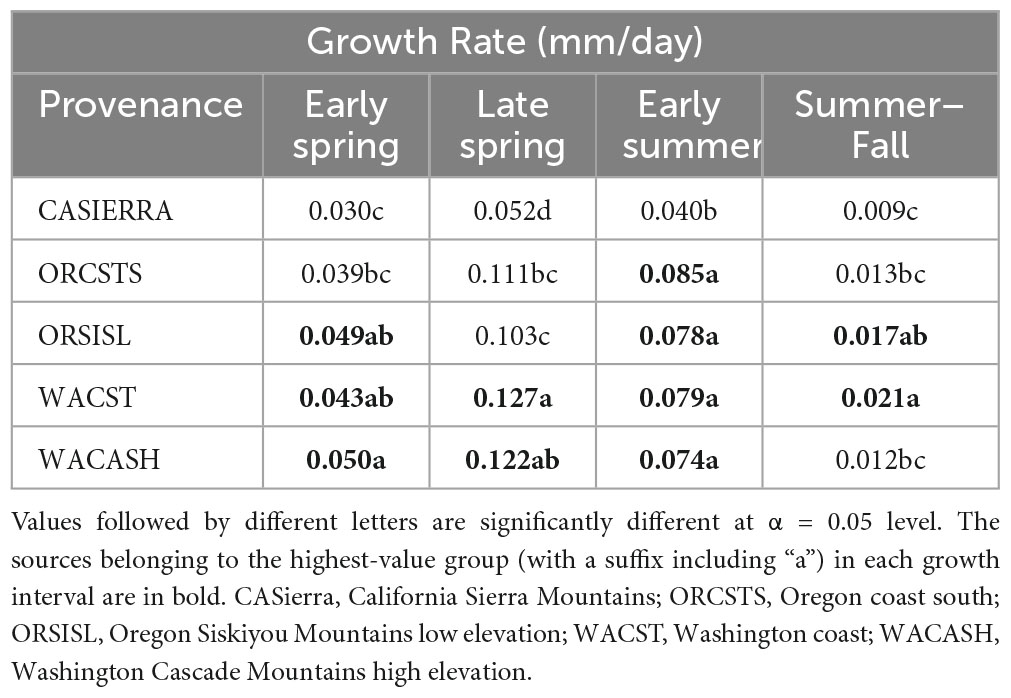
Table 6. Mean daily diameter growth rates for the five provenances during each of four growth intervals.
The five provenances did not all exhibit the same seasonal pattern of diameter growth across the nine sites (Figure 7) but there were common features. The best growth in the first (early spring) interval for all sources was at the Stone Nursery site (Table 5). In general, the provenances had their best growth for the season at the second measurement interval at the inland sites but there were some exceptions. The WACST provenance had its best growth at the inland sites in the second growth interval but in the third or even the fourth growth interval for the coastal sites; it was the only provenance that had the best growth per planting site at more than two growth intervals and also had growth in the highest growth category per time period at all 4 growth intervals (Table 6). The WACASH provenance had the same general pattern across sites during the growing season as WACST except that the best diameter growth for the year was at the 3 coastal sites for WACASH with the growth per site fairly clustered while growth of WACST at Stone Nursery and Slice Butte (both inland sites) separated midsummer (Figure 7). The last measurement interval (summer-fall) tended to have higher growth rates in trees at the three coastal sites (Floras, Nortons, Jammer) than the interior sites and this was most consistent for the ORSISL and WACASH provenances. All the site/provenance combinations had reduced growth during the final measurement interval except the WACST provenance at the Floras site. The two Oregon provenances grew quite differently across the sites during the third growth interval with growth of the ORSISL and ORCSTS provenances increasing at Floras and Jammer between the second and third growth intervals. The CASierra provenance grew poorly at all growth intervals at four of the sites (Floras, Soda 320, Jammer3 and Doorstop) and grew fairly well in comparison to the other sources at the two driest sites (Stone Nursery and Evans Creek) during the first two growth intervals before declining (Figure 5). In contrast to the general pattern of declining or somewhat level growth from the second to the third growth interval, CASierra increased in growth in the third growth interval at the Nortons site.
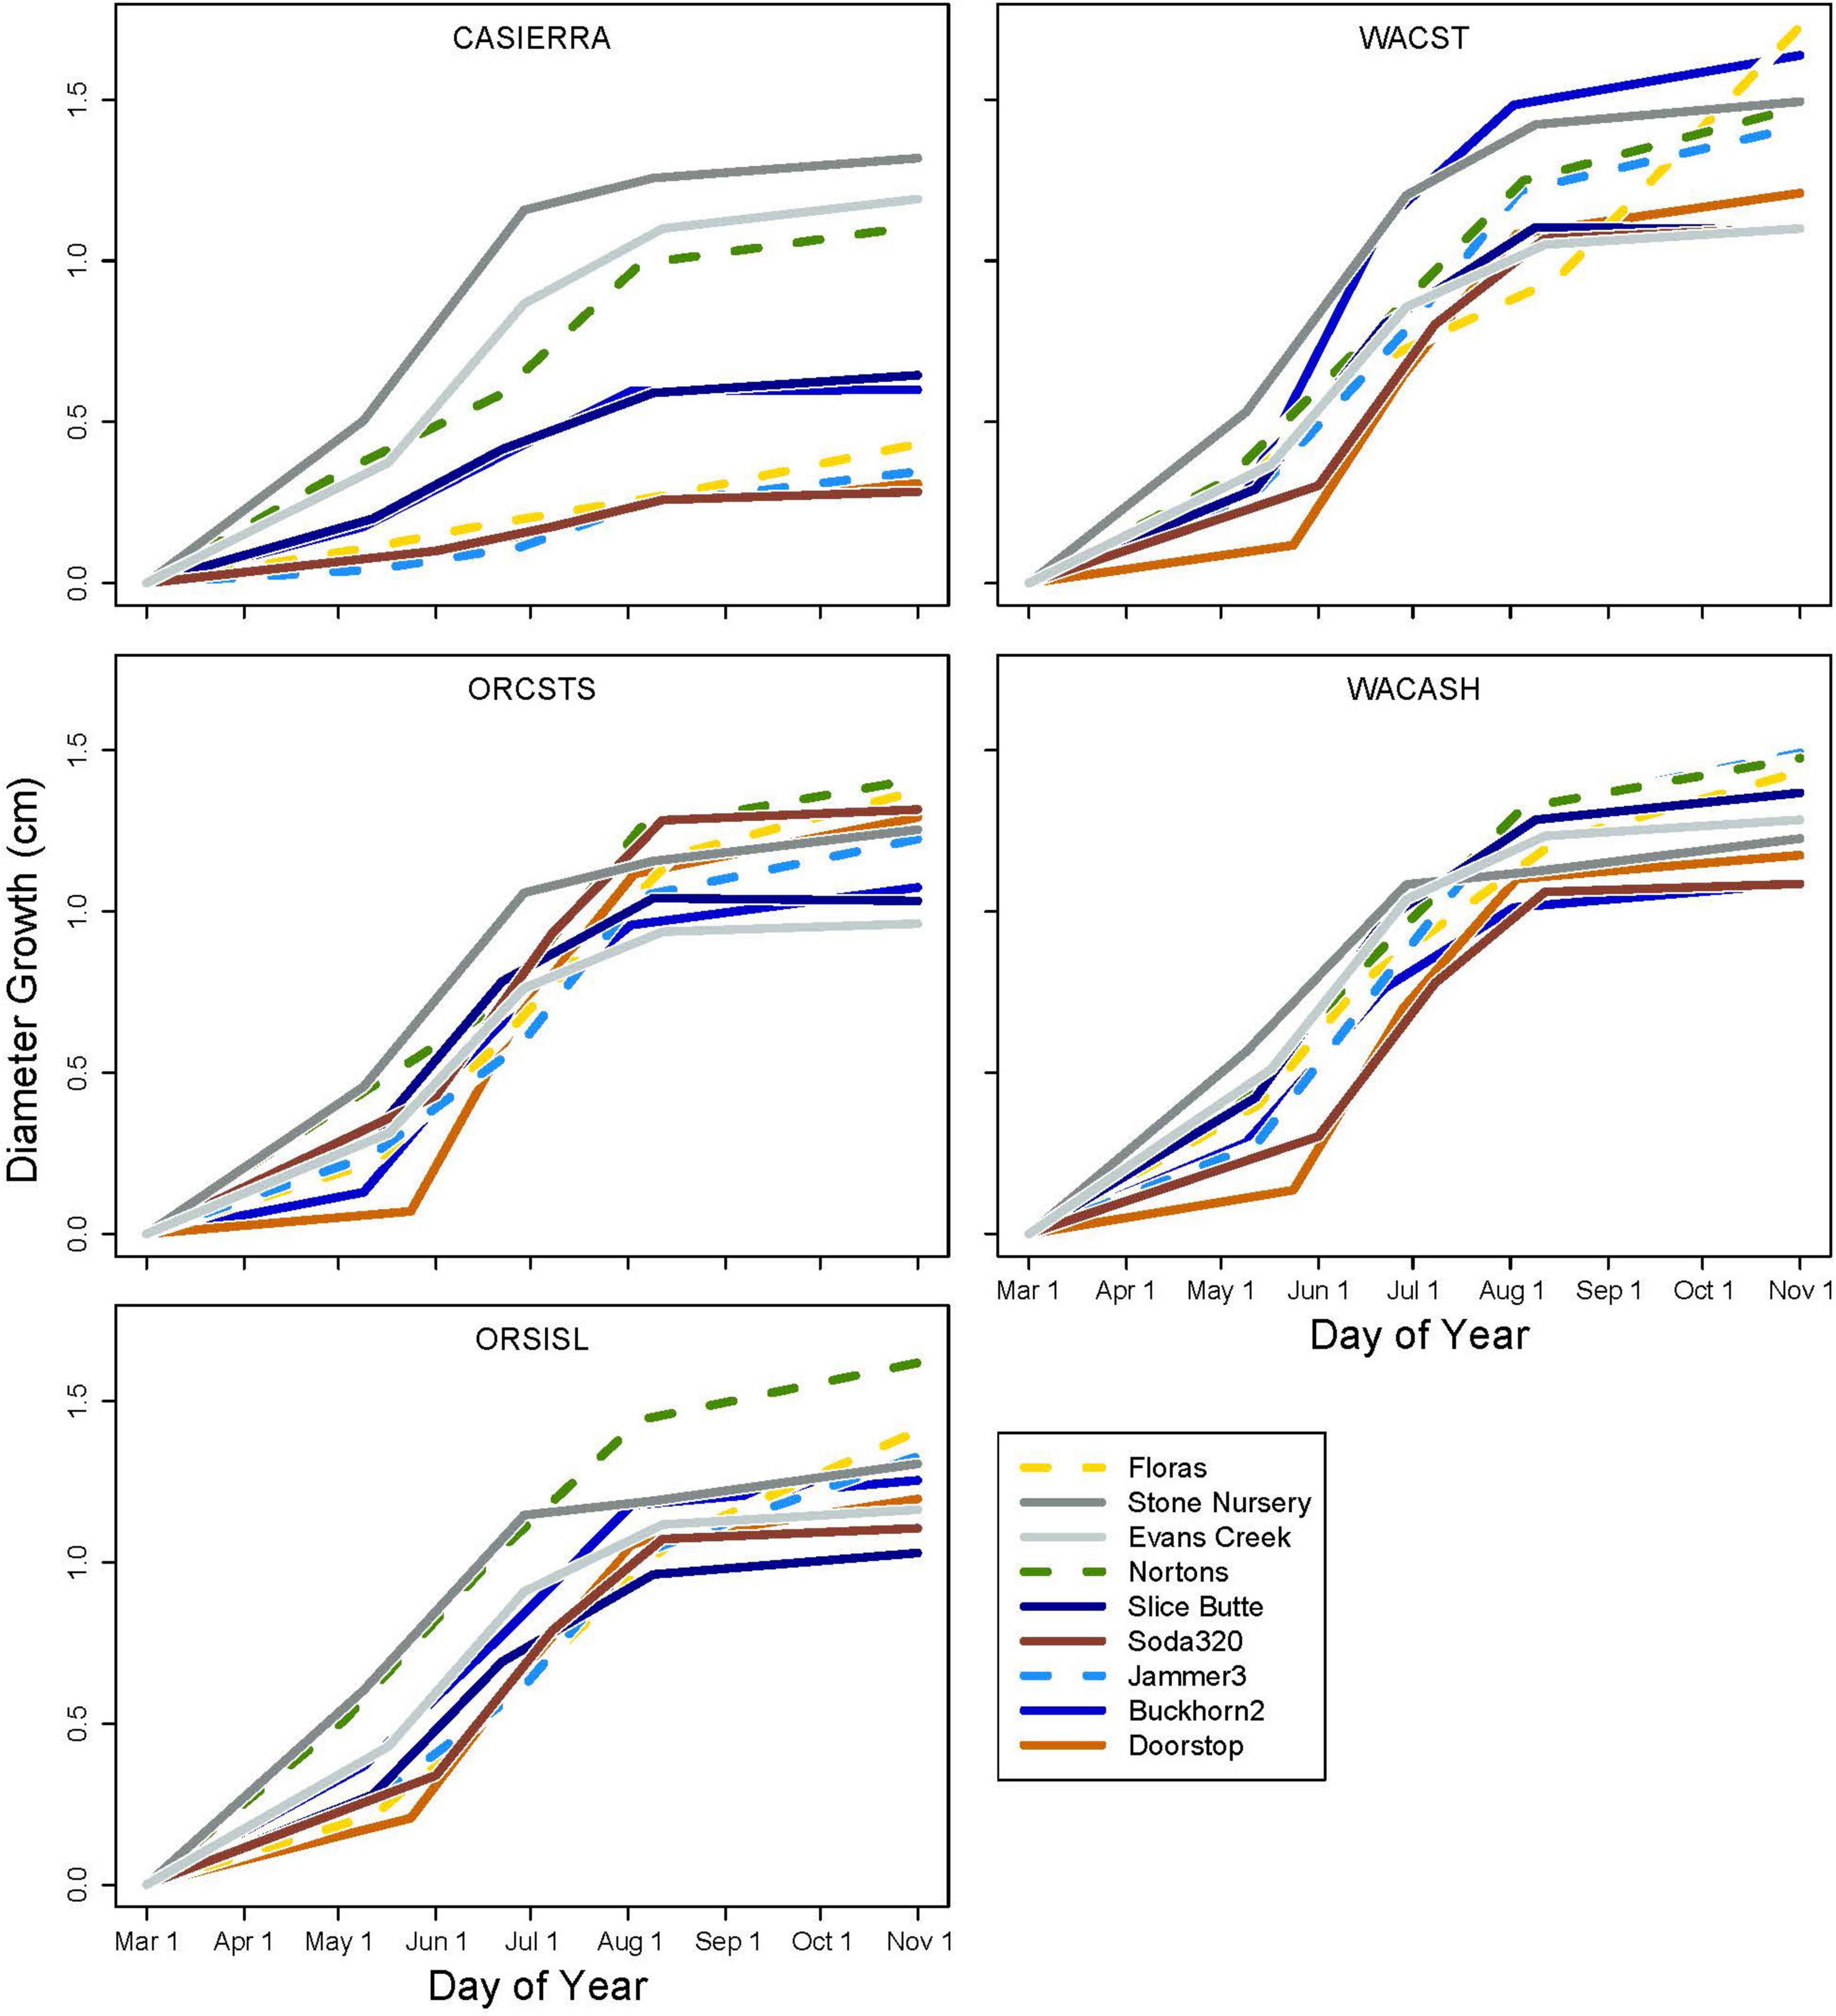
Figure 7. Diameter growth in each growth period for each provenance and planting site. The three coastal sites are shown with dashed lines.
Discussion
We were successful in rapidly deploying a protocol to document the effects of a heat event and using volunteers to assess intra-annual growth of five provenances at multiple sites during the following season. It was especially useful to have all nine sites measured in 2022 to contrast the effects of coastal versus inland sites, as was part of the basic design of the original common garden site network; it would not have been possible to accomplish our objectives without our “citizen science” volunteers.
Our results showed that the heat dome had a significant impact on diameter growth in 2021, and that provenance, site, and the provenance x site interaction were significant factors in diameter growth for the full 2022 growing season. In the 2021 and 2022 field seasons, late-season diameter growth (e.g., from ∼July to October) varied significantly across sites, with the greatest diameter increase observed at the Jammer3 site in coastal Washington (Table 3). Growth at all other sites is significantly lower, and reduced diameter growth at these locations is associated with warmer temperatures and higher aridity, both of which were exacerbated during the 2021 heat dome event. We attribute these differences in growth between 2021 and 2022 to premature growth cessation caused by the 2021 heat dome event. While these differences are significant, it’s important to point out that late-season growth has a minor effect on total annual diameter increment, so the overall impact of premature growth cessation is likely not very strong. We also note the difficulty of identifying a specific environmental factor (or factors) responsible for premature growth cessation, as air temperature, precipitation, and soil moisture are correlated with growing sites in this experiment. We hope to better address this uncertainty and define the range of late-season growth responses by repeating similar mid- and late-season measurements across additional sites and seasons in future years.
Previous models of diameter growth of young Douglas-fir using electronic dendrometers at three sites of the Seed-Source Movement Trial (Ford et al., 2017) indicated that under typical growing conditions, cool temperatures (at high elevations) or short photoperiods (at southerly latitudes) induce fall season diameter growth cessation. In addition, Ford et al. (2017) found that an unusual combination of high temperatures (>42°C for more than 1 day) during long photoperiods (>15 h) near the summer solstice in 2015 resulted in a cessation of diameter growth for the remainder of the season. This 2015 event was similar in severity (but shorter in duration) to the 2021 heat dome event, and it occurred at one of our current study sites (Stone Nursery). Ford et al. (2017) reported that provenances did not show differences in the proportion of trees ceasing diameter growth after the 2015 heat event while provenance was a significant factor in our analyses. Of the effect of the 2021 heat dome.
The 2021 heat dome event provided a test of the Ford et al. (2017) diameter cessation model, and it appears to be supported by this new information. Across the sites evaluated in 2021 and 2022, trees at the Jammer 3 site showed the largest overall late-season diameter growth and the smallest growth reduction relative to 2022. This site did not reach the growth cessation temperature threshold predicted by Ford et al. (2017) (e.g., 1 day at 42°C), and it accumulated additional late-season diameter growth as predicted. It’s important to note that the high air temperature at Jammer may have been ameliorated by the 10.3 cm of precipitation during June 2021, as higher soil moisture (Table 3) can enable evapotranspiration and foliar cooling (Wiegand and Namken, 1966; Taiz et al., 2022). The Buckhorn2 site exceeded the threshold temperature for growth cessation on 1 day, and it showed a significant deficit in annual diameter growth relative to the 2022 season The Buckhorn2 site had similar soil moisture to the Jammer3 site, adding evidence that high threshold air temperature or vapor pressure deficit (rather than soil water availability) is a trigger for premature growth cessation. The Stone Nursery and Evans Creek sites each exceeded the threshold temperature for growth cessation on two consecutive days, and these sites showed the largest diameter growth deficits relative to 2022 values, adding less than 0.1 cm diameter growth in the late season. These sites had substantially lower soil moisture than the Jammer3 or Buckhorn2 sites, which likely amplified the diameter growth cessation response.
Many European tree species experienced stem shrinkage but not growth reductions after the late July 2018 heat wave (Salomón et al., 2022); the authors suggest most trees were no longer actively growing that late in the season. The 2021 Pacific Northwest heat event appears to have reduced diameter growth in Douglas-fir, and the magnitude of the reduction in growth varies in a manner that corresponds to the duration of exposure to high temperatures (e.g., >42°C). Near-complete diameter cessation occurred in specific site-source combinations that experienced the greatest heat (Evans Creek, Stone Nursery), although trees at these sites may have been near the end of their typical growing season, given the seasonally limited soil water at these sites. We observed that growth at coastal sites was more uniform across the growth periods than at interior sites. This is consistent with the observation by Cregg et al. (1988) that cambial growth of Pinus taeda was fairly constant across the season if soil moisture deficits did not develop.
The effect of drought or a heat wave is likely to vary based on species, genotype, and time during the growing season. Drought in central Europe in 2015 had a surprisingly small overall effect on annual growth of Picea abies (Martínez-Sancho et al., 2022) as stem growth increased following drought due to the utilization of non-structural carbohydrates (i.e., photosynthesis and stem growth were decoupled, Anderson-Teixeira and Kannenberg, 2022). Salomón et al. (2022) suggested that only early season drought is likely to impact current year growth, while drought or heat later in the season may reduce wood density due to changes in the formation, filling, and lignification of secondary cell walls. If early season heat or drought limits the amount or proportion of latewood produced this could result in a detrimental carry over effect as latewood with small lumen size plays a critical role in limiting embolism in the xylem and maintaining water conductance under hot and dry conditions (Domec and Gartner, 2002); that is, narrow latewood bands associated with one or more stress years could impact growth or survival in future years. Genotypes that are adapted to relatively dry growing seasons may be less susceptible to damage from droughts but also exhibit slower growth, even under favorable conditions (Vargas-Hernandez and Adams, 1994). Thus, it would be of value to determine the effects of the timing and severity of heat and drought events on production of latewood or specific wood anatomical characteristics by different genotypes, especially given the potential for cumulative effects of multiple (and contrasting) heat events on these sites in 2015 and 2021. Vascular growth is strongly regulated by hormone synthesis and transport and much needs to be learned as to how these factors are impacted by climatic extremes during different stages of vascular cell division, expansion, and cell wall formation (Buttò et al., 2020). Presumably differences in phenology in different genotypes would result in different hormone levels and impact the resulting number of cells and characteristics during the various stages of vascular growth.
The poor growth performance of trees from the California Sierra (CASierra) provenance on moist/cool sites appears to be associated with the presence of Rhabdocline needle cast disease on those sites (Wilhelmi et al., 2017). The foliar disease Swiss needle cast (SNC) was also present at moist/cool sites, but the high susceptibility of this provenance to Rhabdocline masked symptoms of SNC infections, making it difficult to assess SNC infection rates in this source. Rhabdocline disease results in chlorotic, splotched foliage and substantial loss of foliage older than the current year (Stone, 1997). Given the general susceptibility of the CASierra provenance to Rhabdocline, we were surprised at how well it performed at the coastal Nortons site (and Buckhorn2, to a lesser degree). Rhabdocline releases ascospores in the late spring and early summer, coinciding with Douglas-fir budburst and shoot elongation. Ascospores infect the new growth and symptoms progress through the growing season, and infected needles are usually cast the following spring or summer. This results in reduced foliage area to support diameter growth (Kurkela, 1981). Basic climate information (Table 1) shows that the Nortons site has extended periods of late spring needle moisture and cool temperature, and these conditions should favor Rhabdocline dispersal and infection. Interestingly, Rhabdocline infection levels were lower at Nortons in a 2015 survey, and foliage loss was less severe than at other cool/moist sites (Wilhelmi et al., 2017). Thus, it is not obvious based on climate information why Rhabdocline infection levels were lower at Nortons than at the other moist sites but the lower infection levels may explain why the CASierra trees grew better on this site than at the other moist sites.
It has been shown with branches from a healthy 10-year-old Douglas-fir plantation in western Washington State that photosynthate from current year needles primarily is translocated to expanding new foliage and transport to the stem occurs from older needles (Ross, 1972). Based on this information we would expect that trees with almost no older needles, such as those with severe needle cast disease, would not support measurable diameter growth. However, relative source-sink relationships can vary with changes in conditions. For example, translocation of photosynthate can be altered or even reversed by girdling or defoliation (Mason and Maskell, 1928; Münch, 1930). In addition, photosynthetic rates can increase in non-shaded needles when a portion of the crown is shaded (Whitehead et al., 1996). Thus, we could speculate that photosynthetic rates could be increased in current year foliage when older foliage is damaged and that the changes in source-sink relationships could result in photosynthate being transferred to the cambium early in the growing season to support diameter growth when some physiological conditions exist. In addition, source-sink relationships (CO2 and wood production) can be decoupled at time scales ranging from a few hours to months or years (Anderson-Teixeira and Kannenberg, 2022); thus, under some circumstances, not completely understood, growth may be higher than anticipated given the stress factors present as a particular time.
Initiation of cambial growth in Douglas-fir does not have an obligate chilling requirement; however, initiation of growth is enhanced by accumulation of chilling hours (Harrington et al., 2010; Ford et al., 2016). The Stone Nursery site experiences winter conditions cold enough to accumulate substantial chilling, but also accumulates heat units rapidly in the spring; thus, it is not surprising that all the provenances generally grew well at this site in the initial growth interval (Table 5) and that it showed the highest absolute growth rate for the early growth interval of any of our test sites. Cambial initiation has been shown to be synchronous within populations but to differ across three sites (400–1,200 m elevation) for Picea abies (Gričar et al., 2014) and to be synchronized in the mountains but more variable in the lowlands for Pseudotsuga menziesii (Emmingham, 1977); initiation was synchronized across Pinus taeda families within 1 year but started 1–2 weeks later the following year (Emhart et al., 2006). The range in date of diameter growth initiation at a particular site was only a few days for Pseudotsuga menziesii seed sources as measured using electronic dendrometers as opposed to several weeks for date of budburst (Gould et al., 2012).
Tree growth rates have been shown to peak near the time of the summer solstice in other studies (Emmingham, 1977; Dow et al., 2022). Although our measurements were not detailed enough to test the concept that photoperiod or change in photoperiod impact cambial growth rates, we did observe that growth rates appeared to peak in early to mid-summer for our inland sites, but growth rates were much more similar across the coastal sites with two or even three growth periods having similar growth rates during the season. Thus, as suggested by Cregg et al. (1988), the ability to continue diameter growth during the summer in temperate regions may be mostly limited by soil moisture deficits as opposed to declining photoperiod or temperature.
Neither of the null hypotheses related to diameter growth patterns across sites or seed provenances that we tested were supported, as indicated by significant effects of site, provenance, and their interactions in analysis of variance. The differences in growth patterns by provenances across sites is interesting and indicates that it may be difficult to predict growth rates under novel climates for provenances even if we have specific information from planting sites but not about growth rates of specific seed sources under varying environmental conditions. For example, moving the inland provenances WACASH or ORSISL to coastal climates resulted in surprisingly good growth rates in the third growth interval (early summer) on these milder sites. These provenances may be able to continue to grow in diameter into the summer-fall season if soil moisture and temperature are permissive. Differences in seasonal variation in basal area increment for five southern pine families was primarily limited to short time periods in the spring and fall but these differences added up to result in larger stem sizes over multiple years (Emhart et al., 2006). The differences in growth patterns across the season may indicate that growth rates in the future may depend on how individual provenances respond to several different environmental factors. Some sources may be more strongly influenced by some environmental factors, such photoperiod, soil moisture, or air temperature, than others. Having several diverse sites and multiple seed sources should help researchers tease out the important factors associated with control of diameter growth and future growth and survival. In addition, having growth at several intervals during the growing season as opposed to having only annual growth rates may allow better understanding and prediction of how specific genotypes may respond to novel climates. Although assisted migration recommendations for seed lots and planting sites usually strive to optimize the climatic “match” of contemporary and future climates (e.g., using temperature and aridity; St. Clair et al., 2022), the good growth rates of WACASH and WACST when moved to more southerly sites (Figure 5) shows a wide range of genotypes should be considered for future trials. These results also show that across the latitudes used in our study sites (42°N to 47°N), photoperiod appears unlikely to be an important factor in diameter growth.
Previous reports have criticized the use of dendrometer bands (and manual measurements) as not separating differences in vascular cambial growth from that of phloem and bark and not accounting for changes in water content of stems (c.f., Callado et al., 2013); they suggested more information on cambial growth could be gained from histological studies which may help in understanding the factors important in cambial growth. However, histological studies involve stem wounding, which may not be suitable to research sites with relatively few trees per genotype and studies that involve repeated wounding are generally limited to stems larger than 20 cm. In addition, histological studies are time intensive and require anatomical knowledge and access to laboratory equipment such as high-power microscopes to interpret the resulting slides. Our use of repeated measurements with a diameter tape does not permit detailed information on cambial initiation or cessation or on anatomical characteristics but with our relatively fast-growing species it allowed us to sample several genotypes at multiple locations in a way that we would not have been able to afford using a histological approach. Others have also used repeated measurement of trees (Emhart et al., 2006) and tree coring to look at variables such as total year and latewood growth over multiple years (Ivkovich et al., 2002).
Electronic dendrometry is preferable to manual measurements for revealing fine details of cambial phenology (Zweifel et al., 2021) and their relationship to site environmental measurements (c.f., Etzold et al., 2021). The recent availability of lower cost dendrometers will expand the opportunity to gather fine-grained data and test hypotheses on cambial growth. Nevertheless, we show that careful manual measurements can be used to answer general questions of diameter growth phenology when working with a fast-growing species such as P. menziesii. In addition, manual measurements by trained and motivated volunteers enables data collection at a large numerical and geographic scale, and at a far lower cost than electronic dendrometers. Several reports have suggested that tying periodic growth measurements to environmental factors is best done with long-term monitoring (Callado et al., 2013; Pumijumnong and Buajan, 2013) to better understand cambial phenology under a broader range of conditions. We obtained partial year data following a heat event and additional data the subsequent year, and these results allow us to observe how moving genotypes to different environments alters cambial phenology. Long-term observations with diverse approaches (microscopy; electronic dendrometry; manual dendrometry) would enable the clearest understanding of how genotype and environment interact to result in cambial growth, and how cambial phenology will change under the novel environmental conditions that are likely occur with global climate change.
Data availability statement
The datasets presented in this study can be found in online repositories. The names of the repository/repositories and accession number(s) can be found below: The raw data used in this analysis has been submitted to the TreeGenes database (https://treegenesdb.org/).
Author contributions
CH designed and oversaw the study with assistance from RC. PG and RC performed analyses and prepared the figures. All authors contributed to manuscript preparation.
Funding
Funding for study implementation was provided by the USDA Forest Service, Pacific Northwest Research Station and the USDI Washington-Oregon Bureau of Land Management.
Acknowledgments
We thank the current landowners who host the sites for the Douglas-fir Seed Source Movement Trial: Cascade Timber Consulting, Giustina Land and Timber, Long Rock Timber Company, Manulife Investment Management, Port Blakely, Roseburg Forest Products, Starker Forests, USDA Forest Service, and Washington Department of Natural Resources. Special thanks to our volunteers and coworkers for their measurements: Lysbeth Ackerman, Mike Backen, Cassie Berg, Leslie Brodie, William Carlson, Florian Deisenhofer, Darian Domes, Cary Hart, Scott Kolpak, Sara Lipow, Josh Meek, Stuart Olshevski, Hunter Olson, Fred Pfund, and J. B. St. Clair and to Nicholas Wilhelmi for preparing Figure 1 and for reviewing an early draft of the manuscript. We also thank the reviewers for their many helpful comments which improved the manuscript.
Conflict of interest
PG was employed by Mason, Bruce and Girard, Inc.
The remaining authors declare that the research was conducted in the absence of any commercial or financial relationships that could be construed as a potential conflict of interest.
The handling editor RM is currently organizing a Research Topic with one of the authors CH.
Publisher’s note
All claims expressed in this article are solely those of the authors and do not necessarily represent those of their affiliated organizations, or those of the publisher, the editors and the reviewers. Any product that may be evaluated in this article, or claim that may be made by its manufacturer, is not guaranteed or endorsed by the publisher.
Supplementary material
The Supplementary Material for this article can be found online at: https://www.frontiersin.org/articles/10.3389/ffgc.2023.1173707/full#supplementary-material
References
Anderson-Teixeira, K. J., and Kannenberg, S. A. (2022). What drives forest carbon storage? The ramifications of source-sink decoupling. New Phytol. 236, 5–8. doi: 10.1111/nph.18415
Bates, D., Mächler, M., Bolker, B., and Walker, S. (2015). Fitting linear mixed-effects models using lme4. J. Stat. Softw. 67, 1–48. doi: 10.18637/jss.v067.i01
Buttò, V., Deslauriers, A., Rossi, S., Rozenberg, P., Shishov, V., and Morin, H. (2020). The role of plant hormones in tree-ring formation. Trees 34, 315–335. doi: 10.1007/s00468-019-01940-4
Callado, C. H., Roig, F. A., Tomazello-Filho, M., and Barros, C. F. (2013). Cambial growth periodicity studies of South American woody species–a review. IAWA J. 34, 213–230. doi: 10.1163/22941932-00000019
Cregg, B. M., Dougherty, P. M., and Hennessey, T. C. (1988). Growth and wood quality of young loblolly pine trees in relation to stand density and climate factors. Can. J. For. Res. 18, 851–858. doi: 10.1139/x88-131
Curtis, R. O., DeBell, D. S., Miller, R. E., Newton, M., St. Clair, J. B., and Stein, W. I (2007). Silviculture research and the evolution of forest practices in the Douglas-fir region. PNW-GTR-696. Portland, OR: USDA Forest Service Pacific Northwest Research Station.
de Mendiburu, F. (2021). agricolae: Statistical procedures for agricultural research. R package version 1.3-5. Available online at: https://CRAN.R-project.org/package=agricolae (accessed June 6, 2021).
Domec, J. C., and Gartner, B. L. (2002). How do water transport and water storage differ in coniferous earlywood and latewood? J. Exp. Bot. 53, 2369–2379. doi: 10.1093/jxb/erf100
Dow, C., Kim, A. Y., D’Orangeville, L., Gonzalez-Akre, E. B., Helcoski, R., Herrmann, V., et al. (2022). Warm springs alter timing but not total growth of temperate deciduous trees. Nature 608, 552–557. doi: 10.1038/s41586-022-05092-3
Emhart, V. I., Martin, T. A., White, T. L., and Huber, D. A. (2006). Genetic variation in basal area increment phenology and its correlation with growth rate in loblolly and slash pine families and clone. Can. J. For. Res. 36, 961–971. doi: 10.1139/x05-309
Emmingham, W. E. (1977). Comparison of selected Douglas-fir seed sources for cambial and leader growth patterns in four western Oregon environments. Can. J. For. Res. 7, 154–164. doi: 10.1039/x77-022
Etzold, S., Sterck, F., Bose, A. K., Braun, S., Buchmann, N., Eugster, W., et al. (2021). Number of growth days and not length of the growth period determines radial stem growth of temperate trees. Ecol. Lett. 25, 427–439. doi: 10.1111/ele.13933
Fischer, U., Kucukoglu, M., Helariutta, Y., and Bhalerao, R. P. (2019). The dynamics of cambial cell activity. Annu. Rev. Plant Biol. 70, 293–319. doi: 10.1146/annure-arplant-050718-100402
Ford, K. R., Harrington, C. A., and St. Clair, J. B. (2016). Photoperiod cues and pattern of genetic variation limit phenological responses to climate change in warm parts of the species’ range: Modeling diameter-growth cessation in coast Douglas-fir. Glob. Chang. Biol. 22, 3712–3723. doi: 10.1111/gcb.13690
Ford, K. R., Harrington, C. A., Bansal, S., Gould, P. G., and St. Clair, J. B. (2017). Will changes in phenology track climate change? A study of growth initiation timing on coast Douglas-fir. Glob. Chang. Biol. 23, 3348–3362. doi: 10.1111/gcb.13328
Goheen, E. M., and Willhite, E. A. (2021). Field guide to common diseases and insect pests of Oregon and Washington conifers. R6-FHP-RO-2021-01. Portland OR: For. Serv. PNW Region.
Gould, P. J., Harrington, C. A., and St. Clair, J. B. (2010). Incorporating genetic variation into a model of budburst phenology of coast Douglas-fir (Pseudotsuga menziesii var. menziesii). Can. J. For. Res. 41, 139–150. doi: 10.1139/X10-191
Gould, P. J., Harrington, C. A., and St. Clair, J. B. (2012). Growth phenology of coast Douglas-fir seed sources planted in diverse environments. Tree Phys. 32, 1482–1496. doi: 10.1093/treephys/tps106
Gričar, J., Prislan, P., Gryc, H., de Lusi, M., and Čufar, K. (2014). Plastic and locally adapted phenology in cambial seasonality and production of xylem and phloem cells in Picea abies from temperate environments. Tree Phys. 34, 869–881. doi: 10.1093/treephys/tpu026
Harrington, C. A., Ford, K. R., and St. Clair, J. B. (2016). Phenology of Pacific Northwest tree species. Tree Plant Notes 59, 76–85.
Harrington, C. A., Gould, P. G., and St. Clair, J. B. (2010). Modeling the effects of winter environment on dormancy release of Douglas-fir. For. Ecol. Manag. 259, 798–808. doi: 10.1016/j.foreco.2009.06.018
Intrigliolo, D. S., and Castel, J. R. (2005). Effects of regulated deficit irrigation on growth and yield of young Japanese plum trees. Hort.Sci Biotech. 80, 177–182. doi: 10.1080/14620316.2005.11511913
IPCC (2021). Climate Change 2021: The physical science basis. Contribution of working group I to the sixth assessment report of the intergovernmental panel on climate change, eds V. Masson-Delmotte, A. Zhai, S. L. Pirani, C. Connors, S. Péan, N. Berger, et al. (Cambridge: Cambridge University Press), doi: 10.1017/9781009157896
Ivkovich, M., Namkoong, G., and Koshy, M. (2002). Genetic variation in wood properties of interior spruce. I. Growth, latewood percentage, and wood density. Can. J. For. Res. 32, 2116–2127. doi: 10.1139/X02-138
Kramer, P. J., and Kozlowski, T. T. (1979). Physiology of woody plants. New York, NY: Academic Press.
Kurkela, T. (1981). Growth reduction in Douglas fir caused by Rhabdocline needle cast. Commun. Inst. For. Fenn. 102, 1–16.
Lassoie, J. P. (1973). Diurnal dimensional fluctuations in a Douglas-fir stem in response to tree water status. For. Sci. 19, 251–255.
Lavender, D. P., and Hermann, R. K. (2014). Douglas-fir: The genus Pseudotsuga. Corvallis, OR: Oregon Forest Research Laboratory, Oregon State University.
Li, P., and Adams, W. T. (1994). Genetic variation in cambial phenology of coastal Douglas-fir. Can. J. For. Res. 24, 1864–1870. doi: 10.1139/x94-240
Martínez-Sancho, E., Treydte, K., Lehrmann, M. M., Rigling, A., and Fonti, P. (2022). Drought impacts on tree carbon sequestration and water use–evidence from intra-annual tree-ring characteristics. New Phytol. 236, 58–70. doi: 10.1111/nph.18224
Mason, T. G., and Maskell, E. J. (1928). Studies on the transport of carbohydrates in the cotton plant. II. The factors determining the rate and movement of sugars. Can. J. Bot. 42, 571–636. doi: 10.1093/oxfordjournals.aob.a090131
Neter, J., Kutner, M. H., Nachtsheim, C. J., and Wasserman, W. (1996). Applied linear statistical models, 4th Edn. New York, NY: WCB McGraw-Hill.
Pumijumnong, N., and Buajan, S. (2013). Seasonal cambial activity of five tropical tree species in central Thailand. Trees 27, 409–417. doi: 10.1007/s00468-012-0794-4
R Core Team (2021). R: A language and environment for statistical computing. Vienna: R Foundation for Statistical Computing.
Ross, S. D. (1972). The seasonal and diurnal source-sink relationships for photoassimilated 14C in the Douglas-fir branch. dissertation. Seattle, WA: University of Washington.
Salomón, R. L., Peters, R. L., Zweifel, R., Sass-Klaassen, U. G. W., Stegehuis, A. I., Smiljanic, M., et al. (2022). The 2018 European heat wave led to stem dehydration but not to consistent growth reductions in forests. Nat. Comm. 13:28. doi: 10.1038/s41467-021-27579-9
Soil Survey Staff (1975). Soil taxonomy. A basic system of soil classification for making and interpreting soil surveys. Agricultural handbook 436. Washington, DC: U.S. Department of Agriculture.
St. Clair, J. B., Mandel, N. L., and Vance-Borland, K. W. (2005). Genecology of Douglas-fir in Washington and Oregon. Ann. Bot. 96, 1199–1214. doi: 10.1093/aob/mci278
St. Clair, J. B., Richardson, B. A., Stevenson-Molnar, N., Howe, G. T., Bower, A. D., Erickson, V. J., et al. (2022). Seedlot selection tool and climate-smart restoration tool: Web-based tools for sourcing sed adapted to future climates. Ecosphere 13:e4089. doi: 10.1002/ecs2.4089
Still, C. J., Sibley, A., DePinte, D., Busby, P. E., Harrington, C. A., Schulze, M., et al. (2023). Causes of widespread foliar damage from the June 2021 Pacific Northwest Heat Dome: More heat than drought. Tree Phys. 43, 203–209. doi: 10.1093/treephys/tpac143
Stone, J. (1997). “Rhabdocline needle cast,” in Compendium of conifer diseases, eds E. M. Hansen, K. J. Lewis, and M. St. Paul (Saint Paul, MN: American Phytopathological Society), 54–55.
Taiz, L., Møller, I. M., Murphy, A., and Zeiger, E. (2022). Plant physiology and development. Oxford: Oxford University Press.
Talbert, C., and Marshall, D. (2005). Plantation productivity in the Douglas-fir region under intensive silvicultural practices: Results from research and operations. J. For. 103, 65–70. doi: 10.1093/jof/103.2.65
Vargas-Hernandez, J., and Adams, W. T. (1994). Genetic relationships between wood density components and cambial growth rhythm in young coastal Douglas-fir. Can. J. For. Res. 24, 1871–1876. doi: 10.1139/x94-241
Wang, T., Hamann, A., Spittlehouse, D., and Carroll, C. (2016). Locally downscaled and spatially customizable data for historical and future periods for North America. PLoS One 11:e0156720. doi: 10.1371/journal.pone.0156720
Whitehead, D., Livingston, N. J., Kelliher, F. M., Hogan, K. P., Pepin, S., McSeveny, T. M., et al. (1996). Response of transpiration and photosynthesis to a transient change in illuminated foliage area for a Pinus radiata D. Don tree. Plant Cell Environ. 19, 949–957. doi: 10.1111/j.1365-3040.1966.tb00459.x
Wiegand, C. L., and Namken, L. N. (1966). Influences of plant moisture stress, solar radiation, and air temperature on cotton leaf temperature. Agron. J. 58, 582–586. doi: 10.2134/agronj1966.0021962005800060009x
Wilhelmi, N. P., Shaw, D. C., Harrington, C. A., St. Clair, J., and Ganio, L. M. (2017). Climate of seed source affects susceptibility of coastal Douglas-fir to foliage diseases. Ecosphere 8:e02011. doi: 10.1002/ecs2.2011
Zweifel, R. (2016). Radial stem variations–a source of tree physiological information not fully exploited yet. Plant Cell Environ. 39, 231–232. doi: 10.1111/pce.12613
Keywords: Douglas-fir, common gardens, Pacific Northwest, 2021 heat dome, diameter growth cessation, diameter growth phenology, genetics, needle-cast disease
Citation: Harrington CA, Gould PJ and Cronn R (2023) Site and provenance interact to influence seasonal diameter growth of Pseudotsuga menziesii. Front. For. Glob. Change 6:1173707. doi: 10.3389/ffgc.2023.1173707
Received: 25 February 2023; Accepted: 14 June 2023;
Published: 03 July 2023.
Edited by:
Rongzhou Man, Ontario Ministry of Northern Development, Mines, Natural Resources and Forestry, CanadaReviewed by:
Manuel Gabriel Walde, Snow and Landscape Research (WSL), SwitzerlandLahcen Benomar, Ontario Forest Research Institute, Canada
Copyright © 2023 Harrington, Gould and Cronn. This is an open-access article distributed under the terms of the Creative Commons Attribution License (CC BY). The use, distribution or reproduction in other forums is permitted, provided the original author(s) and the copyright owner(s) are credited and that the original publication in this journal is cited, in accordance with accepted academic practice. No use, distribution or reproduction is permitted which does not comply with these terms.
*Correspondence: Constance A. Harrington, Q29uc3RhbmNlLkhhcnJpbmd0b25AdXNkYS5nb3Y=