
95% of researchers rate our articles as excellent or good
Learn more about the work of our research integrity team to safeguard the quality of each article we publish.
Find out more
ORIGINAL RESEARCH article
Front. For. Glob. Change , 11 October 2023
Sec. Tropical Forests
Volume 6 - 2023 | https://doi.org/10.3389/ffgc.2023.1135270
This article is part of the Research Topic Women in Tropical Forests Research 2022 View all 5 articles
 Nanette C. Raczka
 Qian Yi HoVupasana Srinivasan
 Ming Yang Lee
 Chung-Wing KoMadeleine KönigerTerence ChuaDelia BinnyKang Min Ngo
 Kelly M. Andersen*
Tropical forests play a crucial role in mediating the global carbon cycle and climate. Southeast Asian tropical forests are experiencing ongoing threats of deforestation and degradation. There is an urgent need to determine how the conversion from primary forest to secondary forest coverage may impact C stocks and cycling. While old-growth forests typically contain larger stores of C aboveground than secondary forests, past research has found varied results for belowground soil C storage and fluxes between tropical forest types. We examined differences in annual soil C efflux in a 2-ha old-growth and an adjacent 2-ha 70-year-old secondary ForestGEO plots in Bukit Timah Nature Reserve in Singapore. We hypothesized that the secondary forest would have greater soil C efflux rates than the old-growth forest and explored several potential drivers of soil C efflux including abiotic and biotic factors such as soil moisture, fine root biomass, and ectomycorrhizal association. We found that the hypothesis was supported, suggesting that belowground carbon dynamics fundamentally differ with forest age. Additionally, we found that fine root biomass was the best predictor of soil C efflux in the secondary forest and soil moisture in the old-growth forest. The difference in soil C efflux between forest types indicates that with continued degradation of old-growth forests in Southeast Asia, conversion of old-growth forests into secondary forests may drive greater C loss from soils even after 70 years of regrowth.
Tropical forests are a critical ecosystem in the global carbon cycle, removing more atmospheric carbon than temperate and boreal forests and contributing 30% to the global terrestrial carbon sink (Harris et al., 2021). However, the potential of tropical forests to act as a carbon sink is increasingly threatened as climate change and land use continue to accelerate and alter the global carbon balance. One of these potential threats is the loss of carbon stored in the soil, as global change and land use disturbances may increase soil C efflux through microbial decomposition and root respiration (Huang et al., 2020; Lei et al., 2021; Riutta et al., 2021). Increases in carbon emissions could outweigh the carbon taken up and sequestered by intact tropical forest vegetation, threatening the carbon balance, and contributing to increased atmospheric warming. Thus, there is an urgent need to quantify soil fluxes across tropical ecosystems, especially given that tropical forests exchange more carbon dioxide (CO2) with the atmosphere than any other terrestrial ecosystem (Raich and Schlesinger, 1992; Schlesinger and Andrews, 2000; Bond-Lamberty and Thomson, 2010).
Though the percent can vary over a year, approximately half of soil C efflux can be derived from the autotrophic respiration of tree roots (Hanson et al., 2000), indicating that shifts in fine root biomass due to disturbance and logging may alter total rates of soil C efflux. A study in Indonesia researching root biomass and growth along a gradient of increasing forest conversion found that root biomass decreased with disturbance while overall they found higher root growth activity (Leuschner et al., 2009). Indeed, worldwide data on logged forests show greater root biomass when compared to old-growth forests (Hertel et al., 2007). These studies suggest that fine root growth and turnover may increase in secondary forests after logging and have the potential to drive changes in soil C efflux.
Southeast (SE) Asia’s forests are of particular concern, since these tropical forests are large hotspots of biodiversity and productivity but have experienced the greatest deforestation and habitat loss globally (Achard et al., 2002; Sodhi et al., 2004, 2010). Previous research has suggested that secondary forests can mitigate carbon emissions from land use change on a global scale (Harris et al., 2021), but there remains a paucity of data on soil C efflux in secondary forests across SE Asian tropical forests. A recent study in Sabah, Malaysia found that logged tropical forests have higher soil CO2 efflux than intact, old-growth forests, altering the carbon balance of the forest compared to historical carbon dynamics (Riutta et al., 2021). This has significant implications as most of the forests in SE Asia are no longer primary forest but have been deforested and converted to plantations or left to regrow into secondary forest (Food and Agriculture Organisation, 2011). However, it is uncertain how soil carbon efflux in old-growth forests differs in comparison to mature secondary forests in other forests across SE Asia. Additionally, these differences may also have spatial and temporal patterns that can be driven by environmental factors and seasonality (Chambers et al., 2004; Adachi et al., 2009). Generating new empirical data on belowground carbon fluxes and their spatial and temporal variations is critical towards expanding our understanding of future carbon stocks under potential warming and deforestation scenarios.
Filling this knowledge gap of SE Asian tropical forests is also important as SE Asian tropical forests differ from other forests in the dominant types of mycorrhizal fungi that associate with the trees. In tropical forests worldwide, most trees have a symbiotic relationship with arbuscular mycorrhizae (AM), fungi that receive carbon from the host tree in exchange for inorganic nutrients and water that are foraged in return (Smith and Read, 1997). By contrast, most forests in SE Asia are dominated by canopy trees in the Dipterocarpaceae family, which are known to associate with ectomycorrhiza (EM, Brearley, 2012). Ectomycorrhiza can compete with the free-living soil microorganisms in their ability to produce extracellular enzymes to decompose soil organic matter for organic nutrients (Smith and Read, 1997). Due to this potential competition, evidence suggests EM hyphae and their associated plant roots drive reductions in nutrient mineralization rates that can produce lower carbon dioxide emissions from the soil (Averill and Hawkes, 2016). Understanding the effects of mycorrhizal dominance on organic matter turnover and decomposition is therefore fundamental for better predictions of shifts in belowground carbon dynamics.
In Singapore, agriculture, logging, and urbanization have led to widespread deforestation throughout the 19th and 20th centuries (Corlett, 1992). Most of the remaining forest patches are considered secondary, with less than 0.2% of old-growth forest left (Yee et al., 2011; Corlett, 2013; Ngo et al., 2016). The largest remaining patch of old-growth forest in Singapore can be found in Bukit Timah Nature Reserve (BTNR), a reserve with an old-growth forest area that is directly surrounded by a matrix of secondary forests. Previous studies in the BTNR ForestGEO forest dynamics 2-ha plots have found persistent floristic and structural differences between these adjacent forest types despite 70 years of secondary forest regrowth (Chua et al., 2013; Ngo et al., 2013). For example, the secondary forest has half the basal area and half the diversity as the old-growth forest due to the presence of long-lived pioneer species, thick leaf litter, and limited dispersal (Chua et al., 2013). The old-growth forest has significantly greater total carbon stocks (337 Mg C ha−1), which is evenly split between the aboveground and belowground components, compared to secondary forests (224 Mg C ha−1), which store a greater proportion (~62%) of carbon belowground (Ngo et al., 2013). The old-growth forest within BTNR is dominated by trees associating with EM fungi while the secondary forest surrounding the old-growth forest contains trees primarily associating with AM fungi. These associations may influence nutrient cycling within these two forest types, thus impacting the amount of carbon respired from the soil. This suggests that when SE Asian old-growth forests are converted into secondary forests, changes in composition and regrowth may, in turn, impact overall ecosystem function and carbon storage.
In this study, we examined differences in annual soil C efflux in the 2-ha old-growth and 2-ha 70-year-old secondary ForestGEO forest dynamics plots in BTNR, Singapore. The overall goals of the study were to examine the differences in soil C efflux across the forest types with respect to (1) spatial variability, (2) temporal variation, (3) abiotic (soil moisture and temperature, topography) and biotic (fine root biomass, EM relative abundance) factors and their interactive effects. We hypothesized that the secondary forest exhibits a greater soil C efflux rate due to one or more of the following mechanisms:
(1) Lower aboveground biomass of the secondary forest results in greater canopy openness, higher soil temperatures and lower soil moisture, thus promoting soil C efflux due to increased soil microbial activity (Martius et al., 2004).
(2) The greater relative root biomass in the secondary forest increases overall autotrophic respiration rates and the total soil C efflux rates observed (Katayama et al., 2009).
(3) The greater dominance of AM fungi associated tree species relying on soil microbial decomposition in the secondary forest enhances nutrient release from organic matter, which results in greater microbial activity and soil C efflux rates. This is consistent with other studies that demonstrated lower soil C efflux rates in EM-dominated forests due to reduced nutrient mineralization rates (Averill and Hawkes, 2016).
To test these hypotheses, we measured soil C efflux, moisture, and temperature in each forest type monthly over the course of 1 year. Soil C efflux from the primary and secondary forest plots were then compared against various edaphic and biotic factors to explain the variation in soil C efflux rates across both forest types.
This research was conducted at Bukit Timah Nature Reserve (BTNR), a 164-ha forest reserve located in Singapore. Soils are Typic Paleudults of the Rengam series formed on Bukit Timah Granite (Ives, 1977; Ngo et al., 2016). The reserve experiences an aseasonal climate, with a mean annual temperature of 27°C and a mean annual rainfall of 2,688 mm (Ngo et al., 2016). The BTNR is dominated by a mosaic of old-growth dipterocarp and mature secondary forests that were regrown on abandoned agricultural and logged land (Corlett, 1988).
We conducted the soil C efflux surveys in a 2-ha old-growth and adjacent 2-ha secondary ForestGEO forest dynamics plots (Chua et al., 2013; Ngo et al., 2013). We obtained the total basal area of all AM and EM trees with a diameter-at-breast-height > 1 cm from the most recent tree census data conducted from 2019 to 2020 (Ngo et al., 2013). Mycorrhizal type was based on tree family, where species from the Dipterocarpaceae and Fagaceae families were assumed to be EM-associated, while all other species were AM-associated (Soudzilovskaia et al., 2020). We calculated the relative abundance of EM trees for each 20 × 20 subplot in each forest dynamics plot. Soils were collected in 2012 across a subset of quadrats to quantify soil nutrient availability, soil pH, soil carbon stocks, and fine-root biomass (Ngo et al., 2013).
To investigate differences in soil C efflux rates between the old-growth and secondary forests, we measured CO2 respiration using a LI-COR Smart Chamber paired with a LI-870 (LI-COR, Lincoln, Nebraska) at one collar located in the center of each 20 × 20 m quadrat (50 per 2-ha plot) every month from July 2021 to June 2022. In each quadrat, leaf litter was removed from the soil surface and a 20 cm diameter x 5 cm height polyvinyl chloride (PVC) collar was placed on top of the soil. To avoid CO2 leakage, the collar was sealed to the soil surface with wetted clay soil collected from outside of the plot. Removed leaf litter was replaced back into the ring and the leaf litter was standardized prior to measurements for each census. Soil temperature (°C) and soil moisture (%) were measured concurrently with a Stevens HydraProbe connected to the Smart Chamber into the soil at approximately 5 cm depth next to the collar. Duplicate observations were 90 s each, with a 10 s pre- and post- purge to flush the system between observations. All measurements were made during the day (10:00–16:00). SoilFluxPro (version 4.2.1; LI-COR Biosciences, Inc.) was used to estimate linear CO2 flux and check quality of the fitted values determined by the linear coefficient of variation (CV < 1.3). We used the mean value of the duplicate observations for monthly soil C efflux and to estimate annual respiration rates. Annual soil C efflux (in Mg C ha−1 yr.−1) was estimated by scaling up the summed CO2 flux over 11 months into an annual total and converting the scaled value of CO2 flux into total carbon respired (Mg C).
Statistical spatial interpolation was performed through ordinary kriging using the “sf” and “spatstat” R packages (Baddeley and Turner, 2005; Pebesma, 2018). As the forest patches were uniform with no obvious patterns of clustering, the raw Euclidean distance was used as the distance parameter. Briefly, kriging was done by first de-trending the data, then computing the experimental variogram (γ), which measures spatial autocorrelation. We computed γ (difference in soil C efflux rates between location point pairs) for all point pairs and plotted these values as a function of distance between points. These cloud points were binned into 16 lag intervals with a lag distance of 0.01 km which created the sample experimental variogram plot, which was used to fit a spherical mathematical model based on the nugget, partial sill, and range parameters. A sample experimental variogram aims to maximize variance while minimizing distance, and thus commonly uses these three parameters to define and model the behavior of the variogram. The nugget is the height of the variogram as it crosses the y-axis. The partial sill is the height of the variogram between the nugget and the asymptote where the curve levels off. The range is the distance along the x axis until the variogram levels off. The interpolated surface was combined with the trend interpolated surface for the final visualization, along with 95% confidence interval maps.
Spatial autocorrelation was measured with the “spdep” package (Bivand and Wong, 2018). Distances were weighted using the idw pairwise method (α = 2), which weighs closer neighbors more significantly than farther neighbors. These distance-based weights were normalized using row standardization. The Moran’s I statistic was then obtained through a Monte Carlo simulation of 999 simulations to test whether spatial patterns are clustered, dispersed, or random.
We used the same kriging method to estimate soil edaphic factors and fine-root biomass in unsampled quadrats from the 2012 soil survey. These variables were subsequently used as potential predictors for annual C flux (see below sections).
To test if annual soil C efflux differed across forest types, we used a spatially explicit model to account for spatial autocorrelation within each plot. Mean annual soil C efflux at each sampling location was the response variable and the spherical correlation structure was fit using the geospatial coordinates of the sampling locations. To examine temporal variation in soil C efflux across the study period, we used repeated measures linear mixed models where log10 transformed soil C efflux was the response variable, sampling date and location were the random variables used to fit the first order temporal autoregressive correlation structure. To account for both spatial and temporal autocorrelation due to repeated measurements at each quadrat, we constructed spatially explicit linear models for soil C efflux, soil temperature, and soil moisture within each month by including a spherical correlation structure that revolved about the coordinates of each sampling point. These models tested if monthly soil C efflux, moisture and temperature variables consistently differed across forest types across the sampling period. Spatially explicit models were constructed using the ‘gls’ function from the R package “nlme” (Pinheiro et al., 2022). We used the “check_model” function from the R package “performance” to assess whether the models met the assumptions for linear models.
Structural equation modeling (SEM) was used to assess the direct and indirect abiotic and biotic factors on annual soil C efflux. The abiotic variables considered were soil moisture, temperature, elevation (m a.s.l). The biotic variables considered were the kriged estimates of fine-root biomass and the relative abundance of EM trees (see Table 1). Prior to the SEM, the distribution of the data for each variable and the bivariate Pearson correlation relationships among the variables within and across the old-growth and secondary plots were examined using the function “ggpairs” in the R package “GGally.” We used these bivariate relationships and our mechanistic hypotheses, based on existing literature that suggests soil C efflux is driven by abiotic factors as well as mycorrhizal type (Averill and Hawkes, 2016; Zhang et al., 2022), to construct a series of pathways connecting variables to each other and ultimately, annual C flux. The initial model included soil temperature (°C), soil moisture (%), fine-root biomass, and the relative abundance of EM trees by basal area (%) as predictors for annual C flux per quadrat for both forest plots together. These combinations included potential interactive effects among variables and allowed us to identify abiotic and biotic drivers of annual C flux without bias of forest type, which was a key determinant of most variables. We used backward selection to simplify the multivariate effects and the final model was chosen based on the lowest AIC value. We also conducted SEM models for each forest type separately, however, the final models for each forest type were simple linear models with soil moisture as a direct predictor of annual C flux in the old-growth forest and fine-root biomass directly predicting annual C flux in the secondary forest. The SEM analysis was conducted using the “piecewiseSEM” R package.
Table 1. Table of vegetation data of old-growth and secondary forest subplots in BTNR (means ± SE).
Mean soil C efflux was 3.06 ± 0.89 μmol m−2 s−1 across the 2-ha ForestGEO old-growth and secondary forests at Bukit Timah Nature Reserve. The secondary forest had higher overall soil C efflux rates with a mean of 3.50 ± 0.11 μmol m−2 s−1 compared to the old-growth forest with a mean soil C efflux of 2.62 ± 0.11 μmol m−2 s−1 (F1, 98 = 36.48, p < 0.0001). Annual soil C efflux across both forest types was 11.55 Mg C ha−1 yr.−1. The secondary forest emitted significantly more carbon than the old-growth forest (F1,93 = 32.54, p < 0.0001; Figure 1A), in which the secondary forest had a cumulative annual flux of 13.21 ± 0.42 and the old-growth forest had a cumulative annual flux of 9.90 ± 0.42. Soil moisture over the year had a mean of 30% and on average, the old-growth forest had significantly greater soil moisture at 33% than the secondary forest at 27% (F1,98 = 42.889, p < 0.0001; Figure 1B). Mean soil temperature was 27.71°C and on average, the secondary had significantly higher temperature at 28.32°C than the old-growth forest at 27.09°C (F1,98 = 168.57, p < 0.0001; Figure 1C).
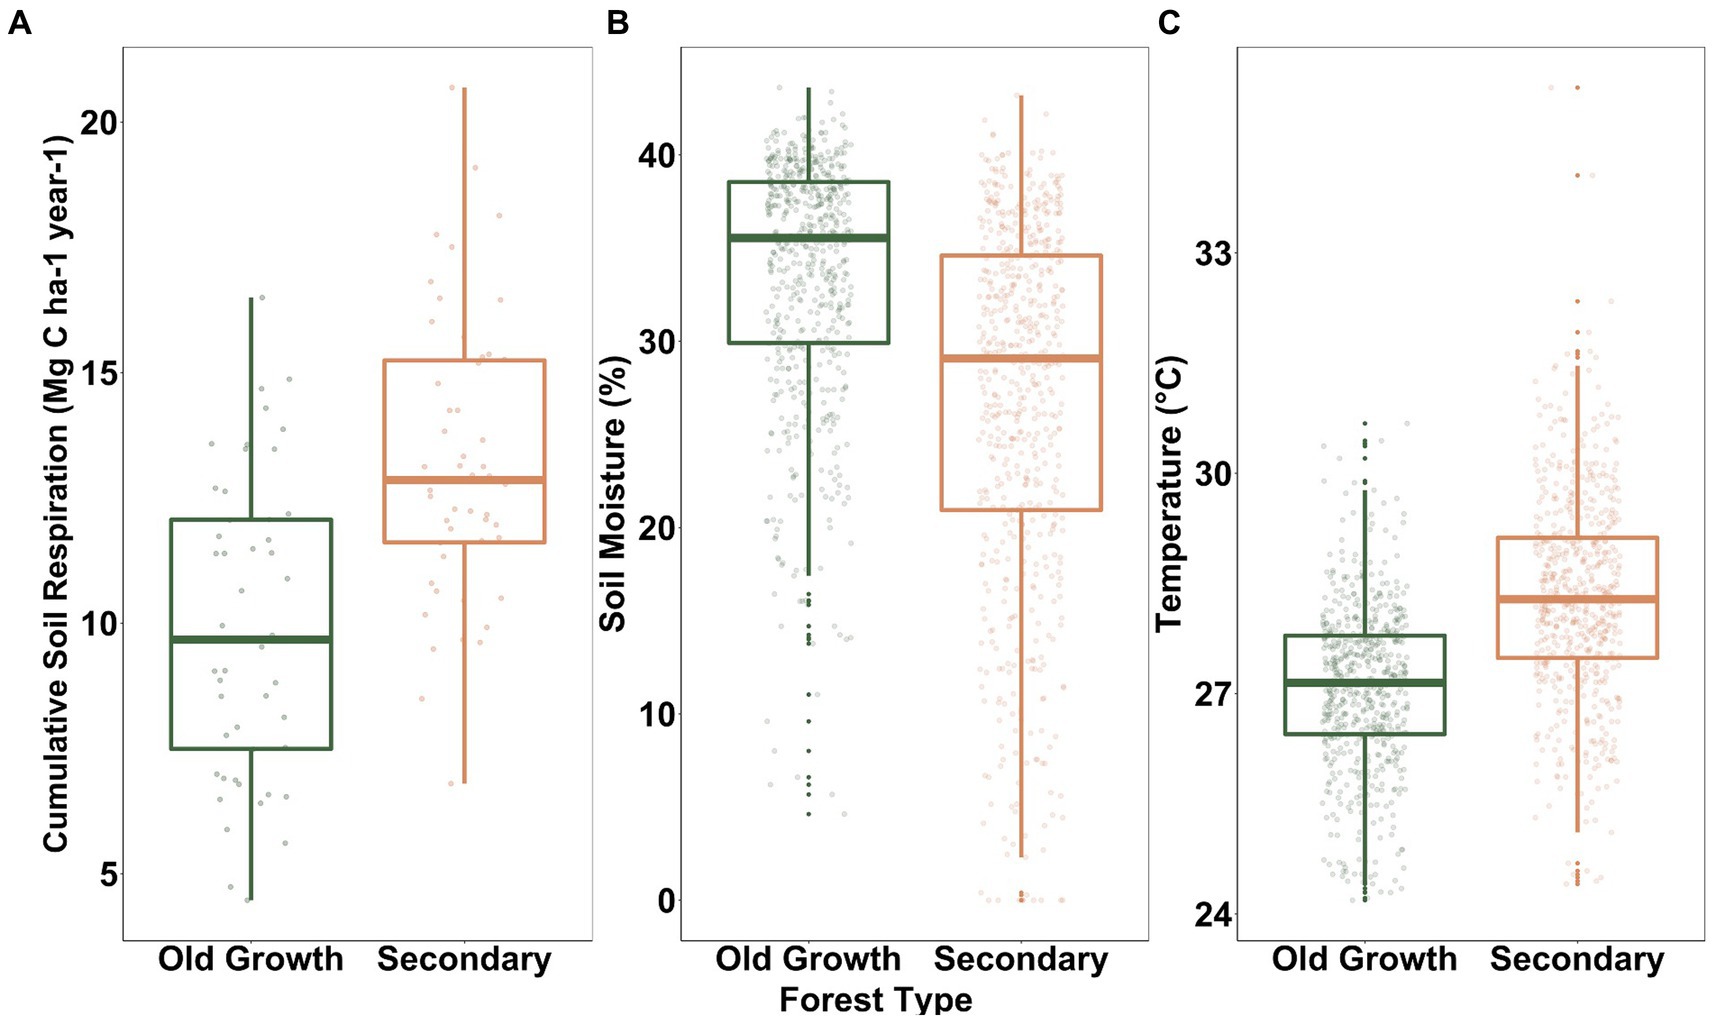
Figure 1. Boxplots of (A) cumulative soil C efflux, (B) average soil moisture, and (C) average temperature across the old-growth and secondary plots in BTNR. All three variables were significantly different between forest types.
Spatial interpolation was performed to visualize spatial variation of annual soil C efflux, soil moisture, and soil temperature across the secondary and old-growth plots in BTNR (Figure 2). Interpolation showed that the annual respiration efflux and soil temperature models reached the sill at a distance of 0.07 km, where there ceased to be any correlation between values. The soil moisture model reached its sill at 0.06 km, meaning neighboring points with over 0.06 km distance exhibited uncorrelated soil moisture values. Based on the Monte Carlo simulations with 999 iterations, annual soil C efflux, mean temperature, and mean soil moisture were all more spatially clustered than would be expected if underlying spatial processes were random (efflux: Moran’s I statistic = 0.29977, p < 0.001; temperature: Moran’s I statistic = 0.76056, p < 0.001; soil moisture: Moran’s I statistic = 0.35625, p < 0.001).

Figure 2. Kriged surfaces for predicted (A) annual soil C efflux, (B) mean soil moisture, and (C) mean soil temperature across the 2-ha old-growth forest plot (left) and the 2-ha 70-year-old secondary forest plot (right) in BTNR. Points represent sampled locations in each forest plot (n = 50).
Based on the monthly spatially explicit models of soil C efflux, quadrats in the secondary forest had significantly greater mean soil C efflux than the old-growth forest in all months across the sampling period, with an exception in April 2022 (F1, 98 = 0.71, p = 0.40; Figure 3). The greatest mean monthly soil C efflux in the secondary forest was reached in February 2022 at 3.90 ± 0.17 μmol m−2 s−1 whereas the greatest mean monthly soil C efflux in the old-growth forest was reached in April 2022 at 3.23 ± 0.20 μmol m−2 s−1 (Figure 3A). Monthly mean soil C efflux was largely idiosyncratic in both forest types, with no clear evidence of seasonality or periodicity across the sampling period. However, mean monthly soil C efflux appeared to increase slightly towards the end of the census period from April to June 2022. Subplots from both forest types experienced large variations in soil C efflux, ranging anywhere from 0.682 to 9.90 μmol m−2 s−1 across the census period.
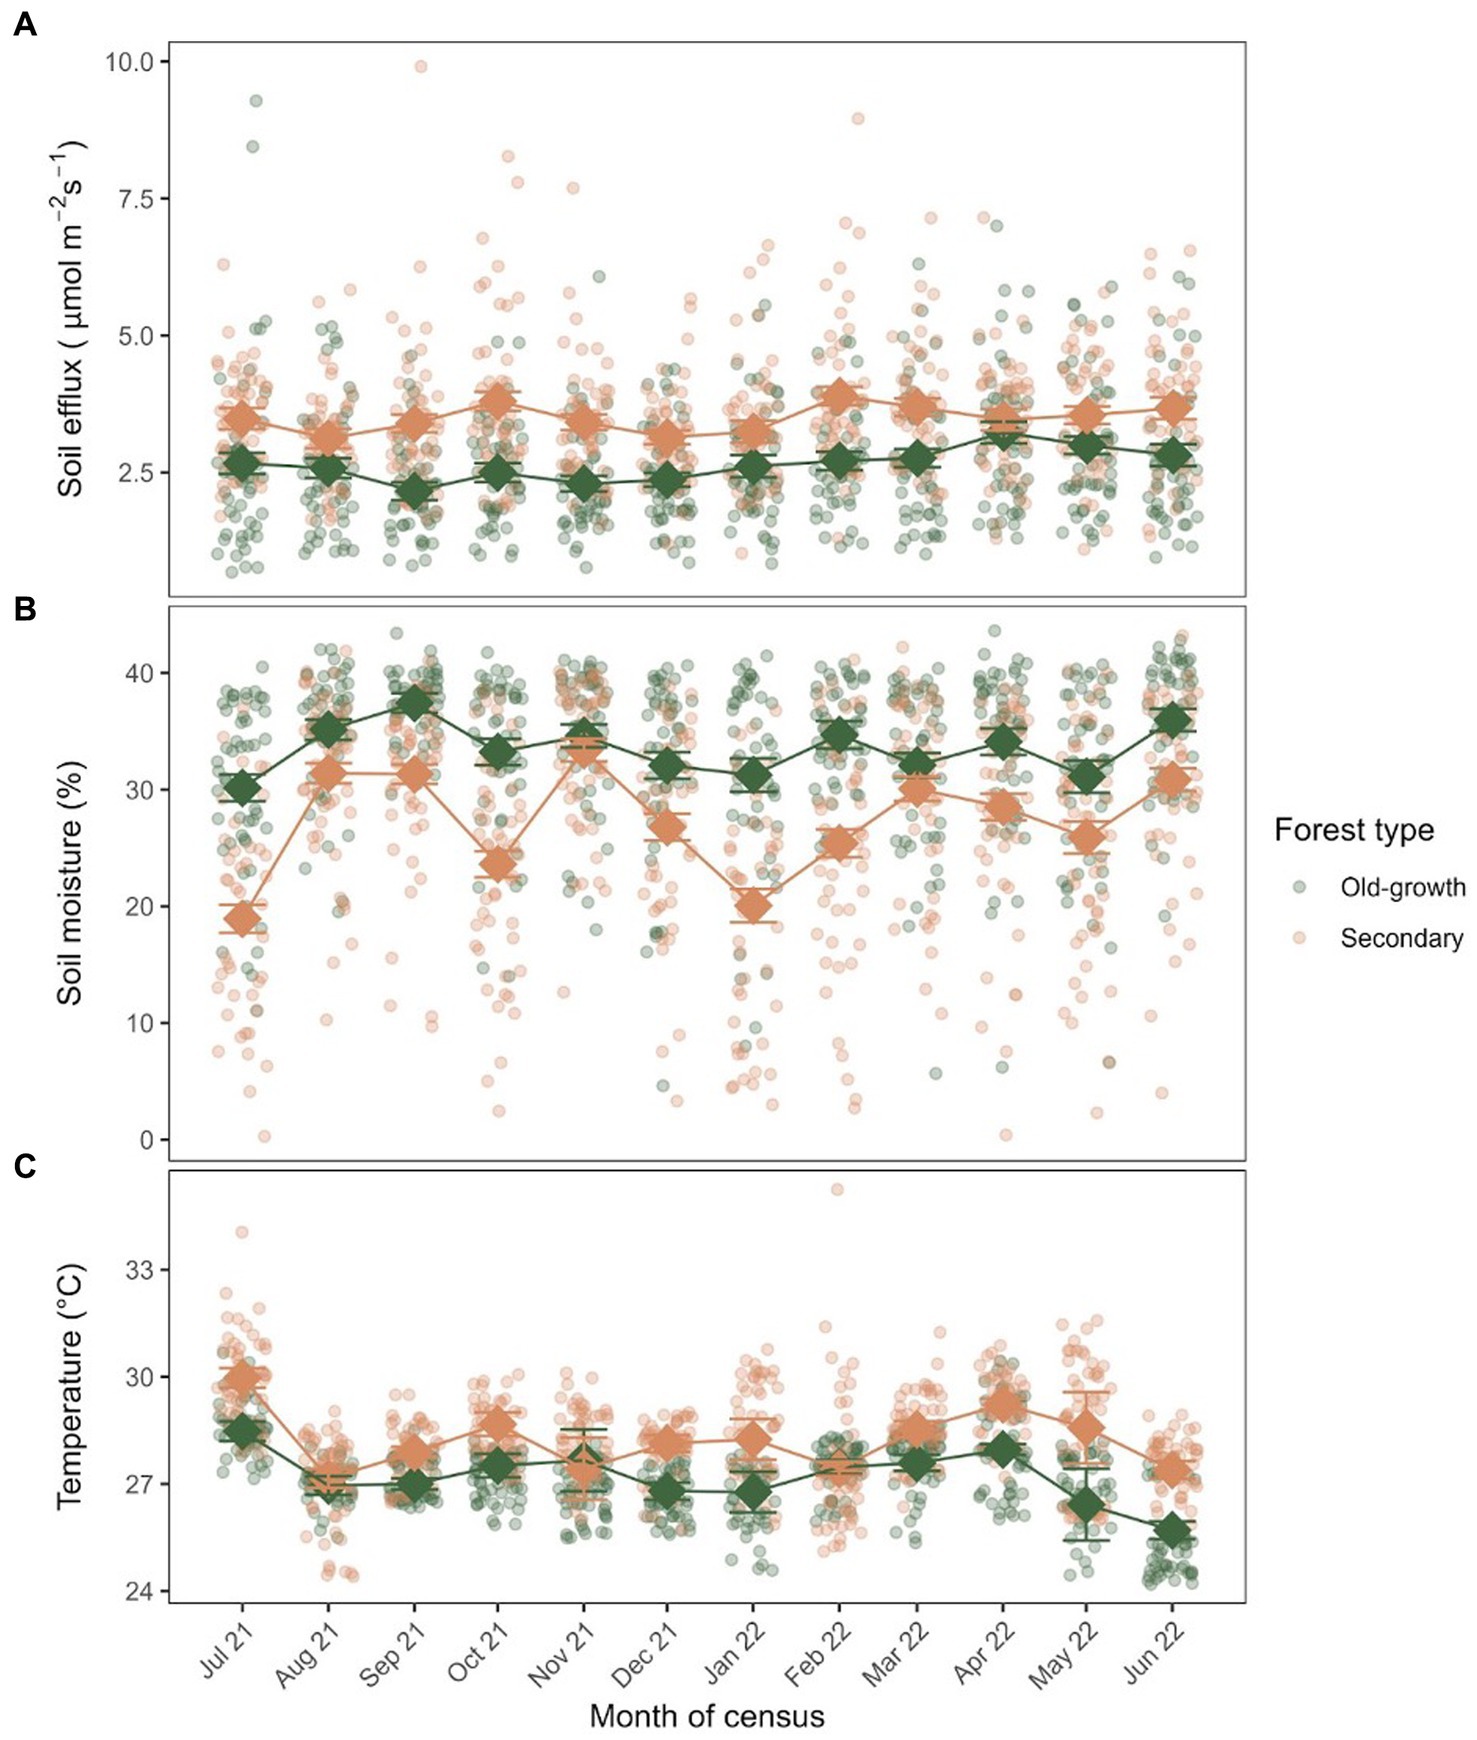
Figure 3. Scatterplot of (A) monthly soil C efflux, (B) percent soil moisture, and (C) temperature of quadrats from the old-growth and secondary forests in BTNR. Squares and thick lines represent the trend of the mean monthly values across quadrats within each forest type (n = 50), coupled with error bars representing the standard error.
Soil moisture was consistently significantly lower in the secondary forest than the old-growth forest with the exception in November 2021 (F1, 98 = 0.79, p = 0.38) and March 2022 (F1, 98 = 1.86, p = 0.18). In addition, the secondary forest experienced stronger fluctuations in mean soil moisture (18.9–33.4%) than the old-growth forest (30.1–37.4%) and experienced slight dips in several months whereas soil moisture in the old-growth forest was relatively stable over the census period (Figure 3B).
Soil temperature was significantly greater in the secondary forest than the old-growth forest in most months, with the exception of August 2021 (F1, 98 = 0.29, p = 0.59), November 2021 (F1, 98 = 0.12, p = 0.73) and February 2022 (F1, 98 = 0.03, p = 0.87). Soil temperature was the greatest in both the old-growth and secondary forests at the start of the census in July 2021 at 28.48 ± 0.28°C and ± 0.28°C, respectively, (Figure 3C). However, the secondary forest reached its lowest mean soil temperature in the subsequent month (27.15 ± 0.26°C in August 2021) but the old-growth forest reached its lowest mean soil temperature only in the final month of the census (25.70 ± 0.25°C in June 2022). Nevertheless, both forest types experienced similar ranges in monthly mean soil temperature throughout the census (approx. 2.8°C).
Abiotic and biotic factors interactively affected annual soil C efflux across the forest plots, explaining 42% of the variation in annual C flux (Fisher’s C = 11.92, p = 0.61; Figure 4). Fine root biomass had direct positive and soil moisture had direct negative effects on annual C flux. Soil moisture declined with soil temperature, which declined with elevation. Fine root biomass increased with soil temperature and declined with EM tree relative abundance, which increased with both soil moisture and elevation. When forest types were examined separately, soil moisture alone directly explained 41% of the variation in annual C flux in the old-growth forest (F = 34.74, p < 0.0001) and fine root biomass directly explained 11% of the variation in annual C flux in the secondary forest (F = 6.83, p = 0.01).
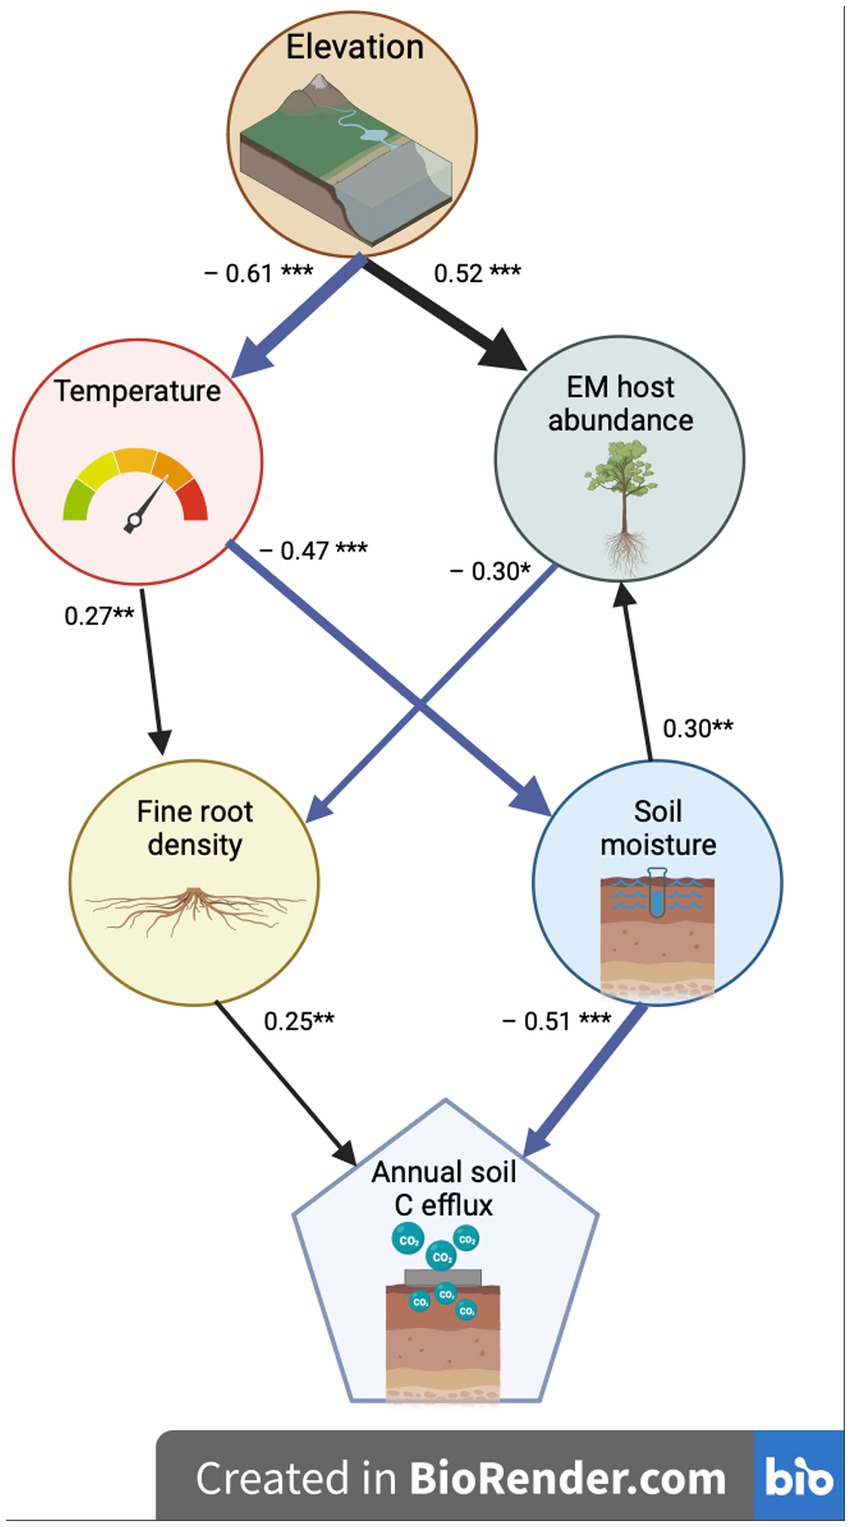
Figure 4. Structural equation models were used to identify drivers of soil C efflux across both old-growth and secondary forests together. Arrow direction points from predictor to response variable. Arrow size is proportional to standard estimate effect size. Blue arrows indicate negative and black indicate positive standard estimates. ***p < 0.001; **p < 0.01; *p < 0.05.
Understanding differences in carbon emissions between old-growth and regrowing, secondary forests in SE Asia is critical to improve model predictions of forest carbon fluxes with future global change (Wright, 2005). We examined patterns of soil C efflux in relation to spatial and temporal differences between the secondary and old-growth plots, as well as potential abiotic and biotic drivers. Here, we show annual soil C efflux was significantly greater in the 70-year-old secondary forest than in the old-growth forest at BTNR (Figure 1A). Further, we found soil moisture and temperature spatially varied, influencing the spatial differences we found in soil C efflux within plots. Specifically, soil moisture was lower and temperature was higher in the more open secondary forest as compared to the primary forest (Figures 2B,C). Further, we found that while there were seasonal signals for soil C efflux, the fluxes did not dramatically vary for either the old-growth or the secondary forest (Figure 3A). Lastly, fine roots were the best and most direct predictor of secondary forest soil C efflux, while soil moisture was the best predictor of soil C efflux in the old-growth forest (Figure 4). Our findings indicate that with continued degradation of old-growth forests in Southeast Asia, conversion of old-growth forest into secondary forests may drive greater C loss from soils even after 70 years of regrowth.
The mean annual soil C efflux in our study was 11.55 Mg C ha−1 yr.−1, and significantly differed between the secondary forest (13.21 ± 0.42 Mg C ha−1 yr.−1) and the old-growth forest (9.90 ± 0.42 Mg C ha−1 yr.−1, Figure 2A). This falls below the average (16.8 Mg C ha−1 yr.−1) for tropical forests, but closely follows previous estimates from other Bornean logged (14.3 ± 0.23 Mg C ha−1 yr.−1) and old-growth forests (12.7 ± 0.60 Mg C ha−1 yr.−1) in the region (Riutta et al., 2021). Our findings also fall well within the range of soil C efflux measurements found across other tropical forest studies, which range from 8.31 Mg C ha−1 yr.−1 in a tropical rainforest in Xishuangbanna, China, to 28.87 Mg C ha−1 yr.−1 in an upland tropical forest in Northwest Mato Grosso, Brazil (Rubio and Detto, 2017). Both forest types in BTNR exhibited slightly lower C flux compared to undisturbed forest sites from other tropical forests, which ranged from 13 to 28.6 Mg C ha−1 yr.−1 (Metcalfe et al., 2007; Saner et al., 2012; Kerdraon et al., 2020), even in the once-logged regenerating secondary forests, suggesting that soils of SE Asian forests may continue to act as a carbon sink even under the influence of logging.
Abiotic and biotic factors are often found to control soil C efflux, whether directly or indirectly (Zhou et al., 2020). Previous literature has found that soil moisture is the most influential abiotic factor in soil C efflux in tropical forests (Davidson et al., 2000; Hashimoto et al., 2004; Li et al., 2006; Sotta et al., 2006; Ohashi et al., 2008; Rubio and Detto, 2017), with soil temperature playing a secondary role (Wood et al., 2013). Soil moisture in our plots ranged from below 10% to more than 40%, with the old-growth forest having higher soil moisture as compared to the secondary forest. In wet climates, soil C efflux rates have been found to negatively correlate with soil moisture (Adachi et al., 2009). When soil water content surpasses a critical point, the moisture limits oxygen availability and gas diffusion within the soil (Linn and Doran, 1984; Skopp et al., 1990; Olesen et al., 2001; Hashimoto and Komatsu, 2006). This therefore reduces soil microbial activity, which is a major source of heterotrophic respiration and a component of soil C efflux (Li et al., 2006). Soil temperature in our plots ranged from 25.7–29.97°C, with higher soil temperatures in the secondary as compared to the old-growth plots. This strongly influences soil moisture (Figure 4), and soil temperatures have been found to have a positive relationship with soil C efflux (Hashimoto and Komatsu, 2006).
Topography, such as ridges and slopes, can also influence water availability, soil texture, and soil nutrients across a forest (Silver et al., 1994; Weintraub et al., 2015). Our plots ranged from 46 to 137 m a.s.l., and elevation strongly determined soil temperature and EM tree relative abundance. The tree floristics between the old-growth and secondary plot remains distinct (Chua et al., 2013), resulting in differences in canopy cover and belowground root carbon. A previous study at BTNR found that the secondary forest plot only stores 62% of the aboveground biomass as the primary forest, but allocates a higher proportion of its carbon belowground (Ngo et al., 2013). The primary forest stores half its carbon aboveground and half belowground, while the secondary forest stores 62% belowground and 38% in aboveground biomass (Ngo et al., 2013). These differences persist despite 70 years of regrowth, resulting in less canopy cover observed in the secondary forest. This increases radiation impacts on the forest floor, resulting in lower soil moisture and higher temperature, which may directly impact soil C efflux through increased soil microbial activity (Martius et al., 2004). The differential distribution of roots belowground in the secondary forest contributes to the higher soil C efflux found in the secondary forest plots.
Fine roots may be important drivers for soil C efflux in the secondary more than the old-growth forest due to previous logging (Figure 4). While logging is known for disrupting aboveground forest biomass and structure in tropical forests (Kenzo et al., 2015), previous studies have shown that the effects of logging may extend to belowground as well, altering fine root biomass (Leuschner et al., 2009) and biomass allocation to roots (Riutta et al., 2018). Hence, the increased belowground carbon investment may have elevated autotrophic respiration in the secondary forests (Metcalfe et al., 2007; Tang et al., 2020). In the context of BTNR, fine root biomass was ~50% greater in the secondary forest compared to the old-growth forest (Ngo et al., 2013), agreeing with previous observations from other logged forests worldwide (Hertel et al., 2007). Thus, we suggest that previous logging of the old-growth forest in BTNR could have led to a shift in species composition towards pioneer species with greater biomass allocation to roots belowground, subsequently enhancing soil C efflux in the secondary forest observed. While our data suggests that fine-root biomass and soil flux are positively correlated across both forest types (Figure 4), the relative contribution of autotrophic respiration towards total soil flux was not investigated and thus remains unclear in our study. As previous studies found that root respiration may contribute anywhere from ~10 to 90% of total soil flux (Hanson et al., 2000), more work is required to ascertain whether the increased belowground carbon allocation of pioneer species in logged forests may translate into a significant increase in total soil flux.
While we did not find evidence of tree mycorrhizal association as a direct driver of soil C efflux between the forest types (Figure 4), the belowground interactions between the fine roots and mycorrhizae may indirectly affect soil C efflux. The secondary forest in BTNR contains almost exclusively tree species colonized by AM fungi, while the old-growth forest contains canopy tree species colonized by EM fungi (Chua et al., 2013). Arbuscular mycorrhizal fungi have been found to enhance soil C cycling and AM mycelia can be a substantial portion of C efflux from tropical forest soils (Smith and Read, 1997; Nottingham et al., 2010). In fact, recent research has found AM fungi can indirectly have an effect on soil C efflux through greater fine root biomass and litter dynamics (Zhang et al., 2022). Greater fine root biomass in the secondary plots compared to the old-growth plots indicates that beyond tree type, root-mycorrhizal interactions may be an important component of the greater respiration we observed in the secondary plots. Future experiments further isolating the belowground components of soil C efflux would provide needed insight into how soil organisms contribute to carbon loss especially in future land use scenarios.
Despite the close proximity of the secondary and old-growth plots, we found spatially distinct patterns in soil C efflux, temperature and soil moisture between the plots (Figure 1). The kriged maps show that some of the variability in soil C efflux is due to CO2 hotspots, with higher soil C efflux rates at point locations in the secondary plot as compared to its surrounding environment (Figure 1A). Previous studies suggest that CO2 hotspots in tropical forests may be due to the presence of nests/bivouacs and foraging activity of termites and ants (Ohashi et al., 2008). Although some spatial variability may be explained by vegetation, soil biogeochemistry, and topography, the fine spatial scale of these relatively large increases in soil C efflux may suggest point location causes rather than larger driving environmental forces. Measuring soil C efflux close to high spots of soil animal activity may be one potential cause for these higher-than-normal values, and the impact of soil animals on soil carbon flow should not be overlooked (Ohashi et al., 2008). We also found that our plots are spatially autocorrelated in both the secondary and old-growth forest plots. Specifically, in both forest types, plots that are clustered and closer to one another have similar values (Figures 2B,C). This clustering is likely due to the influence of soil moisture and temperature microclimate effects. Lastly, topography has been found to impact soil C efflux, in which respiration rates increased from a valley to slope to plateau forests (Chambers et al., 2004). We found that topography mediated the direct drivers of soil C efflux through negative effects on soil temperature and positively relationships with EM tree abundance. However, the relationship between EM relative abundance and topography is a human-mediated construct due the preferential land-use change in low-lying areas, leaving the old-growth forest to remain primarily on ridgetops in Singapore (Corlett, 1992). Nonetheless, the interactive effects of microclimate variation driven by topography and forest type, play a strong role in determining current soil C effluxes across the landscape at various scales.
Strong temporal variation in soil C efflux in response to environmental factors such as soil moisture and temperature is often observed in tropical forests with a seasonal climate (Adachi et al., 2009). However, in this aseasonal tropical forest, we found minor seasonal signals for soil C efflux in this study (Figure 3), indicating that soil C efflux is relatively consistent across the year. Past studies measuring temporal patterns of soil C efflux in SE Asian tropical forests have found mixed results. Similar to our findings, a study conducted in a primary tropical forest in Borneo, Malaysia found soil C efflux was consistent over time, instead finding hotspots of soil C efflux that varied across space potentially due to animal activity (Ohashi et al., 2008). In contrast, a study conducted in a primary dipterocarp forest in Peninsular Malaysia found a positive relationship between soil C efflux and soil water content over time (Kosugi et al., 2007), a result similar to other seasonal tropical forests whereby respiration response to environmental factors varies temporally (Adachi et al., 2009; Rodtassana et al., 2021). These contrasts in soil C efflux over time indicate that further research is needed to determine soil C efflux across various temporal scales. Fine scale temporal variation such as diurnal fluxes and variation due to rainfall may occur, but remain understudied due to difficulties measuring at night, as well as during/immediately after rainfall events (Rubio and Detto, 2017). Other timescales, such as interannual variation in aseasonal SE Asian tropical forests due to ENSO and other climatic drivers, would also build a stronger understanding of soil C efflux fluxes on a larger scale but remain understudied.
Lastly, we acknowledge there were some limitations to this study. First, we did not measure mycorrhizal colonization on the tree species in each forest type, but instead used the relative abundance of species that are known to associate with a type of mycorrhizal fungi. This is used in other studies looking at the effects of mycorrhizal association on ecosystem function (Terrer et al., 2016; Cheeke et al., 2017; Soudzilovskaia et al., 2019), but may limit the quantification of mycorrhizal associations and its effect on soil C efflux. Additionally, we used root biomass data from a past study conducted in the old-growth and secondary forests at BTNR (Ngo et al., 2013), which may have limited our understanding of fine root biomass that was present during our soil carbon efflux sampling period. Seasonal variation in precipitation is known to affect fine root biomass (Zhou et al., 2020), however, since our study site experiences very little variability in rainfall, we do not expect the root biomass to change drastically with time. Lastly, we compared soil C efflux in one stand of secondary forest to another stand of old-growth forest that was adjacent, therefore we did not have forest replication. To account for this, we increased the number of subplots and measurements within each forest, with 50 subplots within each forest type.
We investigated differences in annual soil C efflux between old-growth and secondary tropical forest plots in Singapore. While old-growth forests typically contain larger stocks of C aboveground than secondary forests, past research has found varied results for belowground soil C effluxes between these tropical forest types (Adachi et al., 2005). Importantly, we found greater soil C efflux in the secondary forest than the old-growth forest (Figure 2A). Further, we show that while these forests have minor temporal variations, the adjacent plots spatially differed in soil C efflux with respect to temperature and soil moisture (Figure 1). Fine root biomass and soil moisture were the largest drivers of these differences in soil C efflux between secondary and old-growth forest plots (Figure 4). As such, dynamics between abiotic and biotic interactions on soil C efflux are important to consider, even at small spatial scales, when investigating the long-term impacts of old-growth forest conversion into secondary forests (Wood et al., 2012).
The raw data supporting the conclusions of this article will be made available by the authors, without undue reservation.
KMA conceived the experiment. NCR, QH, VS, MYL, C-WK, MK, TC, DB, KMN, and KMA performed the fieldwork and contributed to the data management. KMA, NCR, MYL, C-WK, and MK analyzed and interpreted the data and wrote the paper. All authors contributed to the article and approved the submitted version.
This study was funded by the Ministry of Education (MOE) award number 002825-00001 Tier 1 Program and Nanyang Technological University to KMA.
We thank Shawn Lum for providing access to the Bukit Timah Nature Reserve ForestGEO forest dynamics plots and unpublished data to calculate relative abundance and the National Park Board for providing permits and research permissions.
The authors declare that the research was conducted in the absence of any commercial or financial relationships that could be construed as a potential conflict of interest.
All claims expressed in this article are solely those of the authors and do not necessarily represent those of their affiliated organizations, or those of the publisher, the editors and the reviewers. Any product that may be evaluated in this article, or claim that may be made by its manufacturer, is not guaranteed or endorsed by the publisher.
The Supplementary material for this article can be found online at: https://www.frontiersin.org/articles/10.3389/ffgc.2023.1135270/full#supplementary-material
Achard, F., Eva, H. D., Stibig, H. J., Mayaux, P., Gallego, J., Richards, T., et al. (2002). Determination of deforestation rates of the world’s humid tropical forests. Science 297, 999–1002. doi: 10.1126/science.1070656
Adachi, M., Bekku, Y. S., Konuma, A., Kadir, W. R., Okuda, T., and Koizumi, H. (2005). Required sample size for estimating soil respiration rates in large areas of two tropical forests and of two types of plantation in Malaysia. For. Ecol. Manag. 210, 455–459. doi: 10.1016/j.foreco.2005.02.011
Adachi, M., Ishida, A., Bunyavejchewin, S., Okuda, T., and Koizumi, H. (2009). Spatial and temporal variation in soil respiration in a seasonally dry tropical forest. Thailand. J. Trop. Ecol. 25, 531–539. doi: 10.1017/S026646740999006X
Averill, C., and Hawkes, C. V. (2016). Ectomycorrhizal fungi slow soil carbon cycling. Ecol. Lett. 19, 937–947. doi: 10.1111/ele.12631
Baddeley, A., and Turner, R. (2005). Spatstat: an R package for analyzing spatial point patterns. J. Stat. Softw. 12, 1–42. doi: 10.18637/jss
Bivand, R., and Wong, D. W. S. (2018). Comparing implementations of global and local indicators of spatial association. TEST 27, 716–748. doi: 10.1007/s11749-018-0599-x
Bond-Lamberty, B., and Thomson, A. (2010). Temperature-associated increases in the global soil respiration record. Nature 464, 579–582. doi: 10.1038/nature08930
Brearley, F. Q. (2012). Ectomycorrhizal associations of the Dipterocarpaceae. Biotropica 44, 637–648. doi: 10.1111/j.1744-7429.2012.00862.x
Chambers, J. Q., Tribuzy, E. S., Toledo, L. C., Crispim, B. F., Higuchi, N., Dos Santos, J., et al. (2004). Respiration from a tropical forest ecosystem: partitioning of sources and low carbon use efficiency. Ecol. Appl. 14, 72–88. doi: 10.1890/01-6012
Cheeke, T. E., Phillips, R. P., Brzostek, E. R., Rosling, A., Bever, J. D., and Fransson, P. (2017). Dominant mycorrhizal association of trees alters carbon and nutrient cycling by selecting for microbial groups with distinct enzyme function. New Phytol. 214, 432–442. doi: 10.1111/nph.14343
Chua, S. C., Ramage, B. S., Ngo, K. M., Potts, M. D., and Lum, S. K. Y. (2013). Slow recovery of a secondary tropical forest in Southeast Asia. For. Ecol. Manag. 308, 153–160. doi: 10.1016/j.foreco.2013.07.053
Corlett, R. T. (1988). Bukit Timah: the history and significance of a small rainforest reserve. Environ. Conserv. 15, 37–44. doi: 10.1017/S0376892900028435
Corlett, R. T. (1992). The ecological transformation of Singapore, 1819-1990. J. Biogeogr. 19, 411–420. doi: 10.2307/2845569
Corlett, R. T. (2013). “Singapore: half full or half empty?” in Conservation biology: Voices from the tropics. eds. P. H. Raven, N. S. Sodhi, and L. Gibson (New York City, NY: John Wiley & Sons), 142–147.
Davidson, E. A., Verchot, L. V., Henrique Cattânio, J., Ackerman, I. L., and Carvalho, J. E. M. (2000). Effects of soil water content on soil respiration in forests and cattle pastures of eastern Amazonia. Biogeochemistry 48, 53–69. doi: 10.1023/A:1006204113917
Food and Agriculture Organisation (2011). Southeast Asian forests and forestry to 2020 – subregional report of the second Asia-Pacific forestry sector outlook study. Bangkok, Thailand: FAO’s Regional Office for Asia and the Pacific.
Hanson, P. J., Edwards, N. T., Garten, C. T., and Andrews, J. A. (2000). Separating root and soil microbial contributions to soil respiration: a review of methods and observations. Biogeochemistry 48, 115–146. doi: 10.1023/A:1006244819642
Harris, N. L., Gibbs, D. A., Baccini, A., Birdsey, R. A., de Bruin, S., Farina, M., et al. (2021). Global maps of twenty-first century forest carbon fluxes. Nat. Clim. Chang. 11, 234–240. doi: 10.1038/s41558-020-00976-6
Hashimoto, S., and Komatsu, H. (2006). Relationships between soil CO2 concentration and CO2 production, temperature, water content, and gas diffusivity: implications for field studies through sensitivity analyses. J. For. Res. 11, 41–50. doi: 10.1007/s10310-005-0185-4
Hashimoto, S., Tanaka, N., Suzuki, M., Inoue, A., Takizawa, H., Kosaka, I., et al. (2004). Soil respiration and soil CO2 concentration in a tropical forest, Thailand. J. For. Res. 9, 75–79. doi: 10.1007/s10310-003-0046-y
Hertel, D., Leuschner, C., Harteveld, M., and Wiens, M. (2007). “Fine root mass, distribution and regeneration in disturbed primary forests and secondary forests of the moist tropics” in Stability of tropical rainforest margins. eds. T. Teja, L. Christoph, Z. Manfred, G. Edi, and B. Arifuddin (Berlin, Heidelberg: Springer), 87–106.
Huang, N., Wang, L., Song, X. P., Black, T. A., Jassal, R. S., Myneni, R. B., et al. (2020). Spatial and temporal variations in global soil respiration and their relationships with climate and land cover. Sci. Adv. 6, 1–12. doi: 10.1126/sciadv.abb8508
Katayama, A., Kume, T., Komatsu, H., Ohashi, M., Nakagawa, M., Yamashita, M., et al. (2009). Effect of forest structure on the spatial variation in soil respiration in a Bornean tropical rainforest. Agric. For. Meteorol. 149, 1666–1673. doi: 10.1016/j.agrformet.2009.05.007
Kenzo, T., Furutani, R., Hattori, D., Tanaka, S., Sakurai, K., Ninomiya, I., et al. (2015). Aboveground and belowground biomass in logged-over tropical rain forests under different soil conditions in Borneo. J. For. Res. 20, 197–205. doi: 10.1007/s10310-014-0465-y
Kerdraon, D., Drewer, J., Chung, A. Y. C., Majalap, N., Slade, E. M., Bréchet, L., et al. (2020). Litter inputs, but not litter diversity, maintain soil processes in degraded tropical forests—a cross-continental comparison. Front. For. Glob. Change. 2:90. doi: 10.3389/ffgc.2019.00090
Kosugi, Y., Mitani, T., Itoh, M., Noguchi, S., Tani, M., Matsuo, N., et al. (2007). Spatial and temporal variation in soil respiration in a southeast Asian tropical rainforest. Agric. For. Meteorol. 147, 35–47. doi: 10.1016/j.agrformet.2007.06.005
Lei, J., Guo, X., Zeng, Y., Zhou, J., Gao, Q., and Yang, Y. (2021). Temporal changes in global soil respiration since 1987. Nat. Commun. 12, 403–409. doi: 10.1038/s41467-020-20616-z
Leuschner, C., Harteveld, M., and Hertel, D. (2009). Consequences of increasing forest use intensity for biomass, morphology and growth of fine roots in a tropical moist forest in Sulawesi, Indonesia. Agric. Ecosyst. Environ. 129, 474–481. doi: 10.1016/j.agee.2008.10.023
Li, Y., Xu, M., and Zou, X. (2006). Heterotrophic soil respiration in relation to environmental factors and microbial biomass in two wet tropical forests. Plant Soil, 281, 193–201.
Linn, D. M., and Doran, J. W. (1984). Effect of water-filled pore space on carbon dioxide and nitrous oxide production in tilled and nontilled soils. Soil Sci. Soc. Am. J. 48, 1267–1272. doi: 10.2136/sssaj1984.03615995004800060013x
Martius, C., Höfer, H., Garcia, M. V. B., Römbke, J., Förster, B., and Hanagarth, W. (2004). Microclimate in agroforestry systems in Central Amazonia: does canopy closure matter to soil organisms? Agrofor. Syst. 60, 291–304. doi: 10.1023/B:AGFO.0000024419.20709.6c
Metcalfe, D. B., Meir, P., Aragão, L. E. O. C., Malhi, Y., da Costa, A. C. L., Braga, A., et al. (2007). Factors controlling spatio-temporal variation in carbon dioxide efflux from surface litter, roots, and soil organic matter at four rain forest sites in the eastern Amazon. J. Geophys. Res. Biogeosciences 112, 1–9. doi: 10.1029/2007JG000443
Ngo, K. M., Davies, S., Nik Hassan, N. F., and Lum, S. (2016). Resilience of a forest fragment exposed to long-term isolation in Singapore. Plant Ecol. Divers. 9, 397–407. doi: 10.1080/17550874.2016.1262924
Ngo, K. M., Turner, B. L., Muller-Landau, H. C., Davies, S. J., Larjavaara, M., Hassan, N., et al. (2013). Carbon stocks in primary and secondary tropical forests in Singapore. For. Ecol. Manag. 296, 81–89. doi: 10.1016/j.foreco.2013.02.004
Nottingham, A. T., Turner, B. L., Winter, K., van der Heijden, M. G. A., and Tanner, E. V. J. (2010). Arbuscular mycorrhizal mycelial respiration in a moist tropical forest. New Phytol. 186, 957–967. doi: 10.1111/j.1469-8137.2010.03226.x
Ohashi, M., Kumagai, T., Kume, T., Gyokusen, K., Saitoh, T. M., and Suzuki, M. (2008). Characteristics of soil CO2 efflux variability in an aseasonal tropical rainforest in Borneo Island. Biogeochemistry 90, 275–289. doi: 10.1007/s10533-008-9253-0
Olesen, T., Moldrup, P., Yamaguchi, T., and Rolston, D. E. (2001). Constant slope impedance factor model for predicting the solute diffusion coefficient in unsaturated soil. Soil Sci. 166, 89–96. doi: 10.1097/00010694-200102000-00002
Pebesma, E. (2018). Simple features for R: standardized support for spatial vector data. R J. 10, 439–446. doi: 10.32614/RJ-2018-009
Pinheiro, J., and Bates, D., R Core Team. (2022). Nlme: linear and non-linear mixed effect models. R package version 3. 1–160. Available at: https://CRAN.R-project.org/package=nlme
Raich, J. W., and Schlesinger, W. H. (1992). The global carbon dioxide flux in soil respiration and its relationship to vegetation and climate. Tellus B 44, 81–99. doi: 10.3402/tellusb.v44i2.15428
Riutta, T., Kho, L. K., Teh, Y. A., Ewers, R., Majalap, N., and Malhi, Y. (2021). Major and persistent shifts in below-ground carbon dynamics and soil respiration following logging in tropical forests. Glob. Chang. Biol. 27, 2225–2240. doi: 10.1111/gcb.15522
Riutta, T., Malhi, Y., Kho, L. K., Marthews, T. R., Huaraca Huasco, W., Khoo, M. S., et al. (2018). Logging disturbance shifts net primary productivity and its allocation in Bornean tropical forests. Glob. Chang. Biol. 24, 2913–2928. doi: 10.1111/gcb.14068
Rodtassana, C., Unawong, W., Yaemphum, S., Chanthorn, W., Chawchai, S., Nathalang, A., et al. (2021). Different responses of soil respiration to environmental factors across forest stages in a southeast Asian forest. Ecol. Evol. 11, 15430–15443. doi: 10.1002/ece3.8248
Rubio, V. E., and Detto, M. (2017). Spatiotemporal variability of soil respiration in a seasonal tropical forest. Ecol. Evol. 7, 7104–7116. doi: 10.1002/ece3.3267
Saner, P., Loh, Y. Y., Ong, R. C., and Hector, A. (2012). Carbon stocks and fluxes in tropical lowland dipterocarp rainforests in Sabah, Malaysian Borneo. PLoS One 7:e29642. doi: 10.1371/journal.pone.0029642
Schlesinger, W. H., and Andrews, J. A. (2000). Soil respiration and the global carbon cycle. Biogeochemistry 48, 7–20. doi: 10.1023/A:1006247623877
Silver, W. L., Scatena, F. N., Johnson, A. H., Siccama, T. G., and Sanchez, M. J. (1994). Nutrient availability in a montane wet tropical forest: spatial patterns and methodological considerations. Plant Soil 164, 129–145. doi: 10.1007/BF00010118
Skopp, J., Jawson, M. D., and Doran, J. W. (1990). Steady-state aerobic microbial activity as a function of soil water content. Soil Sci. Soc. Am. J. 54, 1619–1625. doi: 10.2136/sssaj1990.03615995005400060018x
Sodhi, N. S., Koh, L. P., Brook, B. W., and Ng, P. K. L. (2004). Southeast Asian biodiversity: an impending disaster. Trends Ecol. Evol. 19, 654–660. doi: 10.1016/j.tree.2004.09.006
Sodhi, N. S., Posa, M. R. C., Lee, T. M., Bickford, D., Koh, L. P., and Brook, B. W. (2010). The state and conservation of southeast Asian biodiversity. Biodivers. Conserv. 19, 317–328. doi: 10.1007/s10531-009-9607-5
Sotta, E. D., Veldkamp, E., Guimarães, B. R., Paixão, R. K., Ruivo, M. L. P., and Almeida, S. S. (2006). Landscape and climatic controls on spatial and temporal variation in soil CO2 efflux in an eastern Amazonian rainforest, Caxiuanã, Brazil. For. Ecol. Manage. 237, 57–64. doi: 10.1016/j.foreco.2006.09.027
Soudzilovskaia, N. A., Vaessen, S., Barcelo, M., He, J., Rahimlou, S., Abarenkov, K., et al. (2020). FungalRoot: global online database of plant mycorrhizal associations. New Phytol. 227, 955–966. doi: 10.1111/nph.16569
Soudzilovskaia, N. A., van Bodegom, P. M., Terrer, C., Zelfde, M., McCallum, I., Luke McCormack, M., et al. (2019). Global mycorrhizal plant distribution linked to terrestrial carbon stocks. Nat. Commun. 10:5077. doi: 10.1038/s41467-019-13019-2
Tang, X., Pei, X., Lei, N., Luo, X., Liu, L., Shi, L., et al. (2020). Global patterns of soil autotrophic respiration and its relation to climate, soil and vegetation characteristics. Geoderma 369:114339. doi: 10.1016/j.geoderma.2020.114339
Terrer, C., Vicca, S., Hungate, B. A., Phillips, R. P., and Prentice, I. C. (2016). Mycorrhizal association as a primary control of the CO2 fertilization effect. Science 353, 72–74. doi: 10.1126/science.aaf4610
Weintraub, S. R., Taylor, P. G., Porder, S., Cleveland, C. C., Asner, G. P., and Townsend, A. R. (2015). Topographic controls on soil nitrogen availability in a lowland tropical forest. Ecology 96, 1561–1574. doi: 10.1890/14-0834.1
Wood, T. E., Cavaleri, M. A., and Reed, S. C. (2012). Tropical forest carbon balance in a warmer world: a critical review spanning microbial- to ecosystem-scale processes. Biol. Rev. 87, 912–927. doi: 10.1111/j.1469-185X.2012.00232.x
Wood, T. E., Detto, M., and Silver, W. L. (2013). Sensitivity of soil respiration to variability in soil moisture and temperature in a humid tropical forest. PLoS One 8:e80965. doi: 10.1371/journal.pone.0080965
Wright, S. J. (2005). Tropical forests in a changing environment. Trends Ecol. Evol. 20, 553–560. doi: 10.1016/j.tree.2005.07.009
Yee, A. T. K., Corlett, R. T., Liew, S. C., and Tan, H. T. (2011). The vegetation of Singapore—an updated map. Gard. Bull. Singapore, 63, 205–212.
Zhang, G., Zhou, G., Zhou, X., Zhou, L., Shao, J., Liu, R., et al. (2022). Effects of tree mycorrhizal type on soil respiration and carbon stock via fine root biomass and litter dynamic in tropical plantations. J. Plant Ecol. 16, 16:rtac056. doi: 10.1093/jpe/rtac056
Keywords: belowground carbon dynamics, fine root biomass, soil moisture, soil C efflux, Southeast Asia
Citation: Raczka NC, Ho QY, Srinivasan V, Lee MY, Ko C-W, Königer M, Chua T, Binny D, Ngo KM and Andersen KM (2023) Greater soil carbon losses from secondary than old-growth tropical forests. Front. For. Glob. Change. 6:1135270. doi: 10.3389/ffgc.2023.1135270
Edited by:
Alexandra C. Morel, University of Dundee, United KingdomReviewed by:
Keith John Bloomfield, Imperial College London, United KingdomCopyright © 2023 Raczka, Ho, Srinivasan, Lee, Ko, Königer, Chua, Binny, Ngo and Andersen. This is an open-access article distributed under the terms of the Creative Commons Attribution License (CC BY). The use, distribution or reproduction in other forums is permitted, provided the original author(s) and the copyright owner(s) are credited and that the original publication in this journal is cited, in accordance with accepted academic practice. No use, distribution or reproduction is permitted which does not comply with these terms.
*Correspondence: Kelly M. Andersen, a2VsbHkuYW5kZXJzZW5AbnR1LmVkdS5zZw==
Disclaimer: All claims expressed in this article are solely those of the authors and do not necessarily represent those of their affiliated organizations, or those of the publisher, the editors and the reviewers. Any product that may be evaluated in this article or claim that may be made by its manufacturer is not guaranteed or endorsed by the publisher.
Research integrity at Frontiers
Learn more about the work of our research integrity team to safeguard the quality of each article we publish.