 Kitty Kay Chan
 Alexander Golub
 Ruben Lubowski3†
94% of researchers rate our articles as excellent or good
Learn more about the work of our research integrity team to safeguard the quality of each article we publish.
Find out more
ORIGINAL RESEARCH article
Front. For. Glob. Change, 09 March 2023
Sec. Forest Management
Volume 6 - 2023 | https://doi.org/10.3389/ffgc.2023.1062551
This article is part of the Research TopicForest Carbon Credits as a Nature-Based Solution to Climate Change?View all 10 articles
Introduction: Jurisdictional pay-for-performance systems, with nested accounting of smaller project activities, offer potential to more rapidly scale up carbon finance for reducing deforestation as well as to ensure greater environmental integrity compared to stand-alone projects. However, the design and implementation of such programs raise numerous challenges, including for mobilizing upfront investment when there is a risk of non-performance at the jurisdictional level. This paper provides the first analysis to examine the use of insurance mechanisms to mitigate this jurisdictional delivery risk.
Methods: A conceptual model based on the theory of individual choice under uncertainty is developed to examine the impact of performance uncertainty on large-scale reductions in emissions from deforestation and forest degradation (REDD+). We calibrate the model to perform simulations of how reductions could change with and without the availability of revenue insurance as well as of a carbon buffer to manage performance risks.
Results: Performance uncertainty constrains the potential for large-scale mitigation supply when payments are contingent on emissions falling below a threshold level and when it is important to break even on payments to domestic actors. We show that insurance would allow jurisdictions to increase emissions reductions despite this uncertainty and that building a performance buffer offers nonlinear potential to unlock supply in a complementary manner.
Discussion: Private insurers, together with philanthropic and public funders, have a critical role to play in establishing an insurance market that can de-risk jurisdictional program investments and unlock forest conservation and other climate and nature protection efforts at scale.
At the Leaders' Climate Summit in April 2021, the United States, the United Kingdom, and Norway, and nine other companies announced the LEAF Coalition, a public–private partnership to protect tropical forests using forward commitments and price guarantees to pay at least $1 billion for emissions reductions at large jurisdictional (national and state/province) scales (Lubowski, 2021). Jurisdictional crediting systems, with nested accounting of smaller scale project-scale activities, offer the potential to more rapidly scale up emissions reductions as well as to ensure greater environmental integrity compared to stand-alone small projects (Schwartzman et al., 2021; DeFries et al., 2022). However, the design and implementation of such large-scale nested crediting systems raise numerous practical challenges that are only beginning to be considered.
This study focuses on addressing the risk to potential funders, jurisdictions, and nested project implementers (e.g., indigenous communities, private project developers, and landowners) when carbon credits or other result-based payments depend on the uncertain performance of an entire jurisdiction below a crediting baseline. In particular, this study develops a theoretical and simulation model to provide the first quantitative analysis to examine the use of insurance to mitigate this jurisdictional performance risk. The study examines the very particular risk posed within a jurisdictional and nested crediting structure of whether actors implementing activities that are nested within the jurisdiction can, in fact, receive the full market price for reductions or whether this price might be discounted due to jurisdiction-wide underperformance relative to the larger scale crediting baseline.
A conceptual model is developed to examine potential approaches to mitigate this risk based on the theory of individual choice under uncertainty (Mas-Colell et al., 1995; Hayashi, 2021). The model captures the situation in which the jurisdictional authorities are uncertain about the aggregate production that the jurisdiction can achieve due to various factors including the volatility of future agricultural commodity prices, which could increase the opportunity cost of protecting forests. These unexpected developments may lead policymakers and/or the implementing agents to fail to deliver the expected levels of emission reductions.
We calibrate the model to perform simulations to examine how the level of emission reductions might change with and without the use of revenue insurance as well as the willingness to pay to avoid risks of nonperformance. We also examine the option for jurisdictions to access a carbon buffer to hedge against performance risks. The results show that such approaches to insurance have the potential to play an important role in reducing the barriers to public and private investment to scale up emission reductions under jurisdictional scale programs.
There is growing scientific and stakeholder consensus that carbon finance for reducing deforestation should quickly be moving toward accounting at large, jurisdictional scales (e.g., countries or states), with crediting of smaller project-based activities “nested” or integrated within the larger accounting framework (e.g., COICA, 2023). Jurisdictional crediting aligns with the decisions on REDD+ under the UN Framework Convention on Climate Change as affirmed under the Paris Agreement, as well as the standards for REDD+ approved by compliance carbon markets, notably for international civil aviation as well as California.
Crediting systems based on the performance of an entire jurisdiction offer the potential to incentivize governments to pursue policy reforms and other measures that only governments can do. Large-scale accounting over both space and time brings important advantages in terms of environmental integrity, including capturing any leakage or shifts in deforestation within a jurisdiction (Schwartzman et al., 2021). Jurisdictional crediting also creates incentives for law enforcement, recognition of indigenous rights, and other policy measures that only the government can implement. Large-scale accounting also provides greater potential assurance of “additionality” (ensuring that the activity would not have happened anyway) by, for example, avoiding self-selection, which is inherent when smaller projects are free to voluntarily opt-in to participate in the program (van Benthem and Kerr, 2013). Large-scale accounting also supports systemic changes that can better assure “permanence” (ensuring that the climate benefits will not later be reversed) (Schwartzman et al., 2021; DeFries et al., 2022).
The LEAF Coalition represents an important step in terms of demonstrating both private sector and public sector willingness to pay for credits provided via jurisdictional systems as well as interest from various jurisdictions to develop credits. Nevertheless, there are various practical challenges to scaling up the implementation of jurisdictional and nested systems, including how to operate a multi-layer payment for environmental services program (Wunder et al., 2020).
An important feature of REDD+ is that it is result-based such that payments are made for results delivered, ensuring efficient use of climate resources and providing local actors with flexibility for implementation. However, when the achievement of a certain level of forest protection and resulting emissions reductions is uncertain, this creates a delivery risk for a jurisdiction and/or funders or investors supporting the jurisdiction that must make investments up front to later receive payments for certified emission reductions.
In this section, we explain how to build a probabilistic REDD+ supply function and develop an illustrative numerical example based on estimated uncertainty in the opportunity costs of forest protection. The government or other developers of a large-scale deforestation reduction program will face uncertainty about the resulting outcome from the interventions at a large scale. For example, natural disturbances, increases in commodity prices, or changes in government policy (e.g., at the federal level) might make it harder than expected for a jurisdiction to reduce emissions. We develop a stylized example where there is uncertainty over the marginal costs of reducing deforestation in a jurisdiction. For a stylized example, we focus on uncertainty in the opportunity costs of reducing deforestation. This will play an important role in determining the response of deforestation to jurisdictional programs, including incentive programs for conversation where land managers will trade off these benefits against the benefits of alternative land use. Opportunity costs will also determine the extent to which actors will take the risk of pursuing illegal deforestation, which could result in fines or other penalties.
We use data from global analyses to develop a stylized numerical example. We take the shape of a marginal cost function from the study by Busch et al. (2019), which uses an econometric approach to estimate the opportunity costs of tropical deforestation globally. Estimated costs are in present discounted values, considering 30 years of agricultural revenues and a real discount rate of 10%. This econometric approach captures the actual response of deforestation to changes in economic incentives for converting land and provides a more conservative estimate of the potential for reducing emissions than other modeling studies. Based on the shape of the curves estimated by Busch et al. (2019), we fit a quadratic function for mean values of emissions reductions supply for the different price levels and then scale down the global curve by 0.75% to construct a representative jurisdictional marginal abatement cost curve (MACC). This scaling was used for illustrative purposes, as it is the share of global deforestation emissions represented by a major forest jurisdiction in the Amazon. This yields an average estimated supply of 150 million metric tons (150 Mt) at $100/tCO2, which is approximately the average level of annual emissions over the past decade in the state of Mato Grosso, Brazil, the largest agricultural state in the Brazilian Amazon.1
To account for uncertainty, we apply the 95% confidence interval (95% CI) of supply from tropical forest conservation at $100/tCO2 reported by Griscom et al. (2017). We express the 95% CI in multiples of the mean: 0.48–1.52μ (or 0.61–1.42μ in 90CI), where μ denotes the mean value of supply. Using this range, the resulting 90th confidence interval is 92–213 Mt at $100/tCO2. A narrower confidence interval could reflect incentives created by the jurisdictional implementation program that reduces uncertainty in actors' responses to payments or other interventions. Different types of interventions and program designs could be associated with different levels of uncertainty. We consider a single cost curve for illustration purposes. Furthermore, for illustration purposes, we allow slight asymmetry in the distribution, fitting a lognormal distribution with a mean value of 150 million tCO2 and 185 million tCO2 in the 95th percentile of the distribution. A more precise assessment of the supply distribution requires a specific analysis of different risk factors, which is beyond the scope of our study.
The next step is the estimation of the probability distribution for coefficients of a quadratic function to match the supply distribution at $100/tCO2. The illustrative MACC has a form p = aQ2 + bQ where p stands for marginal cost and Q denotes emissions reduction. For calibration, we use log-normal distributions for each coefficient with a mean value equal to the value of the coefficient estimated for the mean value of emissions reduction. To calibrate the standard deviation of the confidence interval, we used an unsupervised randomized algorithm and selected the pair of values corresponding to the best fit of 90CI. The median value of the marginal abatement supply curve and the uncertainty range in the 90th confidence interval are presented in Figure 1.
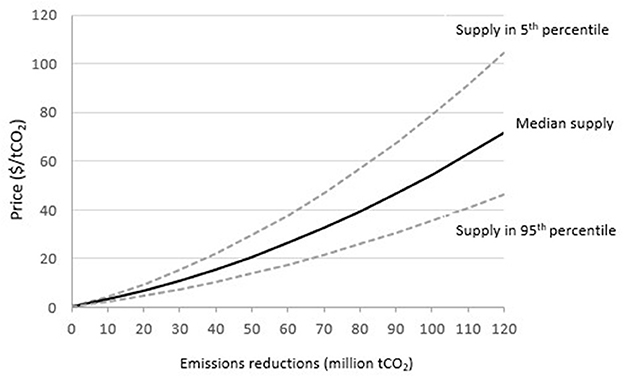
Figure 1. Uncertainty range of jurisdictional abatement supply (90th confidence interval).
The figure shows the degree of uncertainty of marginal costs to secure a given supply of emissions reductions. However, further analysis is needed to know the distribution of supply at a given price. Solving the quadratic equation aQ2 + bQ − p = 0, we express Q as a function of p. The exact supply is uncertain, so we need to estimate this degree of uncertainty based on the information we know already. Since we already know the probability density functions for coefficients a and b, we can compute the distribution of the supply of emissions reductions for each carbon price level. The distribution of emissions reductions and the shift to higher values as prices rise are shown for three illustrative price levels ($20, $25, and $30/tCO2) in Figure 2, based on 10,000 trials of a Monte Carlo simulation for each price.
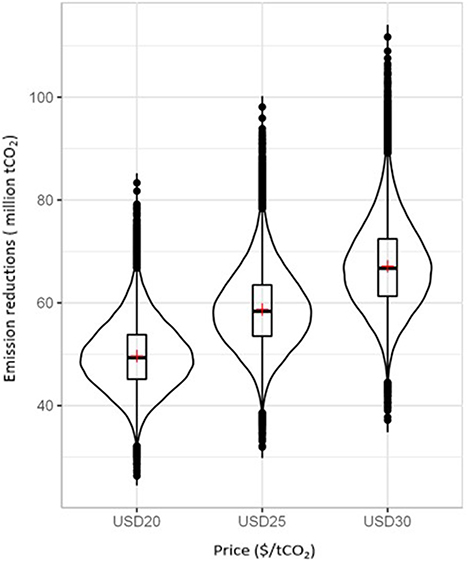
Figure 2. Distribution of jurisdictional emissions reductions under different carbon prices. Note: The violin plots show a kernel density estimation of the distribution of emission reduction outcomes based on 10,000 trials of a Monte Carlo simulation for each indicated price. The lower and upper edges of the rectangles in the box plots denote the interquartile range (25th and 75th percentiles), with the horizontal lines and crosses denoting the median and mean values, respectively.
A jurisdiction will likely need to meet a minimum required reduction threshold , before it is eligible to generate creditable emissions reductions. For example, under the ART-TREES standard, buffer requirements (to insure against the risk of credited emissions reductions being reversed in subsequent periods) range from 0 to 45% of reductions below the baseline, depending on mitigating factors. There is an added leakage deduction (to address the additional risk of deforestation shifting to areas outside of the jurisdiction) of up to 5% for subnational jurisdictions (ART, 2021). As an illustration, we consider million, which is 23% of 150, the mean abatement available and 19% of the 95% of 185 million tCO2. The market supply curve then shifts left, as shown in Supplementary Figure S1, such that at least 35 million tCO2 must be reduced before any credits can be generated.
Supplementary Figure S1 presents uncertainty in costs and potentially creditable emissions supply that can be offered to potential buyers with million. If the jurisdiction aims to reduce emissions by 20 million tCO2, the 90CI cost is $4.6 to $9.4, as shown in Figure 1, but to generate 20 million tCO2 of credits, the cost is $15.6 to $33.6, as shown in Supplementary Figure S1, since the emissions reductions achieved must now be 55 million tCO2.
If the jurisdiction offers implementing agents $20/tCO2, the supply of emission reductions in the 90CI is 37.6 to 65 million tCO2, but the jurisdiction can receive credit for only 2.6 to 30 million tCO2, as shown in Figure 1 and Supplementary Figure S1, respectively. If the jurisdiction signed contracts to sell 22.6 million tCO2 at $20/tCO2, the probability of failing to deliver that quantity is 5% (22.6 million tCO2 is the value of creditable supply in the 95th percentile at a $20 price). With a probability of 0.95 or higher, however, the actual supply of creditable emissions reductions will be ≥22.6 million tCO2.
This uncertainty creates a challenge for jurisdiction and its counterparties, both external and internal. What can a jurisdiction—or investors in a jurisdictional program—commit to paying internally, given that the realization of emissions reductions will be uncertain?
In this section, we propose a conceptual model to describe the jurisdiction's challenge in terms of managing ex-ante investments given the uncertain supply. We then examine potential approaches to mitigate the performance risk based on the theory of individual choice under uncertainty (Mas-Colell et al., 1995; Hayashi, 2021). The model incorporates the option for jurisdictions to access a carbon performance buffer by purchasing insurance, with an adjusted price based on historical performance to hedge against these performance risks.
We then calibrate the model to perform simulations to examine how the level of emission reductions might change with and without the use of the insurance mechanism and the impact on social welfare that jurisdiction would in theory be willing to pay to avoid such risk and the actual payment under an actuarial fair full coverage policy.
Let Q equal the verified reductions in emissions (abatement) that a jurisdiction achieves during a crediting period, annual, or otherwise, such that Q = EB − E where E denotes the verified emissions during the crediting period and EB is a counterfactual “baseline” for emissions, based on either historical levels or future projections that provides a benchmark against which emissions reductions might be calculated. For example, the ART-TREES standard used by the LEAF Coalition uses a 5-year historical average of emissions as the crediting line for a 5-year crediting period, with a requirement for this to readjust downward in each subsequent period (ART, 2021). For simplicity, we only consider the example of a single crediting period in our current model.
In practice, some standards provide additional requirements for the jurisdiction to further reduce emissions below the baseline before payments can be made. These requirements might be a minimum level of “own effort” that the jurisdiction might need to achieve (e.g., 15% below a 10-year historical average under the California Tropical Forest Standard) as well as additional deductions to ensure conservative crediting or to establish a buffer account to help insure against future reversals. Let where equals the crediting baseline, the level of emissions that the jurisdiction must fall under before it can start to sell reductions to the international market. We denote as the minimum abatement requirement for crediting and assuming it is exogenous and is pre-agreed upon between the jurisdiction and its potential buyers in an international market.
Given , we now consider the jurisdiction's challenge of how much to invest in reducing emissions given the uncertainty over the resulting supply, as discussed earlier. We make some simplifying assumptions. First, to focus on the issue of uncertain supply, we consider the potential international price as fixed and do not consider possible uncertainty in prices and possible strategies for handling that. Therefore, we consider that the jurisdiction can contract in advance for guaranteed payment from the international market at the price Pg emission reduction per ton for quantity achieved above the minimum abatement requirement for crediting.
Second, given this Pg, we consider that the jurisdiction offers a single fixed price per ton to its domestic implementing agents and that this must be committed to ex-ante. We assume that the jurisdiction pays the domestic agents fully for their emissions reductions once they are verified, but this does not depend on the aggregate performance of the jurisdiction. Thus, the individual agents bear the risk of their respective projects delivering reductions, but it is the jurisdiction, rather than the implementing agents, that bears the aggregate performance risk relative to the minimum requirement for crediting. Given its broader set of policy tools, the jurisdiction may be better able to manage risks at the landscape level than at the individual agent level. For simplicity, since our focus is on the aggregate performance risk, we assume the jurisdiction pays fully for any realized emissions reductions delivered by the local agents, without conditioning payments on a minimum quantity delivered at the individual project level. The best way to manage project-level delivery risks is a potential topic for other research.
In practice, jurisdictions can be expected to implement a mix of programmatic activities with different marginal costs, and that it may wish to offer different payments to local actors according to these activities. However, for simplicity, we consider the case where the jurisdiction simply offers a single fixed price per ton to domestic actors. The jurisdiction, thus, simply commits to paying local agents Pd, with 0 < Pdg, for each ton of emission reduction achieved. The jurisdiction's domestic price equals Pd = (1 − δ)Pg where 0 ≤ δ ≤ 1 is a “withholding rate” or share of the global price per ton that the jurisdiction does not directly pass on to local actors. We assume that δ is positive as a negative δ would imply the jurisdiction extracts a net tax rather than making a net payment to domestic actors. This could also be considered the case where the jurisdiction allows nested project-scale activities, integrated within the jurisdictional accounting to directly access the international market, with the requirement to contribute a percentage δ to the jurisdictional authority toward covering the costs (including managing the aggregate performance risks) of the larger program.
Third, we assume that the jurisdiction is budget-constrained and must fully cover the costs of the jurisdictional program with the revenues that it can earn from the sale of credits. To focus on the carbon market design challenges, we assume the jurisdiction is not able to use other public or philanthropic revenues toward underwriting the costs to produce other social and environmental benefits of the program, including any profits earned by domestic actors. Thus, the jurisdiction's constraint is to “break-even” on the program in terms of the revenues it receives from the carbon market. This can also be envisioned as a situation where the jurisdictional program is funded by private investors, including through potential bond issuance, and these investors must be paid back based on carbon revenues, with no other revenue streams available.
For the jurisdiction, the total payment collected from the international market must thus be equal to or greater than the total payment necessary to compensate the domestic agents. Thus, the total number of tons of emission reductions achieved by domestic agents needs to meet the following break-even condition, given fixed levels of Pg and , and the jurisdiction's chosen Pd:
Substituting for Pd yields:
This can be simplified as follows:
This implies as follows:
is the minimum number of total tons of emission reduction the jurisdiction needs to achieve to break even. The break-even quantity is inversely proportional to the withholding level of the global price δ and must be equal to (when δ = 1) or greater than (for δ < 1) the threshold level . The smaller the withholding, all else equal, the less revenues the government collects and the greater the level of emissions reductions required for the jurisdiction to break even on its payments to the implementing agents and vice versa.
Rewriting the formula in terms of the withholding rate as follows:
This yields a feasible schedule of to ensure break even. As a numerical example, we return to the example of jurisdiction with 35. Figure 3 shows the feasible combination (loci) of domestic abatement prices and quantities that ensure break even, depending on different levels of global prices for credits from $20 to $90/tCO2. The jurisdiction cannot offer anything to local actors until the quantity of emissions reductions exceeds the threshold and in turn can offer more, as the realized quantity increases such that more credits are generated that can be sold internationally. All else equal, more can also be offered to local actors, as the global price increases. Thus, the actual quantity of emission reductions realized at the jurisdictional level, Q could generally fall under one of the following scenarios: (i) below the minimum emission reduction requirement and not eligible to receive payment from the international market, (ii) above the minimum requirement for crediting but not covering the payment required to reimburse the total number of tons of emission reduced by domestic agents Q, and (iii) above and covering the total payment required to reimburse the domestic agents so as to break even.
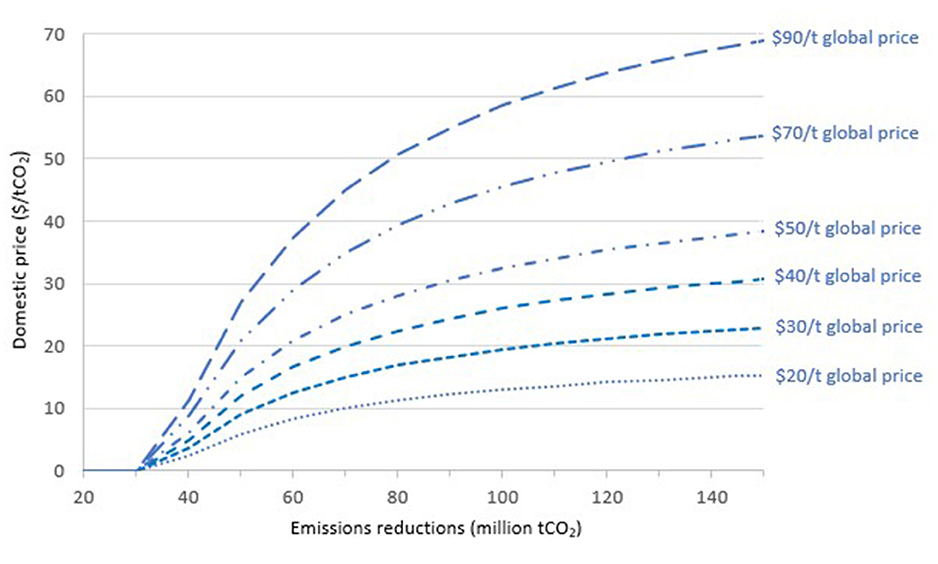
Figure 3. Feasible combinations of domestic abatement prices and quantities consistent with break even, by different global prices for credits. Note: For each level of domestic prices paid for abatement, lines denote the minimum quantities of realized abatement that ensure break-even, given the indicated global price for credits. The minimum abatement requirement () is assumed to be 35 million tCO2 such that international payments are only made for abatement exceeding that level.
The jurisdiction aims to achieve an emission reduction level at or above the break-even level but faces the challenge of being uncertain about the aggregate emission reduction that it will achieve at any given price. Even with no information asymmetry among jurisdictions and implementing agents, the jurisdictional authorities and the implementing agents still face other factors including the volatility of future agricultural commodity prices, which could increase the opportunity cost of protecting forests. These unexpected developments may lead policymakers and/or the implementing agents to decide not to deliver the expected levels of emission reductions. This challenge is illustrated in Figure 4, which combines the information in Figures 1, 3. This shows that a price of $20 is no longer sufficient for the jurisdiction to break even within the 90% confidence interval of supply. With an international price of $50, the jurisdiction can offer around $20 so as to break even with the 95th top percentile of supply (i.e., with just a 5% probability of achieving that level) while a price of around $70 is needed to offer around $25 and approach the median (50th percentile) level of supply. A price of around $90 is needed for the jurisdiction to offer approximately $35 and generate supply at the 5% percentile level (i.e., with a 95% probability of achieving that level).
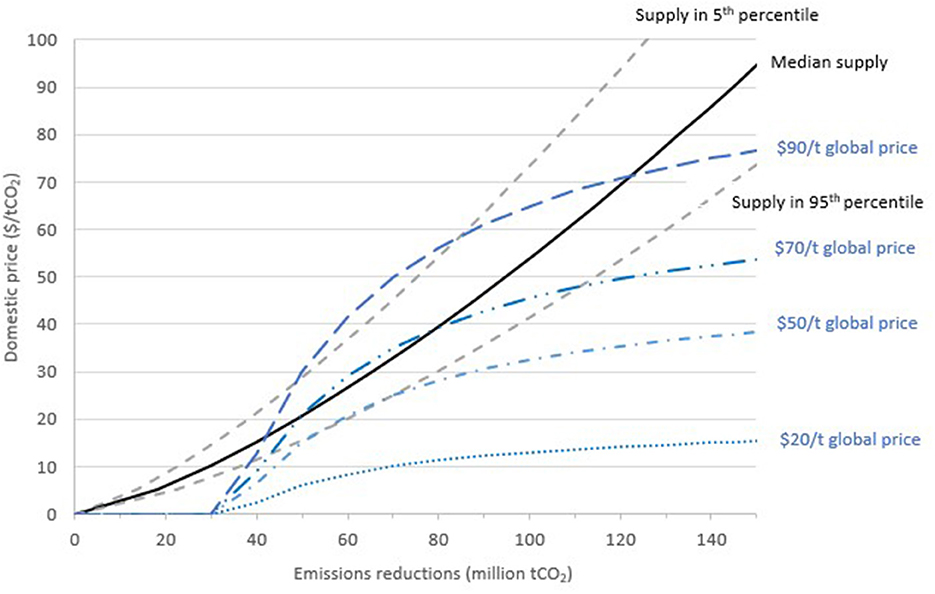
Figure 4. Abatement supply curve and feasible combinations (in blue) of domestic abatement prices and quantities consistent with the jurisdiction breaking even. Note: Figure combines information shown in Figures 1, 3. For each level of domestic prices paid for abatement, lines in blue denote the minimum quantities of realized abatement that ensure break-even, given the indicated global price for credits. Assumed minimum abatement requirement () equals 35 million tCO2 such that international payments are only made for abatement exceeding that level.
Higher domestic prices will stimulate greater supply, given the upward sloping supply curve, but also in turn require higher emissions reductions to break even as a result of the higher costs that must be recovered. Figure 4 shows that under certain circumstances, there may be multiple domestic prices that generate supply with the same level of confidence in breaking even. For example, at the $50 global price and 95% of supply (i.e., with a 5% probability of achieving it), break even can be achieved with a domestic price from around $15/ton to $25/ton, reducing 45–70 million tCO2, respectively. Higher global prices are needed to break even with a greater level of probability.
Therefore, even with relatively high international prices, in the presence of a performance threshold, a jurisdiction (or investors in its program) may lack sufficient certainty of cost recovery to commit to paying its domestic actors. In the next section, we consider the potential role of insurance to help manage the jurisdiction's performance risk and unlock greater jurisdictional supply.
To mitigate the risk of not meeting the break-even quantity, we consider the case where a jurisdiction is provided with the opportunity to purchase a specialized form of insurance. For simplicity, we consider a form of revenue insurance that will top up the jurisdiction's net revenues to ensure these will always be at or above a desired level and at or better than break even. We assume the supplier of the insurance prices the insurance at an actuarially fair rate, such that the price charged exactly equals the expected payout, adjusted for the anticipated probabilities of the different outcomes given all available information. As jurisdictions establish a track level of jurisdictional performance, the organization can continue to adjust the price of its insurance upwards or downwards incorporating the information that is revealed to the actual performance risks. As discussed in the conclusion, insurance might also be provided through a physical carbon buffer that the jurisdiction could establish and then use as a reserve of tons that can later be tapped upon if needed to cover a shortfall in emission reductions.
This section outlines a conceptual model for the provision of actuarially fair insurance to insure the authority governing the program against risks of different levels of jurisdictional non-performance, with the full mathematical details provided in the Supplementary material. We consider the risks of achieving the emissions reductions needed for the authority to receive payments from the international market as well as to fully cover the costs of implementing its program. We consider different potential states of the world defined in terms of the realization of emissions reductions Qk indexed by k = 0…Qmax. We use Qh to denote the total number of tons of emission reductions achieved when the quantity realized is at a “high” level. Qh ranges at or above the break-even quantity up to a maximum abatement potential Qmax. Furthermore, wh represents the associated “wealth” level of the jurisdiction given Qh. Assuming administrative costs are zero for simplicity, the wealth level of the jurisdiction is defined as the net revenues from the REDD+ program that are retained by the jurisdictional program authority:
Assuming the probability pk of any realization Qk given Pd, then for a given domestic price Pd, and threshold , the expected level of wealth equals the sum of the net revenues weighted by the associated probabilities for all possible realizations of quantity where as follows:
As noted earlier, we focus on the problem of a governmental authority concerned about ensuring a budget surplus. Nevertheless, the issues are also applicable to the case of public or private investors funding the jurisdiction, or potentially, other actors such as an indigenous community directly implementing a large-scale emission reduction program. We further assume a degree of risk aversion. For simplicity, the jurisdiction only considers its own budget situation and does consider the overall economic surplus that agents within the jurisdiction may be earning from the program. This is likely to be the case at least for a fraction of REDD+ program revenues, as well as the case for commercial investors simply seeking financial returns whether through a bond or other structures.
We use Ql to denote the total number of tons of emission reductions achieved when the realized quantity is “low” such that the break-even quantity has not been reached. The jurisdiction will only receive payment from the international market if Ql is above . However, it always must bear the committed costs of the quantity of emission reductions realized at the domestic level by local agents.
We illustrate two different “low” scenarios and the corresponding levels of wealth: wl1 is the wealth in “low” case 1 where no revenues are received at all since the quantity falls below , and wl2 is the wealth in “low” case 2 where is exceeded but the realized quantity falls below the necessary level to achieve break even. We distinguish these two cases given that the type of risk may be perceived differently by the jurisdiction and the insurance providers. The jurisdiction may want to insure against both wl1 and wl2. However, some insurers may only want to insure against wl2, as they may want the jurisdiction to at least have some minimal performance requirement, given potential concerns about moral hazard as discussed later.
We assume the jurisdiction is risk-averse with a concave utility function, u(·). While the precise results will vary with the specific functional form applied, the use of an exponential utility function is most suitable for our illustrative examples, as it allows for capturing risk aversion and the utility level corresponding to a negative wealth level. This characteristic is particularly important for the problem analyzed here where the jurisdiction runs the risk of negative net revenues, as it must pay its domestic agents for realized emissions reductions even if the jurisdiction as a whole does not meet the minimum abatement requirement for crediting. In addition, even if the jurisdiction meets but does not achieve , its wealth level, measured as net government revenues, could still be negative.
To simplify, we restrict attention here to the case where the jurisdiction seeks to fully ensure against the case of not meeting Qh, which is at or above We examine the implications of insurance for emission reductions and gains in economic surplus in the insurance market. We restrict considerations of economic surplus to the consumer surplus associated with the willingness to pay off the jurisdictional authorities (and/or potential funders) from purchasing the insurance contract.
In our scenario, the insuring organization in this case is not profit-making such that it does not earn a producer surplus. To simplify the model, we also assume no administrative costs associated with the insurance provision. The actuarially fair price for a full insurance policy equals the expected cost, C, equal to the probability of not meeting the insured-against quantity Qh multiplied by the benefit payout, B, to jurisdictions when the quantity is not achieved.
Expanding on Frank (2021), the consumer surplus, CS, captures the difference between the premium the jurisdiction pays for the insurance, C, and the maximum willingness to pay MWTP, for insurance, against failing to meet its goal Qh, as follows:
MWTP is the difference between the total wealth generated by the jurisdiction when it achieves its goal, wh, and the certainty equivalent CE, which is the minimum monetary amount that the jurisdiction is willing to accept in order not to take the risk of not meeting a particular higher but uncertain quantity. The MWTPl to avoid both “low” states 1 and 2 is as follows:
Certainty equivalence can be derived by setting the expected utility of wealth generated by the jurisdiction to the utility of the certainty equivalent (Mas-Colell et al., 1995).
In practice, it will be difficult to price this insurance in an exactly actuarially precise manner. However, over time, a jurisdiction that has proven to have a better record in meeting its threshold for crediting and break-even level should be eligible to access the insurance at a discounted price. This can be considered a simplified representation of a form of Bayesian updating of the prior probabilities associated with each of the “low” states. Thus, the jurisdiction is assigned a set of performance risk scores, γ with 0 ≤ γ ≤ 1, such that
γ = 1 indicates the jurisdiction receives no discount, while the better a jurisdiction's performance in meeting the crediting threshold and break-even quantity, the lower its risk score applied to its future performance.
We now calibrate the conceptual model to examine (i) the emission reduction level with and without the use of the insurance mechanism and (ii) the impact on economic welfare in terms of a jurisdiction's willingness to pay to avoid the risk of not meeting its emission reduction goal. As per the stylized numerical example mentioned earlier, the minimum threshold requirement is 35 million tCO2. We later consider alternative scenarios with lower levels of this threshold.
International prices for REDD+ credits in the voluntary market were approximately $4 in 2021 (Ecosystem Marketplace, 2022) but have risen sharply. Voluntary market prices for credits are forecast to reach $80—$150 by 2030 (EY, 2022). We examine the global price range between $30 and $90 with $20 increments. The prices offered to domestic agents are set to vary in $1 increments up to the global price.
We consider the case where the jurisdiction chooses a target level of wealth associated with the emission reduction goal, Qh*, which is set at the 50th percentile of expected probability such that πh=0.5. For each level of domestic price Pd, each potential Qk and its associated probability pk are derived using the probability density function as shown in Figure 2.
Studies have suggested that risk tolerance R typically ranges from 100 to 150% of net income (McNamee and Celona, 1990; Kirkwood, 2004). While the tolerance might be higher for a jurisdiction than for individuals, for purposes of illustration, we use 125%, the mid-point of this range. Under the global prices ranging between $30 and $90 with $5 increments at 125%, R is approximately $60, $108, $250, and $204 million when the minimum threshold requirement as 35, 25, 15, and 5 million tCO2, respectively. In practice, the risk tolerance level can be adjusted by a jurisdictional program authority to calibrate such analysis to the level of risk that it can bear.
As shown in Figure 4, with a minimum abatement requirement for crediting at 35 million tCO2, global prices of $30/tCO2 and $50/tCO2 are not high enough to induce emission reduction levels (at the 50th percentile) that would be at or higher than the break-even requirement. In addition, with global prices of $70/tCO2 and $90/tCO2, break even is possible as long as the domestic price is within a certain range. Relatively, low domestic prices do not provide enough incentive for domestic agents to generate emission reductions above the break-even level. On the other hand, relatively high domestic prices raise the break-even quantity, , to a level that the quantity of emission reductions realized at the domestic level is not enough to meet such a high level of break-even quantity. Figure 5 illustrates this situation with the global price of $70/tCO2. A domestic price below $20 does not provide enough incentives for domestic agents to generate emission reductions above the break-even level, with at least a 50% probability. To ensure break even with a 50% probability, the jurisdiction needs to set the domestic price in a range from $20 to $38 per ton.
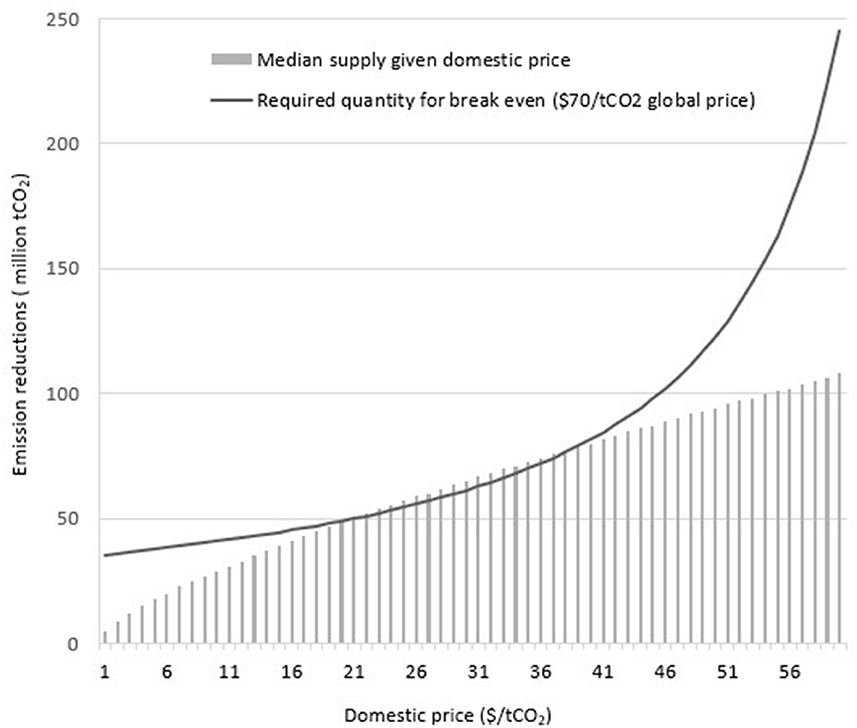
Figure 5. Median supply of emissions reductions relative to break-even requirement, for global price of $70/tCO2. Note: Figure assumes a minimum abatement requirement (tCO2) equal to 35 million tCO2 such that international payments are only made for abatement exceeding that level.
Even within this price range, the jurisdiction still faces uncertainties of not breaking even, since the results only show the emissions reductions achieved or exceeded with a 50% probability. This uncertainty could entail a prohibitive level of risk for committing public funding or obtaining private sector investment (e.g., through a bond issuance) on the back of future carbon market revenues. This is because any emission reduction effort that produces a quantity below the break-even threshold translates to a negative wealth impact on the jurisdiction. Without the option to purchase insurance, therefore, the jurisdiction may decide not to undertake any emission reduction activities at all.
We now simulate the provision of insurance, which could provide confidence to policymakers and potential investors by avoiding the risk of falling below break even. As an example, we consider the goal Qh, to be the 50% of emissions reduction at each domestic price level, and restrict attention to those levels of the domestic price that are sufficient to ensure break even with a 50% probability. We start with examining scenarios based on a global price of $70/tCO2 and a minimum abatement requirement for crediting 35 million tCO2. The expected levels of emission reductions when Q is at or above the 50% goal and when Q falls below this goal are shown in Supplementary Figure S2. The jurisdiction's emission reductions range from 18 to 30 million tCO2, with an average of 24 million tCO2 in the case when it is not able to meet its goal. When the jurisdiction can meet its goal, its expected emission reductions increase between 49 and 77 million tCO2, for prices from $20 to $38 per ton, that is, the jurisdiction's average emission is ~40 million tCO2 lower when the jurisdiction is not able to meet its goal.
We now examine the wealth impact with and without the option to purchase performance insurance when a jurisdiction fails to meet its goal. In regards to the price of performance insurance, results from the simulation suggest, with at 35 million tCO2, the actuarially fair full insurance ranges between $28 and $42/tCO2 for a global price between $70 and $90/tCO2. By construction, under an actuarially fair full insurance policy, the jurisdiction's expected wealth remains the same as without the insurance policy after deducting the price paid for the insurance premium. However, the key here is that without the insurance, the jurisdiction may otherwise decide not to undertake any emission reduction activities at all given the excessive level of risk. This is because any emission reduction effort that produces a quantity below the break-even threshold translates to a negative wealth impact on the jurisdiction.
Figure 6 shows the negative impact on wealth, with and without the option to purchase performance insurance when the jurisdiction fails to meet its reduction goal Qh (set at the 50th percentile of the probability distribution). In the case when the global price of $70//tCO2 and at 35 million tCO2, without an option to purchase insurance, this translates to a potential loss of $199 million if the jurisdiction does not meet its goals and a potential loss of $338 million if the jurisdiction decided not to undertake any emission reduction activities. In the case when the global price of $90//tCO2 and at 35 million tCO2, without an option to purchase insurance, this translates to a potential loss of $320 million if the jurisdiction does not meet its goals and a potential loss of $952 million if the jurisdiction decided not to undertake any emission reduction activities.
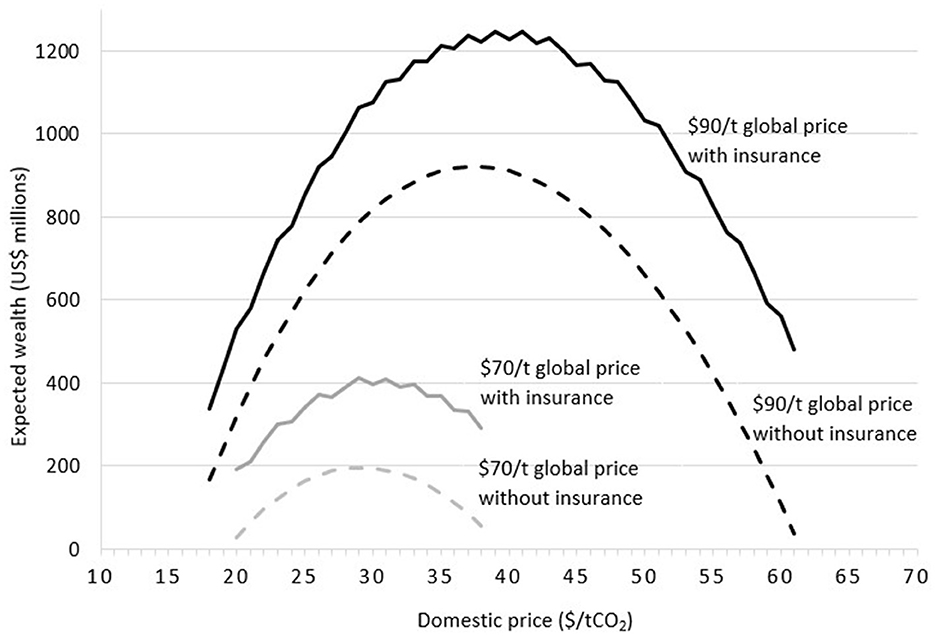
Figure 6. Expected wealth with and without insurance, if jurisdiction fails to meet goal (Qh). Note: Vertical axis shows expected (probability-weighted) wealth of jurisdiction. Assumed minimum abatement requirement () equals 35 million tCO2 such that international payments are only made for abatement exceeding that level.
As discussed earlier, in addition to making it possible for the jurisdiction to meet or go beyond the break-even emission reduction level, the provision of insurance could create an economic surplus when the jurisdiction's willingness to pay is lower than the actual payment to mitigate such risk. We now examine economic surplus. We also examine the effect on the economic surplus of setting the minimum abatement requirement for crediting at 5, 15, and 25 million tCO2.
Figure 7 shows the expected economic surplus for global prices of $70 and $90/tCO2 and the threshold requirement at 35 million tCO2. For an international price of $70, the economic average of the economic surplus is $81 million. For an international price of $90, the expected economic surplus jumps to $572 million, given that there is a jump not only in the price but also in the number of profitable outcomes. This is consistent with the expectation that as global price increases, with domestic price remaining constant, the quantity of emission reductions that could be covered by the international market increases. Figure 7 also illustrates the effect of changing the minimum abatement requirement for crediting. As discussed earlier, at the global price of $70/tCO2 and a minimum threshold requirement of 25 million tCO2, the jurisdiction will participate when the domestic price ranges from $20 to $38 per metric ton. When the minimum threshold requirement falls to 25, 15, and 5 million tCO2, the price range expands to $11 to $51, $5 to $60, and $2 to $67 per metric ton, respectively. The results also indicate that as the minimum crediting requirement decreases, at a given global price and with access to insurance, the positive impact on consumer surplus to emission reductions increases. This is because there is a wider range of domestic prices such that the jurisdiction can meet break even as the minimum abatement requirement decreases.
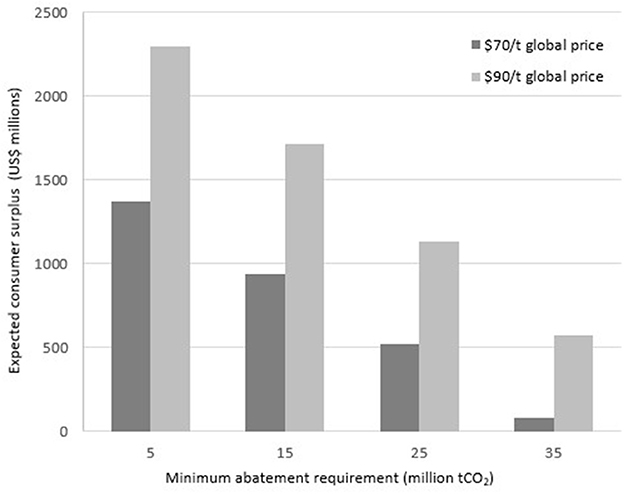
Figure 7. Minimum abatement requirement and expected jurisdiction consumer surplus with insurance. Note: Vertical axis shows expected (probability-weighted) consumer surplus of jurisdiction. Assumed minimum abatement requirement () varies as indicated across horizontal axis.
Earlier, we noted that a jurisdiction that has established a record of meeting its threshold and break-even level could be eligible to access the insurance at a discounted price based on an assigned performance risk score. The better a jurisdiction's performance in meeting threshold and break-even quantity, the lower its performance score. As the score decreases, economic surplus increases. In our illustrative example, with a global price of $70 and $90 t/CO2 and a minimum requirement of 35 million metric tons, a one-point decrease in performance risk score increases the average economic surplus by about $3 million.
Similar to reducing the minimum abatement requirement for crediting, a physical “buffer” of emissions reductions that could be tapped and sold to international buyers in the case of underperformance would provide another approach to insuring the risk of failing to meet a break-even level of reductions. This buffer could potentially be built up by jurisdiction over time, providing a form of self-insurance. Figure 8 shows the potential of such a buffer to unlock emissions reductions at the 50th percentile of supply for different levels of international prices, based on the different levels of domestic prices that the jurisdiction would be willing to offer that is consistent with break even, as shown in Figure 3. The buffer level is varied at 5 million ton intervals. No buffer is needed to allow reductions consistent with break even at prices of $70 and $90, but emissions reductions are not feasible at lower prices without a buffer. However, a buffer of 0–5, 5–10, 10–15, and 15–20 million tons, respectively, enables emissions reductions consistent with break even at international prices of $50, $40, $30, and $20/t CO2. Progressively greater buffers allow for greater reductions at each price level. Notably, for most of the price ranges and buffer sizes, each million ton of buffer enables more than 1 million ton of emissions reductions (a purely one-to-one linear relationship with the buffer is illustrated by the 45-degree line in black).
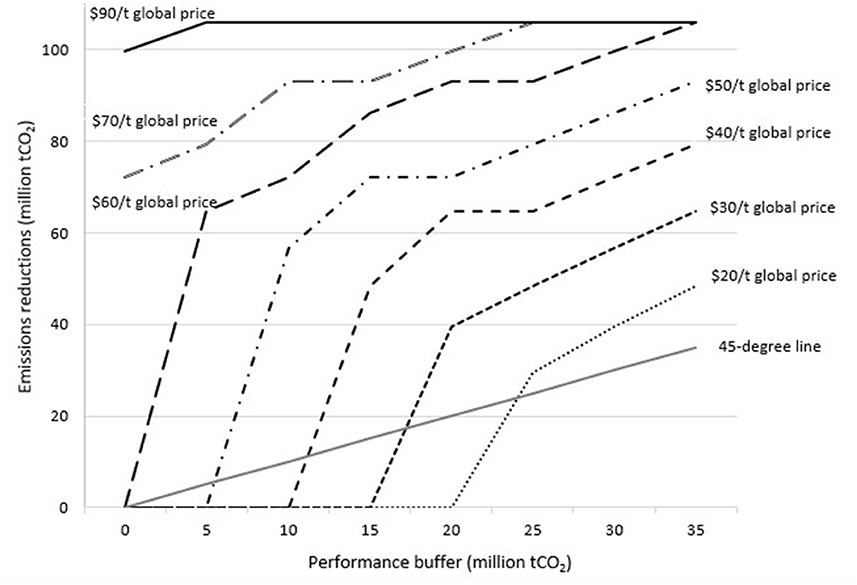
Figure 8. Performance buffer and median supply of emissions reductions at or above break-even, by different global prices. Note: Assumed minimum abatement requirement () equals 35 million tCO2 such that international payments are only made for abatement exceeding that level.
The relationship between a buffer and the feasible emission reductions consistent with break even varies according to different percentiles of the supply distribution (Supplementary Figure S3). A buffer of 10–15 million tons is needed to ensure break even if it is necessary to have a 95% confidence level of supply. The required buffer size falls to 5–10 million tons at the 50th (median) and 75th percentiles, at 0–5 million tons at the 25th percentile, and no buffer at the 5th percentile of supply. This shows how greater reductions are feasible if the jurisdiction can take on more risk of not breaking even, or similarly if the jurisdiction can increase its confidence in the feasibility of different levels of supply.
There is increasing consensus around the environmental and social benefits of moving from small to larger scale emissions reductions under carbon market crediting systems for REDD+ (COICA, 2023). However, the mobilization of large-scale finance will be necessary to implement these approaches. This study demonstrates the critical role of performance uncertainty in constraining the potential for large-scale mitigation supply when payments are contingent on emissions reductions exceeding a threshold level and when there is a need to break even on payments to domestic actors. This would be the case of a jurisdiction that is budget constrained, rather than able to finance emissions reductions with its own domestic resources to meet climate and/or other environmental and social goals. This would also be the case for private investors or other private actors investing with the requirement of a commercial return.
One approach would entail lowering the performance requirements, but this would have tradeoffs with environmental integrity, also potentially limiting demand. Higher international prices could also compensate for the risk but could greatly limit the demand. Our numerical simulations likely overstate the level of prices that will be needed as it is based on cost curves estimated from the price sensitivity of historic land-use decisions rather than the range of government policies (e.g., law enforcement, designation of protected areas) that have demonstrated potential to reduce emissions at low budgetary costs. We also consider the case where the jurisdiction only seeks to cover its budgetary costs without considering the economic benefits to local actors. Different jurisdictions may also have higher levels of risk tolerance. Nevertheless, our analysis suggests that uncertainty over performance could require significantly higher prices to assure break even. Performance uncertainty is, thus, an important concern for REDD+ and other forms of large-scale emissions reductions. Even if uncertainties can be characterized, the risk of failing short on performance is likely to be a powerful hindrance to public and private investors that are seeking to finance high-quality and high-integrity emissions reductions at scale.
We illustrate how insurance has the potential to play an important role in addressing this risk and mitigating the barriers to large-scale public and private investments. We show that actuarially fair insurance would allow jurisdictions to deliver large-scale emissions reductions despite performance uncertainty. Based on our illustrative simulations, given sufficiently high carbon prices, jurisdictions would be willing to pay for insurance and could develop a significant welfare surplus from the purchase of insurance to mitigate uncertainties over performance. As jurisdictions can develop a track record of performance, insurance costs could fall, providing further welfare gains.
Major insurance companies have already identified promoting natural climate solutions, including forest protection, as a top priority for new insurance products as well as direct investments (e.g., AXA, 2022). However, it may be difficult for private companies to provide this insurance given unfamiliarity with the likely probabilities and potential concerns over the moral hazard, such that jurisdictions receiving insurance will have lower incentives to manage risks, particularly if insurance is not conditional on meeting a particular level of performance. A central feature of REDD+ is that it is performance-based. A concern could be that access to insurance might encourage jurisdictions to underperform. Given the high cost of insurance, this is less likely to occur if future insurance rates are conditioned on past performance, creating an incentive for jurisdictions to establish a successful track record.
The challenges faced by private insurers suggest a potential role for philanthropy and potential public and multilateral donors and development finance institutions to work with jurisdictions and private insurers to jump-start the mechanism. Organizations such as the World Bank, Green Climate Fund (GCF), and Development Finance Corporation, together with philanthropic and public donors could potentially act as reinsurers to facilitate the creation of insurance businesses for REDD+ and reduce insurance costs with a consequential increase of private investment in jurisdictional REDD+. They might also offer insurance directly to jurisdictions on a concessional basis, based on a clear definition, monitoring, and verification of the investments to be made by the jurisdiction. Philanthropic and public donors also have an important role to play in supporting jurisdictions in capacity development and other investments that reduce risks of non-performance.
While insurance could play an important role to unlock large-scale reductions, the creation of a performance buffer offers the nonlinear potential to unlock supply. Such buffer could be accumulated at the level of a jurisdiction over time (or across different actors within a jurisdiction) to enable self-insurance or could potentially be funded initially by philanthropic or public donors. A question will be the willingness of the buyers to pay for buffer tons to “top up” jurisdictional performance to ensure the break-even level of reductions is met. There is also potential for a pooled buffer across jurisdictions if buyers or other funders would be willing to accept reductions that are not tied to any particular location. Furthermore, the greater the flexibility of the buyers, the greater the potential to develop a buffer with a greater set of emissions reductions from different time periods and potentially different types of emission reduction activities.
Insurance and a performance buffer could not only be used as stand-alone strategies but also have potential synergies for a mixed strategy to reduce risk and deliver high-quality emissions reductions. Insurance could help enable emissions reductions that support the creation of a buffer over time. Furthermore, the creation of a buffer at the level of a jurisdiction could in turn make a jurisdiction more insurable. Potential insurance providers themselves may also build up a buffer as the basis for their willingness to provide insurance or act as re-insurers.
There is a growing awareness of the importance of credit quality and the importance of large-scale crediting approaches for protecting forests. Buyers of REDD+ emissions reductions are looking for emissions reductions that would satisfy strict jurisdictional crediting criteria such as the ART-TREES standards used by the LEAF Coalition. Higher quality standards may make emission reductions more expensive, but protection and restoration of tropical forests remain the most cost-efficient mechanism to reduce emissions, with a benefit-cost ratio of >5 (Fuss et al., 2021). In addition, REDD+ can provide a large volume of emissions reduction in a timely manner when it is needed most to narrow the emissions. Nevertheless, scaling up REDD+ requires both private and public investments.
We develop a conceptual model and numerical simulations that demonstrate the potential power of REDD+ performance insurance and buffer creation strategy as important instruments to scale up REDD+ supply under jurisdictional crediting programs. Our analysis demonstrates how uncertainty over future performance can significantly increase the cost and decrease potential investment when there is a performance threshold that must be achieved before crediting begins. We, then, show how insurance mechanisms are a solution that could reduce risks and unlock environmental and economic benefits.
We considered the case where the jurisdictional government is the primary actor and can obtain a form of actuarially-fair revenue insurance to mitigate the risk. We also examine the case of a performance buffer to mitigate risk. In practice, a combination of instruments could be used. There may also be important uncertainties about the performance of government authorities, rather than about more decentralized local agents. Performance insurance and buffers could thus be applied at different levels of performance from national, subnational, and actor-specific levels. A surety bond is one widely used approach in construction and public works projects where contractors must post a bond that provides insurance to investors or other clients against the risk of default (Jing et al., 2020; Giacomelli and Passalacqua, 2021). In the case of jurisdictional REDD+ and other climate mitigation, such a mechanism could be appropriate at the level of different local agents, project developers, or government authorities depending on the nature of the performance risk and who is closest to managing it.
The insurance and simulation model could be extended to consider multiple periods of crediting, including the potential resetting of the baseline over time. Additional research could also focus on empirical estimation of potential performance risks to support estimates of actuarially fair insurance rates. Research could also inform how risks can be mitigated through different program designs for jurisdictional REDD+ programs, as well as how these could be diversified at the international level. This could include spatial designs for reducing risks of reversals (McCallister et al., 2022), payments for landowners indexed to agricultural commodity prices (Engel et al., 2021), as well as financial approaches to address the underlying pressures on forests [e.g., via a revolving fund to support the intensification of cattle running on already deforested land instead of additional deforestation (Golub et al., 2021)].
High-integrity carbon markets and other forms of result-based finance will be needed to protect tropical forests and achieve climate mitigation at the scales and speed required. However, given a broad set of uncertainties at this early stage of market implementation, result-based finance approaches that require ambitious performance entail the risk that could significantly diminish government and private investors' appetite to commit capital at sufficient scales to unlock the required mitigation. Once these programs are underway, this should simplify further rounds of insurance by providing more data as well as emissions reductions that could potentially start building a buffer that could support future rounds of insurance. Private insurers and philanthropic and public donors have a critical role to play in kickstarting and building an insurance market that can de-risk these programs and unlock natural climate solutions and other forms of urgent climate and nature protection at scale.
The original contributions presented in the study are included in the article/Supplementary material, further inquiries can be directed to the corresponding author.
KKC, AG, and RL jointly designed research, developed conceptual model, conducted simulations, and wrote the manuscript. All authors contributed to the article and approved the submitted version.
The authors thank Peter C. Goldmark, Jr. for inspiration on the value of performance bonds to unlock large-scale investment in forest protection.
The authors declare that the research was conducted in the absence of any commercial or financial relationships that could be construed as a potential conflict of interest.
All claims expressed in this article are solely those of the authors and do not necessarily represent those of their affiliated organizations, or those of the publisher, the editors and the reviewers. Any product that may be evaluated in this article, or claim that may be made by its manufacturer, is not guaranteed or endorsed by the publisher.
The Supplementary Material for this article can be found online at: https://www.frontiersin.org/articles/10.3389/ffgc.2023.1062551/full#supplementary-material
1. ^While this downscaling approach serves for illustrative purposes, a specific analysis would be needed for a particular application to Mato Grosso or other jurisdiction given that opportunity costs and associated uncertainties are likely to vary widely across jurisdictions.
ART (2021). The REDD+Environmental Excellence Standard (TREES), Version 2.0. Arlington, VA: Winrock International. Available online at: https://www.artredd.org
Busch, J., Engelmann, J., Cook-Patton, S. C., Griscom, B. W., Kroeger, T., Possingham, H., et al. (2019). Potential for low-cost carbon dioxide removal through tropical reforestation. Nat. Climate Chang. 9, 463–466. doi: 10.1038/s41558-019-0485-x
COICA CI, EDF, IPAM, TNC, WCS, WRI and WWF. (2023). Tropical Forest Carbon Credit Integrity Guide for Companies: Differentiating Tropical Forest Carbon Credits by Impact, Quality, and Scale. Washington, DC.
Defries, R., Ahuja, R., Friedman, J., Gordon, D., Hamburg, S. P., Kerr, S., et al. (2022). Land management can contribute to net zero. Science. 376, 1163–1165. doi: 10.1126/science.abo0613
Ecosystem Marketplace (2022). The Art of Integrity: Ecosystem Marketplace's State of the Voluntary Carbon Market 2022 Q3. Washington, DC: Forest Trends.
Engel, S., Palmer, C., Taschini, L., and Urech, S. (2021). Conservation payments under uncertainty. Land Econ. 91, 36–56. doi: 10.3368/le.91.1.36
EY (2022). Essential, Expensive and Evolving: The Outlook for Carbon Credits and Offsets. Sydney, Australia: EY Net Zero Centre Report.
Fuss, S., Golub, A., and Lubowski, R. (2021). The economic value of tropical forests in meeting global climate stabilization goals. Global Sustainabil. 4, 1–11. doi: 10.1017/sus.2020.34
Giacomelli, J., and Passalacqua, L. (2021). Unsustainability risk of bid bonds in public tenders. Mathematics. 9, 2385. doi: 10.3390/math9192385
Golub, A., Herrera, D., Leslie, G., Pietracci, B., and Lubowski, R. (2021). A real options framework for reducing emissions from deforestation: Reconciling short-term incentives with long-term benefits from conservation and agricultural intensification. Ecosys. Serv. 49, 101275. doi: 10.1016/j.ecoser.2021.101275
Griscom, B. W., Adams, J., Ellis, P. W., Houghton, R. A., Lomax, G., Miteva, D. A., et al. (2017). “Natural Climate Solutions,” in Proceedings of the National Academies of Science. doi: 10.1073/pnas.1710465114
Hayashi, T. (2021). “Efficiency of allocation,” in Microeconomic Theory for the Social Sciences. Singapore: Springer. doi: 10.1007/978-981-16-3541-0_12
Jing, J., Deng, X., Maqbool, R., Rashid, Y., and Ashfaq, S. (2020). Default behaviors of contractors under surety bond in construction industry based on evolutionary game model. Sustainability. 12, 9162. doi: 10.3390/su12219162
Kirkwood, C. W. (2004). Approximating risk aversion in decision analysis applications. Deci. Anal. 1, 51–67. doi: 10.1287/deca.1030.0007
Lubowski, R. (2021). Ramping up Efforts: The LEAF Coalition for tropical forest protection and climate collaboration. Carbon Mech. Rev. 9, 44–50.
Mas-Colell, A., Whinston, M. D., and Green, J. R. (1995). Microeconomic Theory. New York, NY: Oxford University Press.
McCallister, M., Krasovskiy, A., Platov, A., Pietracci, B., Golub, A., Lubowski, R., et al. (2022). Forest protection and permanence of reduced emissions. Front. Forests Global Chang. 29:928518. doi: 10.3389/ffgc.2022.928518
McNamee, P., and Celona, J. (1990). Decision Analysis with Supertree, Second Edition. South San Francisco, CA: Scientific Press.
Schwartzman, S., Lubowski, R., Pacala, S. W., Keohane, N O., Kerr, S., and Oppenheimer, M. (2021). Environmental integrity of emissions reductions depends on scale and systemic changes, not sector of origin. Environ. Res. Lett. 16, 091001. doi: 10.1088/1748-9326/ac18e8
van Benthem, A., and Kerr, S. (2013). Scale and Transfers in International Emissions Offset Programs. J. Public Econ. 107, 31–46. doi: 10.1016/j.jpubeco.2013.08.004
Keywords: carbon market, credits, emissions, deforestation, insurance, jurisdictional, performance risk, REDD+
Citation: Chan KK, Golub A and Lubowski R (2023) Performance insurance for jurisdictional REDD+: Unlocking finance and increasing ambition in large-scale carbon crediting systems. Front. For. Glob. Change 6:1062551. doi: 10.3389/ffgc.2023.1062551
Received: 06 October 2022; Accepted: 25 January 2023;
Published: 09 March 2023.
Edited by:
Hisham Zerriffi, University of British Columbia, CanadaReviewed by:
Emi Uchida, University of Rhode Island, United StatesCopyright © 2023 Chan, Golub and Lubowski. This is an open-access article distributed under the terms of the Creative Commons Attribution License (CC BY). The use, distribution or reproduction in other forums is permitted, provided the original author(s) and the copyright owner(s) are credited and that the original publication in this journal is cited, in accordance with accepted academic practice. No use, distribution or reproduction is permitted which does not comply with these terms.
*Correspondence: Kitty Kay Chan, a2tjMjEzOUBjb2x1bWJpYS5lZHU=
†These authors have contributed equally to this work and share first authorship
Disclaimer: All claims expressed in this article are solely those of the authors and do not necessarily represent those of their affiliated organizations, or those of the publisher, the editors and the reviewers. Any product that may be evaluated in this article or claim that may be made by its manufacturer is not guaranteed or endorsed by the publisher.
Research integrity at Frontiers
Learn more about the work of our research integrity team to safeguard the quality of each article we publish.