
95% of researchers rate our articles as excellent or good
Learn more about the work of our research integrity team to safeguard the quality of each article we publish.
Find out more
ORIGINAL RESEARCH article
Front. For. Glob. Change , 01 June 2023
Sec. Tropical Forests
Volume 6 - 2023 | https://doi.org/10.3389/ffgc.2023.1043574
This article is part of the Research Topic Seasonally Dry Tropical Forests: New Insights for Their Knowledge and Conservation View all 8 articles
Tropical dry forests (TDFs) are the most threatened terrestrial ecosystems and studying how functional traits of plant species change as secondary succession advances is important for understanding how and how fast can TDFs recover from disturbance. In this work we asked the question: how do functional traits change during secondary succession in a tropical dry woodland? We studied functional traits, especially ecophysiological traits, such as gas exchange, plant-water relations, leaf carbon isotope composition (δ13C), specific leaf area (SLA) and nitrogen concentration, in shrubs and trees in three successional stages (6 and 20 years after abandonment, and the dry deciduous woodland, 6 years, 20 years, and DW, respectively) along a successional gradient in a TDF in both wet and dry seasons to understand how TDFs recover after disturbance by opencast sand mining. During the wet season, similar mass-based photosynthetic rates (Amass), water potential, relative water content, instantaneous and intrinsic water-use efficiency (WUE and IWUE) and SLA were found in the 6 years and DW stages. During seasonal drought, similar reductions in these variables were observed for all three successional stages. However, δ13C of the 6 years species was higher than in 20 years and DW species, indicating a higher long-term integrated WUE in the former due to a strong reduction in stomatal conductance (gs) in the dry season. Species from the DW seem to couple metabolic changes to their characteristically low gs, such that nitrogen concentration per unit mass explained 86% of the variation in Amass. Given the functional similarity among species from the different successional stages, native species from the DW stage could have good physiological performance in the 6 and 20 years sites, and therefore could be used to restore these degraded areas.
Tropical dry forests (TDFs) are among the most threatened ecosystems of the world, due in large part to human settlement and transformation of these areas into agricultural lands (Murphy and Lugo, 1986; Janzen, 1988; Mooney et al., 1995; Fajardo et al., 2005, 2013). Although TDFs may grow slower than wet forests, after disturbance, they can recover their mature structure more rapidly than the latter with a more complex structure (Vieira and Scariot, 2006). For example, Lebrija-Trejos et al. (2008) found that canopy height, plant diversity and crown cover stabilized in less than 15 years in a very dry forest in Mexico. Similarly, 75% of tree species richness, canopy cover and basal area in mature forests were reached by year 5 after abandonment of slash and burn agriculture in a TDF in Bolivia (Kennard, 2002). However, recent work has shown that old growth forests, with grazing, and a 20–30 year secondary forest, with occasional grazing, differed a lot in terms of species density and accumulation of aboveground biomass in TDFs in northwestern Mexico (Álvarez-Yépiz et al., 2008), and that continued disturbance (grazing) can slow down recovery (Quisehuatl-Medina et al., 2020). Comparing tropical forests with different precipitation regimes, forests take longer to recover in dry than in wet areas, thus water seem to be one of the main abiotic factor affecting recovery of TDFs (Fajardo et al., 2013). How fast TDFs recover from disturbance will depend on the initial species pool and their functional traits. Therefore, studying functional traits of species in different successional stages along a successional gradient can be useful to understand how TDFs recover after disturbance.
Plant species from different successional groups are usually different in traits related to the acquisition, use and conservation of resources (Bazzaz and Pickett, 1980; Chazdon et al., 1996). For example, in a seasonally dry moist forest, functional group (pioneer, intermediate and shade-tolerant species) explained in average 41% of the variation in photosynthetic traits of 21 tree species, indicating that these traits can be used to differentiate plant functional groups (Ellis et al., 2000). Similarly, stomatal conductance (gs) is lower and water-use efficiency (WUE) higher in mature TDF species than in pioneer (Fetene and Feleke, 2001; Sobrado, 2003) and invasive (Cordell et al., 2001) species. Furthermore, acquisitive species are known to dominate young plots in a succession of TDF in the Yucatan Peninsula (Sanaphre-Villanueva et al., 2022). However, recent work shows that variation within successional groups can be larger than among groups, creating a continuum of strategies (van Kuijk and Anten, 2009; Pineda-García et al., 2015; Goldstein et al., 2016; Vieira et al., 2021) and highlighting the need to study functional traits of individual species rather than generalize from so-called functional groups.
Resource-use efficiency is key for plants in disturbed habitats, as these habitats are usually limited in one or more resources (Funk and Vitousek, 2007; Funk, 2013). The stable carbon isotope composition of leaves (δ13C) can be used to quantify certain aspects of functional diversity in plant species (Santiago et al., 2005). In a TDF in Venezuela, deciduous species have higher δ13C and lower intercellular to ambient CO2 concentration ratio (Ci/Ca), therefore predicting a higher WUE than in evergreen species (Sobrado and Ehleringer, 1997). Although δ13C has been studied in pioneer and late successional species of tropical rainforests (Huc et al., 1994; Bonal et al., 2007), less information is available for succession in TDFs. Previous work studying 11 evergreen and deciduous species in a TDF in Venezuela found that evergreen and deciduous plants have leaf traits that are not consistent with their expected leaf life span, with higher nitrogen (N) investment in evergreen leaves despite their lower net photosynthetic rate (A) and lower specific leaf area (SLA), and greater water-conservative traits (high δ13C) in deciduous plants, suggesting that this ecosystem may be more tolerant to drought than previously thought (Ávila-Lovera et al., 2019).
Many TDFs in Venezuela have one continuous arboreal stratum, but below 700 mm of precipitation, as in the dry woodland of Macanao Peninsula, Margarita Island, Venezuela, the canopy becomes discontinuous and members of arid habitats such as cacti become important members of the community defined as “dry deciduous woodland” (Fajardo et al., 2005). Previous work has shown how supplying water to seedlings in this disturbed TDF greatly increases the seedlings’ growth and survival, supporting the hypothesis that water limitation is a key factor for TDF regeneration (Fajardo et al., 2013). In this region, opencast sand mining has eliminated the topsoil of an extensive area and has generated patches of natural succession according to time since abandonment of the activity. In this study, we set out to answer the question: how do functional traits change during secondary succession in a tropical dry woodland? We hypothesize that shrub and tree species from early successional stages have trait values on the fast end of the leaf economic spectrum, e.g., high Amass, A, SLA, N and low WUE (acquisitive traits), whereas species from later successional stages have trait values of the slow end of the leaf economic spectrum, e.g., low Amass, A, SLA, N and high WUE (conservative traits). This hypothesis is based on the knowledge that the physiognomy of the successional stages in this TDF changes from herbaceous to shrubland, scrub and/or forest as the succession advances (Fajardo, 2007), suggesting that traits would also change along the succession, from more acquisitive traits in herbaceous plants and shrubs, to more conservative traits in trees. We also tested whether there is a seasonal response of functional traits regardless of the successional stage, especially plant-water relations and resource-use efficiency traits, as water availability decreases from the wet to the dry season and probably decreasing the nutrient availability as well. Furthermore, we tested whether there is coordination among traits of the leaf economic spectrum that differ across successional stages. Testing these hypotheses will provide valuable information for species selection in ecological restoration, especially in the understudied tropical dry forests of Venezuela (Rodríguez et al., 2010).
This study was conducted in a dry deciduous woodland located in Macanao Peninsula, Margarita Island, Venezuela, 38 km off the continent, that has been subjected to opencast sand mining. Mean annual temperature is 27°C and total annual precipitation is 450–500 mm, with 6 dry months and a bi-seasonal wet season (November–January and June–August) (Fajardo et al., 2005). The woodland is located within La Chica opencast sand mine (11°1′ N, 64°13′ W). At the time of sampling in 2009, extraction of sand had occurred for over 20 years and the size of the mine was 30 ha (Figure 1; Fajardo, 2007). However, the actual area being extracted was 5 ha. Once the vegetation is removed, soil is dug up and sieved to extract the sand (Supplementary Figures 1–4). Once all the soil has been dug up, reaching the parental rock, the extraction activity is abandoned, and the miners move to a different area of the mine. After abandonment of sand mining, vegetation patches naturally re-grow and are found inside and in the surroundings of the mine. Miners come back to stands that have been abandoned for 20–25 years to re-extract sand. Mining still occurs in the area (34 + years).
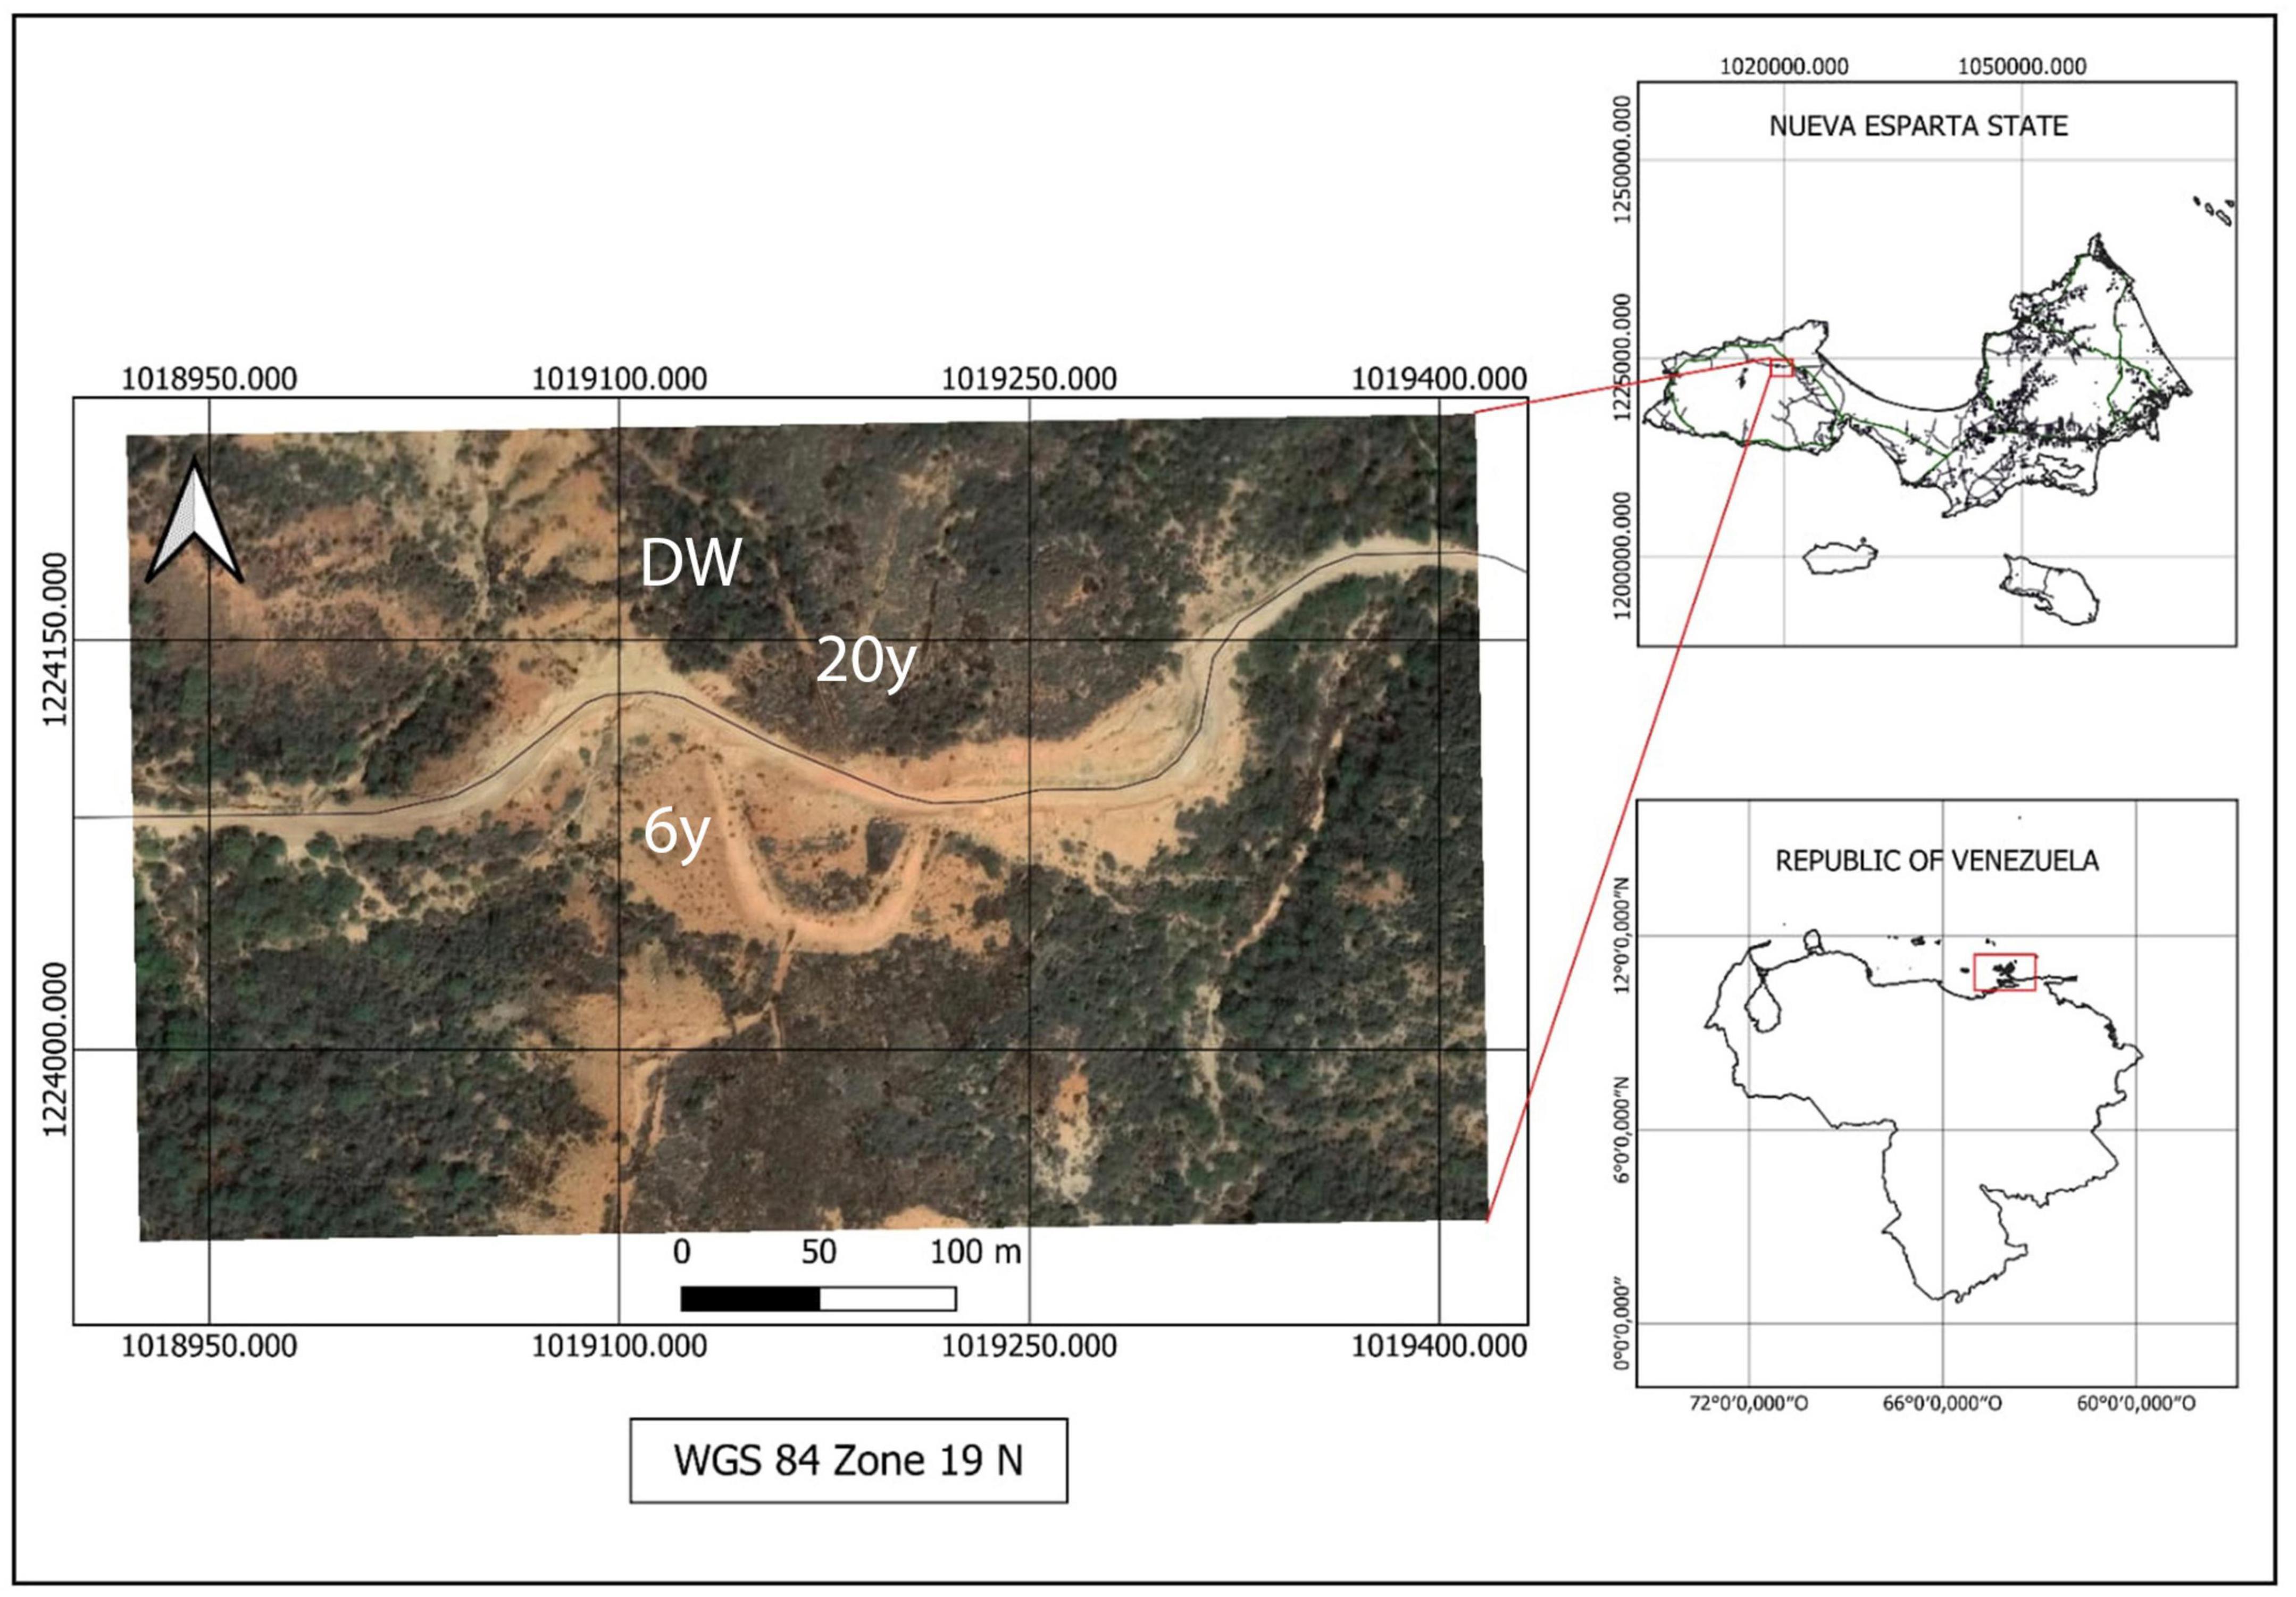
Figure 1. Map of the study site. (Bottom right) Map of Venezuela where red square indicates Nueva Esparta state. (Top right) Nueva Esparta state (composed of three islands, where the largest one is Margarita Island) and red square indicates the study site. (Left) Satellite image of part of Quebrada La Chica, Macanao Peninsula, where the open-cast sand mine is located. 6 years, 20 years, and DW denote the three successional stages: 6 and 20 years since abandonment of sand extraction and the dry deciduous woodland, respectively.
According to the time since abandonment of sand mining or the intactness of the vegetation based on interviews of local workers and the owner of the mine (Fajardo, 2007), sampling was done in three stands, one stand per successional stage: 6 and 20 years since abandonment of sand extraction at the time of sampling (6 and 20 years successional stages, respectively) and the original dry deciduous woodland (DW). We selected one stand per successional stage because of the relatively small size of the sand extraction area. The selection of these stands also required that they were only subjected to sand mining (no other land use), and they were free of current disturbance (Fajardo, 2007).
We studied seven shrub and tree species from three successional stages: 6 years, 20 years, and DW, with three species present at two stages (Table 1). The selected species represent between 10 and 12% of the species found at each stage, but were selected because of their high abundance in some successional stages and their importance for fauna associated to this dry deciduous woodland (Supplementary Table 1). We do not have the importance value index (IVI) for each of the species in our three stages, but Fajardo (2007) did an extensive study on these stages and other 10 stages in the area, and we are including some information here. The shrub Gossypium hirsutum (Malvaceae), the shrub Mimosa arenosa (Fabaceae) and the drought deciduous tree Piscidia carthagenensis (Fabaceae, formerly Piscidia piscipula) all reach their maximum IVI in intermediate stages (Fajardo, 2007), with 25–30, 20, and 26, respectively. Melochia tomentosa (Malvaceae), formerly in the Sterculiaceae, has the greatest IVI of all species, and had its greatest IVI, between 50 and 85, in the early and intermediate stages (Fajardo, 2007). Caesaria tremula was the only species in the Flacourtiaceae, and its IVI was not reported (Fajardo, 2007). P. carthagenensis and Tecoma stans (Bignoniaceae) are also important resources for the threatened yellow-shouldered parrot (Amazona barbadensis) (Rodríguez and Rojas-Suárez, 2008; Rodríguez et al., 2010). IVI values for the most abundant species in each stage can be found in Supplementary Table 1.
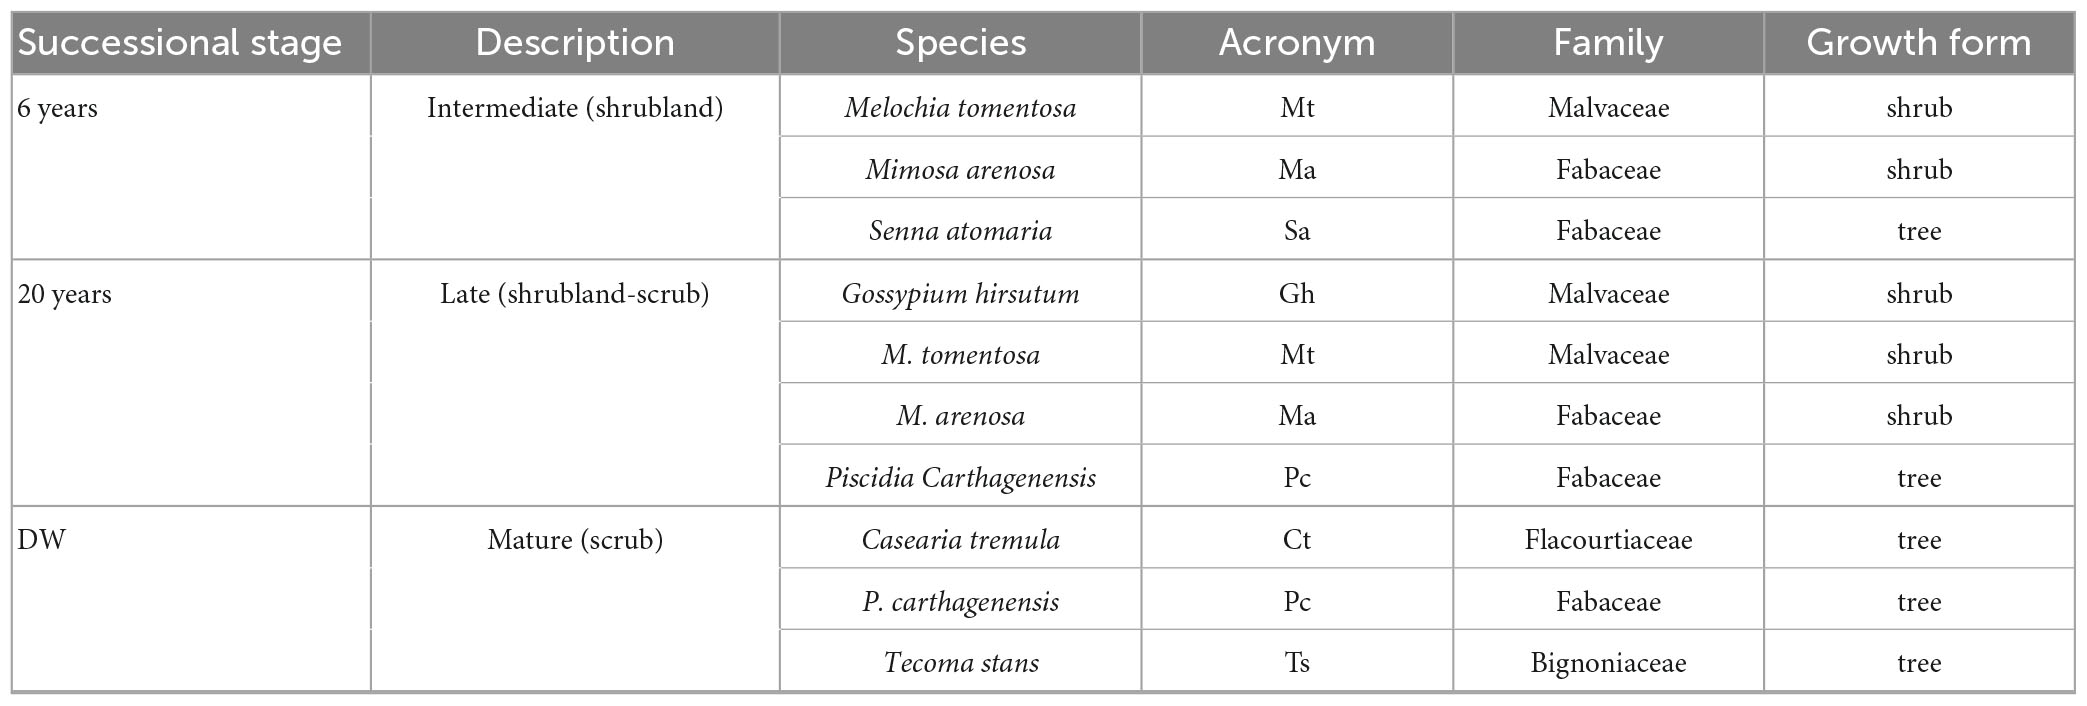
Table 1. Study species from three successional stages 6 years since abandonment (6 years), 20 years since abandonment (20 years), and the dry deciduous woodland (DW) in Macanao Peninsula, Margarita Island, Venezuela; description; species name; acronym used inn figures; family and growth form.
Within each stand, we randomly sampled individuals of the selected species in both wet and dry seasons, indicating that the individuals were not the same in the different seasons. Trees were between 2 and 4 m tall (Fajardo et al., 2005) and shrubs between 1 and 2.5 m (Melochia 1–1.5 m, Mimosa 2–2.5 m, and Gossypium 1.5–2.5 m). All species are drought deciduous, shedding their leaves between March and April and renewing their foliage in June and July. We sampled species in wet (August 2009) and dry seasons (February 2009). Soil conditions of the study site can be found in Fajardo (2007) and show that the highest N concentration is found in the 20 years stage (0.1%), followed by the 6 years stage (0.06%) and the DW (0.02%). Organic matter, electric conductivity and other micronutrients follow the same trend (Fajardo, 2007).
Morning leaf water potential (Ψ, MPa) was measured in three individuals per species × successional stage combination (30 individuals in total in each season) between 0700 and 0900 h using a pressure chamber (model 1000, PMS, Corvallis, OR, USA) in both wet and dry seasons. Leaf relative water content (RWC, %) was measured in leaf disks of known area taken from five individuals per species x stage combination collected at 0700 h, transported in ice to the laboratory, and weighed fresh (fresh mass), after being on distilled water in the dark at 4°C for 1 h (turgid mass), and after drying at 70°C (dry mass). Relative water content was then calculated as the difference between fresh mass and dry mass divided by the difference between turgor mass and dry mass, expressed as a percentage (Turner, 1981).
Photosynthetic rate (A, μmol m–2 s–1), transpiration rate (E, mol m–2 s–1), and gs (mol m–2 s–1) were measured in canopy individuals in DW, and in totally sun exposed individuals in the 6 and 20 years stages, using a photosynthesis system (LCA-4, Analytical Development Co., Hoddesdon, UK). We sampled two leaves per individual, and three individuals of each species × stage combination (60 measurements in total in each season) and measured gas exchange between 0900 and 1100 h at saturating photosynthetic photon flux density (PPFD) of 1,000 μmol m–2 s–1, at ambient CO2 concentration (390 μmol mol–1), leaf temperature of 28°C, and a leaf-to-air vapor pressure deficit of 1 kPa.
Photosynthetic rate on a mass basis (Amass, μmol kg–1 s–1) was calculated using A and leaf dry mass. Instantaneous WUE (mmol mol–1) was calculated as the ratio between A and E, whereas intrinsic WUE (IWUE, μmol mol–1) was calculated as the ratio between A and gs. We estimated both WUE and IWUE to assess for the potential effect of different vapor pressure deficit in the successional stages on values of WUE.
Three individuals per species were sampled for these traits (30 individuals in total in each season). We measured the area of leaves used for A by weighing 1 cm2 of paper and a paper replica of the leaf, and finding the relationship between paper mass and area. Leaves were then oven dried to constant mass at 70°C and weighed. Specific leaf area (SLA, cm2 g–1) was then calculated as the ratio between leaf area and dry mass. These dry leaves were then ground to a fine powder and analyzed for δ13C with an isotope ratio mass spectrometer and nitrogen (N) concentration with an element analyzer at the University of Illinois Chicago Stable Isotope Facility. Finally, photosynthetic nitrogen-use efficiency (PNUE, μmol mol N–1 s–1) was calculated as the ratio between A and the molar concentration of N.
Following the goals of this research, our approach included two kinds of analyses: (i) first, we tested whether there is a seasonal response of functional traits of species, and (ii) we tested changes in functional traits along the succession and between seasons. For the first goal, we performed two sample Student’s t-tests to test for each of the species × stage combination (10 species × stage combinations) comparing wet and dry seasons. For the second goal, we use data from the individuals of all the species per season × stage combination and performed factorial analysis of variance (ANOVA) to determine the fixed main effects of successional stage and season, and the interactive effect of successional stage × season, on the ten traits studied: water potential, relative water content, photosynthetic rate, stomatal conductance, instantaneous and intrinsic water-use efficiency, specific leaf area, carbon isotope composition, nitrogen concentration, and photosynthetic nitrogen-use efficiency. We tested the ANOVA assumptions after performing the tests and found that the residuals were not normally distributed in five out of ten ANOVAs. We then log-transformed those traits and repeated the ANOVAs. After this there was still one trait not normally distributed (SLA). In all instances where the ANOVAs were re-run, the p-values for the main effects and the interaction effects changed slightly but the significance of those effects did not change at α = 0.05. Fewer than five ANOVAs did not pass the variance homoscedasticity test, but log-transforming the data also helped removing heteroscedasticity. All these analyses were performed in R v.4.1.3.
We also performed three separate principal component analysis (PCA) to test for coordination among multiple traits using all the data, and for each of the two seasons, using the function “prcomp” of the package “ggplot2” in R v.4.1.3 (R Core Team, 2022), setting the arguments center and scale to TRUE. Regression analyses were also performed to test for the coordination of interesting pair of traits in the leaf economic spectrum. Plots and regression analyses were performed using SigmaPlot 11 (Systat Software, San Jose, CA, USA) and R v.4.1.3 (R Core Team, 2022).
Results from t-tests showed that water potential differed between seasons for all but one species in the three successional stages (Figure 2A), with higher values usually found in the wet than in the dry season, with the exception of M. arenosa in the 20 years stage that did not change its Ψ, and an unusual increase in Ψ in P. carthagenensis from the wet to dry season in the DW. ANOVA results showed a significant effect of successional stage on Ψ (Table 2), with wet season Ψ being similar across sites, but dry season Ψ differing across stages, being higher in the 20 years than in the 6 years and DW stages (Figure 2A and Table 2). There was also an interaction effect of successional stage × season in Ψ (Table 2). Interestingly, RWC was not affected by successional stage, but there was an effect of season (Table 2) and an interaction effect of successional stage × season on RWC, with differences between seasons in only a few species (Figure 2B and Table 2).
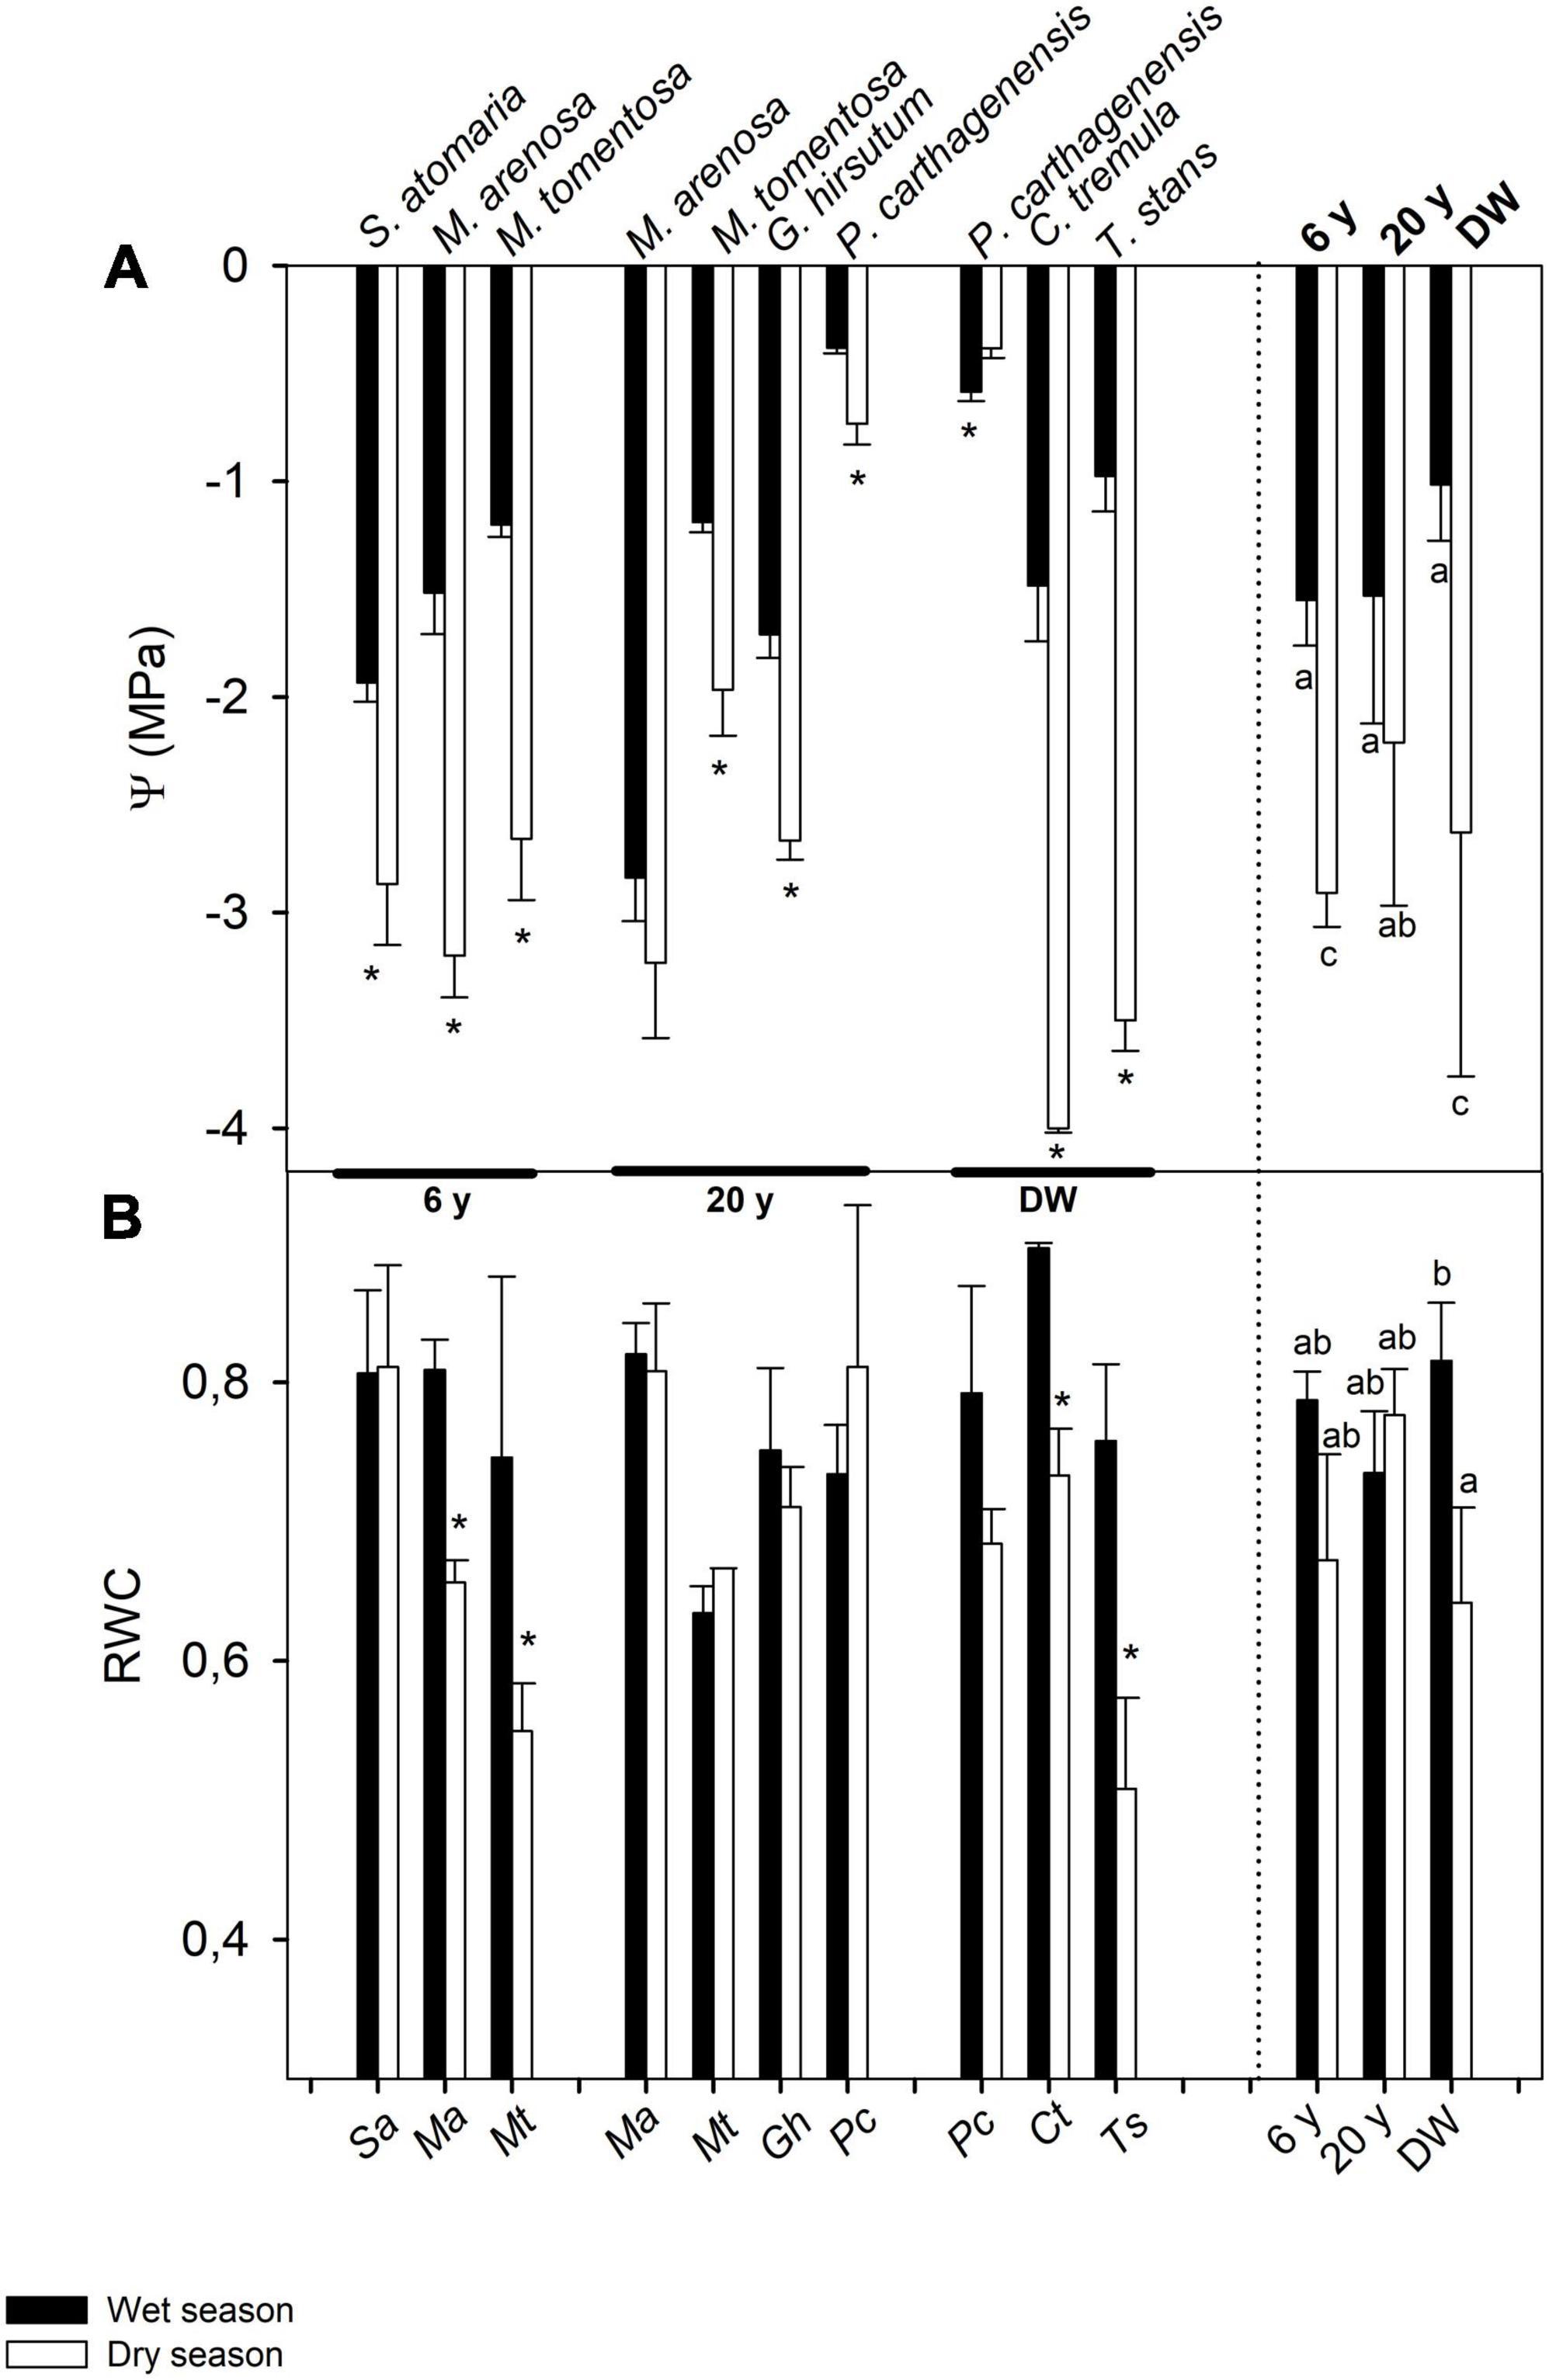
Figure 2. Seasonal changes in leaf water relations traits: (A) morning leaf water potential (Ψ) and (B) relative water content (RWC), in seven shrub and tree species from three successional stages in a dry deciduous woodland in Macanao Peninsula, Margarita Island, Venezuela. Values are means ± SE, and are shown per species (left of the dashed line) and averaged per site (right of the dashed line). Species abbreviations are as in Table 1. Stars (*) indicate significant differences between seasons for each species (Student t-tests with p < 0.05). Different letters indicate statistical differences at p < 0.05 after ANOVA of season and site on the traits.
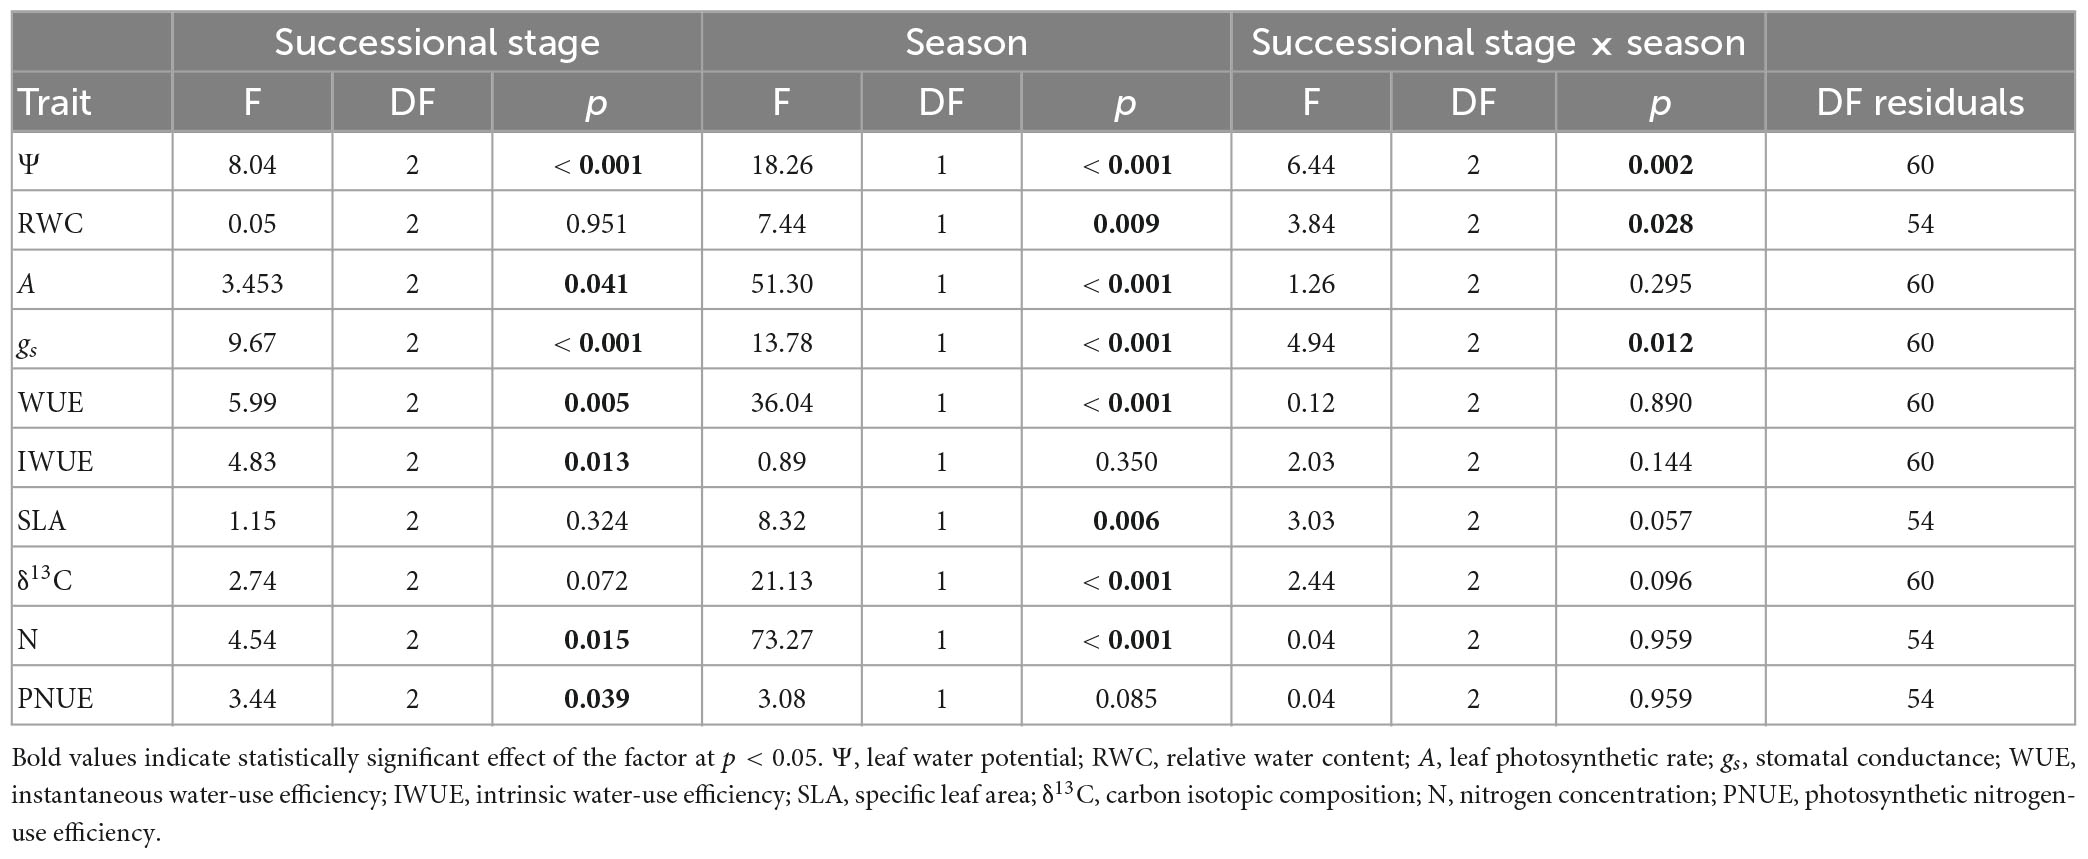
Table 2. Results of the ANOVAs on the effect of successional stage, site, and the interactive effect successional stage × site on the different ecophysiological traits studied. Included are the F and p-values and the degrees of freedom (DF).
T-tests showed that A declined from wet to dry seasons in seven out of 10 species (Figure 3A). The ANOVA also showed a significant effect of season and successional stage on A (Figure 2A and Table 2), with no interaction between stage and season. During the wet season, species of the 6 years stage showed the highest values of A, whilst the lowest occurred in species of the DW; furthermore, the reduction in A from wet to dry season was c. 50% in both the 6 and 20 years stages, but it was only 25% in DW (Figure 3A). Values of A in the dry season were similar across stages (Figure 3A). For gs, we found that only five species changed their gs between seasons, with four decreasing gs during the dry season, and one increasing it (t-test results, Figure 3B). The ANOVA revealed an interaction effect of stage and season, with gs decreasing from wet to dry season only in the 6 years stage (Figure 3B and Table 2). Wet season gs decreased from the 6 years to the DW, with no difference in dry season gs among stages (Figure 3B).
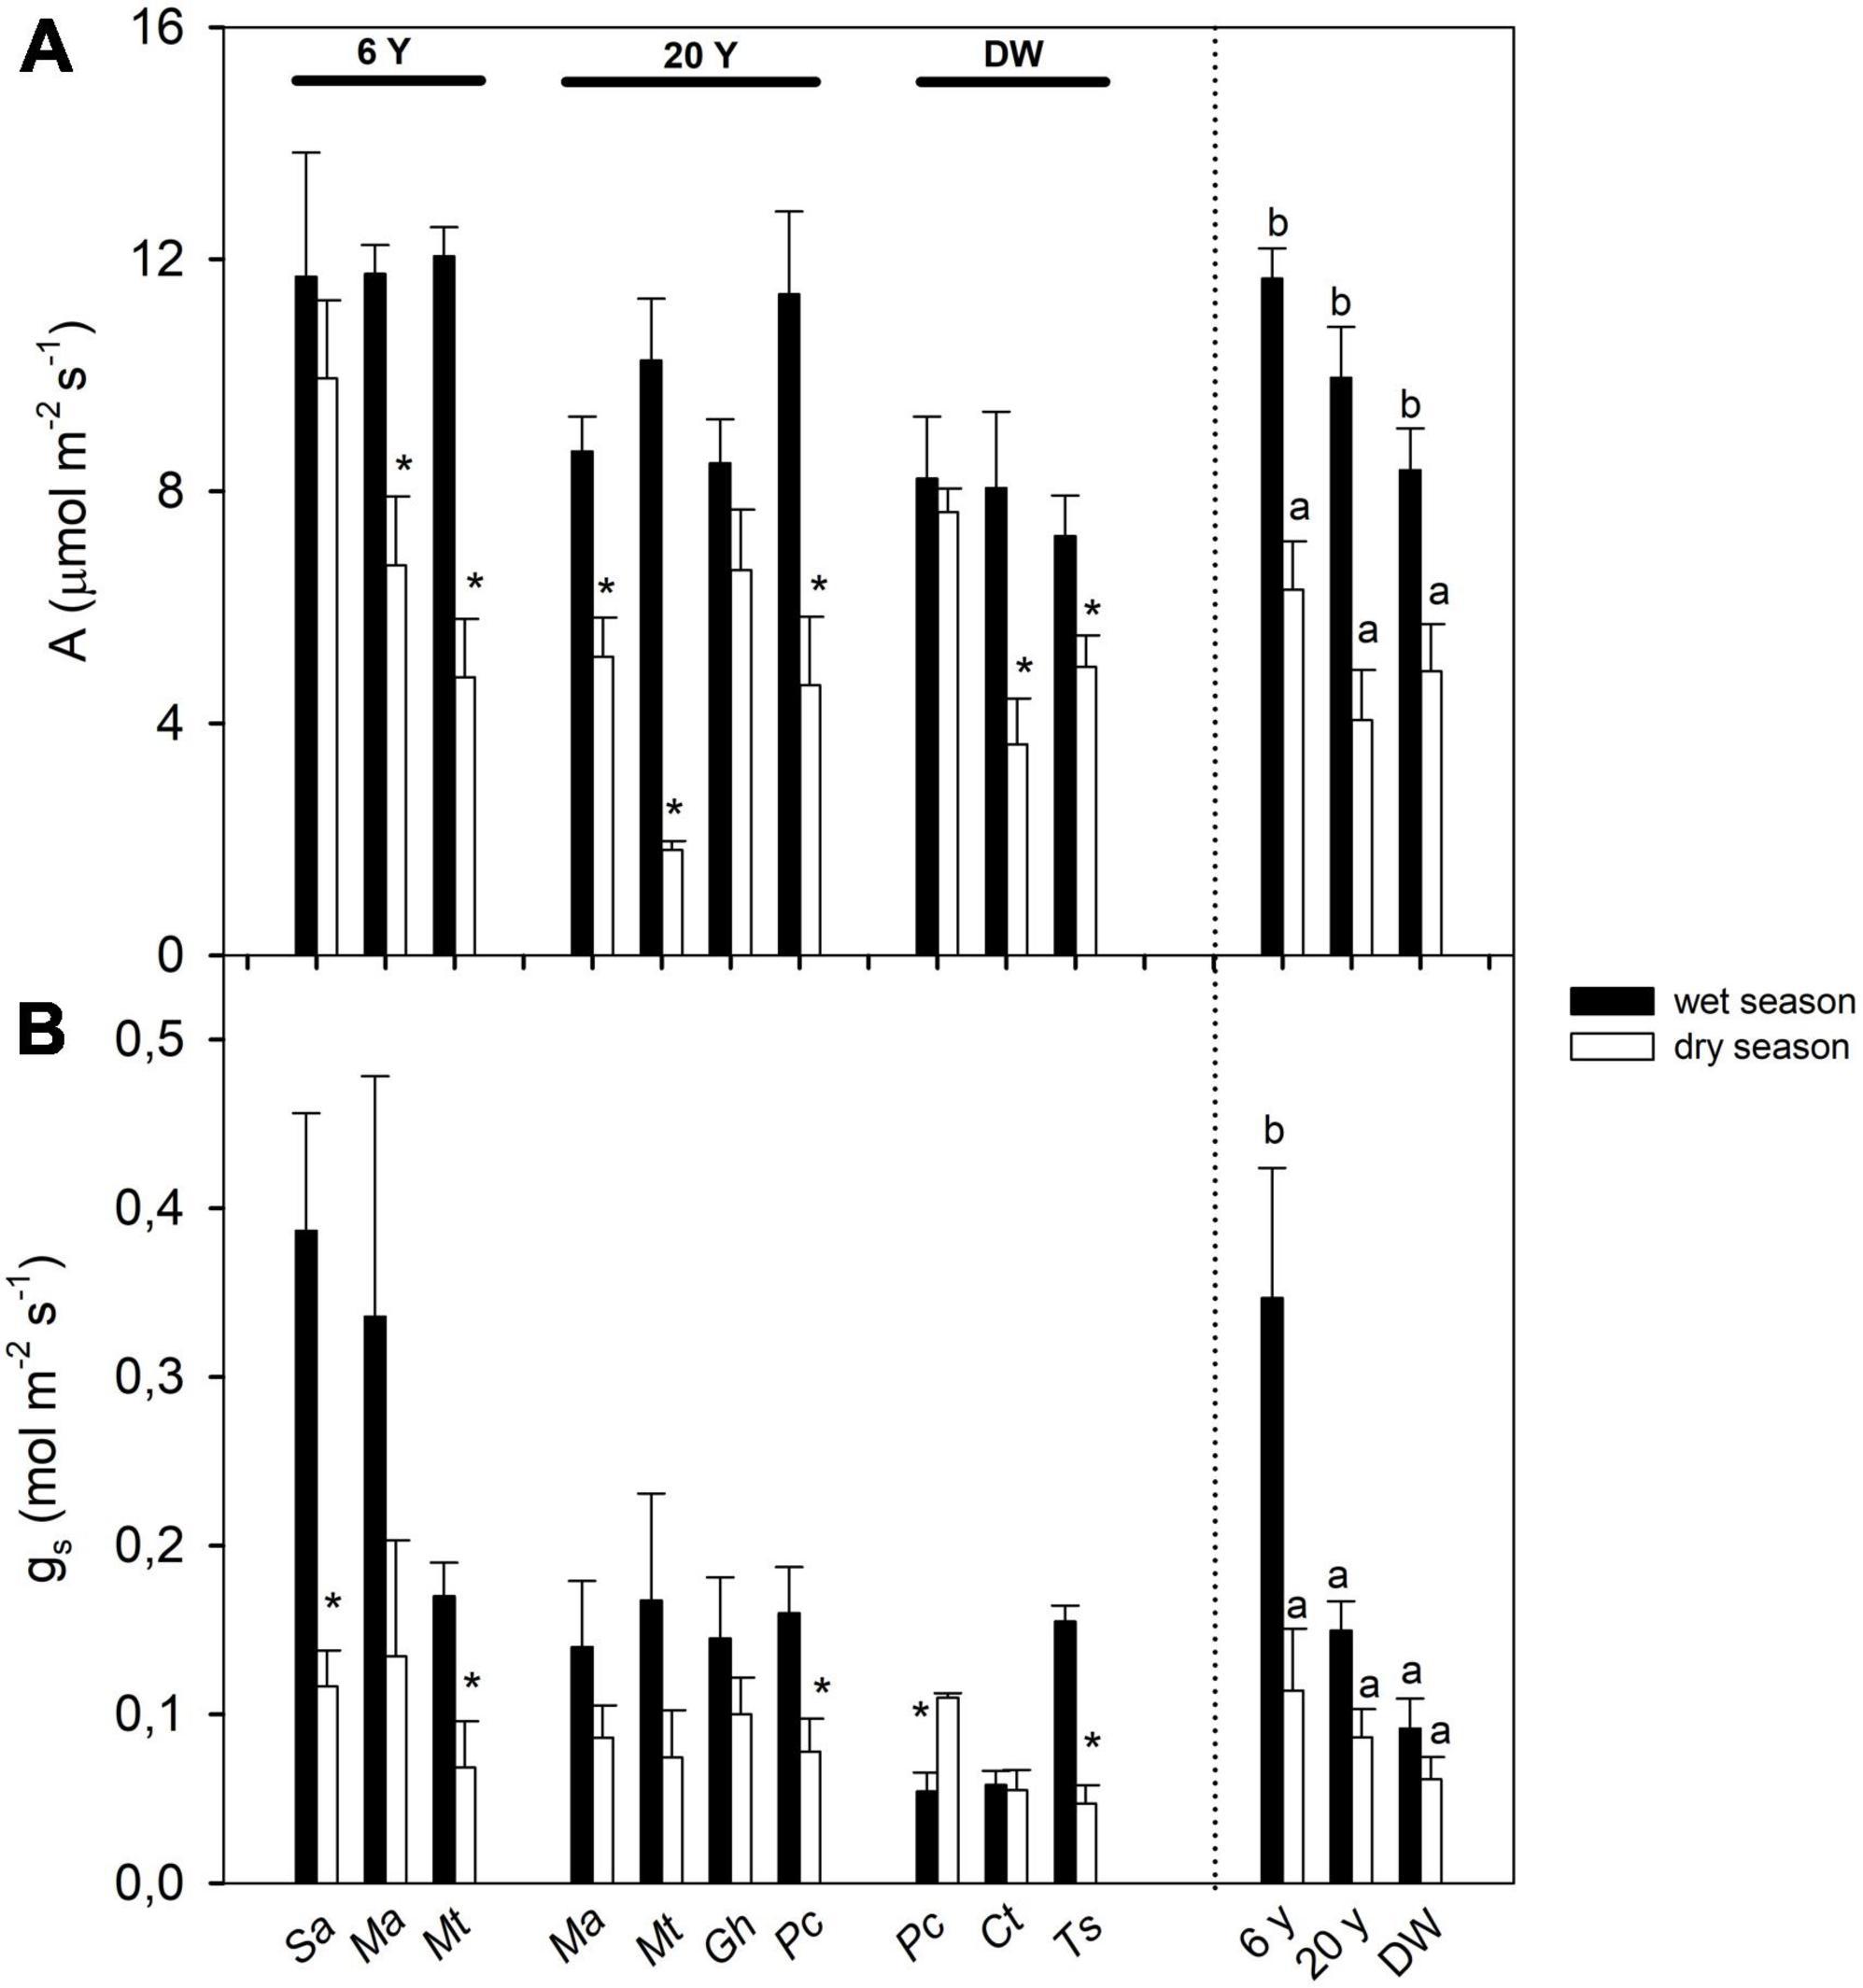
Figure 3. Seasonal changes in gas exchange traits: (A) area-based photosynthetic rate (A) and (B) stomatal conductance (gs), in seven shrub and tree species from three successional stages in a dry deciduous woodland in Macanao Peninsula, Margarita Island, Venezuela. Values are means ± SE, and are shown per species (left of the dashed line) and averaged per site (right of the dashed line). Species abbreviations are as in Table 1. Stars (*) indicate significant differences between seasons for each species (Student t-tests with p < 0.05). Different letters indicate statistical differences at p < 0.05 after ANOVA of season and site on the traits.
T-tests also showed that WUE significantly decreased from wet to dry season in eight out of 10 species (Figure 4A). This decrease was also observed in the ANOVA, with a significant effect of season on WUE (Table 2). There was also a significant difference in WUE among successional stages (Table 2), with the 6 years stage and DW being similar among themselves, but different from the 20 years stage. Values of IWUE changed between seasons in four species (t-test results, Figure 4B). However, the ANOVA showed no significant overall effect of season (Figure 4B and Table 2), but differences among stages (Table 2), with the greatest IWUE in the DW.
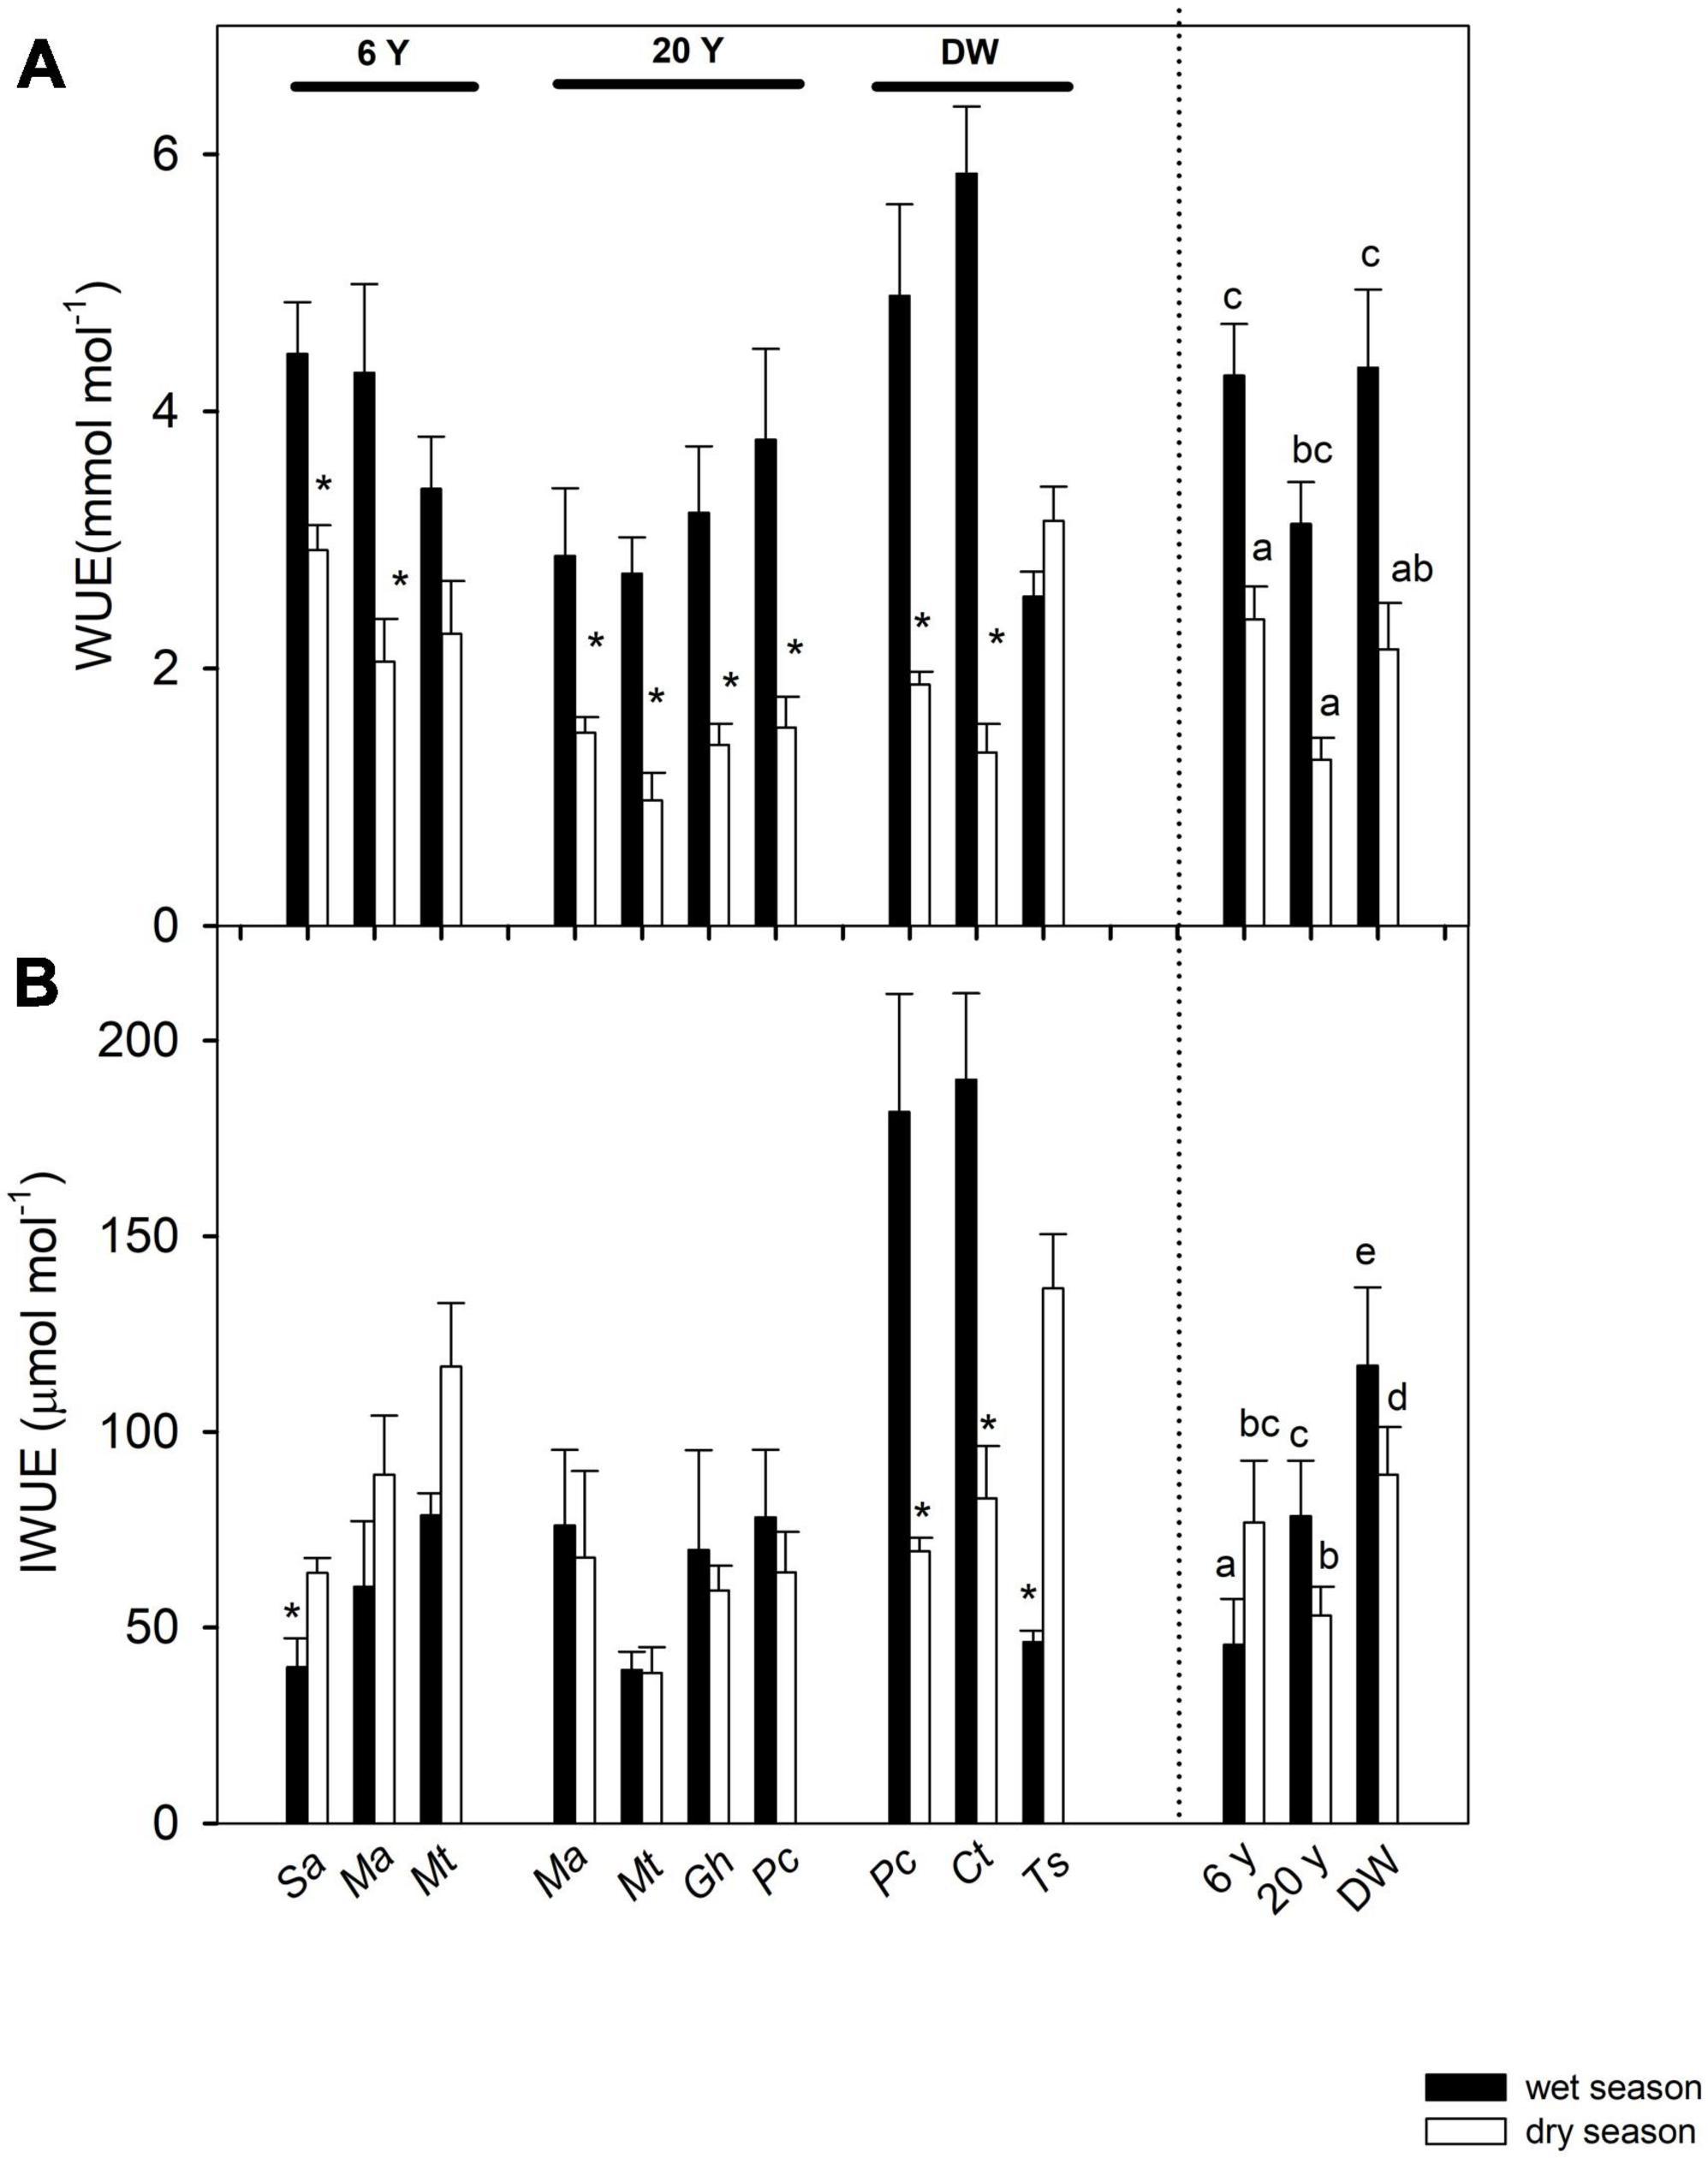
Figure 4. Seasonal changes in gas exchange traits: (A) instantaneous water-use efficiency (WUE) and (B) intrinsic water-use efficiency (IWUE), in seven shrub and tree species from three successional stages in a dry deciduous woodland in Macanao Peninsula, Margarita Island, Venezuela. Values are means ± SE, and are shown per species (left of the dashed line) and averaged per site (right of the dashed line). Species abbreviations are as in Table 1. Stars (*) indicate significant differences between seasons for each species (Student t-tests with p < 0.05). Different letters indicate statistical differences at p < 0.05 after ANOVA of season and site on the traits.
Results from t-tests showed that SLA changed little between seasons, except for three species that decreased their SLA from wet to dry season (Table 3). However, the ANOVA showed a significant effect of season and no effect of successional stage (Table 2) on SLA. Values of δ13C changed between seasons in five out of 10 species, with values becoming higher (less negative) in the dry season (t-tests, Table 3). ANOVA showed a significant effect of season on δ13C (Table 2), but there was no effect of successional stage on δ13C (Table 2). Leaf N concentration differed between seasons in almost all species (t-tests, Table 3), with lower values in the dry than in the wet season. The ANOVA also showed an effect of season and stage on N, with greater N values in the 6 and 20 years stages (Table 2). In contrast, PNUE only differed between seasons in a few species (t-tests, Table 3). The ANOVA also showed no significant effect of season, but successional stage had a significant effect on PNUE (Table 2).
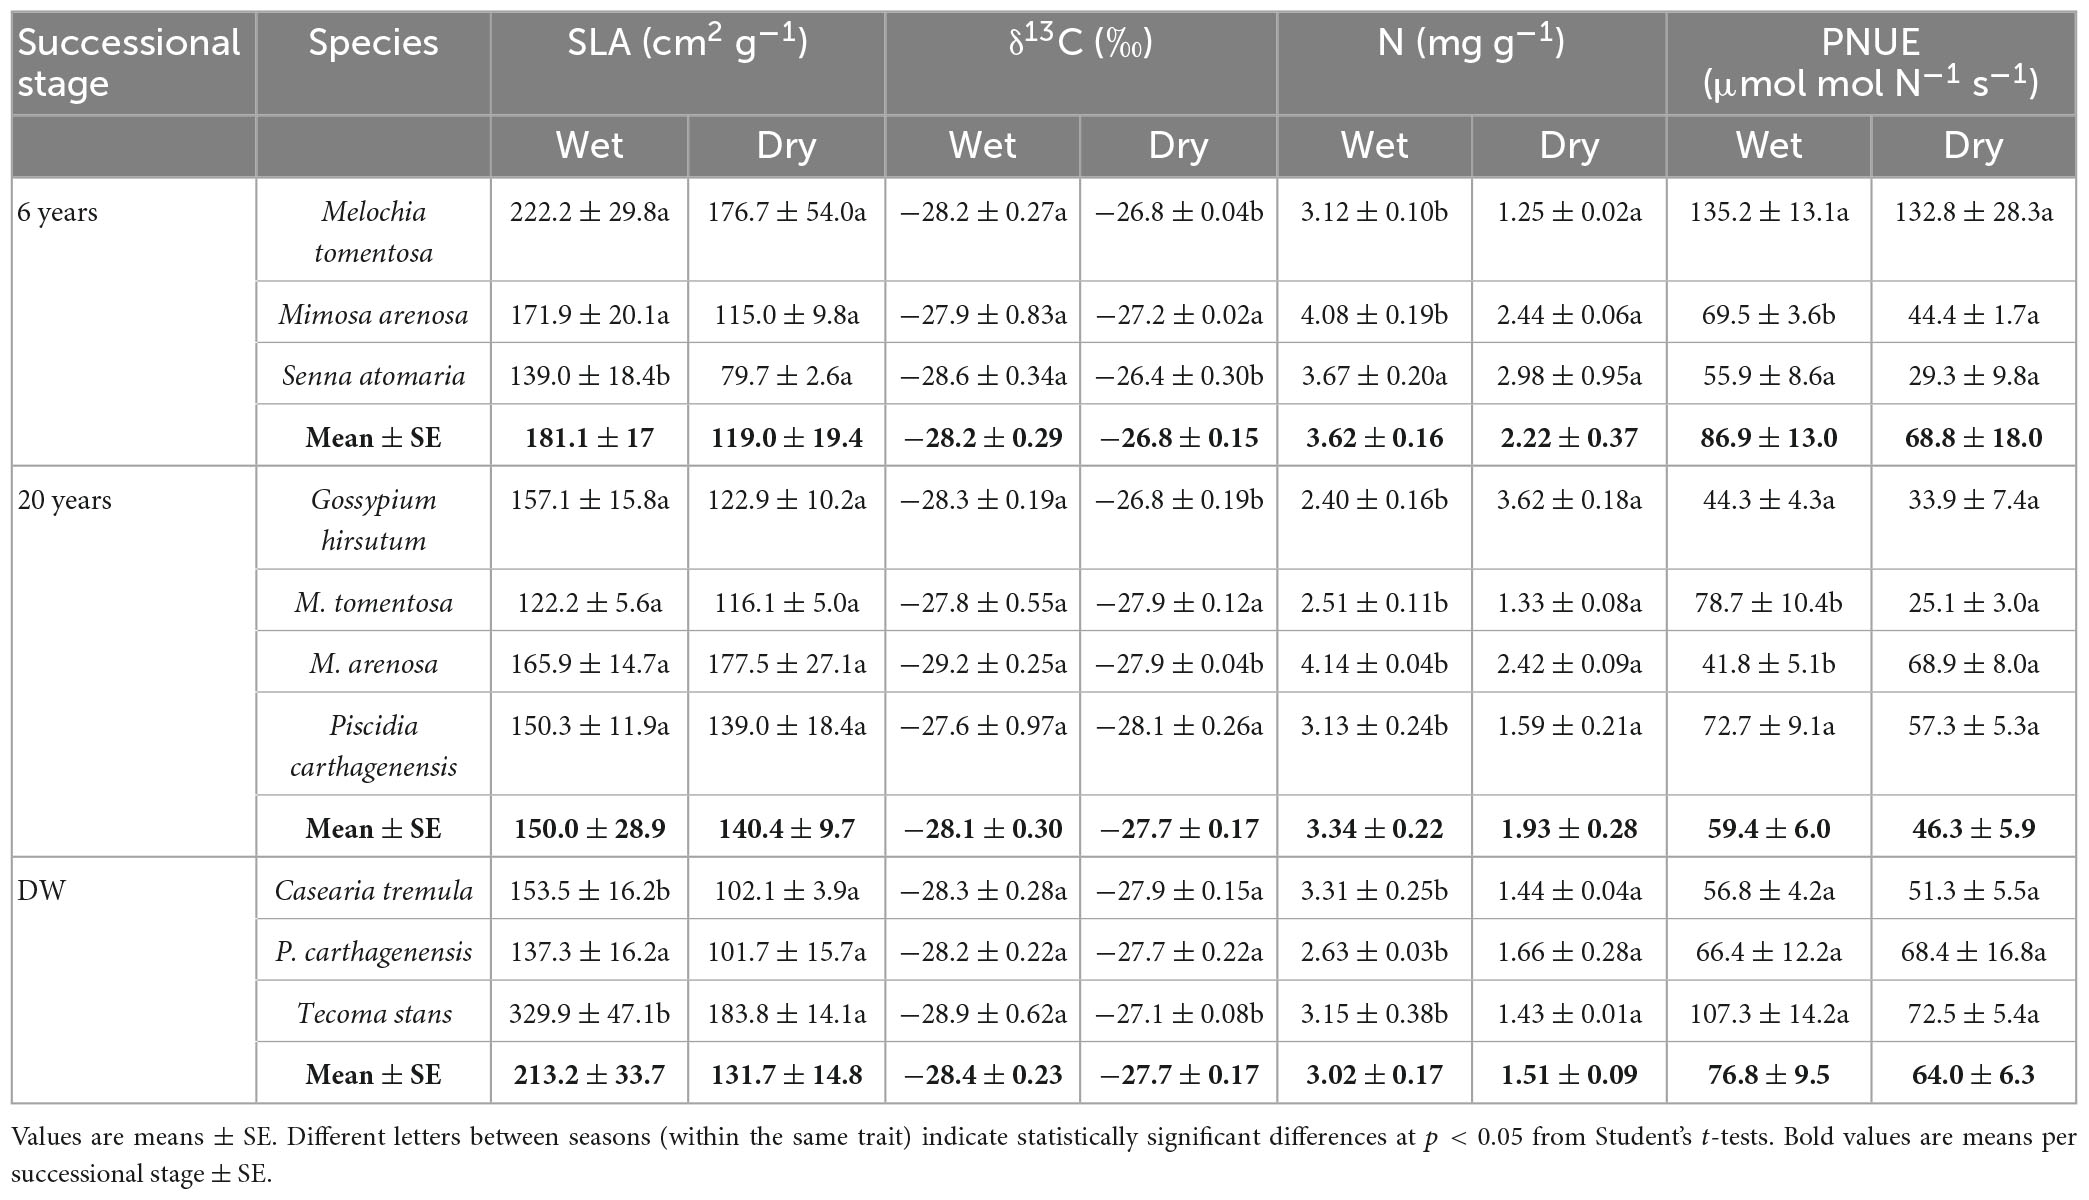
Table 3. Specific leaf area (SLA), carbon isotope composition (δ13C), leaf nitrogen concentration (N) and photosynthetic nitrogen-use efficiency (PNUE) of species from three successional stages: 6 and 20 years since abandonment of sand extraction activity (6 and 20 years, respectively) and dry deciduous woodland (DW) in wet and dry seasons.
When looking at coordination among traits, we found a positive relationship between N concentration and Amass, but only in the DW (r2 = 0.86, p = 0.008, Figure 5). Values of Amass were similar in the 6 years and DW stage in the wet season and slightly higher than those of the 20 years stage (p = 0.420, data not shown), and they decreased in all stages during the dry season (p = 2 × 10⁻⁵, data not shown). Values of δ13C were positively related to WUE in the dry season only (r2 = 0.60, p = 0.008, Figure 6), with species from the 6 years stage having the greater values in both traits, indicating that these species are more water-use efficient.
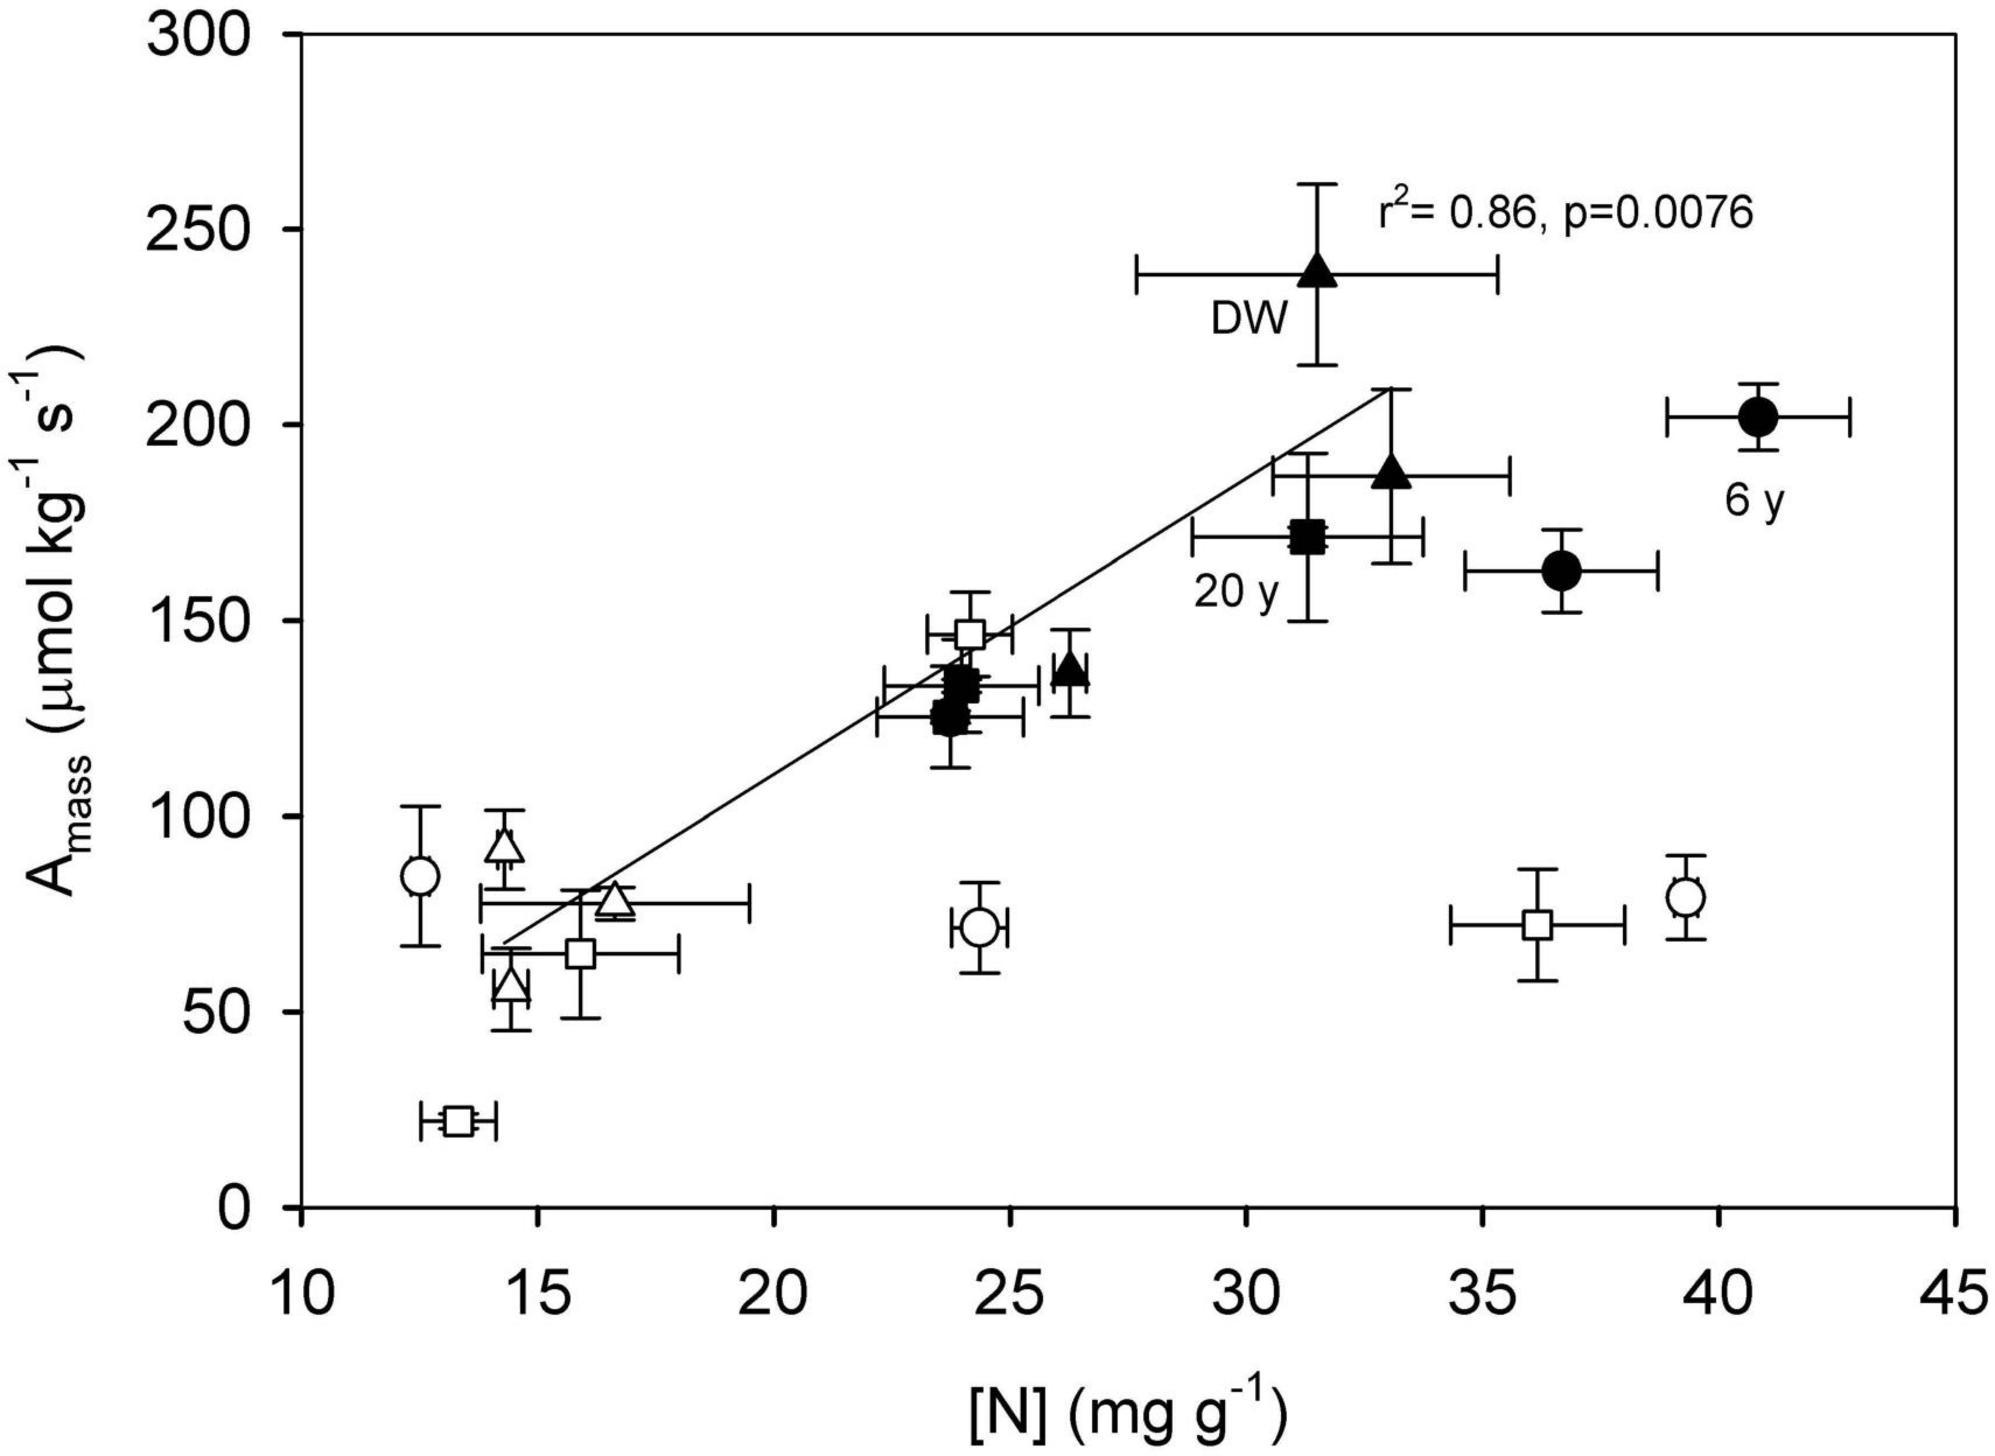
Figure 5. Relationship between mass-based photosynthetic rate (Amass) and nitrogen (N) concentration in species from three successional stages: 6 years since abandonment (circles), 20 years since abandonment (squares) and dry deciduous woodland (triangles), in both wet (closed symbols) and dry seasons (open symbols). The relationship is significant in the dry deciduous woodland only (r2 = 0.86, p = 0.008).
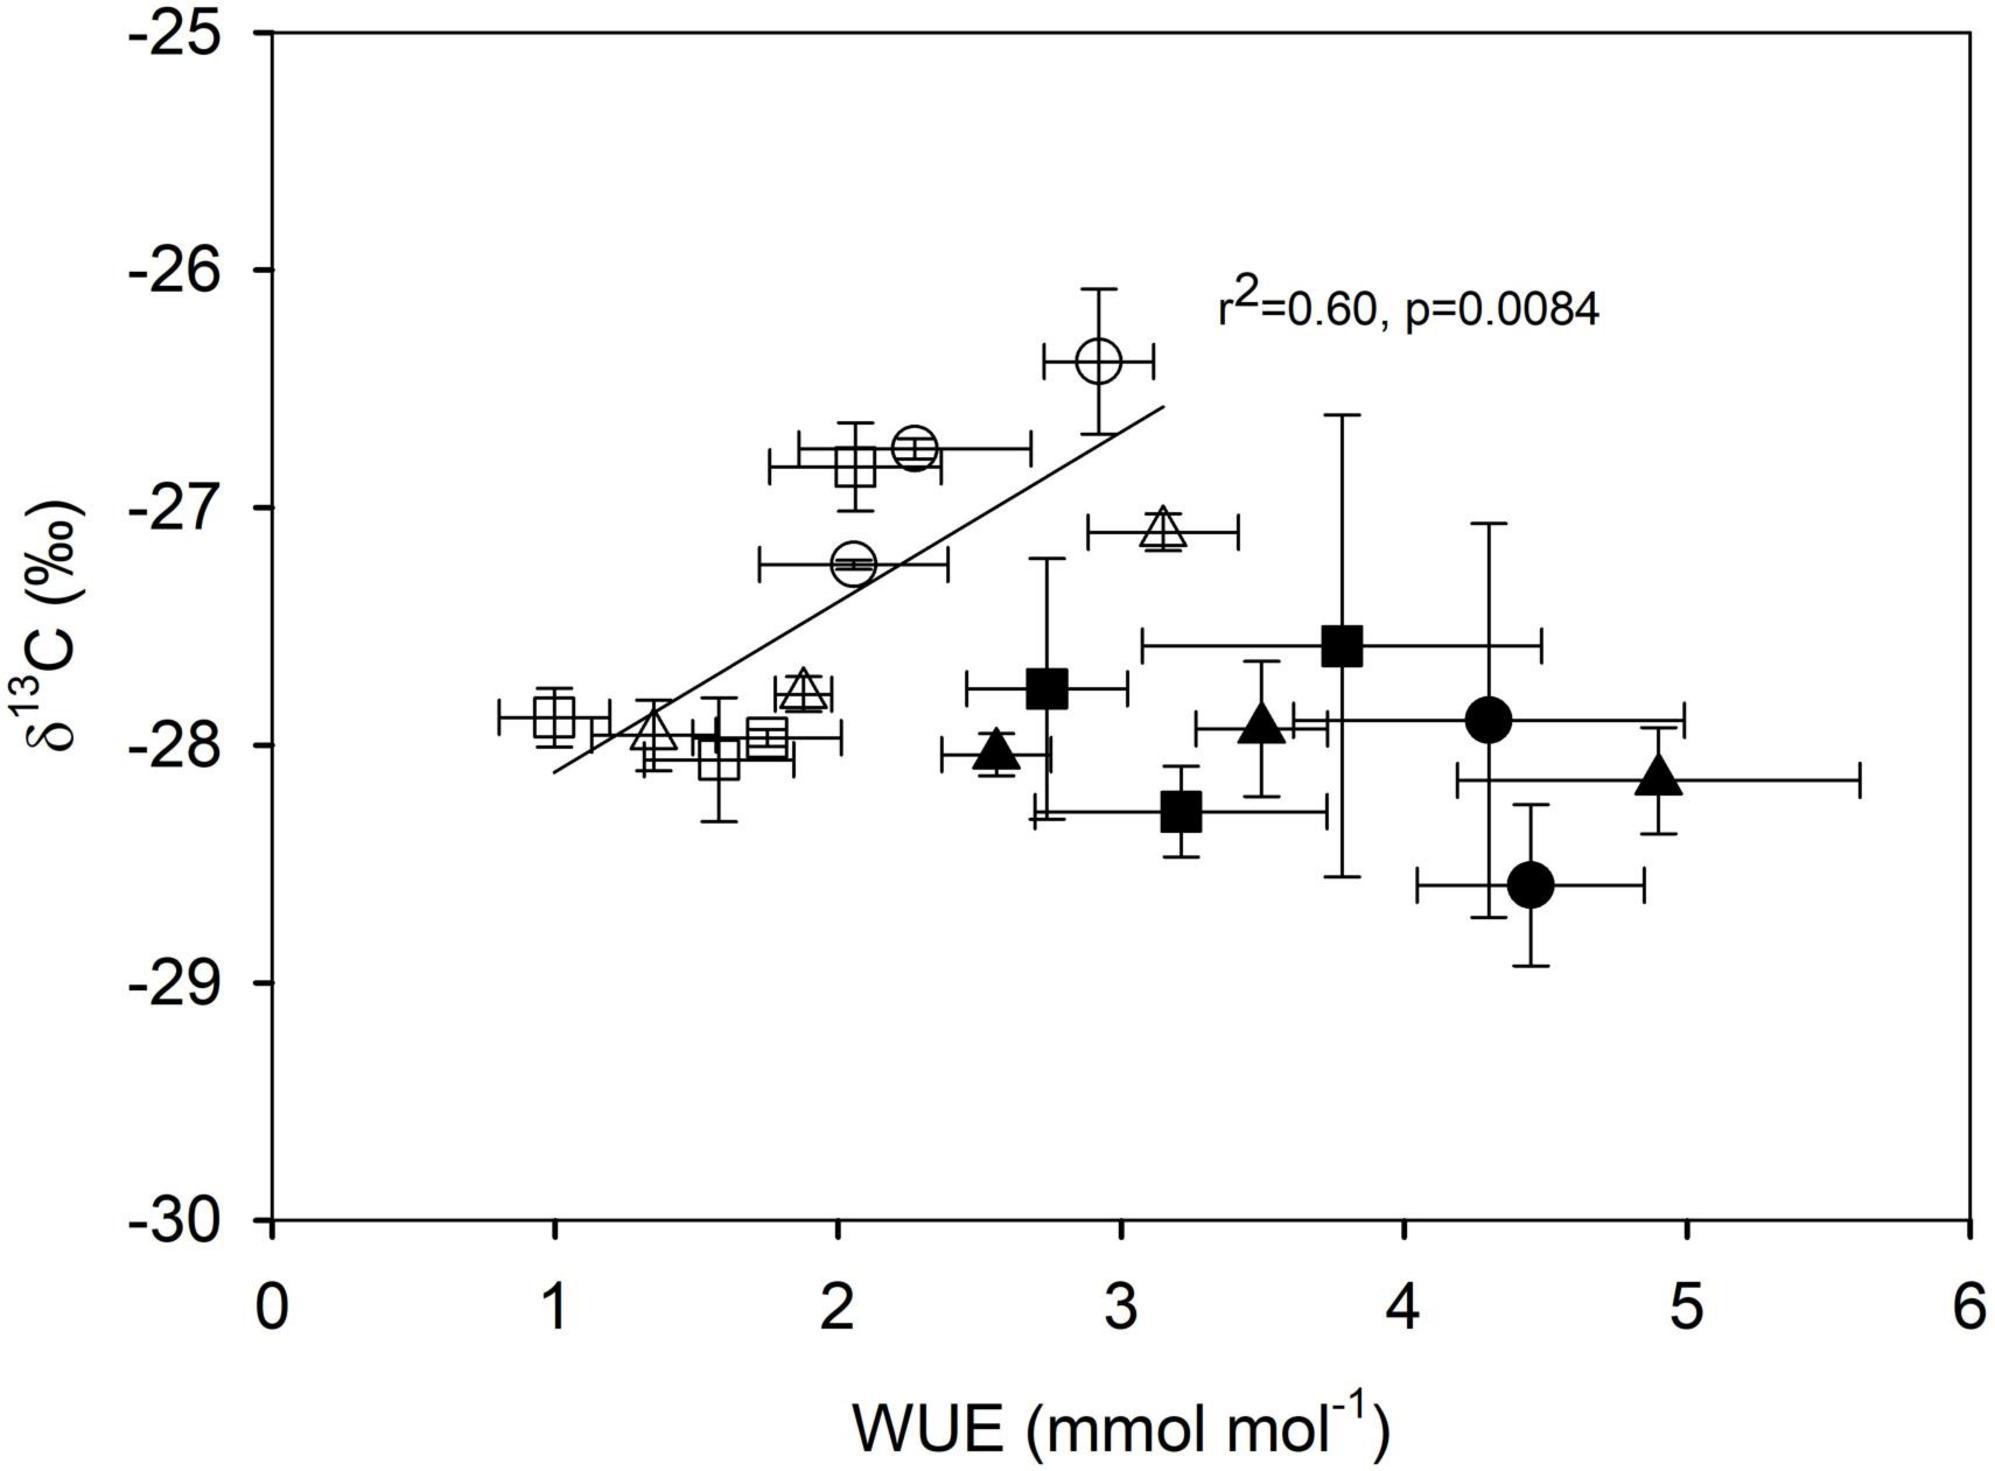
Figure 6. Relationship between carbon isotope composition (δ13C) and instantaneous water-use efficiency (WUE) in species from three successional stages: 6 years since abandonment (circles), 20 years since abandonment (squares) and dry deciduous woodland (triangles), in both wet (closed symbols) and dry seasons (open symbols). The relationship is marginally significant for the dry season only (r2 = 0.60, p = 0.052).
Results from the first PCA on the species mean trait values using both wet and dry season data, show that the main axis of variation explained 41.8% of the data, while the second axis explained 14.3% (Figure 7A). The first axis (PC1) was positively associated with δ13C and negatively associated with all other traits except for IWUE. The second axis (PC2) was positively associated with IWUE. This PCA does not show a clear functional separation of the species in the three successional stages (Figure 7A). To test for different trait coordination in the two seasons, we performed two separate PCAs. The PCA using the wet season data had a PC1 that explained 26.8% of the wet season variation and showed coordination between RWC, WUE and IWUE, and these traits traded-off with Amass, gs and SLA (Figure 7B). The PCA using the dry season data had a PC1 that explained 31.8% of the dry season variation and showed coordination between A, Amass, δ13C, WUE, and PNUE, and these traits traded-off with Ψ (Figure 7C).
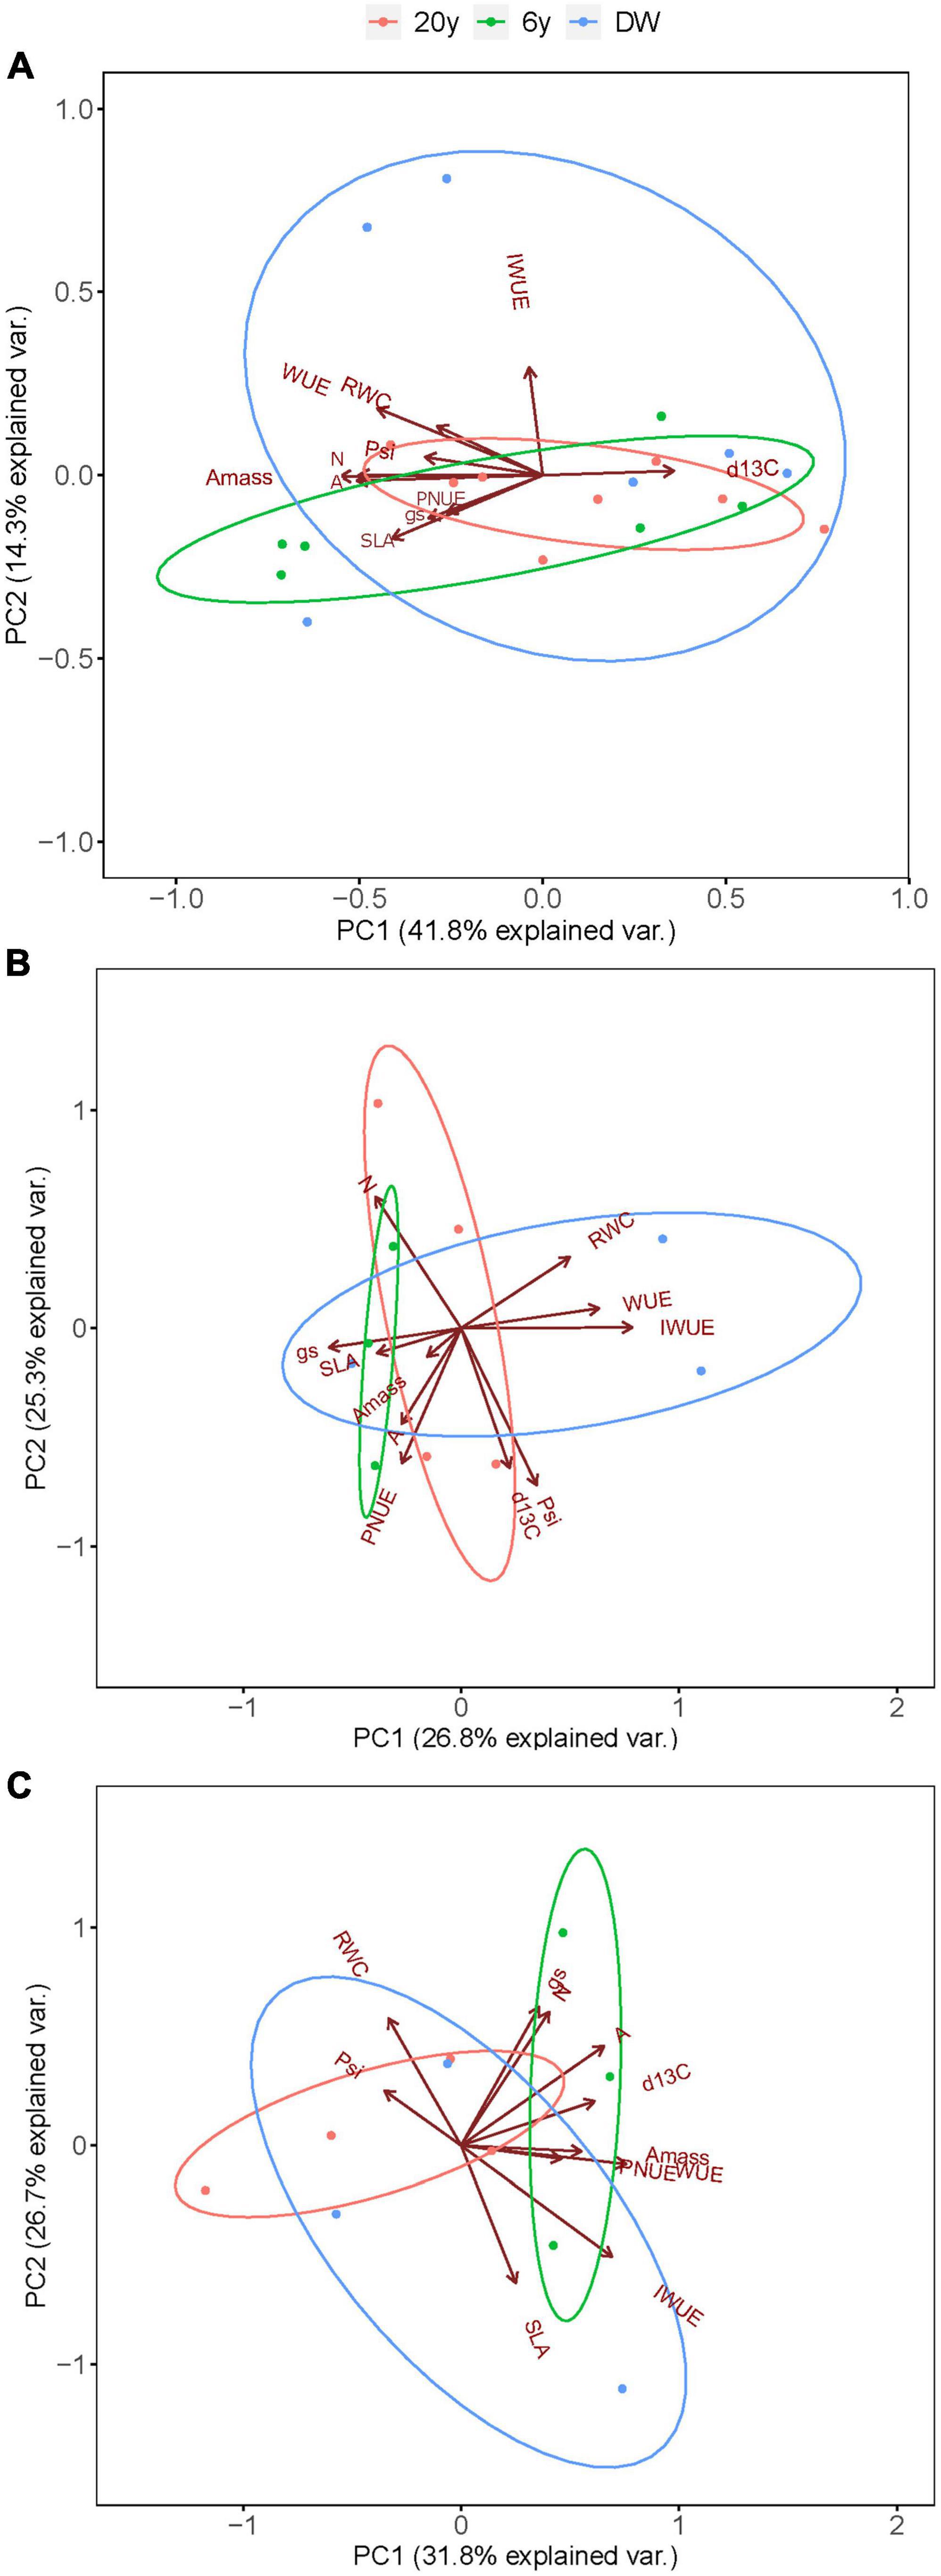
Figure 7. Principal component analyses biplots of species mean trait values grouped by (A) successional stage, and for each of the seasons: (B) wet season, and (C) dry season. Colors represent the 20 years, 6 years and the dry woodland (DW).
We studied the water relations, gas exchange, resource-use efficiency, specific leaf area, carbon isotope composition and nitrogen concentration of seven shrub and tree species from three sites at different stages of succession in a tropical dry forest to understand how functional traits change as succession advances. We found differences among stages in traits, such as Ψ, A, gs, WUE, IWUE, N and PNUE, and a rather strong effect of seasonality in all traits studied except for IWUE and PNUE.
We found partial support for our hypothesis that as succession advances, leaf traits become more conservative, as only A, gs, and N decreased from the 6 years to the DW stage, with no clear trend in Amass, WUE, and PNUE. Photosynthetic rate has been found to decrease from early to late successional stages and this is usually associated with a change in the growth form of plants as succession advances (Zhu et al., 2013; Han et al., 2020). This can partially explain our results, as shrubs are only present in the 6 and 20 years stage and not in the DW. However, the decrease in A along the succession was not accompanied by a decrease in SLA; indeed, SLA increased as succession advances. A similar increased in SLA has been found in another TDF in Guanacaste, Costa Rica (Buzzard et al., 2016). This indicates that leaves become thinner and/or less dense as succession advances, but these changes do not translate into greater photosynthetic capacity as expected from the leaf economic spectrum (Reich et al., 1997; Wright et al., 2004). However, the decrease in A as succession advances can be explained by both reduced gs and N concentration. Species in the 6 years stage significantly decreased gs during the dry season but with a smaller reduction in N concentration, which indicates a higher stomatal control of A, also evidenced by the higher δ13C values measured in these species.
Furthermore, following the expectations of the leaf economic spectrum, Amass was positively related to N concentration, although only in the DW species. Values of Amass represent the rate of carbon capture per unit of biomass invested in leaves, thus providing an index of photosynthetic efficiency (Ávila-Lovera et al., 2019). In our study, species from the 6 years and DW seem to be equally efficient in the C return per unit of C invested during both wet and dry season, as they have similar Amass, while species from the 20 years stage have lower Amass, especially in the wet season, compared to the other two stages.
Despite a decrease in N concentration as succession advances, PNUE decreased from the 6 years to the 20 years stages and then increased from the 20 years to the DW, which contrasts with the expectation that as N decreases, PNUE should increase. A study from a subtropical moist forest found that PNUE decreased as succession advances (Han et al., 2020), whereas another study from a tropical wet forest suggested that PNUE increases as succession advances (van Kuijk and Anten, 2009). In a study in Central Amazonia, PNUE was higher in pioneer species than in early and late secondary species, which was related to the pioneers’ greater photosynthetic capacity, rather than lower N availability (dos Santos et al., 2006). The values of N concentration in our study are relatively high, and can explain the relatively low PNUE we found overall compared to those found in other TDFs with lower leaf N concentration (Chaturvedi et al., 2021).
We found strong support for our expectation that functional traits, especially water relation traits and resource-use efficiency traits, change seasonally. The maintenance of RWC in the dry season in both the 6 and 20 years stages despite of a strong reduction in Ψ in the 6 years stage and a moderate reduction in the 20 years stage indicates that the change in Ψ may be due to osmotic adjustment, as turgor could have been kept at similar values between seasons and accumulation of solutes inside the cells would lead to a decreased osmotic potential and Ψ (Sanders and Arndt, 2012). Maintenance of turgor and hence RWC in the dry season was likely a result of stomatal closure, as gs decreased in the 6 years stage. Early stomatal closure as water availability decreases is an important strategy in plant species from seasonally dry habitats (Tezara et al., 2010) and tropical forests in general (Santiago et al., 2016). At the same time, possible osmotic adjustment leading to decreased Ψ in the dry season allows for a water potential gradient between the soil and the leaf to be maintained in this period of water deficit. Given the similar Ψ values among species in the three stages along with similar responses to water deficit, species from the three successional stages seem to be functionally equivalent in this dry deciduous woodland.
Although no clear trend in WUE was observed among stages, species from the DW were more efficient in the use of water in both the wet and dry season according to values of IWUE. An increase in canopy cover during succession could have played a role in this response, as decreased air evaporative demand (low air vapor pressure deficit, VPD) would affect gs and IWUE. Other studies have found a decreased in wet season VPD as succession advances in a TDF in Oaxaca, Mexico, and this has been associated with larger basal area (Lebrija-Trejos et al., 2010, 2011), and likely large canopy cover. The effect of canopy characteristics on gas exchange of species in different successional stages has also been highlighted in a seasonal evergreen forest in Nakhon Ratchasima, Thailand (Tor-ngern et al., 2021). High IWUE is a desirable trait for maintaining good carbon and water balances in water-limited environments and differences in this ratio suggest variation in stomatal limitation to carbon assimilation (Sobrado, 1991) in the species from the different successional stages.
We found significant relationships among some important traits supported by both the regression analyses and PCA, supporting our hypothesis of a coordination of traits across successional stages. Results from the PCA show strong coordination among most traits studied, the ones aligning with PC1, except for IWUE, which seem to be independent from the other traits (it strongly loaded with PC2). However, species mean trait values did not allow for a functional separation of the species based on the successional stages. Indeed, we found that species from the three successional stages share a big part of their functional trait space, with species from 6 and 20 years being the most similar. These results further support the idea that greater functional variation within than among successional groups is common in tropical forests (van Kuijk and Anten, 2009; Goldstein et al., 2016; Vieira et al., 2021). The separate PCAs for each of the seasons showed how traits and trait coordination changed from wet to dry season. For example, in the wet season species with high values of Amass, gs and SLA also had lower values of WUE and IWUE, indicating a trade-off between carbon assimilation and water-use efficiency. In the dry season, however, species with high values of Amass also had high WUE and PNUE, indicating no trade-off between carbon assimilation and resource-use efficiency. Furthermore, species with high Amass, WUE, and PNUE also had high values of δ13C and low values of Ψ indicating that the species with greater drought tolerance could maintain photosynthetic efficiency and resource-use efficiency during the period of water limitation.
Taken together our results indicate that, contrary to expectation, species along a successional gradient in a tropical dry forest in Venezuela do not necessarily become more resource-conservative as succession advances. This could reflect the low soil nutrient concentrations early in the succession (Fajardo, 2007), as opencast mining completely removes the topsoil and new plant species colonize a bare substrate. Nutrient and organic matter concentration are low in the three stages compared to the nearby forest (Fajardo, 2007), but they are lower in both the 6 years stage and DW than in the 20 years stage. Importantly, similar seasonal behavior in species from the different successional stages indicate that they may be functionally similar, as further supported by the PCA. Our results indicate that in the absence of specific trends (traits becoming more or less conservative as succession advances) in many of the traits evaluated in the different successional stages, the planting of native species from the late successional stage in the 6 and 20 years successional areas could help accelerate the succession and allow species to have a good physiological performance, and therefore help in the overall restoration of these degraded areas. We recognize that we only sampled one stand in each successional stage, and hence our conclusions may not represent what happens at the successional stage level, so we recommend further studies with a community ecology approach using a larger number of stands at each successional stage to determine whether the functional traits (mainly ecophysiological) approach used in the present study are conclusive.
The raw data supporting the conclusions of this article will be made available by the authors, without undue reservation.
RU secured the funding. EÁ-L, RU, IC, and WT designed and conducted research. EÁ-L and WT performed the statistical analyses, made the plots, and wrote the manuscript with significant input from all other authors. All authors contributed to the article and approved the submitted version.
This work was supported by the Consejo de Desarrollo Científico y Humanístico from Central University of Venezuela (CDCH, UCV) grant PI 03-00-5733-2004. EÁ-L thanks the support of the Smithsonian Tropical Research Institute Earl S. Tupper Fellowship during the writing of this manuscript.
We are grateful to José Manuel Briceño (Provita), Juan Carlos Salazar (Arenera La Chica), Dr. Alicia Cáceres, Dr. Carolina Kalinhoff, Victor Romero, Pablo Millán, and Romel Marín for their logistical support in the field. We also thank MSc. Diego Camilo Martínez for providing Figure 1. Special thanks to Drs. Ana Herrera and Nelson Ramírez for useful comments on an early version of this manuscript.
The authors declare that the research was conducted in the absence of any commercial or financial relationships that could be construed as a potential conflict of interest.
All claims expressed in this article are solely those of the authors and do not necessarily represent those of their affiliated organizations, or those of the publisher, the editors and the reviewers. Any product that may be evaluated in this article, or claim that may be made by its manufacturer, is not guaranteed or endorsed by the publisher.
The Supplementary Material for this article can be found online at: https://www.frontiersin.org/articles/10.3389/ffgc.2023.1043574/full#supplementary-material
Álvarez-Yépiz, J., Martínez-Yrízar, A., Búrquez, A., and Lindquist, C. (2008). Variation in vegetation structure and soil properties related to land use history of old-growth and secondary tropical dry forests in northwestern Mexico. For. Ecol. Manag. 256, 355–366. doi: 10.1016/j.foreco.2008.04.049
Ávila-Lovera, E., Urich, R., Coronel, I., and Tezara, W. (2019). Seasonal gas exchange and resource-use efficiency in evergreen versus deciduous species from a tropical dry forest. Tree Physiol. 39, 1561–1571. doi: 10.1093/treephys/tpz060
Bazzaz, F., and Pickett, S. (1980). Physiological ecology of tropical succession: A comparative review. Annu. Rev. Ecol. Syst. 11, 287–310. doi: 10.1146/annurev.es.11.110180.001443
Bonal, D., Born, C., Brechet, C., Coste, S., Marcon, E., Roggy, J., et al. (2007). The successional status of tropical rainforest tree species is associated with differences in leaf carbon isotope discrimination and functional traits. Ann. For. Sci. 64, 169–176. doi: 10.1051/forest:2006101
Buzzard, V., Hulshof, C., Birt, T., Violle, C., and Enquist, B. (2016). Re-growing a tropical dry forest: Functional plant trait composition and community assembly during succession. Funct. Ecol. 30, 1006–1013. doi: 10.1111/1365-2435.12579
Chaturvedi, R., Tripathi, A., Raghubanshi, A., and Singh, J. (2021). Functional traits indicate a continuum of tree drought strategies across a soil water availability gradient in a tropical dry forest. For. Ecol. Manag. 482:118740. doi: 10.1016/j.foreco.2020.118740
Chazdon, R., Pearcy, R., Lee, D., and Fetcher, N. (1996). “Photosynthetic responses of tropical forest plants to contrasting light environments,” in Tropical forest plant ecophysiology, eds S. Mulkey, R. Chazdon, and A. Smith (Boston, MA: Springer), 5–55. doi: 10.1007/978-1-4613-1163-8_1
Cordell, S., Goldstein, G., Meinzer, F., and Vitousek, P. (2001). Regulation of leaf life-span and nutrient-use efficiency of Metrosideros polymorpha trees at two extremes of a long chronosequence in Hawaii. Oecologia 127, 198–206. doi: 10.1007/s004420000588
dos Santos, U., de Carvalho Gonçalves, J., and Feldpausch, T. (2006). Growth, leaf nutrient concentration and photosynthetic nutrient use efficiency in tropical tree species planted in degraded areas in central Amazonia. For. Ecol. Manag. 226, 299–309. doi: 10.1016/j.foreco.2006.01.042
Ellis, A., Hubbell, S., and Potvin, C. (2000). In situ field measurements of photosynthetic rates of tropical tree species: A test of the functional group hypothesis. Can. J. Bot. 78, 1336–1347. doi: 10.1139/b00-095
Fajardo, L. (2007). Bases ecológicas para la restauración de bosques secos tropicales en la Península de Macanao, Isla de Margarita. Doctoral thesis. Parroquia Macarao: Instituto Venezolano de Investigaciones Científicas.
Fajardo, L., Gonzalez, V., Nassar, J., Lacabana, P., Portillo, Q. C. A., Carrasquel, F., et al. (2005). Tropical dry forests of Venezuela: Characterization and current conservation status. Biotropica 37, 531–546. doi: 10.1111/j.1744-7429.2005.00071.x
Fajardo, L., Rodríguez, J., González, V., and Briceño-Linares, J. (2013). Restoration of a degraded tropical dry forest in Macanao, Venezuela. J. Arid Environ. 88, 236–243. doi: 10.1016/j.jaridenv.2012.08.009
Fetene, M., and Feleke, Y. (2001). Growth and photosynthesis of seedlings of four tree species from a dry tropical afromontane forest. J. Trop. Ecol. 17, 269–283. doi: 10.1017/S0266467401001183
Funk, J. (2013). The physiology of invasive plants in low-resource environments. Conserv. Physiol. 1:cot026. doi: 10.1093/conphys/cot026
Funk, J., and Vitousek, P. (2007). Resource-use efficiency and plant invasion in low-resource systems. Nature 446, 1079–1081. doi: 10.1038/nature05719
Goldstein, G., Santiago, L., Campanello, P., Avalos, G., Zhang, Y., and Villagra, M. (2016). “Facing shortage or excessive light: How tropical and subtropical trees adjust their photosynthetic behavior and life history traits to a dynamic forest environment,” in Tropical tree physiology: Adaptations and responses in a changing environment, eds G. Goldstein and L. Santiago (Cham: Springer International Publishing), 319–336. doi: 10.1007/978-3-319-27422-5_15
Han, T., Ren, H., Wang, J., Lu, H., Song, G., and Chazdon, R. (2020). Variations of leaf eco-physiological traits in relation to environmental factors during forest succession. Ecol. Indic. 117:106511. doi: 10.1016/j.ecolind.2020.106511
Huc, R., Ferhi, A., and Guehl, J. (1994). Pioneer and late stage tropical rainforest tree species (French Guiana) growing under common conditions differ in leaf gas exchange regulation, carbon isotope discrimination and leaf water potential. Oecologia 99, 297–305. doi: 10.1007/BF00627742
Janzen, D. (1988). “Tropical dry forests: The most endangered major tropical ecosystem,” in Biodiversity, ed. E. Wilson (Washington DC: National Academies Press), 130–137.
Kennard, D. (2002). Secondary forest succession in a tropical dry forest: Patterns of development across a 50-year chronosequence in lowland Bolivia. J. Trop. Ecol. 18, 53–66. doi: 10.1017/S0266467402002031
Lebrija-Trejos, E., Bongers, F., Pérez-García, E. A., and Meave, J. A. (2008). Successional change and resilience of a very dry tropical deciduous forest following shifting agriculture. Biotropica 40, 422–431. doi: 10.1111/j.1744-7429.2008.00398.x
Lebrija-Trejos, E., Pérez-García, E., Meave, J., Bongers, F., and Poorter, L. (2010). Functional traits and environmental filtering drive community assembly in a species-rich tropical system. Ecology 91, 386–398. doi: 10.1890/08-1449.1
Lebrija-Trejos, E., Pérez-García, E., Meave, J., Poorter, L., and Bongers, F. (2011). Environmental changes during secondary succession in a tropical dry forest in Mexico. J. Trop. Ecol. 27, 477–489. doi: 10.1017/S0266467411000253
Mooney, H., Bullock, S., and Medina, E. (1995). “Introduction,” in Seasonally dry tropical forests, eds S. Bullock, H. Mooney, and E. Medina (Cambridge: Cambridge University Press), 1–8. doi: 10.1017/CBO9780511753398.001
Murphy, P., and Lugo, A. (1986). Ecology of tropical dry forest. Annu. Rev. Ecol. Syst. 17, 67–88. doi: 10.1146/annurev.es.17.110186.000435
Pineda-García, F., Paz, H., Meinzer, F., and Angeles, G. (2015). Exploiting water versus tolerating drought: Water-use strategies of trees in a secondary successional tropical dry forest. Tree Physiol. 36, 208–217. doi: 10.1093/treephys/tpv124
Quisehuatl-Medina, A., Averett, J., Endress, B., and Lopez-Toledo, L. (2020). Removal of cattle accelerates tropical dry forest succession in Northwestern Mexico. Biotropica 52, 457–469. doi: 10.1111/btp.12748
R Core Team (2022). R: A language and environment for statistical computing. Vienna: R Foundation for Statistical Computing.
Reich, P., Walters, M., and Ellsworth, D. (1997). From tropics to tundra: Global convergence in plant functioning. Proc. Natl. Acad. Sci. U.S.A. 94, 13730–13734. doi: 10.1073/pnas.94.25.13730
Rodríguez, J., and Rojas-Suárez, F. (2008). Libro rojo de la fauna Venezolana, 3rd Edn. Caracas: Provita and Shell Venezuela S. A.
Rodríguez, J., Rojas-Suárez, F., and Giraldo Hernández, D. (eds). (2010). Libro rojo de los ecosistemas terrestres de Venezuela. Caracas: Provita, Shell Venezuela, Lenovo (Venezuela).
Sanaphre-Villanueva, L., Pineda-García, F., Dáttilo, W., Pinzón-Pérez, L., Ricaño-Rocha, A., and Paz, H. (2022). Above- and below-ground trait coordination in tree seedlings depend on the most limiting resource: A test comparing a wet and a dry tropical forest in Mexico. PeerJ 10:e13458. doi: 10.7717/peerj.13458
Sanders, G., and Arndt, S. (2012). “Osmotic adjustment under drought conditions,” in Plant responses to drought stress, ed. R. Aroca (Berlin: Springer), 199–229. doi: 10.1007/978-3-642-32653-0_8
Santiago, L., Bonal, D., De Guzman, M., and Ávila-Lovera, E. (2016). “Drought survival strategies of tropical trees,” in Tropical tree physiology, eds G. Goldstein and L. Santiago (Cham: Springer International Publishing), 243–258. doi: 10.1007/978-3-319-27422-5_11
Santiago, L., Silvera, K., Andrade, J., and Dawson, T. (2005). El uso de isótopos estables en biología tropical. Interciencia 30, 28–35.
Sobrado, M. (1991). Cost-benefit relationships in deciduous and evergreen leaves of tropical dry forest species. Funct. Ecol. 5, 608–616. doi: 10.2307/2389479
Sobrado, M. (2003). Hydraulic characteristics and leaf water use efficiency in trees from tropical montane habitats. Trees 17, 400–406. doi: 10.1007/s00468-003-0251-5
Sobrado, M., and Ehleringer, J. (1997). Leaf carbon isotope ratios from a tropical dry forest in Venezuela. Flora 192, 121–124. doi: 10.1016/S0367-2530(17)30766-1
Tezara, W., Urich, R., Coronel, I., Marín, O., and Herrera, A. (2010). Asimilación de carbono, eficiencia de uso de agua y actividad fotoquímica en xerófitas de ecosistemas semiáridos de Venezuela. Ecosistemas 19, 67–78.
Tor-ngern, P., Chart-asa, C., Chanthorn, W., Rodtassana, C., Yampum, S., Unawong, W., et al. (2021). Variation of leaf-level gas exchange rates and leaf functional traits of dominant trees across three successional stages in a Southeast Asian tropical forest. For. Ecol. Manag. 489:119101. doi: 10.1016/j.foreco.2021.119101
Turner, N. (1981). Techniques and experimental approaches for the measurement of plant water status. Plant Soil 58, 339–366. doi: 10.1007/BF02180062
van Kuijk, M., and Anten, N. (2009). Whole-canopy nitrogen-use efficiency of pioneer species in early secondary forest succession in Vietnam. Ecol. Res. 24, 811–820. doi: 10.1007/s11284-008-0554-5
Vieira, D., and Scariot, A. (2006). Principles of natural regeneration of tropical dry forests for restoration. Restor. Ecol. 14, 11–20. doi: 10.1111/j.1526-100X.2006.00100.x
Vieira, T., Santiago, L., Pestana, I., Ávila-Lovera, E., Silva, J., and Vitória, A. (2021). Species-specific performance and trade-off between growth and survival in the early-successional light-demanding group. Photosynthetica 59, 203–214. doi: 10.32615/ps.2021.013
Wright, I., Reich, P., Westoby, M., Ackerly, D., Baruch, Z., Bongers, F., et al. (2004). The worldwide leaf economics spectrum. Nature 428, 821–827. doi: 10.1038/nature02403
Keywords: photosynthesis, carbon isotope composition (δ13C), drought, opencast sand mining, resource-use efficiency, water relations
Citation: Ávila-Lovera E, Urich R, Coronel I and Tezara W (2023) Ecophysiological traits change little along a successional gradient in a tropical dry deciduous woodland from Margarita Island, Venezuela. Front. For. Glob. Change 6:1043574. doi: 10.3389/ffgc.2023.1043574
Received: 13 September 2022; Accepted: 11 May 2023;
Published: 01 June 2023.
Edited by:
Fernanda De Vasconcellos Barros, University of Exeter, United KingdomReviewed by:
Yuko Hanba, Kyoto Institute of Technology, JapanCopyright © 2023 Ávila-Lovera, Urich, Coronel and Tezara. This is an open-access article distributed under the terms of the Creative Commons Attribution License (CC BY). The use, distribution or reproduction in other forums is permitted, provided the original author(s) and the copyright owner(s) are credited and that the original publication in this journal is cited, in accordance with accepted academic practice. No use, distribution or reproduction is permitted which does not comply with these terms.
*Correspondence: Eleinis Ávila-Lovera, YXZpbGFlQHNpLmVkdQ==; orcid.org/0000-0003-3529-3600; Wilmer Tezara, d2lsbWVyLnRlemFyYUBjaWVucy51Y3YudmU=; orcid.org/0000-0002-2666-0571
†Present address: Eleinis Ávila-Lovera, Smithsonian Tropical Research Institute, Balboa, Ancón, Panama
Disclaimer: All claims expressed in this article are solely those of the authors and do not necessarily represent those of their affiliated organizations, or those of the publisher, the editors and the reviewers. Any product that may be evaluated in this article or claim that may be made by its manufacturer is not guaranteed or endorsed by the publisher.
Research integrity at Frontiers

Learn more about the work of our research integrity team to safeguard the quality of each article we publish.