 Abderrahmane Ameray
 Xavier Cavard
 Yves Bergeron
- 1Institut de Recherche sur les Forêts, Université du Québec en Abitibi-Témiscamingue (UQAT), Rouyn-Noranda, QC, Canada
- 2Centre d’Étude de la Forêt, Université du Québec en Abitibi-Témiscamingue (UQAT), Rouyn-Noranda, QC, Canada
- 3Département des Sciences Biologiques, Montreal, QC, Canada
Several recent studies point out that climate change is expected to influence boreal forest succession, disturbances, productivity, and mortality. However, the effect of climate change on those processes and their interactions is poorly understood. We used an ecophysiological-based mechanistic landscape model to study those processes and their interactions and predict the future productivity and composition under climate change scenarios (RCP) for 300 years (2010–2310). The effects of climate change and wildfires on forest composition, biomass carbon sequestration and storage, and mortality were assessed in three management units of Quebec boreal forest, distributed along a longitudinal gradient from west to east: North-of-Quebec (MU1), Saguenay–Lac-Saint-Jean (MU2), and Côte-Nord region (MU3). Coniferous mortality variation was explained by competitive exclusion and wildfires, which are related to climate change. In the studied MU, we found a decrease in coniferous pure occupancy at the landscape scale and an increase in mixed deciduous forests in MU1 and MU2, and an increase in mixed coniferous, mainly black spruce and balsam fir in MU3. On the other hand, for extreme scenarios (RCP4.5 and RCP8.5), in the absence of broadleaves dispersal, the open woodland occupancy could increase to more than 8, 22, and 10% in MU1, MU2, and MU3 respectively. Also, climate change might increase overall biomass carbon stock two times for RCP2.6 and RCP4.5 scenarios compared to the baseline this may be explained by the extension of the growing season and the reduction of potential cold-temperature injuries. Generally, western regions were more sensitive to climate changes than the eastern regions (MU3), in fact under RCP8.5 biomass carbon stock will be decreasing in the long-term for MU1 compared to the current climate. This study provides a good starting point to support future research on the multiple factors affecting forest C budget under global change.
1. Introduction
The boreal forest is the second largest biome on Earth and is the subject of increasing interest for its role in the terrestrial carbon cycle. Those ecosystems occupy 27% of world forests in 2020, dominating the subarctic northern latitudes of Eurasia and America, providing 37% of global wood consumption, and other ecosystem services that benefit society at levels ranging from local to global (Gauthier et al., 2015; FAO, 2020; Ameray et al., 2021). They store 88 Pg of carbon in living biomass (aboveground and belowground), 471 Pg in soil and sequester 0.5 Pg year–1, and contain 60% of the world’s soil organic carbon (SOC) (Dixon et al., 1994; Pan et al., 2011). However, numerous studies carried out in the boreal forest and elsewhere have shown that climate change will have considerable impacts on forest mortality, composition, and carbon storage (Bergeron et al., 2006; Peng et al., 2011; Boulanger et al., 2014; D’Orangeville et al., 2018; Molina et al., 2021).
Recently, the climate has been warming as a result of augmentation in radiatively active gases in the atmosphere caused by human activities (IPCC, 2014). The exchanges of carbon between vegetation and the atmosphere are essential determinants of regional climate and the global carbon budget (Schimel et al., 2001). In Quebec boreal forests, climate change reveals a large positive effect of increasing thermal energy on forest productivity leading to 20.5–22.7% projected gains in growth with climate change under RCP 4.5 and 8.5 (Wang et al., 2023). In the high latitudes where the boreal forests are situated, increasing temperatures directly affect trees’ growth and SOC decomposition through effects on photosynthetic and heterotrophic respiration rates respectively, and it is one of the main direct results of climate change which has been observed (Curiel et al., 2007; D’Orangeville et al., 2018). An increase in temperatures may stimulate vegetation growth by increasing the growing season length, but in areas more prone to droughts an increase in temperature might reduce productivity when the tree foliage closes its stomata by regulation process, or even cause increased mortality rates (Peng et al., 2011). Also, higher rates of temperatures and drought frequency may increase the intensity and frequency of wildfires, mainly in the boreal forest (Bergeron et al., 2006; Boulanger et al., 2014).
Wildfires are one of the most significant natural disturbances in the Canadian boreal zone, as there are annually an average of 7,500 fires, burning approximately 2.4 million ha (NRC, 2017). In addition, they affect carbon pools, mostly aboveground biomass (AGB), litter, and soil, and any change in fire regimes can have large-scale consequences through their contribution to atmospheric carbon emissions (Peng and Apps, 2000). Similarly, they affect forest growth, decomposition, forest regeneration and succession, and control stand age class distribution (Bergeron et al., 1999, 2002; Peng and Apps, 2000). Also, fire frequency and intensity affect vegetative reproduction and the regeneration of dispersed or serotinous species, so when the intensity of fires is high, the regeneration opportunities for widely dispersed or serotinous species are favored (Mladenoff and He, 1999). Generally, when the intervals between fires are longer, forests are mainly dominated by conifers while when the intervals between fires are shorter, forests are dominated by early successional species (mostly broadleaves and some conifers like jack pine and black spruce) (Bergeron et al., 2014). Johnstone et al. (2010) state also that when fire intervals are short, black spruce tends to become less dominant.
Landscape models for forest carbon modeling are usually based on empirical models rather than mechanistic ones, and may not be robust to global changes, which are producing novel conditions that forests have not experienced historically. Landsberg et al. (2011) and Kim et al. (2015) have extensively discussed the advantages and disadvantages of using empirical and mechanistic process-based models (PBMs) in spatial forest management. The empirical models based on national forest inventories are widely used for the assessment of carbon sequestration (e.g., CBM-CFS3, CO2FIX, CASMOFOR, and EFISCEN) (Kurz et al., 2009; Landsberg et al., 2011; Kim et al., 2015). In boreal forests, CBM-CFS3 is commonly used to provide relatively more detailed-level compartments and volume-to-biomass conversions in the processes of growth (Kurz et al., 2009). However, these models do not treat explicitly all of the processes occurring in the ecosystem, as they are mainly based on statistical relationships to estimate forest development (Kurz et al., 2009; Kim et al., 2015). On the other hand, PBMs integrate a set of functional relationships (tree–soil–climate), and their interactions with each other, in order to describe the behavior of a given system (Huang et al., 2018). There are multiple processes such as succession, disturbances, and land-use changes, occurring at the ecosystem level; PBMs offer a framework for testing alternative hypotheses and help us accurately describe how those processes will interact under a given environmental change (Cook et al., 2008).
In the boreal forest climate change and wildfires will affect forest composition and structure at the landscape scale. Consequently, young forests dominated by pioneer broadleaf species (e.g., Populus tremuloides) are projected to increase in relative abundance, while the coniferous boreal forest is expected to decrease significantly mainly in transition zones (boreal-temperate) (Boulanger et al., 2017; Molina et al., 2021). In the Quebec spruce-feathermoss bioclimatic zone, increases in droughts and frequent vast fires will likely drive a transition to open lichen woodlands (Stralberg et al., 2018). However, species growth and establishment are related to site conditions. This process depends on (1) how far seeds disperse to new sites within a given timeframe, (2) the new site soil and climate conditions, (3) how readily new seeds can produce established cohorts, (4) how quickly newly established cohorts reach sexual maturity, (5) competition with resident and other migrating species, and (6) natural and anthropogenic disturbances (e.g., harvest, wildfire, insects, and disease) that interact to affect competition for light and water (Liang et al., 2018).
In this study, we used PnET-Succession of LANDIS-II as PBMs to improve our understanding of the short, medium, and long-term effects of climate change and wildfires on boreal forest composition, mortality, and biomass carbon storage at the landscape scale (Mladenoff and He, 1999; Scheller et al., 2007; De Bruijn et al., 2014). This PBM uses physiological first principles to mechanistically account for the effects of temperature, light, and water availability on photosynthesis (competition and growth) and includes simulation of seed dispersal and establishment. Based on the literature, we first hypothesized that in the future boreal forests might accumulate more C in living tree biomass for broadleaves and decrease those of coniferous under climate change (Bergeron et al., 2014; D’Orangeville et al., 2018; Molina et al., 2021; Wang et al., 2023). Also, coniferous mortality will increase under climate change, because of wildfires and competition with broadleaves (Boulanger and Pascual Puigdevall, 2021). Therefore, near the Québec northern logging limit (the limit beyond which forests are not managed because of their lower productivity), along a longitudinal gradient in three management units (MU) and under different scenarios of climate change (RCP) and wildfires frequency and severity, we aim to (1) project the future boreal forest composition, (2) forecast biomass carbon storage at the landscape scale, (3) assess the effect of climate and the cause (competitive exclusion or wildfires) on forest mortality, and finally, (4) carbon sequestration was evaluated under different climate change scenarios. The scope of this study did not include human interventions (e.g., afforestation and management) and disturbances other than fire (disease and pests). We highlighted this study’s aims as well to calibrate the model and perform an extensive sensibility analysis. This study identifies the parameters that mostly influence the outputs of LANDIS-II/PnET-Succession and consider interactive effects as well. Consequently, it offers to the users a more complete understanding of model uncertainty and responses to variations in the inputs.
2. Materials and methods
2.1. Study area
The study was conducted along a longitudinal gradient of Québec’s boreal forest (Figure 1). Forest landscapes were simulated within three MU: UM08551 in Nord-du-Québec (MU1), UM2471 in Saguenay–Lac-Saint-Jean (MU2), and UM09351 in the Côte-Nord region (MU3). Each MU encompasses a wide variety of forest types, soils, slopes, and local climate conditions. Also, those MU are located in several sensitive areas near the northern limit of Québec managed forest and belong to the spruce-feathermoss and balsam fir- white birch bioclimatic domains of the Boreal Shield, dominated by black spruce (Picea mariana), jack pine (Pinus banksiana), balsam fir (Abies balsamea), white birch (Betula papyrifera), trembling aspen (P. tremuloides), and other species (MFFP, 2010). All commercial tree species present in these landscapes are summarized in Table 1 and simulated during the experiments. From the western to the eastern region the annual precipitation average ranges from 824 to 970 mm with a high longitude gradient effect (Wang et al., 2016). In each MU, the MFFP (Ministère des Forêts, de la Faune et des Parcs) ecoregions were considered (Figure 1), and the unproductive forest land was excluded for the analysis including water bodies, wetlands, islands, and other no-commercial species (inactive cells). On the other hand, the productive cells that were recently disturbed in 2010 (after logging or wildfires) were activated.
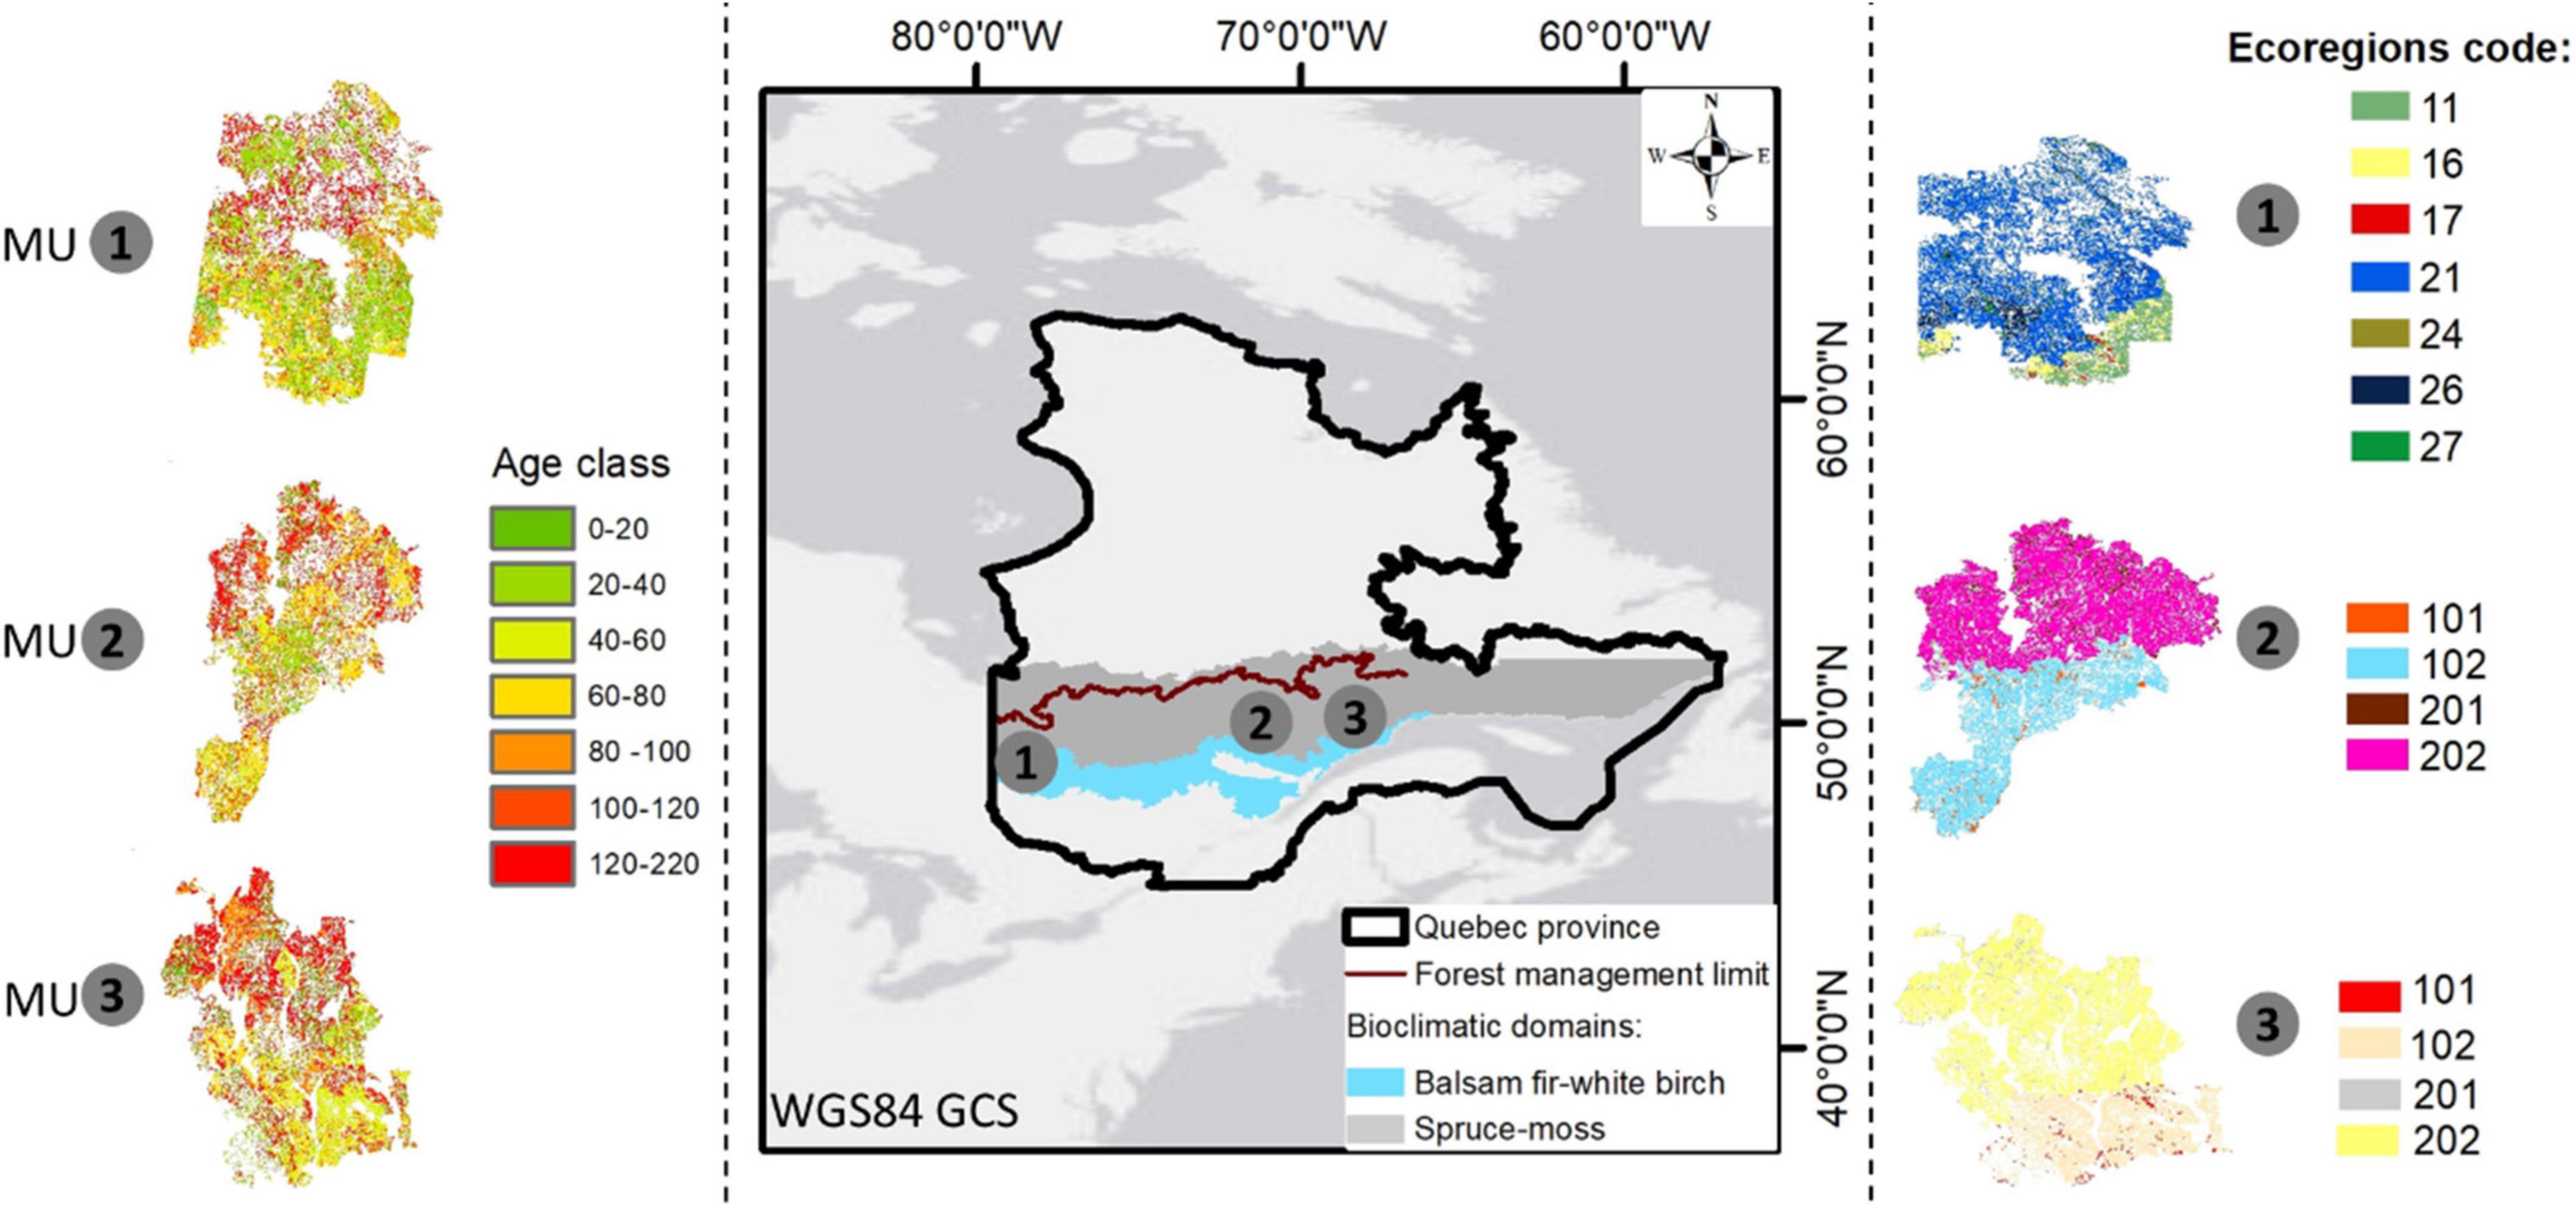
Figure 1. Study area (three management units: MU1, MU2, and MU3) with their ecoregions (see Table 2). The age-class structure of each MU in 2010 (the starting year 0).
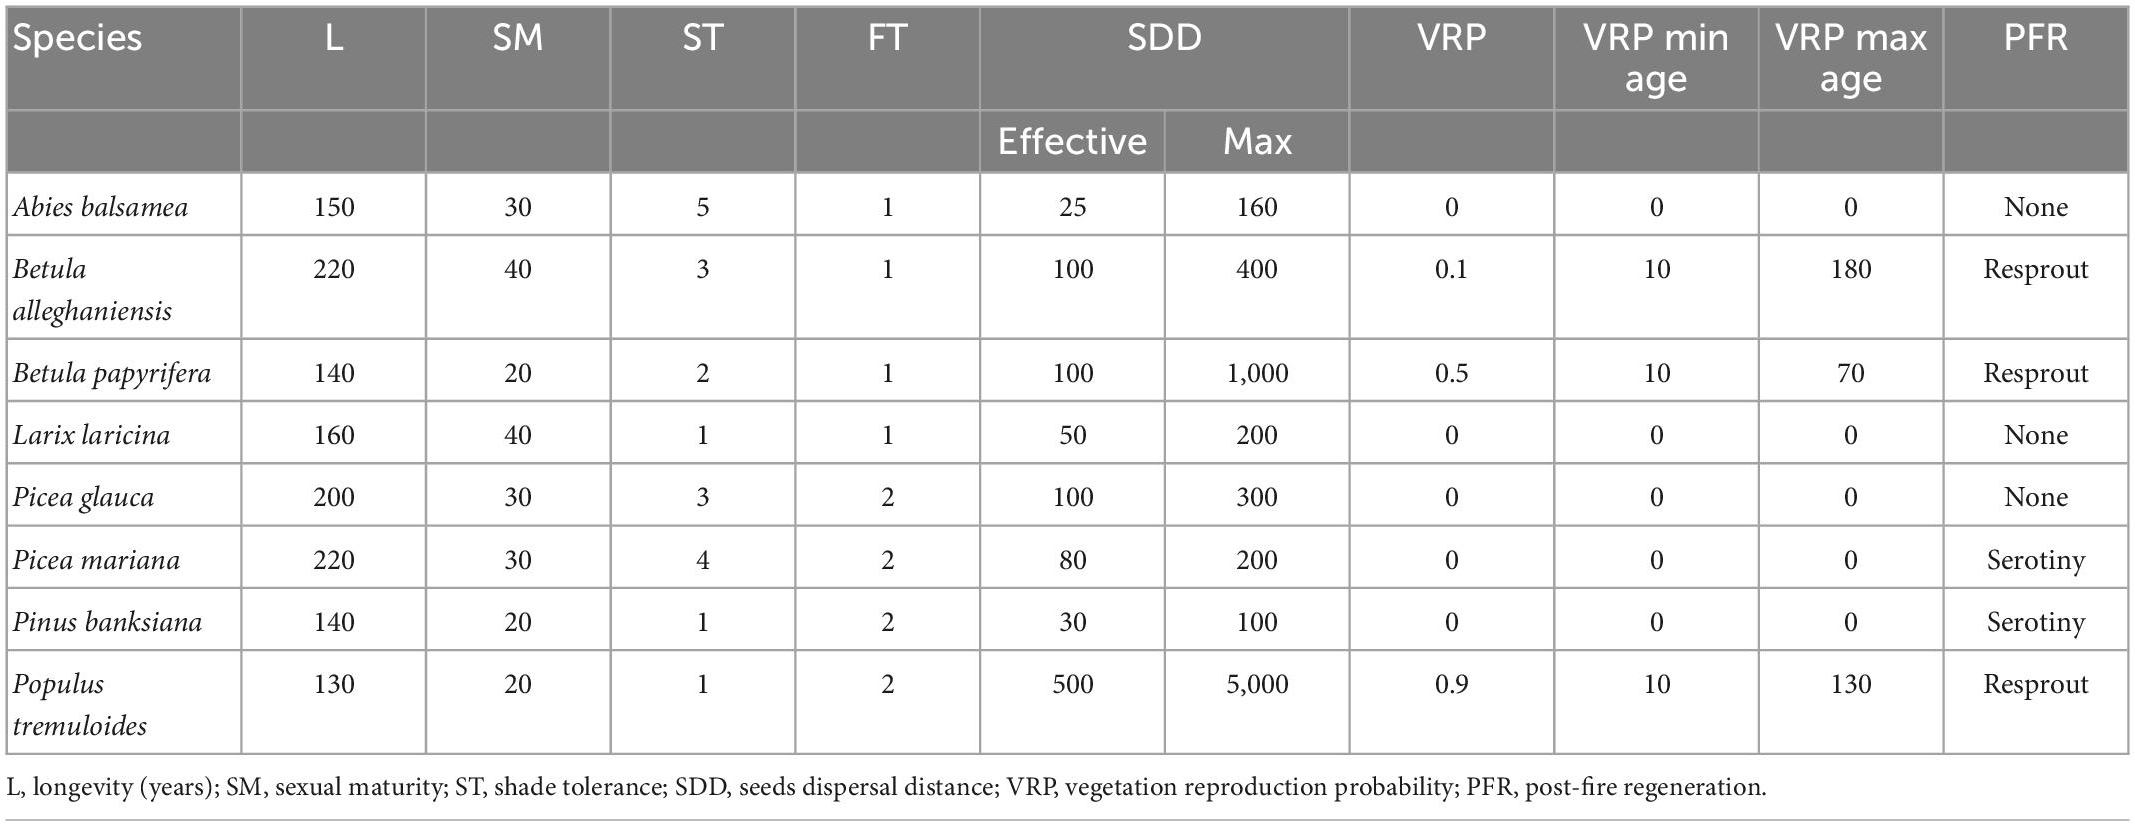
Table 1. The life-history attributes for the eight species according to Boulanger et al. (2017), the ages were updated considering site index per species from Pothier and Savard (1998) yield tables.
2.2. Forest simulation model
We conducted landscape-scale simulations at a spatial resolution of 200 × 200 m (4 ha) for forest growth, succession, and disturbance across the three MU, using LANDIS-II (V7.1). The simulated area was 0.6 × 10⁶, 1.2 × 10⁶, and 1.1 × 10⁶ ha in MU1, MU2, and MU3, respectively. LANDIS-II is a process-based forest landscape disturbance and succession model, stochastic and spatially explicit, it simulates the forest development processes (e.g., succession, growth, and dispersal), forest disturbances (management, wildfires, windthrow, and insect outbreaks), and other forest degenerative processes (senescence and mortality) at large spatial and temporal scales (Mladenoff and He, 1999; Scheller et al., 2007). These landscape processes are dependent on neighboring locations in the surrounding landscape and on neighborhood interactions from focal cells, including adjacent neighbors (e.g., fire spread) and non-adjacent neighbors (e.g., seed dispersal). We used the default seed dispersal algorithm of Brendan Ward’s where two negative exponential distribution are used to calculate the probability of a seed landing at a site (Ward et al., 2005; Scheller et al., 2007). LANDIS-II uses a probability decay function to simulate seed dispersal from surrounding cells – i.e., the probability of arriving seeds decreases with increased seeding distance, with distance drawn from two negative exponential distributions defined by a species’ effective and maximum seed dispersal distances, and the total probability that seeds will be present is equal to the sum of the probabilities from each source cell (Ward et al., 2005).
Because our study investigates novel conditions of climate, we used a LANDIS-II succession extension (PnET) with very direct links between climate drivers and species establishment and growth (Aber and Federer, 1992; Gustafson and Miranda, 2019). The PnET-SUCCESSION v4.1 extension uses the physiological first principles incorporated in the PnET-II ecophysiology model (Aber and Federer, 1992; De Bruijn et al., 2014). PnET-Succession mechanistically projects growth and competition of tree species cohorts on each landscape grid cell (Gustafson and Miranda, 2019). The cohort photosynthesis and growth are simulated as competition for light and water among all the cohorts at each grid cell with a monthly time step (De Bruijn et al., 2014; Gustafson et al., 2015). These estimations are dependent on multiple reduction factors: water stress, suboptimal radiation, vapor pressure deficit, and departure from optimal temperature. Respiration increases with temperature using a Q10 relationship, where a 10°C increase in temperature results in a tenfold increase in respiration rate. Each species has optimal, minimum, and maximum temperatures for photosynthesis, causing its phenology to respond to the climate inputs each month and year. Competition for light is modeled by tracking solar radiation through canopy layers (related to cohort age) according to a standard Lambert–Beer formula (Aber and Federer, 1992). Available soil water depends on soil texture, inputs from precipitation, and losses from interception, evaporation, runoff, transpiration by cohorts, and percolation out of the rooting zone. The establishment probability (Pest) is a function of the light and water photosynthesis reduction factors for the species at the time of establishment. In PnET-Succession, species-specific life-history traits reflect the competitive ability for resources (e.g., light and water), which have implications for simulated tree species range boundary shifts. PnET-Succession and LANDIS-II have been widely used in North America including Quebec boreal forest (Boulanger et al., 2017; Mina et al., 2021, 2022; Molina et al., 2021). Complete details of the PnET-Succession extension are found in De Bruijn et al. (2014) and Gustafson and Miranda (2019). All simulations were run for 300 years (2010–2310) at 20-year step intervals and a 200 × 200 m resolution grid (4 ha).
2.3. Models’ parametrization and calibration
2.3.1. Initial communities and ecoregions parameters
For each MU, an input map of initial communities that contains a unique integer for each combination of species and cohorts was created from the fourth national forest inventories (NFI) geodatabase (MFFP, 2010). The tree of each forest stand are grouped into species-age classes, each class being represented by a cohort. The species were grouped into 344, 377, and 339 initial communities in MU1, MU2, and MU3, respectively. Each tree species requires a set of parameters related to the cells as attributes, including longevity, sexual maturity, shade tolerance, seed dispersal distance, sprouting, and post-fire regeneration, as well as shade parameters, which affect the ability of tree species to reproduce via seeding and resprouting (Table 1). The life-history attributes determine the successional strategy for each species. Also, the PnET-Succession extension modifies the calculation of shade based on the leaf area index (LAI). The HalfSat was calibrated to reflect shade tolerance because the LANDIS-II shade tolerance parameter in Table 1 has no effect in PnET-Succession. The species shade tolerance and the stand shade are used to determine whether light is sufficient for the species to seed or resprout. Also, species establishment probability (SEP) is calculated at each time step as a function of abiotic conditions (water and light).
The LANDIS-II model requires an input map that divides the landscape into ecoregions, where the soil properties and climate conditions (precipitation and temperatures) are assumed to be homogenous (Table 2). The ecoregions were defined by Quebec’s Ministry of Forest, Fauna and Parks (MFFP) and integrated with (Duchesne and Ouimet, 2021) dataset to delimit more refined ecoregions per MU based on soil types (textures) which correspond with FAO categories (Gustafson and Miranda, 2019). Duchesne and Ouimet (2021) modeled and mapped particle size composition for the entire managed forests area in the province of Quebec, and these data were used to classify soil’s texture for all MUs using clay, silt, and sand percentages for each cell of 4 ha based on a decision tree algorithm. The soil type is used in the PnET model to determine the water retention curve of the soil. The precipitation lost fraction which represents the proportion of precipitation that does not enter the soil (e.g., runoff) was adjusted for topographic slope per ecoregion. Also, the rooting depth was assumed to be lower in Côte-Nord (MU3) than in other units.
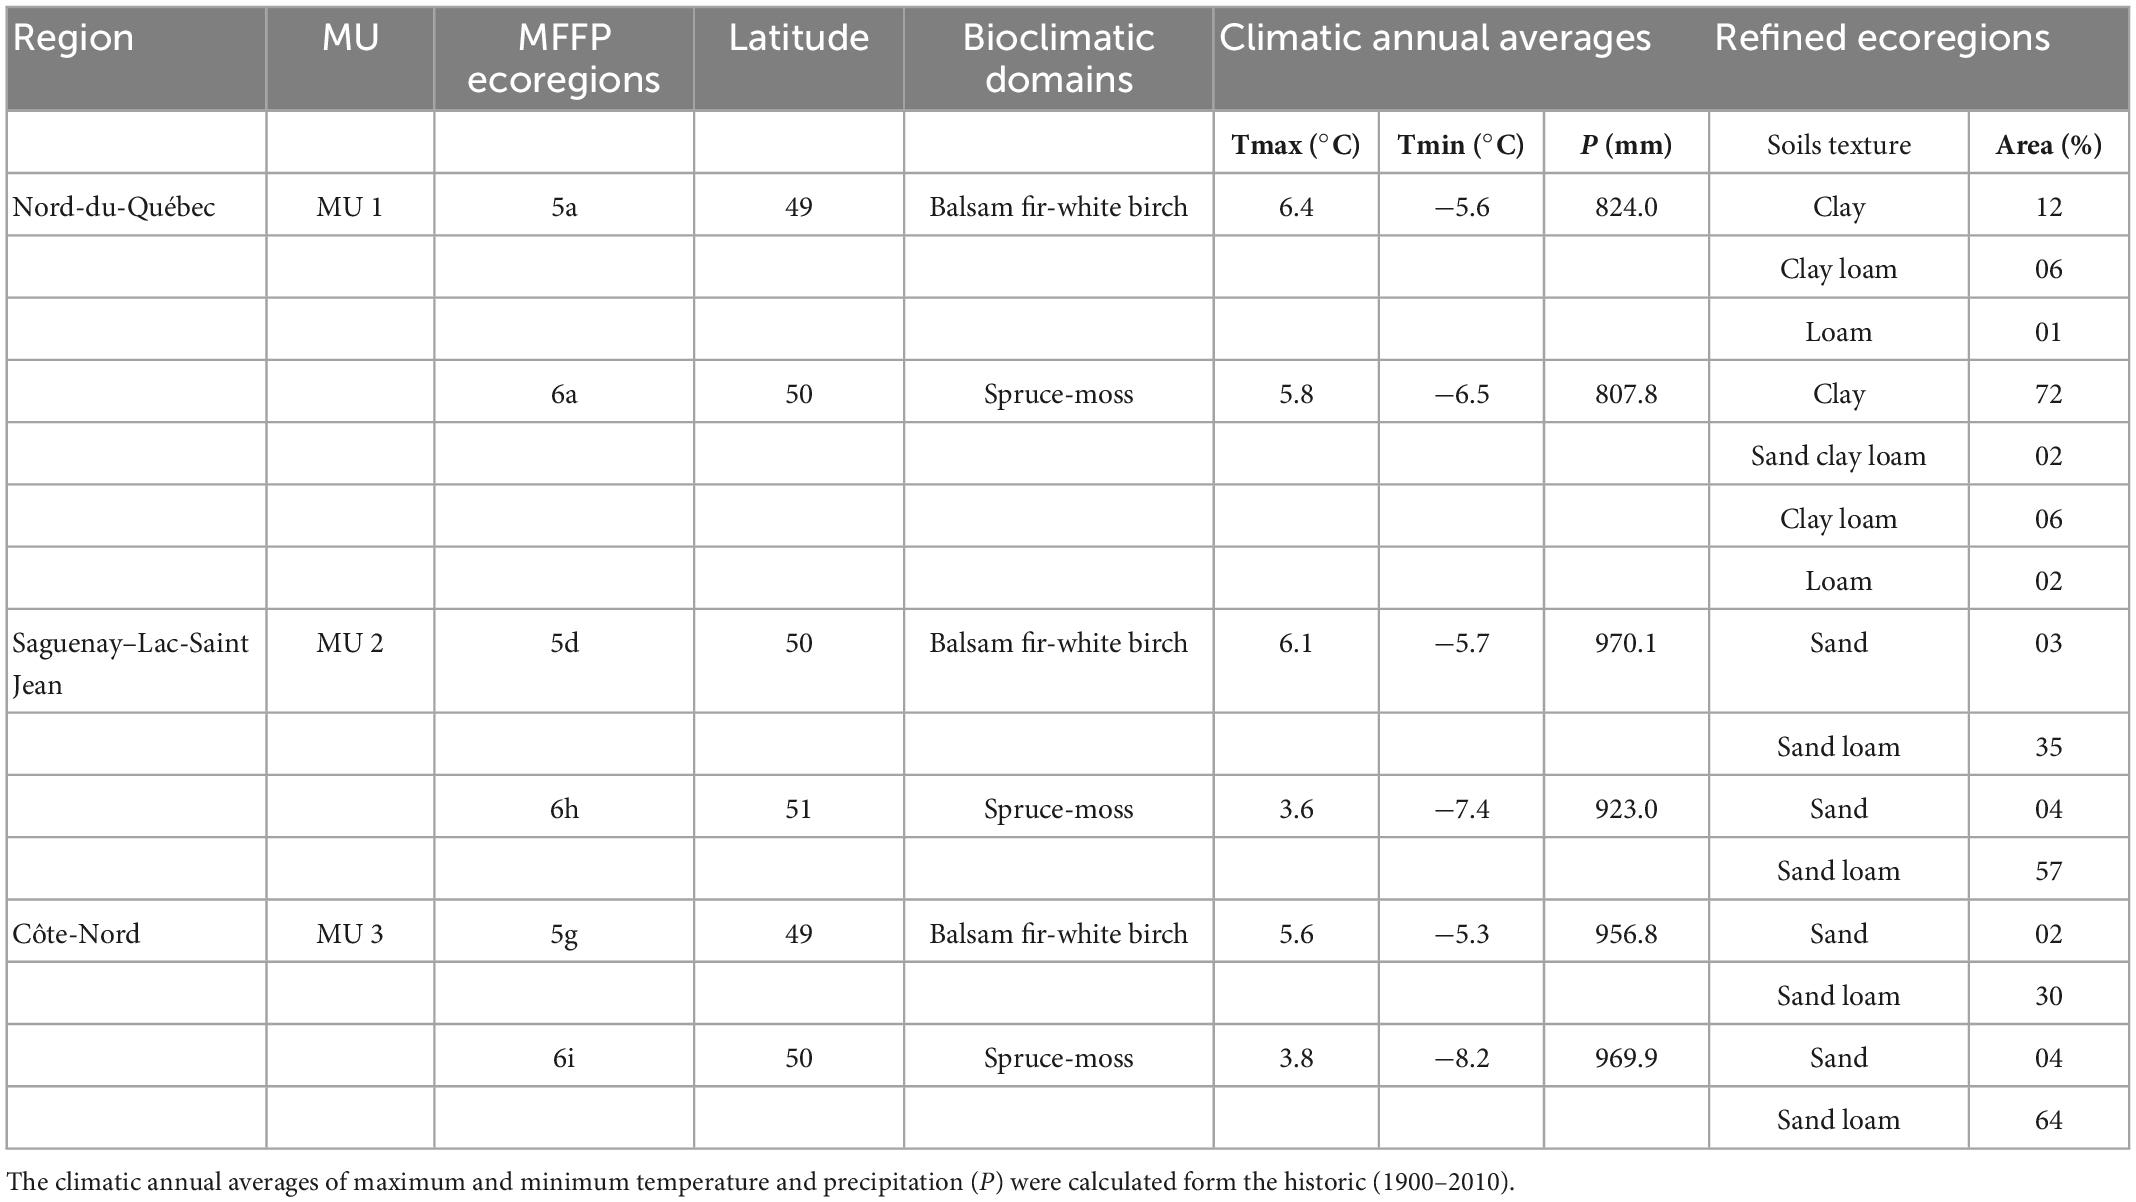
Table 2. The characteristics of used ecoregions during the simulations.
2.3.2. Climate and atmosphere composition
PnET-Succession extension requires average monthly temperature (Tmin and Tmax), precipitation (mm), photosynthetically active radiation (PAR), and atmospheric CO2 and O3 (optional) concentrations as inputs. The climatic data for each ecoregion were extracted from the climateNA model (Wang et al., 2016), a local downscaling model which facilitates extracting climate data for specific locations (longitude, latitude, and elevation). The second-generation Canadian Earth System Model (CanESM2) data from climateNA spatial model were used (Wang et al., 2016). In order to represent ecoregion climate conditions, an average of each climate parameter was calculated from 10 locations randomly distributed inside each MFFP ecoregion (Table 2). ClimateNA model provides data until 2100, so the climate scenarios per month were extrapolated until 2310, using Extended Concentration Pathways (ECPs) rules, recommended by (Meinshausen et al., 2011) and IPCC group (Collins et al., 2013), which describe the RCPs from 2100 to 2500 (Supplementary Figures 1, 2). The purpose of these extrapolations was to simulate for the medium and long-term (more than species longevity) and to catch the landscape productivity and composition equilibrium. CO2 concentration data was acquired from the RCP database,1 which covers data representing a time frame of every 10 years until 2310. For the baseline climatic scenario, we assumed that CO2 remained constant at 389 ppm (2010) during the simulation, while in the case of RCP scenarios, the CO2 concentration was projected to 360.67 ppm under RCP2.6, 542.96 ppm under RCP4.5, and 1,961.58 ppm under RCP8.5 in 2310 (Supplementary Figure 2).
2.3.3. PnET-Succession parametrization and calibration
The model was tested and calibrated using one single cell, based on local biomass estimations and literature information (Paré et al., 2013; Duveneck and Thompson, 2019; Gustafson and Miranda, 2019). Our goal was to match the empirical curve [above-ground biomass (g m–2) as a function of age] as much as possible. PnET succession parameters were calibrated based on Gustafson’s guidance (Gustafson and Miranda, 2019). For each MU, the species were calibrated for 120 years, following a single cohort initialized without regeneration, using the PnET-Succession output-sites option to produce the cohort growth output files. All species were calibrated under optimal conditions (Gustafson and Miranda, 2019), using a fixed annual weather stream (long-term monthly averages) of the historic climate (1900–2010). Also, sandy loam soil type was used for calibration since it has relatively a high-water holding capacity. For species generic parameters, the default values from the PnET-Succession user guide were used (Gustafson and Miranda, 2019).
In order to improve our calibration, 19 specific parameters were tuned within the empirical bounds of literature values (Table 3). Regarding each specific parameter’s confidence interval (McKenzie et al., 2019), other values were assessed, thus increasing the number (n) of tested combinations of all parameters. In order to test several combinations (n > 104), a python script was built (using NumPy and Pandas libraries), allowing the selection of the best one (set of the 19 parameters). The closeness of fit was quantified by the Least-squares approximation method as one of the most used objective function, which allows finding a single optimum parameter set that provides model results fitting the empirical data as closely as possible. The root-mean-square error (RMSE) between predicted and simulated curves was calculated and only the output with the lowest RMSE and close to the empirical values (AGB) reported by Pothier and Savard (1998) was saved. To select the appropriate empirical yield curve (optimal) per species from Pothier and Savard (1998), we used the mean site index (SI) from NFI, which reflects the abiotic conditions (soil and climate) of each MU. To ensure that units were the same as outputs by PnET-Succession, we converted volumes to biomass using density values (g m–3) (MFFP). In addition, as the LAI determines the ability of a cohort to compete for light, LAI must approximate empirical values. We used the values reported by Chen et al. (1997) for boreal forest species (1.56 ≤ LAI ≤ 4.81 m2 m–2 for the old stand).
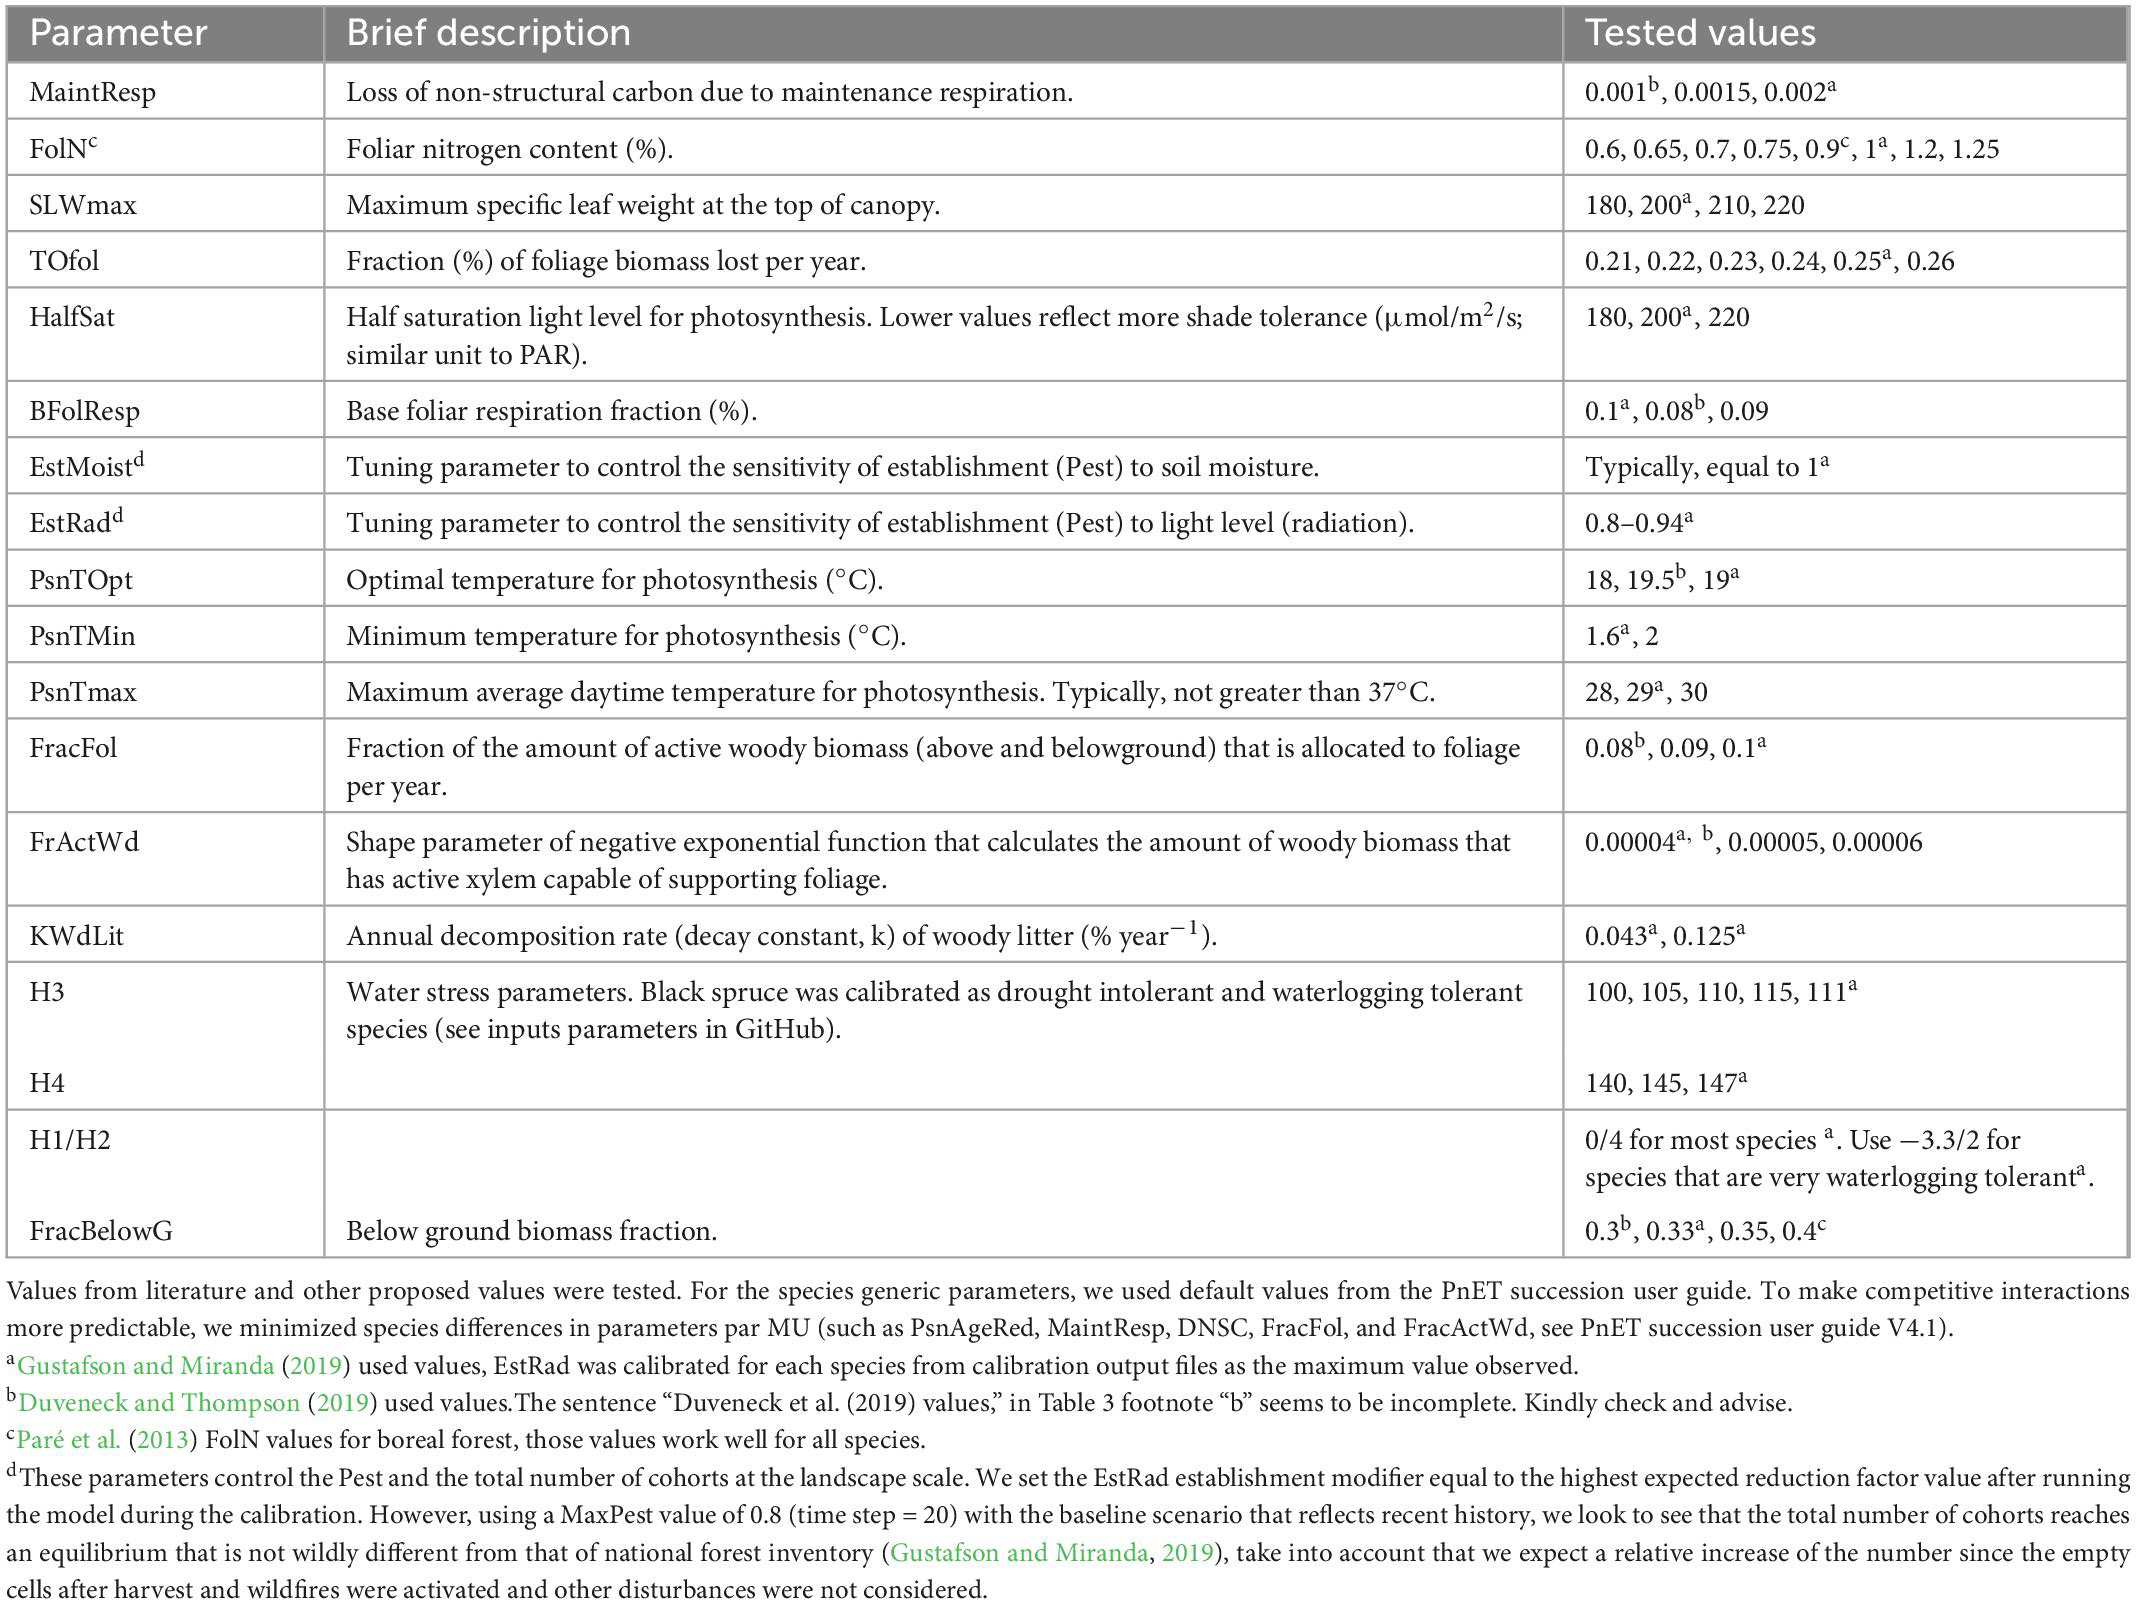
Table 3. An example of the tested values of 19 parameters for black spruce in MU1.
2.3.4. Wildfire’s disturbances calibration
The wildfires effect was assessed using the extension Base-Fire (v4.7), this extension simulates fire regimes through stochastic fire events depending on fire ignition, initiation, and spread by ecological region, using as input data: ignition probability, fire regions map, fire size (min, mean, and max), fire severity and the k parameter that determines the strength of the association between fire spread probability and fuel age (Scheller and Domingo, 2018). As the wildfire regime depends on climate change, the burned area (land disturbed annually) was calculated per MFFP ecoregion (5a, 5d, 5g, 6a, 6h, and 6i) for each climatic scenario from the literature (Supplementary Table 1; Bergeron et al., 2006; Boulanger et al., 2014; Gauthier et al., 2015; Boucher et al., 2017; Tremblay et al., 2018; Molina et al., 2021). Fire simulations were not parameterized as a process emerging from dynamic changes in vegetation as well as from climate change, but fire regime data (annual area burned, fire occurrence, min, max, and mean fire size) were first compiled into “fire regions” corresponding to the Canadian Homogeneous Fire Regime (HFR) zones (Boulanger et al., 2014), and they were updated to account for changing climate conditions under the different RCP scenarios (see Supplementary Table 1; Bergeron et al., 2006; Gauthier et al., 2015; Tremblay et al., 2018). Also, the probability of ignition for each ecoregion as well as the severity was used from the literature (Tremblay et al., 2018; Molina et al., 2021). The fire rotation period was short in MU2 compared to MU1 and MU3 (see input files for more details). In addition, the initial fire regions map parameter is the input map showing where the fire regions are located on the landscape, we assumed that the fire could occur stochastically across all of the activated cells.
2.4. Sensitivity analysis
To better understand the increased mechanistic detail provided by the model, we studied the effect of the uncertainty of the parameters on the outputs based on local and global sensitivity analysis (GSA). In order to reduce the simulation time and outputs size during the sensitivity analysis, we simulated a small landscape in each MU of 46-by-46 cells grid landscape totaling 2,116 cells, each representing 4 ha of forested land. This experiment grid contains all the studied species. As the PnET model is more mechanistic, more input parameters are required, which increases model parameter uncertainty. We used a local sensitivity analysis (LSA) on 12 specific parameters (MaintResp, FolN, SLWmax, TOfol, HalfSat, BFolResp, FracFol, FrActWd, KWdLit, AmaxA, AmaxB, H3, H4, K, Slwdel, and FracBelowG) and the climatic inputs using 20 replications. The strength of LSA is that it is easy to perform since just one input parameter is varied for each test. Using the initial calibrated values, we varied all the parameters including radiation and CO2 atmospheric composition by 5%. Then, the variation percentages (V; %) between the outputs of each iteration and the initial values (reference parameters) were calculated. However, interpretations of LSA are limited when several parameters might interact dynamically through the range of individual values (Saltelli and Annoni, 2010). Consequently, we used a GSA to capture the model sensitivity throughout all of the input parameters, using the Sobol algorithm. The Sobol indices is a variance-based method very popular in recent literature (McKenzie et al., 2019). Salib library in python was used to build the Sobol model algorithm using 100 as the sampling size, resulting in 2600 replications. This algorithm is an extensive GSA; it calculates total sensitivity indices for each parameter, including influence due to interaction effects (McKenzie et al., 2019). The objective of LSA and GSA was to identify the most sensitive parameters and to reduce the tested combinations in the other MU (2 and 3) later during the calibration.
2.5. Model validation
The annual NPP (below and aboveground) was validated in the three MU using MODIS imagery (Moderate Resolution Imaging Spectroradiometer). MOD17A3 is a product provided by MODIS that allows studying mainly carbon sequestration by vegetation, the product MOD17A3 allows the calculation of annual NPP (Running et al., 2000). The MOD17A3 was resampled to match LANDIS-II NPP grid outputs resolution (200 × 200). From the NFI geodatabase, 104 sites per MU with mature (80–120) high-density stand were randomly selected, followed by PnET-output sites extension, and compared to MOD17 NPP in the year 0 (2010) (t-test). High-density stands were chosen to avoid any considerable effect of understory vegetation on annual NPP estimation from MODIS imagery.
On the other hand, the LAI during summer (growing season) was validated as well using remote sensing. The monthly LAI estimations were derived only in MU1 since all the studied MU were dominated by similar species, using 500 samples. The LAI simulated values were provided by PnET-output sites extension. The empiric LAI was extracted from Sentinel-2 imagery and compared to the estimated LAI by PnET succession, using t-test in R software. The images were downloaded from Open Access Hub during the growing season of 2020 (8 August, zone path: T17UPQ), processed, rescaled and co-registered to match the spatial resolution of the used grid (200 × 200 m), using Castro et al. (2020) method in SNAP software. The obtained values by both methods were compared to Chen et al. (1997) optical measurements.
2.6. Scenarios design and data analysis
In order to separately assess wildfires and climate effects on forest biomass carbon storage, we designed eight scenarios for all the studied MU. We firstly ran the model without wildfires (only succession) with the four climate scenarios (baseline and RCP). Then, we ran it with all the climate scenarios under wildfire disturbance. We assessed the differences in biomass accumulation, forest composition, and mortality rate among the scenarios in the short- (ST: 2010–2110), medium- (MT: 2110–2210), and long- (LT: 2210–2310) terms. The mortality rate reflected the number of cohorts of each species killed by the major sources of mortality succession (competitive exclusion) and wildfires. The percentage area of the different tree species and forest type was used to quantify forest composition occupancy in percentage, dividing the forest into six types (BsPF, black spruce pure forests; OcPF, other coniferous pure forests; BPF, broadleaves pure forests; BsJP, black spruce and jack pine; BsAB, black spruce and balsam fir; BsOC, black spruce and other coniferous; OCMF, other coniferous mixed forests; BMF, broadleaves mixed forests; BsBMF, black spruce and broadleaves mixed forests; OCBMF, other coniferous and broadleaves mixed forests; Em, open woodlands). We highlight that for each scenario, we used three replicates, which reflected the minimum required number to capture stochastic variation in the response variables (Murphy et al., 2014; Zhuo et al., 2020). The relative effects of mortality cause (wildfires/competitive exclusion), climate, period (ST, MT, and LT), and the interaction of climate with both factors on mortality were calculated using a repeated-measures analysis of variance (ANOVA-3). All the statistical analyses in our study were performed in RStudio (v3.6.3). In addition, in order to understand the model behavior and climate effect on carbon sequestration, the species’ annual NPP (above and belowground) under different climate scenarios were assessed during their longevity period (starting from their establishment until their mortality).
LANDIS-II could not account for the fact that most broadleaves have several limitations for dispersal near the Nordic limit of Québec managed boreal forest (e.g., organic soils and nutrient deficit). Consequently, we assessed and discussed the effect of restricting the broadleaves dispersal on forest composition and biomass carbon storage. An extreme scenario was therefore added in all MU, where under wildfire disturbance, the broadleaves effective and maximum dispersal value was set to 1 m (minimum value).
3. Results
3.1. Calibration, validation, and sensitivity analysis
After calibration, modeled projections of AGB under the current climate, showed excellent agreement with empirical data (Figure 2). The calibrated curves closely emulated the empirical ones for the most abundant species such as black spruce, jack pine, balsam fir, and trembling aspen (AD ≤ 5 t ha–1 and RMSE ≤ 10 t ha–1), and moderately emulated them for the other species (e.g., white birch) in MU1 (10 t ha–1 < RMSE ≤ 15 t ha–1). The highest RMSE was observed for white spruce and larch (Larix laricina) species (RMSE > 15 t ha–1). The correlation coefficient between measured and predicted biomass was 91%, but there was a slight bias in the model predictions for the age between 40 and 80 years with an absolute difference (AD) higher than 15 t ha–1 for larch tree and white spruce, mainly in MU2 and MU3.
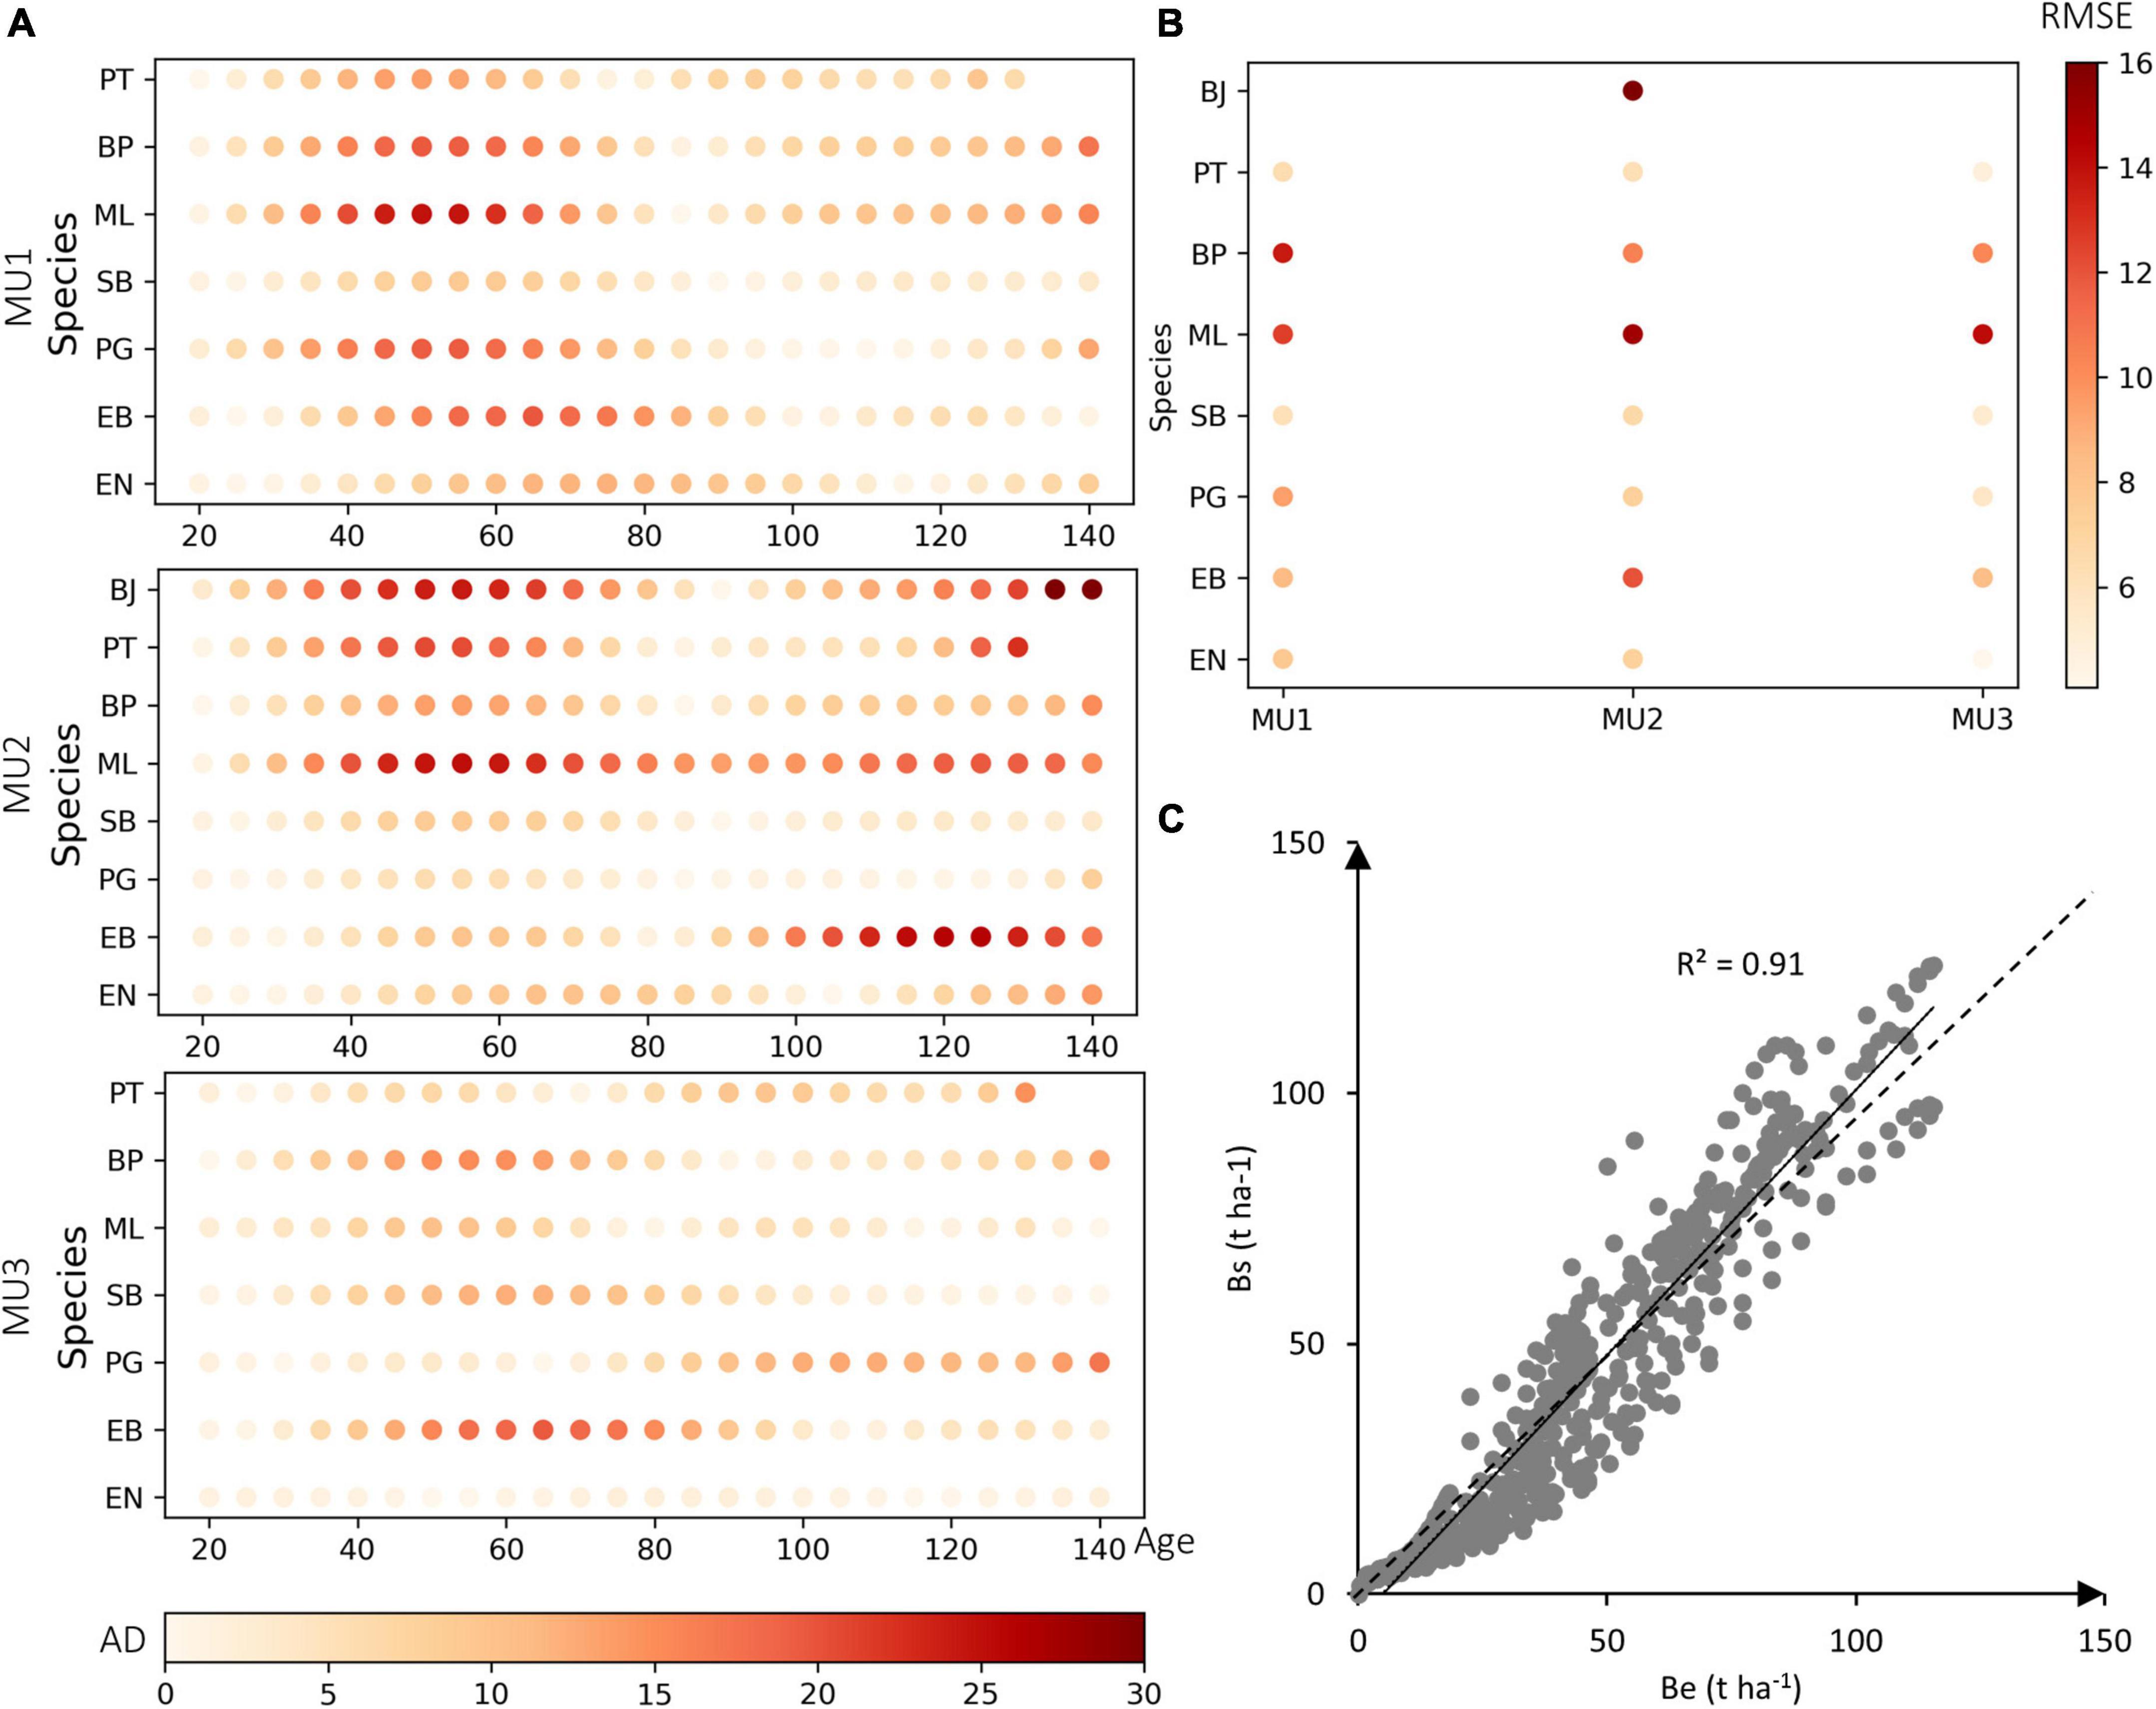
Figure 2. (A) Calibration results of all species in the three MUs (MU1, MU2, and MU3), the color-bars present the absolute difference (AD) between empirical biomass (Be) and simulated biomass (Bs) for 120 years per studied species (EN, black spruce; EB, white spruce; PG, jack pine; SB, balsam fir; ML, larch tree; BP, white birch; PT, trembling aspen; BJ, yellow birch). (B) The root-mean-square error (RMSE) between Be and Bs in the three MU. (C) The correlation between all simulated and empirical values used for calibration, the dotted line represents the 1:1 ratio, and the continuous line represents the adjusted model.
Our validation of both LAI and NPP was informative (Figure 3). We found a LAI value of 2.36 and 2.78 m2 m–2 from Sentinel-2 and PnET-Succession respectively (Figure 3A). The t-test reflects that the mean LAI of PnET-Succession was significantly different from that observed by Sentinel-2 (p-value < 0.05). However, the values founded by both methods are very close to those reported in the literature in the boreal forest. For NPP validation, the estimated NPP values from MODIS and LANDIS-II models were very similar, but also significantly different (p < 0.05). The highest NPP average estimated in 2010 by our model was observed in MU2 (606.67 g m–2 year–1) while a moderate value was observed in MU1 (575.22 g m–2 year–1) and lower values in MU3 (483.62 g m–2 year–1) (Figure 3B). However, the RMSE between both method (MODIS vs. Landis-II) is moderately high (>100 g m–2 year–1).
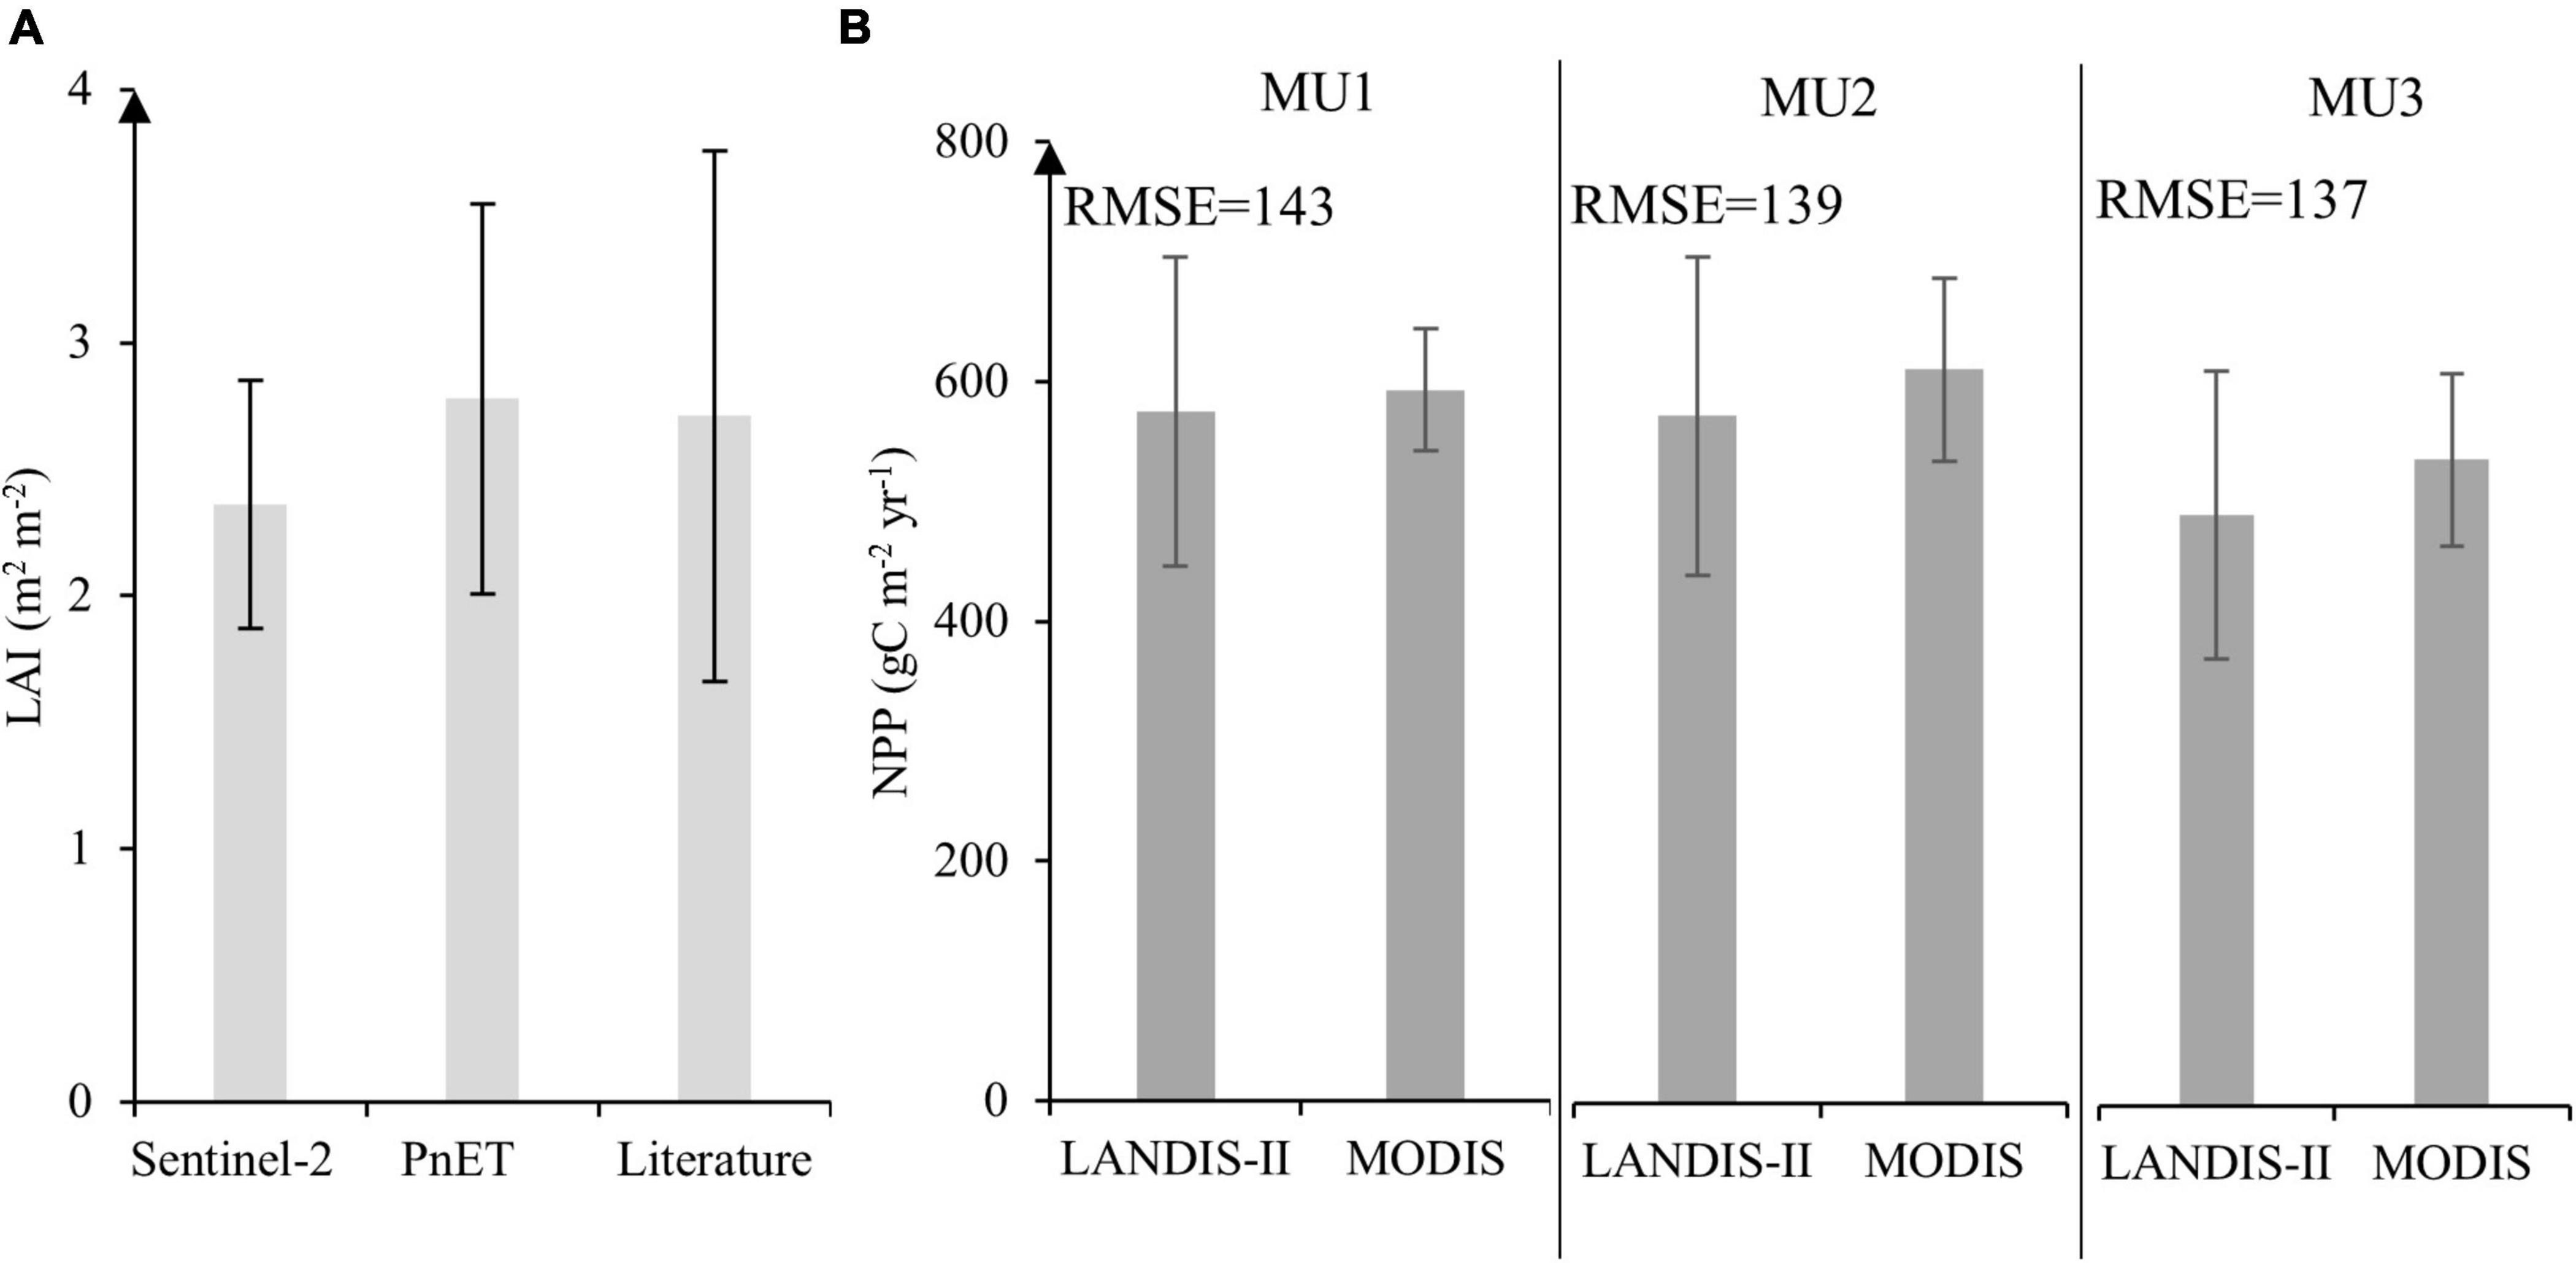
Figure 3. (A) Comparison for MU1 between monthly LAI during the growing season per unit ground surface area (m2 m– 2) at landscape scale of PnET succession in 2020 with Sentinel-2 and literature values. (B) Model validation through annual NPP estimated by MODIS imagery and the predicted data from LANDIS-II. The error bar presents the standard deviation at a significance level of 0.05.
Our LSA analysis indicates that the biomass module was sensitive to all PnET parameters tested (V > 5%) (Figure 4A). The LSA showed that the model was highly sensitive to four parameters (FolN, HalfSat, FracFol, and TOfol), where the V tended to 100% when we increased the parameter by 20%. The LSA supported the direction and magnitude of the influence of each parameter on total biomass (Figure 4A), for instance, increased FolN and temperature inputs increased landscape biomass variation. On the other hand, the precipitation did not have a substantial effect on the biomass variation in the study area, while increasing radiation (rad) and atmospheric CO2 concentration by 50% did increase the biomass by 30% (Figure 4B). Based on the Sobol results (Figure 4C), all the parameters exhibited first-order sensitivities (S1 > 0.01), except KWdlit, H3, and H4. The total landscape biomass was especially sensitive to FracFol, FolN, followed by MainResp. Also, GSA showed that there were likely higher-order interactions occurring. The GSA showed that MaintResp was either strongly or moderately interacting with all of the tested parameters. A strong interaction was also observed between FolN, MaintResp, SLWmax, TOfol, HalfSat, BFolResp, FractWd, and KWdlit. However, it seemed that the PnET model mostly required a careful calibration of FolN and MaintResp since they are interacting with other parameters.
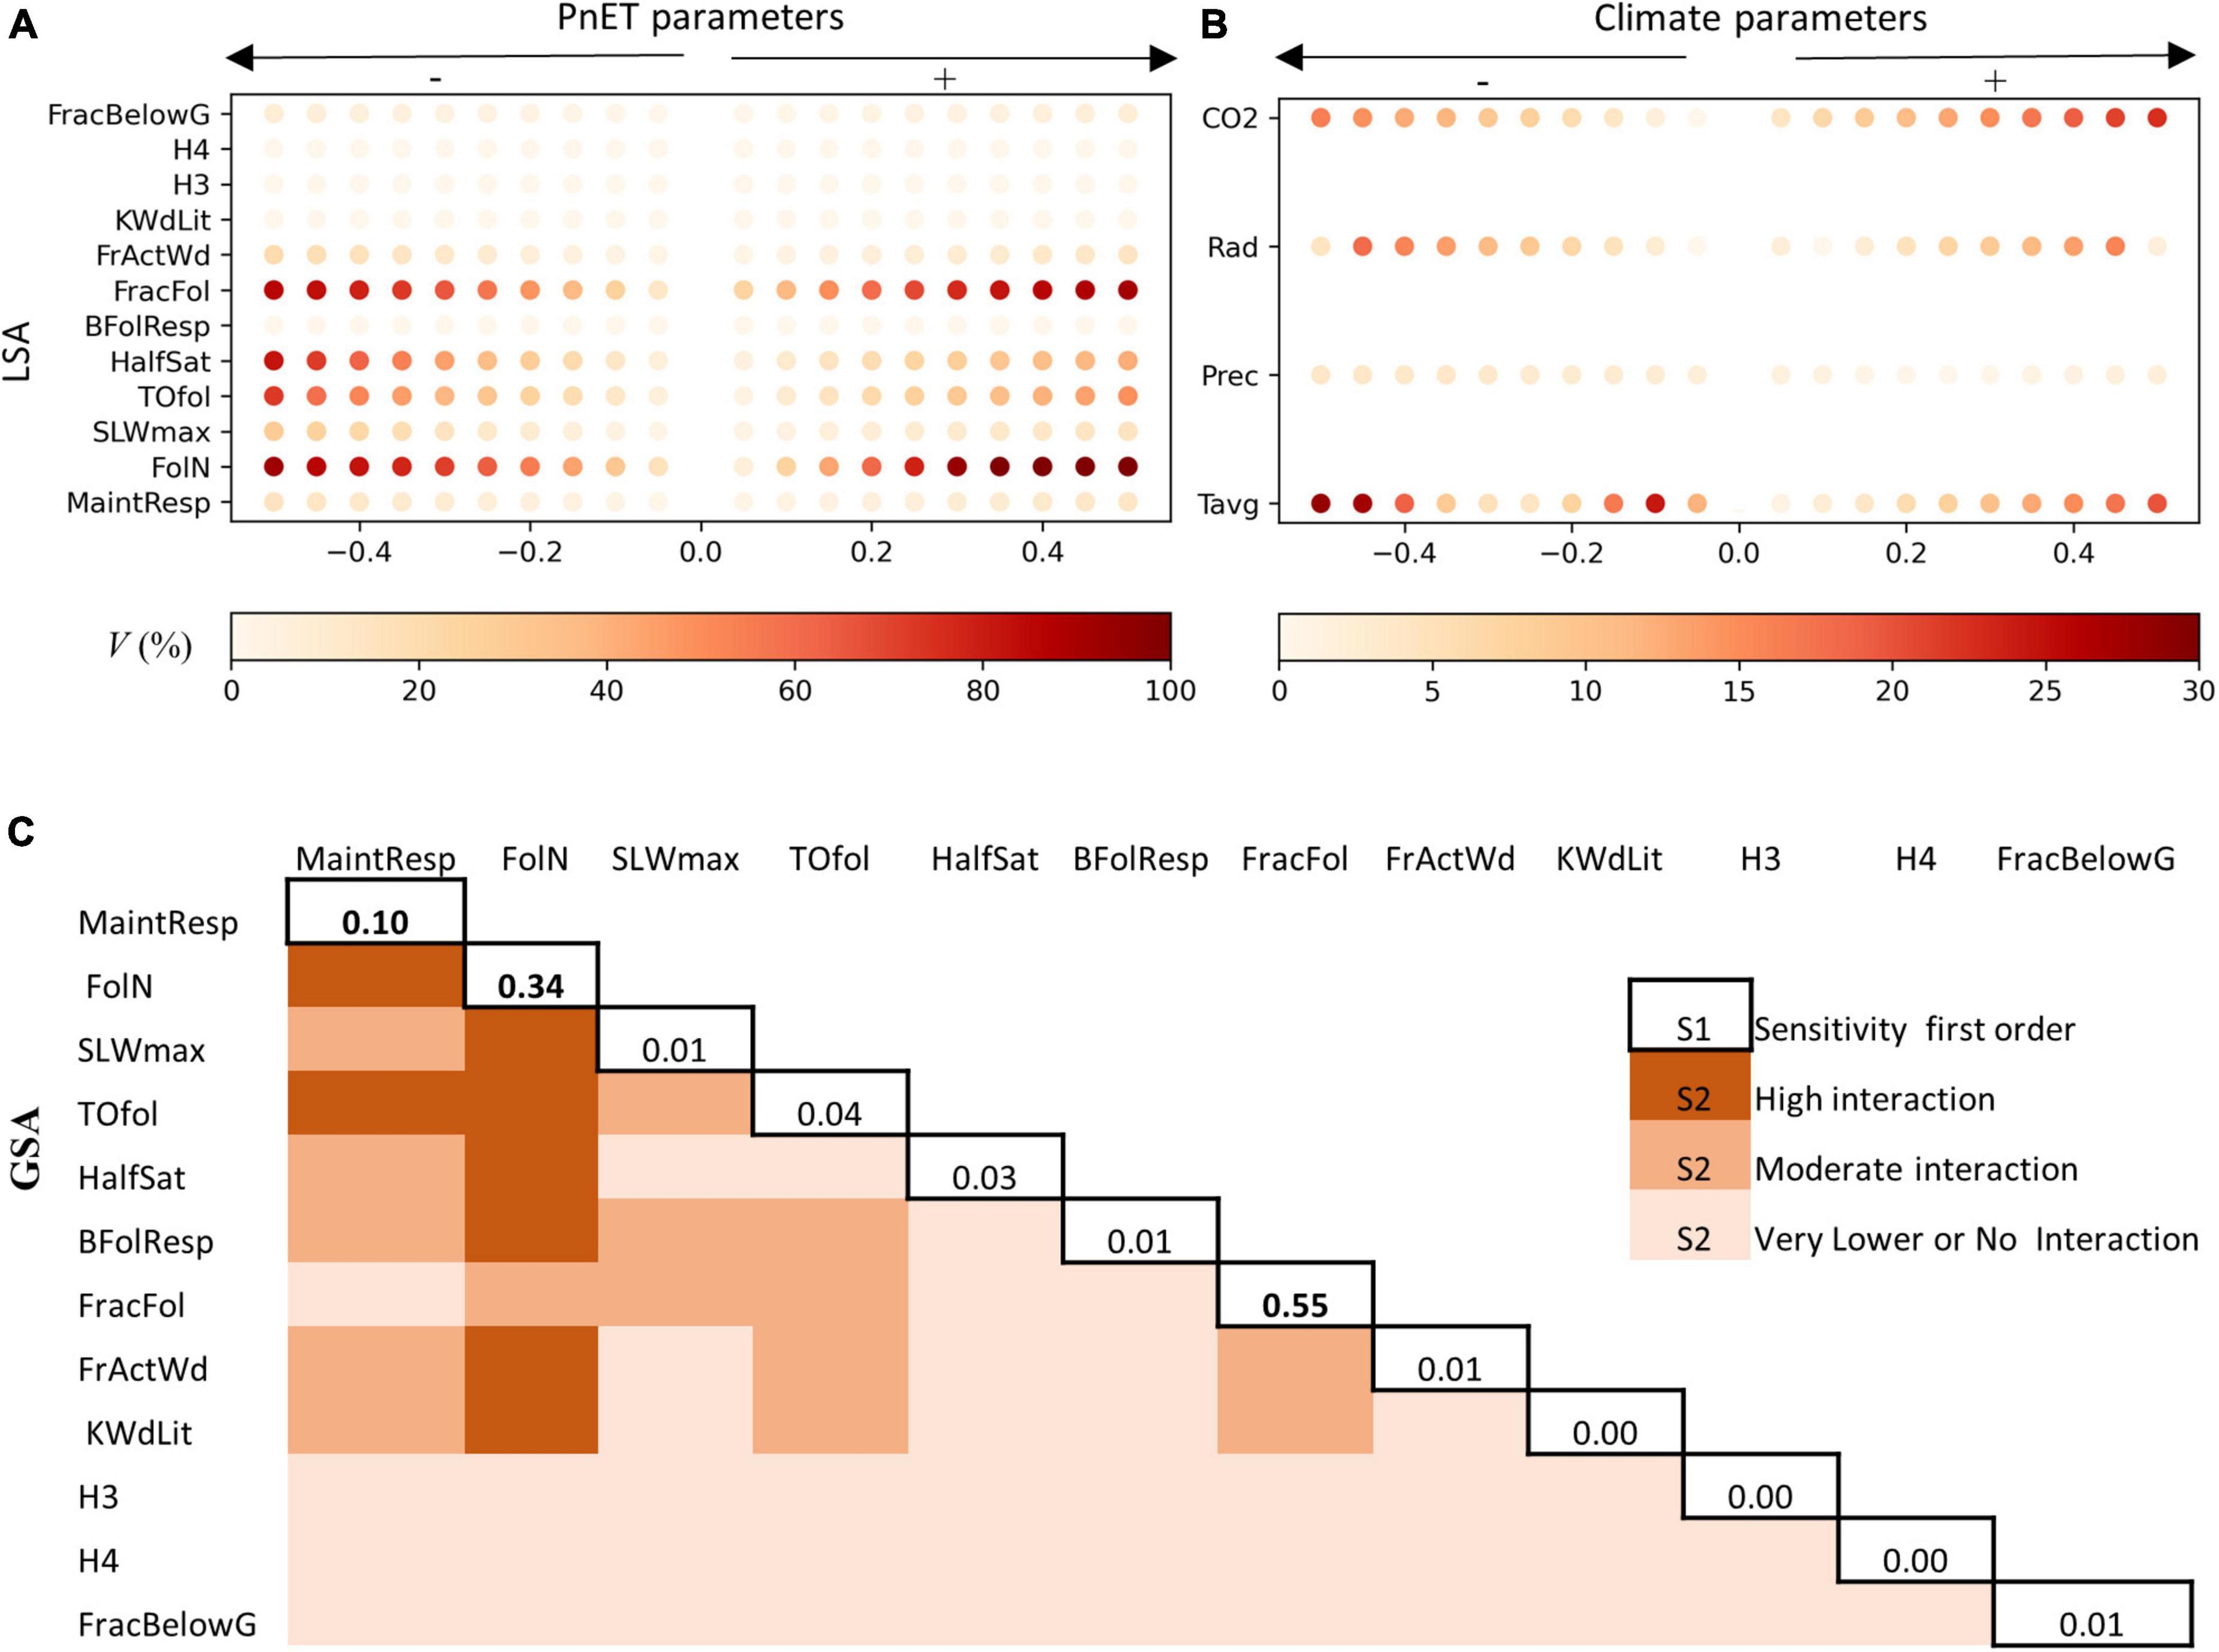
Figure 4. (A) Local sensitivity analysis (LSA) of the 12 PnET model parameters in 2050, where V is the variation percentage compared to the reference values, the signs –/+ reflect the decreasing/increasing in biomass variation. (B) LSA of CO2 concentration and climate parameters (P, precipitation; Tavg, average temperature of Tmin and Tmax; Rad, radiation), (C) global sensitivity analysis using Sobol algorithm, the diagonal values represent the sensitivity of first order, well the other values reflect the sensitivity of the second-order (S2) (interaction), (lower: S2 < 0.05) (moderate: 0.05 < S2 < 0.10) (high: S2 > 0.10).
3.2. Forest carbon
3.2.1. Species NPP
In order to isolate climate effects on species in the absence of regeneration, disturbance, and competition, our simulation from single-cell and single-cohort experiments showed that under all scenarios and MU, most species exhibited an increase in NPP under climate change by 2100. Then it decreased to baseline or below baseline conditions by 2200 in MU1. Indeed, boreal forest species NPP near the northern limit of Quebec managed forest benefited from climate change in the next 100 years mainly for intermediate scenarios (RCP2.6 and RCP4.5) (Figure 5 and Supplementary Figure 3). While, under RCP8.5, the NPP of coniferous was lower than that observed for the baseline climate in MU1, mainly for black spruce, white spruce and jack pine. On the other hand, coniferous forest NPP was higher than that of the baseline in MU3 under all climate scenarios during their next succession (longevity). Broadleaves forests on the other hand benefited from climate change in all scenarios, potentially doubling their NPP compared to the baseline. The length of the growing season might affect a species’ NPP and biomass carbon storage. In fact, the growing season increased under climate change for all species, except black spruce in MU1 after 2100 under RCP8.5 (Supplementary Figure 4).
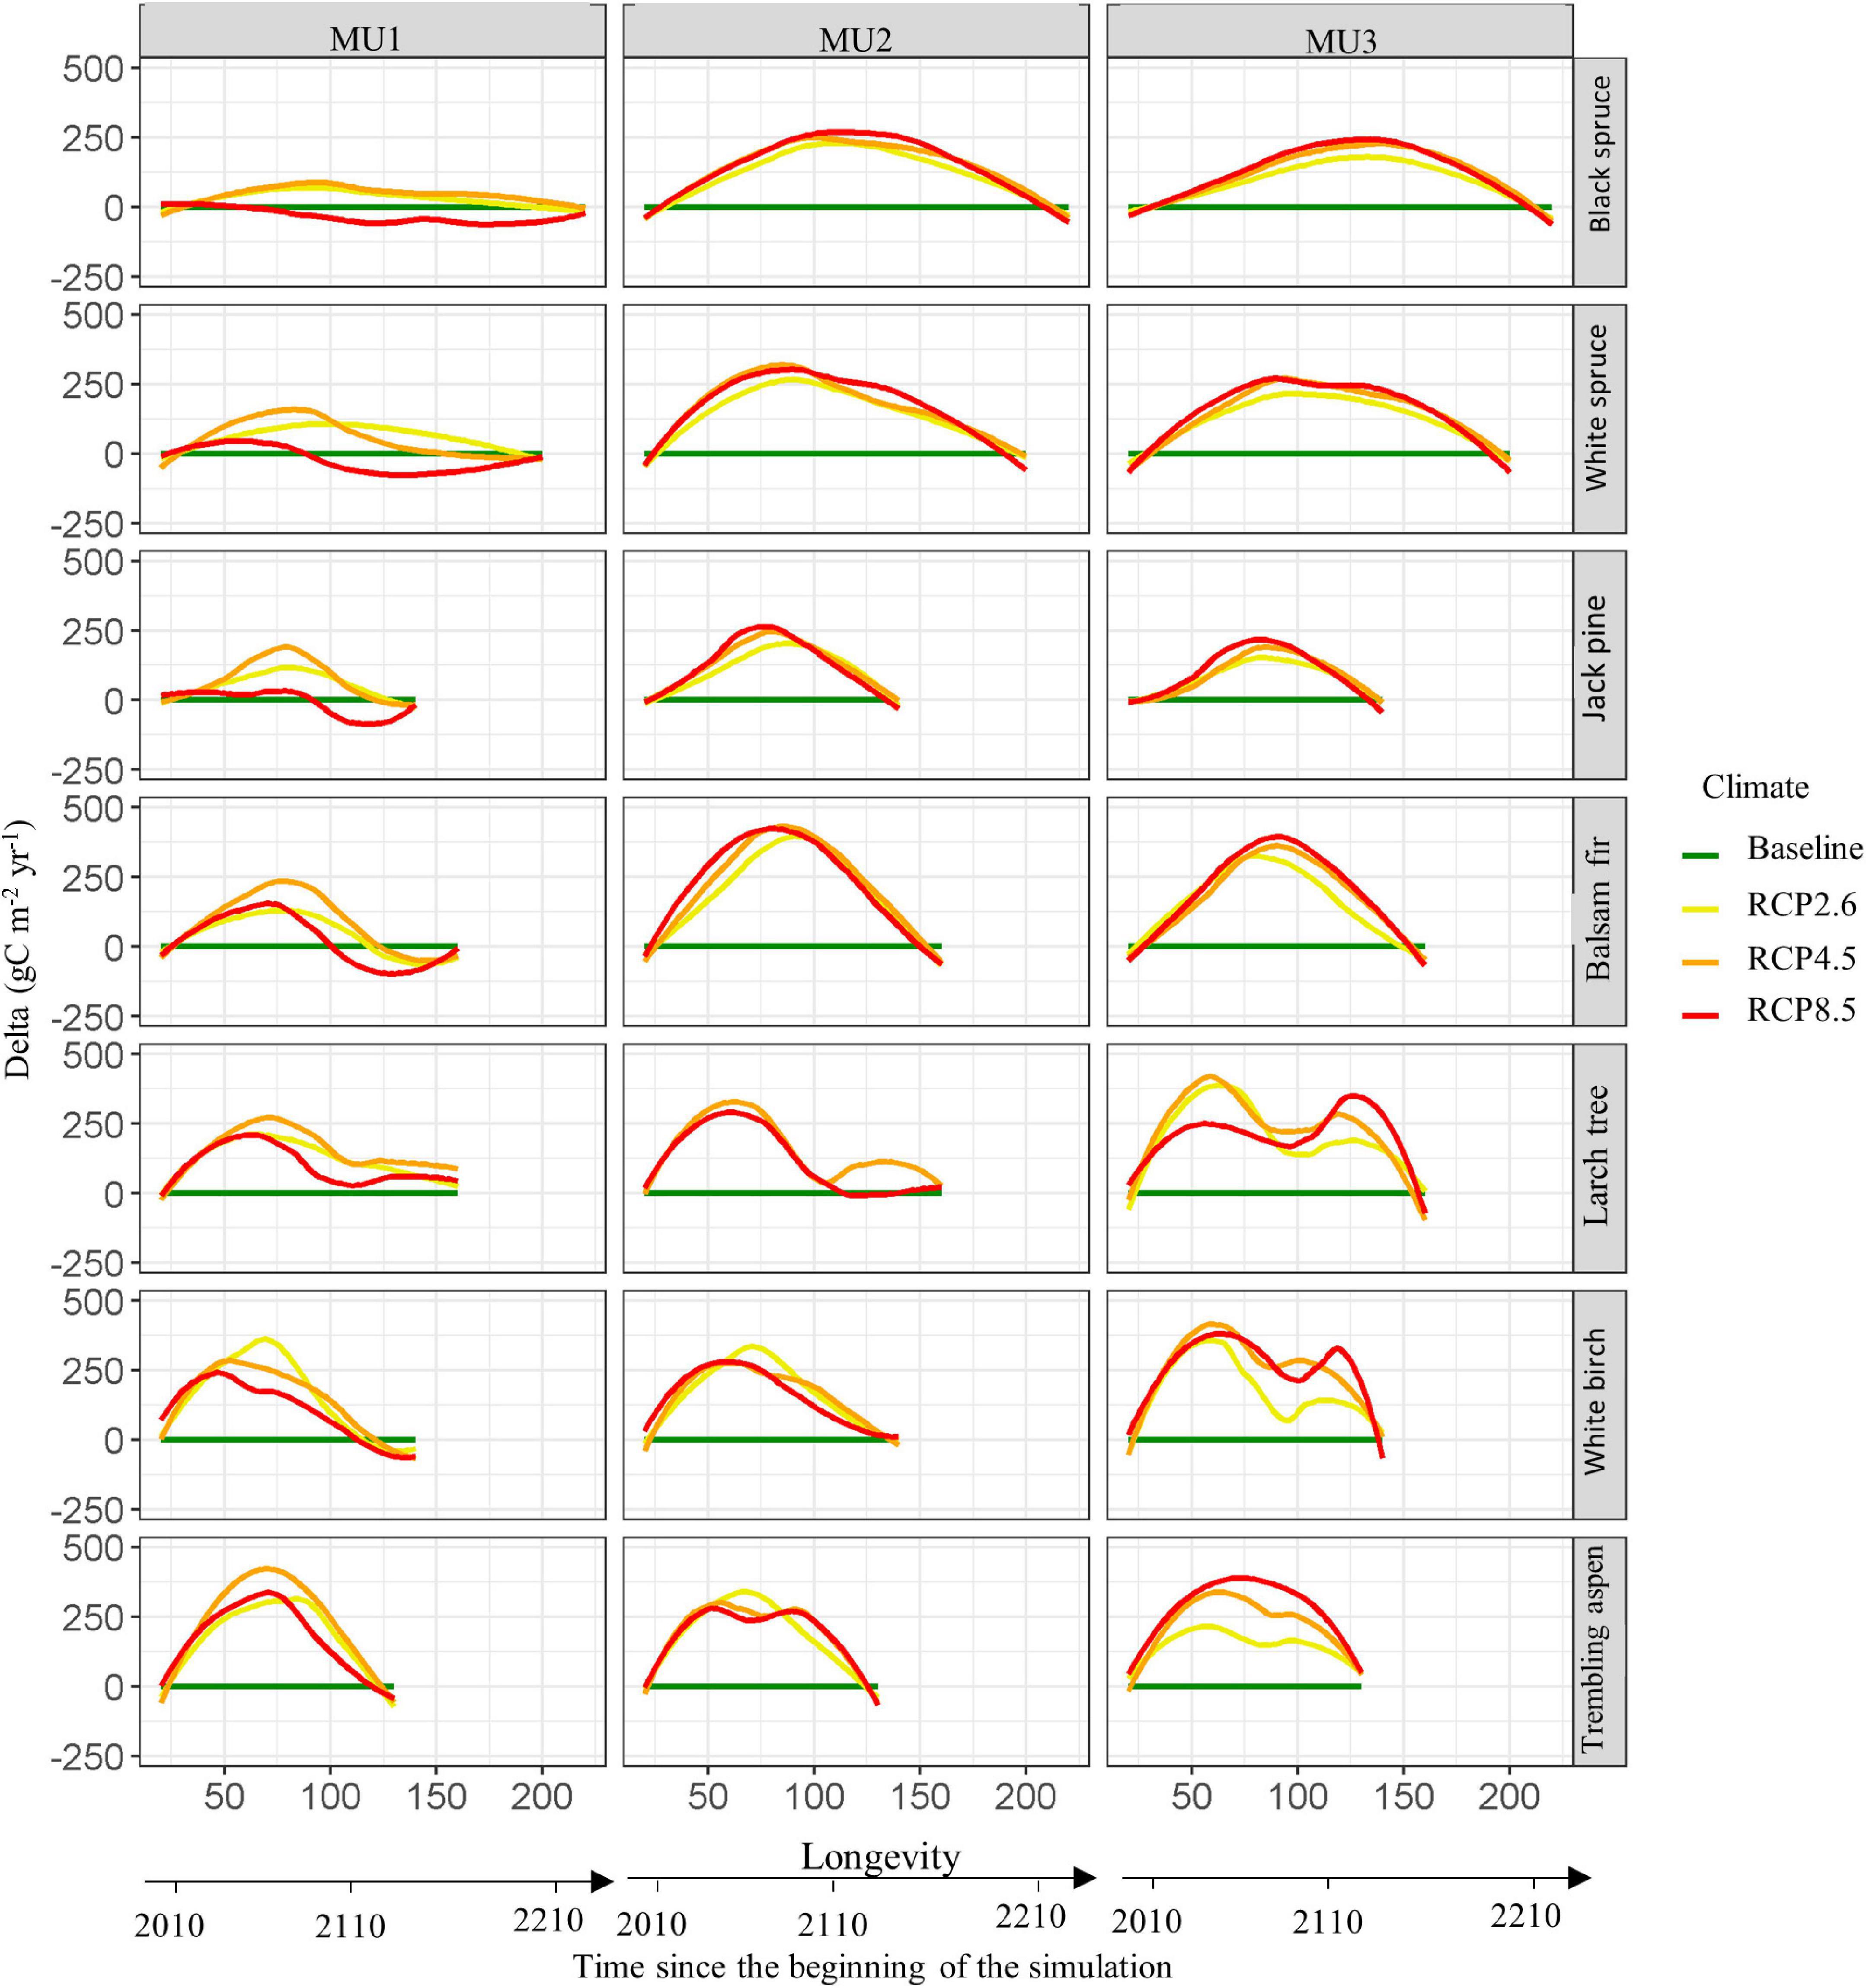
Figure 5. The difference in species’ annual NPP (delta) between climate change scenarios and current climate (baseline) during their longevity age in the three management units (see Supplementary Figure 3 for more details about the NPP per species and its confident interval). The simulations were started in 2010 with a single cohort (20 years old, monoculture) using the dominant soil texture per management unit (clay in MU1, and sandy-loam texture in MU2 and MU3). During the simulations the growing season was increased under climate change effect from 90–120 to 150–180 days (see Supplementary Figure 4).
3.2.2. Biomass carbon storage
Forest total living biomass (AGB and BGB) carbon storage responded to climate change and integrated disturbances (Figure 6). In the short-term (2010–2110), in all MU and for all RCP scenarios, the simulated carbon storage in biomass increased, by about twice compared to the baseline. Under wildfires scenarios, in MU1, the biomass carbon storage showed an increase from 37 tC ha–1 at the beginning of the modeling period to about 59 tC ha–1 for the baseline, 71 tC ha–1 for RCP2.6, and 83 tC ha–1 for RCP4.5. Similarly, in MU2, carbon storage in biomass showed an increase from 28 tC ha–1 to 39, 65, 73 for the baseline, RCP 2.6 and RCP4.5, respectively, but in the long-term, it declined to 44 tC ha–1 in MU1 and 59 tC ha–1 in MU2 under RCP8.5. On the other hand, high stocks were observed for RCP8.5 and RCP4.5 during the study period in MU3 for all periods with or without wildfires, in fact, the biomass carbon storage increased from 32 to around 90 tC ha–1 for both climate scenarios, and to 61 tC ha–1 for RCP2.6. In the MT, the stocks stabilized under all scenarios with high values observed for RCP4.5 in MU1 and MU2, and for RCP8.5 in MU3. In the long-term, the RCP scenarios continued to be more productive than the baseline in MU2 and MU3, while for MU1 the baseline was more productive than RCP8.5.
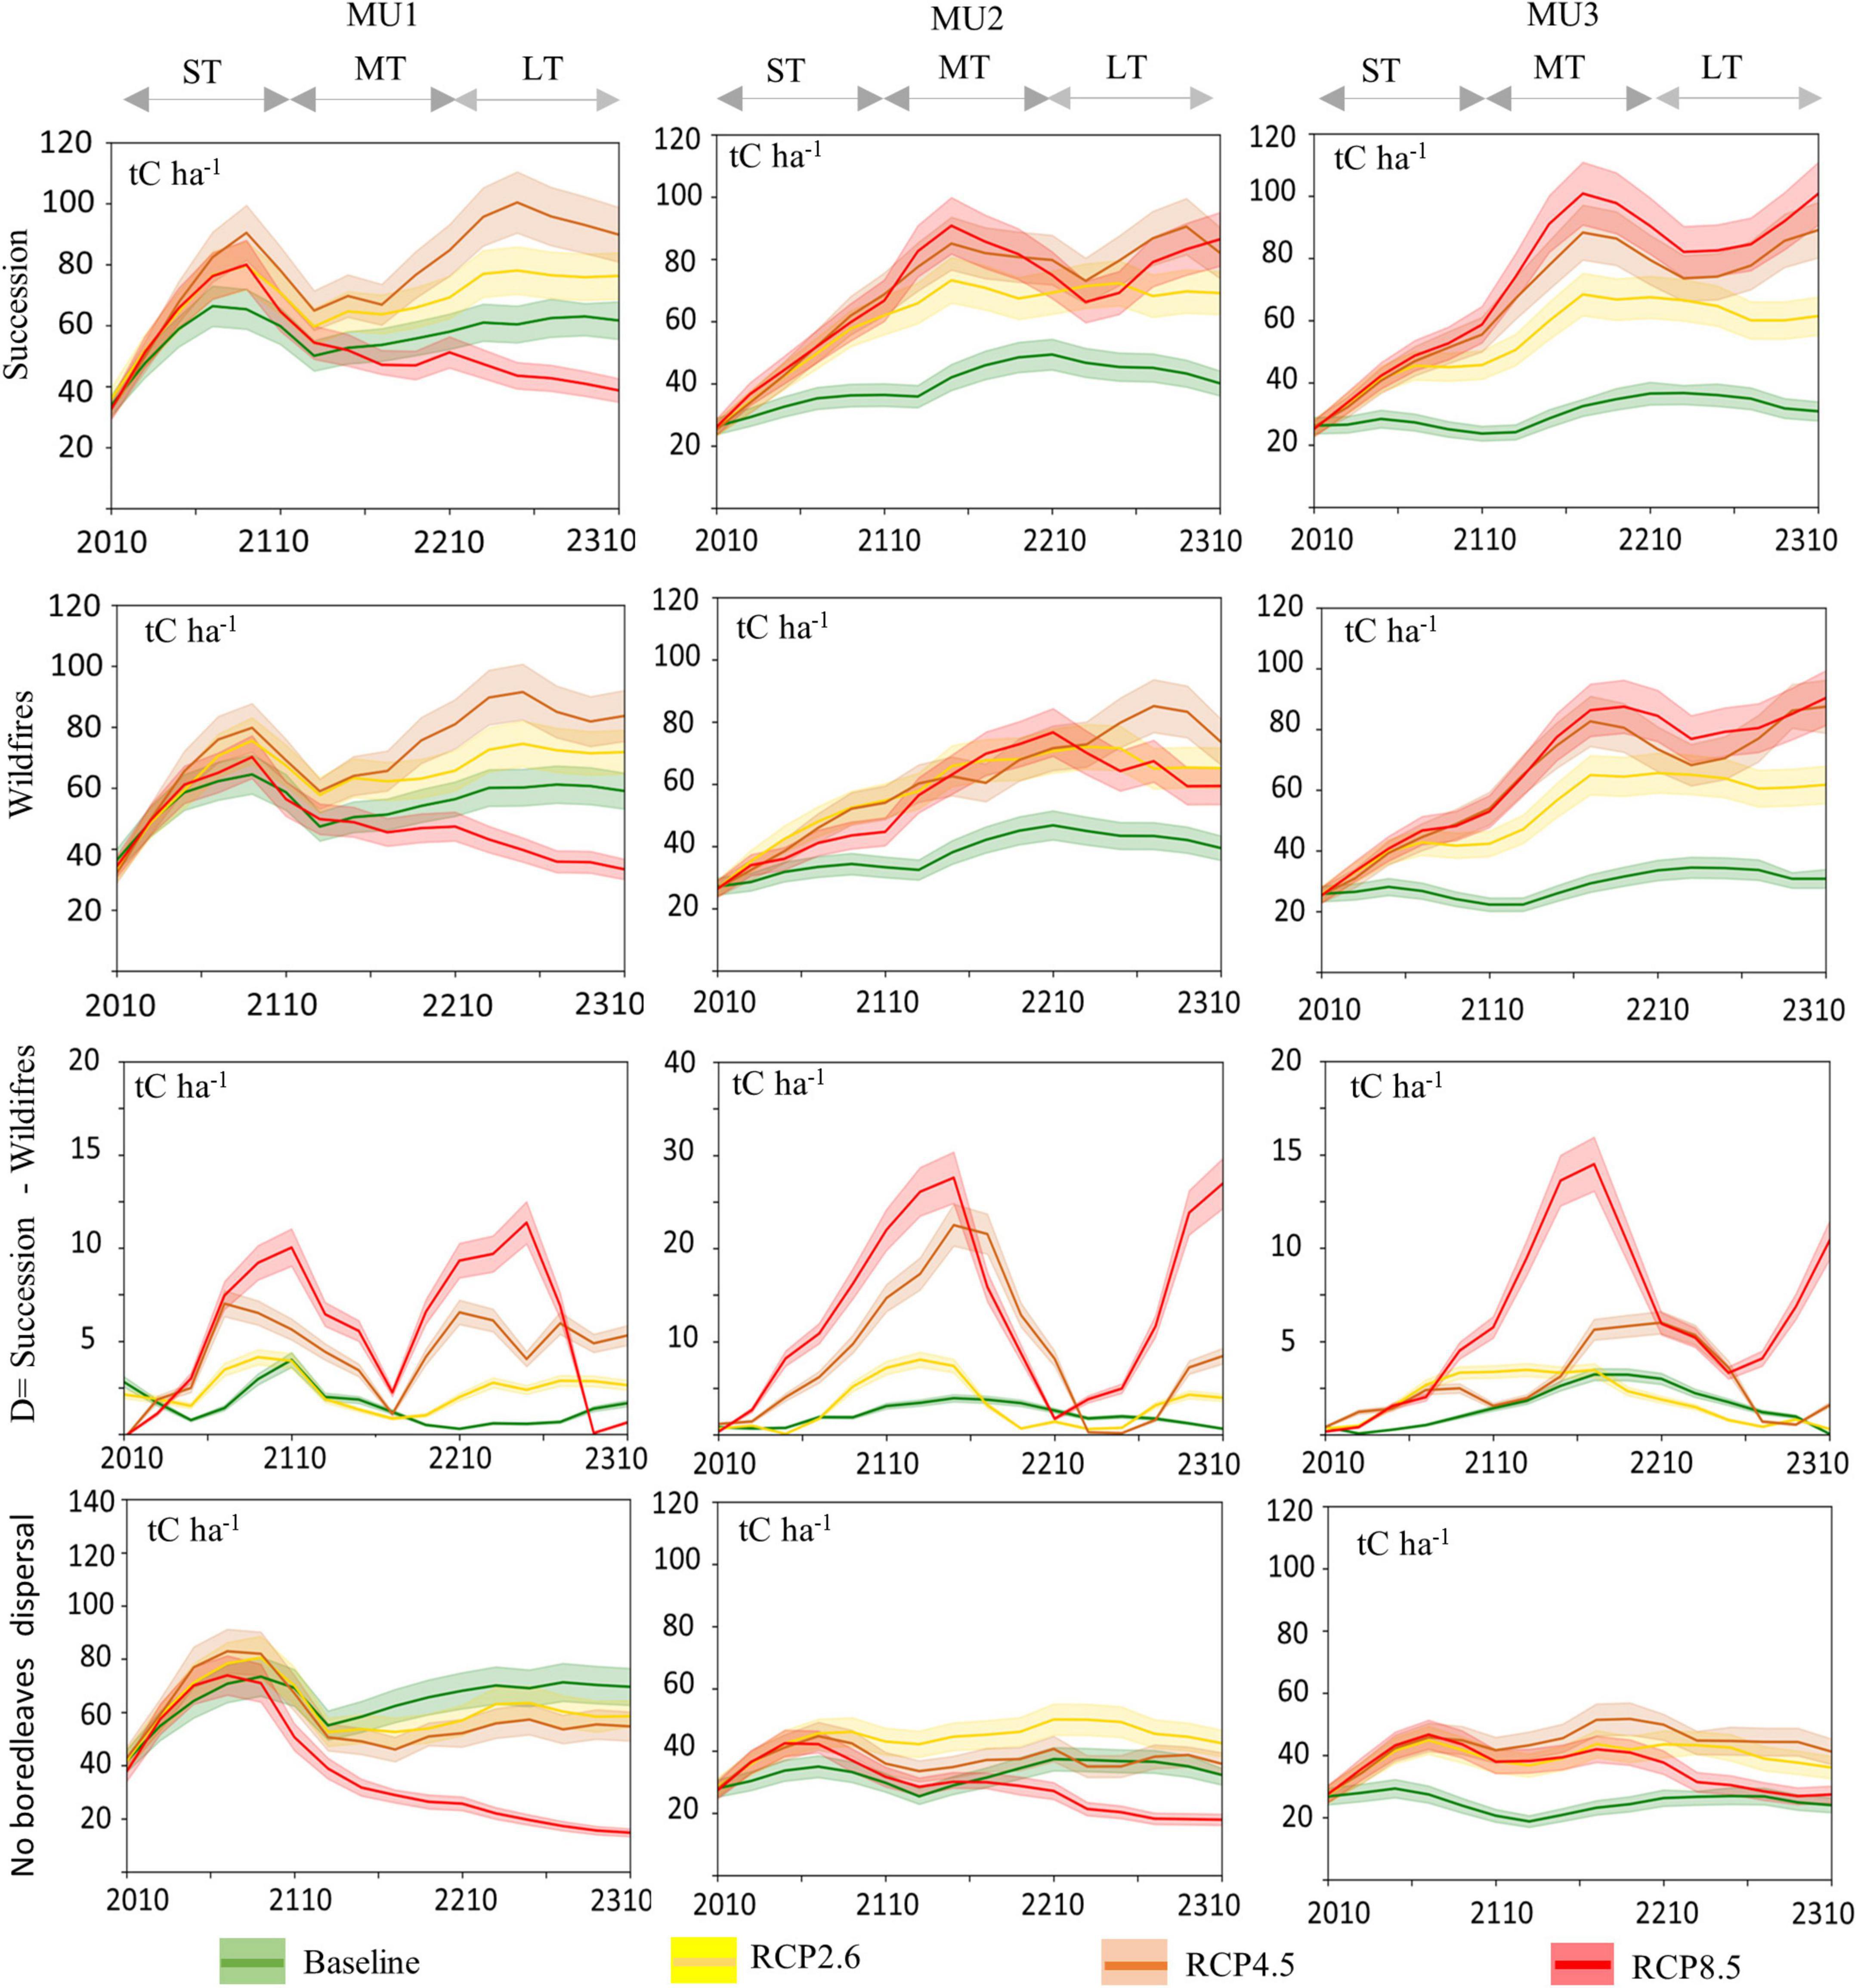
Figure 6. Mean simulated annual total biomass (stem, roots) (tC ha– 1) projection for 300 years (2010–2310) under RCP and current climate (baseline) scenarios for three periods [(ST: 2010–2110); (MT: 2110–2210); (LT: 2210–2310)], with and without wildfires disturbance (see Figure 7 for more details per species). Difference (D) in carbon (C) loss due to wildfires integrated across the studied MU over time, relative to the no-disturbance scenario (only succession). The confident intervals were estimated from the three repetitions per time step to assess the stochastic effect of the model on the outputs.
The growth of the five studied coniferous species will decline in future climates, mainly in the medium- and long-term in the western parts of the Québec boreal forest (Figure 7). Under global warming, white birch and trembling aspen offset the coniferous species’ biomass decline (Figure 7). The total biomass of coniferous species decreased mainly in the long-term, while that of broadleaves increased. Carbon losses related to fire had increased under climate change and increased dramatically if there is no broadleaves dispersal (Supplementary Figure 5). On the other hand, climate change enhanced biomass carbon storage for all MUs under different RCP scenarios, except in MU1 under RCP8.5 (Figures 6, 7). Furthermore, after 100 years of simulation and under no dispersal of broadleaves, total biomass under RCP 8.5 dropped to 20 and 15 tC ha–1 in MU1 and MU2 respectively (more than 30%) relative to the current climate. For RCP8.5 in MU2, this reduction was related to wildfires, which reduced the stocks by around −60%, while in MU1 both climate change and wildfires contributed to this reduction by −27 and −29%, respectively (Supplementary Figure 5).
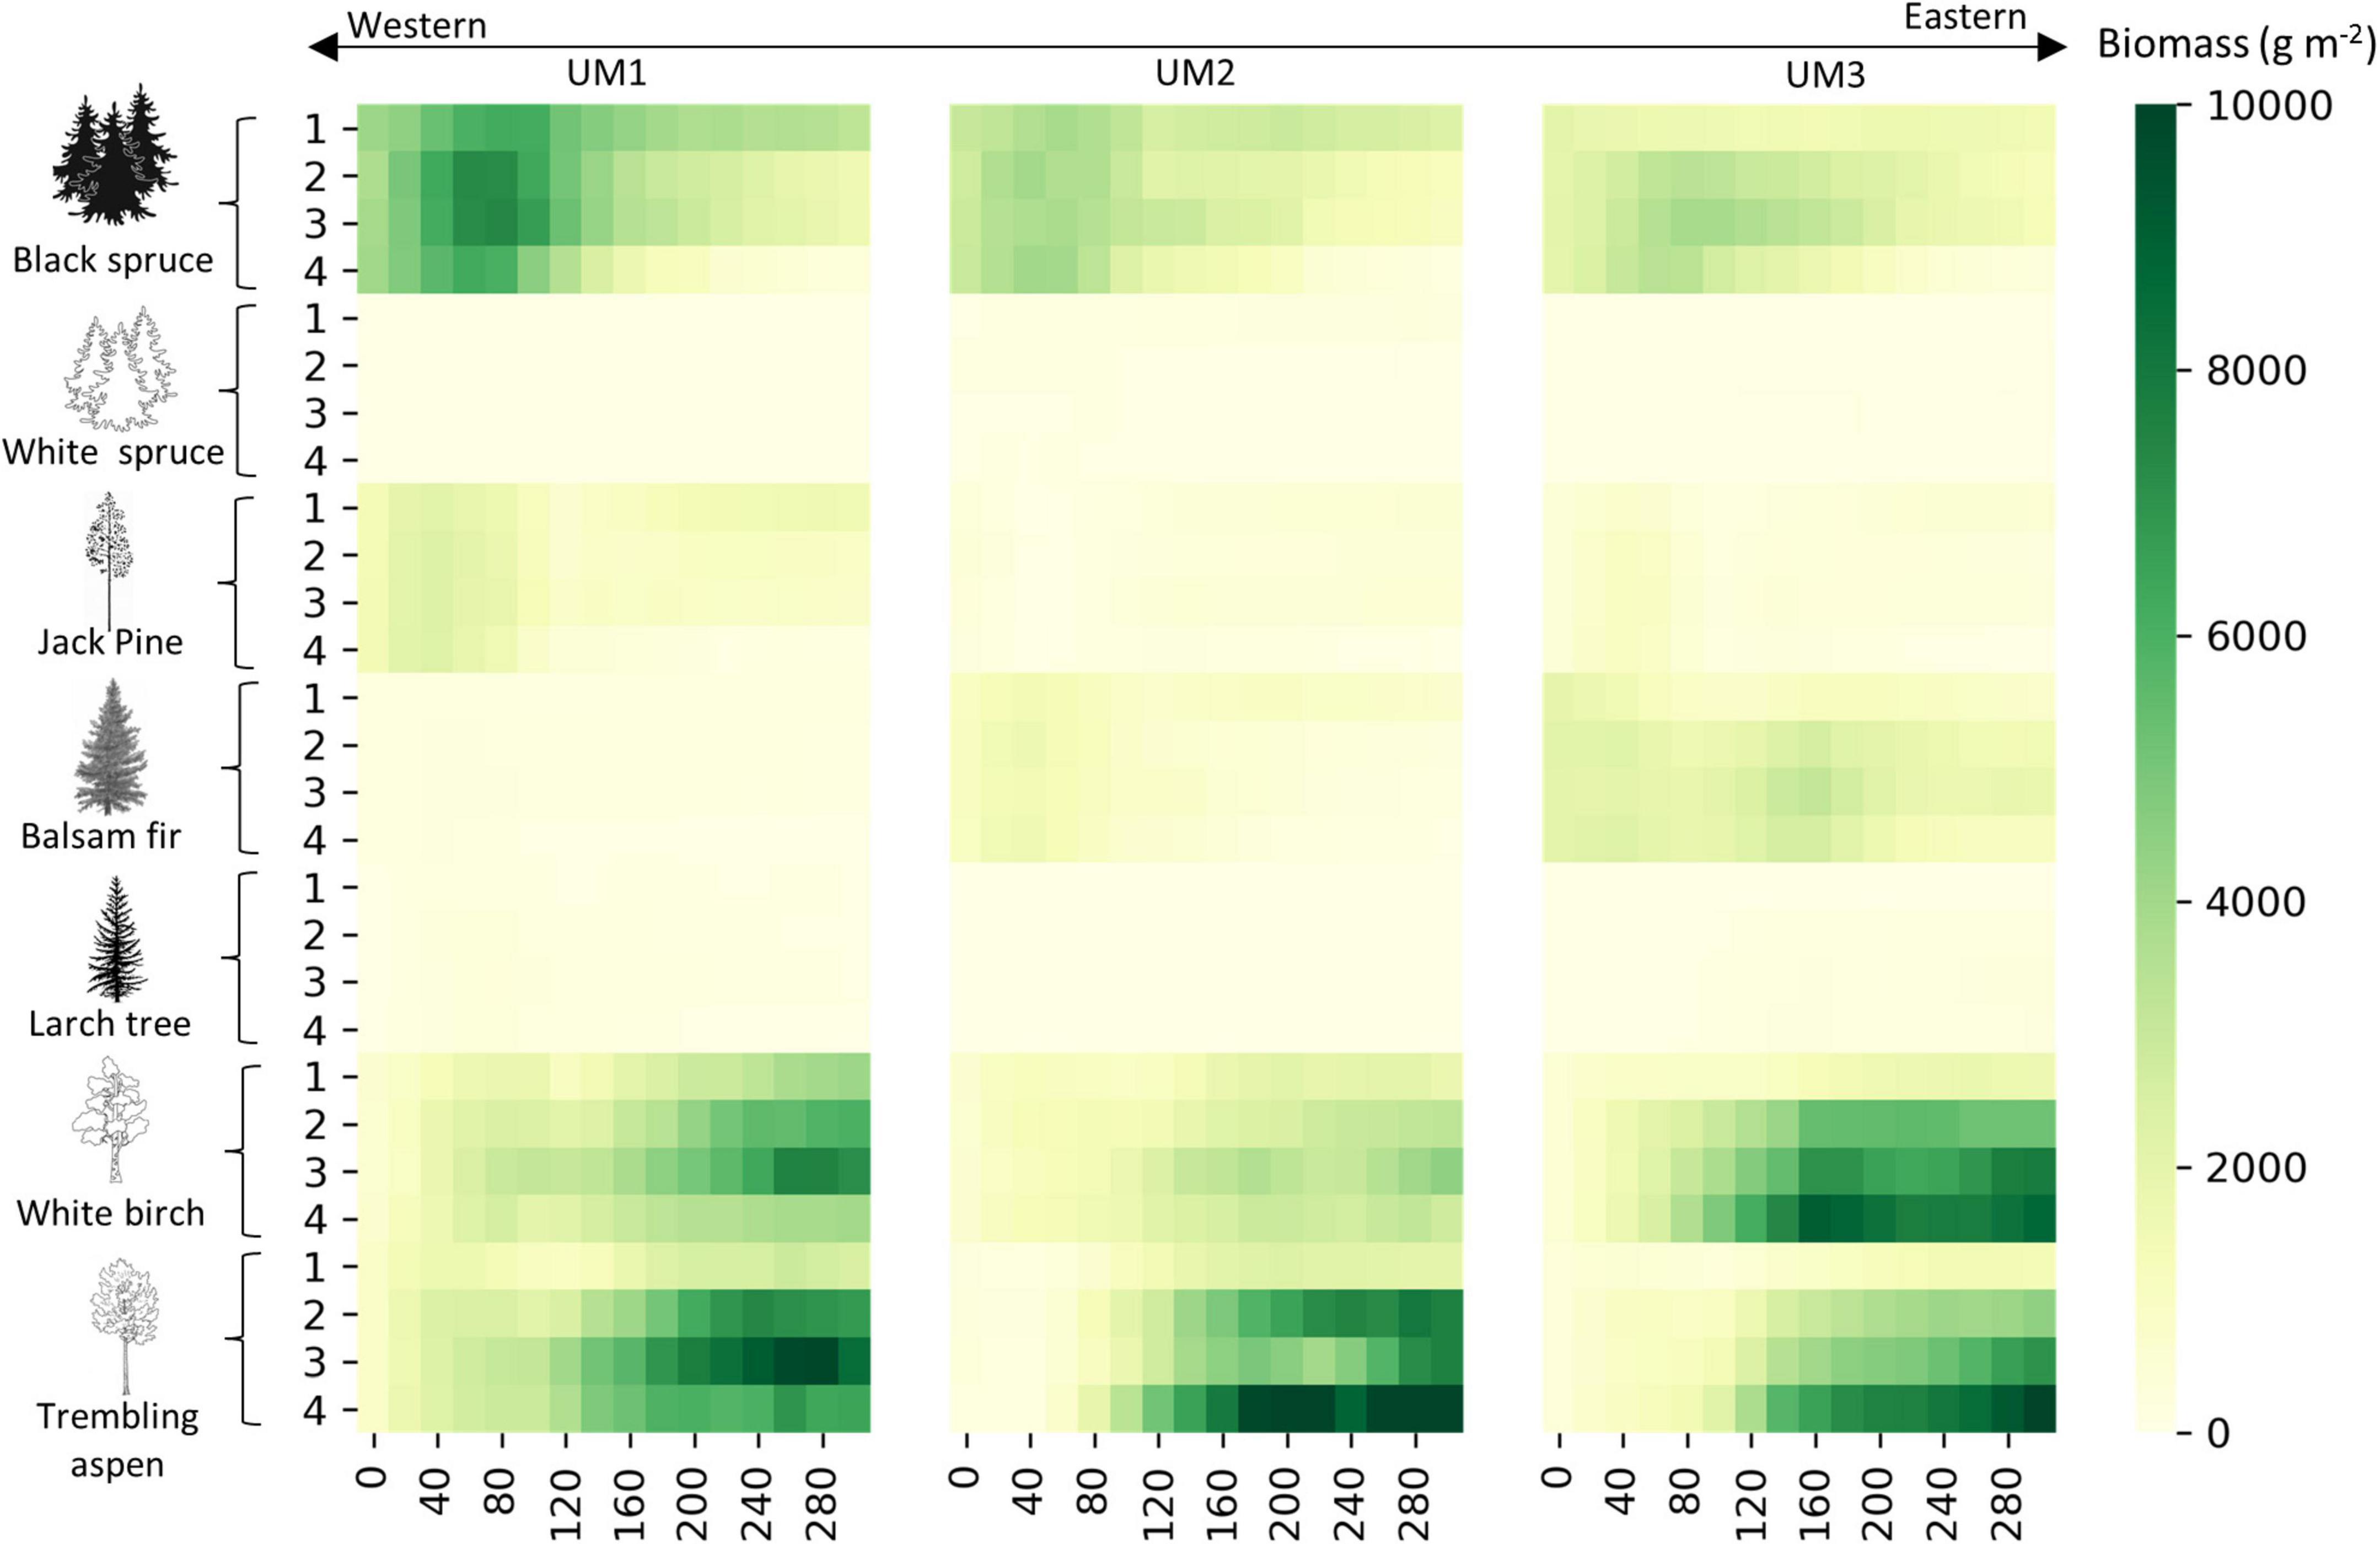
Figure 7. Mean simulated annual biomass (wood + roots) (tC ha– 1) per species projection for 300 years (2010–2310) under four climate scenarios (1, baseline; 2, RCP2.6; 3, RCP4.5; 4, RCP8.5).
On the other hand, compared to the baseline the carbon losses from the biomass pool under wildfires (D) were lower for all climate scenarios in MU3 and MU1 compared to MU2 (Figure 6). However, the increase in the burned area increased carbon losses from biomass pool under RCP scenarios compared to the baseline, with high fluctuation under RCP4.5 and RCP8.5, thus related the fluctuation in total area burnt (Supplementary Figure 6). The losses could reach 12, 30, and 15 tC ha–1 year–1 in MU1, MU2, and MU3, respectively. In scenarios where there was broadleaves dispersal restriction, the forest biomass carbon storage dropped to less than 20 tC ha–1 under RCP8.5 in MU1 and MU2 in the MT and LT. Biomass carbon storage has remained higher than that of the baseline in MU3 for all RCP scenarios. Consequently, MU3 was less vulnerable to climate change than MU1 and MU2 even without broadleaves dispersal or regeneration since coniferous species’ NPP increased (Figure 5), with more abundance of black spruce and balsam fir.
3.3. Forest composition dynamics
Generally, in all MUs, there is a decrease in the proportion of pure coniferous species occupancy at the landscape scale and an increase in the mixed deciduous forest (Figure 8). In the ST, under different climate change scenarios, BsPF accounted for the largest proportion of the area in all MU. In the MT and LT, mainly in MU1 and MU2, the area of BsBMF, BMF, and BPF increased, mainly for RCP2.6 and RCP4.5, while the area of BsPF and OcMF decreased. Under RCP8.5 BMF and BPF dominated the landscape in MU2 and MU1. In MU3 the coniferous occupancy was less sensitive to climate change scenarios, the BsAB, OCMF, and BsBMF will continue to dominate the landscape, with 70, 63, 44%, for RCP2.6, RCP4.5, and RCP8.5, respectively. On the other hand, mixed forest of BsBMF remained the dominating composition in MU1 with 46, 48, 42, and 32% for the baseline, RCP2.6, RCP4.5, and RCP8.5, respectively. In all MU, our results showed that OCMF (other species except black spruce) is the most stable and resilient composition under all scenarios. Also, it was very likely that the Côte-Nord region (MU3) will be a refuge site for coniferous species.
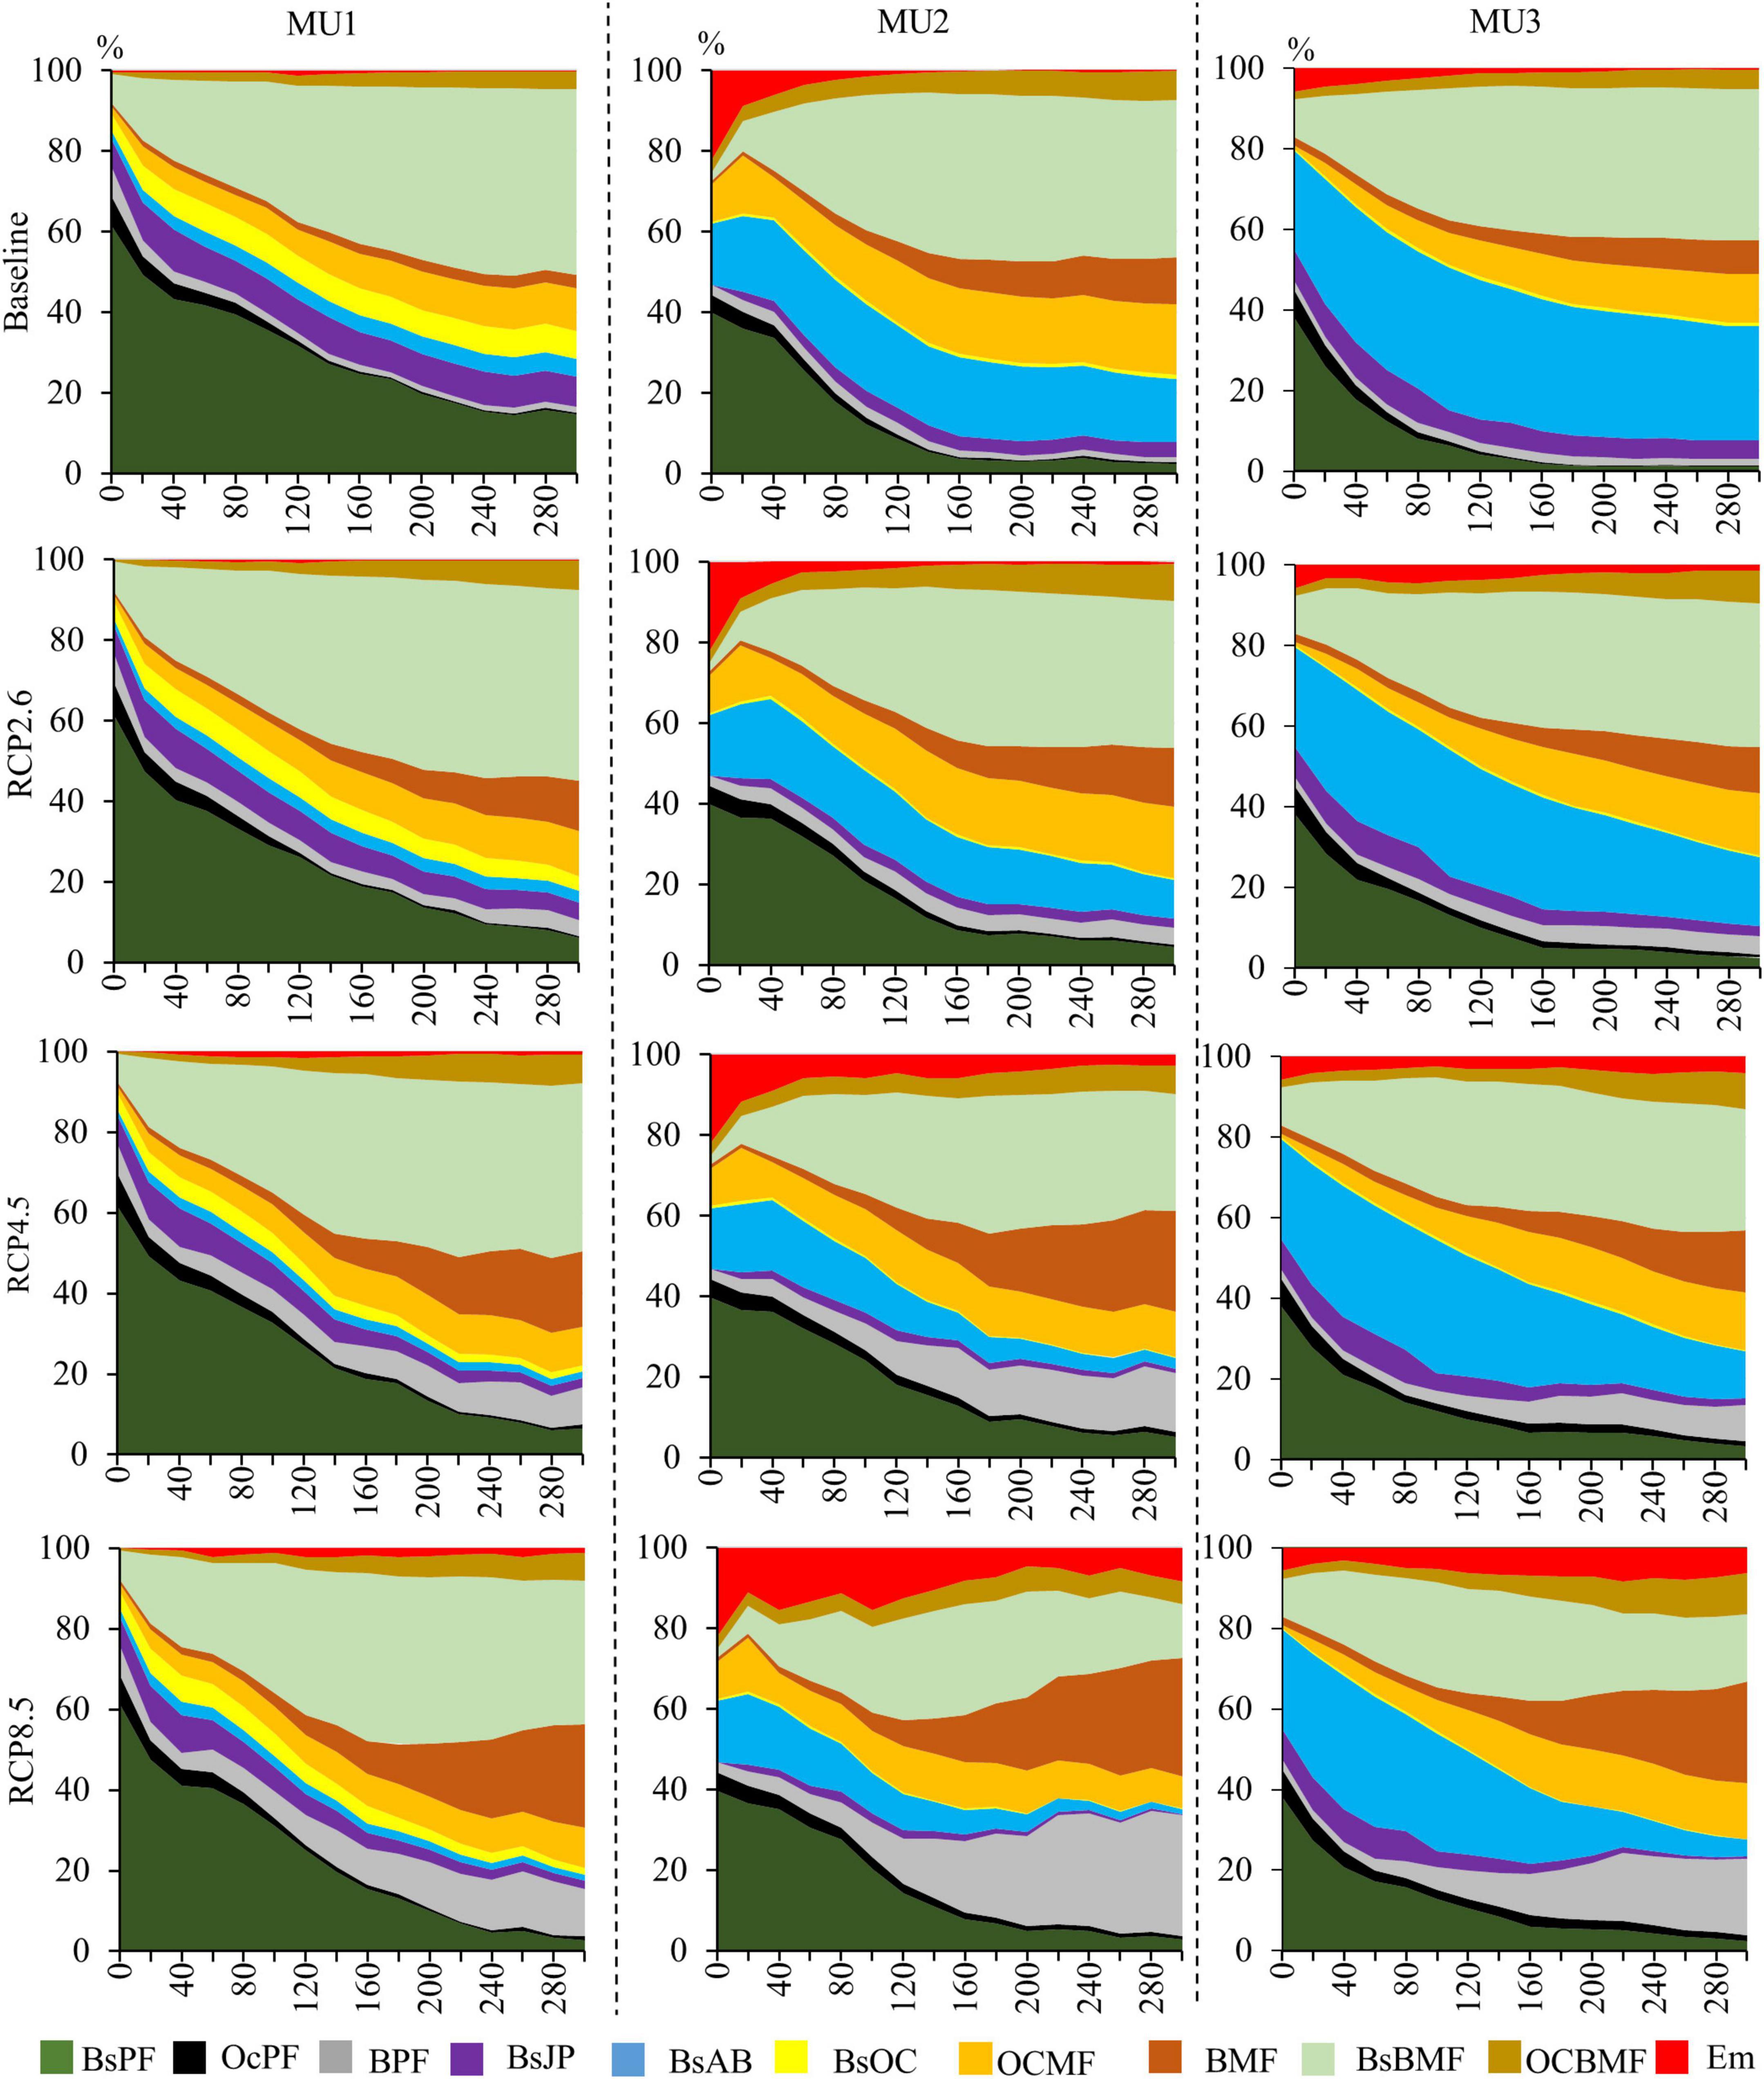
Figure 8. The occupancy area (%) of forest type in the three MU under climate change and wildfires scenarios between 2010 (year 0) and 2310 (year 300) (BsPF, black spruce pure forests; OcPF, other coniferous pure forests; BPF, broadleaves pure forests; BsJP, black spruce and jack pine; BsAB, black spruce and balsam fir; BsOC, black spruce and other coniferous; OCMF, other coniferous mixed forests; BMF, broadleaves mixed forests; BsBMF, black spruce and broadleaves mixed forests; OCBMF, other coniferous and broadleaves mixed forests; Em, empty land which represents open forest woodland).
3.4. Broadleaves dispersal limitation effect
The dispersal constraint considerably affected the forest composition (Figure 9). Under broadleaves dispersal limitation scenario, in MU1 and MU2, BsPF, CPF, BsJP, and OCMF dominated the landscape during the study period (300 years), with lower productivity for RCP8.5 (Figure 6). In the medium- and long-terms, in both MU (1 and 2) the Em which represents the open forest woodlands was increasing for both RCP4.5 and RCP8.5 scenarios, with more than 10 and 20% in MU1 and MU2, respectively. On the other hand, in MU3 the Em was around 10% for RCP4.5 and RCP8.5, a little higher than that of the current climate. However, in MU3, BsAB and OCMF were the dominant compositions for all scenarios, with more than 50% of the total area for RCP4.5 and RCP8.5. In this unit, the coniferous species (mainly black spruce and balsam fir) did not appear to be under climate stress and remained more productive than the baseline (Supplementary Figure 3).
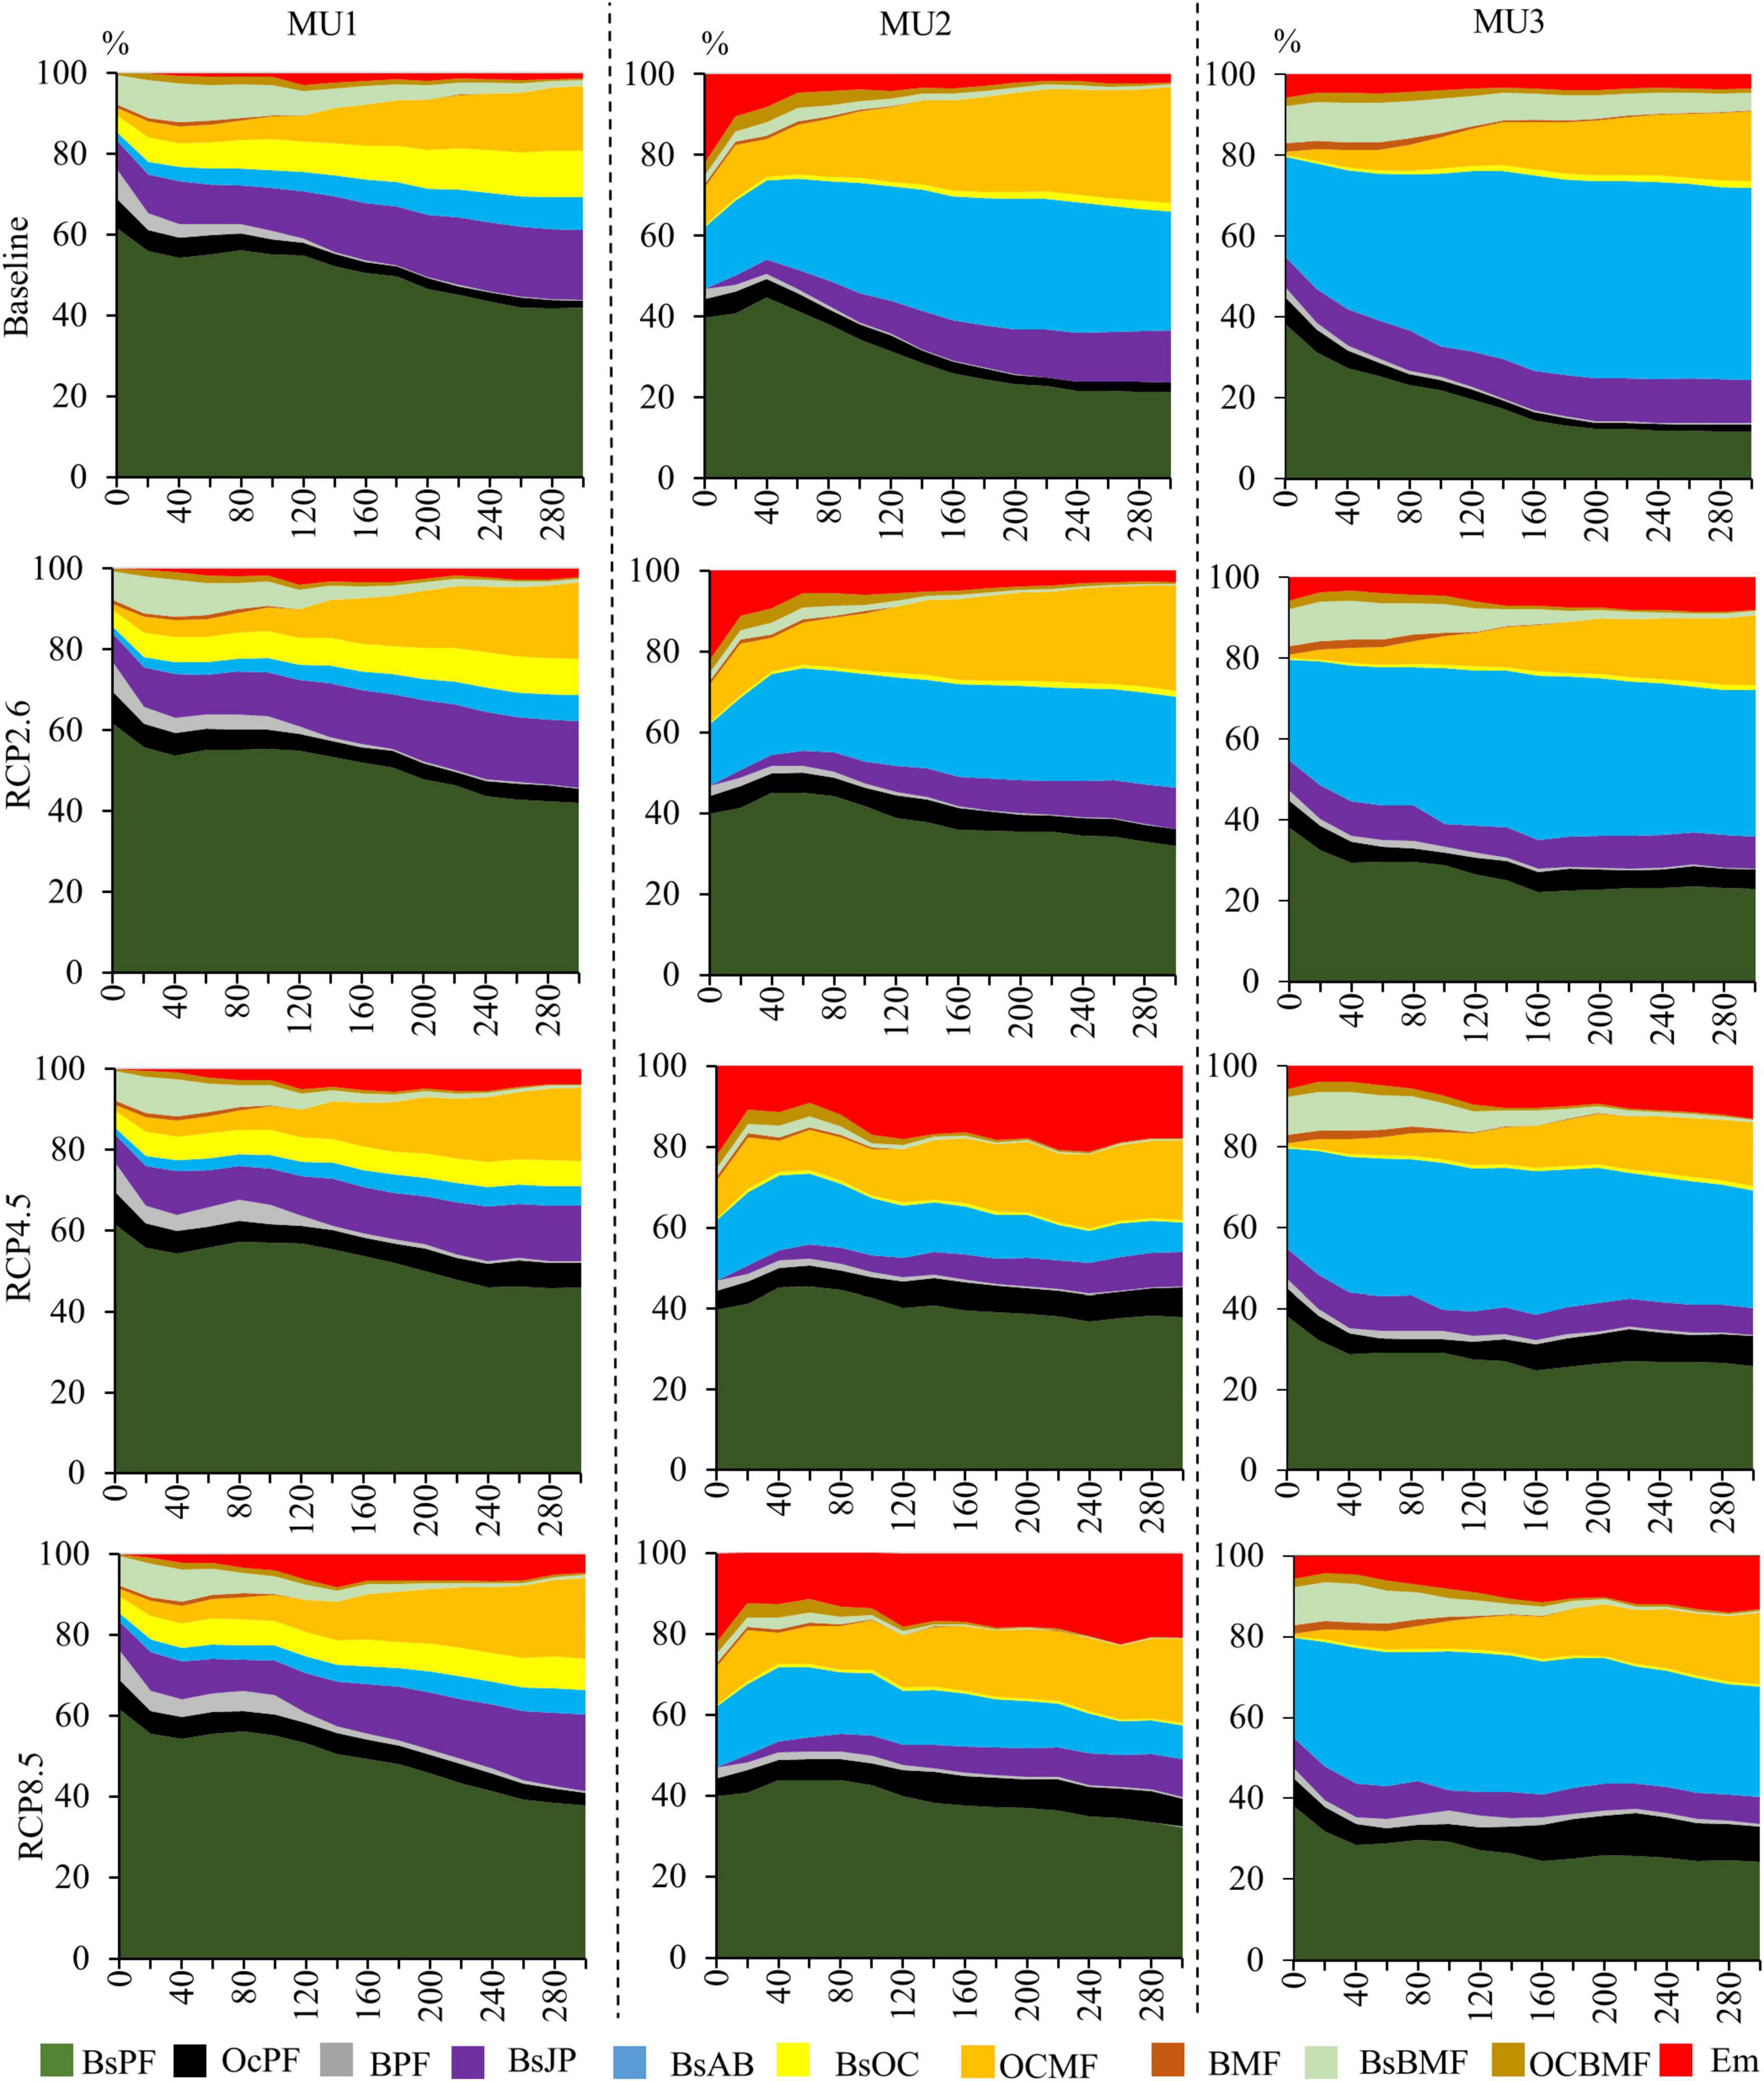
Figure 9. The occupancy area of each forest type (%) in the three MU under the four climate scenarios, where we assumed that broadleaves will not disperse across all the landscape because of soil limitation (BsPF, black spruce pure forests; OcPF, other coniferous pure forests; BPF, broadleaves pure forests; BsJP, black spruce and jack pine; BsAB, black spruce and balsam fir; BsOC, black spruce and other coniferous; OCMF, other coniferous mixed forests; BMF, broadleaves mixed forests; BsBMF, black spruce and broadleaves mixed forests; OCBMF, other coniferous and broadleaves mixed forests; Em, empty land which presents open forest woodland).
3.5. Mortality
The total number of cohorts killed by wildfires during the study period was lower than that of competitive exclusion but increased under climate change scenarios for both MU1 and MU2 (Figure 10). Indeed, in MU2 under RCP4.5 and RCP8.5 pathways, this total could reach a similar value of mortality as that from the competition (Figure 10). According to the ANOVA test, forest mortality within the different forest types was significantly affected by its cause (fire and competition), climate change, period (succession), and the interaction between climate and cause. The presence of a very significant interaction (p < 0.001) between climate change and cause indicates that the mortality caused by competition and wildfires were depending on climate change. The variation explained by this interaction was higher for coniferous than broadleaves mainly in MU1 and MU2 (Table 4). In MU1, the period factor explained 41% of the variation within the total cohort killed for broadleaves, while the mortality cause factor explained 44% for coniferous. In MU2, period factor explained 32 and 19% of mortality variation for broadleaves and coniferous, respectively. In MU3, this variation was explained mainly by mortality cause, 28 and 73% for broadleaves and coniferous, respectively. Also, we highlight that the variation part explained by the interaction climate × cause and climate × period for coniferous was higher than that of broadleaves. In conclusion, the ANOVA test showed that broadleaves mortality was related to period factor (succession), while the mortality of conifers was related to the cause factor (competition or wildfires), with high interaction with climate change.
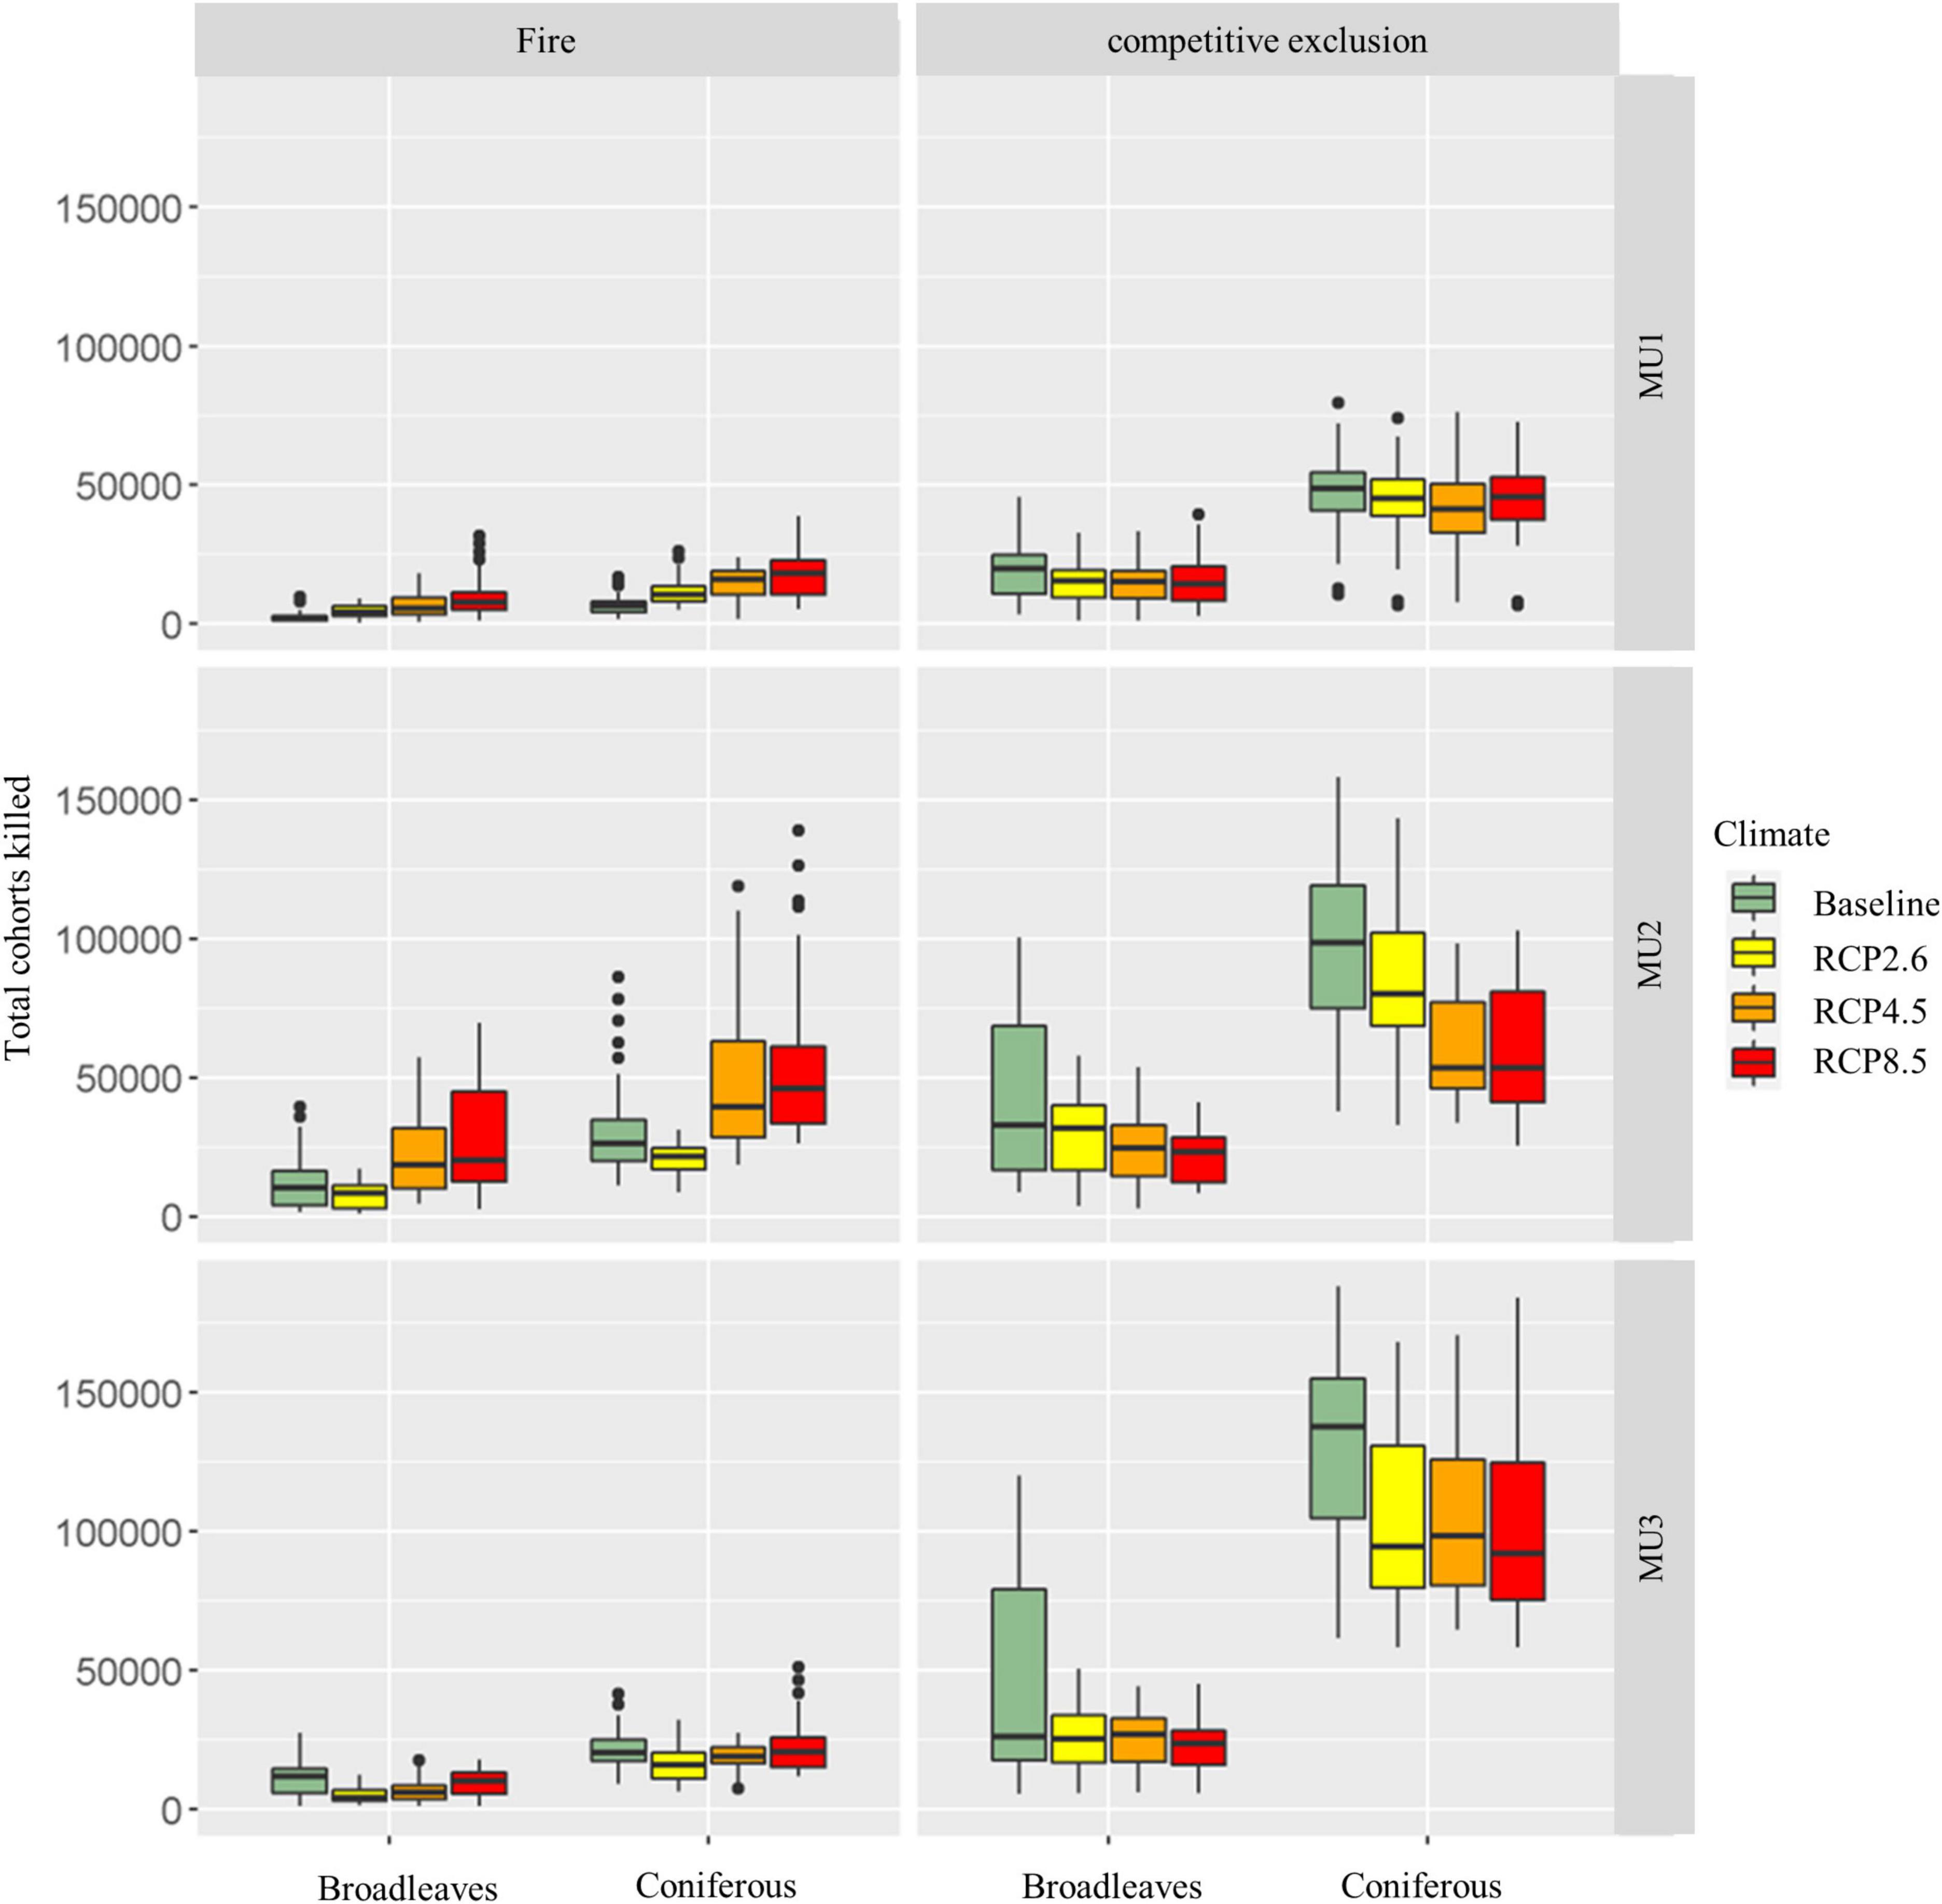
Figure 10. Fires and competitive exclusion mortality boxplots and averages for the entire study period (2010–2310) under climate change scenarios in the three management units.
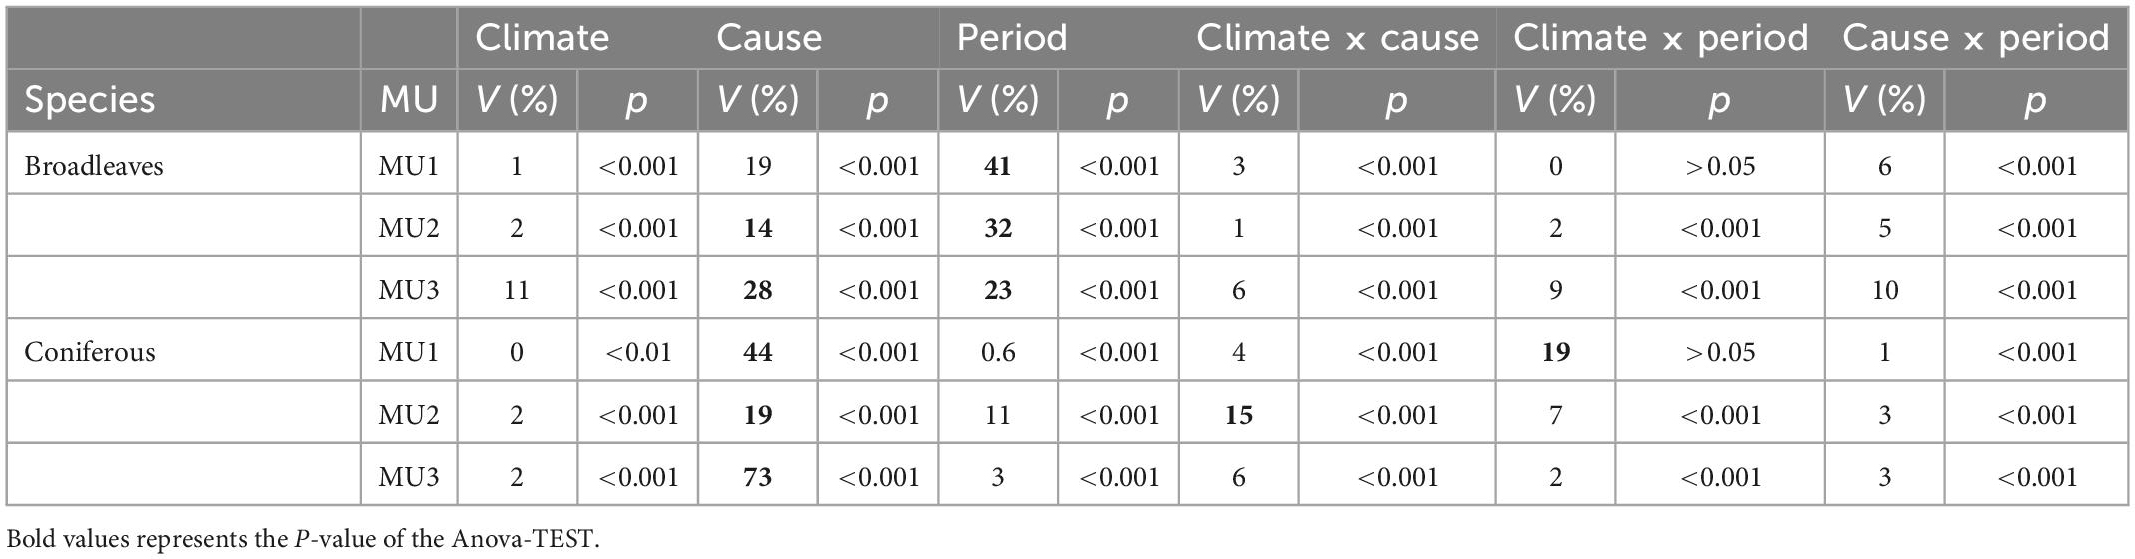
Table 4. Variation explained (V) and significance of the effects of climate, mortality cause (competitive exclusion vs. wildfires), period (succession), and the interaction of climate × cause in the three MU from 2010 to 2310.
4. Discussion
4.1. Future boreal forest composition
Wildfire’s activity and changes in environmental conditions (higher temperatures, more precipitation in studies area) under climate change will affect forest species composition. Our results are consistent with Boulanger and Pascual Puigdevall (2021) findings, climate change will favor white birch and trembling aspen, which will strongly increase at the expense of coniferous species. Likewise, more broadleaved species are now observed in the regeneration layer after fire rather than conifer species, apparently due to global warming (Walker et al., 2017). Similarly, in the next 100 years, Augustin et al. (2022) report that the abundance of black spruce and jack pine will decline by around 9, 40, and 58% in Central, West, and East MU, respectively. Also, Molina et al. (2021) stated that an increase in fire events is accompanied by an increase in the mixed broadleaves stands proportion in the landscape for western regions. All of our results are consistent with other projections for the boreal forest of Canada (Boulanger and Pascual Puigdevall, 2021; Molina et al., 2021; Augustin et al., 2022), showing that spruce-broadleaves mixed forests will be resilient to climate change and wildfires.
The climate-induced changes in growth directly alter the competitive abilities of boreal coniferous species, making black spruce less productive when mixed with broadleaves in extreme scenarios (Fisichelli et al., 2014; Brecka et al., 2020). However, in our simulations, this co-occurrence allowed white birch and trembling aspen species to partially compensate for the decline in coniferous species biomass carbon stock. Overall, the mortality of forests dominated by shade-tolerant conifers is positively related to dry conditions (warm temperature) (Sánchez-Pinillos et al., 2022). Our model overestimated the dispersal of white birch and trembling aspen since there are several edaphic limitations for their regeneration and establishment. This study suggests that in all scenarios for 300 years, coniferous species may not disappear from the northern limit of forest management, but they could be at risk of becoming less productive than they currently are in the western regions compared to the Côte-Nord region. In contrast, broadleaves might take over the landscape where the soil conditions are favorable for their establishment. Regarding that, a high proportion of the landscape in MU1 is dominated by paludified and organic soils, and the other MU are characterized by lower soils nutrient content, such factors preventing broadleaves regeneration (Greene et al., 1999). On the other hand, although black spruce is less productive than other boreal species, it can grow under conditions of low nutrient availability and paludified soils and can therefore outcompete other species on nutrient-poor sites (Lavoie et al., 2006).
On the other hand, similar to our results Stralberg et al. (2018) confirm that wildfires could increase the areas of open woodlands (unproductive forest area or), with lower productivity in the absence of broadleaves dispersal. Augustin et al. (2022) state that unproductive forest area will exceed 30% in all MUs under RCP4.5 and RCP8.5 mainly in central units (MU2), which could be explained by the occurrence of shorter fire return intervals, resulting in a higher rate of fire-induced regeneration failure compared to the other units (Baltzer et al., 2021; Augustin et al., 2022). Cyr et al. (2021) propose a post-fire reforestation with jack pine as the most effective strategy to maintain potential production under climate change effect, the post-fire afforestation using mixed stands of black spruce and jack pine in open forest woodland could be an opportunity for carbon offsets in Québec boreal forest, mainly in MU2 where the fire cycle is short. Diversified forests were shown to be more resilient under increased anthropogenic climate forcing (Ameray et al., 2021).
4.2. Climate change and forest carbon sequestration
To our knowledge, this is the first study based on an ecophysiological model to project the impact of wildfires and climate change on Québec boreal forest composition and productivity at the landscape scale, near the Québec northern limit of forest management (Figure 1). Our study indicates that the projected impacts of global warming and wildfires are substantial and subject to major differences between the eastern and western parts of the Québec boreal forest. In the next 100 years, it is expected that climate change will increase annual temperature averages by 2.5, 4, and 5.2°C for RCP2.6, RCP4.5, and RCP8.5 respectively (Wang et al., 2016). Our models projected an increase in boreal forest productivity and mixed forest area in the short term. Such an increase in productivity can be explained both by climate change-induced increases in potential growth and by the dominance of mixed forests (Cavard et al., 2010; Ameray et al., 2021; Molina et al., 2021). Warming extends the growing season from 90–120 to 150–180 days (Supplementary Figure 4) and increases growth rates while reducing potential cold-temperature injuries (D’Orangeville et al., 2018), which could explain the increase of NPP for both coniferous and broadleaves, mainly for intermediate scenarios RCP2.6 and RCP4.5 in all MU. Under RCP8.5 in MU1, climate change is expected to increase summer ecosystem respiration, which may increase drought and contributes to reducing NPP and biomass gains (Boulanger and Pascual Puigdevall, 2021). Besides, after 2100 the NPP of conifers (mainly black spruce) under RCP8.5 in MU1 during both July and August started to drop to 0, because tree foliage closes its stomata due to an increase in temperature above the upper temperature limit for photosynthesis (as defined for each species). Also, as we did not consider the harvesting and more than 50% of the age structure is less than 60 years in MU1, consequently, the stocks increased even in the baseline. Our results were consistent with D’Orangeville et al. (2018), which find that 2°C of warming may increase overall boreal forest productivity by 13 ± 3%. On the other hand, Boulanger et al. (2017) report opposite results in transition zones (boreal-temperate) in southern regions (lower latitudes), where the potential growth will decline. In the medium and long-term, we emphasize that conifer biomass was reduced under the effect of extreme climate change scenarios in the western, drier regions (Boulanger and Pascual Puigdevall, 2021).
Under intermediate climate change scenarios, coniferous species have shown increases in photosynthesis as temperatures approached the upper limit of their optimal range (27–29°C, see input files for species calibrated parameters), which could reflect the thermal acclimation of the photosynthesis process. However, only few studies (e.g., Way and Sage, 2008; Benomar et al., 2018; Dusenge et al., 2020) showed moderate thermal acclimation of respiration and no evidence for thermal acclimation of photosynthesis. Boreal coniferous species, which are well adapted to cold temperature, were assumed to be limited in their capacity to adapt to warm conditions (Girardin et al., 2016). In addition to temperature effects, Gustafson et al. (2018) found that elevated CO2 stimulates productivity such that it dwarfs the negative effect caused by elevated temperature. Also, Charney et al. (2016) used continent-wide empirical observations of tree sensitivity to climate and CO2 to predict increases in growth across much of North America of up to 60% under the RCP8.5 emissions scenario, while in our case we found that an increase of 50% in atmospheric CO2 could increase the growth by 30%. According to our simulations, the growth of coniferous species will decline in future climates, mainly in the medium and long-terms in both MU1 and MU2. Indeed, after 100 years of simulation and under no dispersal of broadleaves, the carbon stock in biomass under RCP 8.5 had decreased by 50% relative to the baseline climate.
Several studies showed that future warming will create climate conditions that are more prone to fire occurrence (Boulanger et al., 2017). Based on the literature, our study assumed that burned areas strongly differed between climate change scenarios and the baseline, increasing with climate change severity (Bergeron et al., 2006; Boulanger et al., 2014; Tremblay et al., 2018; Molina et al., 2021). Our findings are consistent with previous studies (Boulanger and Pascual Puigdevall, 2021; Molina et al., 2021), which report that an increase in wildfire activity could explain these declines in biomass. Indeed, in MU1 and MU2 area burned per year by 2100 under RCP85 reach 1 and 1.25% of the landscape, respectively (Bergeron et al., 2006), where the losses reach more than 15 tC year–1. However, our study project that the losses in forest area under wildfires disturbance will have more fluctuation for extreme scenarios (RCP4.5 and RCP8.5) with high values compared to that of the baseline (current burn rate) in MU2, which could reach 9000 ha year–1 of burned area (Supplementary Figure 6). These fluctuations could be explained by the model behavior, in fact the fire sizes in the model follow a log-normal distribution with small fire occurring more frequently than large fires (Scheller and Domingo, 2018). Fire cycles are generally shorter in the western regions, as a result, the forest matrix tends to be dominated by a younger post-fire forest with patches of older forest dispersed throughout (Bergeron et al., 2017), which comprise much lower biomass carbon stock (Johnson et al., 1998; Boulanger and Pascual Puigdevall, 2021), thus could explain the drop of the stocks under RCP8.5 in MU1.
4.3. Model limitation and future improvements
Generally, our model underestimated the biomass of young stands (40–80 years), which may be due to the numerous parameters (Table 3) considered by PnET and Landis-II models (Duveneck and Thompson, 2019; Gustafson and Miranda, 2019), but mainly to the data used for calibration (yield curves shape). However, Pothier and Savard (1998) regional and empirical yield curves should be accurate enough for our purpose since they are based on site index, thus reflecting the regional potential growth of the studied species. The bias could be reduced using monthly and annual dendrochronological data, improving the calibrated parameters. However, the PnET model allows us to adequately assess the effect of climate on species productivity and competition. It was also very useful in estimating biomass variation and composition under climate change. In MU1, our results could be overestimated, because the lowland sites are characterized by a thick organic layer, in fact, black spruce productivity declines by 50–80% with increased paludification, particularly during the first centuries after fire (Simard et al., 2007). However, the species waterlogging tolerance mainly in MU1 (clay soils) was considered during the calibration. So far, the model is not associated with soil pools to simulate SOC dynamics. Since the PnET model mechanistically simulates litter and deadwood across the landscape, a dynamic soil model could be associated with both to follow the SOC pools. Also, the integration of a dispersal model based on soil condition and nutrient content could be a good improvement in the future. In addition, the species’ drought sensitivity may be underestimated by the current PnET parameters, requiring more ecophysiological research to adjust them if necessary.
There are known problems with the model we used (v.4) and a new version is due to be released shortly that will fix some known bugs. Models are constantly being improved upon, and we used the latest official release of the model. Some of the known issues with the model we used are an underestimation of drought effect on forest growth and other problems related to soil texture that causes more water to be retained in coarse soils (e.g., sand compared to loam). The updated beta version could result in more mortality due to drought and competition, and less biomass for conifers, particularly in MU1 under RCP8.5. Any switch to this new version requires verification and potential calibration and adjustment of our parameters to achieve similar empirical yield curves per species. Moreover, the V5 beta version is not yet finalized and still needs some improvements to be compatible with the LANDIS-II output extensions.
5. Conclusion
Our findings are consistent with previous studies, which state that climate change will considerably affect boreal forest landscapes in the future. In that context, the use of forest simulators such as PnET and LANDIS-II models makes it a useful tool for integrating ecophysiological and ecological processes and testing climate change with multiple simultaneous objectives. The use of a PBM allowed us to mechanistically simulate the changes in forest stand productivity and composition. In this study, we draw four main conclusions which could be useful in future decision-making: (i) the current productivity of boreal forests in high latitudes will increase from lower to high values in the short-term (2110), which could reach more than 80 tC ha–1, (ii) the dominance of black spruce decreased in favor of mixed forest and broadleaves pure forests, (iii) in the absence of broadleaves dispersal because of soil limitations, the risk of forests conversion into open forest woodlands was high due to wildfires activity, which may require more afforestation of mixed coniferous to offset the lower regeneration rate in these zones, and (iv) coniferous mortality was strongly explained by competitive exclusion and wildfires with high interaction with climate change, while for broadleaved species it was related to forest succession. The impacts of global warming were much more important under RCP 8.5 after 2100, suggesting that western Québec forests might experience important stress under strong anthropogenic climate forcing, while eastern regions could be less venerable to climate change and a refuge site for coniferous. The results obtained in this study provide a good reference to guide sustainable forest management as well as a reasonable starting point, which can be improved and support future work on carbon budget modeling.
Data availability statement
The raw data supporting the conclusions of this article will be made available by the authors, without undue reservation.
Author contributions
AA wrote the manuscript as part of his dissertation research at UQAT (Université du Québec en Abitibi-Témiscamingue) under the supervision of YB and XC. AA conducted the simulations, data analysis, and visualization. All authors read, commented, and approved the final manuscript. YB and XC funded the project. All authors contributed to the study conceptualization and scenarios design, and had read and agreed upon the submitted version of the manuscript.
Funding
Open access funding was provided by “Chaire de Recherche UQAT-MFFP sur la gestion du carbone forestier.” This work was made possible by the funding from DESI (Développement économique Sept-Îles), MFFP (Québec Ministry of Forests, Wildlife and Parks), and NSERC (Natural Sciences and Engineering Research Council of Canada).
Acknowledgments
We thank E. Gustafson for his valuable comments on our parameters during the model calibration, and Louis Duchesne for sharing their dataset on soils texture for all Quebec managed forest. We also thank Ouranos for climatic data.
Conflict of interest
The authors declare that the research was conducted in the absence of any commercial or financial relationships that could be construed as a potential conflict of interest.
Publisher’s note
All claims expressed in this article are solely those of the authors and do not necessarily represent those of their affiliated organizations, or those of the publisher, the editors and the reviewers. Any product that may be evaluated in this article, or claim that may be made by its manufacturer, is not guaranteed or endorsed by the publisher.
Supplementary material
The Supplementary Material for this article can be found online at: https://www.frontiersin.org/articles/10.3389/ffgc.2023.1020305/full#supplementary-material
Footnotes
References
Aber, J. D., and Federer, C. A. (1992). A generalized, lumped-parameter model of photosynthesis, evapotranspiration and net primary production in temperate and boreal forest ecosystems. Oecologia 92, 463–474. doi: 10.1007/BF00317837
Ameray, A., Bergeron, Y., Valeria, O., Girona, M., and Cavard, X. (2021). Forest carbon management: A review of silvicultural practices and management strategies across boreal, tropical, and temperate forests. Curr. Forest. Rep. 7, 245–266. doi: 10.1007/s40725-021-00151-w
Augustin, F., Girardin, M. P., Terrier, A., Grondin, P., Lambert, M.-C., Leduc, A., et al. (2022). Projected changes in fire activity and severity feedback in the spruce–feather moss forest of Western Quebec, Canada. Trees Forests People 8:100229. doi: 10.1016/j.tfp.2022.100229
Baltzer, J. L., Day, N. J., Walker, X. J., Greene, D., Mack, M. C., Alexander, H. D., et al. (2021). Increasing fire and the decline of fire adapted black spruce in the boreal forest. Proc. Natl. Acad. Sci. U.S.A. 118:e2024872118. doi: 10.1073/pnas.2024872118
Benomar, L., Lamhamedi, M. S., Pepin, S., Rainville, A., Lambert, M.-C., Margolis, H. A., et al. (2018). Thermal acclimation of photosynthesis and respiration of southern and northern white spruce seed sources tested along a regional climatic gradient indicates limited potential to cope with temperature warming. Ann. Bot. 121, 443–457. doi: 10.1093/aob/mcx174
Bergeron, Y., Chen, H. Y. H., Kenkel, N. C., Leduc, A. L., and Macdonald, S. E. (2014). Boreal mixedwood stand dynamics: Ecological processes underlying multiple pathways. Forest. Chronicle 90, 202–213. doi: 10.5558/tfc2014-039
Bergeron, Y., Cyr, D., Drever, C., Flannigan, M., Gauthier, S., Kneeshaw, D., et al. (2006). Past, current, and future fire frequencies in Quebec’s commercial forests: Implications for the cumulative effects of harvesting and fire on age-class structure and natural disturbance-based management. Can. J. Forest Res. 36, 2737–2744. doi: 10.1139/X06-177
Bergeron, Y., Harvey, B., Leduc, A., and Gauthier, S. (1999). Forest management guidelines based on natural disturbance dynamics: Stand-and forest-level considerations. Forest. Chronicle 75, 49–54.
Bergeron, Y., Irulappa Pillai Vijayakumar, D. B., Ouzennou, H., Raulier, F., Leduc, A., and Gauthier, S. (2017). Projections of future forest age class structure under the influence of fire and harvesting: Implications for forest management in the boreal forest of Eastern Canada. Forestry 90, 485–495. doi: 10.1093/forestry/cpx022
Bergeron, Y., Leduc, A., Harvey, B. D., and Gauthier, S. (2002). Natural fire regime: A guide for sustainable management of the Canadian boreal forest. Silva Fennica 36, 81–95.
Boucher, Y., Perrault-Hébert, M., Fournier, R., Drapeau, P., and Auger, I. (2017). Cumulative patterns of logging and fire (1940–2009): Consequences on the structure of the Eastern Canadian boreal forest. Landsc. Ecol. 32, 361–375.
Boulanger, Y., and Pascual Puigdevall, J. (2021). Boreal forests will be more severely affected by projected anthropogenic climate forcing than mixedwood and northern hardwood forests in Eastern Canada. Landsc. Ecol. 36, 1725–1740. doi: 10.1007/s10980-021-01241-7
Boulanger, Y., Gauthier, S., and Burton, P. J. (2014). A refinement of models projecting future Canadian fire regimes using homogeneous fire regime zones. Can. J. Forest Res. 44, 365–376.
Boulanger, Y., Taylor, A. R., Price, D. T., Cyr, D., McGarrigle, E., Rammer, W., et al. (2017). Climate change impacts on forest landscapes along the Canadian southern boreal forest transition zone. Landsc. Ecol. 32, 1415–1431. doi: 10.1007/s10980-016-0421-7
Brecka, A. F. J., Boulanger, Y., Searle, E. B., Taylor, A. R., Price, D. T., Zhu, Y., et al. (2020). Sustainability of Canada’s forestry sector may be compromised by impending climate change. Forest Ecol. Manag. 474:118352. doi: 10.1016/j.foreco.2020.118352
Castro, M., Ameray, A., and Castro, J. P. (2020). A new approach to quantify grazing pressure under Mediterranean pastoral systems using GIS and remote sensing. Int. J. Remote Sens. 41, 5371–5387. doi: 10.1080/01431161.2020.1731930
Cavard, X., Bergeron, Y., Chen, H. Y. H., and Pare, D. (2010). Mixed-species effect on tree aboveground carbon pools in the east-central boreal forests. Can. J. Forest Res. 40, 37–47.
Charney, N. D., Babst, F., Poulter, B., Record, S., Trouet, V. M., Frank, D., et al. (2016). Observed forest sensitivity to climate implies large changes in 21st century North American forest growth. Ecol. Lett. 19, 1119–1128. doi: 10.1111/ele.12650
Chen, J. M., Rich, P. M., Gower, S. T., Norman, J. M., and Plummer, S. (1997). Leaf area index of boreal forests: Theory, techniques, and measurements. J. Geophys. Res. 102, 29429–29443.
Collins, M., Knutti, R., Arblaster, J., Dufresne, J.-L., Fichefet, T., Friedlingstein, P., et al. (2013). “Long-term climate change: Projections, commitments and irreversibility,” in Climate change 2013-The physical science basis: Contribution of working group I to the fifth assessment report of the intergovernmental panel on climate change, eds T. F. Stocker, D. Qin, G.-K. Plattner, M. Tignor, S. K. Allen, J. Doschung, et al. (Cambridge: Cambridge University Press), 1029–1136.
Cook, B. D., Bolstad, P. V., Martin, J. G., Heinsch, F. A., Davis, K. J., Wang, W., et al. (2008). Using light-use and production efficiency models to predict photosynthesis and net carbon exchange during forest canopy disturbance. Ecosystems 11, 26–44. doi: 10.1007/s10021-007-9105-0
Curiel, Y. J., Baldocchi, D. D., Gershenson, A., Goldstein, A., Misson, L., and Wong, S. (2007). Microbial soil respiration and its dependency on carbon inputs, soil temperature and moisture. Glob. Change Biol. 13, 2018–2035. doi: 10.1111/j.1365-2486.2007.01415.x
Cyr, D., Splawinski, T. B., Pascual Puigdevall, J., Valeria, O., Leduc, A., Thiffault, N., et al. (2021). Mitigating post-fire regeneration failure in boreal landscapes with reforestation and variable retention harvesting: At what cost? Can. J. Forest Res. 52, 568–581. doi: 10.1139/cjfr-2021-0180
D’Orangeville, L., Houle, D., Duchesne, L., Phillips, R. P., Bergeron, Y., and Kneeshaw, D. (2018). Beneficial effects of climate warming on boreal tree growth may be transitory. Nat. Commun. 9:3213. doi: 10.1038/s41467-018-05705-4
De Bruijn, A., Gustafson, E. J., Sturtevant, B. R., Foster, J. R., Miranda, B. R., Lichti, N. I., et al. (2014). Toward more robust projections of forest landscape dynamics under novel environmental conditions: Embedding PnET within LANDIS-II. Ecol. Modell. 287, 44–57.
Dixon, R. K., Solomon, A. M., Brown, S., Houghton, R. A., Trexier, M. C., and Wisniewski, J. (1994). Carbon pools and flux of global forest ecosystems. Science 263, 185–190.
Duchesne, L., and Ouimet, R. (2021). Digital mapping of soil texture in ecoforest polygons in Quebec, Canada. PeerJ 9:e11685. doi: 10.7717/peerj.11685
Dusenge, M. E., Madhavji, S., and Way, D. A. (2020). Contrasting acclimation responses to elevated CO2 and warming between an evergreen and a deciduous boreal conifer. Glob. Change Biol. 26, 3639–3657. doi: 10.1111/gcb.15084
Duveneck, M. J., and Thompson, J. R. (2019). Social and biophysical determinants of future forest conditions in New England: Effects of a modern land-use regime. Glob. Environ. Change 55, 115–129.
Fisichelli, N. A., Frelich, L. E., and Reich, P. B. (2014). Temperate tree expansion into adjacent boreal forest patches facilitated by warmer temperatures. Ecography 37, 152–161.
Gauthier, S., Bernier, P., Kuuluvainen, T., Shvidenko, A. Z., and Schepaschenko, D. G. (2015). Boreal forest health and global change. Science 349, 819–822.
Girardin, M. P., Bouriaud, O., Hogg, E. H., Kurz, W., Zimmermann, N. E., Metsaranta, J. M., et al. (2016). No growth stimulation of Canada’s boreal forest under half-century of combined warming and CO2 fertilization. Proc. Natl. Acad. Sci. U.S.A. 113, E8406–E8414. doi: 10.1073/pnas.1610156113
Greene, D. F., Zasada, J. C., Sirois, L., Kneeshaw, D., Morin, H., Charron, I., et al. (1999). A review of the regeneration dynamics of North American boreal forest tree species. Can. J. Forest Res. 29, 824–839. doi: 10.1139/x98-112
Gustafson, E. J., and Miranda, B. R. (2019). PnET-Succession – LANDIS-II. Available online at: http://www.landis-ii.org/extensions/pnet-succession (accessed April, 02, 2022).
Gustafson, E. J., De Bruijn, A. M. G., Pangle, R. E., Limousin, J.-M., McDowell, N. G., Pockman, W. T., et al. (2015). Integrating ecophysiology and forest landscape models to improve projections of drought effects under climate change. Glob. Change Biol. 21, 843–856. doi: 10.1111/gcb.12713
Gustafson, E. J., Miranda, B. R., and Sturtevant, B. R. (2018). Can future CO2 concentrations mitigate the negative effects of high temperature and longer droughts on forest growth? Forests 9:664. doi: 10.3390/f9110664
Huang, C., He, H. S., Liang, Y., Wu, Z., Hawbaker, T. J., Gong, P., et al. (2018). Long-term effects of fire and harvest on carbon stocks of boreal forests in Northeastern China. Ann. Forest Sci. 75:42. doi: 10.1007/s13595-018-0722-x
IPCC (2014). Climate change: The fifth assessment report of the intergovernmental panel on climate change. Geneva: IPCC.
Johnson, E. A., Miyanishi, K., and Weir, J. M. H. (1998). Wildfires in the Western Canadian boreal forest: Landscape patterns and ecosystem management. J. Veg. Sci. 9, 603–610.
Johnstone, J., Hollingsworth, T., Chapin, I. F., and Mack, M. (2010). Changes in fire regime break the legacy lock on successional trajectories in Alaskan boreal forest. Glob. Chang. Biol. 16, 1281–1295. doi: 10.1111/j.1365-2486.2009.02051.x
Kim, Y.-H., Kim, R., and Park, H. (2015). Reviews of forest carbon dynamics models that use empirical yield curves: CBM-CFS3, CO2FIX, CASMOFOR, EFISCEN AU – Kim, Hojung. Forest Sci. Technol. 11, 212–222. doi: 10.1080/21580103.2014.987325
Kurz, W. A., Dymond, C. C., White, T. M., Stinson, G., Shaw, C. H., Rampley, G. J., et al. (2009). CBM-CFS3: A model of carbon-dynamics in forestry and land-use change implementing IPCC standards. Ecol. Modell. 220, 480–504.
Landsberg, J. J., Sands, P. J., Landsberg, J., and Sands, P. (2011). Physiological ecology of forest production: Principles, processes and models. London: Elsevier/Academic Press.
Lavoie, M., Paré, D., and Bergeron, Y. (2006). Relationships between microsite type and the growth and nutrition of young black spruce on post-disturbed lowland black spruce sites in Eastern Canada. Can. J. Forest Res. 37, 62–73.
Liang, Y., Duveneck, M. J., Gustafson, E. J., Serra-Diaz, J. M., and Thompson, J. R. (2018). How disturbance, competition, and dispersal interact to prevent tree range boundaries from keeping pace with climate change. Glob. Change Biol. 24, e335–e351. doi: 10.1111/gcb.13847
McKenzie, P. F., Duveneck, M. J., Morreale, L. L., and Thompson, J. R. (2019). Local and global parameter sensitivity within an ecophysiologically based forest landscape model. Environ. Modell. Softw. 117, 1–13.
Meinshausen, M., Smith, S. J., Calvin, K., Daniel, J. S., Kainuma, M. L. T., Lamarque, J.-F., et al. (2011). The RCP greenhouse gas concentrations and their extensions from 1765 to 2300. Clim. Change 109, 213–241.
Mina, M., Messier, C., Duveneck, M. J., Fortin, M. J., and Aquilué, N. (2022). Managing for the unexpected: Building resilient forest landscapes to cope with global change. Glob. Change Biol. 28, 4323–4341. doi: 10.1111/gcb.16197
Mina, M., Messier, C., Duveneck, M., Fortin, M. J., and Aquilué, N. (2021). Network analysis can guide resilience-based management in forest landscapes under global change. Ecol. Appl. 31:e2221. doi: 10.1002/eap.2221
Mladenoff, D. J., and He, H. S. (1999). “Design, behavior and application of LANDIS, an object-oriented model of forest landscape disturbance and succession,” in Spatial modeling of forest landscape change: Approaches and applications, eds D. J. Mladenoff and W. L. Baker (Cambridge: Cambridge University Press), 125–162.
Molina, E., Valeria, O., De Grandpre, L., Ramirez, J. A., Cyr, D., and Boulanger, Y. (2021). Projecting future aboveground biomass and productivity of managed eastern Canadian mixedwood boreal forest in response to climate change. Forest Ecol. Manag. 487:119016.
Murphy, K. R., Myors, B., and Wolach, A. (2014). Statistical power analysis: A simple and general model for traditional and modern hypothesis tests. London: Routledge.
Pan, Y., Birdsey, R. A., Fang, J., Houghton, R., Kauppi, P. E., Kurz, W. A., et al. (2011). A large and persistent carbon sink in the world’s forests. Science 333, 988–993. doi: 10.1126/science.1201609
Paré, D., Bernier, P., Lafleur, B., Titus, B. D., Thiffault, E., Maynard, D. G., et al. (2013). Estimating stand-scale biomass, nutrient contents, and associated uncertainties for tree species of Canadian forests. Can. J. For. Res. 43, 599–608. doi: 10.1139/cjfr-2012-0454
Peng, C., and Apps, M. J. (2000). Simulating global soil-CO_2 flux and its response to climate change. J. Environ. Sci. 12, 257–265.
Peng, C., Ma, Z., Lei, X., Zhu, Q., Chen, H., Wang, W., et al. (2011). A drought-induced pervasive increase in tree mortality across Canada’s boreal forests. Nat. Clim. Change 1:467.
Pothier, D., and Savard, F. (1998). Actualisation des tables de production pour les principales espèces du Québec. Québec, QC: Gouvernement Du Québec.
Running, S. W., Thornton, P. E., Nemani, R., and Glassy, J. M. (2000). Global terrestrial gross and net primary productivity from the earth observing system, eds O. E. Sala, R. B. Jackson, H. A. Mooney, and R. W. Howarth (New York, NY: Springer), 44–57. doi: 10.1007/978-1-4612-1224-9_4
Saltelli, A., and Annoni, P. (2010). How to avoid a perfunctory sensitivity analysis. Environ. Modell. Softw. 25, 1508–1517. doi: 10.1016/j.envsoft.2010.04.012
Sánchez-Pinillos, M., D’Orangeville, L., Boulanger, Y., Comeau, P., Wang, J., Taylor, A. R., et al. (2022). Sequential droughts: A silent trigger of boreal forest mortality. Glob. Change Biol. 28, 542–556. doi: 10.1111/gcb.15913
Scheller, R. M., and Domingo, J. B. (2018). LANDIS-II base fire v4.0 extension user guide in reproduction. The LANDIS-II Foundation. Available online at: https://landis-ii-foundation.github.io/Extension-Base-Fire/
Scheller, R. M., Domingo, J. B., Sturtevant, B. R., Williams, J. S., Rudy, A., Gustafson, E. J., et al. (2007). Design, development, and application of LANDIS-II, a spatial landscape simulation model with flexible temporal and spatial resolution. Ecol. Modell. 201, 409–419.
Schimel, D. S., House, J. I., Hibbard, K. A., Bousquet, P., Ciais, P., Peylin, P., et al. (2001). Recent patterns and mechanisms of carbon exchange by terrestrial ecosystems. Nature 414:169.
Simard, M., Lecomte, N., Bergeron, Y., Bernier, P. Y., and Paré, D. (2007). Forest productivity decline caused by successional paludification of boreal soils. Ecol. Appl. 17, 1619–1637. doi: 10.1890/06-1795.1
Stralberg, D., Wang, X., Parisien, M., Robinne, F., Sólymos, P., Mahon, C. L., et al. (2018). Wildfire-mediated vegetation change in boreal forests of Alberta, Canada. Ecosphere 9:e02156.
Tremblay, J. A., Boulanger, Y., Cyr, D., Taylor, A. R., Price, D. T., and St-Laurent, M.-H. (2018). Harvesting interacts with climate change to affect future habitat quality of a focal species in Eastern Canada’s boreal forest. PLoS One 13:e0191645. doi: 10.1371/journal.pone.0191645
Walker, X. J., Mack, M. C., and Johnstone, J. F. (2017). Predicting ecosystem resilience to fire from tree ring analysis in black spruce forests. Ecosystems 20, 1137–1150.
Wang, J., Taylor, A. R., and D’Orangeville, L. (2023). Warming-induced tree growth may help offset increasing disturbance across the Canadian boreal forest. Proc. Natl. Acad. Sci. U.S.A. 120:e2212780120. doi: 10.1073/pnas.2212780120
Wang, T., Hamann, A., Spittlehouse, D., and Carroll, C. (2016). Locally downscaled and spatially customizable climate data for historical and future periods for North America. PLoS One 11:e0156720. doi: 10.1371/journal.pone.0156720
Ward, B. C., Mladenoff, D. J., and Scheller, R. M. (2005). Simulating landscape-level effects of constraints to public forest regeneration harvests due to adjacent residential development in Northern Wisconsin. Forest Sci. 51, 616–632.
Way, D. A., and Sage, R. F. (2008). Thermal acclimation of photosynthesis in black spruce [Picea mariana (Mill.) B.S.P.]. Plant Cell Environ. 31, 1250–1262. doi: 10.1111/j.1365-3040.2008.01842.x
Keywords: forest carbon, climate change, wildfires, PnET-Succession, LANDIS-II, competition, mortality
Citation: Ameray A, Cavard X and Bergeron Y (2023) Climate change may increase Quebec boreal forest productivity in high latitudes by shifting its current composition. Front. For. Glob. Change 6:1020305. doi: 10.3389/ffgc.2023.1020305
Received: 16 August 2022; Accepted: 25 January 2023;
Published: 10 February 2023.
Edited by:
Ling Zhang, Jiangxi Agricultural University, ChinaReviewed by:
Matthew Joshua Duveneck, New England Conservatory of Music, United StatesMelissa Lucash, University of Oregon, United States
Copyright © 2023 Ameray, Cavard and Bergeron. This is an open-access article distributed under the terms of the Creative Commons Attribution License (CC BY). The use, distribution or reproduction in other forums is permitted, provided the original author(s) and the copyright owner(s) are credited and that the original publication in this journal is cited, in accordance with accepted academic practice. No use, distribution or reproduction is permitted which does not comply with these terms.
*Correspondence: Abderrahmane Ameray,  YW1lYTAyQHVxYXQuY2E=