 Huilin Yu
 Jie Zhang
 Baoping Meng
 Meng Li
 Shuhua Yi
- School of Geographic Sciences, Nantong University, Nantong, China
Vegetation photosynthesis is a critical component of terrestrial carbon cycles, and its peak value (peak photosynthetic rate) dominates plant CO2 uptake. Urbanization has significantly influenced vegetation photosynthesis by changing environmental conditions directly (replacement of vegetated surfaces with impervious surfaces) and indirectly (e.g., atmospheric and climatic conditions). Although some studies have investigated the effects of urbanization on vegetation productivity across the whole study area, how the peak photosynthetic rate responds to urbanization for different vegetation types has received scant scholarly attention. Here, using the urban-rural gradient approach, we explored the effects of urbanization on the peak photosynthetic rate (surrogated by GPPmax and EVImax) of different vegetation types across urbanization intensity (UI) gradients in the Yangtze River Delta Urban Agglomeration (YRDUA). The results showed that (1) the GPPmax and EVImax of the forest, grassland, and wetland decreased with urban intensity. GPPmax and EVImax in rural areas (UI ≦ 1%) were 36.62 and 30.47% higher than those of urban areas (UI > 1%) overall vegetation types. (2) The indirect impacts can offset or exacerbate the direct loss of vegetation photosynthesis caused by urbanization in YRDUA. Especially for forest ecosystems in YRDUA, the negative direct urbanization effect is exacerbated by the indirect reduction in vegetation growth. However, the indirect effects of urbanization on grassland and wetland offset 47.08 and 87.23% loss of GPPmax, and 34.17 and 79.73% loss of EVImax due to the reduction of vegetated surface area, respectively. (3) The indirect impact of urbanization on vegetation photosynthesis was dominated by the elevated daytime land surface temperature (LSTday). Our study highlights the necessity of distinguishing the various effects of urbanization on vegetation photosynthesis, which may help stakeholders formulate more reasonable urban environmental planning.
Introduction
As one of the typical anthropogenic perturbances, urbanization transforms natural land into impervious surfaces and causes the shrinkage of vegetation areas (Dewan and Yamaguchi, 2009). This conversion subsequently increased temperatures, elevated CO2 concentrations, and aggravated air pollution (Ziska et al., 2004; Zhou et al., 2014; Si et al., 2021). Urban environmental changes could derail the physical and biological processes of vegetation (Liu et al., 2015). On account of the indispensable roles in improving social, economic, and environmental benefits, there has long been a debate about whether vegetation growth has been reduced or enhanced in urban environments compared to rural environments (Quigley, 2002; Gregg et al., 2003). As a considerable indicator of ecosystem CO2 exchange, vegetation photosynthesis forbodes vegetation growth adaptation under future climatic conditions (Youngsteadt et al., 2015). Hence, it is necessary to quantify the variation in vegetation photosynthesis in the urbanization gradient; this would allow us to establish a linkage between urban planning and environmental protection.
Due to the convenience and promising tools of the remote sensing models, a considerable quantity of literature adopted it to identify the variation of vegetation photosynthesis during urbanization (Wang et al., 2010). Most research suggests that the total losses in vegetation carbon sequestration capacity and the rapid degradation of urban carbon stock are mainly attributed to land cover/land use conversion (Fu et al., 2013; Li et al., 2018). However, some research showed the opposite, demonstrating that appropriate human management, plant long-term adaptations to urban conditions, surface urban heat island, and atmospheric deposition changes seemed to enhance carbon sequestration and contribute to vegetation productivity (Lohse et al., 2008; Peng et al., 2012; Calfapietra et al., 2015; Pretzsch et al., 2017). The variation of carbon sequestration mainly results from the difference in photosynthetic uptake of CO2, i.e., vegetation photosynthesis. Moreover, the above content indicated that the disturbances of vegetation photosynthesis under urbanization might decompose into two sizes: one was replacing original surfaces with impervious built-up (i.e., direct impact), and the other was the change of photosynthetic rate resulting from the change in the growth environments (i.e., indirect impact) (Zhao et al., 2016). Some studies have investigated urbanization's direct and indirect effects on vegetation growth across the world's cities. For example, Zhao et al. (2016) found that the growth enhancement offset about 40% of China's direct loss of vegetation productivity. Zhong et al. (2019) also suggested that the indirect impact of urbanization can compensate for vegetation loss due to land use and land cover conversion in Shanghai. China. Zhang et al. (2022) observed an increasing indirect effect of urbanization on vegetation growth in 672 cities worldwide.
Notably, urbanization's effects on vegetation photosynthesis involve complex changes in vegetation types and multiple environmental factors from rural-to-urban gradients. The extent of vegetation dynamics is also related to the distinct responses of various vegetation types to urbanization (Zhang et al., 2012). However, few of these studies have examined vegetation growth responses to urbanization for different vegetation types.
Vegetation photosynthesis reflects the land-atmosphere carbon exchange and controls CO2 uptake (gross primary productivity, GPP); its peak rate (maximum capacity of CO2 uptake, GPPmax) mainly dominates GPP variability in response to environmental transform interference (Xia et al., 2015). The enhanced vegetation index (EVI) is a proxy of vegetation greenness and a canopy structural property directly linked to the maximum proportion of photosynthetically active radiation. Both GPP and EVI can represent vegetation photosynthesis, but GPP is related to canopy function, and EVI is related to canopy structure. Previous studies observed that GPP was highly correlated with EVI in some ecosystems (Hu et al., 2022). Therefore, it is necessary to investigate the impact of urbanization on vegetation photosynthesis with the combination of GPP and EVI.
In contrast with rural areas, urban vegetation experiences richer carbon dioxide concentrations (Schwandner et al., 2017) and elevated temperatures (i.e., urban heat island) (Peng et al., 2012), resulting in photosynthetic activity peaking early and higher sensitivity to climate change (Wang et al., 2019). For that reason, quantifying the variation of vegetation peak photosynthetic rate between urban and rural gradients not only provides a simulation of the interannual variability of local net ecosystem CO2 exchange but also offers a reference for predicting vegetation photosynthetic dynamics under future climate conditions (Calfapietra et al., 2015; Fu et al., 2019). However, the consequences of urbanization on vegetation photosynthesis are still unclear. Therefore, it is necessary to quantify urbanization's direct and indirect effects on vegetation's peak photosynthetic variation rate.
To fill these gaps in current research, we selected the Yangtze River Delta Urban Agglomeration (YRDUA) as the study area, as it is the largest agglomeration that has witnessed rapid urbanization but has simultaneously preserved parts of rural areas, making this agglomeration appropriate for assessing the effects of urbanization on vegetation photosynthesis. We used the urban-rural gradient approach and aimed to investigate the effects of urbanization on the peak photosynthetic rate (surrogated by GPPmax and EVImax) of different vegetation types across urbanization intensity (UI) gradients. Firstly, we collected historical records of the EVI, Gross Primary Production (GPP), and urbanization intensity (UI) data in 2020. These data were mainly used to simulate the spatial patterns of the urbanization effect on vegetation photosynthesis. We also collected corresponding meteorological data to quantify how much the relevant climatic factors can explain the consequences of urbanization on vegetation photosynthesis.
Materials and methods
Study area
The Yangtze River Delta Urban Agglomeration (YRDUA) is located in the Yangtze River Delta Plain, China (Figure 1). It covers about 211,700 square kilometers, occupying 26 cities in three provinces (Jiangsu Province, Zhejiang Province, and Anhui Province) and one municipality (Shanghai Municipality) (Luo et al., 2021). According to statistics, the average urbanization rate of the Yangtze River Delta urban agglomeration was 75.01%, reaching an overall high level. The plains here are vast, with abundant water resources, and it is also the typical subtropical monsoon climate zone. The vegetation types are diverse; the dominants are forest and cropland, among which the main forest is evergreen broad-leaved forest, and the main crop is rice (Figure 1).
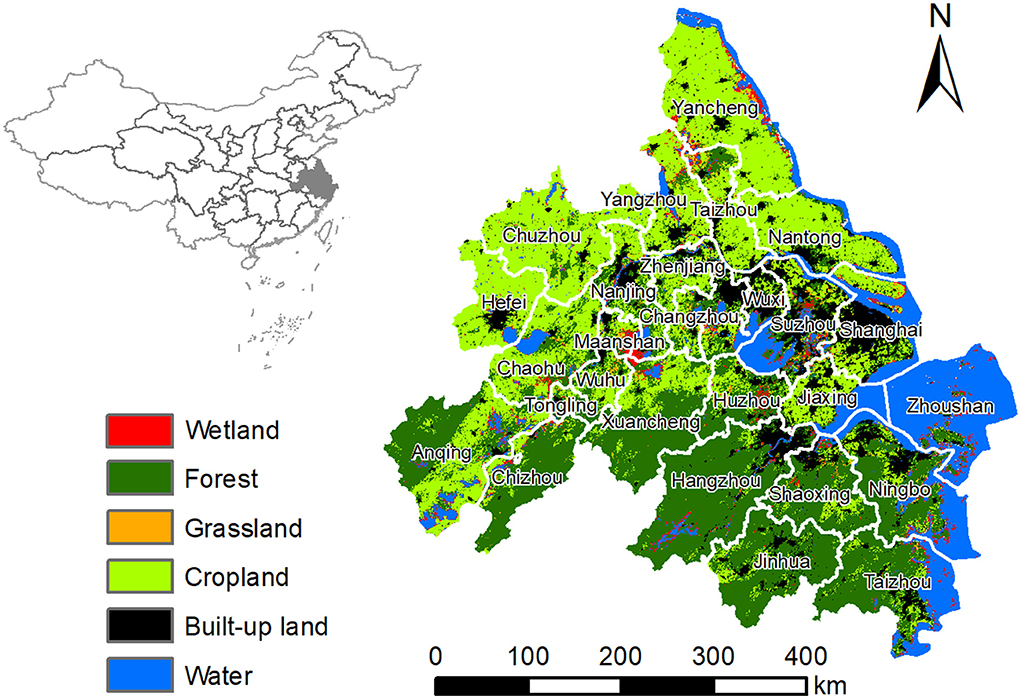
Figure 1. The location and main land-use types of the study region. The urban land cover map was derived from MCD12Q1 with a spatial resolution of 500 m.
Data collection and process method
We downloaded the land cover from the MCD12Q1 Moderate Resolution Imaging Spectroradiometer (mods) product. The product contains five legacy classification schemes with 500 m spatial resolution. In this study, we used the International Geosphere-Biosphere Programme (IGBP) scheme to identify and classify the land cover in the YRDUA by using the decision tree algorithm. Croplands were excluded because their photosynthetic dynamics are strongly affected by human management. We integrated evergreen coniferous forests, evergreen broadleaf forests, deciduous broadleaf forests, and mixed forests into the forest.
The 16-day MOD13A1 EVI and MOD17A2H GPP in 2020 were obtained from the NASA LP DAAC (Land Processes Distributed Active Archive Center) website (https://lpdaac.usgs.gov/get_data/data_pool). These datasets were calculated by the Maximum Value Composition method (MVC) and minimized geometrical, atmospheric, and radiation influences. The original EVI and GPP datasets were handled with the TIMESAT software to eliminate the effects of clouds and atmospheric contamination. Based on asymmetric Gaussian function-fitting, we adopted the Savitzky-Golay (SG) smoothing model to eliminate the influence of random noise, using data filtering and reconstruction (Luo et al., 2005). The annual EVImax and GPPmax were extracted from the smoothed and reconstructed EVI and GPP data.
Meteorological data, including air temperature, precipitation, and solar radiation in 2020, were collected from the National Earth System Science Data Center, National Science & Technology Infrastructure of China (http://www.geodata.cn) (Peng et al., 2019). Land surface temperature (LST) across the urban-rural gradient in 2020 was derived from the Aqua MODIS (MYD11A2; 8-d composite) dataset with a spatial resolution of 1 km. Each day, the Aqua satellite was acquired at 13:30 and 01:30 local time, approximately representing the diurnal and nocturnal temperatures, respectively.
Calculation of urban intensity
To ensure the consistency of spatial resolution, we calculated the urban intensity at a resolution of 500 m, corresponding to a pixel of MCD12Q1. We first downloaded the 30 m landcover product from GLC_FCS30-2020: Global Land Cover with Fine Classification System (Zhang et al., 2020). Then, we defined urban intensity (UI) as the ratio of the urban land or built-up class pixels to the total pixel numbers (30 m) within a 500 m MODIS pixel, ranging from 0 (fully vegetated) to 100% (no vegetation).
A conceptive framework for quantifying the impacts of urbanization on vegetation growth
Referring to the proposed conceptive framework by Zhao et al. (2016), we distinguished the impacts of urbanization on vegetation growth on both sides, direct and indirect effects, using the urban-rural gradient approach. Previous studies suggest that the rural and free from built-up land effect is the region with a UI lower than 1% (Jia et al., 2021). The direct impacts were defined as the transformation from the underlying natural surface to the underlying urban surface and led to the loss of vegetation index (VI) in the rural-urban gradient, presenting during urban expansion. The indirect impact occurred during urban development, and primitive environmental changes may enhance or exacerbate remaining vegetation growth. Thus, the observed VI (Vobs) contained two parts: impacts and the calculation formula was as follows:
where β is urbanization intensity, the proportion of non-vegetation or impervious surface area in the pixel, Vobs is the observed VI in the urban pixel, ω reflects the total impact of urbanization on VI, Vv represents the background VI before urbanization, or (β = 0, VI = Vv), and Vnv represents the VI values of total impervious surface coverage pixels (β = 1, VI = Vnv). When expanding the urbanization impacts on VI for single to whole pixels, Vobs could emerge distinct corresponding along the urban intensity gradient from 0 to 100%. It is worth noting that Vv possibly included whole vegetation coverage pixels in urban areas where vegetation growth might be regulated by urban construction. However, such pixels are relatively fewer in quantity than rural areas, and their influence on Vv should be as small as possible.
Due to theoretical VI in a pixel reflecting contributions from vegetation and nonvegetative surfaces, the relationship between VI and urbanization should be linear without indirect impacts. Additionally, we applied the zero-impact straight line to define the variation of theoretical VI (Vzi). The zero-impact straight line was determined by Vv and Vnv
When plotting the Vobs of all pixels along the urbanization gradients, their practical distribution may not be completed following the zero-impact straight line, indicating the existence of indirect impacts. Any observed points above the zero-impact line can be considered the positive effect of urbanization on vegetation growth and vice versa.
According to the conceptive framework, the relative direct urbanization impact on vegetation growth was as follows:
And here, we can see that the relative direct impact of urbanization on vegetation photosynthesis was always negative.
The relative indirect impact of urbanization on vegetation photosynthesis was calculated with the following formula:
The VI changes after urbanization included both direct and indirect impacts. By comparing indirect VI changes (Vobs-Vzi) and direct VI changes (Vv-Vzi), we could quantify the extent to which growth changes caused by indirect impacts on remaining vegetation compensate (or aggravate) the productivity reduction caused by impervious buildings replacing the original ground surface (direct impacts).
The growth offset coefficient (τ) denotes the compensation capability of the remaining vegetation. τ > 0 represented that urbanization enhanced vegetation growth, and the remaining vegetation weakened the negative direct impacts of urbanization to some extent. On the other hand, τ < 0 illustrated that the negative direct impacts of urbanization would be exacerbated and further restrained vegetation growth.
The calculation of Vv and Vnv
The mean GPPmax and EVImax corresponding to fully vegetation coverage (Vv) and fully urbanized (Vnv) pixels are the essential parameters for determining the zero-impact line, which can be derived from the relationship of GPPmax and β or EVImax and β. GPPmax and EVImax values determined the two relationships within each urban intensity bin (interval of 1) in the YRDUA. This method ignores the physical location of the pixels, making it possible to continuously measure the urban gradient without being affected by the urban development direction. There were two ways to identify the Vv. The first uses the mean or median GPPmax and EVImax of all the fully vegetated pixels for the YRDUA. The second uses the intercept of regression between GPPmax and EVImax and urbanization intensity, respectively. We chose the second method because it could reflect the trend changes in GPPmax and EVImax more accurately and minimize the interference of GPPmax and EVImax outliers (Jia et al., 2018).
The GPPmax ~ β relationship and EVImax ~ β relationship were fitted by the cubic polynomial model, respectively: y = Vv + a1x + a2x2 + a3x3. X was β, where y was the observed GPPmax and EVImax. We found that low-order (order < 3) could not faithfully fit the trend, while higher orders might increasingly accept outliers. The good fitting of the cubic polynomial model demonstrated the significant correlation between vegetation photosynthesis and urbanization intensity and the suitability of Vv's determination across the YRDUA. Vnv is also classified into different main vegetation types across the study area. We calculated Vnv by the cubic polynomial model, respectively, and then checked these calculated Vnv in the high-resolution MAP WORLD (https://www.tianditu.gov.cn/) imagery to ensure no vegetation activity to avoid the uncertainties from outlier and uncertainties sourced from the urbanization maps.
Data analysis
We took the main vegetation types as the research objects. Before further analysis, we eliminated the cropland and null-value pixels due to the distribution of human activities and unavailable data in the YRDUA. These data are indicated by the white color in the figures. The mean for each property of urbanization intensity was computed at each 1% equal interval. GPPmax and EVImax were calculated by the Maximum Value Composition method (MVC). And the spatial analysis was calculated by the raster package (https://cran.r-project.org/web/packages/raster/index.html, accessed on October 1, 2021). The Spearman correlation test was used to calculate the relationships between vegetation and climate factors.
As one of the represented bagging integrated algorithms, the random forest could minimize outlier interference and obtain higher prediction accuracy (Lv and Feng, 2019). Thus, we employed the random forest algorithm to calculate the relative importance of climate factors to the dynamics variations of indirect impact (ωi) and growth offset (τ) in each pixel with the randomForest package (https://cran.r-project.org/web/packages/randomForest/index.html, accessed on November 1, 2021). We selected ωi and τ as response variables, and the daytime and nighttime land surface temperatures (LSTday and LSTnight), annual precipitation (Pre), solar radiation (Rad), and mean annual air temperature (Tair) as predictor variables. By randomly assigning one value to each predictor variable, we noticed that the model prediction error would increase after randomly replacing (%IncMSE). Higher %IncMSE means the higher importance of climate factors to ωi and τ variation. All statistical analyses were performed in the environment R4.02 (https://www.r-project.org/) and mapped in ArcGIS 10.2 (ESRI, Inc. 380 New York Street Redlands, CA 92373 USA).
Results
Spatial patterns of urbanization intensity, GPPmax, and EVImax
The mean UI of the YRDUA in 2020 was ~11.64%, with noticeable spatial differences. The highest UI was observed in the central and eastern regions, while the edges of urban agglomerations showed a relatively lower UI (Figure 2A). Vegetation GPPmax presented an increasing pattern from north to south. The vegetation GPPmax in the southeast of the YRDUA was more than 9 g C m−2 day−1 but lower than 3 g C m−2 day−1 in the north (Figure 2B). Overall, GPPmax decreased by 47% in urban areas (UI above 1%) relative to rural areas (UI lower than 1%). The spatial pattern of EVImax was generally consistent with that of GPPmax. EVImax decreased by 33% in urban areas (UI above 1%) relative to rural areas (UI lower than 1%) (Figure 2C).
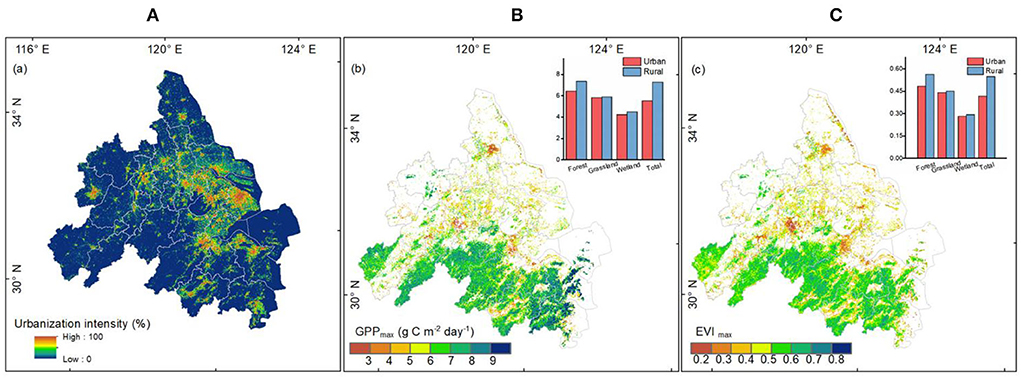
Figure 2. The spatial patterns of (A) urbanization intensity, (B) GPPmax, and (C) EVImax in YRDUA in 2020. The small map at the corner compares GPPmax and EVImax between urban and rural areas for the whole study area and the three main vegetation types.
The changes in GPPmax and EVImax across different UI gradients
Figure 3 shows the relationship between the GPPmax and EVImax with the UI in 2020. For the whole study area, both the GPPmax and the EVImax significantly and nonlinearly decreased along with increasing UI, as expected (P < 0.001) (Figures 3A,E). The polynomial regressions of the GPPmax-UI and EVImax-UI curves in different vegetation types were statistically significant (α < 0.05). However, evident variation existed in the shape of the GPPmax-UI and EVImax-UI relationships among the forest, grassland, and wetland. Specifically, GPPmax and EVImax were generally lower than the zero-impact lines for the forest ecosystem but higher than the zero-impact lines for most grassland and wetland ecosystems (Figures 3C,D,G,H), suggesting that the process of urbanization might benefit grassland and wetland vegetation growth in the YRDUA.
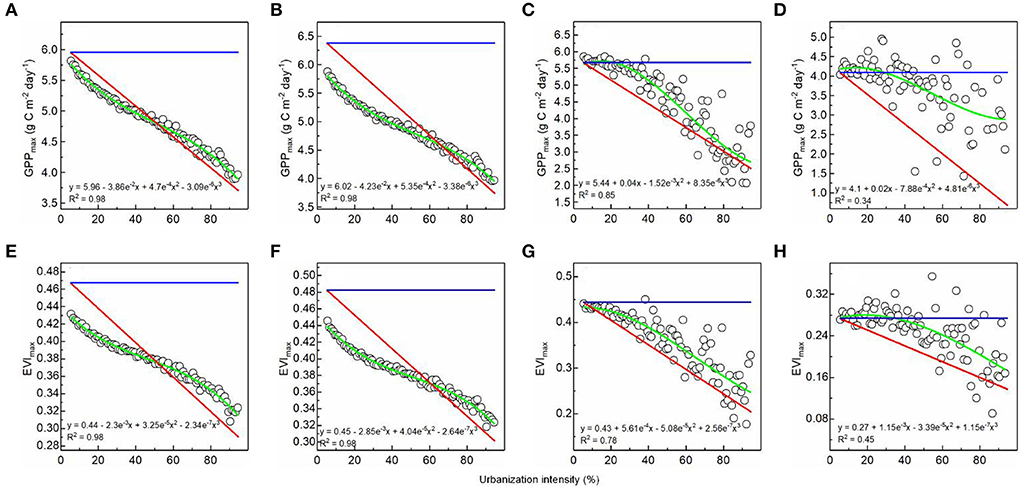
Figure 3. The impacts of the urbanization gradient on peak photosynthetic rates in the whole area (A,E), forest (B,F), grassland (C,G), and wetland (D,H). The green, red, and blue lines are the cubic regression of the observed GPPmax and EVImax (circles) with UI, the zero-impact line (Vzi, GPPmax, and EVImax without urbanization impact), and the background Vv, respectively.
Indirect impacts and growth offset of urbanization on GPPmax and EVImax
The change patterns along the urbanization gradients were analogous in both indirect impacts (ωi) and growth offset (τ) of urbanization on GPPmax and EVImax in the YRDUA. The negative ωi_GPPmax and ωi_EVImax were gradually weakened along the UI gradient for the entire study area, and higher UI exhibited a positive effect (Figures 4A,E). For different vegetation types, forest ωi_GPPmax and ωi_EVImax transitioned from negative to positive impacts when coupled with the rising UI gradient (Figures 4B,F). The indirect impacts for grassland and wetland integrally presented positive benefits to GPPmax and EVImax (Figures 4C,G,D,H).
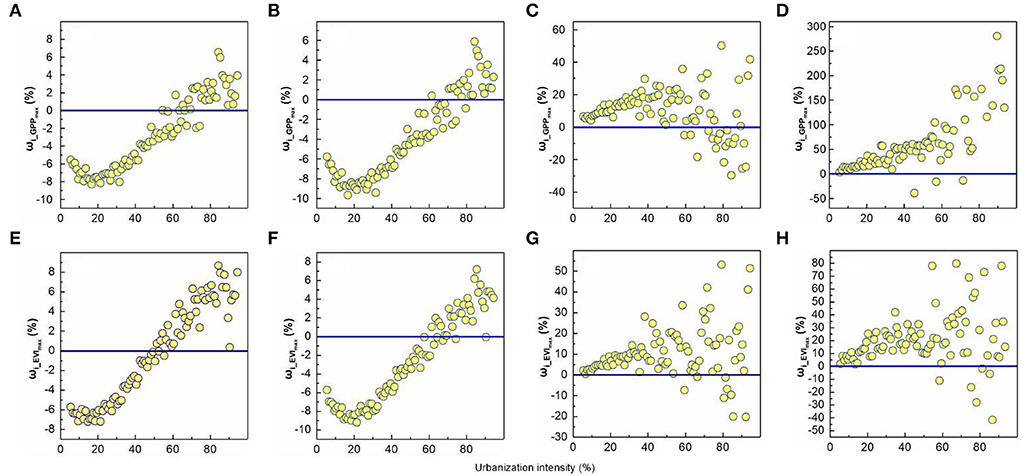
Figure 4. Relative indirect impacts of urbanization on GPPmax and EVImax along the urbanization gradient in the whole area (A,E), forest (B,F), grassland (C,G), and wetland areas (D,H) in 2020.
Both τGPPmax and τEVImax showed enhancement; subsequently, they remained relatively stable in higher UI throughout the study area (Figures 5A,E). However, the τGPPmax and τEVImax for remaining vegetation disturbed by ωi still worsened, with a 36.62% loss of GPPmax and a 30.47% loss of EVImax caused by direct impact. Forest τ gradually rose (Figures 5B,F), and grassland and wetland τ showed downward trends in the urban-rural gradient (Figures 5C,D,G,H). According to statistics, forest τGPPmax and τEVImax exacerbated 43.33% direct GPPmax loss and 47.45% direct EVImax loss severally. Grassland and wetland growth offset enhancements compensated about 47.18% (τgrasslandGPPmax), 34.22% (τgrsslandEVImax), 87.15% (τwetlandGPPmax), and 79.79% (τwetlandEVImax) for the direct GPPmax and EVImax loss, respectively.
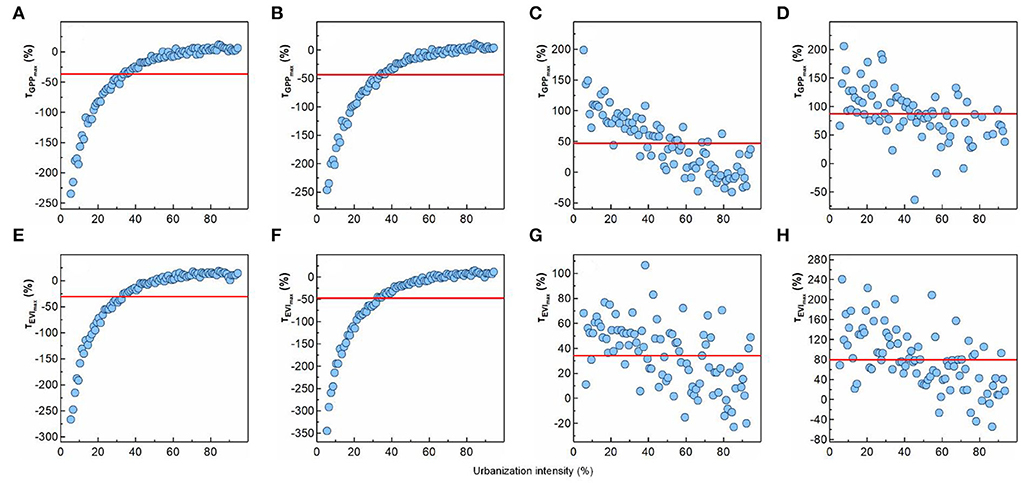
Figure 5. Growth offset of urbanization on GPPmax and EVImax along the urbanization gradient in the whole area (A,E), forest (B,F), grassland (C,G), and wetland (D,H) in 2020. The red line represents the mean values of the growth offset.
The relative importance of climate factors on indirect impacts (ωi) and growth offset (τ)
The correlation coefficients of ωi and τ with five responsible variables are displayed in Table 1. Regarding the entire study area, ωi and τ had stronger correlations with LSTday than the other four climatic variables. For different vegetation types, forest ωi and τ both showed significant positive correlations with LSTday (p < 0.05). Grassland ωi had weak correlations with LSTday, while τ showed significant negative correlations with LSTday. LSTday had more positive effects on wetland ωi, while it had more significant negative effects on wetland τ.
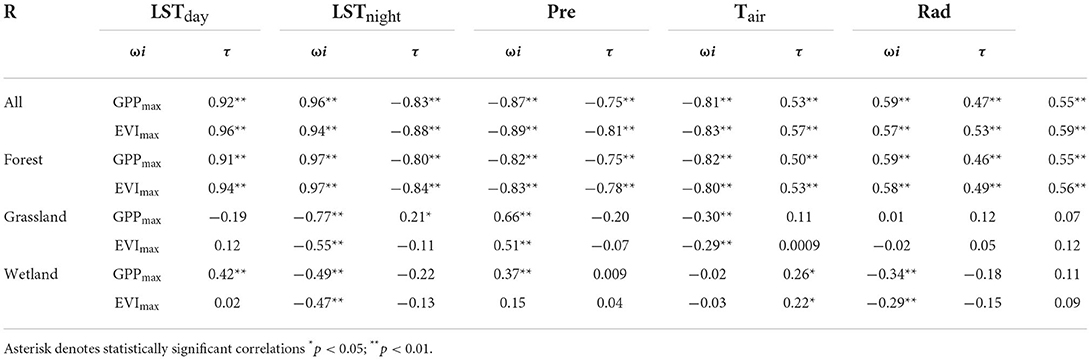
Table 1. Correlation analysis between the indirect impacts and growth offset of urbanization on GPPmax and EVImax and five responsible variables (LSTday, LSTnight, Pre, Rad, Tair, and Tem).
The Random Forest model was used to quantify the contributions of the five responsible variables (LSTday, LSTnight, Pre, Rad, Tair, Tem) concerning the relative importance of indirect impacts (ωi) and growth offset (τ) in vegetation GPPmax and EVImax. LSTday was the principal driver that dominated the variation of ωi and τ for the whole study area and different vegetation types (Figures 6, 7).
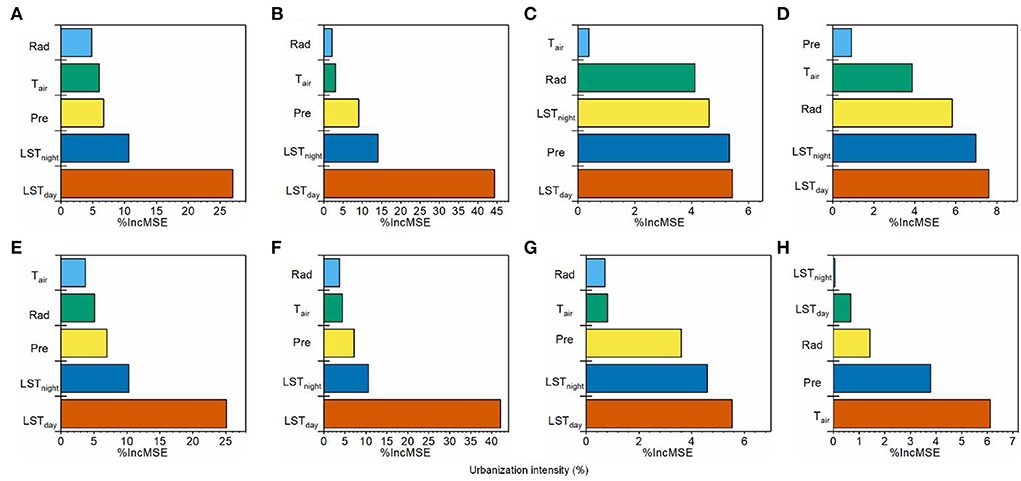
Figure 6. The relative importance of climatic factors to indirect impacts of urbanization on GPPmax and EVImax for the study area (A,E), forest (B,F), grassland (C,G), and wetland (D,H) in 2020. LSTday, land surface temperature of the day; LSTnight, land surface temperature of the night; Pre, annual precipitation; Tair, mean annual air temperature; Rad, solar radiation. The values were signed by the percentage increase of mean squared error (%IncMSE) in the RF model.
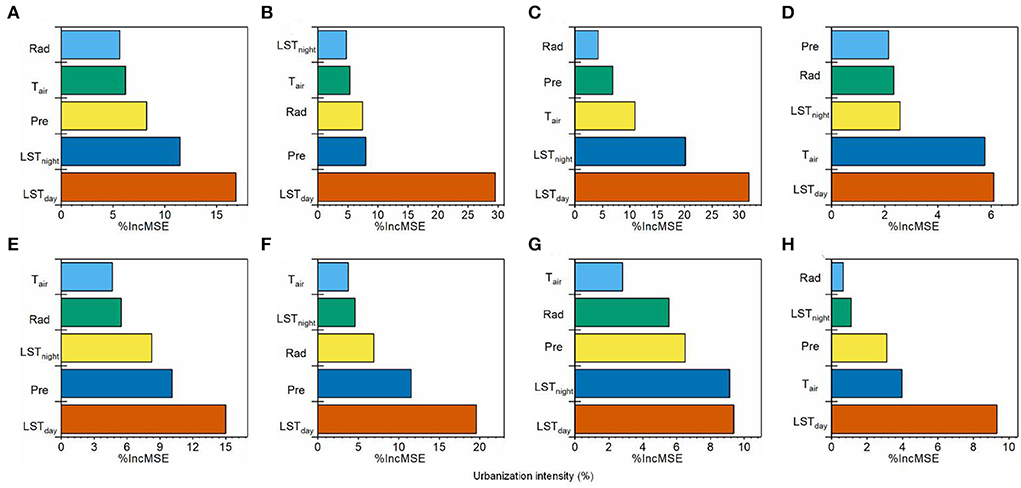
Figure 7. The relative importance of climatic factors to growth offset of urbanization on GPPmax and EVImax for the study area (A,E), forest (B,F), grassland (C,G), and wetland (D,H) in 2020. LSTday, land surface temperature of the day; LSTnight, land surface temperature of the night; Pre, annual precipitation; Tair, mean annual air temperature; Rad, solar radiation. The values were signed by the percentage increase of mean squared error (%IncMSE) in the RF model.
Discussion
In the context of urban expansion, it is crucial to understand urbanization's impacts on vegetation and the responses of vegetation growth to changing atmospheric and climatic conditions. In the Yangtze River Delta Urban Agglomeration (YRDUA), one of the most rapid urban development regions, urbanization's direct and indirect impacts on vegetation growth are still under debate. In this study, an urban-rural gradient approach based on remote-sensing techniques was used, in combination with vegetation productivity (GPP) and vegetation greenness (EVI), to detect the consequences of urbanization on vegetation photosynthesis across different vegetation types on the YRDUA.
First, we found that the distribution of vegetation photosynthesis along the urbanization gradient showed a significant overall downward trend from the whole study area to different vegetation types. This finding was similar to that of Zhou et al. (2015). They suggested that vegetation productivity in Nanjing decreased significantly with urban sprawl because urban development and expansion resulted in the shrinkage of vegetation area. Theoretically, the decreasing trend should be distributed linearly along with the UI (i.e., zero-impact liner). However, we found that actual vegetation photosynthesis declined nonlinearly, along with increasing UI in the YRDUA. This finding suggests that the indirect impacts of urbanization on plant growth are not negligible. Hence, it is essential to distinguish between direct and indirect impacts of the overall effects to identify the responses of vegetation photosynthesis to the changed environmental conditions due to urbanization (indirect impacts). Remote-sensing techniques could provide extensive observations of physical and biological processes (Pei et al., 2013). Vegetation productivity (GPP) and vegetation greenness (EVI) from remotely sensed data could be decomposed into contributions from vegetation and non-vegetative surfaces in an urban pixel and distinguish the direct and indirect impact of urbanization (Wang et al., 2010).
Second, we found that the responses of vegetation photosynthesis were vegetation-type dependent. For the whole YRDUA, urban environments had a negative effect on forest growth (ωi < 0), while grassland and wetland areas showed vegetation growth enhancement due to urbanization (ωi > 0). Specifically, the growth enhancement of grassland and wetland offset 47.08 and 87.23% loss of GPPmax, and 34.17 and 79.73% loss of EVImax due to reduction of vegetated surface area, respectively. Most previous studies have demonstrated that vegetation growth could be enhanced in urban regions compared to their rural counterparts. For example, Kaye et al. (2010) thought the urban-rural gradients presented a mass of driving factors variation at the site scale, such as atmospheric CO2 increase and urban heat island. These changes in urban atmospheric and climatic conditions increased grassland productivity in the urban sites by four to five times relative to surrounding rural sites. At the regional scale, growth enhancement was also observed by satellite records across the world's major cities (Zhang et al., 2022) and China's major cities (Zhao et al., 2016), especially in cold and arid regions. Meanwhile, we also found that the negative impacts of urbanization aggravated a 43.45% loss of GPPmax and a 47.55% loss of EVImax for the forest ecosystem. This result suggests that urban expansion does not necessarily promote plant growth and might even stunt plant growth, which was supported by Quigley (2004), who concluded that increased impervious surfaces could hinder street tree growth in central Ohio, USA. Thus, it can be seen that vegetation photosynthesis would be more complexly disturbed by environmental factors.
Last but not least, both correlation analysis and RF model revealed that the LSTday is far more critical than other climatic variables in controlling ω. This indicates that the daytime temperature mainly dominated the differences in vegetation photosynthesis across the urban-rural gradient. A study conducted in the Northern Hemisphere found that temperature was a regulating factor in lengthening photosynthetic seasons (Wang et al., 2019). In the YRDUA, Han and Xu (2013) also suggested that land surface temperature was essential in affecting vegetation phenology. Compared with other climatic variables, LST showed a stronger relationship with the urban environment and controlled the exchanges of energy and water between the surface and the atmosphere (Arnfield, 2003; Han and Xu, 2013). Therefore, vegetation physiology processes might be more sensitive to the variation of LSTday, experiencing longer growth season lengths and a more robust maximum capacity of CO2 uptake (Zhou et al., 2016; Wu et al., 2019). In our study, the spatial pattern of LSTday correlated negatively with the fraction of vegetation coverage, indicating that a higher UI experienced higher temperatures than surrounding areas. Therefore, in high UI regions, we found a prevalent enhancement of forest growth because the rising LSTday increased vegetation photosynthetic rate to some extent and partly compensated for the negative direct impact of urbanization. However, we also observed the negative impacts of urbanization on vegetation growth on grassland and wetland in high UI environments. This inhibitory phenomenon could be interpreted by the fact that the temperature may exceed the optimum temperature for vegetation growth, resulting in the decreased capacity of grassland and wetland growth offset (Huang et al., 2019).
It must be noted that our study has some limitations for further improvement. Based on satellite records, we attempted to reveal the consequences of urbanization on vegetation photosynthesis. Although remote sensing approaches provided holistic evidence of the impacts of urbanization on plant growth at a large scale, they could not reveal the underlying mechanisms at the process and ecosystem levels. In the future, we call for more complementary studies at the local scale with the combination of higher resolution remote sensing data and field surveys to investigate the possible mechanisms of urbanization's imprint on vegetation photosynthesis. Besides, cities in the YRDUA are experiencing complicated climatic and atmospheric changes, such as urban warming accompanied by precipitation pattern changes and elevated atmospheric CO2 concentration. However, our study did not explore the effect of the rising CO2 concentration on vegetation photosynthesis due to the lack of high spatial and temporal resolution data. Therefore, the interactions between environmental drivers and vegetation growth should be investigated in the future to investigate the key drivers of vegetation growth in urban areas.
Conclusion
This study distinguished the direct and indirect impacts of urbanization on vegetation photosynthesis for different vegetation types on the YRDUA. We also quantified the dominant factor for vegetation photosynthesis dynamic. The results showed that current urbanization conditions impaired vegetation photosynthesis of forests but improved vegetation photosynthesis of grassland and wetland. LSTday dominated vegetation photosynthesis dynamics and had the largest contribution to vegetation growth offset. Our findings suggest that appropriate measures are required to alleviate environmental stresses resulting from urbanization.
Data availability statement
The original contributions presented in the study are included in the article/supplementary material, further inquiries can be directed to the corresponding author/s.
Author contributions
ML conceptualized this study. ML and HY collected and analyzed the data. HY wrote the manuscript. JZ, XK, GD, BM, and SY interpreted the results and revised the text. All authors have read and agreed to the published version of this manuscript.
Funding
This study was supported by Natural Science Foundation of Jiangsu Province (BK20201439) and the Studying on Nantong water Chal-a remote sensing monitoring based on UAV aerial photography technology and high-resolution satellite remote sensing data (MS12021086).
Acknowledgments
We acknowledge the support of all co-authors for their constructive and helpful comments and the organization of this study.
Conflict of interest
The authors declare that the research was conducted in the absence of any commercial or financial relationships that could be construed as a potential conflict of interest.
Publisher's note
All claims expressed in this article are solely those of the authors and do not necessarily represent those of their affiliated organizations, or those of the publisher, the editors and the reviewers. Any product that may be evaluated in this article, or claim that may be made by its manufacturer, is not guaranteed or endorsed by the publisher.
References
Arnfield, A. J. (2003). Two decades of urban climate research: a review of turbulence, exchanges of energy and water, and the urban heat island. Int. J. Climatol. 23, 1–26. doi: 10.1002/joc.859
Calfapietra, C., Peuelas, J., and Niinemets, L. (2015). Urban plant physiology: adaptation-mitigation strategies under permanent stress - ScienceDirect. Trends Plant Sci. 20, 72–75. doi: 10.1016/j.tplants.2014.11.001
Dewan, A., and Yamaguchi, Y. (2009). Land use and land cover change in Greater Dhaka, Bangladesh: using remote sensing to promote sustainable urbanization. Appl. Geogr. 29, 401. doi: 10.1016/j.apgeog.2008.12.005
Fu, Y., Lu, X., Zhao, Y., Zeng, X., and Xia, L. (2013). Assessment impacts of weather and land use/land cover (LULC) change on urban vegetation net primary productivity (NPP): A Case Study in Guangzhou, China. Remote Sens. 5, 4125–4144. doi: 10.3390/rs5084125
Fu, Z., Stoy, P. C., Poulter, B., Gerken, T., Zhang, Z., Wakbulcho, G., et al. (2019). Maximum carbon uptake rate dominates the interannual variability of global net ecosystem exchange. Glob. Change Biol. 25, 3381–3394. doi: 10.1111/gcb.14731
Gregg, J. W., Jones, C. G., and Dawson, T. E. (2003). Urbanization effects on tree growth in the vicinity of New York City. Nature 424, 183–187. doi: 10.1038/nature01728
Han, G., and Xu, J. (2013). Land surface phenology and land surface temperature changes along an urban–rural gradient in Yangtze River Delta, China. Environ. Manage. 52, 234–249. doi: 10.1007/s00267-013-0097-6
Hu, Z., Piao, S., Knapp, A. K., Wang, X., Peng, S., Yuan, W., et al. (2022). Decoupling of greenness and gross primary productivity as aridity decreases. Remote Sens. Environ. 279, 113120. doi: 10.1016/j.rse.2022.113120
Huang, M., Piao, S., Philippe, C., Josep, P., Wang, X., F, K. T., et al. (2019). Air temperature optima of vegetation productivity across global biomes. Nat. Ecol. Evol. 3, 772–779. doi: 10.1038/s41559-019-0838-x
Jia, W., Zhao, S., and Liu, S. (2018). Vegetation growth enhancement in urban environments of the Conterminous United States. Glob. Change Biol. 24, 4084–4094. doi: 10.1111/gcb.14317
Jia, W., Zhao, S., Zhang, X., Liu, S., Henebry, G. M., and Liu, L. (2021). Urbanization imprint on land surface phenology: the urban–rural gradient analysis for Chinese cities. Glob. Change Biol. 27, 2895–2904. doi: 10.1111/gcb.15602
Kaye, J. P. M., Cc Ulley, R. L., and Burke, I. C. (2010). Carbon fluxes, nitrogen cycling, and soil microbial communities in adjacent urban, native and agricultural ecosystems. Glob. Change Biol. 11, 575–587. doi: 10.1111/j.1365-2486.2005.00921.x
Li, J., Wang, Z., Lai, C., Wu, X., Zeng, Z., Chen, X., et al. (2018). Response of net primary production to land use and land cover change in mainland China since the late 1980s. Sci. Total Environ. 639, 237–247. doi: 10.1016/j.scitotenv.2018.05.155
Liu, Y., Wang, Y., Peng, J., Du, Y., Liu, X., Li, S., et al. (2015). Correlations between urbanization and vegetation degradation across the world's metropolises using DMSP/OLS nighttime light data. Remote Sens. 7, 2067–2088. doi: 10.3390/rs70202067
Lohse, K. A., Hope, D., Sponseller, R., Allen, J. O., and Grimm, N. B. (2008). Atmospheric deposition of carbon and nutrients across an and metropolitan area. Sci. Total Environ. 402, 95–105. doi: 10.1016/j.scitotenv.2008.04.044
Luo, D., Liang, L., Wang, Z., Chen, L., and Zhang, F. (2021). Exploration of coupling effects in the Economy–Society–Environment system in urban areas: Case study of the Yangtze River Delta Urban Agglomeration. Ecol. Indic. 128:107858. doi: 10.1016/j.ecolind.2021.107858
Luo, J., Ying, K., and Bai, J. (2005). Savitzky–Golay smoothing and differentiation filter for even number data. Signal. Process. 85, 1429–1434. doi: 10.1016/j.sigpro.2005.02.002
Lv, H., and Feng, Q. (2019). A review of random forests algorithm. J. Hebei Acad. Sci. 36, 37–41. doi: 10.16191/j.cnki.hbkx.2019.03.005
Pei, F., Li, X., Liu, X., Wang, S., and He, Z. (2013). Assessing the differences in net primary productivity between pre- and post-urban land development in China. Agr. Forest Meteorol. 171–172, 174–186. doi: 10.1016/j.agrformet.2012.12.003
Peng, S., Ding, Y., Liu, W., and Li, Z. (2019). 1 km monthly temperature and precipitation dataset for China from 1901 to 2017. Earth Syst. Sci. Data 11, 1931–1946. doi: 10.5194/essd-11-1931-2019
Peng, S., Piao, S., Ciais, P., Friedlingstein, P., Ottle, C., Breon, F. M., et al. (2012). Surface urban heat island across 419 global big cities. Environ. Sci. Technol. 46, 696–703. doi: 10.1021/es2030438
Pretzsch, H., Biber, P., Uhl, E., Dahlhausen, J., Schütze, G., Perkins, D., et al. (2017). Climate change accelerates growth of urban trees in metropolises worldwide. Sci. Rep. 7, 15403. doi: 10.1038/s41598-017-14831-w
Quigley, M. F. (2002). Franklin Park: 150 years of changing design, disturbance, and impact on tree growth. Urban Ecosyst. 6, 223–235. doi: 10.1023/A:1026157629609
Quigley, M. F. (2004). Street trees and rural conspecifics: will long-lived trees reach full size in urban conditions? Urban Ecosyst. 7, 29–39. doi: 10.1023/B:UECO.0000020170.58404.e9
Schwandner, F. M., Gunson, M. R., Miller, C. E., Carn, S. A., Eldering, A., Krings, T., et al. (2017). Spaceborne detection of localized carbon dioxide sources. Science 358, eaam5782. doi: 10.1126/science.aam5782
Si, P., Liang, D., and Chenkaihua Luo, C. (2021). Urbanization effect on average and extreme temperature warming in tianjin during the last 60 years. Climat. Environ. Res. 26, 142–154. doi: 10.3878/j.issn.1006-9585.2020.20060
Wang, H., Jia, G., Fu, C., Feng, J., Zhao, T., and Ma, Z. (2010). Deriving maximal light use efficiency from coordinated flux measurements and satellite data for regional gross primary production modeling. Remote Sens. Environ. 114, 2248–2258. doi: 10.1016/j.rse.2010.05.001
Wang, S., Weimin, J., Josep, P., Alessandro, C., Zhou, Y., Fu, Y., et al. (2019). Urban–rural gradients reveal joint control of elevated CO2 and temperature on extended photosynthetic seasons. Nat. Ecol. Evol. 3, 1076–1085. doi: 10.1038/s41559-019-0931-1
Wu, Y., Tang, G., Gu, H., Liu, Y., Yang, M., and Sun, L. (2019). The variation of vegetation greenness and underlying mechanisms in Guangdong province of China during 2001–2013 based on MODIS data. Sci. Total Environ. 653, 536–546. doi: 10.1016/j.scitotenv.2018.10.380
Xia, J., Niu, S., Ciais, P., Janssens, I. A., Chen, J., Ammann, C., et al. (2015). Joint control of terrestrial gross primary productivity by plant phenology and physiology. Proc. Natl. Acad. Sci. U. S. A. 112, 2788–2793. doi: 10.1073/pnas.1413090112
Youngsteadt, E., Dale, A. G., Terando, A. J., Dunn, R. R., and Frank, S. D. (2015). Do cities simulate climate change? A comparison of herbivore response to urban and global warming. Glob. Change Biol. 21, 97–105. doi: 10.1111/gcb.12692
Zhang, C., Tian, H., Chen, G., Chappelka, A., Xu, X., Ren, W., et al. (2012). Impacts of urbanization on carbon balance in terrestrial ecosystems of the Southern United States. Environ. Pollut. 164, 89–101. doi: 10.1016/j.envpol.2012.01.020
Zhang, L., Yang, L., Zohner, C. M., Crowther, T. W., Li, M., Shen, F., et al. (2022). Direct and indirect impacts of urbanization on vegetation growth across the world's cities. Sci. Adv. 8, eabo0095. doi: 10.1126/sciadv.abo0095
Zhang, X., Liu, L., Chen, X., Gao, Y., and Mi, J. (2020). GLC_FCS30: global land-cover product with fine classification system at 30 m using time-series landsat imagery. Earth syst. Sci. 13, 2753–2776. doi: 10.5194/essd-2020-182
Zhao, S., Liu, S., and Zhou, D. (2016). Prevalent vegetation growth enhancement in urban environment. Proc. Natl. Acad. Sci. U. S. A. 113, 6313–6318. doi: 10.1073/pnas.1602312113
Zhong, Q., Ma, J., Zhao, B., Wang, X., Zong, J., and Xiao, X. (2019). Assessing spatial-temporal dynamics of urban expansion, vegetation greenness and photosynthesis in megacity Shanghai, China during 2000-2016. Remote Sens. Environ. 233, 111374. doi: 10.1016/j.rse.2019.111374
Zhou, D., Zhao, S., Liu, S., Zhang, L., and Zhu, C. (2014). Surface urban heat island in China's 32 major cities: spatial patterns and drivers. Remote Sens. Environ. 152, 51–61. doi: 10.1016/j.rse.2014.05.017
Zhou, D., Zhao, S., Zhang, L., and Liu, S. (2016). Remotely sensed assessment of urbanization effects on vegetation phenology in China's 32 major cities. Remote Sens. Environ. 176, 272–281. doi: 10.1016/j.rse.2016.02.010
Zhou, Y., Xing, B., and Ju, W. (2015). Assessing the impact of urban sprawl on net primary productivity of terrestrial ecosystems using a process-based model—A Case Study in Nanjing, China. IEEE J. Select. Top. Appl. Earth Obs. Remote Sens. 8, 2318–2331. doi: 10.1109/JSTARS.2015.2440274
Keywords: carbon cycles, urbanization intensity, vegetation photosynthesis, the daytime land surface temperature, the Yangtze River Delta
Citation: Yu H, Zhang J, Kong X, Du G, Meng B, Li M and Yi S (2022) The consequences of urbanization on vegetation photosynthesis in the Yangtze River Delta, China. Front. For. Glob. Change 5:996197. doi: 10.3389/ffgc.2022.996197
Received: 17 July 2022; Accepted: 31 August 2022;
Published: 23 September 2022.
Edited by:
Hongfang Zhao, East China Normal University, ChinaReviewed by:
Shoubao Geng, Guangzhou Institute of Geography, ChinaYan Sun, Beijing Forestry University, China
Copyright © 2022 Yu, Zhang, Kong, Du, Meng, Li and Yi. This is an open-access article distributed under the terms of the Creative Commons Attribution License (CC BY). The use, distribution or reproduction in other forums is permitted, provided the original author(s) and the copyright owner(s) are credited and that the original publication in this journal is cited, in accordance with accepted academic practice. No use, distribution or reproduction is permitted which does not comply with these terms.
*Correspondence: Meng Li, bGltZW5nQG50dS5lZHUuY24=