 Laura L. Bourgeau-Chavez
 Jeremy A. Graham
 Dorthea J. L. Vander Bilt
 Michael J. Battaglia
- Michigan Tech Research Institute, Michigan Technological University, Ann Arbor, MI, United States
Climate warming and changing fire regimes in the North American boreal zone have the capacity to alter the hydrology and ecology of the landscape with long term consequences to peatland ecosystems and their traditional role as carbon sinks. It is important to understand how peatlands are affected by wildfire in relation to both extent of burn and severity of burn to the organic soil (peat) layers where most of the C is stored. Peatlands cover more than 75% of the landscape in the southern Northwest Territories, Canada where extreme drought led to widespread wildfires in 2014–2015. To assess the wildfire effects across a 14.6 million ha study area including 136 wildfire events, we used an integration of field data collection, land cover mapping of peatland and upland ecotypes, Landsat-8-based mapping of burn severity to the soil organic layers, and MODIS-hotspot mapping of fire progression for season of burning. The intersection of these geospatial products allows for a broadscale assessment of wildfire effects across gradients of ecotype, ecoregions, seasons, and year of burn. Using a series of chi-squared goodness of fit tests, we found that peatlands are more susceptible to wildfire on the Taiga shield where they are smaller and hydrologically isolated by the rocky landscape. There burning affected proportionally larger peat areas with an evenness of burn severity to the organic soil layers which may lead to less spatial diversity in post-fire recovery, making the landscape less resilient to future fire. The most resilient peatlands are expected to be hydrologically well-connected to both ground water systems and larger peatland complexes such as those on the Taiga plains which exhibited large unburned and singed patches across the landscape, and greater variability in burn severity across seasons and ecotypes. Understanding the tipping point of drought conditions at which the landscape becomes connected, and peatlands are susceptible to wildfire with deeper burning of the organic soil layers is important for understanding the potential future effects of climate change and projected increases in wildfire on peatlands. This is critical for C accounting and climate mitigation strategies.
1 Introduction
The climate of the North American boreal ecozone is continuing to warm, with more extreme weather events and increased frequency of wildfire that is burning larger areas with lengthened fire seasons (Kasischke and Turetsky, 2006; Kasischke et al., 2010; Hanes et al., 2019). Such changes in fire regime have the potential to alter the landscape as we know it, with long-term consequences for landscape hydrology and ecology. As a whole, global trends in wildfire have been observed as decreasing in area burned (Andela et al., 2017) and fire frequency (Chuvieco et al., 2021), however, the trends vary regionally. Within boreal Canada there is geographic heterogeneity in wildfire trends. The eastern zones of Canada show stable or decreasing trends in wildfire while increases in area burned occur predominantly in western Canada (Hanes et al., 2019). Here the effects of widespread warming have been observed as more extreme heat, less extreme cold, longer growing seasons, shorter periods of snow and ice cover, earlier springs, and thawing permafrost (Bush and Lemmen, 2019). All of these changes have consequences for water table depths and fuel moisture patterns across the landscape, but when and where drought will occur and how the frequency may change is more difficult to predict. Understanding how these changes affect boreal systems, their ecological function, carbon cycling, wildlife habitat, fire regimes, and successional trajectories have all been topics of recent research (Rogers et al., 2015, 2020; Veraverbeke et al., 2017; Sulla-Menashe et al., 2018; Whitman et al., 2018; Boelman et al., 2019; Marchand et al., 2019; Thompson et al., 2019; Spence et al., 2020; Walker et al., 2020a,b; Baltzer et al., 2021). The effects of a changing climate, in particular drought on peatland wildfire (Thompson et al., 2019), as well as an understanding of peatland-fire interactions (Nelson et al., 2021), have been topics of little research until recently. Most research related to climate and wildfire has focused on upland systems.
Historically, a positive relationship between drought and wildfire events has been observed, with increasing forest fire occurrence and area burned under drought conditions in the presence of ignition sources (Littell et al., 2016). Weather, climate and lightning are major drivers of wildfire activity in Canada and the regions with the highest wildfire occurrence often overlap with regions of highest peatland cover (Boulanger et al., 2014; Thompson et al., 2019). But it is continuity and flammability of fuels that allows fires to spread once a fire ignites. The relationship between drought and burn severity, particularly in lowland ecosystems, is not well-known (Littell et al., 2016). We define burn severity as the degree of burn to the vegetation, organic surface, and soil layers. The drivers of field-scale burn severity are primarily topo-edaphic factors, fuel availability, fuel moisture, and fire weather at the time of burning (Whitman et al., 2018).
In 2014, extreme drought conditions (as measured by the Canadian Forest Fire Danger Rating System–CFFDRS) of southern Northwest Territories (NWT) and northern Alberta led to wildfires that burned a record-breaking areal extent. In the winter-spring of 2013–2014, precipitation was as much as 50% drier than normal and temperatures were 0.5–3°C below normal (Kochtubajda et al., 2019). During that summer, precipitation remained scarce and temperatures were higher than normal. In NWT, 385 wildfires occurred in 2014, affecting a record 3.4 million ha (CCFM: National Forestry Database). This is nearly 1.75 times the annual average area burned in all of Canada (1.96 M ha; Hanes et al., 2019). The dominant ignition source was lightning, with the first detection on 14 May, and subsequent occurrences nearly every day somewhere in NWT until early September (Kochtubajda et al., 2019). A total of 154,000 lightning flashes were detected in NWT in 2014, compared to the average of less than half that, 71,000 (Kochtubajda et al., 2019). This consistent source of ignition was a main driver of widespread wildfire in the presence of drought. Conditions continued to remain dry at the start of the 2015 fire year, with much lower than normal rainfall in Yellowknife (on the northern edge of Great Slave Lake, Figure 1) until August, and lower than normal at Hay River (at the southwestern edge of Great Slave Lake, Figure 1) until July. In both 2014 and 2015, the CFFDRS fuel weather index’s drought code reached values of 750, indicative of extreme drought (Whitman et al., 2018; Thompson et al., 2019). The 2015 fire season turned out to be a more normal year with 646,955 ha burning (CCFM: National Forestry Database). In both years, fires occurred across gradients of ecoregions, seasons, and diverse fuel complexes from upland to peatland and even emergent wetlands. This leads to an overarching question: Are peatlands as vulnerable to burning as upland areas during the extreme drought of 2014–2015?
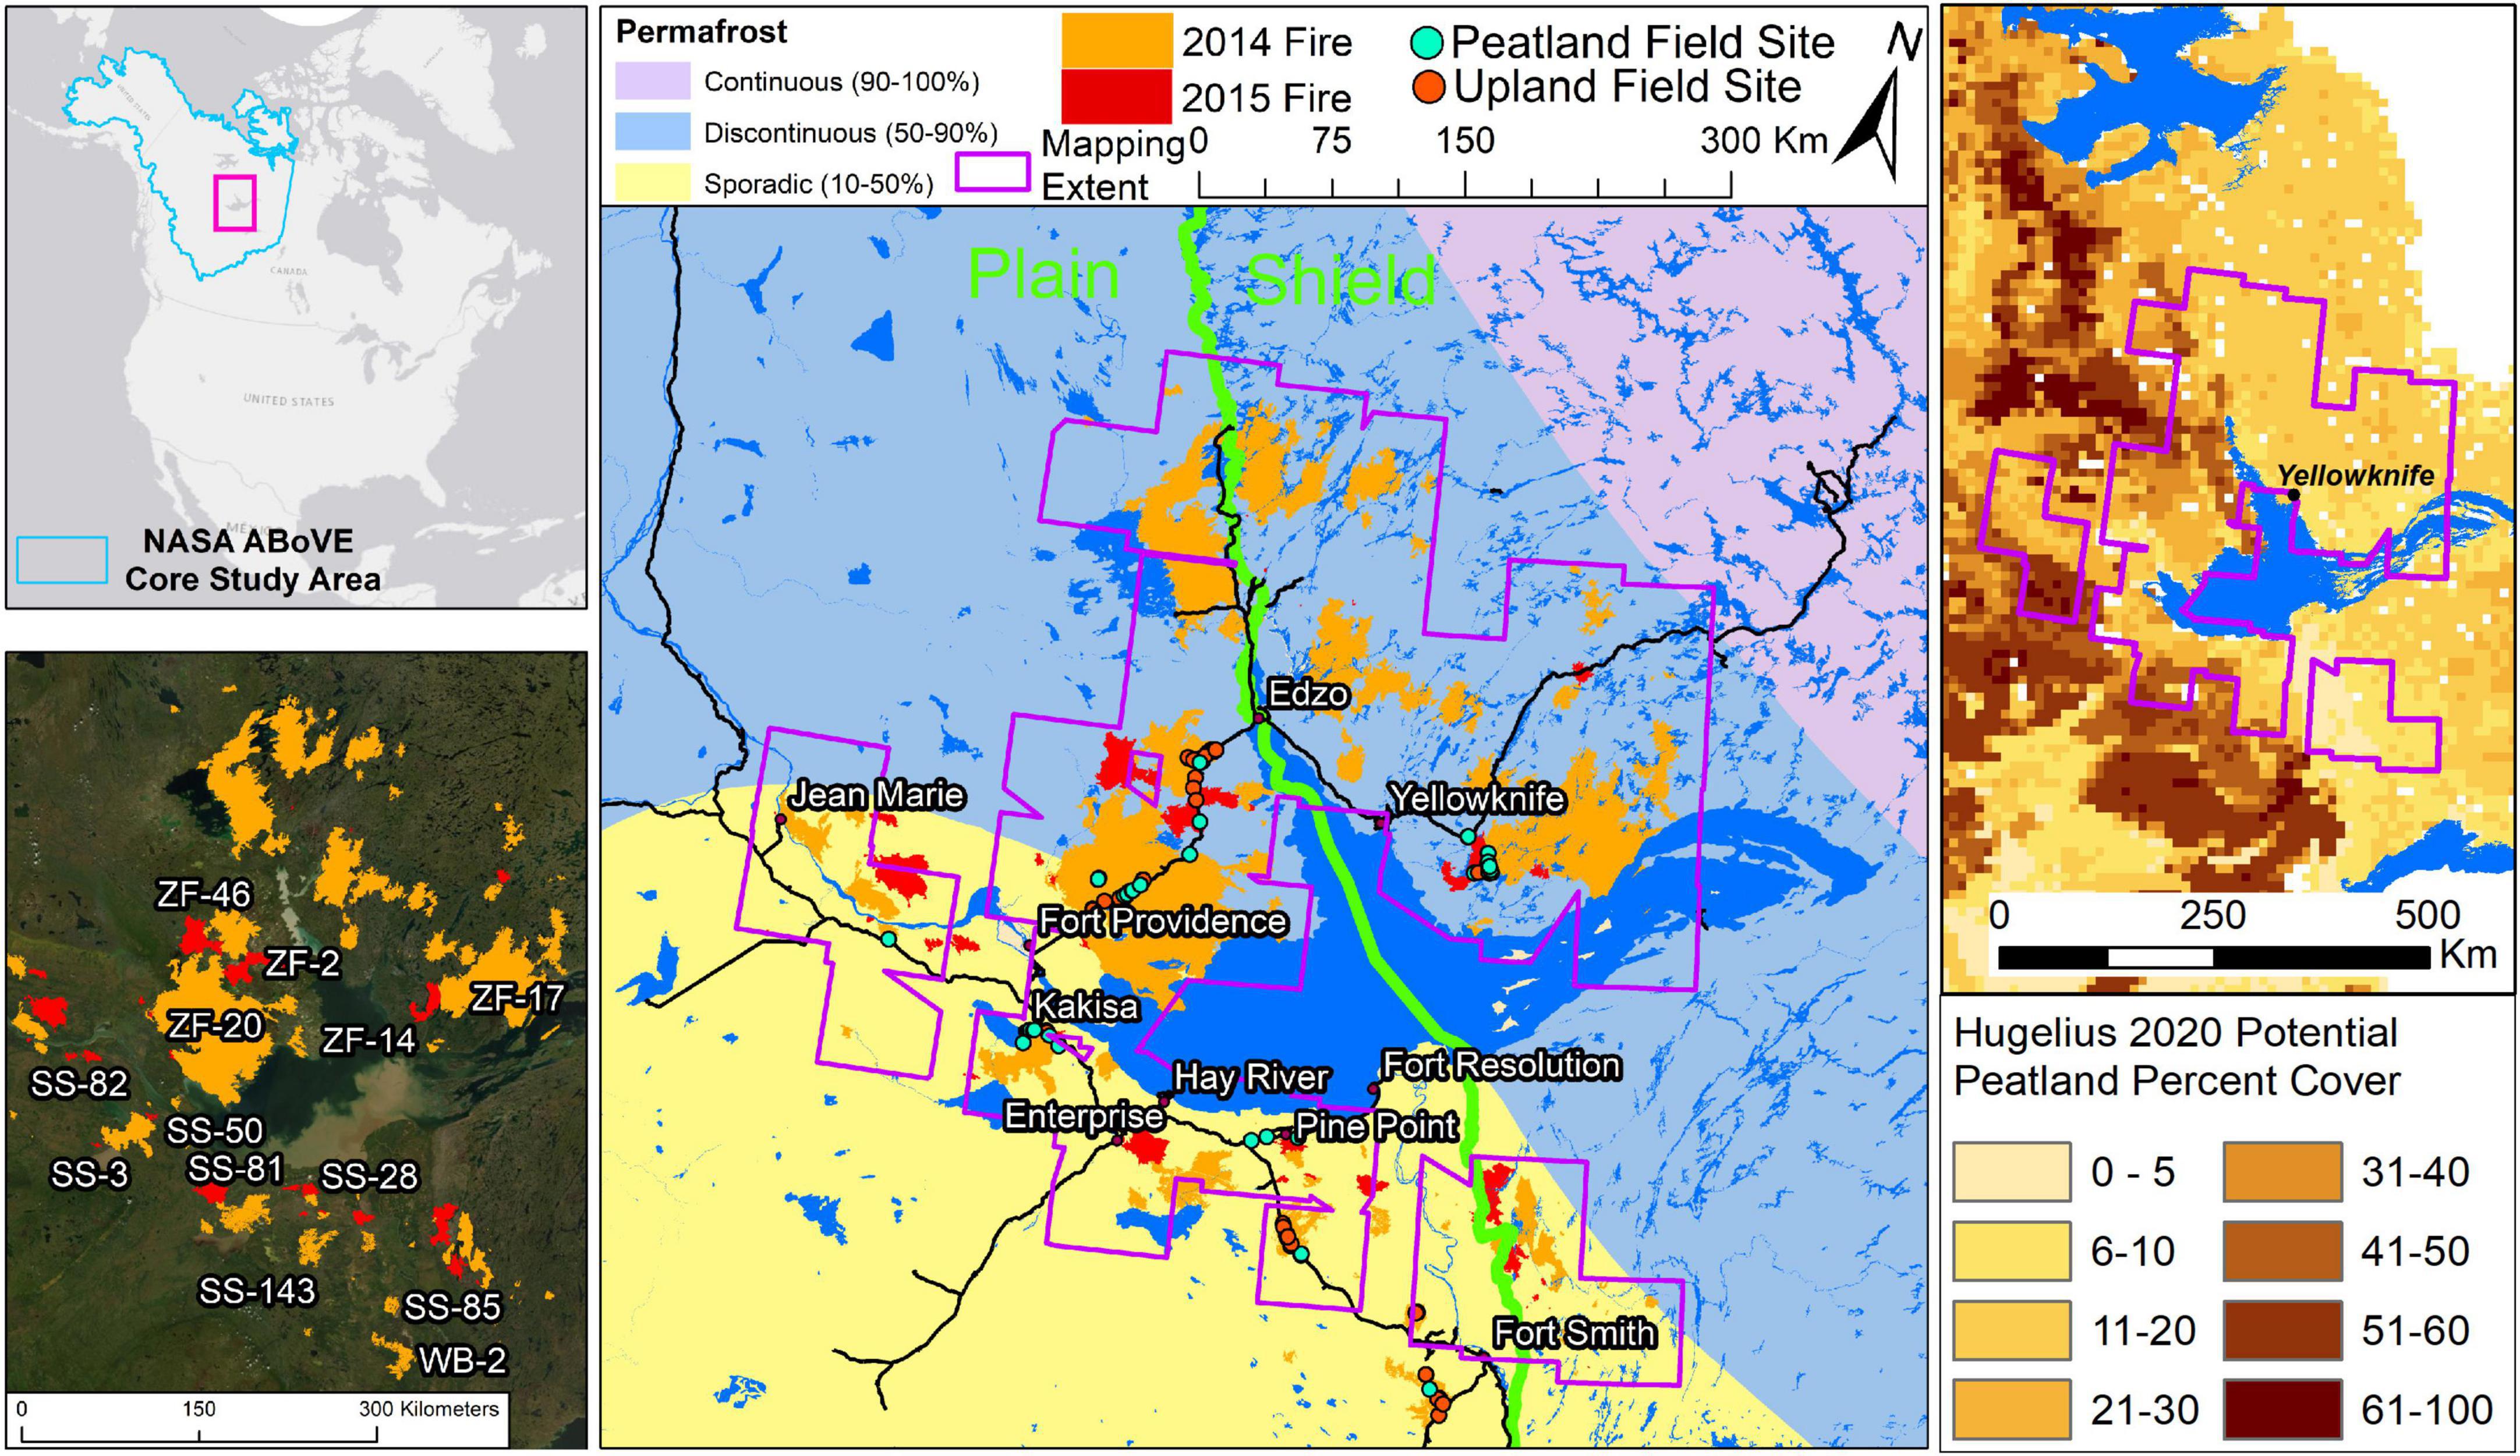
Figure 1. Map of Northwest Territories and northern Alberta showing 136 wildfires (2014–2015) within the study area around the Great Slave Lake and boundaries of ecoregions, permafrost zones, and location of field sites.
To address our overarching question, we focus on a geospatial analysis of remote sensing and field data and ask two specific research questions with associated hypotheses:
1) What are the patterns of burned areas across the landscape and which ecotypes may be acting as fire refugia, especially in areas with extensive peatlands?
2) How do the landscape patterns of burn severity vary by ecoregion, ecotype, season of burn, and year of burn?
1.1 Unburned islands hypothesis
Based on previous research in the study region (e.g., Burton et al., 2008) we expect the total area left unburned within fire events to be on average proportional to fire size. Upland conifer is expected to have fewer unburned islands within fire perimeters due to their landscape position, better drained soil conditions and flammability. Unburned islands are expected to be predominantly within wetter sites and those with lower fuel loading (e.g., open fens and marshes) but also further in proximity from upland conifer.
1.2 Ecoregion hypothesis
Discontinuous fuels of the Taiga shield (fragmentated with water bodies and rock) are expected to result in less area and less severe burning, while the continuous fuels of the plains should result in more area and deeper burning in drought conditions.
1.3 Ecotype hypothesis
Vegetation structure and configuration, soil organic layer (SOL) and vegetation fuel moisture conditions, and water table depths all serve as important local controls on fire behavior and severity. Therefore, in peatland-rich landscapes, the more continuous fuel loadings of forested peatlands (bogs and poor fens) should be associated with greater burned areas and organic matter consumption rates in drought conditions relative to unforested sedge dominated (open) or shrubby peatlands. Upland conifer is expected to have more area and severe burning than other ecotypes, while open fens should burn the least area and severely due to high water tables and lack of forest fuels (trees < 7% cover).
1.4 Fire seasonality hypothesis
Later season fires when water table drawdown has occurred are expected to be more severe with greater surface fuel consumption than early season fires, particularly in the lowland systems (e.g., Turetsky et al., 2011).
1.5 Year of fire hypothesis
The large fires of 2014 are expected to have deep burning due to widespread drought and because large fires often experience greater burn severity (Walker et al., 2018). While the 2015 fires were of much smaller size, they also occurred after 2 consecutive years of drought which could also result in high severity burning.
1.6 Extreme drought/continuity of fuels hypothesis
In extreme drought conditions, there is an expectation for continuity of fuels across uplands and lowlands (i.e., peatlands/wetlands) that allows widespread burning with fewer unburned islands. As water table drawdown exceeds depths of 40 cm (Thompson et al., 2019) in boreal moss dominated sites there should be drying of surface fuels and vegetation to allow continuity of fuels. Under such extreme dry conditions, reduction of fine-scale heterogeneity of burn severity may also occur (e.g., Littell et al., 2016).
2 Materials and methods
To answer our research questions and test our hypotheses, we used an integration of field data collection, land cover mapping of peatland and upland ecotypes (Bourgeau-Chavez et al., 2017, 2019), Landsat-8-based mapping of burn severity to the soil organic layers (French et al., 2020a,b), and MODIS-hotspot mapping of fire progression for season of burning (Loboda and Csiszar, 2007; Bourgeau-Chavez et al., 2015, 2016). The fires of the boreal region are dominated by crown fires, which allowed us to assess the burn severity to the soil organic layers (SOL) from Landsat (French et al., 2020a). The intersection of these maps allows for a geospatial assessment of the wildfire effects across the gradients of seasons of fire, ecoregions, fire year, ecosystem types, as well as landscape position (see Appendix).
Peatland vulnerability to fire was assessed in a series of 136 wildfires that burned in 2014–2015 in NWT/Alberta, in the context of two of the elements of ecosystem vulnerability (Vaillant et al., 2016; Weißhuhn et al., 2018) including:
1. Exposure to the stressor, which in our analysis is the probability of exposure of an ecotype to wildfire disturbance, measured by area burned; and
2. Sensitivity to a range of stressor intensities, which is the sensitivity of the landscape to a range of fire intensities measured as post-fire effects, mainly burn severity.
Here we focus on exposure to address research question 1 and sensitivity to address research question 2 across a broad range of fires on the Taiga shield and Taiga plains ecoregions around the Great Slave Lake (Figure 1).
2.1 Study area
Although wildfire affected a much larger region of NWT and Alberta in 2014–2015, our study area encompasses a 14.6 million ha peat-rich study area located around the Great Slave Lake of southern Northwest Territories (NWT) and northern Alberta, which was affected by more than 136 wildfires in 2014–2015 (Figure 1). This area is in the discontinuous and sporadic permafrost zones, crosses between the Taiga shield and Taiga plains ecoregions, and has large peat-rich complexes intermixed with mosaics of upland forested ecosystems (Figure 1). The Taiga plains is described as flat plains with broad lowlands and plateaus intermixed with some lakes (23% cover, Burton et al., 2008). The lowlands of this ecoregion are characterized by very dense soils transitioning to coarse well-drained conditions on the uplands. The deep lacustrine and glacial sedimentary deposits of this region enable deep groundwater inputs in fen ecosystems and poor drainage in bogs (Thompson et al., 2019). The mean temperature is 13.8°C, annual precipitation of 187 cm, and conifer to other live fuels ratio of 1.21 (Burton et al., 2008). The Taiga shield is characterized by rolling topography with numerous lakes (47% cover) and exposed Precambrian bedrock of the Canadian shield. Glacial history has left thin soil layers on top of bedrock. It contains a mosaic of forest types intermixed with peat and non-peat forming wetland depressions surrounded by a matrix of sparsely vegetated exposed rock. The average temperature is 14.2°C, annual precipitation of 265 cm, and ratio of conifer to other live fuels of 3.32 (Burton et al., 2008).
The peatland types of both ecoregions include open fens dominated by sedges or shrubs and mosses, treed fens, and wooded bogs (Zoltai et al., 1988). The forested sites, both upland and lowland, are mostly dominated by black spruce [Picea mariana (Mill.) Britton, Sterns and Poggenb.] and boreal mosses (Zoltai et al., 1988). Drier sites are dominated by jack pine [Pinus banksiana Lamb.]. These dominant conifer types are intermixed with stands of deciduous aspen [Populus tremuloides Michx] and balsam poplar [Populus balsamifera L., Zoltai et al., 1988]. Tamarak [Larix laricina (Du Roi) K. Koch], a deciduous conifer, also occurs in wetland areas with black spruce. Picea mariana is a fire-adapted, dominant tree species across boreal North America in both upland and lowland areas. The fire return interval in boreal peatlands has been estimated as 200–1100 years (Zoltai et al., 1988) while it is 50–500 years for boreal upland ecosystems (Laberge and Payette, 1995).
The distribution of pre-fire ecotypes in the Taiga shield and plains study areas were mapped using methods of Bourgeau-Chavez et al. (2017) and are described in more detail in the Section “2.2 Remote sensing methods.” Based on these maps, the Taiga shield and Taiga plains study areas varied in proportional area for the wetland classes, while upland conifer and deciduous dominant ecotypes were fairly consistent (22 and ∼5%, respectively, Figure 2). Treed fens were the most dominant of the peatland ecotypes followed by wooded bogs and open fens on both the Taiga shield and the Taiga plains, but the amount of peatland was less than 15% on the Taiga shield and 32% of area on the Taiga plains. Unburnable features (water and barren rock—sparsely vegetated) occur on 42% of the Taiga shield study area and on only 15% (water) of the Taiga plains. Thus, the spatial variation on the two landscapes are quite different although both fall within the same general fire regime (Great Slave Lake) based on fire occurrence and area burned (Boulanger et al., 2014).
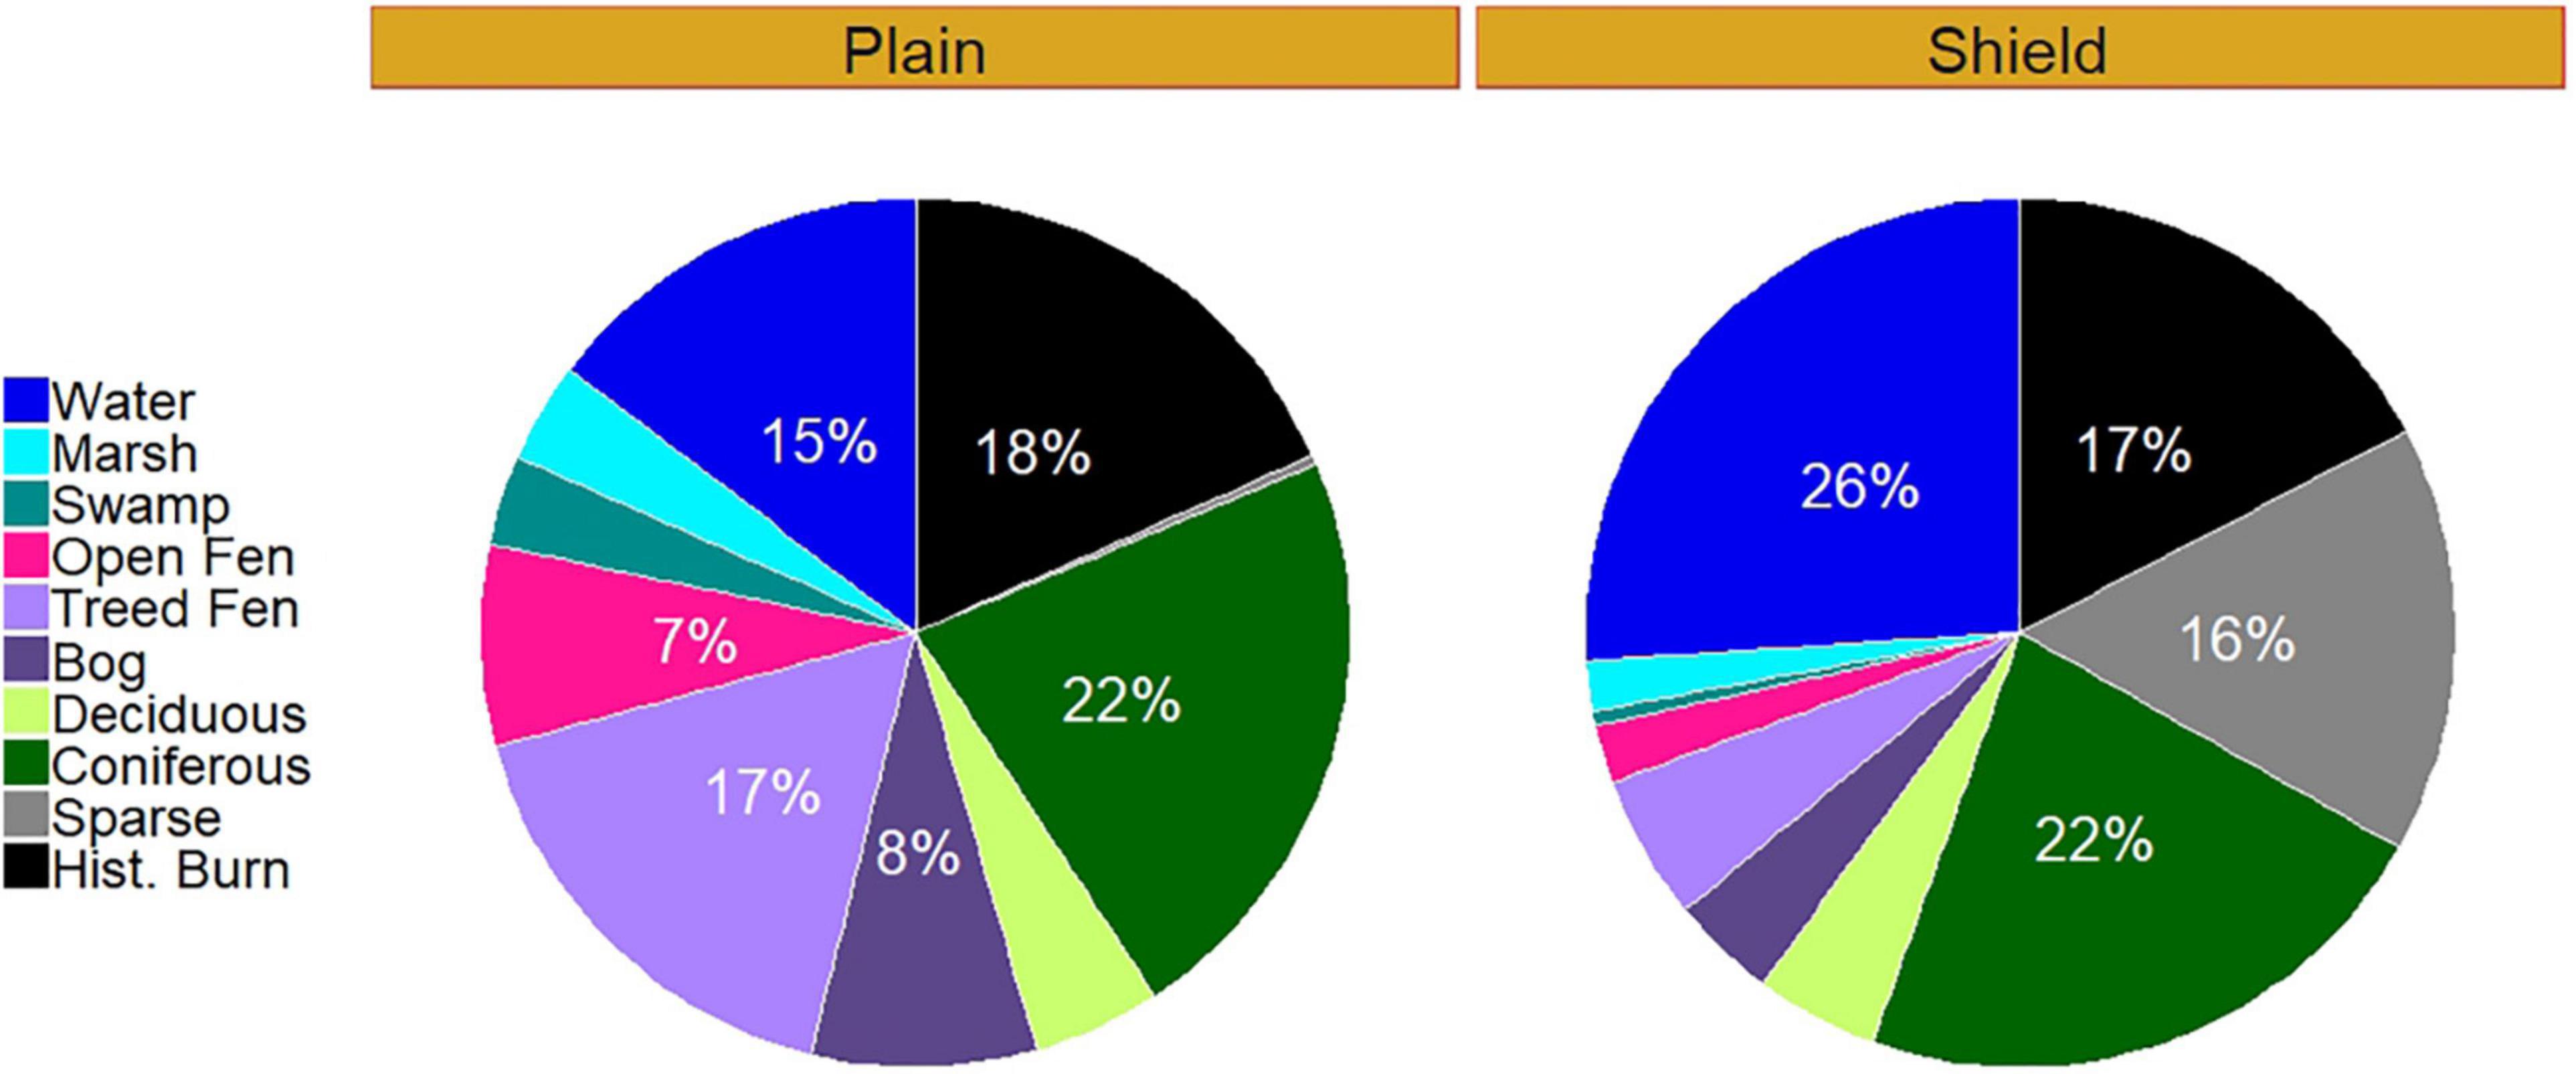
Figure 2. Pie charts showing distribution of ecotypes on the Taiga plains (left) and Taiga shield (right) for the study area.
The 136 individual fires that were the focus of study burned an expanse of 3.3 million ha. Six of those fires burned across ecoregion boundaries, so for the analyses which had a focus on difference in patterns of area burned and burn severity by ecoregion, we split them for a total of 142 fires. In 2014, this consisted of 1,705,800 ha burned in 52 fires on the Taiga plains and 1,218,700 ha in 46 fires on the Taiga shield. In 2015, fire affected much less area (13% of what burned in 2014), 274,300 ha over 27 fires in the Taiga plains and 108,800 ha in 17 fires on the Taiga shield. Most of the individual fires burned areas greater than 200 ha, but less than 5,200 ha (Figure 3 and Table 1) with the next greatest number of fires less than 200 ha. The combined area of all fires under 5,200 ha account for less than 3% of the total burned area. As in most large fire years, a majority of the area burned occurred in a small number of large fire events. For our study, more than 63% of the total area burned occurred in 6 fire events that were > 100,000 ha in size.
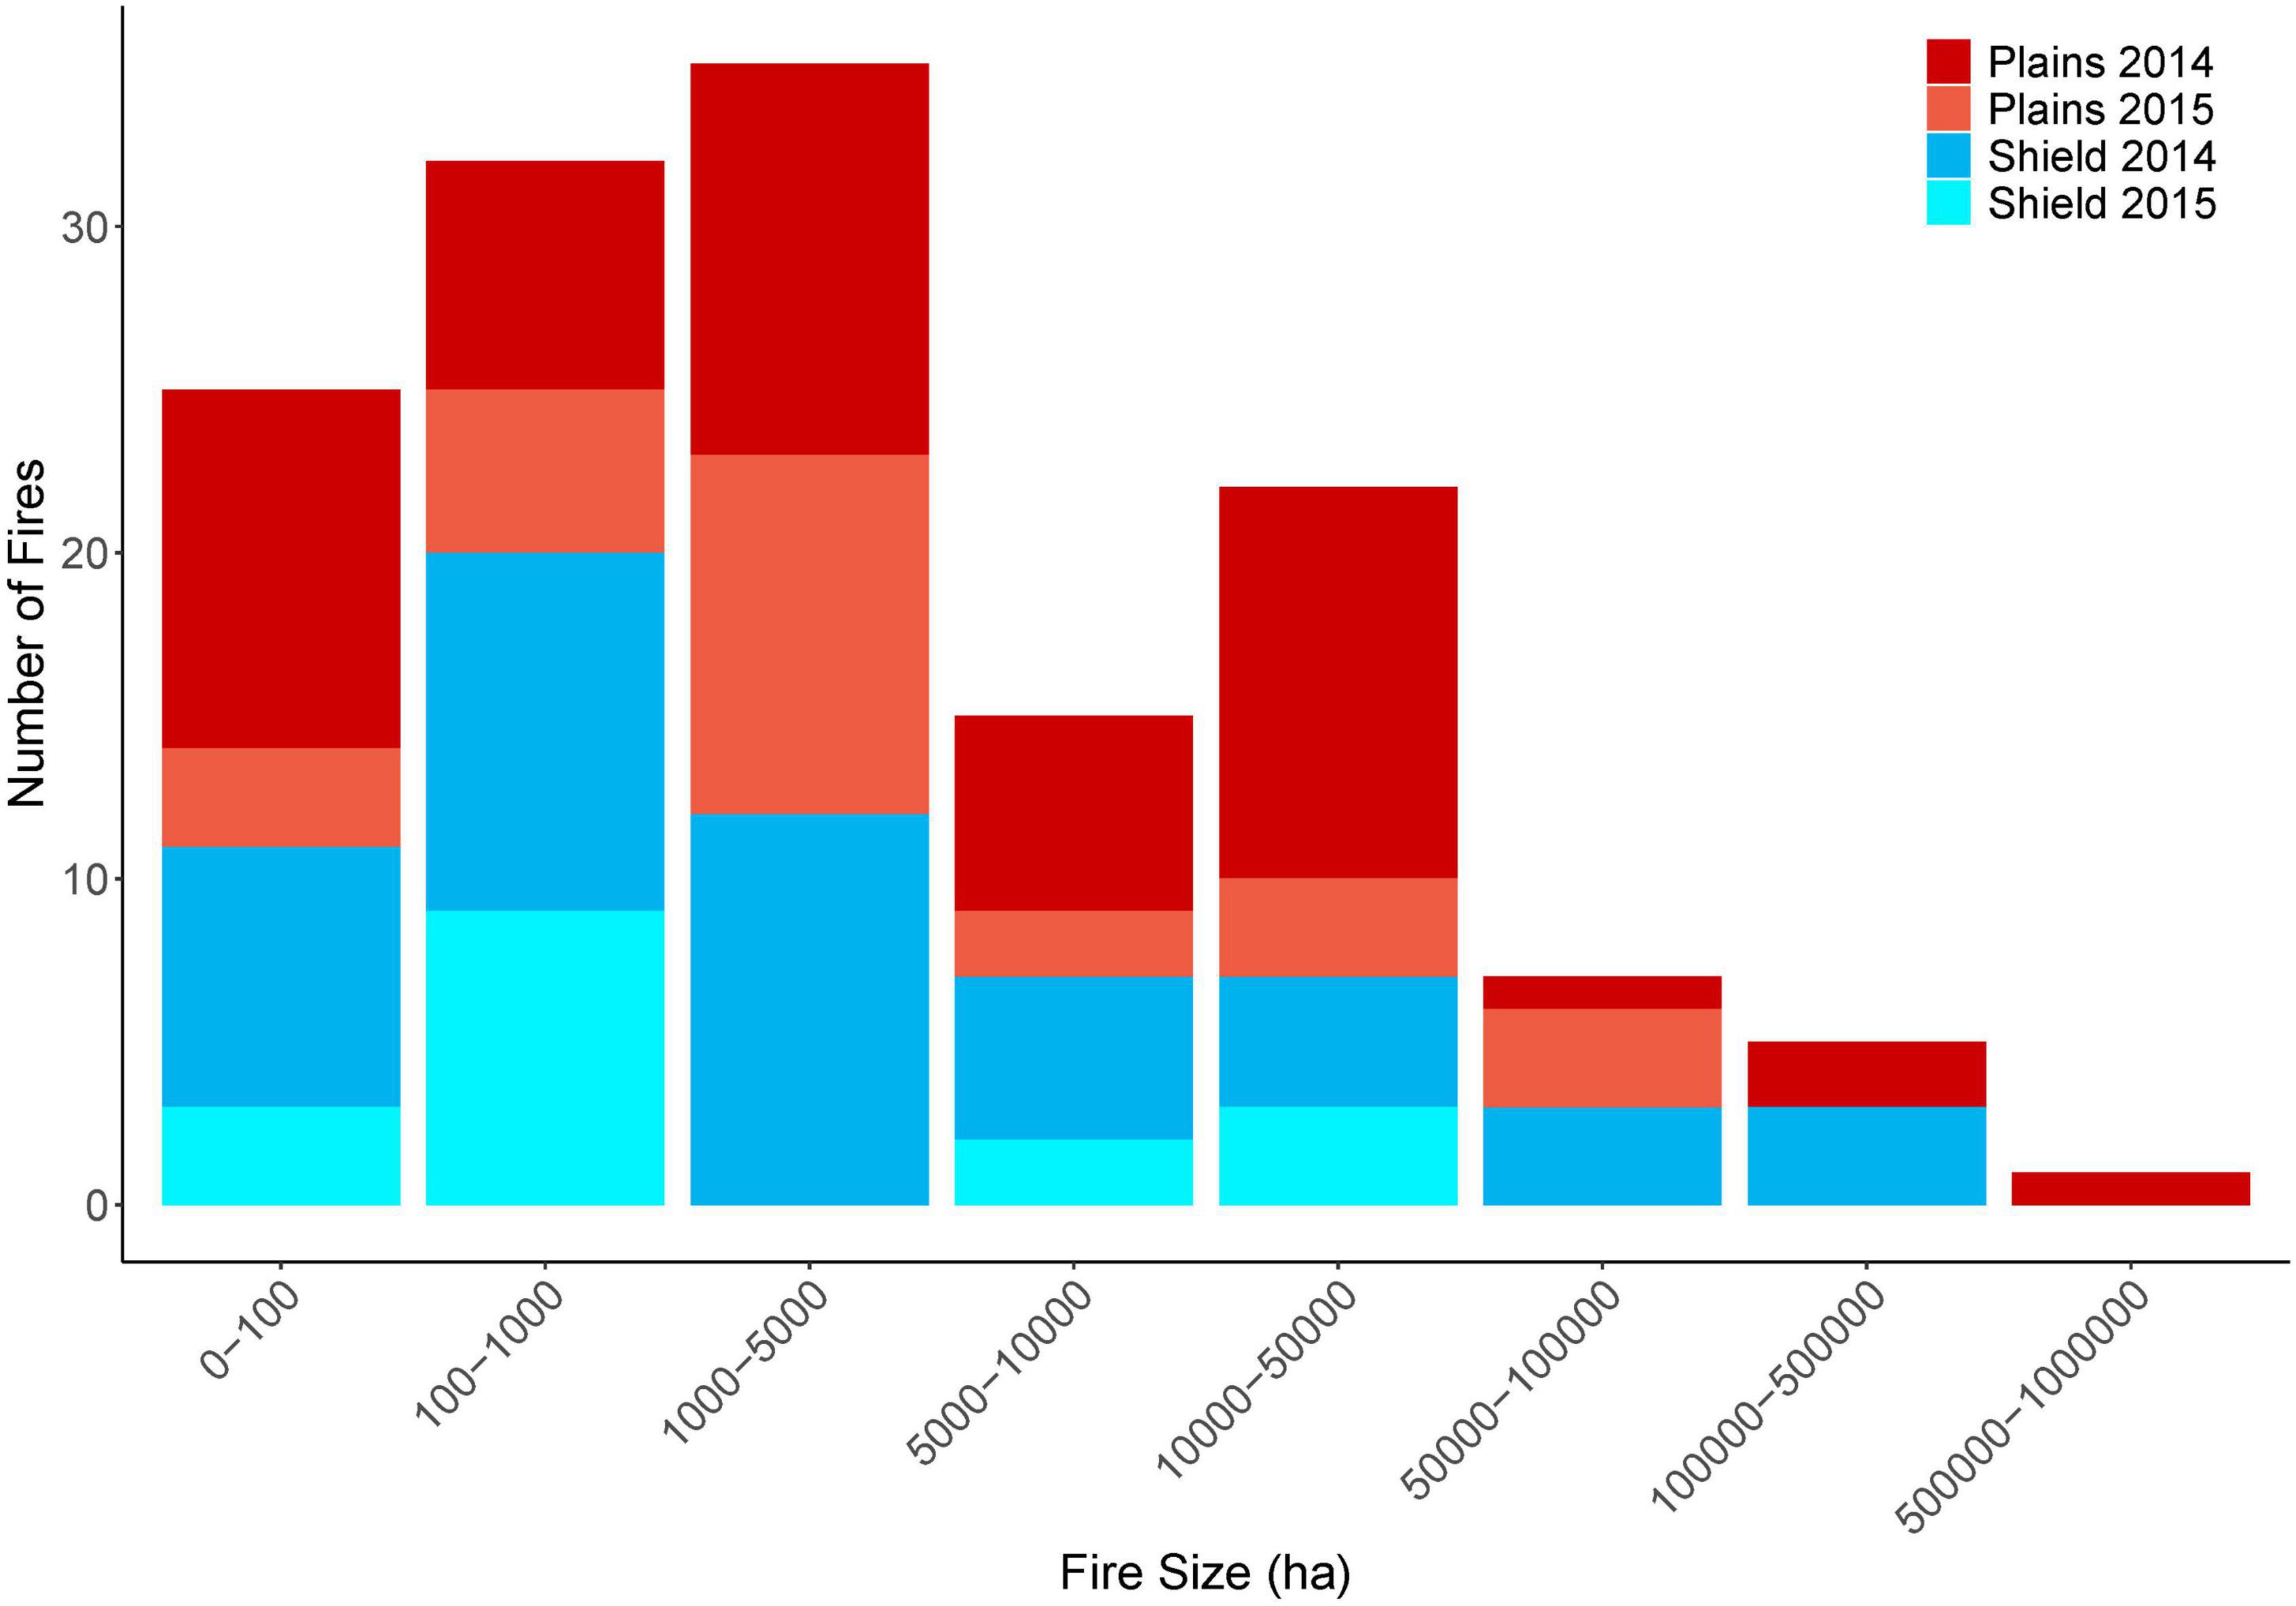
Figure 3. Frequency distribution of fire size (ha) for the fires within the study area, symbolized to show contributions by ecoregion and year.
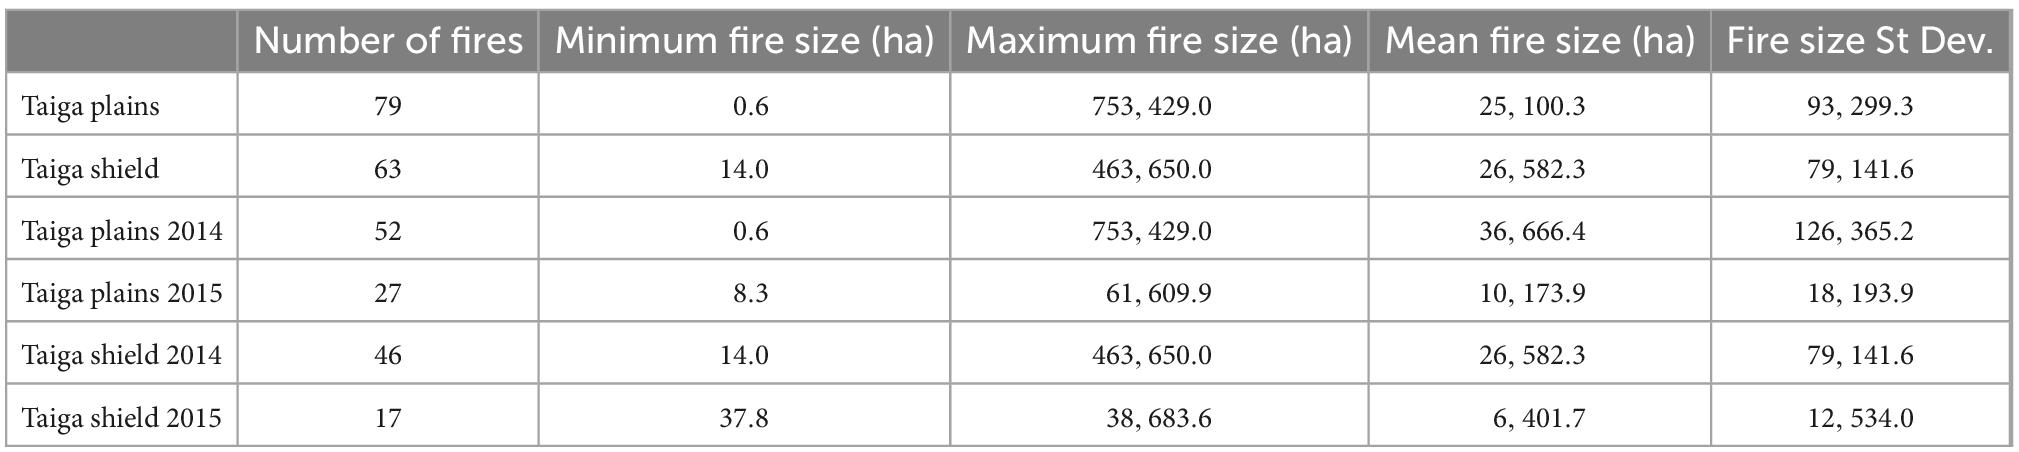
Table 1. Number of fires, minimum size, mean, maximum, and standard deviation reported as a cumulative, and by year and ecoregion for the study area.
2.2 Remote sensing methods
2.2.1 Peatland type mapping
The peatland type classification used in this analysis was created from archival Landsat and ALOS PALSAR multi-date data to map pre-fire ecotypes. To do this, we used field data and air photo interpretation for training in a machine learning classifier as described in Bourgeau-Chavez et al. (2015, 2017). Using field data from 152 locations collected in the years 2015–2018 as training and validation, we created additional polygons through air photo interpretation of WorldView2 imagery. The land cover maps distinguish three peatland types (bog, treed, and open fen), two other non-peat wetland types (marsh and swamp) as well as two upland cover types (upland conifer, upland deciduous). The multi-date multi-sensor approach incorporated 129 PALSAR L-band and 142 Landsat-5 TM images across spring, summer, and fall dates to take advantage of seasonal differences of phenology and hydrology for classification with the machine learning classifier Random Forests (Breiman, 2001).
A total area of 14.6 million ha was mapped (Figure 4; Supplementary Figure 1; Bourgeau-Chavez et al., 2019), using 9,943 training polygons to train the classifier and 2,149 validation polygons reserved for the accuracy assessment. The map has a 0.2 ha minimum mapping unit (mmu), which was determined by the resolution of the input imagery. This mmu takes into consideration inherent SAR speckle, which needed to be filtered (3×3 pixel median filter was used), thus reducing the resolution. The mapped classes include: wooded bog, treed fen, open fen, marsh, swamp, barren rock or sparsely vegetated, coniferous, and deciduous upland. The overall accuracy was 93.5% with all classes having greater than 77% user’s (UA) and producer’s accuracy (PA) except swamp (69% PA, 60% UA) (Supplementary Table 1).
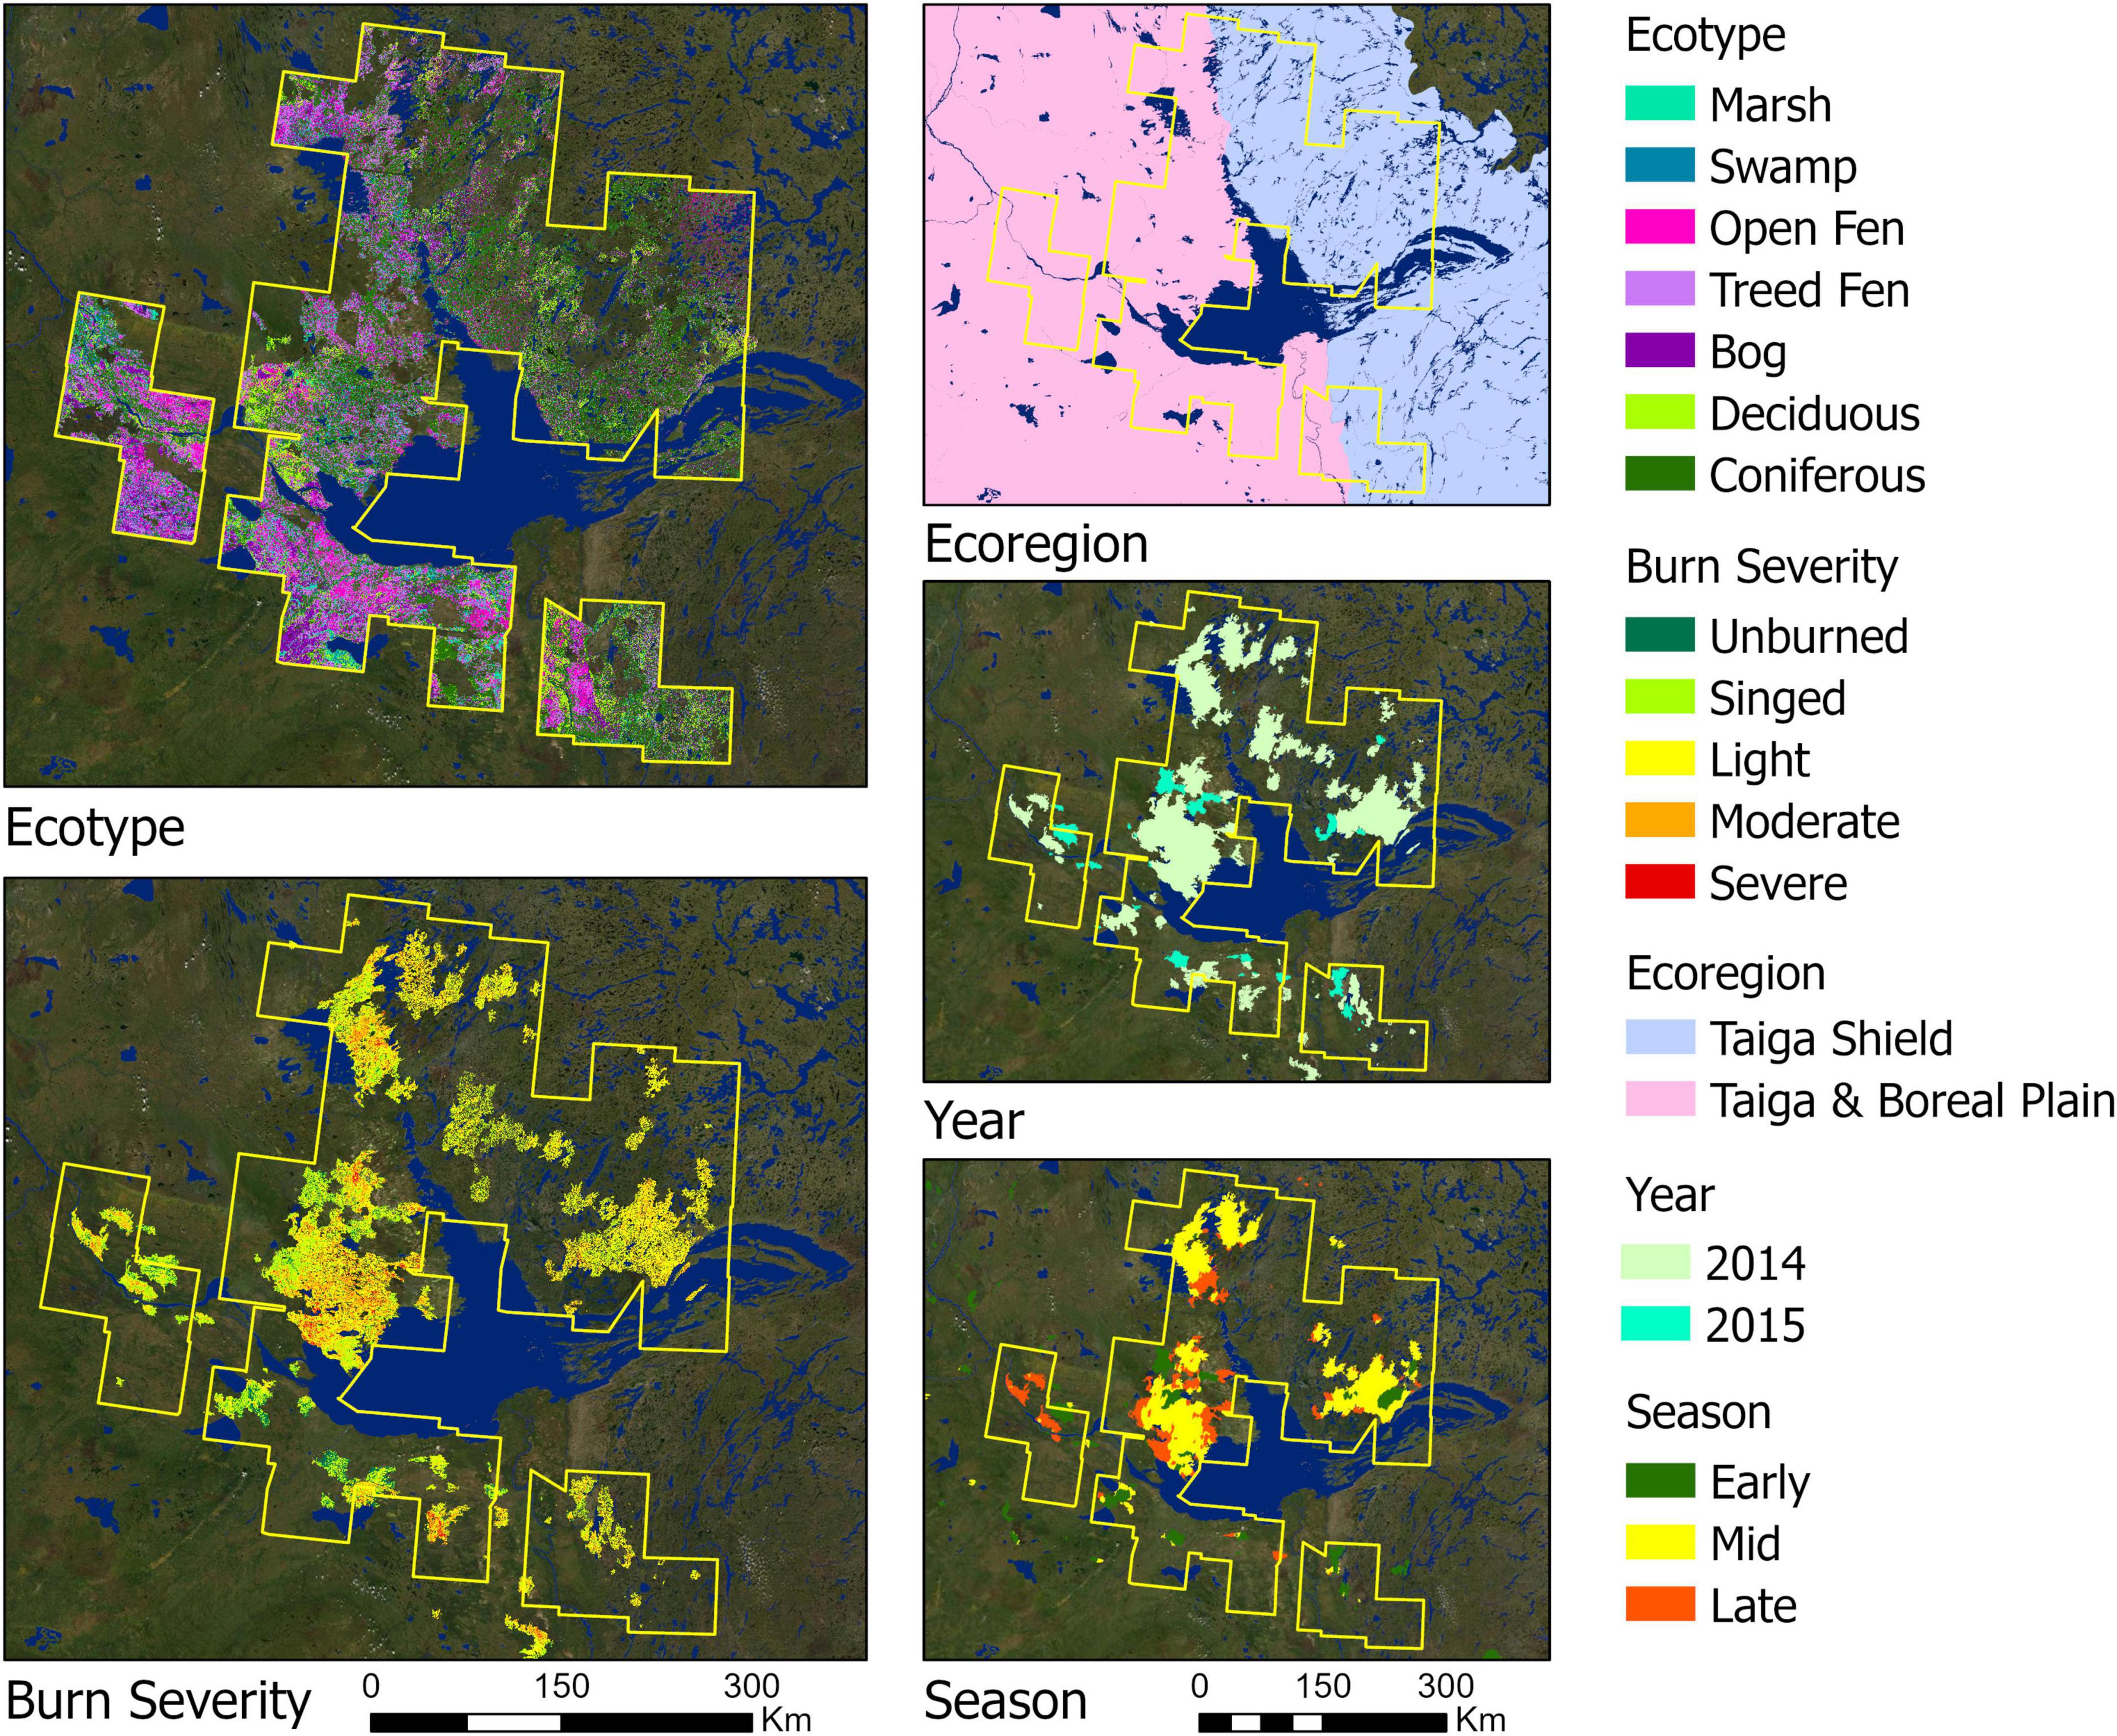
Figure 4. Study parameters were parsed by ecoregion consisting of Taiga plains and Taiga shield, by year for the 2014 and 2015 wildfire perimeters, by season for early, middle, and late season fires, and by ecotype.
Swamp was primarily confused with upland conifer. Bog has 97% PA and 94% UA. Open and treed fens have high accuracy and are mostly confused with each other. The definition of a treed fen is that it has greater than 7% canopy closure. Typically, open fens also have a few trees and it is usually this fine distinction that causes confusion in the classified maps (Bourgeau-Chavez et al., 2017).
2.2.2 Soil organic layer burn severity mapping
Algorithms to map SOL burn severity from Landsat-8 were created from an extensive set of field data quantifying burn severity to the ground and organic soil layers within fire perimeters across the study area. The Canada National Fire Database [Natural Resources Canada (2018) was used for defining fire perimeters (outermost perimeters of the fire boundaries)]. The metric used for field assessment of burn severity was a qualitative ocular assessment of the proportion of six evenly dispersed 10 m × 10 m sampling plots within a 1 ha homogeneous ecotype falling into 5 categories of burn modified from Dyrness and Norum (1983) to fit the peatland dominant study area: 0-unburned moss; 1-singed moss; 2-light burned moss; 3-moderately burned moss; 4-severely burned moss/duff (Supplementary Table 2).
All burn assessments were made in years 1 and 2 following the fires and then averaged across the 6 subplots at each site (either 6 or 4 subplots, depending on the source study; Whitman et al., 2018; French et al., 2020a). To relate the field sampled information to Landsat, the burn severity index (BSI), which is the sum of the proportion of area in each burn class multiplied by that class [after Bourgeau-Chavez (1994), Loboda (2013), and Bourgeau-Chavez et al. (2020)], was calculated. Since this field metric is highly subjective, great care was taken in calibrating estimates of area in each of the burn severity classes across a plot between field crew members.
The BSI was related to differenced pre- and post-burn Landsat-8 bands/metrics for algorithm development to retrieve burn severity across the landscape (Supplementary Figure 2; French et al., 2020a). Algorithms were based on multivariate linear regression models and apply to both uplands and peatlands. Given the landscape differences between the Taiga shield and the Taiga plains, two different burn severity models were developed, one for each of the ecoregions. The final models had coefficients of determination of 0.67 R2 for the Taiga plains and 0.73 R2 for the Taiga shield. The maps of 136 wildfires of 2014 and 2015 (Figure 4; French et al., 2020a,b) had severity outputs ranked into five classes as: Unburned 0–0.5; Singed > 0.5–1.5; Light > 1.5–2.5, Moderate > 2.5–3.5; Severe > 3.5–4.0.
2.2.3 Fire progression maps
Fire progression maps for the 2014–2015 NWT wildfires were created from MODIS using the methods of Loboda and Csiszar (2007) to understand the seasonality of fire (Bourgeau-Chavez et al., 2016, 2017). These maps were used not only for our geospatial study, but also to aid in obtaining field data on BSI from a range of fire seasons.
We used information from the literature to define early, middle and late wildfire season breaks. Early season included April through June, middle season included only the month of July, and late season included August through October (Johnson et al., 1999; Kasischke and Turetsky, 2006; Barrett et al., 2011; Bourgeau-Chavez et al., 2020).
2.3 Statistical analyses
In addition to general statistics, a series of chi-square goodness-of-fit tests were conducted to determine the statistical significance of differences in burn area and burn severity by ecotype, ecoregion, season of burn, year of burn, and landscape position in relation to the expected probability of occurrence on the landscape (as described in more detail in Sections “2.3.1 Ecosystem vulnerability through exposure—Analysis of burned areas” and “2.3.2 Ecosystem vulnerability through sensitivity—Analysis of burn severity,” note landscape position analysis is in the Appendix). Chi-squared goodness of fit is a non-parametric test to determine if observed values differ significantly from expected values, where expected values are representative of a probability distribution (Pearson, 1900). The test does not imply causality, only that observed values of a phenomenon are different than expected.
All statistical tests were run in R software (version 4.1) (R Core Team, 2022). The analysis of burn severity by ecoregion and landscape position was conducted on all 142 fires. There were 10 fires for which pre-burn ecotypes were not mapped so the analysis of burn severity by ecotype was applied to 132 fires. Additionally, there were 10 fires for which the fire progression (Loboda and Csiszar, 2007) algorithm would not run due to small fire size or a lack of hot spots, reducing the population of the fire seasonality analysis to 132 fires.
2.3.1 Ecosystem vulnerability through exposure—analysis of burned areas
To address the question of burn exposure (i.e., whether some ecotypes are burning preferentially on the landscape in these extreme drought years of 2014–2015 in the NWT/Alberta study area), a classic equal probability of burning for each ecotype was assumed based on the area available for burning on the landscape within the outermost fire perimeters [after Turetsky et al. (2004) and Bourgeau-Chavez et al. (2020)]. This provides the null model from which to determine if an ecotype burned more or less preferentially, given a binary burned/not burned assessment.
Here, whether the SOL burned and by how much is assessed with the Landsat-8 model described in Section “2.2.2 Soil organic layer burn severity mapping.” To create the binary assessment, the Landsat-8 SOL burn severity classes were grouped into a binary comparison of burned (BSI > 0.5) to unburned (BSI < 0.5) areas. The probability of burning was equal to the ratio of the total area available for each ecotype per wildfire by the total area of all ecotypes available within each wildfire perimeter. Expected area burned was calculated by multiplying the probability of burning for each ecotype by the total burned are for each wildfire. The actual ratio of observed area burned in each ecotype was then compared to the expected values. The information from the intersection of the two maps was evaluated for all 142 wildfires and then parsed by ecoregion (Taiga shield/plains), year, and season of burn within the study area (Figure 4; Supplementary Figure 3).
2.3.2 Ecosystem vulnerability through sensitivity—analysis of burn severity
To determine if severity of burn to the organic layer surface was occurring as expected across ecoregion, year, burn season (Figure 4), a second series of chi-square goodness-of-fit tests were applied (see Appendix for results on SOL burn severity by landscape position). For this set of chi-square tests, only the peat-forming lowlands and uplands were compared. Expected probabilities were calculated from the distribution of 5 BSI levels (0-unburned, 1-singed, 2-light, 3-moderate, 4-severe) by the entire region for the effects of ecoregion (Taiga plains/shield) and for the effects of season on ecotypes. Expected probabilities were based on severity distribution by ecoregion for all other parameters (season, year, and landform). Expected values were generated by multiplying the probability of each severity level by the total area that burned within each study parameter and as before, were compared to the actual area ratio of observed area burned within the study parameter.
3 Results
3.1 Ecosystem vulnerability through exposure–analysis of burned areas
Since the pre-fire land cover ecotype maps were completed for 132 of the 142 fire events, the assessment was based on those 132 fires including only peatland and upland forest classes. Within the 132 fire perimeters across both ecoregions, upland conifer was the dominant pre-fire ecotype on the landscape (53% of the area, 11,031 km2), this was followed by treed fen (22%, 4,644 km2), open fen (10%, 2,106 km2), bog (9%, 1,771 km2), and upland deciduous (6%, 1,158 km2).
3.1.1 What ecotypes burned and where and when did unburned islands occur?
In an assessment of burned and unburned areas within fire perimeters, we found that nearly all the upland conifer forest burned within the 132 wildfires assessed. Upland deciduous forest, bog and treed fen burned more than 90% of their respective overall area, and open fens more than 70% (Figure 5). The Taiga shield experienced greater area burned across all ecotypes (>95%) than the Taiga plains, with very low amounts of unburned areas remaining. The most notable ecotype with unburned islands across ecoregions was the open fen (Figure 5).
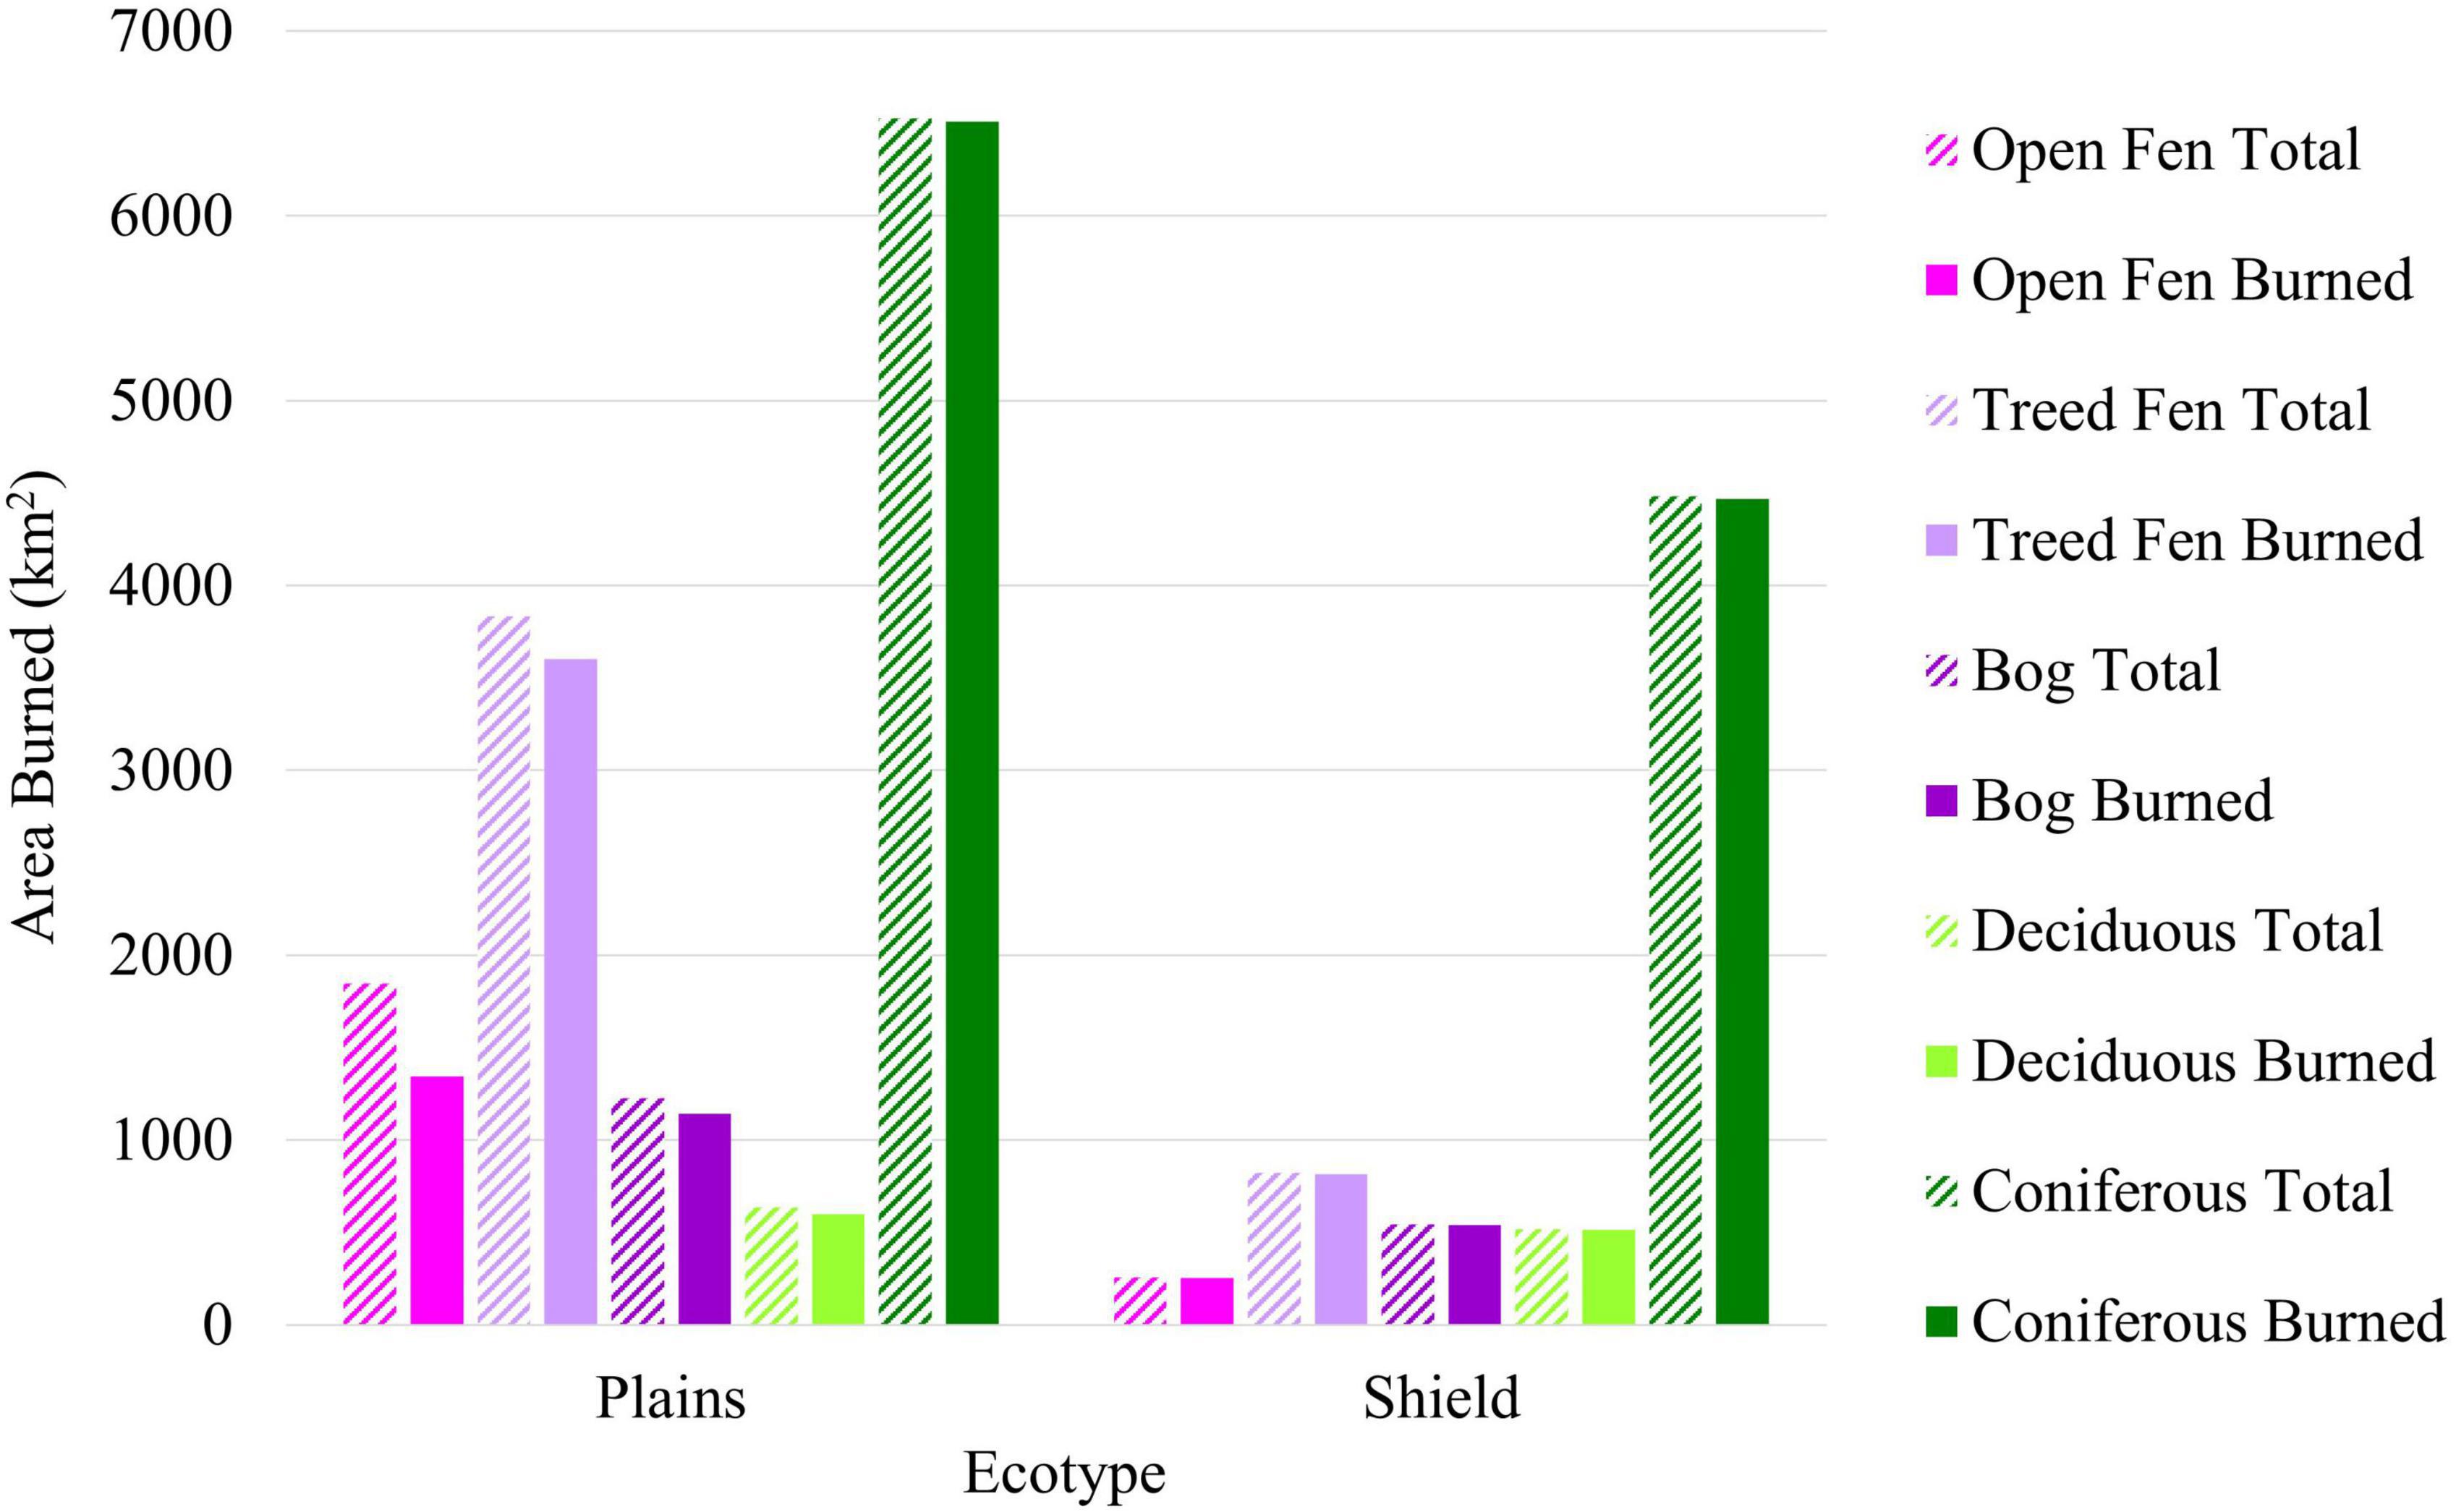
Figure 5. Plot of actual area within fire perimeters (hashed bars) and area burned (solid bars) in km2 by ecotype for the Taiga plains and shield.
Since most of the fires were large (>1000 ha), we evaluated unburned patches that were a minimum of 18 ha to understand what was leading to these unburned islands and whether or not their size was related to corresponding fire event sizes. There were 446 patches on the Taiga plains with an area of 71,888 ha, while there were only 5 such patches on the Taiga shield with a total area of 178.56 ha. These unburned islands occurred on only 4% of the area of the 132 wildfires, although this did vary by fire year (2014–2.8% and 2015–11.2%). For these larger unburned islands on the plains, we found a mean patch size of 161.2 ha with a median of 39.2 and this was consistent for 2014 and 2015. We did not find a relationship between the size of the fire and size of unburned patches (Kendall’s rank correlation tau = 0.04, p = 0.17).
For these large unburned islands on the Taiga plains, peatlands made up on average 83% of cover (open fen 47%, treed fens 25%, bog 11%), and this did not change by patch size (0–50, 50–100, 100–1000, >1000). Ecotypes adjacent to the unburned islands (within a 500 m buffer) in the Taiga plains were also comprised primarily of peatlands (31% treed fens, 18% open fen, and 11% bog) with 22% upland conifer. For the Taiga shield, the unburned islands consisted primarily of treed fen (32% on average) followed by upland conifer (25%), bog (13%), and bedrock (9.5%). The adjacent areas of the unburned islands on the shield were comprised primarily of upland conifer (39%) followed by treed fen (13%) and exposed bedrock (13%).
3.1.2 Variations in patterns of ecotypes burning within individual fire events
To assess the variation in patterns of burning across individual fires, we normalized the burn area data to proportional area of each ecotype burned within each individual wildfire event. This eliminated the disparities in pre-fire landscape composition between fire events. We found that the proportional area of each ecotype that burned was more variable between the Taiga plains and shield ecoregions than it was between fire years for the Taiga plains or shield (Figure 6). On the Taiga shield, in both years, the minimum percent area burned per fire event was very high across ecotypes (greater than 70% in 2014 and greater than 60% in 2015), while it varied from less than 10% to greater than 90% on the Taiga plains. For the Taiga plains, the patterns of minimum and mean proportional burn area are similar between years, but there is a noticeable increase in minimum proportional area burned for upland conifer, treed fen, marsh, and to a lesser degree open fen in 2015. In contrast, bog, upland deciduous, and swamp had proportionally more areas left unburned in 2015 on the Taiga plains (Figure 6).
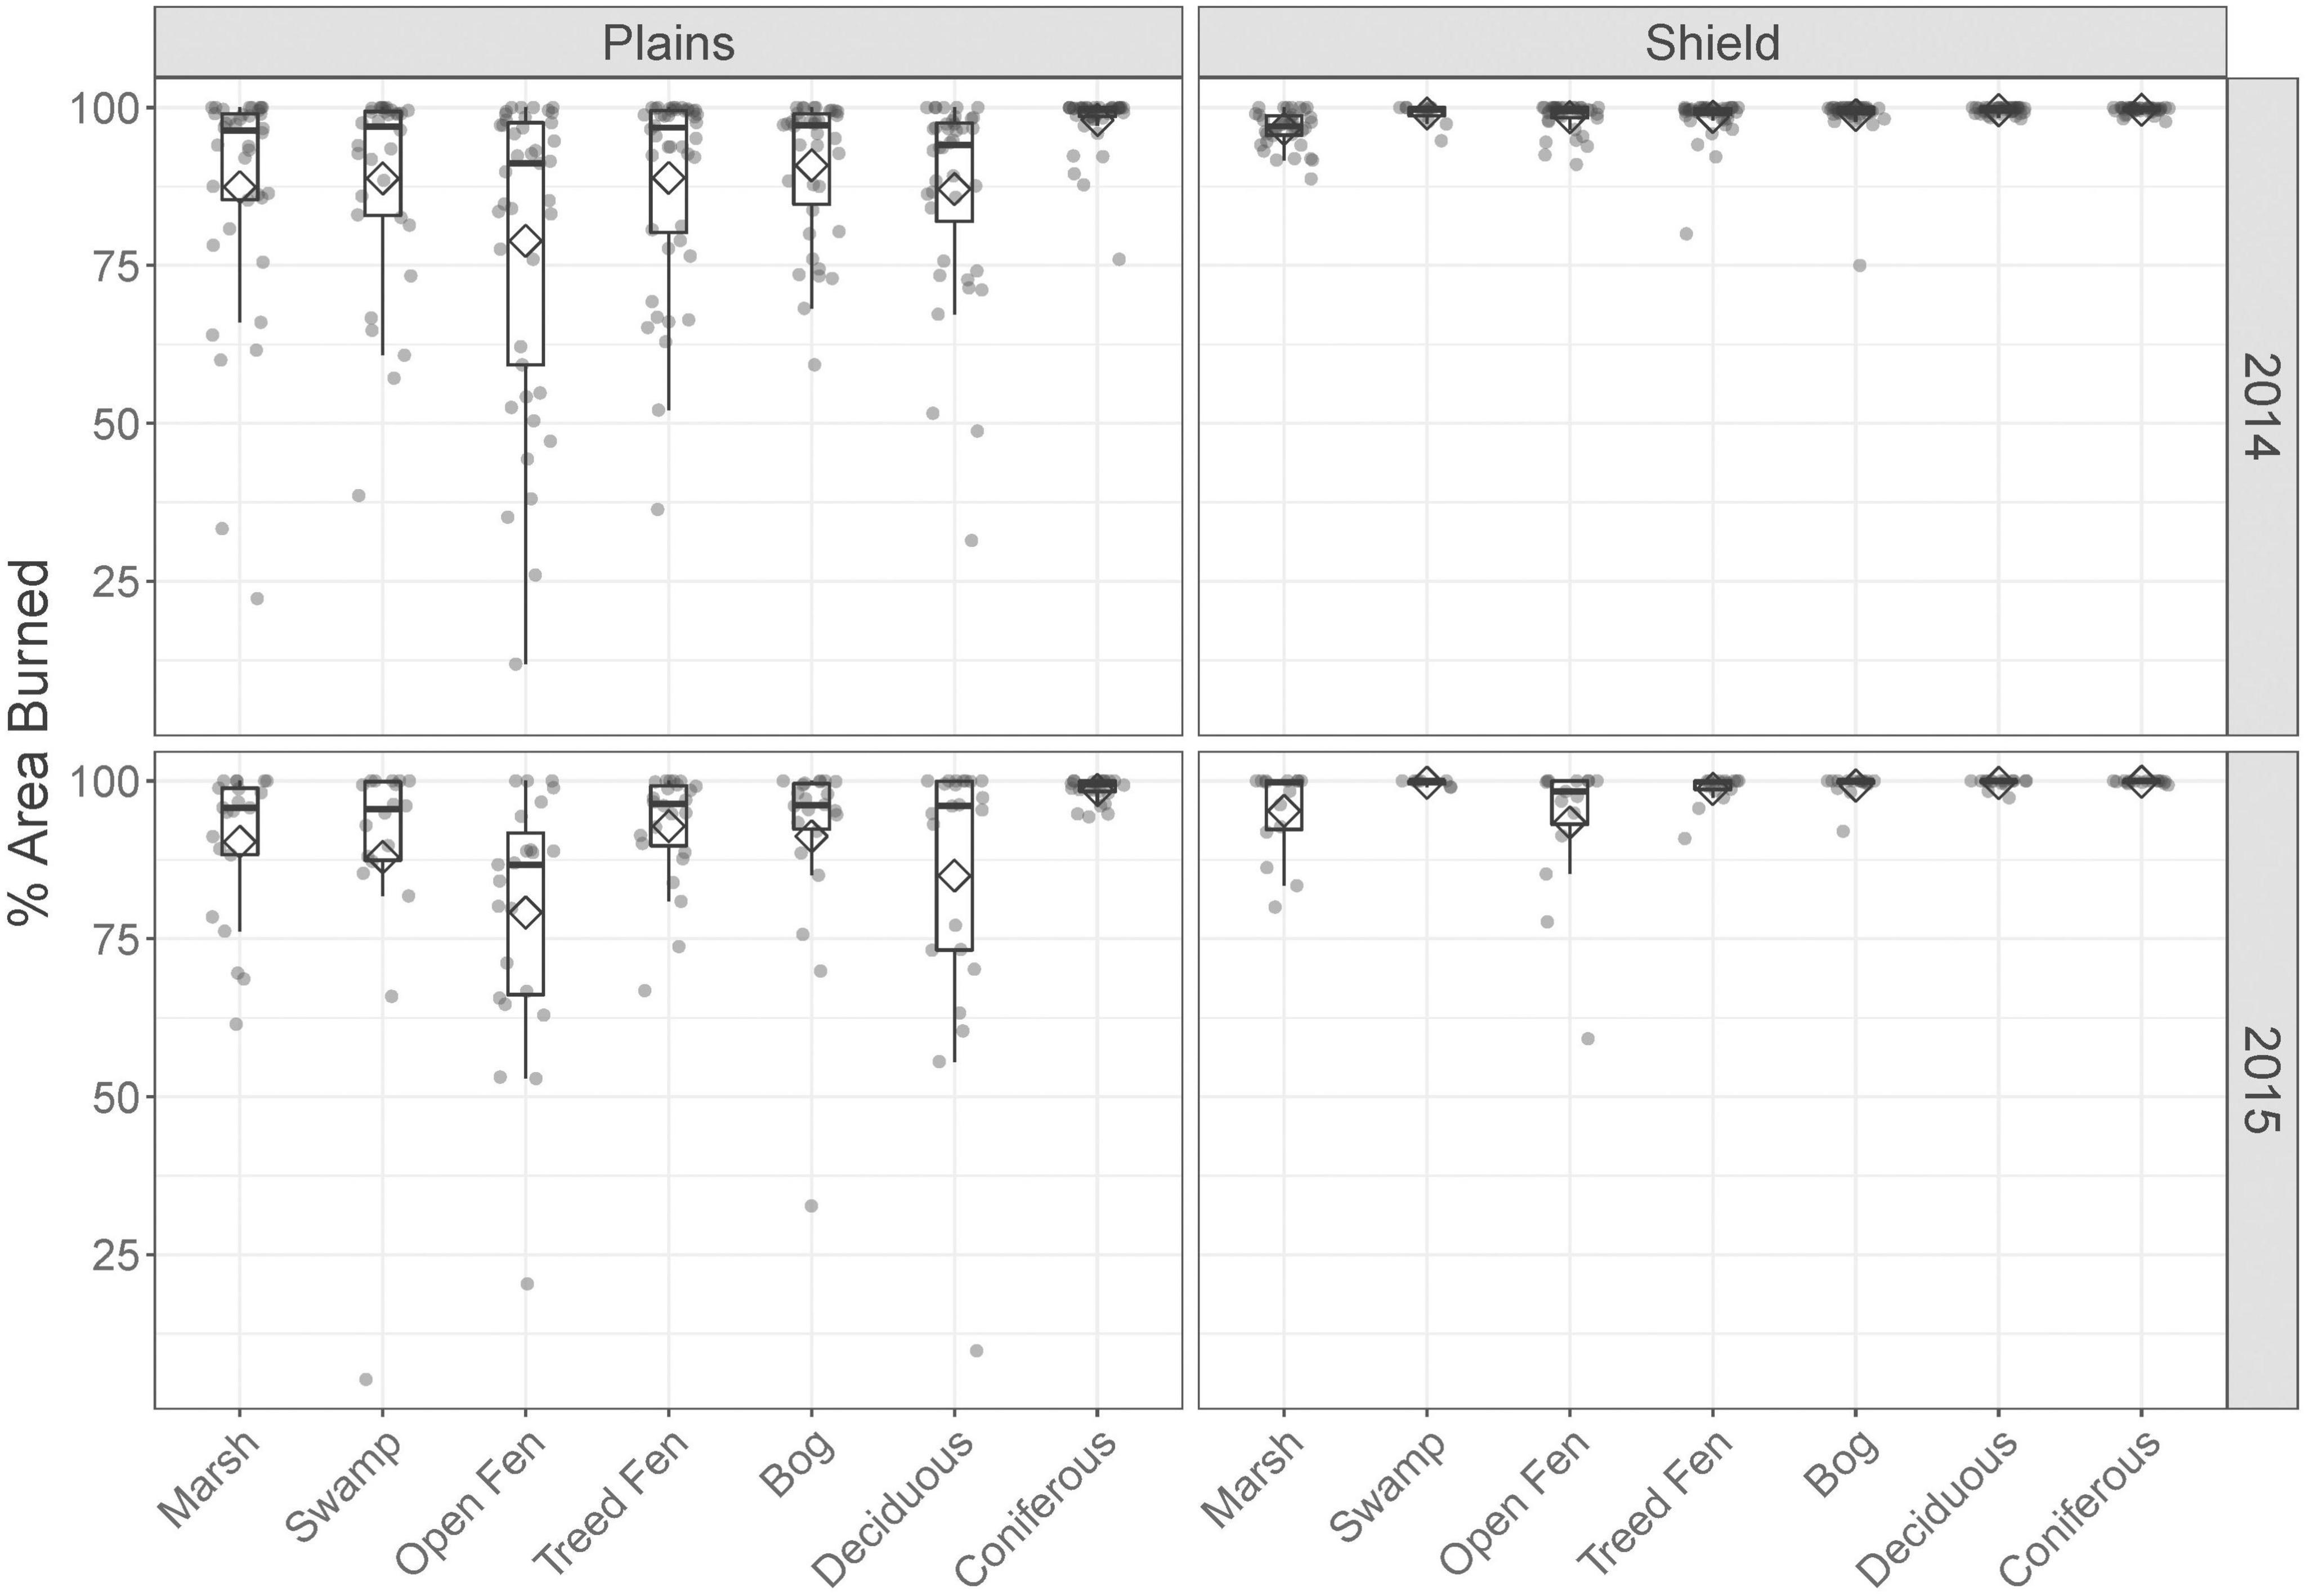
Figure 6. Box plots, separated by ecoregion and year, showing the mean percent area burned of each ecotype as diamond and actual data values plotted as gray circles.
The mean and difference between minimum and maximum percent burn by ecotype were used to suggest susceptibility to wildfire occurrence [after Bourgeau-Chavez et al. (2020)]. Thus, a high mean and low min-max difference would suggest a high susceptibility to wildfire, a high mean and high min-max difference would suggest moderate susceptibility, and low mean and large min-max difference would suggest low susceptibility. Using these assumptions, we found upland conifer to be highly susceptible (as expected) to wildfire on both the shield and plains in both 2014 and 2015. Nearly all of the upland conifer was burned within every fire perimeter with a very low standard deviation on the Taiga shield in both years. For the Taiga plains, there was a minimum of 75% upland conifer burned in 2014 within a fire event, and this increased in 2015 to nearly 95%.
3.1.3 Are peatlands as exposed to burning as upland areas during this extreme drought? How does this vary by ecoregion, season of burn, or year of burn?
The chi-square goodness-of-fit test results suggest that for the Taiga shield ecoregion, the area burned in these 132 wildfires was not dependent on ecotype, season of burn, or year of burn (Figure 7 bottom plot—all chi-square results were not significant). On the Taiga shield, the observed/expected ratios are mostly around 1.0 with marshes and open fens a bit lower (>0.92). In contrast, for the Taiga plains ecoregion, area burned was dependent on ecotype, season of burn and year of burn for all comparisons (Figure 7 top plot–all significant).
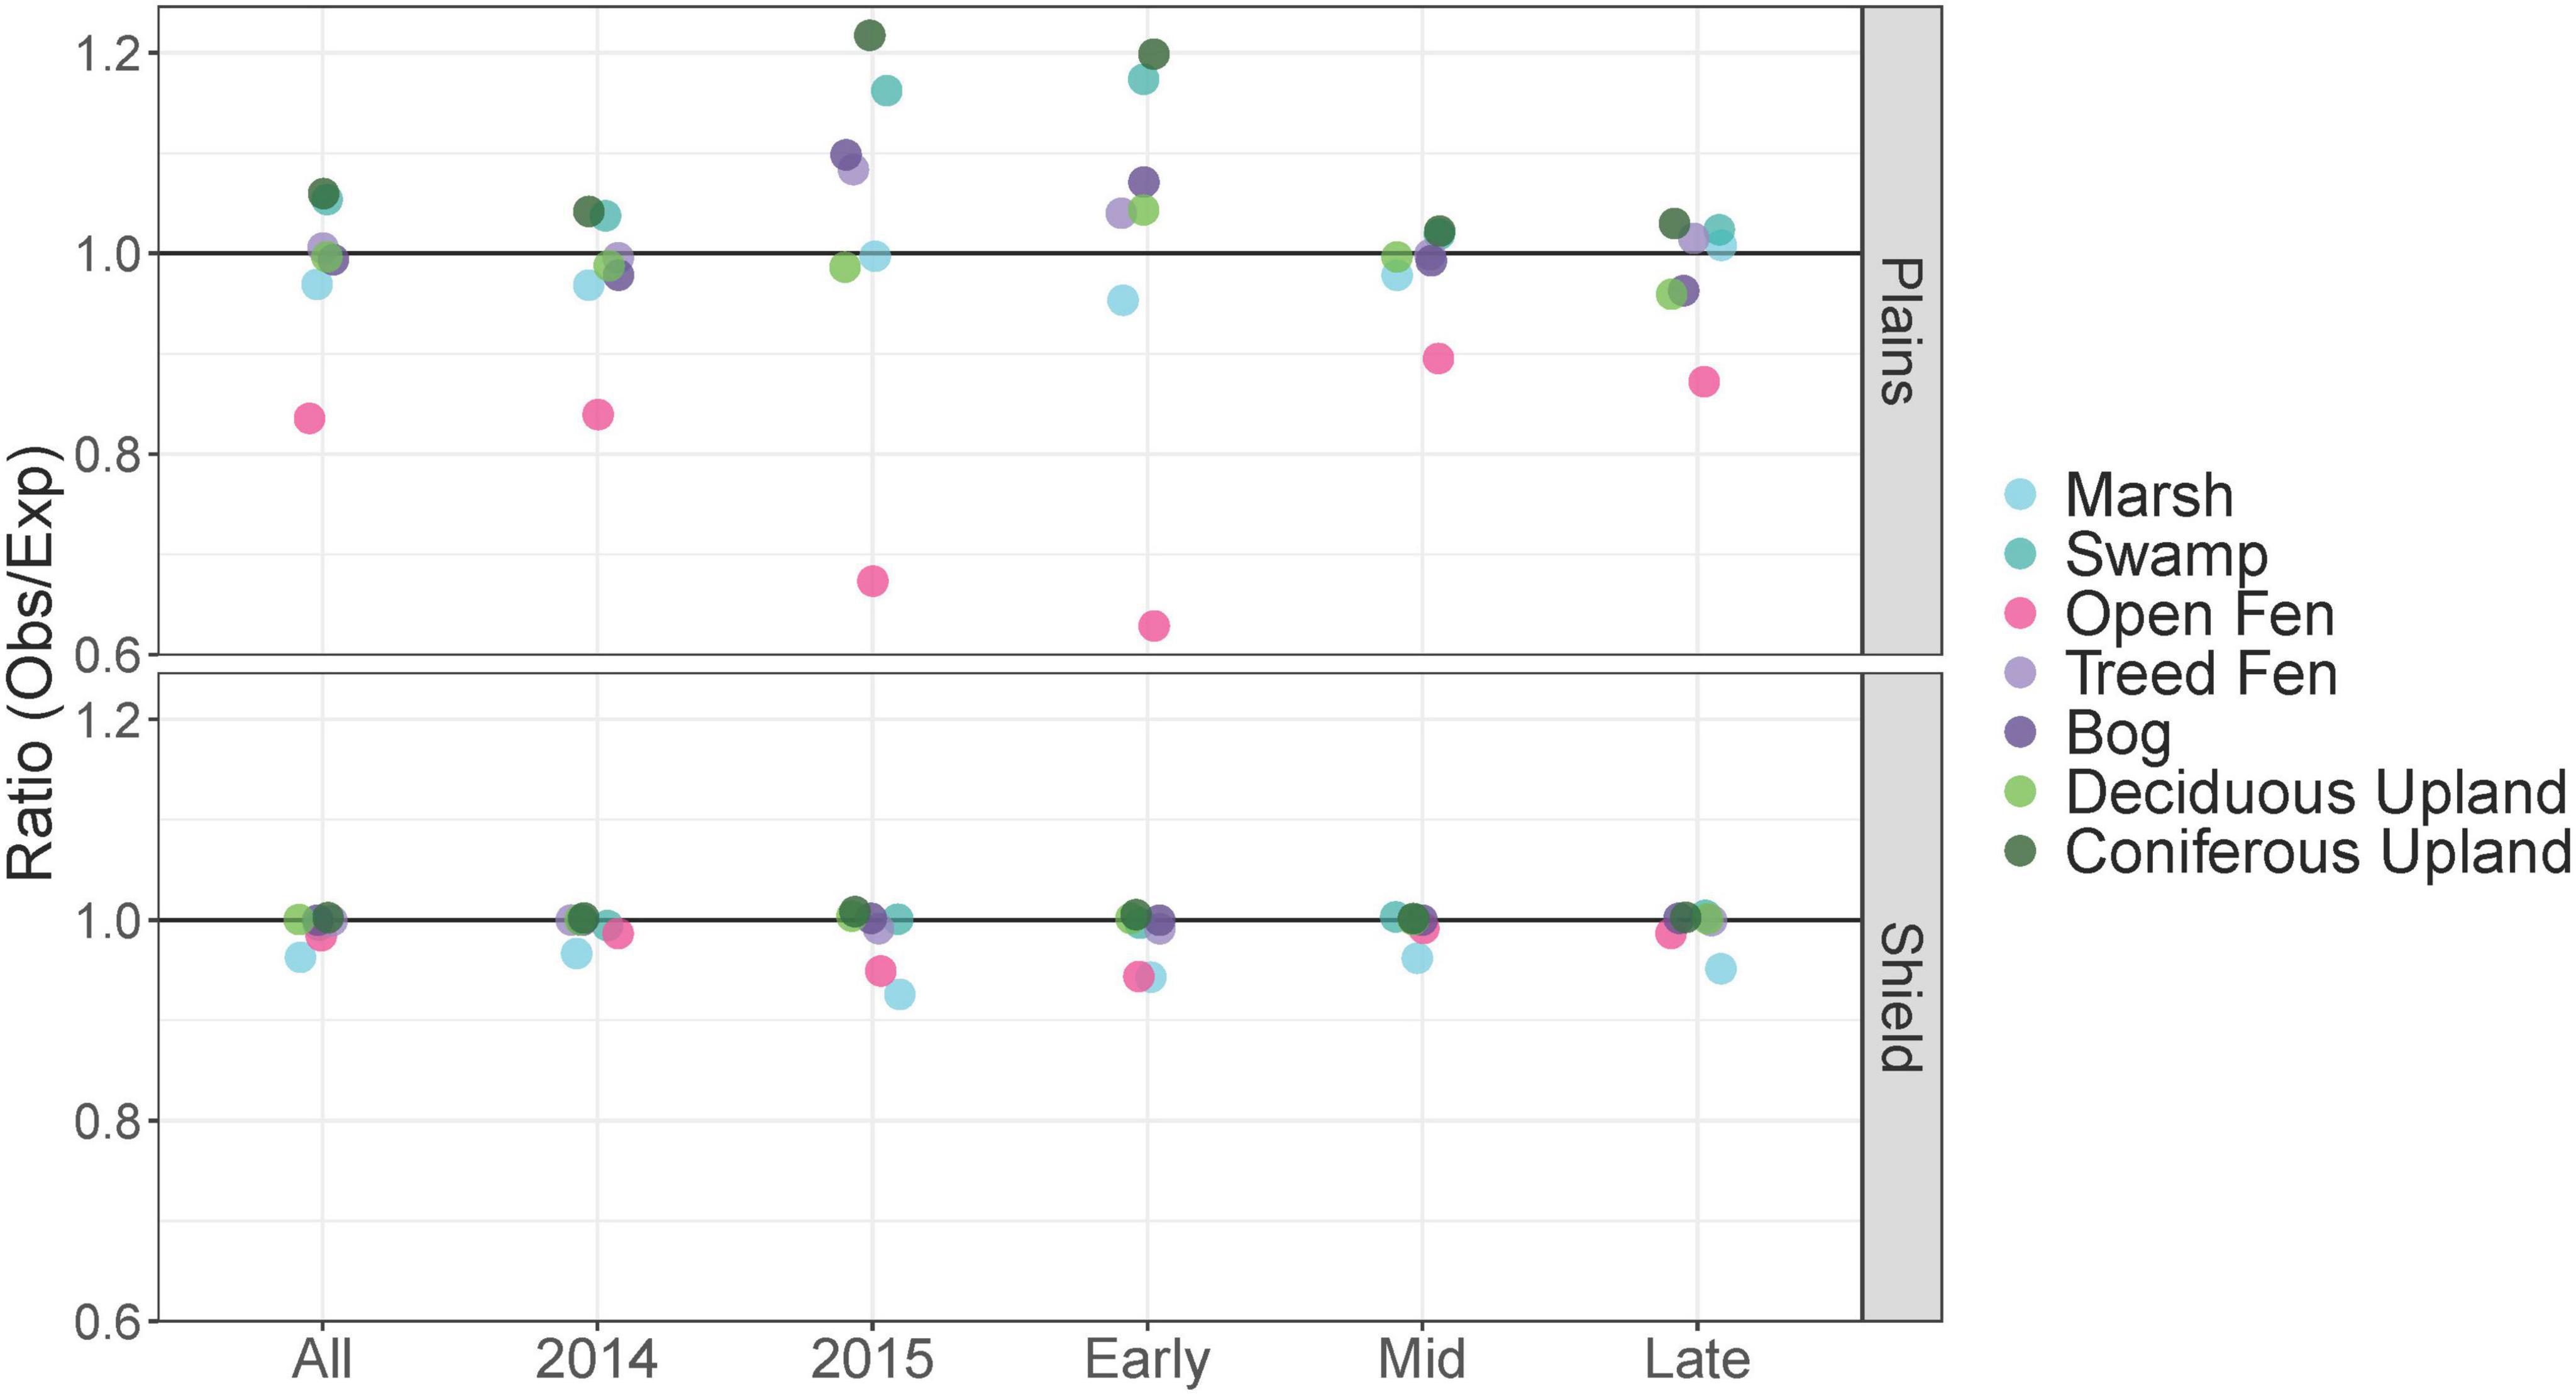
Figure 7. Observed/Expected ratios of area burned for 2014, 2015, early, mid, and late season for the Taiga plains (top) and Taiga shield (bottom).
For the Taiga plains, treed peatlands (bogs and treed fens) burned as expected (Figure 7, top plot) with the exceptions of the early season and in 2015 when they burned more area than expected (observed/expected ratios 1.04–1.06). Open fens burned much less than expected across all groupings (observed/expected ratios 0.67–0.91), even lower than marshes (observed/expected ratios 0.96–1.00). Open fens are the wettest peatlands and their patch sizes are much larger than marshes in general, which may impede fire as it spreads across the landscape. Coniferous upland and swamp experienced burning of more area than expected, with the highest ratios for the Taiga plains in 2015 (observed/expected ratios 1.17–1.20) and in the early season (observed/expected ratios 1.18–1.2), similar to treed peatlands.
3.2 Ecosystem vulnerability through sensitivity–analysis of burn severity
The previous section addressed which ecotypes burn on the landscape in terms of area affected. In this section we focus on assessing how severely each ecotype was burned, across the gradients of ecoregion, years of fire, and seasons to provide further insight into how deeply the SOL was burning in each ecotype and thus further addressing what their sensitivity to wildfire may be.
The area affected by a light severity burn class was proportionally much greater across the Taiga shield than singed or moderate severity classes, with very little unburned or severely burned areas in both years (Figure 8). In the Taiga plains, the light severity class was also the dominant severity class in 2014. There were also significant amounts of singed and moderate severity burning and much more area was unburned or severely burned than was observed on the Taiga shield. In 2015, there was a shift in dominant severity to the singed class on the Taiga plains.
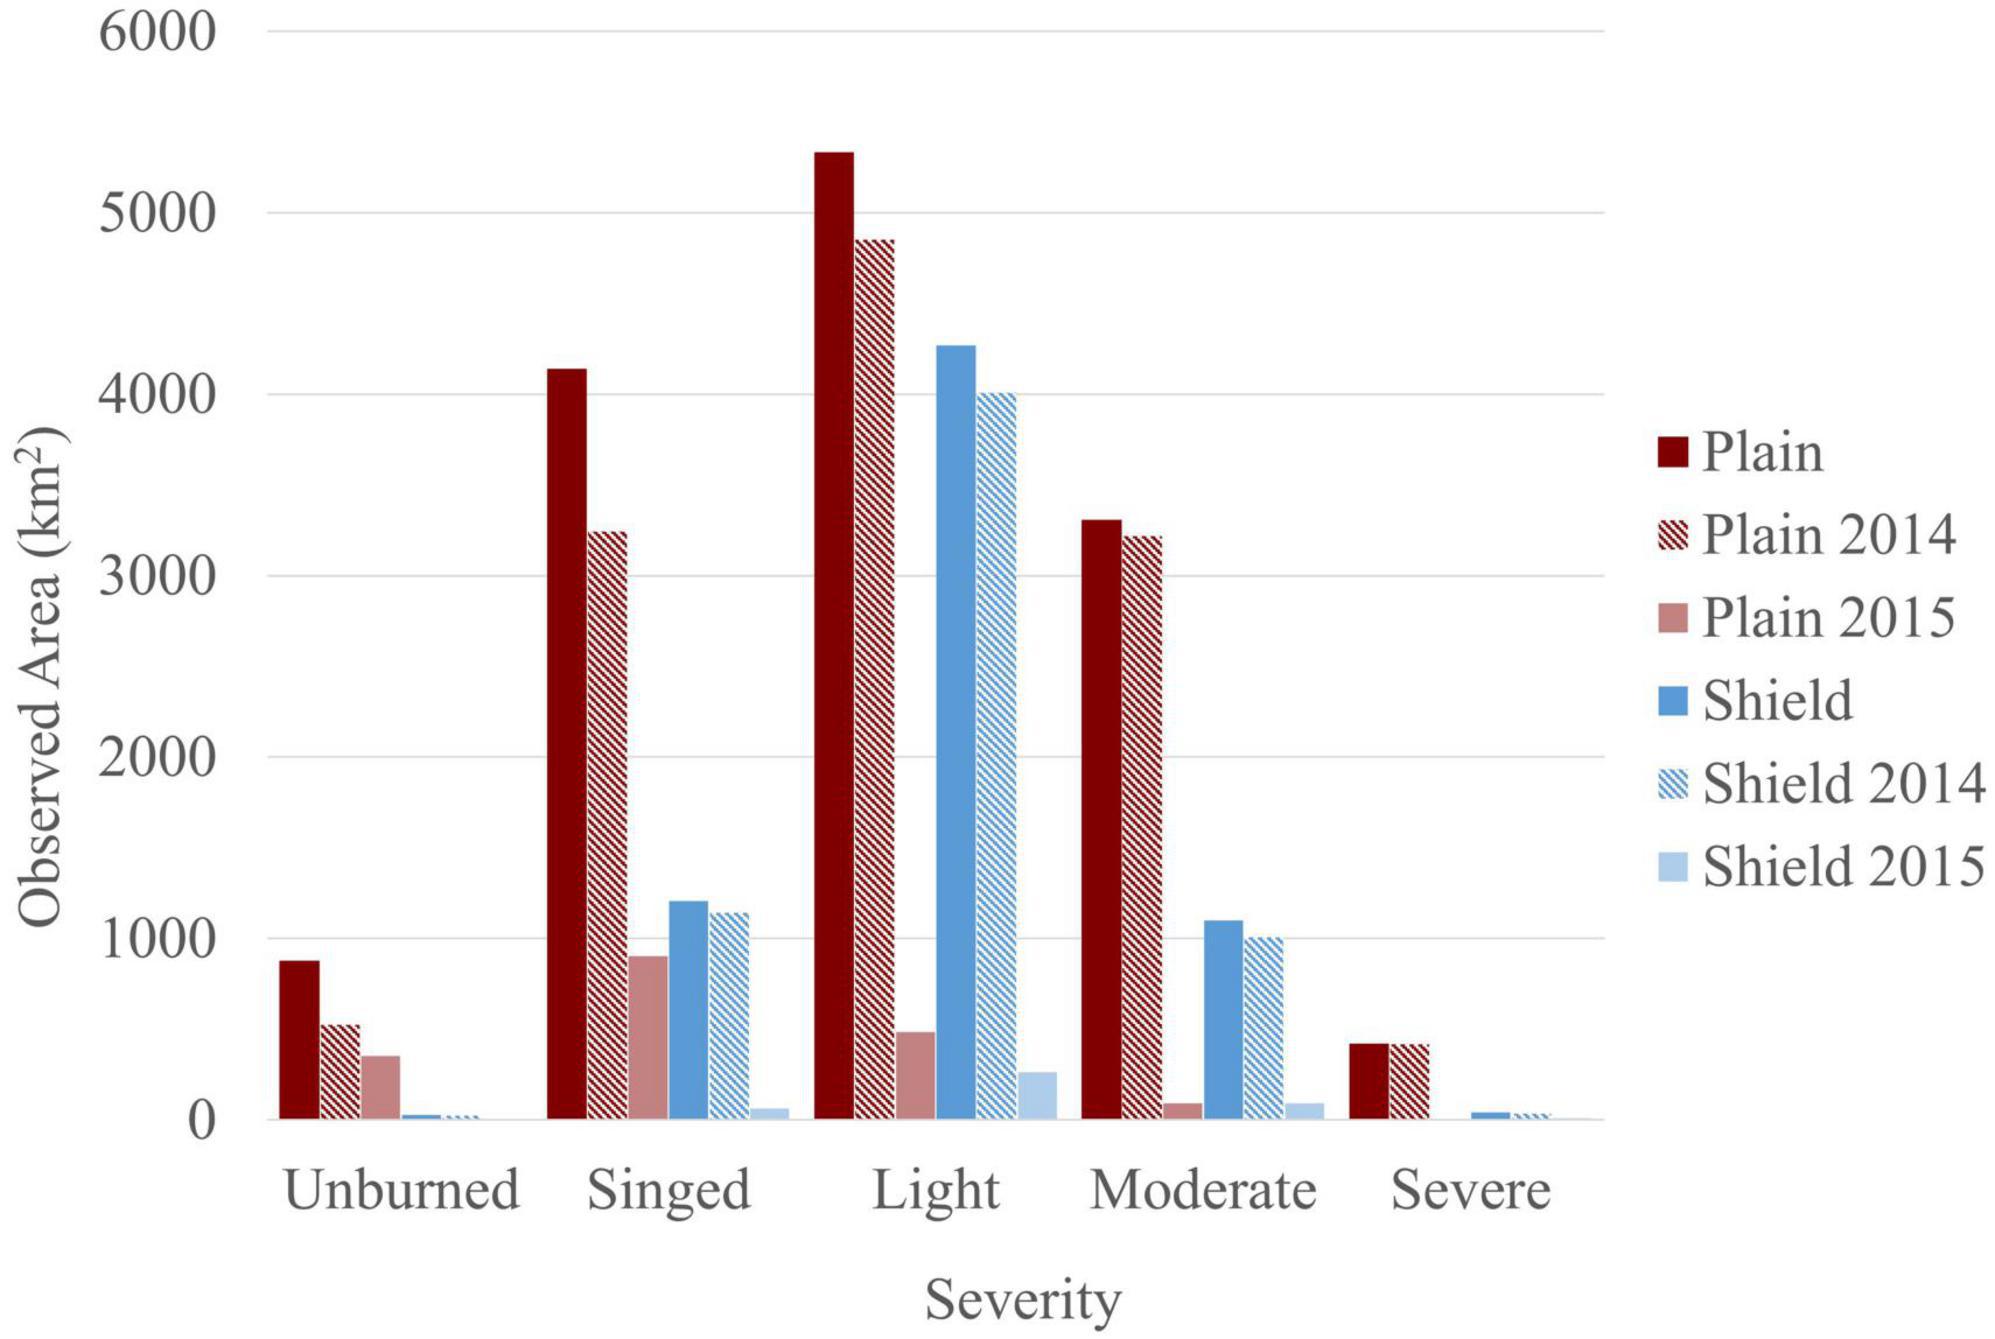
Figure 8. Plot of total observed area of each burn severity class by ecoregion and year of fire.
The distribution of burn severity by ecotype, ecoregion, and year (Figure 9) within the 132 fire perimeters shows upland conifer has a higher proportion of moderate or severe SOL burn severity than the other ecotypes. Although the actual area affected by wildfire was much smaller in 2015 than 2014, the proportional area of unburned and singed categories was greater in 2015 on the Taiga plains, whereas on the Taiga shield the severity of burn by ecotype between years appears to be similar.
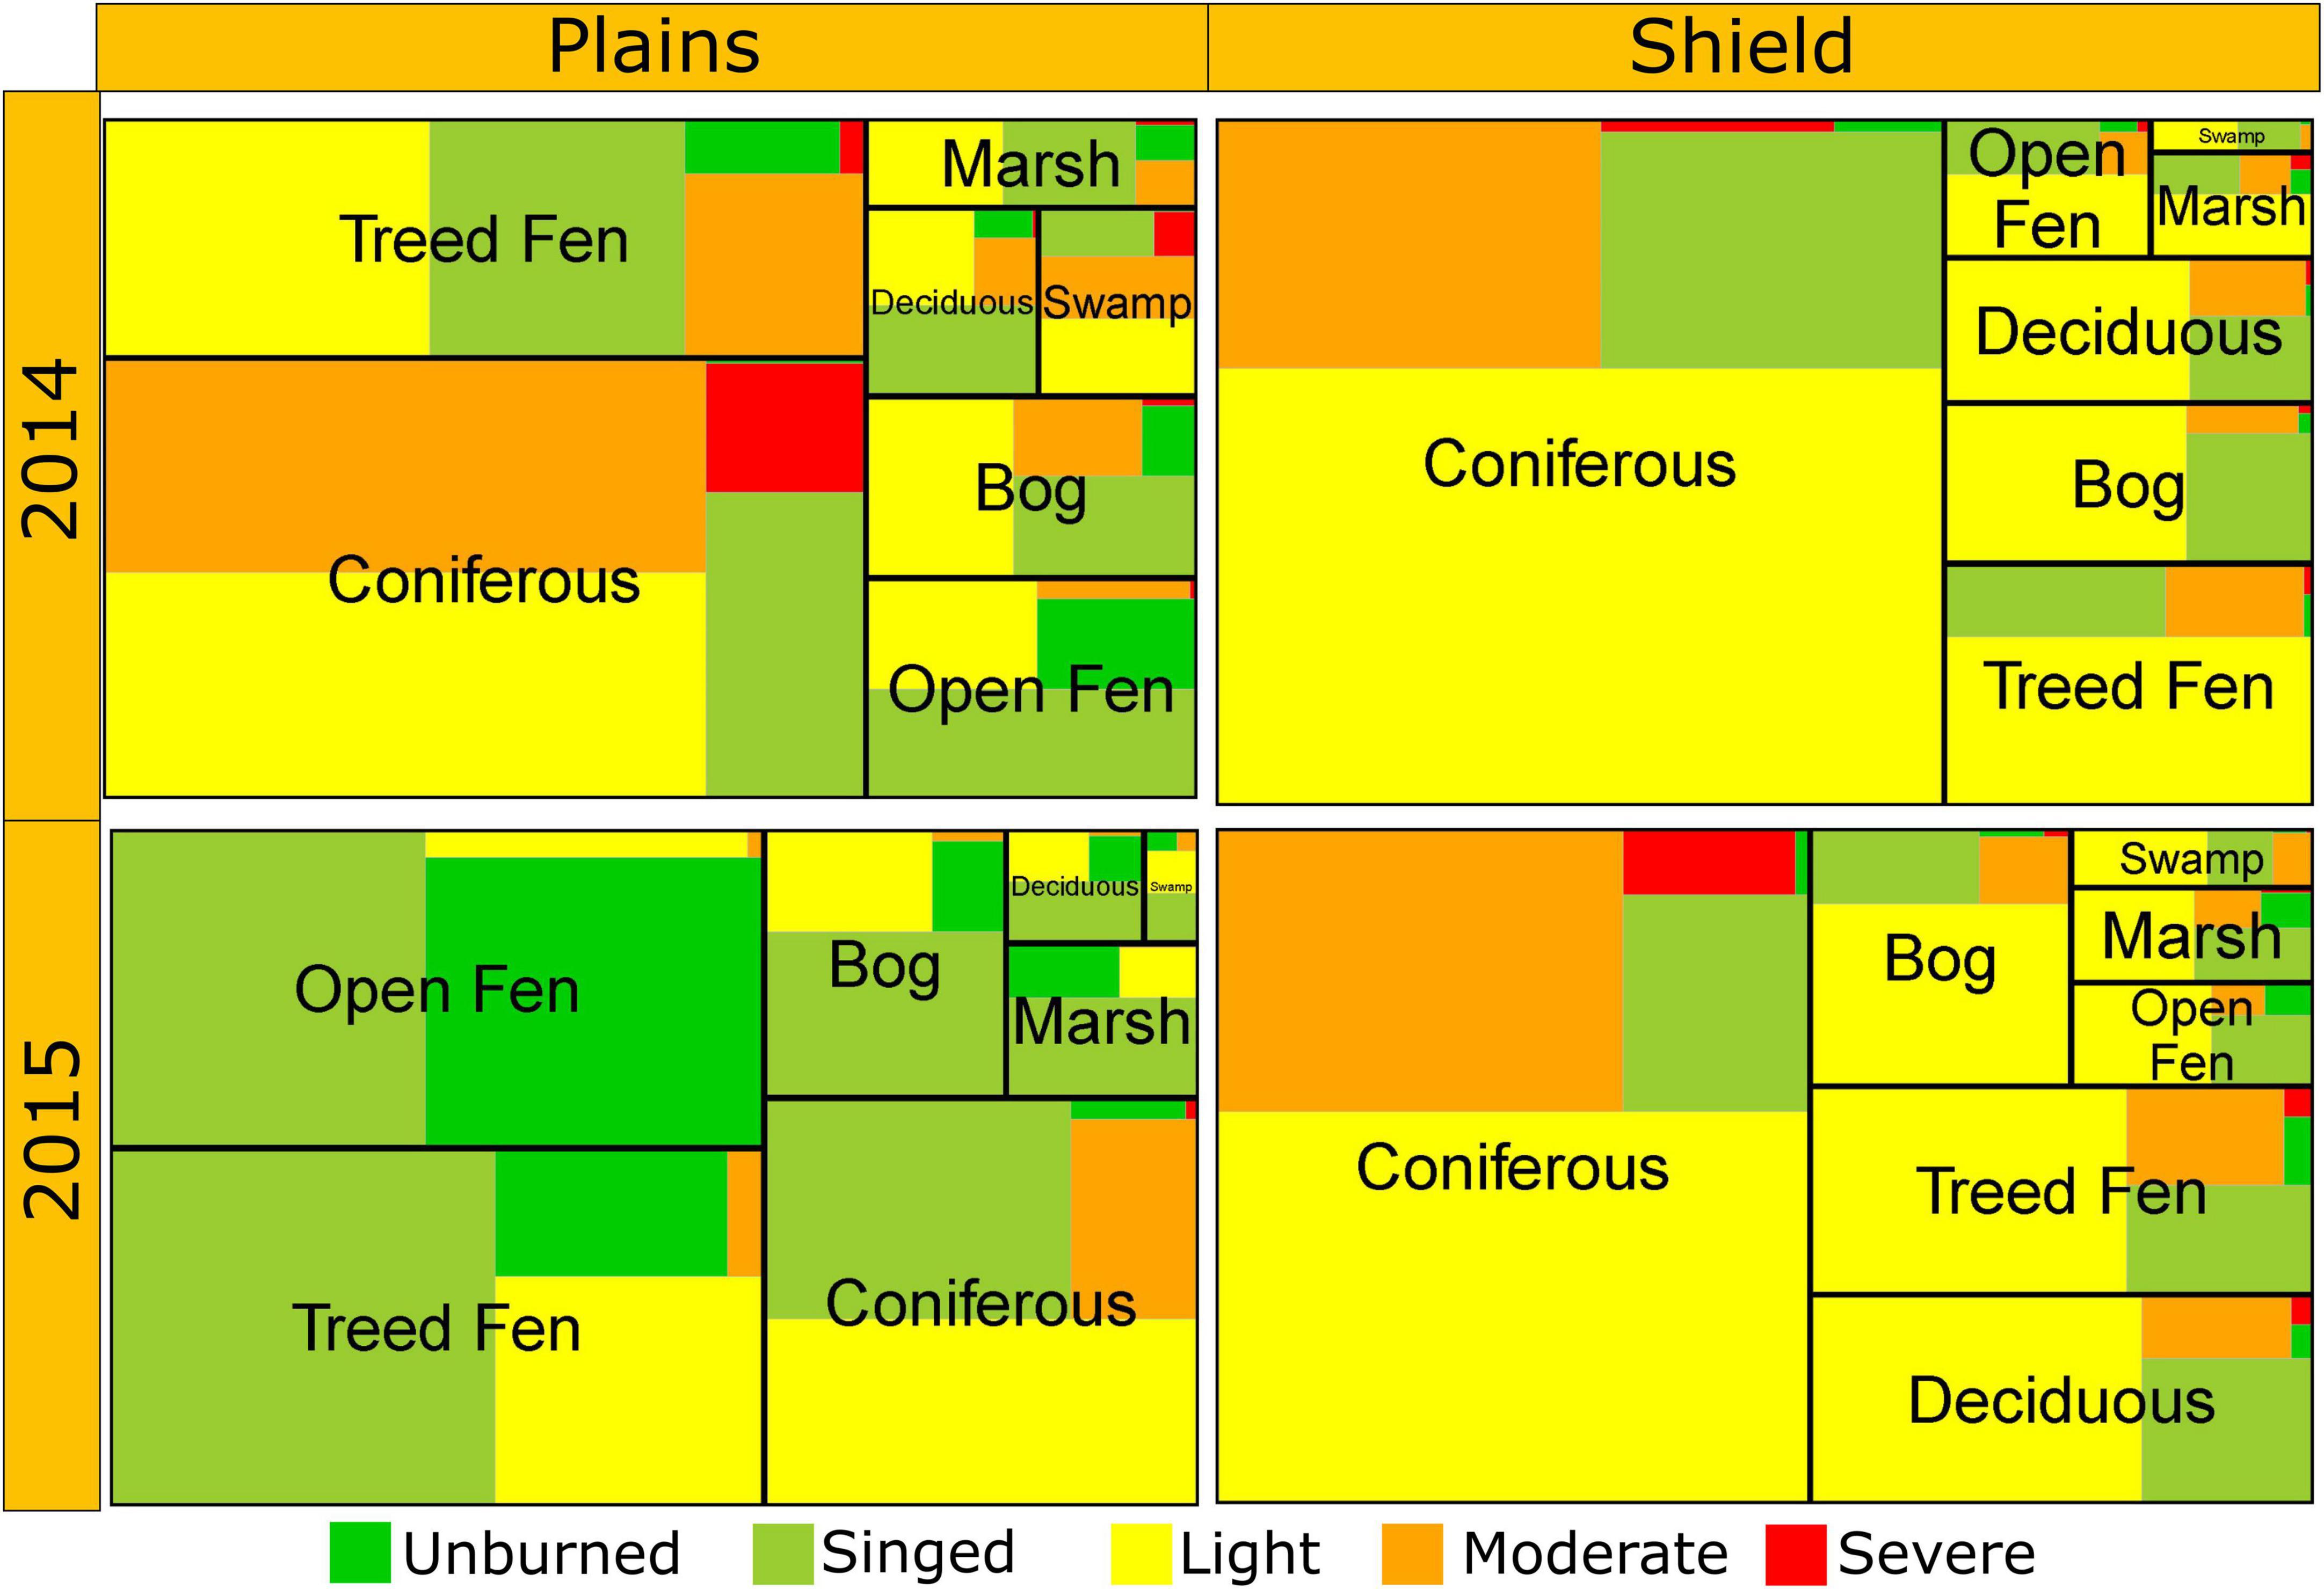
Figure 9. Treemap where the area of each box represents the proportion of that respective class and class/severity combination resulting from the intersection of the ecosystem and burn severity layers for Taiga shield (right column) vs. Taiga plains (left column) in 2014 (top row) vs. 2015 (bottom row). The area of each ecosystem type box is proportional to the area within the fire perimeter and area of each embedded colored burn severity class is proportional to the area within the ecosystem.
3.2.1 Ecoregion analysis
The chi-square goodness-of-fit analysis of the severity of organic soil burning on all 142 wildfires showed burn severity depended on ecoregion [Figure 10, χ2 = 521 (plains), 977 (shield), p << 0.0001]. In the Taiga plains, more area than expected was burned moderately (observed/expected ratio 1.18) and severely (observed/expected ratio 1.38) but more area was also left unburned (observed/expected ratio 1.45) or was categorized as singed (observed/expected ratio 1.09). In the Taiga shield, burn area was much less patchy than on the plains. Here, less area than expected was left unburned (observed/expected ratio 0.10) or burned in the singed (observed/expected ratio 0.67), moderate (observed/expected ratio 0.83), or severe category (observed/expected ratio 0.30), while more than expected (observed/expected ratio 1.38) burned with light severity.
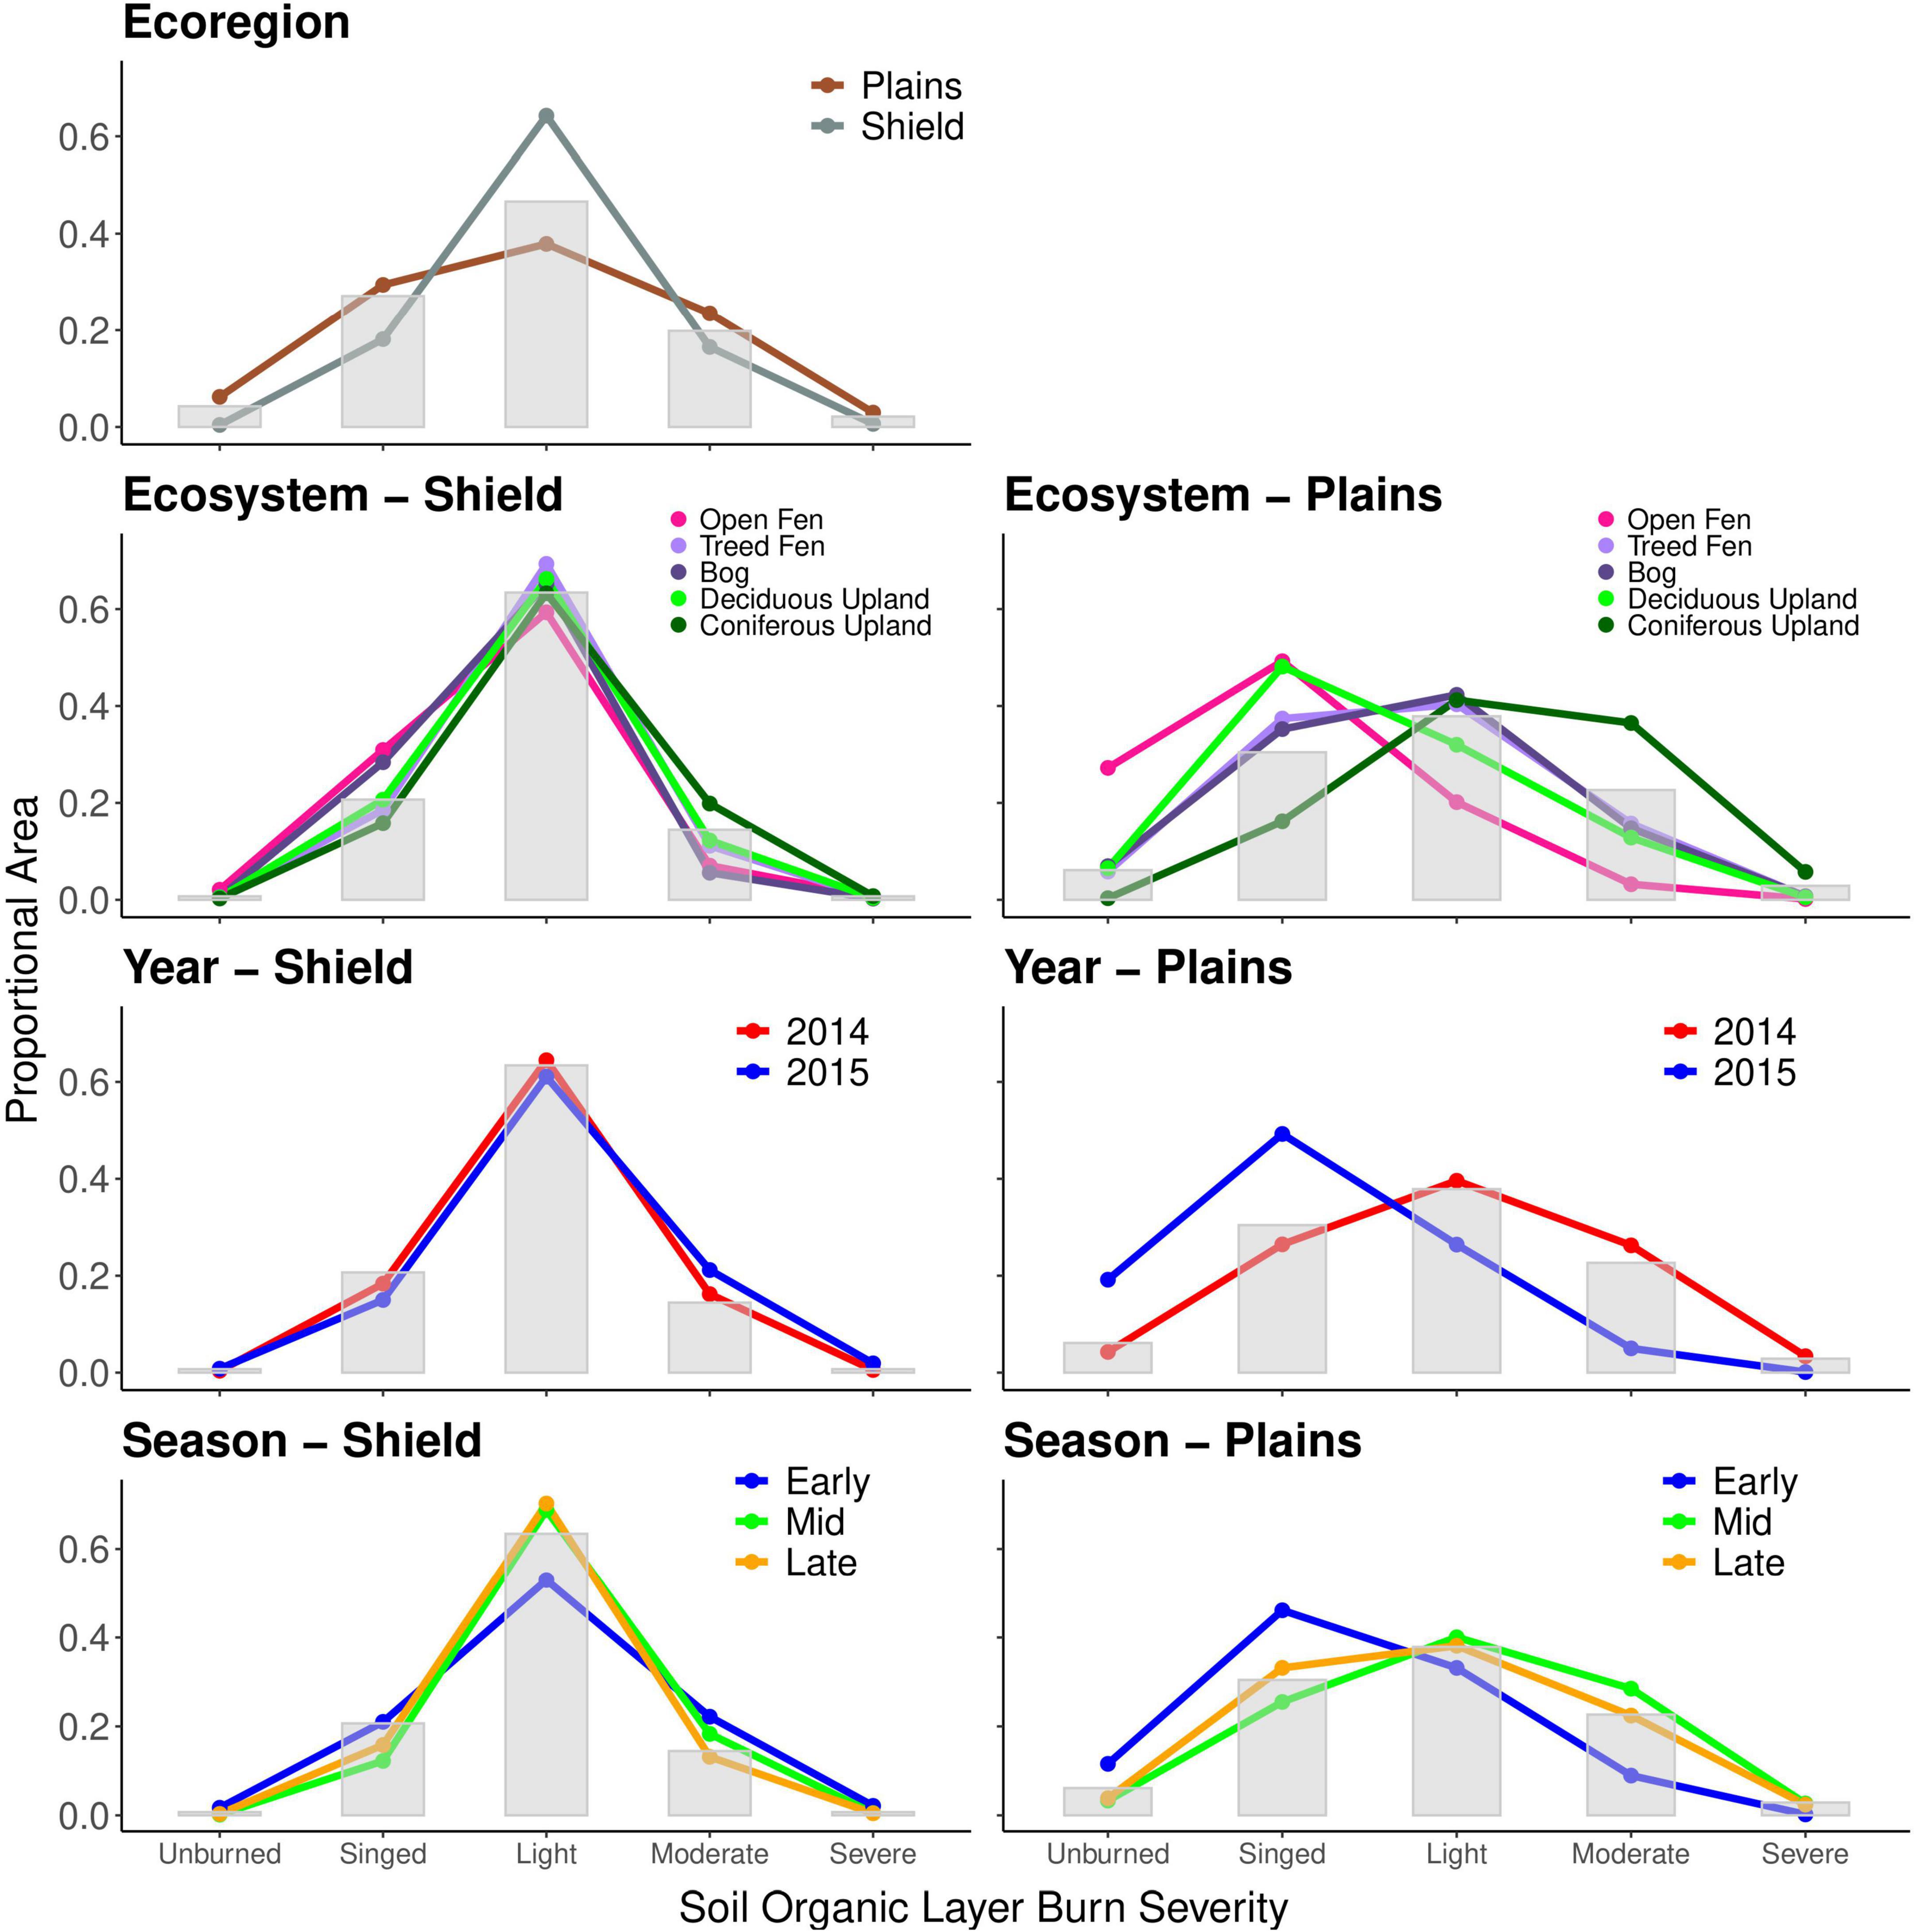
Figure 10. Expected (gray bars) and actual proportional area (colored lines and points) showing sensitivity to wildfire (burn severity) by ecoregion on the Taiga plains, by ecosystem type on the Taiga shield, by Ecosystem type on the Taiga plains, by year on the Taiga shield, by year on the Taiga plains, by season on the Taiga shield, and by season on the Taiga plains.
3.2.2 Ecotype analysis
Just as area burned was found to be dependent on ecotype on the Taiga plains, burn severity was also found to be dependent on ecotype (Supplementary Table 3). For the Taiga shield, patterns of burn severity were dependent on ecotype for the peatland classes and coniferous uplands (Figure 10) even though area burned was not dependent on ecotype. Burn severity in deciduous uplands in the Taiga shield was as expected (χ2 = 3.5, p = 0.47).
In the Taiga plains, the upland conifer ecotype had more burned area than expected in the moderate (1.60 observed/expected ratio) or severe (2.0 observed/expected ratio) severity classes and less area in the unburned (0.55 observed/expected ratio) and singed (0.53 observed/expected ratio) severity classes. Peatland classes (open fen, treed fen, and bog) had less burned area than expected with moderate to severe categories (open fen 0.05–0.14 observed/expected ratio, treed fen 0.23–0.69, bog 0.25–0.65) and more burned area than expected in the singed class (open fen 1.61, treed fen 1.23, bog 1.16 observed/expected ratio). Open peatlands had dramatically more area left unburned (observed/expected ratio 4.45). Peatlands were burned with lower severity overall than upland conifer.
For the Taiga Shield, upland conifer had more area than expected burned at moderate (1.37 observed/expected ratio) and severe (1.05 observed/expected ratio) classes and again, less area in the singed (0.76 observed/expected ratio) and unburned classes (0.39 observed/expected ratio, Figure 10). Open peatlands in the Taiga shield also had much more area left unburned (2.87 observed/expected ratio) or singed than expected (1.49 observed/expected ratio). Treed peatlands in the Taiga shield had more area burned with light severity (treed fen 1.09, bog 1.03 observed/expected ratio) and less area than expected left unburned (treed fen 0.81 bog 0.73 observed/expected ratio) or burned at moderate or severe categories (0.69, 0.23 treed fen, 0.65, 0.26 bog observed/expected ratio). Treed fens had less singed area than expected (0.89 observed/expected ratio) and bogs had more than expected (1.37 observed/expected ratio).
3.2.3 Fire seasonality analysis
The intersection of the remote sensing products (fire progression, ecotype maps, and burn severity maps) allowed us to explicitly assess how much, and how severely, different peatland, and upland land covers burned. Many of the fire events burned over several weeks to months. In 2014–2015 the largest burn extents occurred in July (mid-season) followed by August (late season, Figure 11).
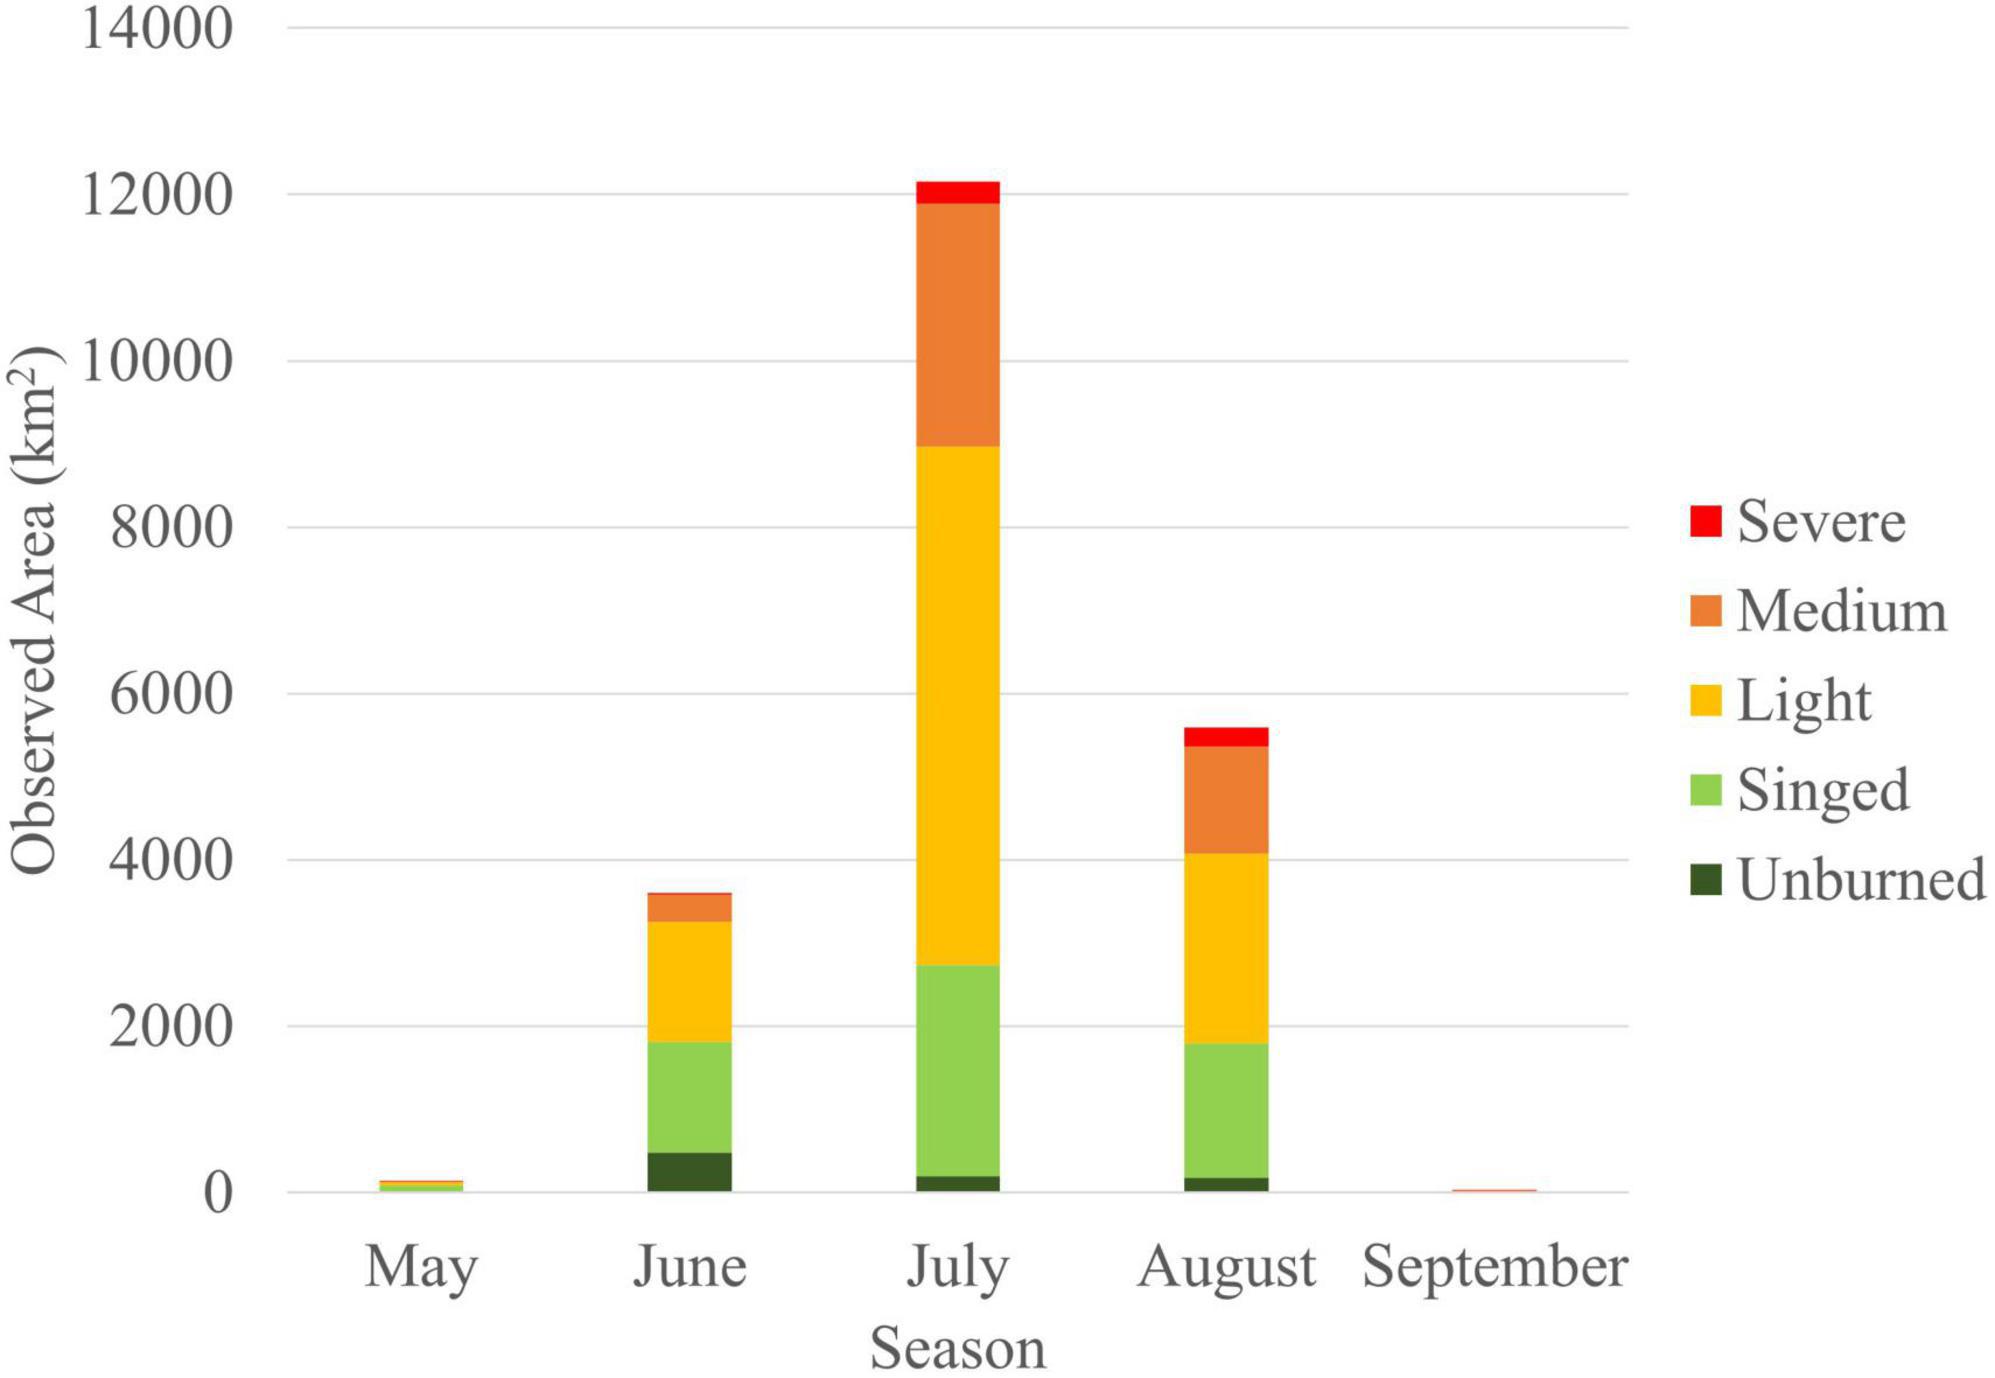
Figure 11. Distribution of fire area by severity from May to September 2014–2015.
Burn severity across the region was found to be dependent on season (Supplementary Table 3). The chi-square goodness-of-fit tests showed preferential burning in the Taiga plains in all seasons and for early and mid-season in the Taiga shield (Figure 10; Supplementary Table 4). The late season fires in the Taiga shield burned as expected.
Most burning on the Taiga plains occurred in the middle season, with more area burned moderately (BSI-3) than expected (1.26 observed/expected ratio), and less area burned moderately in the early (0.39 observed/expected ratio) and late season (0.99 observed/expected ratio). Early season burns in the Taiga plains resulted in much more area left unburned than expected (1.89 observed/expected ratio) or singed (1.51 observed/expected ratio) and late season burns resulted in more area singed than expected (1.09 observed/expected ratio).
In the Taiga shield, early season burns had more area than expected both left unburned (2.36 observed/expected ratio) or with moderate (1.53 observed/expected ratio) and severe category burns (2.95 observed/expected ratio). Mid-season, moderate severity burns in the Taiga shield occurred more than expected (1.27 observed/expected ratio) but to a lesser extent than early season.
When effect of season on burn severity by ecotype was assessed, all chi-square goodness-of-fit tests were significant for the Taiga plains ecoregion, therefore, burn severity per ecotype is dependent on season on the Taiga plains (Supplementary Table 3; Figure 12). In the early season, 5.6 times more area of open fen was left unburned than was expected and 1.8 (observed/expected ratio) times as much was singed than expected. Similar trends are seen in the mid and late seasons for this ecotype. In the early season, treed fen and bog had nearly 2 times as much area left as singed and 1.25 times as much unburned than expected. These peatland classes had much lower than expected amounts in the moderate and severe categories (0.01–0.16). Deciduous forest showed a similar trend. The mid-season and late season had more treed peatland area in singed (1.06–1.11) and light burn (1.12–1.25) severities than expected. Upland conifer shifted from more light burn than expected in the spring (1.4) to include more moderate and severe burning than expected in the mid and late seasons (1.5–1.8; Supplementary Table 3; Figure 12).
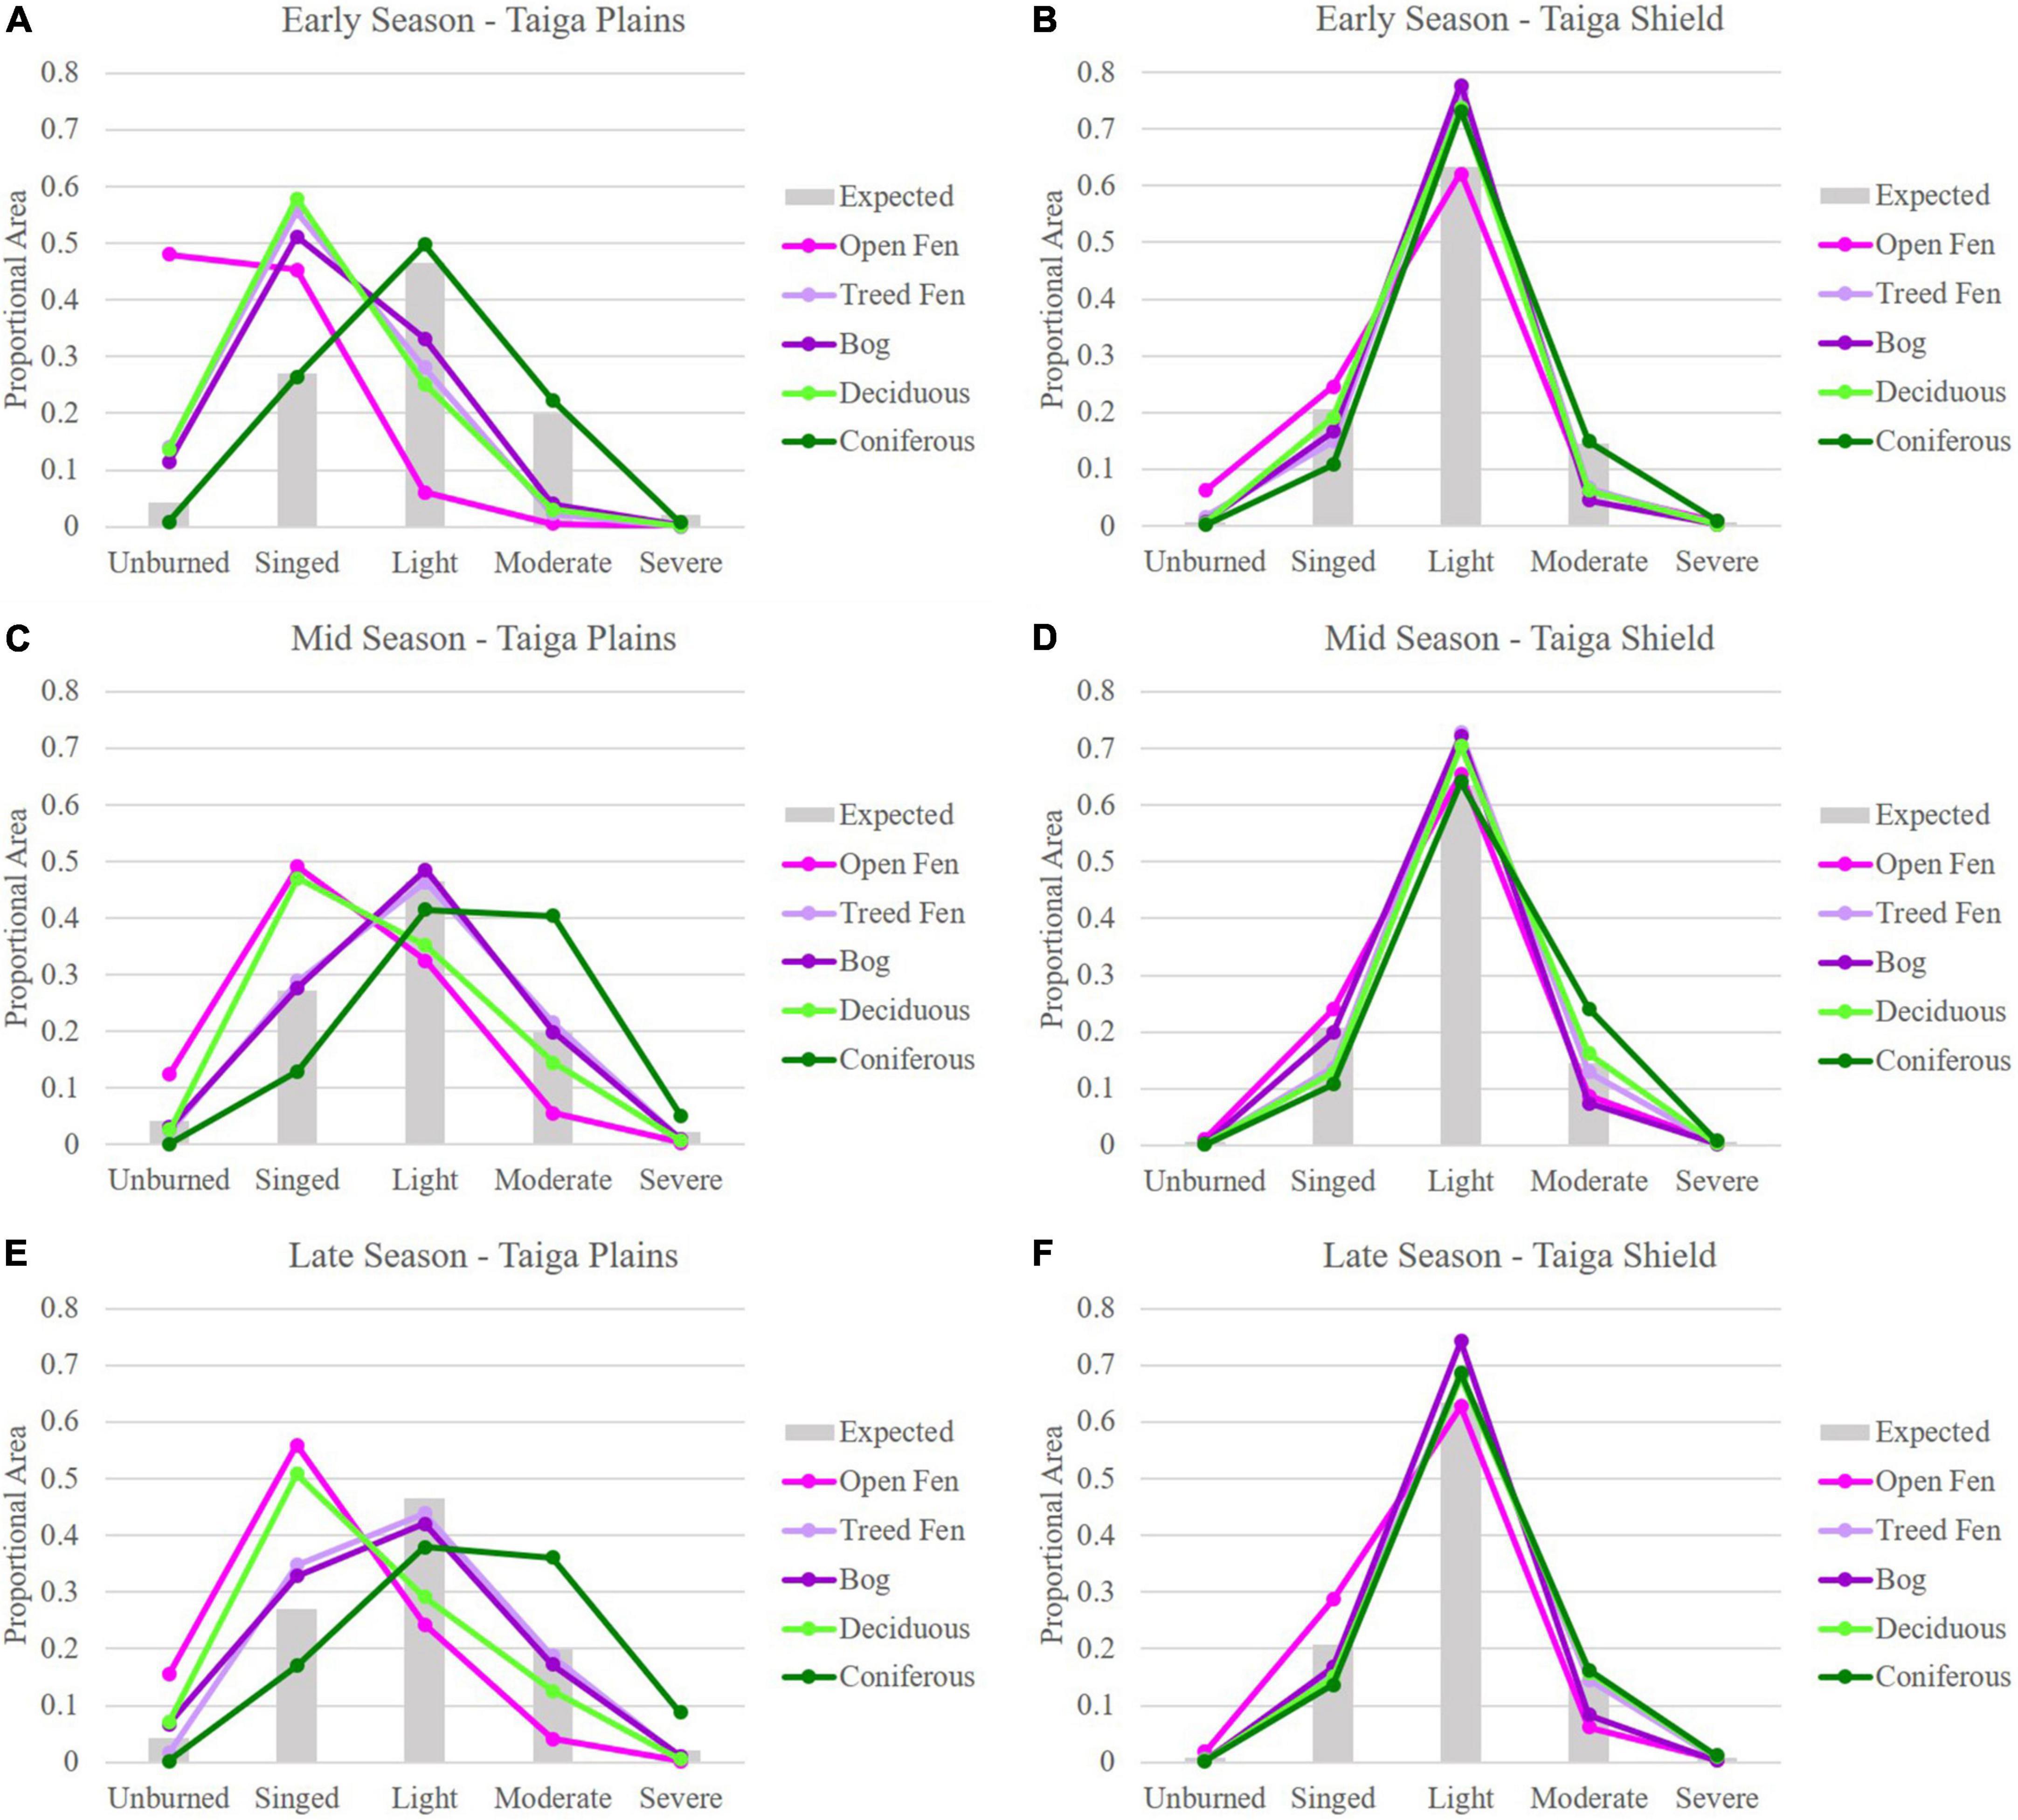
Figure 12. Plots of expected (gray bars) and actual proportional area of each burn severity for each ecotype by (A) early season on the Taiga plains; (B) early season on the Taiga shield; (C) mid-season on the Taiga plains; (D) mid-season on the Taiga shield; (E) late season on the Taiga plains; and (F) late season on the Taiga shield.
For the Taiga shield, chi-square goodness-of-fit tests were only significant for open fen and conifer upland in the spring and for treed fen, bog and conifer in the mid-season (Supplementary Table 3). No tests were significant on the Taiga shield in the late season, meaning all ecotypes were burning as expected. On the Taiga shield the higher amounts of unburned and singed burn classes in the early season are evident, similar to the Taiga plains, while the upland conifer is experiencing greater moderate and severe burn severities. In the mid-season, the treed peatlands have more light burn than expected, as does upland conifer. Upland conifer also has more moderate burn than expected in the mid-season.
3.2.4 Year of burn analysis
Burn severity was dependent on year of burn for both ecoregions (χ2 = 223, 1089 Plains 2014, 2015, p < 0.0001, χ2 = 42, 29 Shield 2014, 2015, p < 0.0001, Figure 10). The first year of the drought conditions in the Taiga plains resulted in less area than expected remaining unburned (0.70 observed/expected ratio) or singed (0.86 observed/expected ratio) and more area than expected burned with moderate (1.15 observed/expected ratio) and severe classes (1.17 observed/expected ratio). However, in 2015, much more area than expected was left unburned (3.13 observed/expected ratio) or singed (1.62 observed/expected ratio) and much less area burned with moderate (0.22 observed/expected ratio) and severe (0.04 observed/expected ratio) severity classes. The other difference between these years was the size of the fires, with 2015 having much smaller fire size.
Soil organic layer burn severity on the Taiga shield was higher in 2015 than 2014 in spite of smaller fire extents. In the Taiga shield during 2014, more area than expected burned with moderate severity (1.12 observed/expected ratio) and light severity (1.02 observed/expected ratio) while less area than expected was left unburned (0.55 observed/expected ratio), singed (0.89 observed/expected ratio), and severe (0.76 observed/expected ratio). However, in the second year of drought conditions, sensitivity to burn severity increased with more area than expected burned moderately (1.46 observed/expected ratio) or severely (2.65 observed/expected ratio).
4 Discussion
In this analysis we used geospatial information on ecotype specific SOL burn severity and burned area extent to provide insight into the susceptibility of various ecosystem types to fire. In this section, we structured the discussion of our results around the research hypotheses as listed in the Section “1 Introduction.”
4.1 Unburned islands analysis
The large (>18 ha) unburned islands of this 2014–2015 study represented merely 4% of the area within the 142 wildfire perimeters. However, this did vary by fire year, with proportionally more area left as unburned islands in 2015 (11.2%) than 2014 (2.8%). Despite our expectations (e.g., Burton et al., 2008), we did not find a statistical relationship between the size of the fire and size of unburned patches within fire boundaries (Kendall’s rank correlation tau = 0.04, p = 0.17). Nor did we find a difference in mean patch sizes between fire years which were dramatically different in total area burned (mean patch size of ∼161 ha with a median of ∼39 ha for each year). This contrasts with our hypothesis and the findings of Burton et al. (2008) who found the total area left unburned within fire events of the Great Slave Lake study region to be on average proportional to fire size. The fact that proportionally more area was left as unburned islands in the smaller fire year (2015) than the larger fire year (2014) seems to support findings of a study of western U.S. wildfires by Kolden et al. (2012). They determined that the proportional area left unburned decreased with increasing fire size and severity. However, statistically our data did not show any relationship between fire size and unburned island sizes.
The extreme drought of 2014–2015 seems to have affected the number and size of unburned islands in our study area, with relatively few remaining on the landscape. Although previous studies of unburned islands have been highly variable in the proportions estimated to have been left on the landscape [14–37% (Kolden et al., 2012), 20% (Meddens et al., 2016), 4–17% (Burton et al., 2008)], the proportion we found is on the smaller end (4%). Most wildfires leave some unburned islands within their perimeters, but the degree to which they occur on the landscape and why some ecotypes burn preferentially appears to be a function of landscape position, fuel loading, and fire weather.
We found the most notable ecotype with unburned islands across the 2014–2015 wildfires was open fen (Figure 5). Unburned islands on the plains were dominated by peatlands (83% of the area), whereas in the limited unburned islands of the shield, 45% of the area consisted of peatlands. There were too few unburned patches on the shield to draw any substantial conclusions, but in this extreme drought year unburned islands were rare and consisted of both peatland and upland ecotypes. To assess the proximity of unburned areas to upland conifer, we measured what ecotypes were within a buffer of 500 m from the unburned islands. On the plains the buffer regions were dominated by peatlands (60%), with 22% of the area classified as upland conifer. In contrast, for the shield, the buffer area was dominated by upland conifer (39%) followed by treed fen (13%) and exposed rock (13%). On average, unburned islands were at lower lying positions on the landscape at all scales for both ecoregions and primarily within wetter sites and those with lower fuel loading (e.g., open fens). This is consistent with observations of Whitman et al. (2018) for the region, and others have also found that non-forested landscapes had more area left unburned than forested areas (Meddens et al., 2016).
Despite having a highly fragmented landscape with 42% unburnable (water/exposed bedrock) cover on the Taiga shield, there were few unburned islands and on average > 92% of the area within fire perimeters burned. In contrast, the Taiga plains, which has deeper, denser soils and large complexes of wetlands, demonstrated moderate to high continuity of fuels due to extreme drought, allowing for wildfire spread resulting in large fires. There were many more > 18 ha unburned islands found on the Taiga plains than on the shield suggesting that some areas continued to have high water tables. de Groot et al. (2009) demonstrated that the water table depth, moisture content, bulk density, mineral soil content, and depth of the forest floor all contribute to variation in consumption of the forest floor. The Taiga plains also has large wetland complexes with high water tables and lower woody biomass that cause fire intensity to diminish. In particular, open fens make up a much larger proportion of the landscape on the Taiga plains in comparison to the Taiga shield. Therefore, it is not surprising that fens accounted for more of the unburned and singed patches across the plains landscape.
4.2 Ecoregion analysis
We found significant differences in the distribution of unburned islands and burn severity on the Taiga plains and shield (Figures 9, 10) which both reside within the same fire regime (Boulanger et al., 2014). Statistically (χ2), severity of burn depended on ecoregion (Supplementary Table 3). More area than expected burned in the Taiga plains with moderate and severe categories. More area than expected was also left unburned (Figure 10). Burn patterns were less patchy on the Taiga shield with more area than expected burning in the light category and less than expected in all other burn categories. The ecoregions also differed in terms of which ecotypes were burning and at what severities (Figure 10). The Taiga shield experienced greater proportional area burned across all ecotypes (>95%) than the Taiga plains, with very low amounts of unburned areas remaining (Figure 8). The Taiga plains, on the other hand, showed more variation in burn severity by ecotype.
These results suggest ecoregion plays a large role in how much burned vs. unburned areas are being left on the landscape in extreme drought conditions. The fragmentation of the landscape on the Taiga shield by unburnable areas (lakes and exposed bedrock), does not appear to be reducing fire spread or acting as effective fire breaks, negating our hypothesis. Further, the less fragmented (by unburnable land) Taiga plains landscape does not appear to have been dry enough for continuity of fuels to sustain wildfire. While more area than expected burned severely in the plains, there also was more area than expected left unburned. Thus, our hypothesis that the continuous fuels of the plains should result in more area and deeper burning was not confirmed.
4.3 Ecotype analysis
For the Taiga shield, our results showed consistency across ecotypes in proportional area burned at the various fire severities (Figure 12), with a dominance of light burn severity across ecotypes, in all seasons and in both 2014 and 2015 (Figure 10). In contrast the wildfire on the Taiga plains affected large areas, but burn severity within fire events was much patchier than on the shield, and larger differences were observed across seasons of fire (Figures 10, 12) and years of fire (Figure 10).
Large within-event variability in severity is typical of Canadian fires (Guindon et al., 2021). As fires increase in size they are more likely to affect a diversity of fuel types which may burn at a range of severities as a function of diversity of vegetation types, structure, landscape position, and fire weather conditions that develop as large fires burn over multiple days to weeks to months (Guindon et al., 2021). In examinations of severity among vegetation types in several other studies, researchers have found strong associations between vegetation type and burn severity. In eastern Australian montane rain forests, Clarke et al. (2014) suggested that severity was strongly moderated by vegetation structure, moisture, and density. Similarly, in an analysis of wildfires in boreal China, Fang et al. (2015) found that vegetation type was strongly associated with severity, while fire size was more associated with weather. Wildfires are a weather and climate driven disturbance but fire effects have often been qualified as a function of fuel type and moisture conditions (Whitman et al., 2018). In their structural equation modeling of drivers of burn severity (defined as g C consumed per m2) in boreal North America, Walker et al. (2020b) found fine scale drainage, overstory tree species, and fuel availability to be more important for predicting C-combustion in boreal North America than fire weather or climate.
The Taiga plains experienced preferential burning with upland conifer, having more area (Figure 5) and more severe burning (2 times more than expected) than other ecotypes (Figure 9; Supplementary Table 3). Two of the dominant upland conifer species, black spruce, and jack pine, are fire-adapted and highly flammable, often hanging onto lower dead branches that act as fuel ladders. As expected, open fens were found to burn the least, exhibiting lower burn severity and more unburned islands (4.45 times as much area as expected on the plains and 2.9 times more area on the shield, Supplementary Table 3), most likely due to high water tables and lack of forest fuels (trees < 7% cover). Open fens burned much less than expected across all groupings (observed/expected ratios 0.67–0.91), even lower than marshes (observed/expected ratios 0.96–1.00). Proportionally, treed peatlands (bogs and fens) burned more extensively and with greater severity than open fens, as expected.
These observations are consistent with our hypotheses and results from Whitman et al. (2018), based on field studies of 51 sites across 6 large 2014 wildfires of this region. They found peatlands to have consistently lower burn severities and attributed that to the higher soil moisture and the lower fuel loadings and basal areas when compared to upland conifer.
4.4 Fire seasonality analysis
Burn severity was dependent on season of burn in both the Taiga shield and plains (χ2, Supplementary Table 3) with preferential burning occurring in all seasons except late season on the Taiga shield which burned as expected. In contrast to our hypothesis, we did not find late-season fires to consume more area or burn more severely in general in these extreme years of drought. The observed decrease in burn severity at the end of the fire season may be related to longer nights when cooler and more humid air allows rewetting of fine fuels (Guindon et al., 2021). The fact that the mid-season (July) had the most area and most severe burning is consistent with results found by Guindon et al. (2021) in their analysis of severity of burn across Canada, mapped by dNBR (primarily a measure of canopy fire) in 1985–2015. Consistent with our results, they also found overall lower burn area and burn severity in the early season. In the Taiga shield, early season burns had more area than expected both left unburned (2.4 observed/expected ratio) or with moderate (1.5 observed/expected ratio) and severe category burns (2.95 observed/expected ratio). This suggests that the Taiga shield is vulnerable to early season fires occurring before leaves are flushing, when the ground fuels are cured in the extreme drought conditions. Mid-season burns in the Taiga shield also had an increase in moderately burned area (1.3 observed/expected ratio) but to a lesser extent than early season.
Seasonality appears to have more of an interaction with ecotype in burn severity on the plains than it did on the shield (Figure 12). While we found that treed peatland, upland conifer and swamps burned more area than expected in the early season on the plains, the severity of burn was lower than expected (more area left unburned and singed, Figure 12). Across both ecoregions, upland conifer was burning with the greatest severity, particularly in the mid- and late seasons and treed peatlands had more area burning in the light category than expected in the mid-season.
4.5 Year of fire analysis
Burn severity was found to be dependent on year of burn for both ecoregions (χ2, Supplementary Table 3), but our results with relation to large fire sizes in 2014 and 2 years of drought in 2015 leading to more severe burning differed by ecoregion. While fire sizes were dramatically different in 2014 and 2015, similar patterns of burn severity were observed in both years on the Taiga shield, with some shifts to higher burn severity than expected in 2015 (Figures 9, 10). In the Taiga shield, more area than expected burned during 2014 with moderate severity (1.12 observed/expected ratio) and light severity (1.02 observed/expected ratio) while less area than expected burned severely (0.76 observed/expected ratio). However, in the second year of drought conditions, sensitivity to burn severity increased with more area than expected burning moderately (1.46 observed/expected ratio) or severely (2.65 observed/expected ratio). Two years of drought conditions on water tables and moss-dominated soil moisture seemed to have a great impact on severity of burn on the Taiga shield, where soils are shallower in general, but this was not true on the Taiga plains.
For the Taiga plains, there was a shift to lower burn severity categories in 2015 (Figures 9, 10). Although area burned in 2015 on the plains was greater than expected for coniferous upland, swamp, and treed peatlands, the burn severity was lower. For the Taiga plains overall, the burn severity was higher in 2014, the larger fire year. This is consistent with the assertion that large fire size is associated with high fire intensity and severity leading to deep burning of SOL (Walker et al., 2018).
The landscapes of the Taiga shield and plains are so different, that the effects of drought and associations with large fire size and burn severity are complicated by topography, hydrological conditions, and fire weather, which are all large drivers of wildfire patterns and effects. Season of burn, timing of typical rainfall patterns resuming mid-summer of 2015, and wind may also have played a role in the burn severity outcomes.
4.6 Extreme drought/continuity of fuels analysis
In extreme fire years, some researchers (e.g., Dillon et al., 2011) have reported that there is less distinction between topographic and landscape controls on burn severity, because all ecotypes become dry in extreme conditions, reducing fine-scale heterogeneity in fire effects (Littell et al., 2016). However, based on structural characteristics, different vegetation types may experience fire differently between normal and extreme fire weather (Clarke et al., 2014). In a recent study of landscape connectivity during drought, Thompson et al. (2019) asserted that for peatlands dominated by mosses and shrubs that the threshold for connectivity of uplands and lowlands is only reached when water tables exceed depths of 40 cm to allow surface fuels to become dry. While for non-moss (sedge) dominated fens the water table needs to exceed depths of 25 cm. Our results for the Taiga shield, which show that area burned was as expected for all ecotypes at first seems to support the previous findings of Dillon et al. (2011) and Littell et al. (2016). The rocky landscape, with greater topographic gradients and shallow soils of the shield seemed to have reached the threshold of drought conditions in 2014–2015, where the landscape became connected, and all ecotypes had high susceptibility to wildfire. All ecotypes were burned on the Taiga shield in these extreme years, even emergent wetland marshes (Figures 6–9), however, the severity of burn varied. On the Taiga shield, the upland conifer ecotype had more area than expected burned at a moderate or severe class while peatlands (fens, bogs) had less area than expected burned in those classes.
For the Taiga plains, it appears that many of the peatlands must not have reached the water table depth thresholds cited by Thompson et al. (2019) because we found lighter burning and more unburned islands to occur across the landscape, within bogs and fens in particular. Further, on the Taiga plains the various ecotypes had both area and severity of burn occurring preferentially on the landscape. Here, all peatlands had more area singed than expected and the open peatlands and bogs had more unburned islands. Thus, the wetlands of the Taiga plains acted more to fragment the landscape than the exposed bedrock and water bodies of the Taiga shield.
The shallow soils of the Taiga shield, topography, and smaller peatland sizes are likely a factor in allowing these drier conditions to connect the landscape, across ecotypes (topoedaphic gradients) for continuity of wildfire (>95% of area burned within fire perimeters). This can likely be explained by the drought and drawdown of water tables on the Taiga shield, while areas of the Taiga plains must have remained wet enough to dampen wildfire and allow the wetter peatland/wetlands to act as fire breaks.
These observations support the concept that water table drawdown via extreme drought can lead to continuity of fuels or landscape connectivity of uplands and peatlands for widespread wildfire exposure (e.g., Thompson et al., 2019). However, it does not support the presumption that fine-scale heterogeneity of fire effects, mainly burn severity, are reduced under drought conditions because everything is dry (Dillon et al., 2011; Littell et al., 2016).
4.7 Overarching question: Are peatlands as vulnerable to burning as upland areas during the extreme drought of 2014–2015?
During drought conditions, wildfire in wetlands is more likely to occur, however, hydrology (soil moisture and water table position in peatlands) is a large driver of how well the fire carries as well as depth of burn in the organic peat layers. Nelson et al. (2021) developed a conceptual framework for peatland resilience and described the most resilient peatlands to be hydrologically well-connected to both ground water systems and larger peatland complexes. Based on this framework and our analysis, peatlands are less susceptible to wildfire on the Taiga plains, which contain large expanses of peatland/wetland complexes, and are dominated by fens that are hydrologically connected to groundwater. In contrast, peatlands are more susceptible to fire on the Taiga shield where they are smaller and hydrologically isolated on the rocky, fragmented landscape. We found the Taiga shield landscape to be more affected by wildfire with greater proportional areas burned with low variability (Figure 6). In addition, burning there was dominated by the light burn severity class, also with low variability (Figure 12). We found all ecotypes were highly susceptible to wildfire on the Taiga shield in both 2014 and in 2015 drought conditions (Figure 6). The upland conifer ecotype was highly susceptible to wildfire on both the Taiga shield and plains. Treed fen on the plains was moderately susceptible in 2014 and highly susceptible in 2015 and bog was the reverse in those years. The other ecotypes (besides upland conifer) were found to be moderately susceptible to wildfire.
Given that biophysical conditions affected by fire disturbance influence post-fire patterns of landscape recovery (Johnstone et al., 2016), the high burn area and evenness of burn severity to the SOL across the Taiga shield may lead to less spatial diversity in post-fire recovery within ecotypes. In contrast, the patchiness observed on the Taiga plains should lead to a greater diversity of seedbeds and post-fire patterns of recovery, which should make the landscape more resilient to future wildfire.
4.8 Limitations of study
The limitations of this study were mainly related to scale, years of study as well as field data collection constraints and map accuracies. While this study focused on the extreme drought conditions in 2014 and 2015 for a large area of the Taiga Shield and plains, it may not be representative of the fire effects to peatlands and uplands in more normal fire years. A longer temporal scale of study would allow for a more comprehensive understanding of burn exposure and sensitivity. The effects of scale may also impact the representativeness of this study to the larger boreal region. Regionally observed patterns may vary from global trends (e.g., Andela et al., 2017; Chuvieco et al., 2021) or from those of another boreal region [e.g., eastern and western Canada fire regime trend differences noted by Hanes et al. (2019)]. The peatland-rich Great Slave Lake study region, therefore, may not reflect fire dynamics throughout the entire Boreal and Taiga regions.
The remoteness of the study region restricted access to field sampling locations both in site selection and frequency of sampling dates. While attempts were made to select areas of varying fire severities based on initial dNBR and varying pre-fire ecotypes (based on field reconnaissance and high-resolution image interpretation) and seasons of burn, accessibility limited the number of sites that could be visited. This may have impacted the representativeness of both the ecotype map and the burn severity maps to the range of conditions that exist on the landscape.
The burn severity maps were based on repeat date imagery collected pre-fire and within 1–2 years after the fires to minimize effects of post-fire recovery on the imagery. However, ecosystems with particularly high resiliency and green-up between the fire and sampling dates may have biased severity estimates. In particular, many emergent marshes and some open, non-woody fens greened up within 1–2 years post-burn. While in the field, burn depth could be discerned in these ecosystems up to 2 years post-burn; by year 3 evidence of burn severity to the SOL was no longer measurable. This quick green up of graminoid vegetation could result in mis-assignment of burn severity to the “unburned” class in some cases. Thus, in this study, we may overestimate the amount of open fen and marsh that was unburned. In tree-canopied areas the severity metric is likely mixed to some degree with canopy burn severity. In many cases canopy and surface layer severity are correlated, though this is not always the case and remains an area of ongoing research (French et al., 2020a).
Although the overall accuracy of the peatland type map was quite high, there is some uncertainty within the map, particularly between transitioning ecosystems (e.g., open and treed fen). While we have quantified which classes are experiencing confusion, and to what degree for the entire map (Supplementary Table 1), we cannot determine the specific locations of inaccuracies. This may lead to some misrepresentation of burn severity by ecotype during the intersection of these datasets.
4.9 Next steps and relevance to climate
One of the next steps in understanding vulnerability of peatlands to wildfire is to further develop land system models that include hydrology and wildfire, allowing for future fire regime scenarios to be modeled and assessed for the Taiga shield and plains landscape. This will allow for a better understanding of the drivers of not only wildfire activity and severity of burn, but also post-fire regeneration. In particular it will provide a better understanding of thresholds of water table draw down on the Taiga plains to create connectivity for more widespread wildfire with deeper and more severe burning.
To more fully understand the vulnerability of these ecosystems to wildfire, there is a need to address the third element of ecosystem vulnerability (Vaillant et al., 2016; Weißhuhn et al., 2018), resiliency: or adaptive capacity measured as the regeneration of the dominant forest species (e.g., Picea mariana). Recent research has indicated that black spruce may be losing dominance in boreal North America due to the changing climate and increased wildfire (Baltzer et al., 2021). Black spruce is a keystone species of the boreal region due to its role in wildfire (Rogers et al., 2015) and it is the dominant tree species in uplands, bogs and treed fens. Understanding how black spruce are regenerating post fire in the peatlands vs. uplands in this study area is the focus of concurrent research. Such an assessment of peatland field data on post-fire regeneration is needed to determine what factors are driving decreases in black spruce regeneration, including co-dominance with deciduous broadleaf species and what factors may lead to regeneration failure.
Wildfire and climate are drivers of change in boreal ecosystems (Foster et al., 2022). Understanding the tipping point of drought conditions at which the landscape becomes connected, and peatlands are susceptible to wildfire with deeper burning of the organic soil layers is important for understanding the potential future effects of climate change and projected increases in wildfire on peatlands. This is critical for C accounting and climate mitigation strategies because, although peatlands have a rather small footprint on the Earth, they store more than 30% of global soil carbon. The largest C stocks are in boreal peatlands (78% of global peatland area, Leifeld and Menichetti, 2018) which are estimated to store 22.6–66.0 kg/m2 in the organic soils (Beaulne et al., 2021). This is more than twice that of boreal aboveground biomass C stock (Kasischke, 2000; de Groot et al., 2009). Documenting wildfire effects to these belowground layers are key for quantifying C emissions, understanding post-fire recovery and potential future fire effects.
5 Conclusion
In this wildfire study of the Taiga shield and plains where wildfire regimes are dominated by crown fires, we focused on burn severity to the organic horizons (SOL). We used empirical field data and remote sensing to assess the vulnerability of the landscape to wildfire by exposure (defined by areas burned and unburned islands by ecotype) and sensitivity (assessed by evaluating severity of burn to the soil organic layers). We found that in these extreme drought years (2014–2015), peatlands were more vulnerable to widespread burning on the Taiga shield than Taiga plains. Peatlands were as affected by wildfire on the Taiga shield as uplands in terms of proportional area burned, with few unburned islands remaining to act as fire refugia. For the Taiga plains, peatlands were less affected by wildfire than upland conifer, with lighter burn severities and dominance of the unburned islands. Thus, peatlands are likely acting as fire refugia on the Taiga plains but not the Taiga shield in extreme drought. In general, most unburned islands were found to occur in ecotypes that typically occur in low wet areas and also have low woody plant structure or are dominated by graminoids (primarily open fens). The extreme drought of 2014–2015 allowed the water tables to drop enough to allow connectivity of the peatland-upland landscape on the Taiga shield to allow widespread burning. In contrast, even in this extreme drought, wetlands and peatlands acted to fragment the continuity of fuels on the Taiga plains landscape. This study provides insight into what to expect in boreal peatlands under extreme drought. How increased drought frequency and other expected climate change factors (e.g., permafrost thaw) will affect the boreal landscape remains to be seen.
Data availability statement
The datasets presented in this study can be found in online repositories. The names of the repository/repositories and accession number(s) can be found in the article/Supplementary material.
Author contributions
LB-C led the conception, design, analysis and interpretation, and writing of the work. JG was the lead in producing the ecotype maps and the SOL burn severity maps. JG and DV were key in conducting the geospatial and statistical analysis, displaying the outputs in an interpretable format, assisting in analysis and interpretation of the results, and assisting in writing the methods, results, and discussion. MB assisted in all aspects including field data collection, remote sensing methods, and interpretation of results. All authors contributed to the article and approved the submitted version.
Funding
This research was funded by NASA grants # NNX15AD58G, # NNX15AT83A, and # 80NSSC19M0107.
Acknowledgments
We would like to thank the people who helped in collecting field data that allowed for production of the maps used in this analysis (Sarah Grelik, Eleanor Serocki, Evan Kane, Elizabeth Ernst, Nancy French, Danielle Tanzer, Liza Jenkins, and Ellen Whitman). We would also like to thank Evan Kane and Ellen Whitman for their reviews of the manuscript and constructive feedback.
Conflict of interest
The authors declare that the research was conducted in the absence of any commercial or financial relationships that could be construed as a potential conflict of interest.
Publisher’s note
All claims expressed in this article are solely those of the authors and do not necessarily represent those of their affiliated organizations, or those of the publisher, the editors and the reviewers. Any product that may be evaluated in this article, or claim that may be made by its manufacturer, is not guaranteed or endorsed by the publisher.
Supplementary material
The Supplementary Material for this article can be found online at: https://www.frontiersin.org/articles/10.3389/ffgc.2022.965605/full#supplementary-material
References
Andela, N., Morton, D. C., Giglio, L., Chen, Y., van der Werf, G. R., Kasibhatla, P. S., et al. (2017). A human-driven decline in global burned area. Science 356, 1356–1362. doi: 10.1126/science.aal4108
Baltzer, J. L., Day, N. J., Walker, X. J., Greene, D., Mack, M. C., Alexander, H. D., et al. (2021). Increasing fire and the decline of fire adapted black spruce in the boreal forest. Proc. Natl. Acad. Sci. U.S.A. 118:e2024872118. doi: 10.1073/pnas.2024872118
Barrett, K., McGuire, A. D., Hoy, E. E., and Kasischke, E. S. (2011). ‘Potential shifts in dominant forest cover in interior Alaska driven by variations in fire severity’. Ecol. Appl. 21, 2380–2396. doi: 10.1890/10-0896.1
Beaulne, J., Garneau, M., Magnan, G., and Boucher, É (2021). Peat deposits store more carbon than trees in forested peatlands of the boreal biome. Sci. Rep. 11, 1–11. doi: 10.1038/s41598-021-82004-x
Boelman, N. T., Liston, G. E., Gurarie, E., Meddens, A. J., Mahoney, P. J., Kirchner, P. B., et al. (2019). Integrating snow science and wildlife ecology in Arctic-boreal North America. Environ. Res. Lett. 14:010401. doi: 10.1088/1748-9326/aaeec1
Boulanger, Y., Gauthier, S., and Burton, P. J. (2014). A refinement of models projecting future Canadian fire regimes using homogeneous fire regime zones. Can. J. For. Res. 44, 365–376. doi: 10.1139/cjfr-2013-0372
Bourgeau-Chavez, L. L. (1994). Using ERS-1 SAR imagery to monitor variations in burn severity in an Alaskan fire-disturbed boreal forest ecosystem. Ph. D. thesis. Ann Arbor, MI: University of Michigan. doi: 10.1109/IGARSS.1994.399093
Bourgeau-Chavez, L. L., Endres, S., Powell, R., Battaglia, M. J., Benscoter, B., Turetsky, M., et al. (2017). ‘Mapping boreal peatland ecosystem types from multitemporal radar and optical satellite imagery’. Can. J. For. Res. 47, 545–559. doi: 10.1139/cjfr-2016-0192
Bourgeau-Chavez, L. L., French, N. H. F., Endres, S., Jenkins, L., Battaglia, M., Serocki, E., et al. (2016). ABoVE: Burn severity, fire progression, landcover and field data, NWT, Canada, 2014. Oak Ridge, TN: ORNL DAAC.
Bourgeau-Chavez, L. L., Graham, J. A., Endres, S., French, N. H. F., Battaglia, M., Hansen, D., et al. (2019). ABoVE: Ecosystem map, Great Slave Lake area, northwest territories, Canada, 1997-2011. Oak Ridge, TN: ORNL DAAC.
Bourgeau-Chavez, L. L., Grelick, S., Banda, E., Powell, R. B., Turetsky, M. R., Benscoter, B., et al. (2015). NACP peatland landcover type and wildfire burn severity maps. Alberta: ORNL DAAC.
Bourgeau-Chavez, L. L., Grelik, S. L., Billmire, M., Jenkins, L. K., Kasischke, E. S., and Turetsky, M. R. (2020). Assessing boreal peat fire severity and vulnerability of Peatlands to early season Wildland fire. Front. Fore. Glob. Change 3:20. doi: 10.3389/ffgc.2020.00020
Burton, P. J., Parisien, M., Hicke, J. A., Hall, R. J., and Freeburn, J. T. (2008). ‘Large fires as agents of ecological diversity in the North American boreal forest’. Int. J. Wildland Fire 17, 754–767. doi: 10.1071/WF07149
Bush, E., and Lemmen, D. S. (eds) (2019). Canada’s changing climate report. Ottawa, ON: Government of Canada. doi: 10.4095/314614
Chuvieco, E., Pettinari, M. L., Koutsias, N., Forkel, M., Hantson, S., and Turco, M. (2021). Human and climate drivers of global biomass burning variability. Sci. Total Environ. 779:146361. doi: 10.1016/j.scitotenv.2021.146361
Clarke, P. J., Knox, K. J., Bradstock, R. A., Munoz-Robles, C., and Kumar, L. (2014). Vegetation, terrain and fire history shape the impact of extreme weather on fire severity and ecosystem response. J. Veg. Sci. 25, 1033–1044. doi: 10.1111/jvs.12166
de Groot, W. J., Pritchard, J. M., and Lynham, T. J. (2009). Forest floor fuel consumption and carbon emissions in Canadian boreal forest fires. Cana. J. For. Res. 39, 367–382. doi: 10.1139/X08-192
Dillon, G. K., Holden, Z. A., Morgan, P., Crimmins, M. A., Heyerdahl, E. K., and Luce, C. H. (2011). Both topography and climate affected forest and woodland burn severity in two regions of the western US, 1984 to 2006. Ecosphere 2, 1–33. doi: 10.1890/ES11-00271.1
Dyrness, C. T., and Norum, R. A. (1983). ‘The effects of experimental fires on black spruce forest floors in interior Alaska’. Can. J. For. Res. 13, 879–893. doi: 10.1139/x83-118
Fang, L., Yang, J., Zu, J., Li, G., and Zhang, J. (2015). Quantifying influences and relative importance of fire weather, topography, and vegetation on fire size and fire severity in a Chinese boreal forest landscape. For. Ecol. Manag. 356, 2–12. doi: 10.1016/j.foreco.2015.01.011
Foster, A. C., Shuman, J. K., Rogers, B. M., Walker, X. J., Mack, M. C., Bourgeau-Chavez, L. L., et al. (2022). Bottom-up drivers of future fire regimes in western boreal North America. Environ. Res. Lett. 17:025006. doi: 10.1088/1748-9326/ac4c1e
French, N. H. F., Graham, J. A., Bourgeau-Chavez, L. L., Grelick, S., and Whitman, E. (2020b). ABoVE: Burn severity of soil organic matter, northwest territories, Canada, 2014-2015. Oak Ridge, TN: ORNL DAAC.
French, N. H. F., Graham, J., Whitman, E., and Bourgeau-Chavez, L. (2020a). ‘Quantifying surface severity of the 2014 and 2015 fires in the Great Slave Lake area of Canada’. Int. J. Wildland Fire 29, 892–906. doi: 10.1071/WF20008
Guindon, L., Gauthier, S., Manka, F., Parisien, M. A., Whitman, E., Bernier, P., et al. (2021). Trends in wildfire burn severity across Canada, 1985 to 2015. Can. J. For. Res. 51, 1230–1244. doi: 10.1139/cjfr-2020-0353
Hanes, C. C., Wang, X., Jain, P., Parisien, M. A., Little, J. M., and Flannigan, M. D. (2019). Fire-regime changes in Canada over the last half century. Can. J. For. Res. 49, 256–269. doi: 10.1139/cjfr-2018-0293
Johnson, E. A., Miyanishi, K., and O’Brien, N. (1999). ‘Long-term reconstruction of the fire season in the mixedwood boreal forest of Western Canada’. Can. J. Bot. 77, 1185–1188. doi: 10.1139/b99-110
Johnstone, J. F., Allen, C. D., Franklin, J. F., Frelich, L. E., Harvey, B. J., Higuera, P. E., et al. (2016). Changing disturbance regimes, ecological memory, and forest resilience. Front. Ecol. Environ. 14:369–378. doi: 10.1002/fee.1311
Kasischke, E. S. (2000). Boreal ecosystems in the global carbon cycle. In fire, climate change, and carbon cycling in the boreal forest. New York, NY: Springer, 19–30. doi: 10.1007/978-0-387-21629-4_2
Kasischke, E. S., and Turetsky, M. R. (2006). Recent changes in the fire regime across the North American boreal region–spatial and temporal patterns of burning across Canada and Alaska. Geophys. Res. Lett. 33, L09703. doi: 10.1029/2006GL025677
Kasischke, E. S., Verbyla, D. L., Rupp, T. S., McGuire, A. D., Murphy, K. A., Jandt, R., et al. (2010). Alaska’s changing fire regime–implications for the vulnerability of its boreal forests. Can. J. For. Res. 40, 1313–1324. doi: 10.1139/X10-098
Kochtubajda, B., Stewart, R. E., Flannigan, M. D., Bonsal, B. R., Cuell, C., and Mooney, C. J. (2019). ‘An assessment of surface and atmospheric conditions associated with the extreme 2014 wildfire season in Canada’s Northwest territories’. Atmos. Ocean 57, 73–90. doi: 10.1080/07055900.2019.1576023
Kolden, C. A., Lutz, J. A., Key, C. H., Kane, J. T., and van Wagtendonk, J. W. (2012). Mapped versus actual burned area within wildfire perimeters: Characterizing the unburned. For. Ecol. Manag. 286, 38–47. doi: 10.1016/j.foreco.2012.08.020
Laberge, M. J., and Payette, S. (1995). Long-term monitoring of permafrost change in a palsa peatland in northern Quebec, Canada: 1983–1993. Arct. Alp. Res. 27, 167–171. doi: 10.2307/1551898
Leifeld, J., and Menichetti, L. (2018). The underappreciated potential of peatlands in global climate change mitigation strategies. Nat. Commun. 9, 1–7. doi: 10.1038/s41467-018-03406-6
Littell, J. S., Peterson, D. L., Riley, K. L., Liu, Y., and Luce, C. H. (2016). ‘A review of the relationships between drought and forest fire in the United States’. Glob. Change Biol. 22, 2353–2369. doi: 10.1111/gcb.13275
Loboda, T. V. (2013). ‘Mapping fire extent and burn severity in Alaskan tussock tundra: An analysis of the spectral response of tundra vegetation to wildland fire’. Remote Sens. Environ. 134, 194–209. doi: 10.1016/j.rse.2013.03.003
Loboda, T. V., and Csiszar, I. A. (2007). ‘Reconstruction of fire spread within wildland fire events in Northern Eurasia from the MODIS active fire product’. Glob. Planet. Change 56, 258–273. doi: 10.1016/j.gloplacha.2006.07.015
Marchand, W., Girardin, M. P., Hartmann, H., Gauthier, S., and Bergeron, Y. (2019). Taxonomy, together with ontogeny and growing conditions, drives needleleaf species’ sensitivity to climate in boreal North America. Glob. Change Biol. 25, 2793–2809. doi: 10.1111/gcb.14665
Meddens, A. J., Kolden, C. A., and Lutz, J. A. (2016). Detecting unburned areas within wildfire perimeters using landsat and ancillary data across the northwestern United States. Remote Sens. Environ. 186, 275–285. doi: 10.1016/j.rse.2016.08.023
Natural Resources Canada (2018). Canadian national fire database. Available online at: https://cwfis.cfs.nrcan.gc.ca/ha/nfdb?type=nbac&year=9999 (accessed July 23, 2020).
Nelson, K., Thompson, D., Hopkinson, C., Petrone, R., and Chasmer, L. (2021). Peatland-fire interactions: A review of wildland fire feedbacks and interactions in Canadian boreal peatlands. Sci. Total Environ. 769:145212. doi: 10.1016/j.scitotenv.2021.145212
Pearson, K. (1900). X. On the criterion that a given system of deviations from the probable in the case of a correlated system of variables is such that it can be reasonably supposed to have arisen from random sampling. Lond. Edinb. Dublin Philos. Mag. J. Sci. 50, 157–175. doi: 10.1080/14786440009463897
Porter, C., Morin, P., Howat, I., Noh, M., Bates, B., Peterman, K., et al. (2018). ‘ArcticDEM’, harvard dataverse, V1. Available online at: https://www.pgc.umn.edu/guides/user-services/acknowledgement-policy/
R Core Team (2022). R: A language and environment for statistical computing, R foundation for statistical computing. Vienna: R Core Team.
Rogers, B. M., Balch, J. K., Goetz, S. J., Lehmann, C. E., and Turetsky, M. (2020). Focus on changing fire regimes: Interactions with climate, ecosystems, and society. Environ. Res. Lett. 15:030201. doi: 10.1088/1748-9326/ab6d3a
Rogers, B. M., Soja, A. J., Goulden, M. L., and Randerson, J. T. (2015). Influence of tree species on continental differences in boreal fires and climate feedbacks. Nat. Geosci. 8, 228–234. doi: 10.1038/ngeo2352
Spence, C., Hedstrom, N., Tank, S. E., Quinton, W. L., Olefeldt, D., Goodman, S., et al. (2020). Hydrological resilience to forest fire in the subarctic Canadian shield. Hydrol. Process. 34, 4940–4958. doi: 10.1002/hyp.13915
Sulla-Menashe, D., Woodcock, C. E., and Friedl, M. A. (2018). Canadian boreal forest greening and browning trends: An analysis of biogeographic patterns and the relative roles of disturbance versus climate drivers. Environ. Res. Lett. 13:014007. doi: 10.1088/1748-9326/aa9b88
Thompson, D., Golivets, M., Edling, L., Meigs, G. W., Gourevitch, J. D., Sonter, L. J., et al. (2019). The climate sensitivity of carbon, timber, and species richness covaries with forest age in boreal–temperate North America. Glob. Change Biol. 25, 2446–2458. doi: 10.1111/gcb.14656
Turetsky, M. R., Amiro, B. D., Bosch, E., and Bhatti, J. S. (2004). Historical burn area in western Canadian peatlands and its relationship to fire weather indices. Glob. Biogeochem. Cycles 18, 1–9. doi: 10.1029/2004GB002222
Turetsky, M. R., Kane, E. S., Harden, J. W., Ottmar, R. D., Manies, K. L., Hoy, E., et al. (2011). Recent acceleration of biomass burning and carbon losses in Alaskan forests and peatlands. Nat. Geosci. 4, 27–31. doi: 10.1038/ngeo1027
Vaillant, N. M., Kolden, C. A., and Smith, A. (2016). Assessing landscape vulnerability to wildfire in the USA. Curr. For. Rep. 2, 201–213. doi: 10.1007/s40725-016-0040-1
Veraverbeke, S., Rogers, B. M., Goulden, M. L., Jandt, R. R., Miller, C. E., Wiggins, E. B., et al. (2017). Lightning as a major driver of recent large fire years in North American boreal forests. Nat. Clim. Change 7, 529–534. doi: 10.1038/nclimate3329
Walker, X. J., Baltzer, J. L., Bourgeau-Chavez, L., Day, N. J., Dieleman, C. M., Johnstone, J. F., et al. (2020a). Patterns of ecosystem structure and wildfire carbon combustion across six ecoregions of the north American boreal forest. Front. For. Glob. Change 3:87. doi: 10.3389/ffgc.2020.00087
Walker, X. J., Baltzer, J. L., Cumming, S. G., Day, N. J., Johnstone, J. F., Rogers, B. M., et al. (2018). Soil organic layer combustion in boreal black spruce and jack pine stands of the Northwest Territories, Canada. Int. J. Wildland Fire. 27:125–134.
Walker, X. J., Rogers, B. M., Veraverbeke, S., Johnstone, J. F., Baltzer, J. L., Barrett, K., et al. (2020b). Fuel availability not fire weather controls boreal wildfire severity and carbon emissions. Nat. Clim. Change 10, 1130–1136. doi: 10.1038/s41558-020-00920-8
Weiss, A. (2001). Topographic position and landforms analysis. Paper presented at the, ESRI user conference, San Diego, CA.
Weißhuhn, P., Müller, F., and Wiggering, H. (2018). ‘Ecosystem vulnerability review: Proposal of an interdisciplinary ecosystem assessment approach’. Environ. Manag. 61, 904–915. doi: 10.1007/s00267-018-1023-8
Whitman, E., Parisien, M. A., Thompson, D. K., Hall, R. J., Skakun, R. S., and Flannigan, M. D. (2018). Variability and drivers of burn severity in the northwestern Canadian boreal forest. Ecosphere 9:e02128. doi: 10.1002/ecs2.2128
Zoltai, S. C., Taylor, S., Jeglum, J. K., Mills, G. F., and Johnson, J. D. (1988). Wetlands of boreal Canada. Ecol. Land Classif. Ser. 24, 97–154.
Appendix
Supplemental landform analysis
To understand the effects of topology on fire severity, a landscape position map (i.e., landform) was created for the study area. The landform parameter is a digital elevation model (DEM) derived product allowing each pixel to be evaluated in relation to both its local and global or regional surroundings (Weiss, 2001). ArcticDEM (Porter et al., 2018) data for the area were resampled to 30 m resolution, the resolution of the ecotype classification and fire severity maps, and smoothed with a 5×5 cell mean filter to reduce the impacts of surface features. Normalized topographic position index (TPI) layers were created at the 500-m and 2000-m scale, thresholded according to the standard deviation breaks defined by Weiss (2001) (Supplementary Table 5), and reclassified into slope position classes of very low, relatively low, flat, flat (slope > 5°), relatively high, and very high. The small scale (500-m) and large scale (2000-m) slope position layers were then combined to create 10 distinctive landform classes delineating cell placement as a local ridge, flat, or depression within a globally high, middle, or low region (Supplementary Figure 4 and Supplementary Table 6).
Chi-square tests were run to assess the effects of landform on fire severity (Supplementary Table 7). Expected probabilities were calculated from the fire severity distribution by ecoregion.
Analysis of the landscape position relative to the fire severity, showed that the majority of landforms are burning preferentially, with the exception of landforms that are locally high in globally low or flat areas or locally low in a regional or global high area, which are burning as expected. In the plains, preferential burning trends were observed at a regional level with regionally high areas burning with more area than expected in the higher severities (moderate and severe) and less area in remaining unburned or singed (Supplementary Figure 5). Regionally low areas, as well as depressions in regionally flat areas, observed elevated singed burn conditions as well as more area remaining unburned than expected based on their availability on the landscape. The Taiga shield experienced a similar trend as the Taiga plains for BSI levels 0–3 (unburned to moderate burns), however, for severely burned areas landscape position showed the inverse relationship. Here, regionally low areas in the Taiga shield had more area than expected burning severely and regionally high areas had less area than expected burning severely.
Keywords: peatland, wildfire, drought, boreal, fire severity, ecosystem vulnerability, soil organic layer, seasonality
Citation: Bourgeau-Chavez LL, Graham JA, Vander Bilt DJL and Battaglia MJ (2022) Assessing the broadscale effects of wildfire under extreme drought conditions to boreal peatlands. Front. For. Glob. Change 5:965605. doi: 10.3389/ffgc.2022.965605
Received: 09 June 2022; Accepted: 30 November 2022;
Published: 20 December 2022.
Edited by:
Christoph Rüdiger, Bureau of Meteorology, AustraliaReviewed by:
Tomás Calheiros, University of Lisbon, PortugalVíctor Fernández García, Universidad de León, Spain
Copyright © 2022 Bourgeau-Chavez, Graham, Vander Bilt and Battaglia. This is an open-access article distributed under the terms of the Creative Commons Attribution License (CC BY). The use, distribution or reproduction in other forums is permitted, provided the original author(s) and the copyright owner(s) are credited and that the original publication in this journal is cited, in accordance with accepted academic practice. No use, distribution or reproduction is permitted which does not comply with these terms.
*Correspondence: Laura L. Bourgeau-Chavez, ✉ bGNoYXZlekBtdHUuZWR1