 James A. Westfall
 Christopher B. Edgar
95% of researchers rate our articles as excellent or good
Learn more about the work of our research integrity team to safeguard the quality of each article we publish.
Find out more
ORIGINAL RESEARCH article
Front. For. Glob. Change , 20 June 2022
Sec. Forest Management
Volume 5 - 2022 | https://doi.org/10.3389/ffgc.2022.895969
This article is part of the Research Topic Monitoring and responding to global change to promote resilient and productive forests through innovative forest inventory View all 9 articles
When conducting urban forest inventories, complete or partial inaccessibility of sample plots results in non-response for a portion of the selected sample. Unfortunately, the non-response is rarely random and thus a potential bias may be imparted in the sample and associated data analyses. In this study, results from an alternative estimation method that employs response homogeneity groups (RHGs) appeared to be more robust to non-random non-response when compared to those of a standard estimation method. Across the six cities studied, the total non-response rates varied from 8.0 to 20.4%. Percent differences between the two methods in estimated number of trees ranged from −0.7 to 12.6%; whereas 1.4 to 14.8% differences were found for tree biomass density. While these differences only approximate the amount of non-response bias present under standard estimation methods, there is a clear indication that misleading results may be obtained if non-response bias is not adequately addressed. By implementing methods that mitigate potential non-response bias, urban forest inventory practitioners would increase the reliability of information used by city planners to make effective management and policy decisions.
A problem common to nearly all sample-based surveys is partial or complete non-response from some of the selected sample units. In urban forest inventories, the issue arises when the desired information cannot be obtained from the field plot area (or a portion thereof). It is usually the case that access to the area is denied by the landowner, although other reasons such as hazardous conditions can also preclude collection of the requisite data (Patterson et al., 2012; Corona et al., 2014). The magnitude of non-response in urban forest inventory can vary considerably with non-response percentages ranging from essentially trivial (<2%) to nearly 40% (Westfall et al., 2022a). The total non-response is comprised of complete non-response (the entire plot is unobservable) as well as partial non-response (only a portion of the plot is unobservable). Urban environments tend to have smaller parcel sizes than rural areas, which may result in higher prevalence of partial non-response outcomes. In standard estimation approaches, it is often assumed that non-response occurs randomly and thus minimal bias is incurred. In practice, non-response can be non-random with respect to various factors and the assumption is often not satisfied (Heffetz and Reeves, 2019). For example, in urban forest inventories non-response rates may vary systematically by amount of tree canopy, socio-economic conditions, and/or land cover type, which may cause unbalanced representation of site and tree attributes in the sample data (Westfall et al., 2022a). In the context of urban forest inventory, the potential bias implications from non-random patterns of non-response have received little attention.
Given that non-response is almost always present and the magnitude is unknown until after the sampling effort has been completed, it is sensible for urban forest inventory practitioners to develop strategies to mitigate any non-response bias in subsequent sample-based estimates. While the specific study of urban inventory non-response bias is lacking in the literature, the issue has garnered some attention from traditional forest inventory practitioners. Non-response bias resulted in underestimation of forestland area by about 4% in New Mexico, United States (Goeking and Patterson, 2013), nearly 6% underestimation of growing stock volume was found in Central Italy (Corona et al., 2014), and underestimation of forestland area of 2.9% based on a synthetic population and 0.1–3.6% (mean = 1.5%) across 10 states in the northern United States has been reported (Westfall, 2022).
In general, considerable study has been done on effects of non-response and potential mitigation approaches (Little and Rubin, 2002; Särndal and Lundström, 2005). In the United States national forest inventory, efforts include defining strata and/or subpopulations wherein the response probabilities for each sample plot are considered to be approximately equal and non-response plots likely have similar characteristics to the response plots (Goeking and Patterson, 2013; Gormanson et al., 2018). However, these approaches have not been implemented into similarly conducted urban forest inventories (Edgar et al., 2021) such that non-response bias of unknown magnitude and direction may be extant. This may be of concern for city managers and policy makers as actions based on inaccurate data may not achieve intended outcomes for key objectives related to temperature amelioration, tree canopy cover, and other issues important to urban inhabitants. Thus, the objectives of this study are to (1) assess amounts of partial and complete plot non-response rates, (2) present the standard estimation method and an alternative method that better accounts for non-response, and (3) assess differences in estimates of number of trees and total tree biomass as a potential indicator of non-response bias magnitude and direction.
The data used in this study are from urban forest inventories conducted by the Forest Inventory and Analysis (FIA) program of the U.S. Forest Service. FIA urban inventories use a quasi-systematic sampling design similar to that employed in the national forest inventory (Reams et al., 2005) but is intensified to target a minimum of 200 plots within the urban population (Edgar et al., 2021). The sample units consist in part of a circular plot having 14.63 m (48 ft) radius where information is collected on site characteristics and trees having diameter at breast-height (dbh) of 12.70 cm (5.0 in.) and larger (Figure 1). The plot design also includes four 2.07 m (6.8 ft) radius microplots with centers occurring at 3.66 m (12 ft) from plot center in each of the cardinal directions. Microplot measurements include trees having dbh from 2.54 cm (1.0 in.) to 12.45 cm (4.9 in.). Tree frequency and tree biomass serve as the attributes of interest to examine effects of non-response on population estimates. A mapped plot protocol is implemented which allows for quantification of partial non-response (i.e., portions of plots). Also relevant to non-response is that information for plots with no trees can often be obtained visually without physically occupying the plot area, such that plots without trees are usually not subject to non-response.
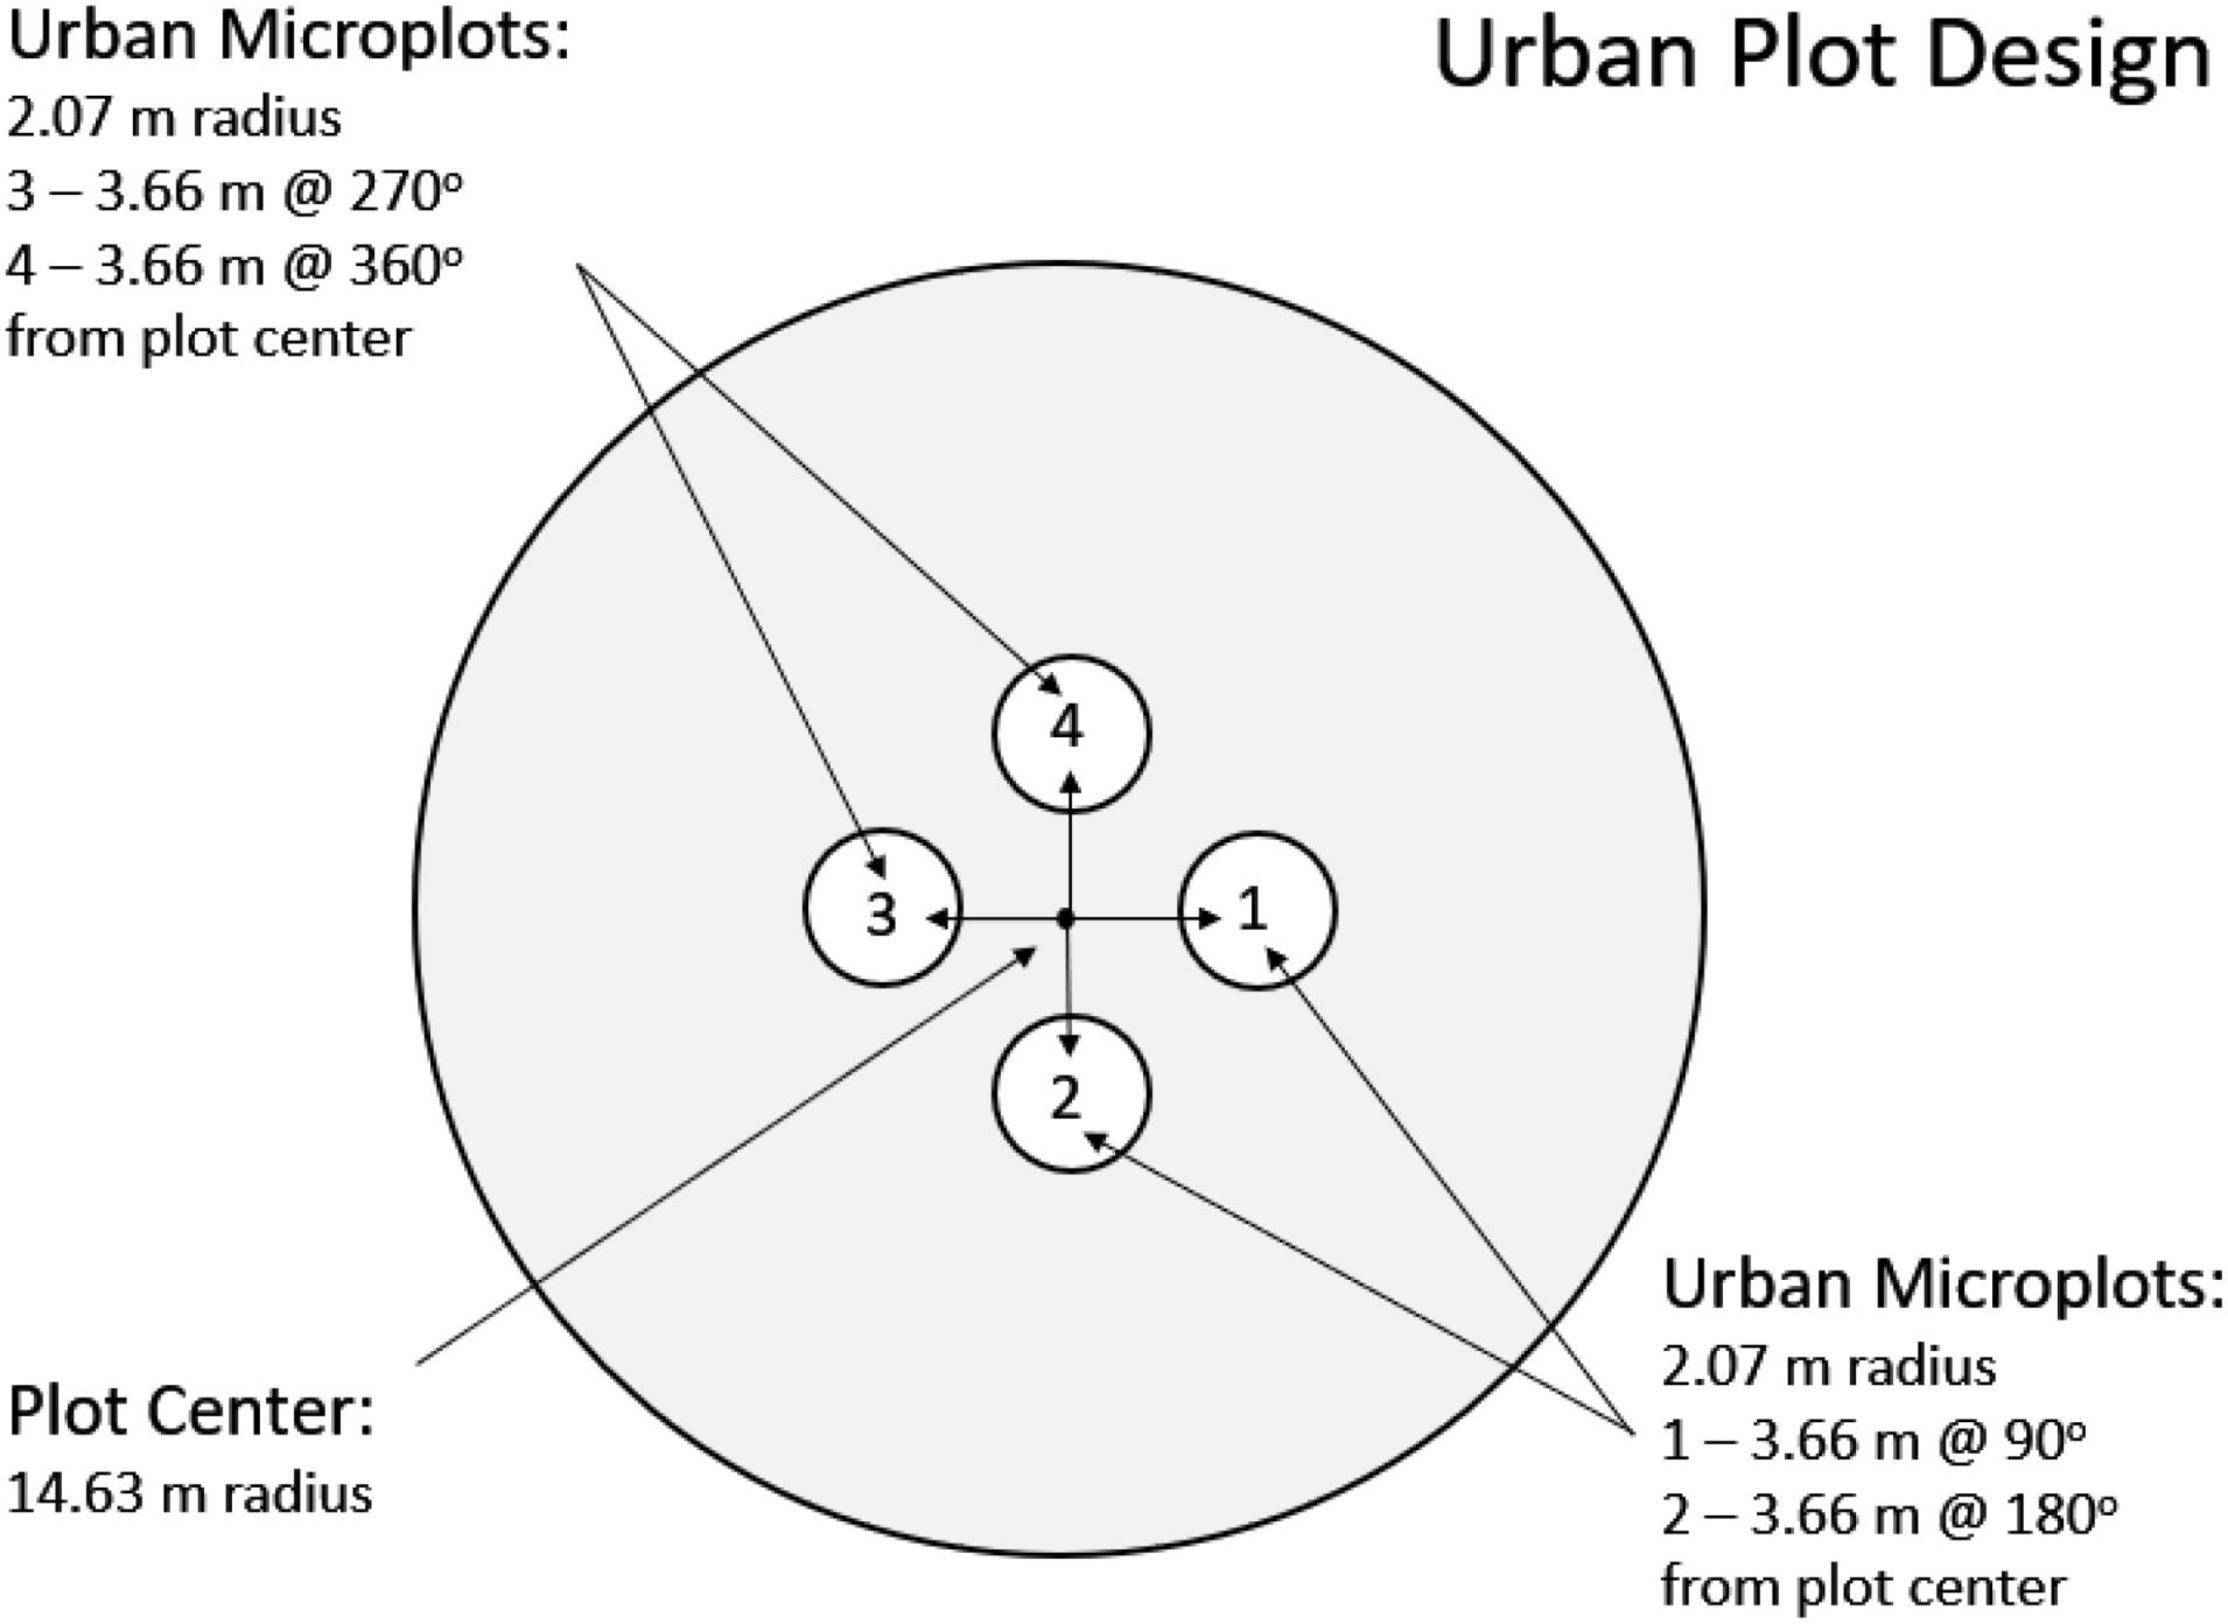
Figure 1. Urban inventory plot configuration used by the United States FIA program.
Study cities reflect a broad diversity of regions in the United States. The cities and year of most recent data availability were Chicago, IL (2019), Kansas City, MO (2018), San Diego, CA (2018), St. Louis, MO (2018), Portland, OR (2018), and Austin, TX (2018). Non-response can generally be quantified to (1) determine the percent of plots where no measurements were taken (only complete non-response plots), and (2) assess the percent of plot areas that were inaccessible for measurement (includes both complete and partial non-response plots). Respectively, these statistics can be calculated as:
Where CNR% is the complete non-response percentage, TNR% is the complete and partial non-response percentage, pi(NR) is the non-response area proportion of plot i, δi = 1 when plot i is complete non-response or 0 otherwise, and n is the sample size for all plots selected into the sample. The percentage of non-response specifically due to partial plot inaccessibility is PNR% = TNR%−CNR%. Relevant statistics for each city, including sample size and rates of complete and partial non-response, are provided in Table 1.
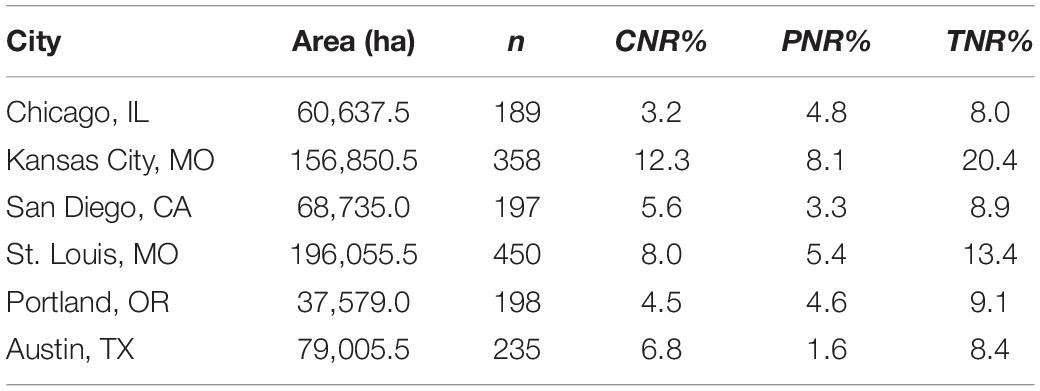
Table 1. Summary information for urban forest inventories from six cities in the United States.
The post-stratified estimation methods used in FIA national forest inventory (Scott et al., 2005) are applied to FIA urban inventories as well. For the urban inventories, post-strata are initially created using the 2016 NLCD land cover class map (Jin et al., 2019) with plot assignments to strata being determined from plot center coordinates. A minimum of 10 plots per stratum is strived for, with some exceptions (e.g., open water), such that often classes need to be collapsed to attain reliable estimates of stratum means and variances. Collapsing involves grouping of similar land cover classes, e.g., all classes of undeveloped land are combined into a single stratum. Once the final stratification scheme has been determined, stratum weights (wh) are calculated as the number of map pixels in the stratum divided by the total number of map pixels in the population (city). Estimation proceeds by dropping any plots that were entirely inaccessible and no response was obtained. For the remaining plots, accounting for plots having partial non-response requires calculation of an adjustment factor in each stratum h and this factor is used to adjust the values for all observed (at least partially accessible) plots within the stratum.
Where is the partial plot adjustment factor for stratum h, ahi is the proportion of the plot area measured on plot i in stratum h, mh is the number of plots with partial or full area measurement in stratum h, is the observation (tree count or biomass, expressed per ha) for plot i in stratum h, and yhi is the observation from sample plot i in stratum h adjusted for partial non-response in stratum h. If there are no plots in stratum h having partial non-response, = 1. Separate partial non-response adjustment factors are calculated for the plot and the microplot areas.
Stratum means and variances are then calculated using:
Where is the mean of stratum h and is the variance of the mean in stratum h. The population estimate and associated uncertainty are attained by combining across all h = 1, …, H strata:
Where is the estimated population total, AT is the area of the population (ha), m is the total number of observed plots, is the estimated standard error of the population total, is the estimated variance of the population total, and is the standard error as a percentage of the estimate (Scott et al., 2005).
A key assumption in the standard estimation procedure is that complete non-response plots have characteristics that are on average equal to the mean of the stratum in which they occur. If this assumption holds, no bias due to complete non-response in incurred. However, research has shown cases in which this assumption fails and the resultant effects on estimated population totals (Goeking and Patterson, 2013; Corona et al., 2014; Westfall, 2022). Further, the partial plot adjustment factor method of the standard approach produces bias in variance estimates (Van Deusen, 2005; Westfall et al., 2022b). Building on the work of Goeking and Patterson (2013) and Westfall (2022) presented estimators in a national forest inventory context where sample plots were grouped based on similar probabilities of obtaining a response [response homogeneity groups (RHG); Särndal et al., 1992] to reduce bias in estimates caused by non-response. This approach can also be applied to urban forest inventories with modifications on how RHG are constructed. As noted previously, plots having no trees can often be completed without occupying the plot area when the crew can make peripheral visual assessments. Further, inaccessibility is rarely encountered on publicly owned lands (local, state, or federal government). The set of plots where non-response primarily occurs are those with trees on privately owned properties. Thus, RHGs for urban inventories can consist of two basic plot types – those with near zero probability of non-response (assigned to RHG = R) and those with an unknown but larger probability of non-response (assigned to RHG = N). Formulation of the RHGs occurs within existing cover class post-strata, and then estimation proceeds by calculating sample means and sample variances for each RHG. To avoid bias in the estimated variance due to partial non-response using the standard estimation approach, a ratio-to size estimator is used instead (Westfall et al., 2022b):
Where is the mean of attribute y for RHG g in stratum h, yhgi is the observation from the ith plot in RHG g for stratum h, ahgi is the accessible proportion of plot i in RHG g for stratum h, and is the sample variance of attribute y in RHG g for stratum h. In this article, finite population correction factors are not included in variance estimators as most forest inventories have very small sampling fractions.
Subsequently, the RHGs within each stratum need to be combined to obtain the H strata means and their variances. These calculations require determination of the weights for each RHG, which can be considered as a double sampling for post-stratification where the measured plot locations comprise the first sampling phase (Westfall et al., 2019).
Where whg is the estimated weight for RHG g in stratum h, is the number of selected plots in RHG g within stratum h, and is the number of selected plots in stratum h. The n′ notation indicates the weight calculation corresponds with double sampling for post-stratification design in which the plot RHG assignments serve as the first phase sample. In this special case, sample sizes are and for RHGs and strata, respectively.
The first three terms of the double sampling for post-stratification variance estimator account for randomness due to sampling, random RHG sample sizes within strata, and uncertainty due to estimation of the RHG weights. A fourth term is included to represent randomness of non-response outcomes (Särndal et al., 1992, section 15.6.3).
The estimated population total and its variance are calculated from Scott et al. (2005):
Where N = number of sample units in the population.
Except for numbers of trees in Austin, TX, the RHG estimation approach resulted in larger population estimates than the standard method for number of trees and total tree biomass for each of the six cities studied (Table 2). Percent differences in estimated number of trees ranged from −0.7 to 12.6%; whereas 1.4 to 14.8% percent differences were found for total tree biomass estimates. In most cases, the %SE using RHG estimation was similar to or larger than that of the standard estimation. This outcome is to be expected as the RHG incurs additional variance due to estimated weights and considers randomness of non-response as a source of uncertainty (Eq. 14).
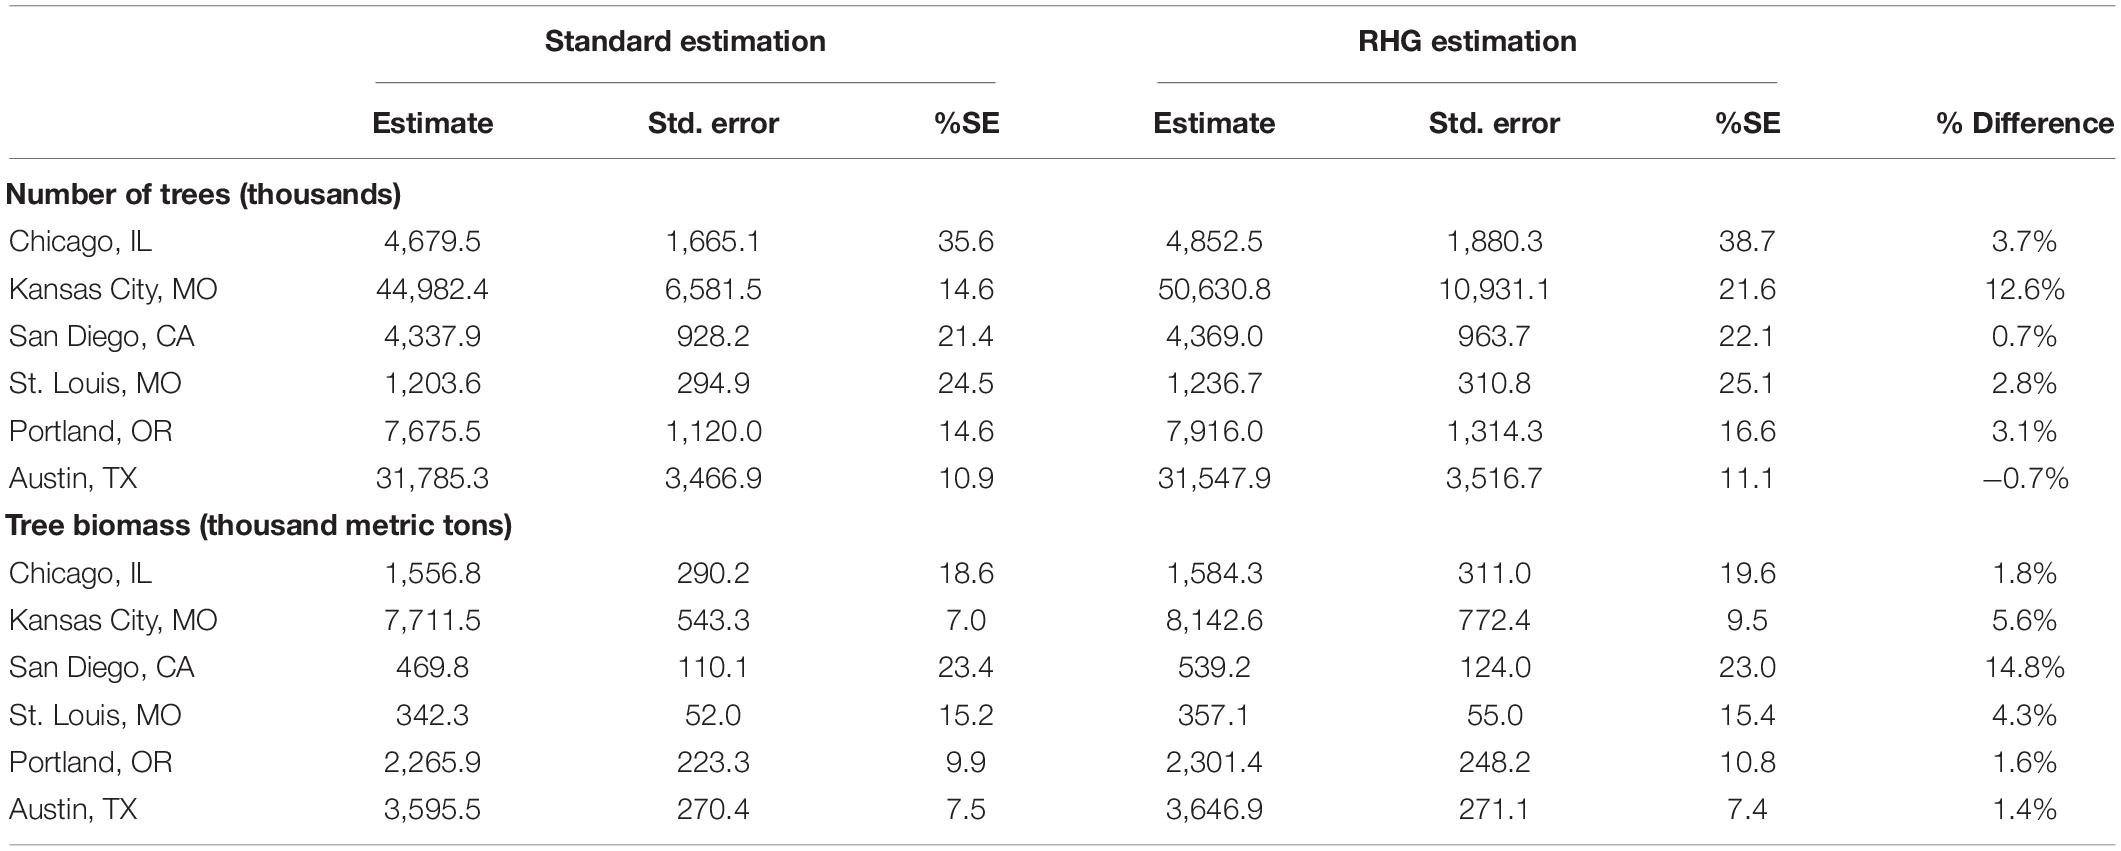
Table 2. Comparison between standard and RHG estimation results for number of trees and total tree biomass in six cities in the United States.
Examination of results at the stratum-level provides insight into why the estimates differ between the standard and alternative (RHG) methods (Table 3). The reduction in estimated number of trees in Austin, TX arises from shifts in some stratum means caused by the different weighting of plots that occurs due to within-RHG non-response. This is primarily due to the weights for RHG = N (possible non-response) being larger than the proportion of accessible plots because the RHG weights are based on all selected plots not just accessible plots. This outcome gives accessible RHG = N plots larger weight than would have been realized using the standard process. While many strata exhibited increased or identical means when employing RHGs, the results were primarily driven by strata F (Mixed Forest) and G (Conifer Forest) where the RHG method produced smaller stratum means than the standard approach. Closer examination of these strata reveals that the mean values for RHG = N are smaller than those for RHG = R, and thus the increased weighting of the RHG = N mean to account for non-response reduces the overall stratum mean . This outcome serves to highlight two points: (1) implementation of RHG can result in either positive or negative differences in comparison to the standard estimation, and (2) although it is generally the case that plots in RHG = N (possible non-response) often have more trees (and biomass) than RHG = R (unlikely non-response) plots, exceptions to this tendency can and do occur in some situations.
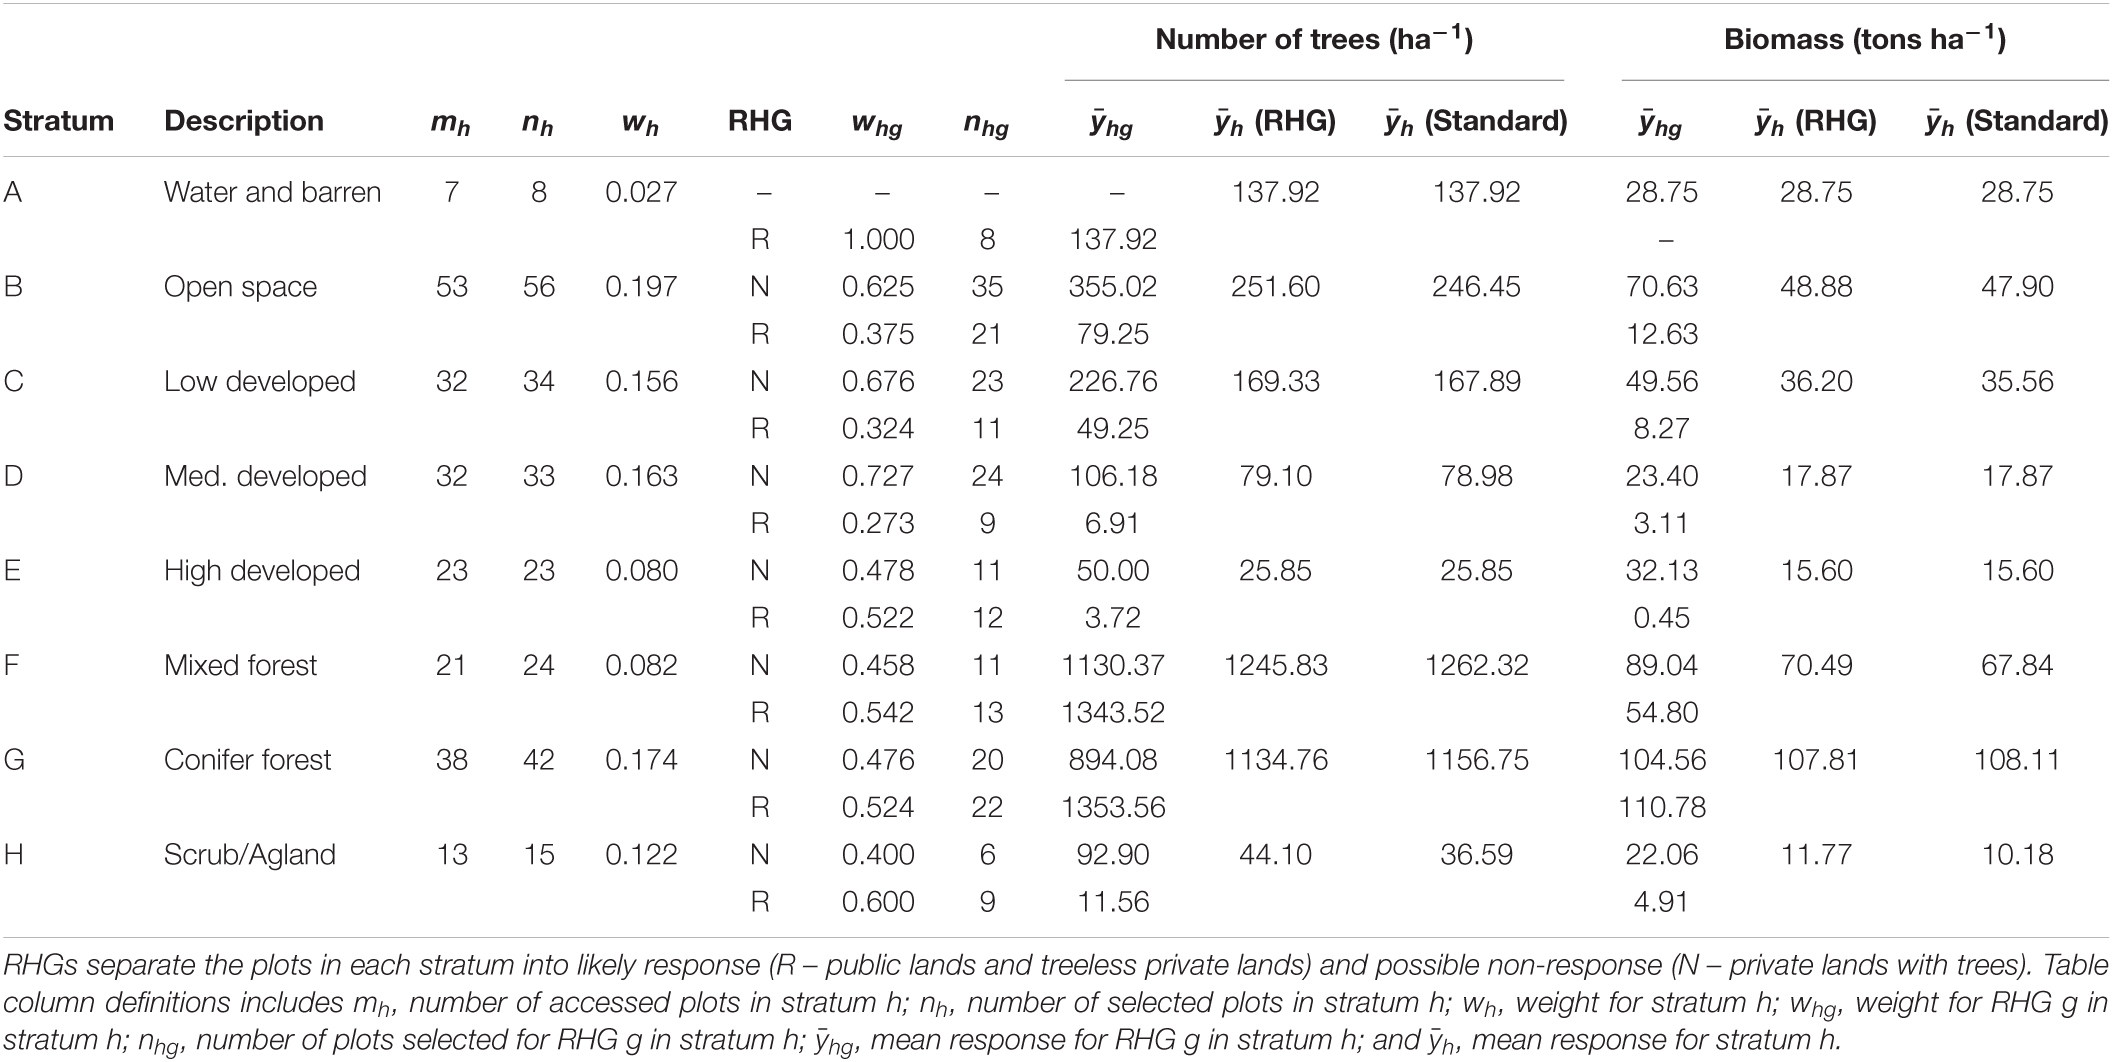
Table 3. Summary of stratum and RHG statistics for Austin, TX.
Unlike the estimated number of trees, the estimate of total biomass in Austin, TX increased when the RHG method was used. In this case, Table 3 shows differing patterns of shifts in stratum means, particularly increases instead of decreases for strata B, C, and F. These contrary shifts between tree and biomass density attributes suggest that plots in RHG = N for these strata tend to have fewer but larger trees than plots categorized as RHG = R.
Table 3 also exhibits some stratum characteristics worth noting in the context of implementing RHG estimation. Stratum A had all plots assigned RHG = R because the there was only one observed plot in RHG = N, which prohibited calculation of . Thus, even though there was a non-response plot present in RHG = N, it could not be accounted for due to the small sample size.
In other cases, it may be that all plots in the strata belong to the same RHG and thus only one RHG is present. Also, there may be no complete non-response plots in a stratum (e.g., stratum E) and thus the RHG weights (whg) are exactly proportional to the number of selected plots. In each of these cases, the stratum mean () is the same for both standard and RHG methods.
Comparison between the percent difference in the estimates arising from the use of RHG (Table 2) and the amounts of non-response in each city (Table 1) reveals that the potential sample bias is not directly related to non-response magnitude. The sample bias arises within strata that contain a mix of plots having different response probabilities which are coarsely defined by tree presence (possible non-response due to physical access requirement) or lack thereof (unlikely to be non-response as physical access usually not required). The creation and use of RHG does not require quantification of the response probabilities; however, knowledge of factors that result in differing probabilities is needed such that plots considered to have similar probabilities can be assigned to a specific RHG. RHGs essentially act as sub-strata where the assumption that complete non-response is on average equal to the stratum mean is more likely to be satisfied and thus the non-response bias is reduced (McRoberts, 2003). There is no assurance that the RHG approach is completely unbiased as this would only hold when all the plots in each RHG strictly have equal response probabilities (Westfall, 2022). However, increased satisfaction of underlying assumptions in the estimation process seems more likely to provide estimates closer to the true population mean than would be obtained using the standard estimation approach.
The general outcome of the alternative estimation procedure that employs RHG is estimates having smaller bias but larger standard errors (Table 2). The percent sampling errors are also usually larger but can be slightly smaller in some situations where the increase in the estimate is proportionally larger than the standard error increase. Users of urban forest inventory data for policy and decision making (Morgenroth and Östberg, 2017) rely on unbiased information, which potentially makes the use of RHGs more appealing despite the increased uncertainty. Särndal and Lundström (2005) note that a low variance is of little consequence in the case of highly biased estimates. The degree of bias that may be present may depend on the attribute of interest, e.g., less than 1% for number of trees but nearly 15% in San Diego, CA (Table 2). Ultimately, these differences arise from complex interactions among RHGs (and their weights), the amount of non-response, and the characteristics of the observed plots. These factors determine the direction of magnitude of shifts in stratum means relative to the standard estimation approach. Subsequently, the influence of those stratum means on the final population estimate depends on the strata weights (Table 3). In the San Diego case, a relatively large amount of non-response occurred in an RHG where the number of trees was about average but the biomass was large caused little change in the number of trees estimate but a large change in the total biomass estimate. Unlike typical forested settings, tree size – density relationships (Burkhart, 2013) can be highly variable in urban environments due to localized plantings, removals, and other anthropogenic factors (Conway, 2016; Morgenroth et al., 2017).
In this study, presence/absence of trees and public/private land ownership were used to assign plots to RHGs. This may be considered simplistic and surely other factors affect the response probabilities of individual plots. An examination of urban forest inventory non-response across 33 cities in the United States revealed that factors such as median household income, median age, percent canopy cover, and land use type may also influence plot response probabilities (Westfall et al., 2022a). In this study, land cover classes were used to define the post-strata, which should alleviate non-response bias with respect to those categorizations. Nonetheless, other factors may be useful in construction of RHGs. However, the number of factors that may be considered is likely limited as the “curse of dimensionality” (Bellman, 1957) can result in RHG with very small sample sizes. Practitioners need to evaluate the specific circumstances of their urban forest inventories to determine the most appropriate and effective factors for RHG construction.
The true underlying causes of non-response are likely very complex and may be the result of numerous interrelated factors. As such, a certain amount of non-response bias may exist in any survey result despite explicit mitigation efforts. Nonetheless, strategies to minimize non-response bias can be implemented when causal factors are readily identifiable. It was common to find larger estimates of forest resource attributes using RHG estimation in comparison to the standard estimation method (Table 2), which suggests that non-response often results in a downward bias of estimation results. This outcome and the magnitude of bias are consistent with results of traditional forest inventory studies mentioned in the introductory material (Goeking and Patterson, 2013; Corona et al., 2014; Westfall, 2022). When non-response in urban inventories remains unaccounted for, it can hamper effective decision making by city planners to meet management objectives associated with stormwater runoff, temperature moderation, tree species diversity, carbon sequestration, and other attributes that affect the well-being of urban inhabitants (Miller et al., 2015; Östberg et al., 2018; Rossi et al., 2022). As urban forest inventories become more commonplace and their results play a more prominent role in informing planning and policy decisions, attenuating any potential biases in urban forest resource estimates will be of considerable importance.
Urban forest inventories are subject to a wide range of non-response rates that are affected by a myriad of factors. As with all surveys, non-response has the potential to impart bias in the sample and associated estimates of population parameters. Although it must be recognized the RHG approach likely reduces but does not eliminate non-response bias, the results of this study imply bias in number of trees and total tree biomass estimates may exceed 10% in some cases. Thus, urban forest inventory practitioners may want to minimize negative impacts of non-response when analyzing survey data. Effective mitigation is likely not a trivial exercise as factors that lead to non-response plot characteristics being substantially different than those of response plots need to be identified and prioritized in terms of their potential bias implications. Further, structural population differences may require city-specific resolution of non-response causal factors instead of broadly applicable paradigms.
Publicly available datasets were analyzed in this study. This data can be found here: https://www.fia.fs.fed.us/tools-data/.
JW contributed to the manuscript conceptualization, data analysis, and writing of the original draft. CE contributed to the manuscript conceptualization, methodology, and review and editing the draft manuscript. Both authors contributed to the article and approved the submitted version.
Funding to support this effort was provided in part by the USDA Forest Service Project – FIA Forest Biometrics Research and Program Support (RJVA 20-JV-11242305-018) and Minnesota Agricultural Experiment Station Project MIN-42-078.
The authors declare that the research was conducted in the absence of any commercial or financial relationships that could be construed as a potential conflict of interest.
All claims expressed in this article are solely those of the authors and do not necessarily represent those of their affiliated organizations, or those of the publisher, the editors and the reviewers. Any product that may be evaluated in this article, or claim that may be made by its manufacturer, is not guaranteed or endorsed by the publisher.
Burkhart, H. E. (2013). Comparison of maximum size–density relationships based on alternate stand attributes for predicting tree numbers and stand growth. For. Ecol. Manage. 289, 404–408. doi: 10.1016/j.foreco.2012.10.041
Conway, T. M. (2016). Tending their urban forest: residents’ motivations for tree planting and removal. Urban For. Urban Green. 17, 23–32. doi: 10.1016/j.ufug.2016.03.008
Corona, P., Chirici, G., Franceschi, S., Maffei, D., Marcheselli, M., Pisani, C., et al. (2014). Design-based treatment of missing data in forest inventories using canopy heights from aerial laser scanning. Can. J. For. Res. 44, 892–902. doi: 10.1139/cjfr-2013-0521
Edgar, C. B., Nowak, D. J., Majewsky, M. A., Lister, T. W., Westfall, J. A., and Sonti, N. F. (2021). Strategic national urban forest inventory for the United States. J. For. 119, 86–95. doi: 10.1093/jofore/fvaa047
Goeking, S. A., and Patterson, P. L. (2013). Stratifying to Reduce Bias Caused by High Nonresponse Rates: A Case Study from New Mexico’s forest inventory. Fort Collins, CO: Res. Note RMRS-RN-59, USDA, Forest Service, Rocky Mountain Research Station. doi: 10.2737/RMRS-RN-59
Gormanson, D. D., Pugh, S. A., Barnett, C. J., Miles, P. D., Morin, R. S., Sowers, P. A., et al. (2018). Statistics and Quality Assurance for the Northern Research Station Forest Inventory and Analysis program. Newtown Square, PA: Gen. Tech. Rep. NRS-178, USDA, Forest Service, Northern Research Station. doi: 10.2737/NRS-GTR-178
Heffetz, O., and Reeves, D. B. (2019). Difficulty of reaching respondents and nonresponse bias: evidence from large government surveys. Rev. Econ. Stat. 101, 176–191. doi: 10.1162/rest_a_00748
Jin, S., Homer, C., Yang, L., Danielson, P., Dewitz, J., Li, C., et al. (2019). Overall methodology design for the United States National Land Cover Database 2016 products. Rem. Sens. 11:2971. doi: 10.3390/rs11242971
Little, R. J. A., and Rubin, D. B. (2002). Statistical Analysis with Missing Data, 2nd Edn. New York, NY: Wiley. doi: 10.1002/9781119013563
McRoberts, R. E. (2003). Compensating for missing plot observations in forest inventory estimation. Can. J. For. Res. 33, 1990–1997. doi: 10.1139/x03-112
Miller, R. W., Hauer, R. J., and Werner, L. P. (2015). Urban Forestry: Planning and Managing Urban Greenspaces, 3rd Edn. Long Grove, IL: Waveland Pr Inc.
Morgenroth, J., O’Neil-Dunne, J., and Apiolaza, L. A. (2017). Redevelopment and the urban forest: a study of tree removal and retention during demolition activities. Appl. Geog. 82, 1–10. doi: 10.1016/j.apgeog.2017.02.011
Morgenroth, J., and Östberg, J. (2017). “Measuring and monitoring urban trees and urban forests,” in Routledge Handbook of Urban Forestry, eds F. Ferrini, C. C. Konijnendijk, B. van den, and A. Fini (London: Taylor & Francis Group), 33–48. doi: 10.4324/9781315627106-3
Östberg, J., Wiström, B., and Randrup, T. B. (2018). The state and use of municipal tree inventories in Swedish municipalities–results from a national survey. Urb. Ecosys. 21, 467–477. doi: 10.1007/s11252-018-0732-3
Patterson, P. L., Coulston, J. W., Roesch, F. A., Westfall, J. A., and Hill, A. D. (2012). A primer for nonresponse in the US forest inventory and analysis program. Env. Mon. Assess. 184, 1423–1433. doi: 10.1007/s10661-011-2051-5
Reams, G. A., Smith, W. D., Hansen, M. H., Bechtold, W. A., Roesch, F. A., and Moisen, G. G. (2005). “The forest inventory and analysis sampling frame,” in The Enhanced Forest Inventory and Analysis Program - National Sampling Design and Estimation Procedures, eds W. A. Bechtold and P. L. Patterson (Asheville, NC: Gen. Tech. Rep. SRS-80. USDA, Forest Service, Southern Research Station), 21–36.
Rossi, L., Menconi, M. E., Grohmann, D., Brunori, A., and Nowak, D. J. (2022). Urban planning insights from tree inventories and their regulating ecosystem services assessment. Sustainability 14:1684. doi: 10.3390/su14031684
Särndal, C.-E., and Lundström, S. (2005). Estimation in Surveys with Nonresponse. West Sussex: John Wiley & Sons. doi: 10.1002/0470011351
Särndal, C.-E., Swensson, B., and Wretman, J. (1992). Model Assisted Survey Sampling. New York: Springer-Verlag. doi: 10.1007/978-1-4612-4378-6
Scott, C. T., Bechtold, W. A., Reams, G. A., Smith, W. D., Westfall, J. A., Hansen, M. H., et al. (2005). “Sample-based estimators used by the forest inventory and analysis national information management system,” in The Enhanced Forest Inventory and Analysis Program - National Sampling Design and Estimation Procedures, eds W. A. Bechtold and P. L. Patterson (Asheville, NC: Gen. Tech. Rep. SRS-80. USDA, Forest Service, Southern Research Station), 53–77.
Van Deusen, P. C. (2005). “Comparing mapped plot estimators,” in Proceedings of the Sixth Annual Forest Inventory and Analysis symposium, eds R. E. McRoberts, G. A. Reams, P. C. Van Deusen, and W. H. McWilliams (Washington, DC: Gen. Tech. Rep. WO-70. USDA Forest Service, Washington Office), 93–97.
Westfall, J. A. (2022). An estimation method to reduce complete and partial nonresponse bias in forest inventory. Eur. J. For. Res. In review.
Westfall, J. A., Edgar, C. B., and Zehnder, R. (2022a). Quantification and characterization of nonresponse in urban forest inventories. Lands. Urban Plan. In review.
Westfall, J. A., Lister, A. J., and Scott, C. T. (2022b). Evaluation of mapped-plot variance estimators across a range of partial nonresponse in a post-stratified national forest inventory. Can. J. For. Res. 52, 280–285. doi: 10.1139/cjfr-2021-0159
Keywords: ownership, response probability, post-stratification, non-random, city planning
Citation: Westfall JA and Edgar CB (2022) Addressing Non-response Bias in Urban Forest Inventories: An Estimation Approach. Front. For. Glob. Change 5:895969. doi: 10.3389/ffgc.2022.895969
Received: 14 March 2022; Accepted: 18 May 2022;
Published: 20 June 2022.
Edited by:
Piermaria Corona, University of Tuscia, ItalyReviewed by:
Christina Staudhammer, University of Alabama, United StatesCopyright © 2022 Westfall and Edgar. This is an open-access article distributed under the terms of the Creative Commons Attribution License (CC BY). The use, distribution or reproduction in other forums is permitted, provided the original author(s) and the copyright owner(s) are credited and that the original publication in this journal is cited, in accordance with accepted academic practice. No use, distribution or reproduction is permitted which does not comply with these terms.
*Correspondence: James A. Westfall, amFtZXMud2VzdGZhbGxAdXNkYS5nb3Y=
Disclaimer: All claims expressed in this article are solely those of the authors and do not necessarily represent those of their affiliated organizations, or those of the publisher, the editors and the reviewers. Any product that may be evaluated in this article or claim that may be made by its manufacturer is not guaranteed or endorsed by the publisher.
Research integrity at Frontiers
Learn more about the work of our research integrity team to safeguard the quality of each article we publish.