- 1Centre for Boreal Research, Northern Alberta Institute of Technology, Edmonton, AB, Canada
- 2School of Applied Sciences and Technology, Northern Alberta Institute of Technology, Edmonton, AB, Canada
- 3EnviroStats Solutions Inc., Edmonton, AB, Canada
Empirical evaluations of reclamation success are critical for understanding the speed of ecosystem recovery and improving best practices. In this study, we provide a quantitative evaluation of the effectiveness of past (pre-1995) and current (2010) reclamation criteria in creating functioning forest ecosystems on former industrial sites in boreal Alberta, Canada. We compared ecological indicators of ecosystem recovery (vegetation structure and soil properties) on mineral surface leases (MSLs) certified to the pre-1995 or 2010 reclamation criteria with nearby reference areas recovering from harvest (CUT) or fire (FIRE) disturbances. Six CUT and FIRE sites were chosen to compare six 1995MSLs and five 2010MSLs. Averaging 8 years since reclamation, most of the 2010MSLs were characterized by many of the same vegetation structure and soil properties as the FIRE and CUT sites. The 1995MSLs tended to support more agronomic species, notably grasses and non-native forbs, and fewer shrubs, trees, and native forbs than CUT or FIRE sites. Sites with the greatest coverage of herbaceous species (native and non-native grasses as well as non-native forbs) were the most ecologically impaired sites, based on the extreme deviation from reference site conditions. Based on these results, 2010 reclamation criteria appear to be more effectively promoting ecosystem recovery on reclaimed industrial sites than the pre-1995 criteria. While this case study illustrated the potential benefits of straightforward changes to reclamation criteria in terms of including metrics around soil quality and conservation, woody stem requirements and native plant coverage, there is ultimately always room for improvement. For jurisdictions where the objective of the criteria is to restore a forest ecosystem, including criteria geared toward tree establishment would likely be of value in ensuring the speedy return to a forest canopy state. Adding criteria with measures of native plant species diversity may also be of utility as it is well understood that having plant diversity is also a beneficial metric in creating a more resilient vegetation community.
Introduction
Governments around the world are experiencing mounting public concern over issues of environmental stewardship. These issues include how to restore lands where ecological integrity is lost or compromised, mainly by anthropogenic disturbances. In response, a number of regulatory frameworks have been developed over the last two decades on how best to restore the ecological integrity of affected lands (Baker and Eckerberg, 2016; Government of Alberta [GoA]., 1999; Environment and Sustainable Resource Development [ESRD]., 2013). This includes developing new reclamation criteria or initiating changes to refine existing criteria using jurisdiction-specific land management goals. Reclamation criteria are standards used to evaluate whether site restoration activities have achieved certain minimum standards. They define expectations and outline requirements regarding professional practices within the area of land reclamation. Having effective reclamation criteria is important for environmental stewardship because the magnitude and intensity of human disturbance have long been considered the primary cause of biodiversity loss and ecosystem degradation worldwide (Arbogast, 2002; Skousen et al., 2012; Rayner et al., 2017; Gerwing et al., 2021).
As in many other jurisdictions around the world, the province of Alberta in Canada has a long history of oil and gas extraction throughout the boreal forest region with nearly 8 to 20 well sites, each 0.8–1.4 hectares in size, established per square kilometer (Frerichs et al., 2017). As of April 2020, Alberta had more than 400,000 well sites (Government of Alberta [GoA]., 1999, 2020) and associated facilities, including borrow pits and sumps. Reclamation criteria in the oil and gas sector have evolved in the last 40 years. Since the early 1980s, there have been changes in the reclamation criteria toward requiring the restoration of biodiversity and ecosystem function (Powter et al., 2012; Environment and Sustainable Resource Development [ESRD]., 2013). This is in contrast to early criteria (pre-1995) that were focused primarily on revegetation of the site and did not typically require specific species to be established or that any plant structural targets be achieved. The goal of early reclamation practices was to establish a plant cover that would reduce soil erosion concerns (Alberta Environment and Protection [AEP]., 1995); however, this resulted in widespread utilization of agronomic, often non-native graminoid seeding on these sites. The widespread use of agronomic species in reclamation has potentially impeded natural colonization by both coniferous and deciduous tree species, leaving long-term legacy effects on sites reclaimed using pre-1995 standards (K. Kemball, personal communication, May 3, 2020).
In 2010, there was a significant regulatory adjustment in Alberta whereby the reclamation criteria were updated to include requirements for woody vegetation (trees or shrubs) and two layers of vegetation strata (overstory and understory). The 1995 reclamation criteria for forested lands do not explicitly require tree cover, which may raise questions regarding the potential speed and trajectory of ecological recovery to a forested state and conditions resembling those present before disturbance (Table 1). Further, rigorous empirical evidence of the rate of recovery in sites reclaimed to these more recent standards is lacking. Thus, a knowledge gap exists as to whether these new criteria are creating forests that appear to be on track to becoming functioning forest ecosystems (Rowland et al., 2009). Given that reclamation criteria will continue to evolve in the decades to come, it is important to evaluate the effectiveness of both past and current reclamation criteria in creating functioning ecosystems to inform future criteria changes locally and provided empirical evidence for other jurisdictions undertaking similar efforts.
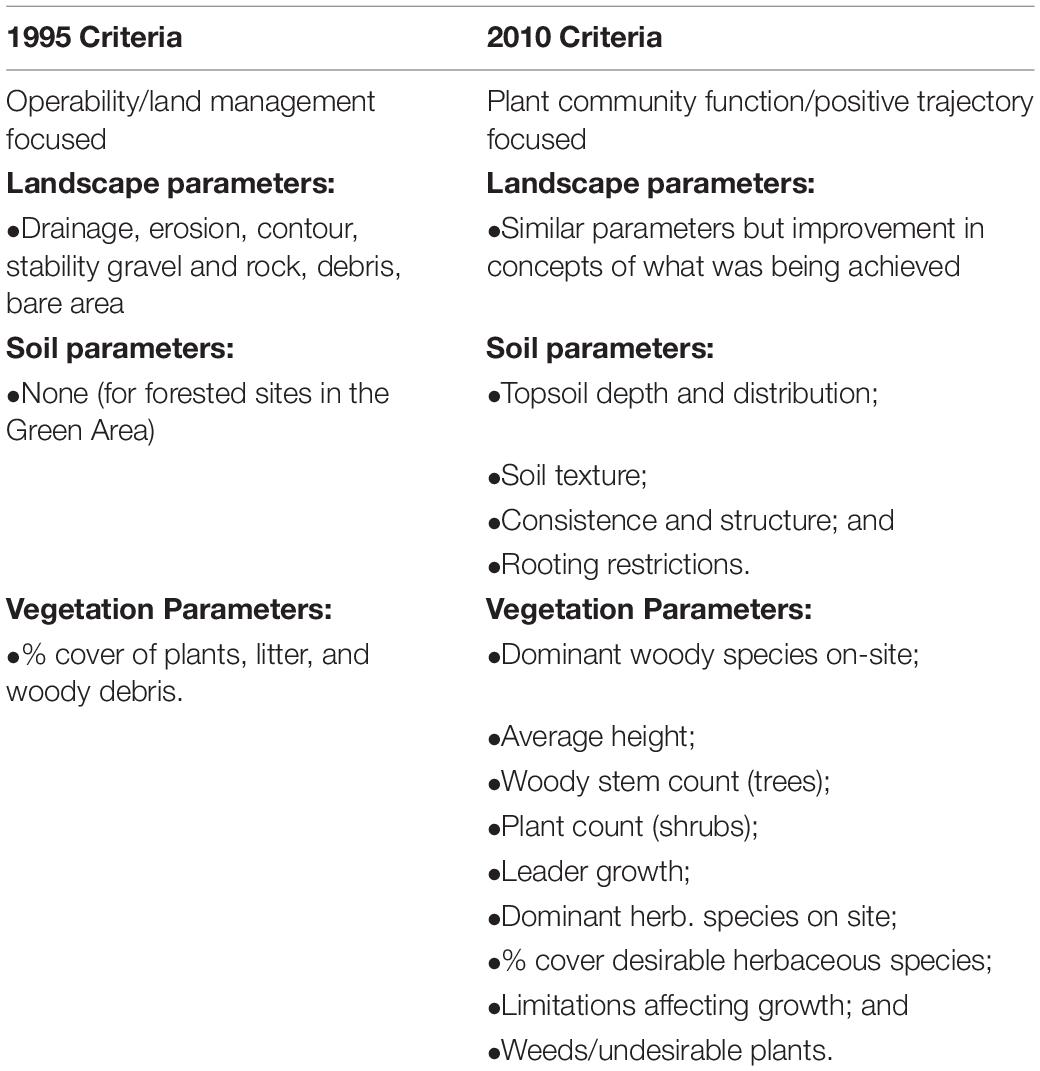
Table 1. Key differences between the 1995 and 2010 forest reclamation criteria of Alberta, Canada, adapted from AEP (1995) and ESRD (2010).
To evaluate the rate of ecological recovery, it is essential to determine if the ecological characteristics of interest in the reclaimed ecosystem are similar to those present in healthy ecosystems in the region. A common means of evaluation is through comparison with adjacent forests which are often at a much later seral stage than the reclaimed site. Lupardus et al. (2019), in a study looking at the ecological recovery on reclaimed sites in Alberta, found that vegetation can be dissimilar to undisturbed, natural systems for up to 48 years after reclamation. In our study, because the evaluation is being made 5 to 20 years after reclamation, we believed that it was unlikely that the ecological condition of reclaimed areas would replicate an intact, mature forest simply due to the different seral stages, as previously noted by Redente et al. (1983).
Therefore, we elected to pursue an alternative approach whereby the ecological condition of reclaimed sites is compared with sites that have similarly experienced stand-replacing disturbances such as being burned, blown down, or harvested. It has been suggested that directly comparing the conditions of young post-disturbance ecosystems provides a better evaluation of ecosystem development than comparison with an undisturbed forest. Indeed, there is evidence to suggest that areas recovering from natural disturbances often have understory vegetation and similar trajectories of recovery to young native forests (Carleton and Maclellan, 1994; Bergeron et al., 2001; Dhar et al., 2018; Sasaki et al., 2018). This approach is previously recommended (Chambers et al., 1994; Rowland et al., 2009; Lupardus et al., 2019), and is based on a general assumption that the constituent plant and animal species are extremely adapted to current disturbances and would eventually colonize the area from elsewhere (Carleton and Maclellan, 1994). However, despite this general, and acceptance of the importance of integrating disturbance-type-specific considerations into the evaluation of ecosystem recovery, assessments of already conducted restoration projects from this perspective are not common.
Measures of vegetation structure and soil physical, chemical, and elemental properties are often used as an indicator of function (Ruiz-Jaen and Aide, 2005; Wortley et al., 2013). Previously, comprehensive analyses have demonstrated vegetation structure and soil physical, chemical, and elemental properties as our response variables (Ruiz-Jaen and Aide, 2005; Wortley et al., 2013). The selection of these variables as ecological indicators of choice was based on current experimental evidence demonstrating that vegetation and soil processes are inextricably linked (Vanhala et al., 2005; Lafleur et al., 2015) and most impacted during oil and gas operations (Dhar et al., 2018, 2020). Vegetation structure is useful for predicting the direction of plant succession (Salinas and Guirado, 2002; Prach et al., 2019; Rydgren et al., 2020), and is often evaluated through ground cover estimates, woody plant density, and species diversity. Soil physical, chemical and elemental properties are important because this information gives an indirect measure of nutrient cycling (Chambers et al., 1994; Wortley et al., 2013), and provides insights into the resilience of the restored ecosystem.
Given that boreal forest reclamation will continue in the decades to come, it is important to ascertain the degree to which current criteria are creating ecosystems that are representative of those in the surrounding landscape. We used a range of ecological indicators from reference harvest and fire areas to define “potential recovery,” for comparison with those on mineral surface leases certified with either the pre-1995 or 2010 reclamation criteria. We logically expect to observe differences in outcomes due to changes in criteria and it may be a reasonable expectation that the pre-1995 criteria will be most distinct concerning less severely disturbed early successional sites. Nevertheless, it is important to quantify the magnitude and direction of these similarities and differences to gauge the relative effectiveness that changes in criteria and practice have had on ecological recovery. We addressed ecological recovery by asking three questions in this study: (1) Have key changes in criteria led to quantifiable improvements in reclamation outcomes? (2) Which vegetation and soil properties match between reclaimed sites and reference areas, and are thus considered useful indicators of reclamation ecosystem recovery? (3) Can previously harvested cut blocks and forest fire impacted sites of comparable age provide reasonable analogs to assess ecosystem recovery (as opposed to the current practice of referencing adjacent and often mature forests)?
Materials and Methods
Study Region
The study area lies within the Central Mixedwood, Dry Mixedwood, and Lower Boreal Highlands natural sub-regions of Alberta (Natural Regions Committee [NRC], 2006). The general topography of the is consists of large and gently undulating plains, flat terrains, hummocky uplands, and extensive wetlands, with an average elevation of 354 m above mean sea level. The area has a continental climate, which is defined by short and warm summers and long and cold winters, providing a growing season of approximately 96 days between May and September. The average annual temperature ranges from −2 to 2.4°C, with 400-439 mm of rainfall (Environment Canada Climate Normals 1981-2010).1 Gray Luvisolic soils are dominant in this landscape in addition to Brunisolic soils.
Site Selection
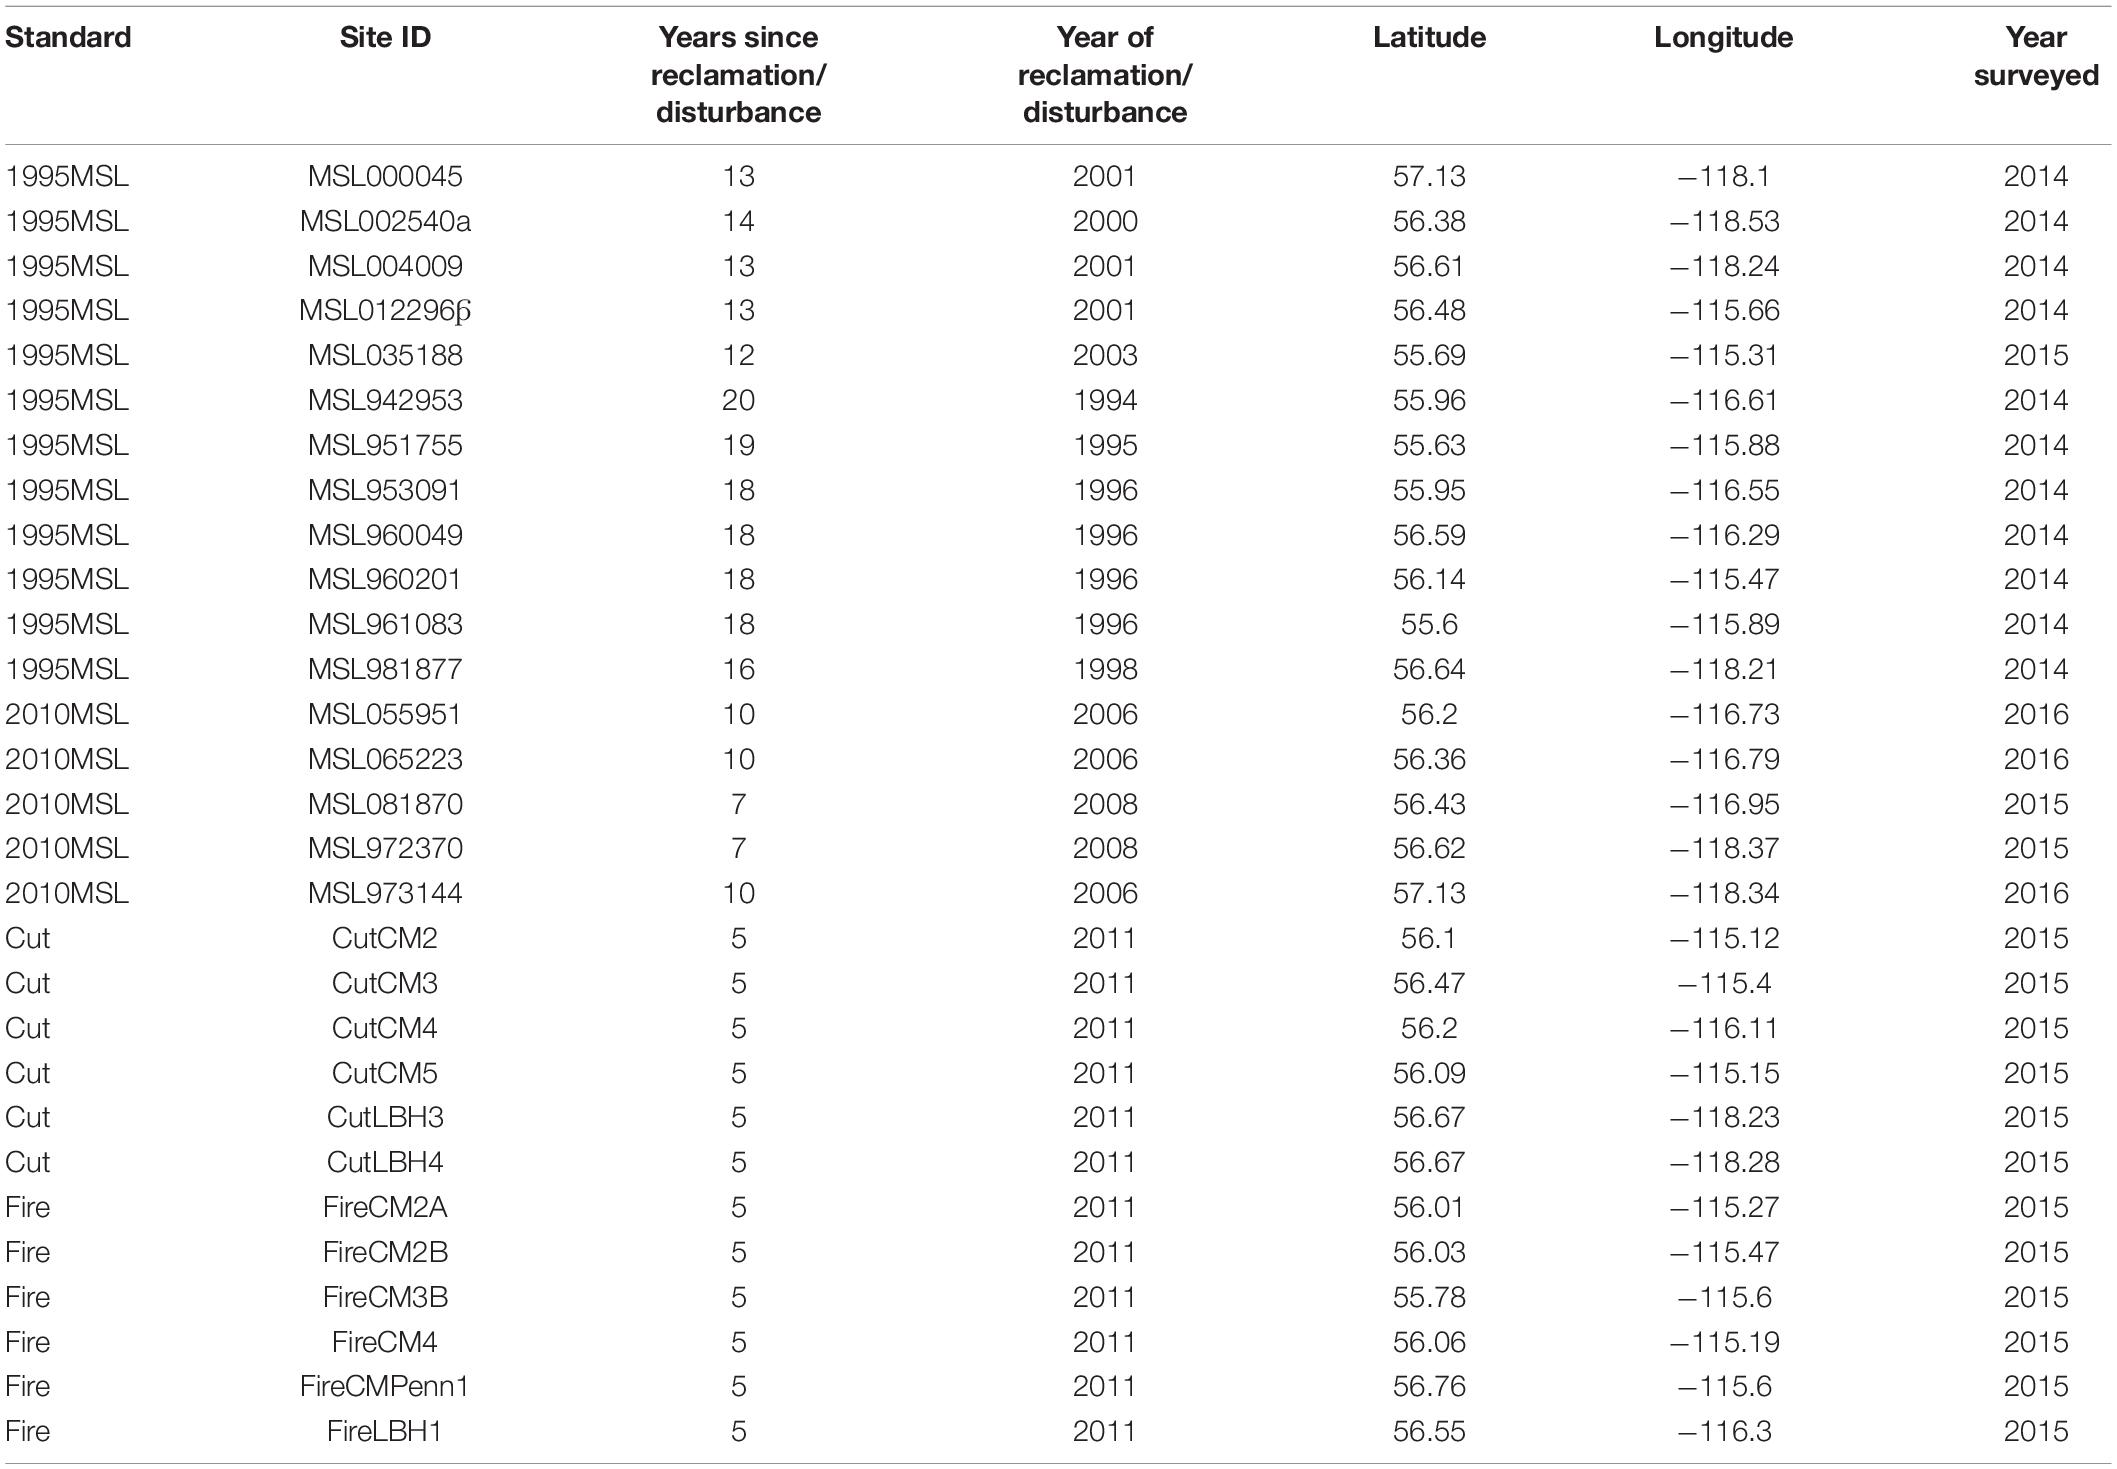
The sites examined were mineral surfaces leases (MSLs) that have been certified as successfully reclaimed after oil and gas disturbance in north-central Alberta (55° 55′ 55.2′′ N to 55° 18′ 31.5′′ N). These MSLs have been reclaimed and certified per the requirements of either the pre-1995 (Alberta Environment and Protection [AEP]., 1995) or 2010 versions of the Reclamation Criteria for Wellsites and Associated Facilities for Forested Lands (Environment and Sustainable Resource Development [ESRD]., 2013). Study sites were within the Central Mixedwood, Dry Mixedwood or Lower Boreal Highlands Natural Sub-Regions (Beckingham and Archibald, 1996). Prior to disturbance, all sites were mesic/medium (ecotype d) on the edatopic grid, with different proportions of native tree species including Populus tremuloides, Populus balsamifera, Picea glauca, Pinus banksiana (Rowe, 1972; Beckingham and Archibald, 1996). A total of 17 MSLs sites were selected based on their accessibility and known certification status; these sites ranged from 7 to 20 years since reclamation (Table 2). Of the 17 sites, 12 were certified with the 1995 criteria and 5 with the 2010 criteria. For the current study, only 6 out of the 12 1995MSLs we sampled were included in the analysis to better represent a balanced study design, unless otherwise stated. Normally, the protocols described in the 2010 reclamation criteria require the use of undisturbed, natural systems as reference sites for comparison, but in this study, we chose 12 reference sites that represented two disturbance regimes: forest fires (6 sites) and forest harvest blocks (6 sites).
Initially, historical information and a list of potential sites were collected for MSLs from Alberta Energy Regulator and Alberta Environment and Park’s databases for the sub-regions to be sampled. A reconnaissance trip to potential sites was conducted to ensure sites were accessible and met selection criteria (i.e., all certified MSLs located in upland forest, and were mesic/medium (modal) on the edatopic grid) (Beckingham and Archibald, 1996). The final 29 sites used in this study were selected after confirming landowners’ or companies’ approval to measure (Figures 1A–D; Supplementary Figures 1.1–1.29). Google Earth imagery was used to determine if MSLs were likely to have been modal pre-disturbance with typical vegetation including aspen and white spruce. Once this was confirmed, the location for sampling plot installation within a site was randomly selected using a random number table.
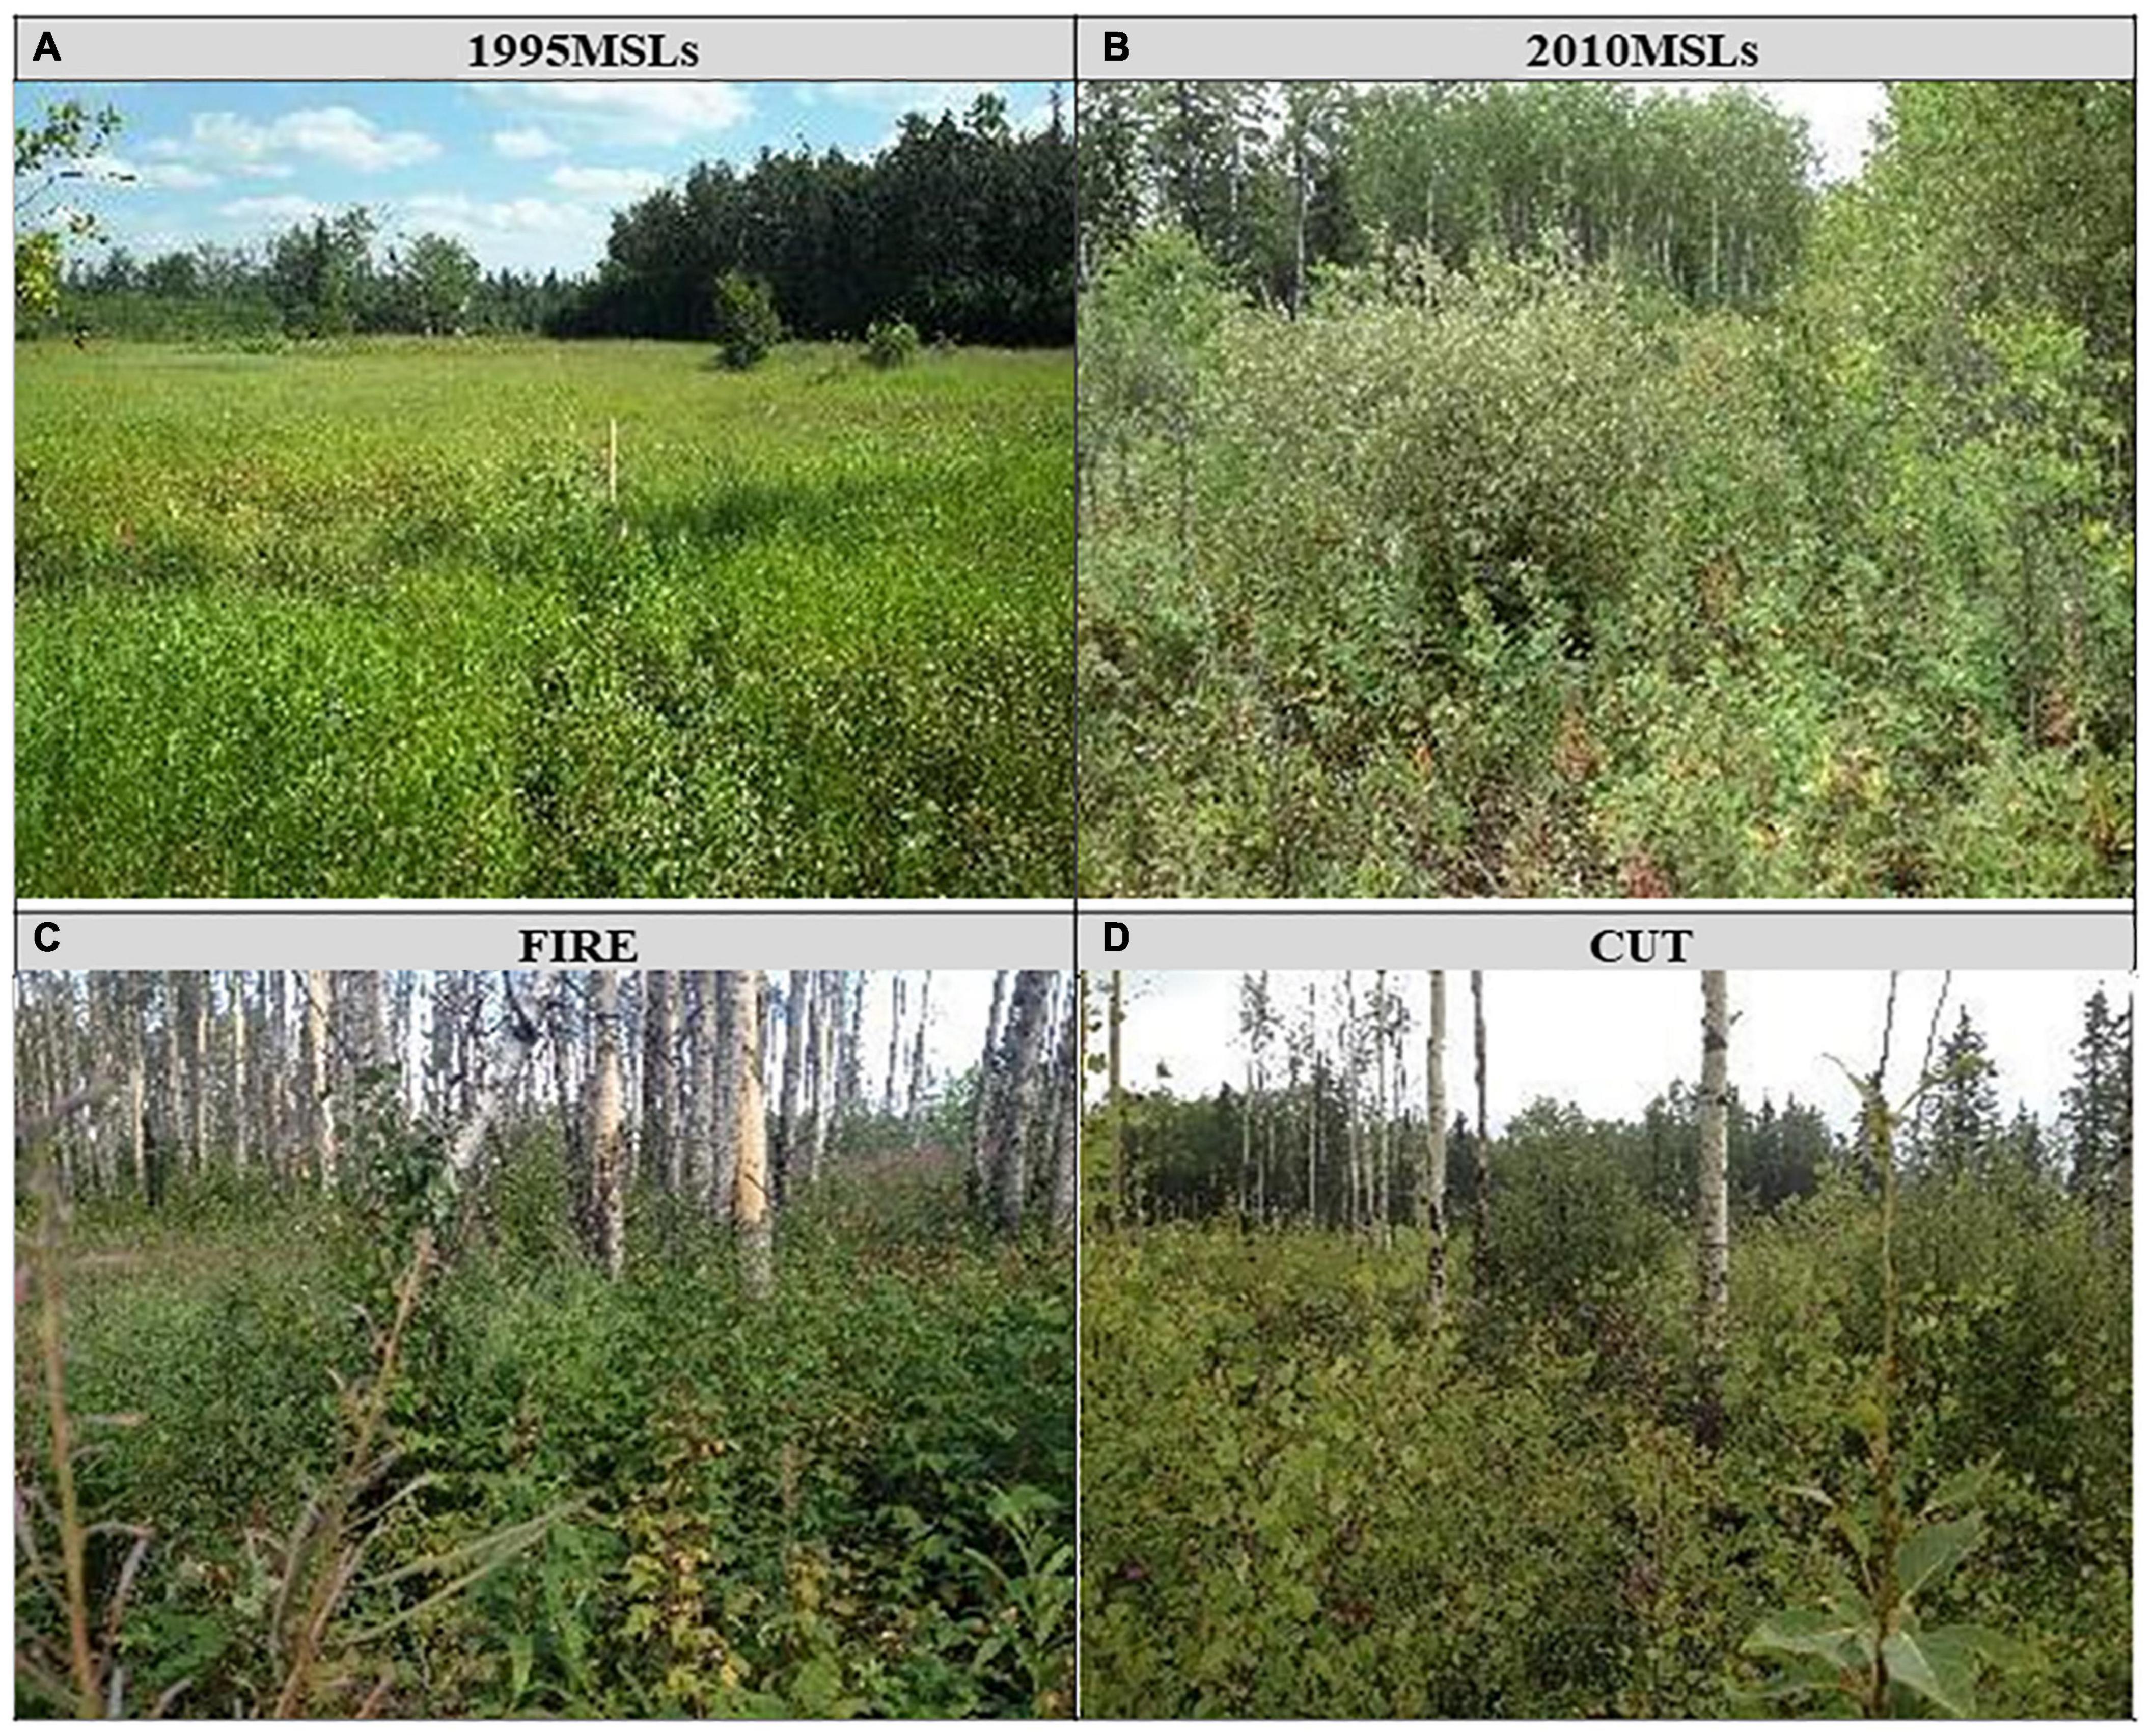
Figure 1. Images showing the general status of the two certified reclaimed mineral lease surfaces and adjacent reference sites in Alberta’s Central Mixedwood, Dry Mixedeood, and Lower Boreal Highlands Natural Subregions: (A) 1995MSL, (B) 2010MSL, (C) FIRE, and (D) CUT.
Sampling Design
We measured a suite of parameters relating to ecosystem structure and function in the certified MSLs and reference sites. Supplementary Table 1 contains the list of attributes and sampling protocols we considered. We created these protocols considering cost, ease of use, method sensitivity, and sampling season timing. Variables relating to ecosystem parameters were measured at growing season peak biomass (mid-August) in 2015 and 2016. For each certified reclaimed or reference site, one large plot (150 m × 200 m), or smaller if the site size did not permit it, judged to be representative of the entire site, was established at each site. Within the 150 m × 200 m measurement plot, 12 subplots that were each 10 m × 10 m were evenly spaced on a grid. Five subplots (P1–P5) were established diagonally across the 150 m × 200 treatment plot. Three vegetation surveys were carried out within a 10 m × 10 m subplot. At the center of each subplot, a 1.78 m circular plot was established to measure: (i) the count of individual woody species (living and dead); and (ii) total height of the tallest woody plant (for each species). Two 0.5 m × 0.5 m subplots were also established within each 10 m × 10 m plot to measure the percent ground coverage of each herbaceous and woody species.
Soils were sampled from four pits that were located along the diagonal of the 150 m × 200 m measurement plot. The pits shared the same inter-plot distance as the vegetation survey protocol. Pits were dug to 60 cm to expose soil horizons where the depths of the organic (LFH) and the A + B mineral soil layers were recorded. Soil samples for soil chemistry analysis were collected from two depths in the mineral soil, 0–10 and 20–30 cm, using a 3.2 cm diameter core, thereby excluding the fresh litter, fibric and humified surficial organic matter (i.e., mulch or LFH) layer. Samples for bulk density were collected at each of these two depths (0–10 cm and 20–30 cm), by inserting three metal rings of 106 cm3 volume into the soil. The composited samples were placed in plastic bags and refrigerated (∼4°C) until further analysis.
Lab Procedure
Fresh soil samples were sieved to pass a 2 mm screen (# 10 U.S. Standard Sieve) and separated into two subsamples. One subsample was stored in a −20°C freezer for chemistry analysis, while the other subsample was air-dried at room temperature (∼20–25°C) in preparation for total carbon and nitrogen analyses. Soil pH and electrical conductivity (EC) were measured using a pH meter and an EC meter with a 1:2 (m:v) soil-to-water ratio (Kalra and Maynard, 1991). A portion of the oven-dried sample was ground using a ball mill (MM200, Retsch GmbH, Haan, Germany) and used for measurement of total C and total N, using an automated elemental analyzer (NA-1500 series, Carlo Erba, Milan, Italy). To determine bulk density, samples taken with the metal rings were oven-dried at 105°C to constant mass and weighed. The bulk density of the soil was then calculated by dividing dry mass by metal ring volume.
Statistics
All data analyses and visualizations were performed using the R programming environment (R Core Team, 2020). Depending on the nature of the outcome variable, e.g., concentrations, fractions, percentages, or zero-inflated data, the appropriate distributions and functions were chosen for model fitting (see Supplementary Table 1). The function gls() from the package nlme was used for all statistical models involving fixed and random effects (Pinheiro, 2017). The gls technique can model non-constant variance among factors by specifying ‘weights = varIndent(). Count data with many zeros were analyzed with the function glm. nb() from the MASS package (Ripley et al., 2013), while the function gamlss() from the gamlss package was used for zero and one inflated percentage data (Rigby and Stasinopoulos, 2005). Shannon–Weiner diversity index is calculated in R using vegan package version 2.4-4 (Oksanen et al., 2008). Model assumptions were checked with diagnostic plots of fitted and residual values and a histogram of residuals. Post-hoc comparisons were conducted with the Fisher’s protected least significant difference (LSD) test if the means were significantly different with ANOVA. Given that the study design depended on the availability of reclamation sites that had several confounding factors including small numbers of treatment sites, age since reclamation, age at the time of planting, and operational practices (e.g., equipment used, prior stockpiling), the risk of a type II error in the analysis was considered to be high. Consequently, a P-value of 0.10 was used to assess the significance to reduce the type II error.
We used an NMDS ordination to characterize and compare plant community diversity using vegetation cover between the site types. All 29 sites were fitted onto NMDS ordination using metaMDS function from the vegan package (Oksanen et al., 2008) as it is proven to have a significant advantage for analyzing data from this unbalanced experimental design by rapidly producing visually informative results (Rowland et al., 2009). Their centroids and 95% confidence interval ellipses were used to represent each site type on the biplots. With NMDS, space-sample relationships are based on ranked dissimilarity in compositional space, and thus free from assumptions of normality, dimensionality, linearity, and the shape of species-response curves to gradients. The output solution with the lowest dissimilarity between ordination and Bray-Curtis distances were selected as the final model. Also, the resulting two-dimensional image output from the ggplot2 package produces a visual aid to interpreting similarity among entities, those more similar being clustered closer together. Subsequently, we completed a permutational analysis of variance (PERMANOVA) with the function adonis() (R vegan package) to determine if the vegetation cover of the different sites could be explained by species groupings variables including coniferous trees, hardwood trees, shrubs, forbs, grasses, and mosses and for comparison against the NMDS ordination to validate our findings. Bray–Curti’s dissimilarities distance was used during the analysis.
Results
Soil Physical-Chemical Characteristics
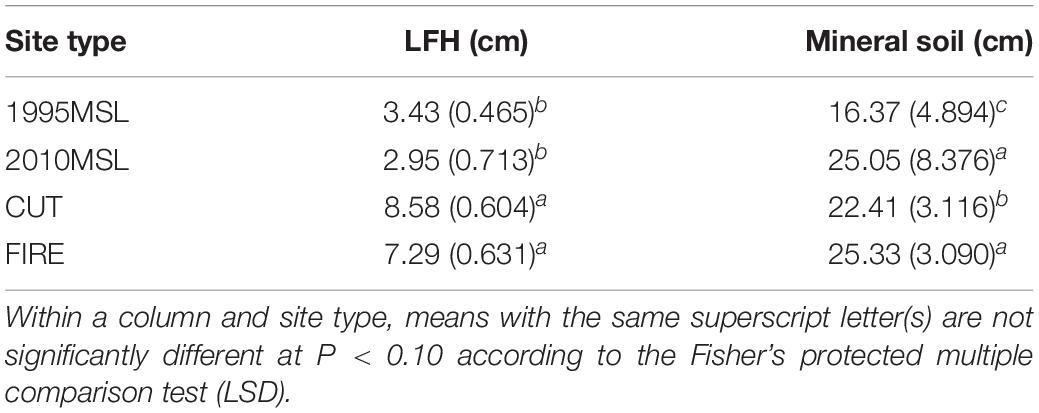
Soil bulk density (F = 1.84; p = 0.02) in the 0–10 cm layer of the 2010MSLs (0.97) was not different from that in the CUT (0.71) or FIRE (0.65); however, the 1995MSLs had higher bulk density (1.25 g cm–3) than the CUT and FIRE sites (Table 3). Soil bulk density at 20–30 cm depth ranged from 1.34 to 1.49 g cm–3 and was similar (F = 0.25, p = 0.61) between the different site types. While soil pH (F = 6.51; p = 0.03) in the 0–10 cm layer varied between 1995MSLs and reference sites, no difference was observed between 2010MSLs and FIRE sites. Soil pH in the 20–30 cm layer (F = 5.99; p < 0.001) was higher on the reclaimed sites compared with on reference sites. The electrical conductivity (F = 4.21; p < 0.001) in the 20–30 cm depth was higher in the 1995MSLs compared with the reference sites; no differences were observed among the site types within the 0–10 cm soil layer (F = 0.41; p = 0.58). Soil C stock in the 0–10 cm depth did not vary (F = 10.77; p = 0.12) among the site types. On the other hand, soil C stock in the 10–30 cm layer was significantly different (F = 6.21; p = 0.02); it was the highest in 2010MSLs and lowest in CUT sites. While differences in total N stock in the 10–30 cm soil layer did not differ (F = 1.39; p = 0.26) among the site types, the 1995 and 2010MSLs at the 0–10 cm layer had an average a higher N stock (F = 0.54; p = 0.09) than the CUT site. The soil C:N ratios at the 0–10 cm (F = 3.64; p = 0.52) and 10–30 cm (F = 1.64; p = 0.13) depth did not differ among the site types (Table 3). LFH development (F = 21.39; p < 0.001) on the reclaimed sites had not yet reached a thickness similar to those found on reference sites (Table 4). The average thickness of the LFH layer was 2.5 times thicker on reference sites (7.9) than on reclaimed sites (2.5 cm). The thickness of the mineral soil layer (F = 15.71; p = 0.002) on 2010MSLs was comparable to the FIRE site but significantly thicker than those found on 1995MSLs and CUT site (Table 4).

Table 3. Bulk soil chemical and physical properties (means with standard errors in parentheses) at the 0–10 and 10–20 cm depth at each test site (n = 5–12).
Vegetation Structure
Native forb cover (F = 2.21; p = 0.07) varied 1995MSLs and reference sites; no differences were observed between 2010MSLs and FIRE or CUT site (Figure 2A). Non-native forb cover (F = 7.64; p < 0.001) was greater on 1995MSLs than the other three site types (Figure 2B); this change was driven by the initial establishment of Trifolium spp., Melilotus spp., and Medicago sativa in the 1995 criteria. Again, the 1995MSLs were associated with a substantially higher cover of native grasses (F = 13.88; p < 0.001), more than 20%, whereas the cover of native grasses was 10% or less for the other three site types (Figure 2C). Non-native grass coverage (F = 16.32; p < 0.001) was twice as high on the 1995MSLs than 2010MSLs, while no non-native grass was recorded on either the CUT or FIRE sites 5 years after disturbance (Figure 2D). There was also an increase in moss cover (F = 4.11; p = 0.04) and total vegetation cover (F = 10.53; p < 0.001) on reclaimed sites, with the 1995MSLs having a higher coverage of each than the other site types (Figure 2E,F). Due to a lack of sample size (i.e., a low number of measurements), no statistical analyses were conducted for the non-native grass cover in FIRE and CUT sites. Coniferous tree stem densities (F = 9.64; p < 0.01) on the reclaimed sites were extremely low, presumably, these sites were not planted with conifers and natural recovery was lacking (Figure 3A). Hardwood tree density (F = 2.65; p = 0.01) in CUT sites was significantly higher than all other site types at 35,000 stems ha–1 through both FIRE and 2010MSLs showed similar densities at ∼10,000 stems ha–1; of note, 1995MSLs almost entirely lacked hardwood tree species (Figure 3B). Tall shrub density (F = 4.25; p = 0.06) was 36% lower in 1995MSLs than the other site types (Figure 3C). Medium shrubs (F = 8.42; p = 0.04) were similarly lacking in 1995MSLs while the 2010MSLs showed densities comparable to the CUT sites but not the FIRE sites (Figure 3D). The net effect for tree and shrub stem counts was that the 2010MSLs were comparable to both reference site types while the 1995MSLs were significantly lower than both reference site types (F = 2.73; p = 0.02; Figure 3E). Species richness and Shannon’s diversity index tended to be lower on reclaimed sites compared to the CUT and FIRE sites (Figure 4). However, the 2010MSLs were more similar in species diversity to the reference sites than the 1995MSLs. The differences in diversity were due to significant differences in species richness, not to differences in species evenness. The 2010MSLs richness averaged 6.7 species per plot, whereas the 1995MSLs averaged 3.7 species per plot. The CUT sites averaged 12.1 species per plot and the FIRE sites averaged 11.2 species per plot (Figure 4).
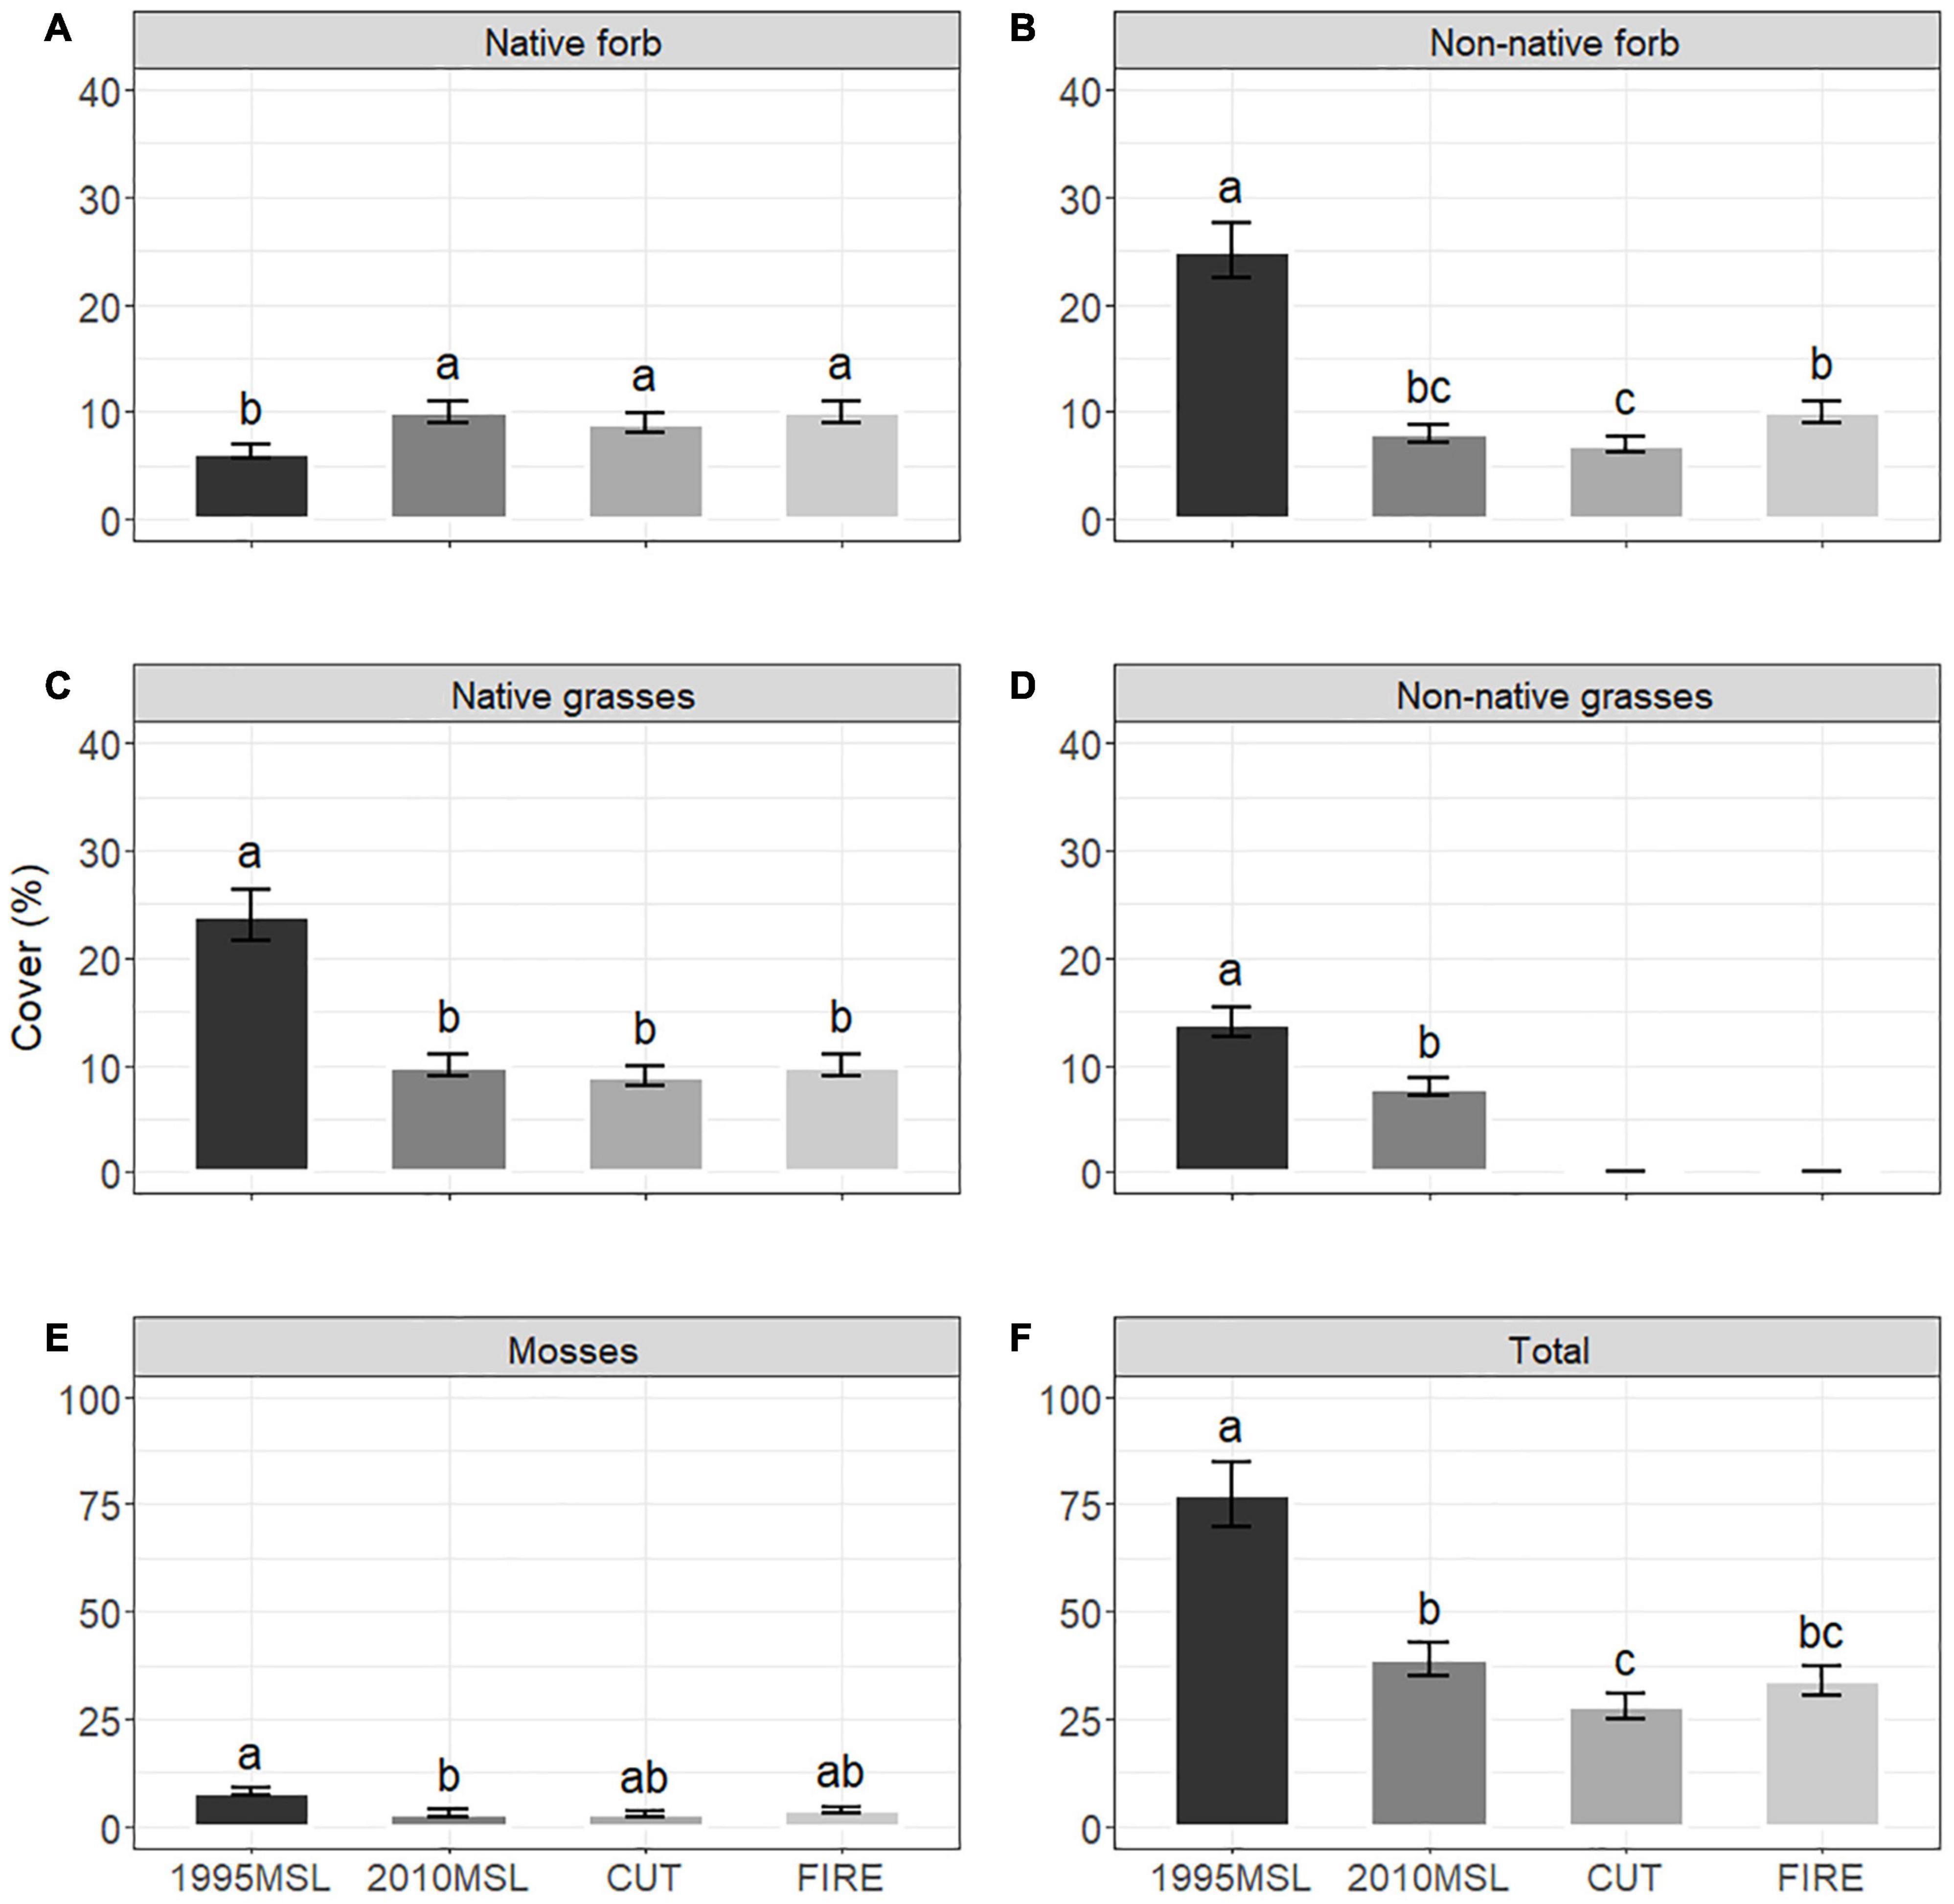
Figure 2. Least squares means (lsmeans) of coverages of native and non-native forbs (A,B), native and non-native grasses (C,D), mosses (E), and total (F) layer by reclaimed (1995 and 2010MSL) and reference (CUT and FIRE) site types. Mean (±SE) values with a different lowercase letter(s) were significantly different among the site types at P < 0.10.
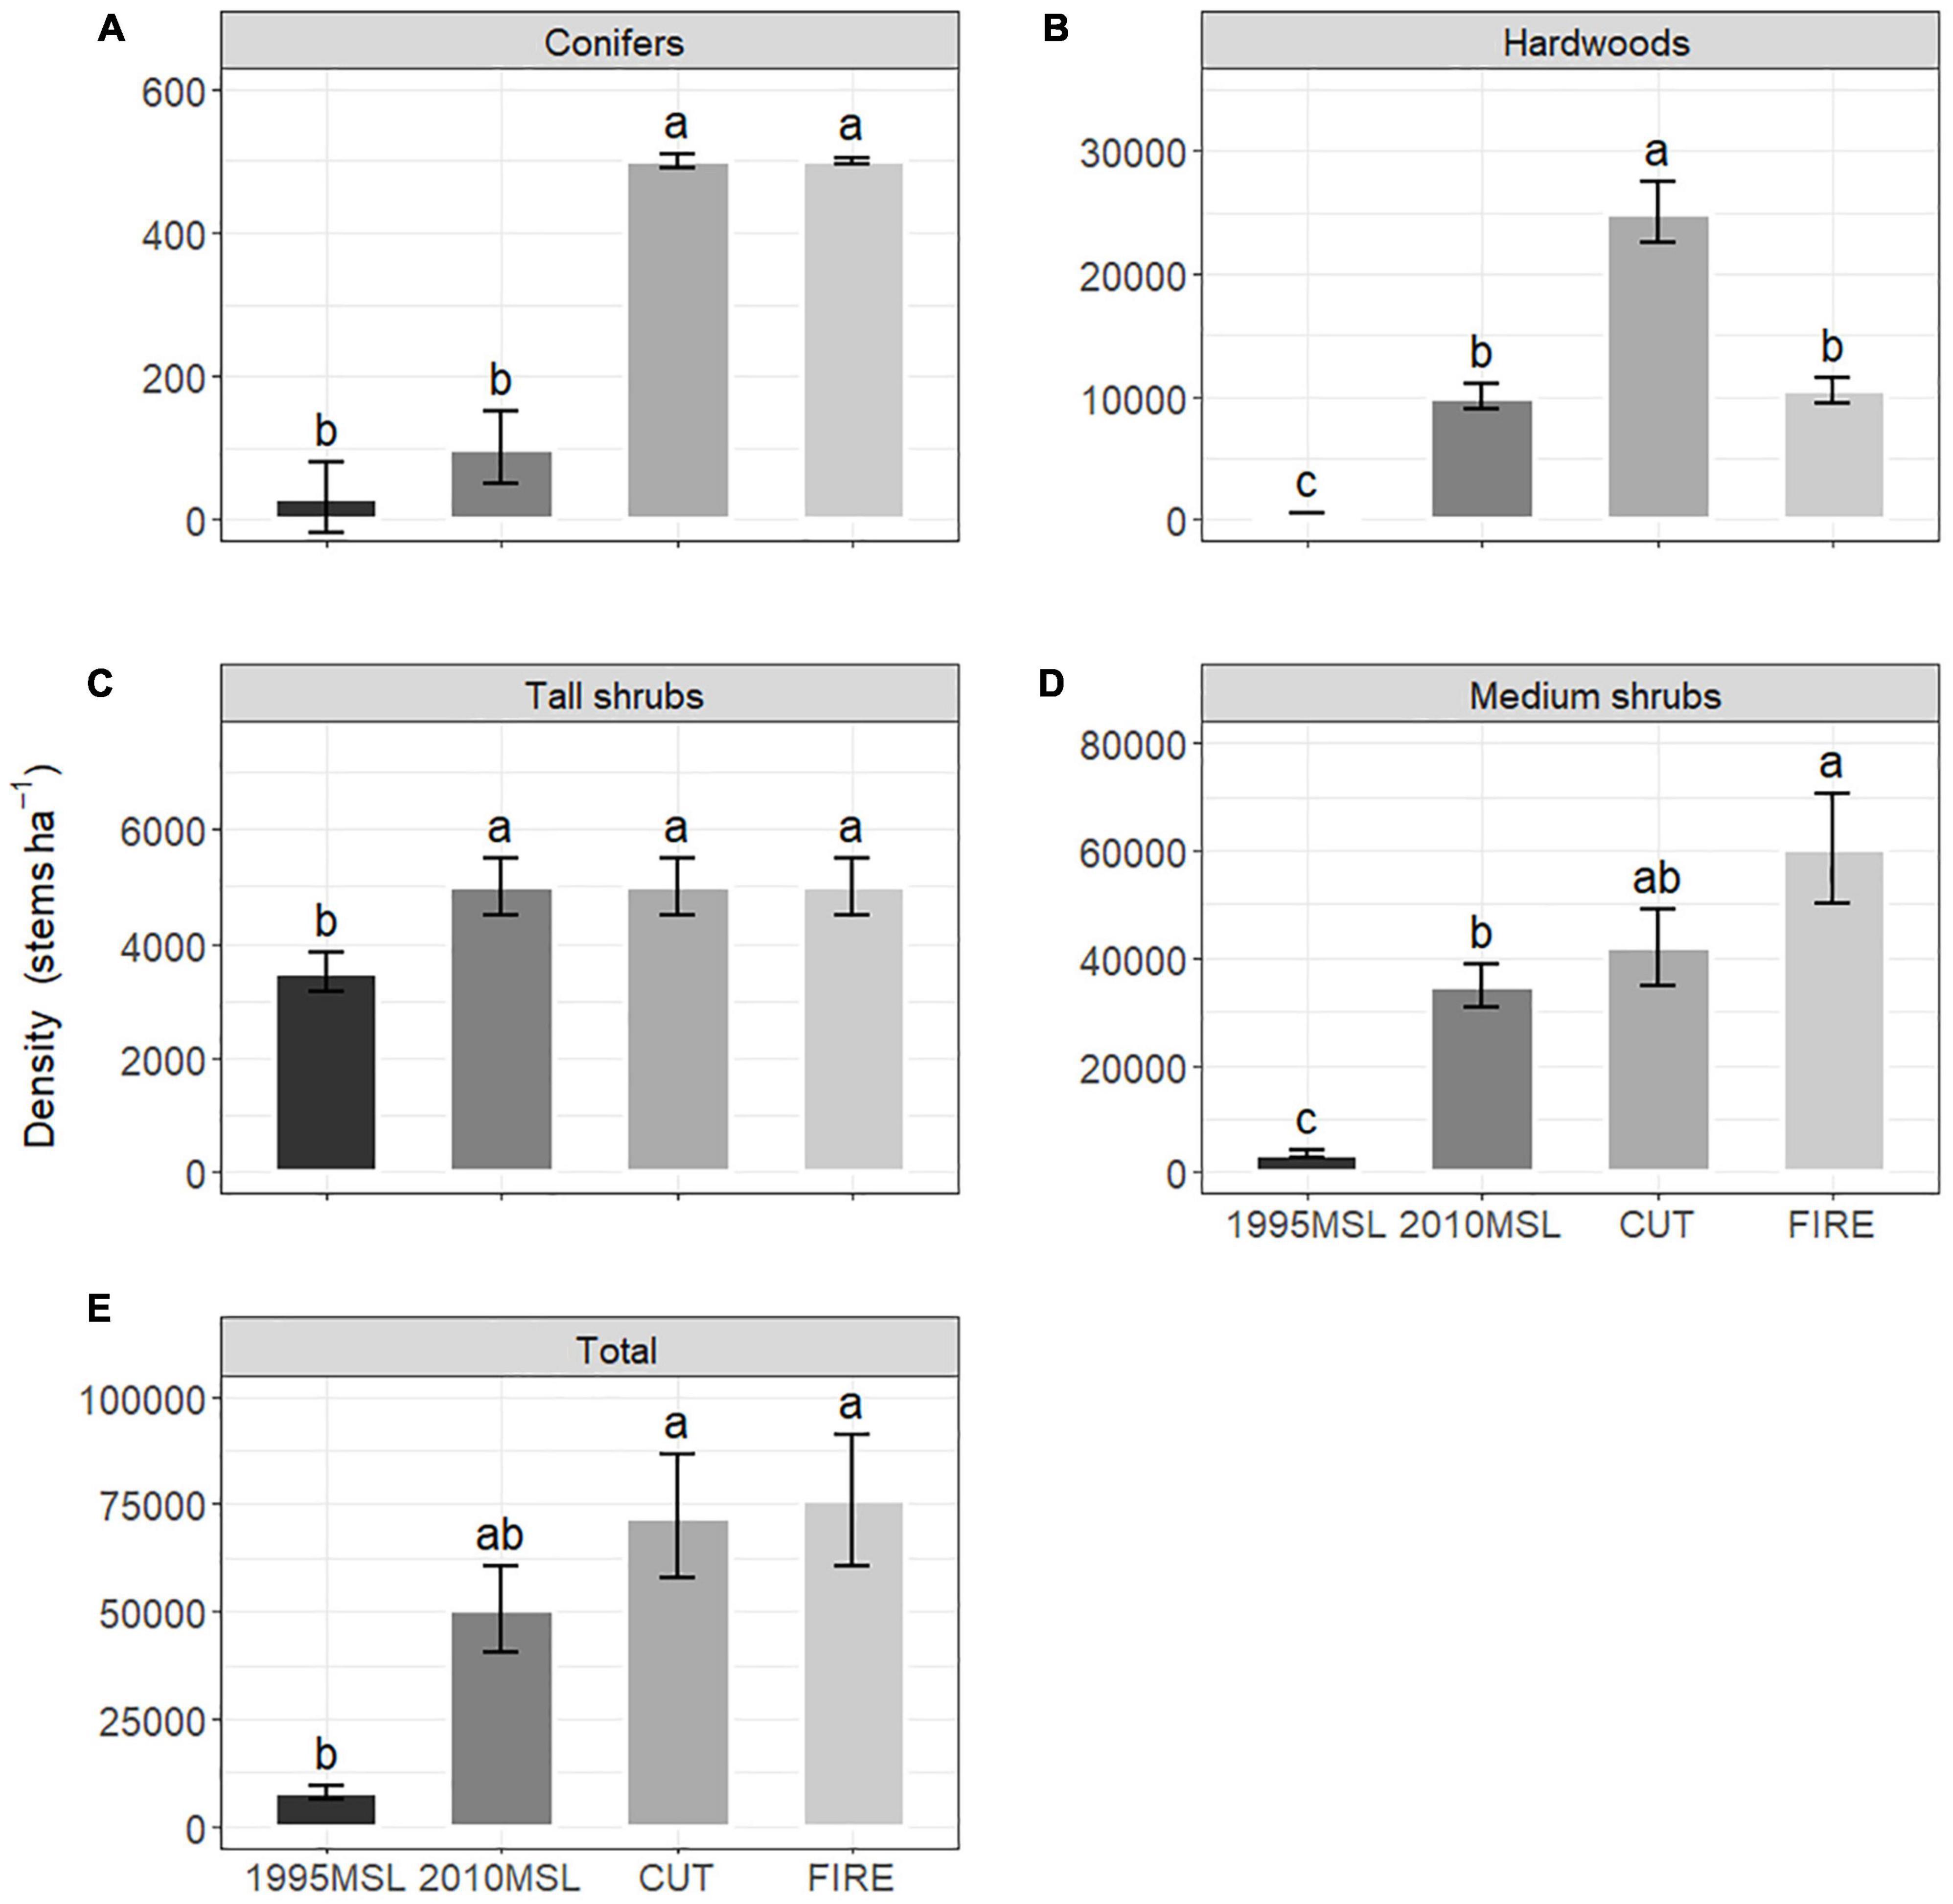
Figure 3. Least squares means conifers (A), hardwoods (B), tall and medium shrubs (C,D), and total (E) stem density by reclaimed (1995 and 2010MSL) and reference (CUT and FIRE) site types. Mean (±SE) values with a different lowercase letter(s) were significantly different among the site types at P < 0.10.
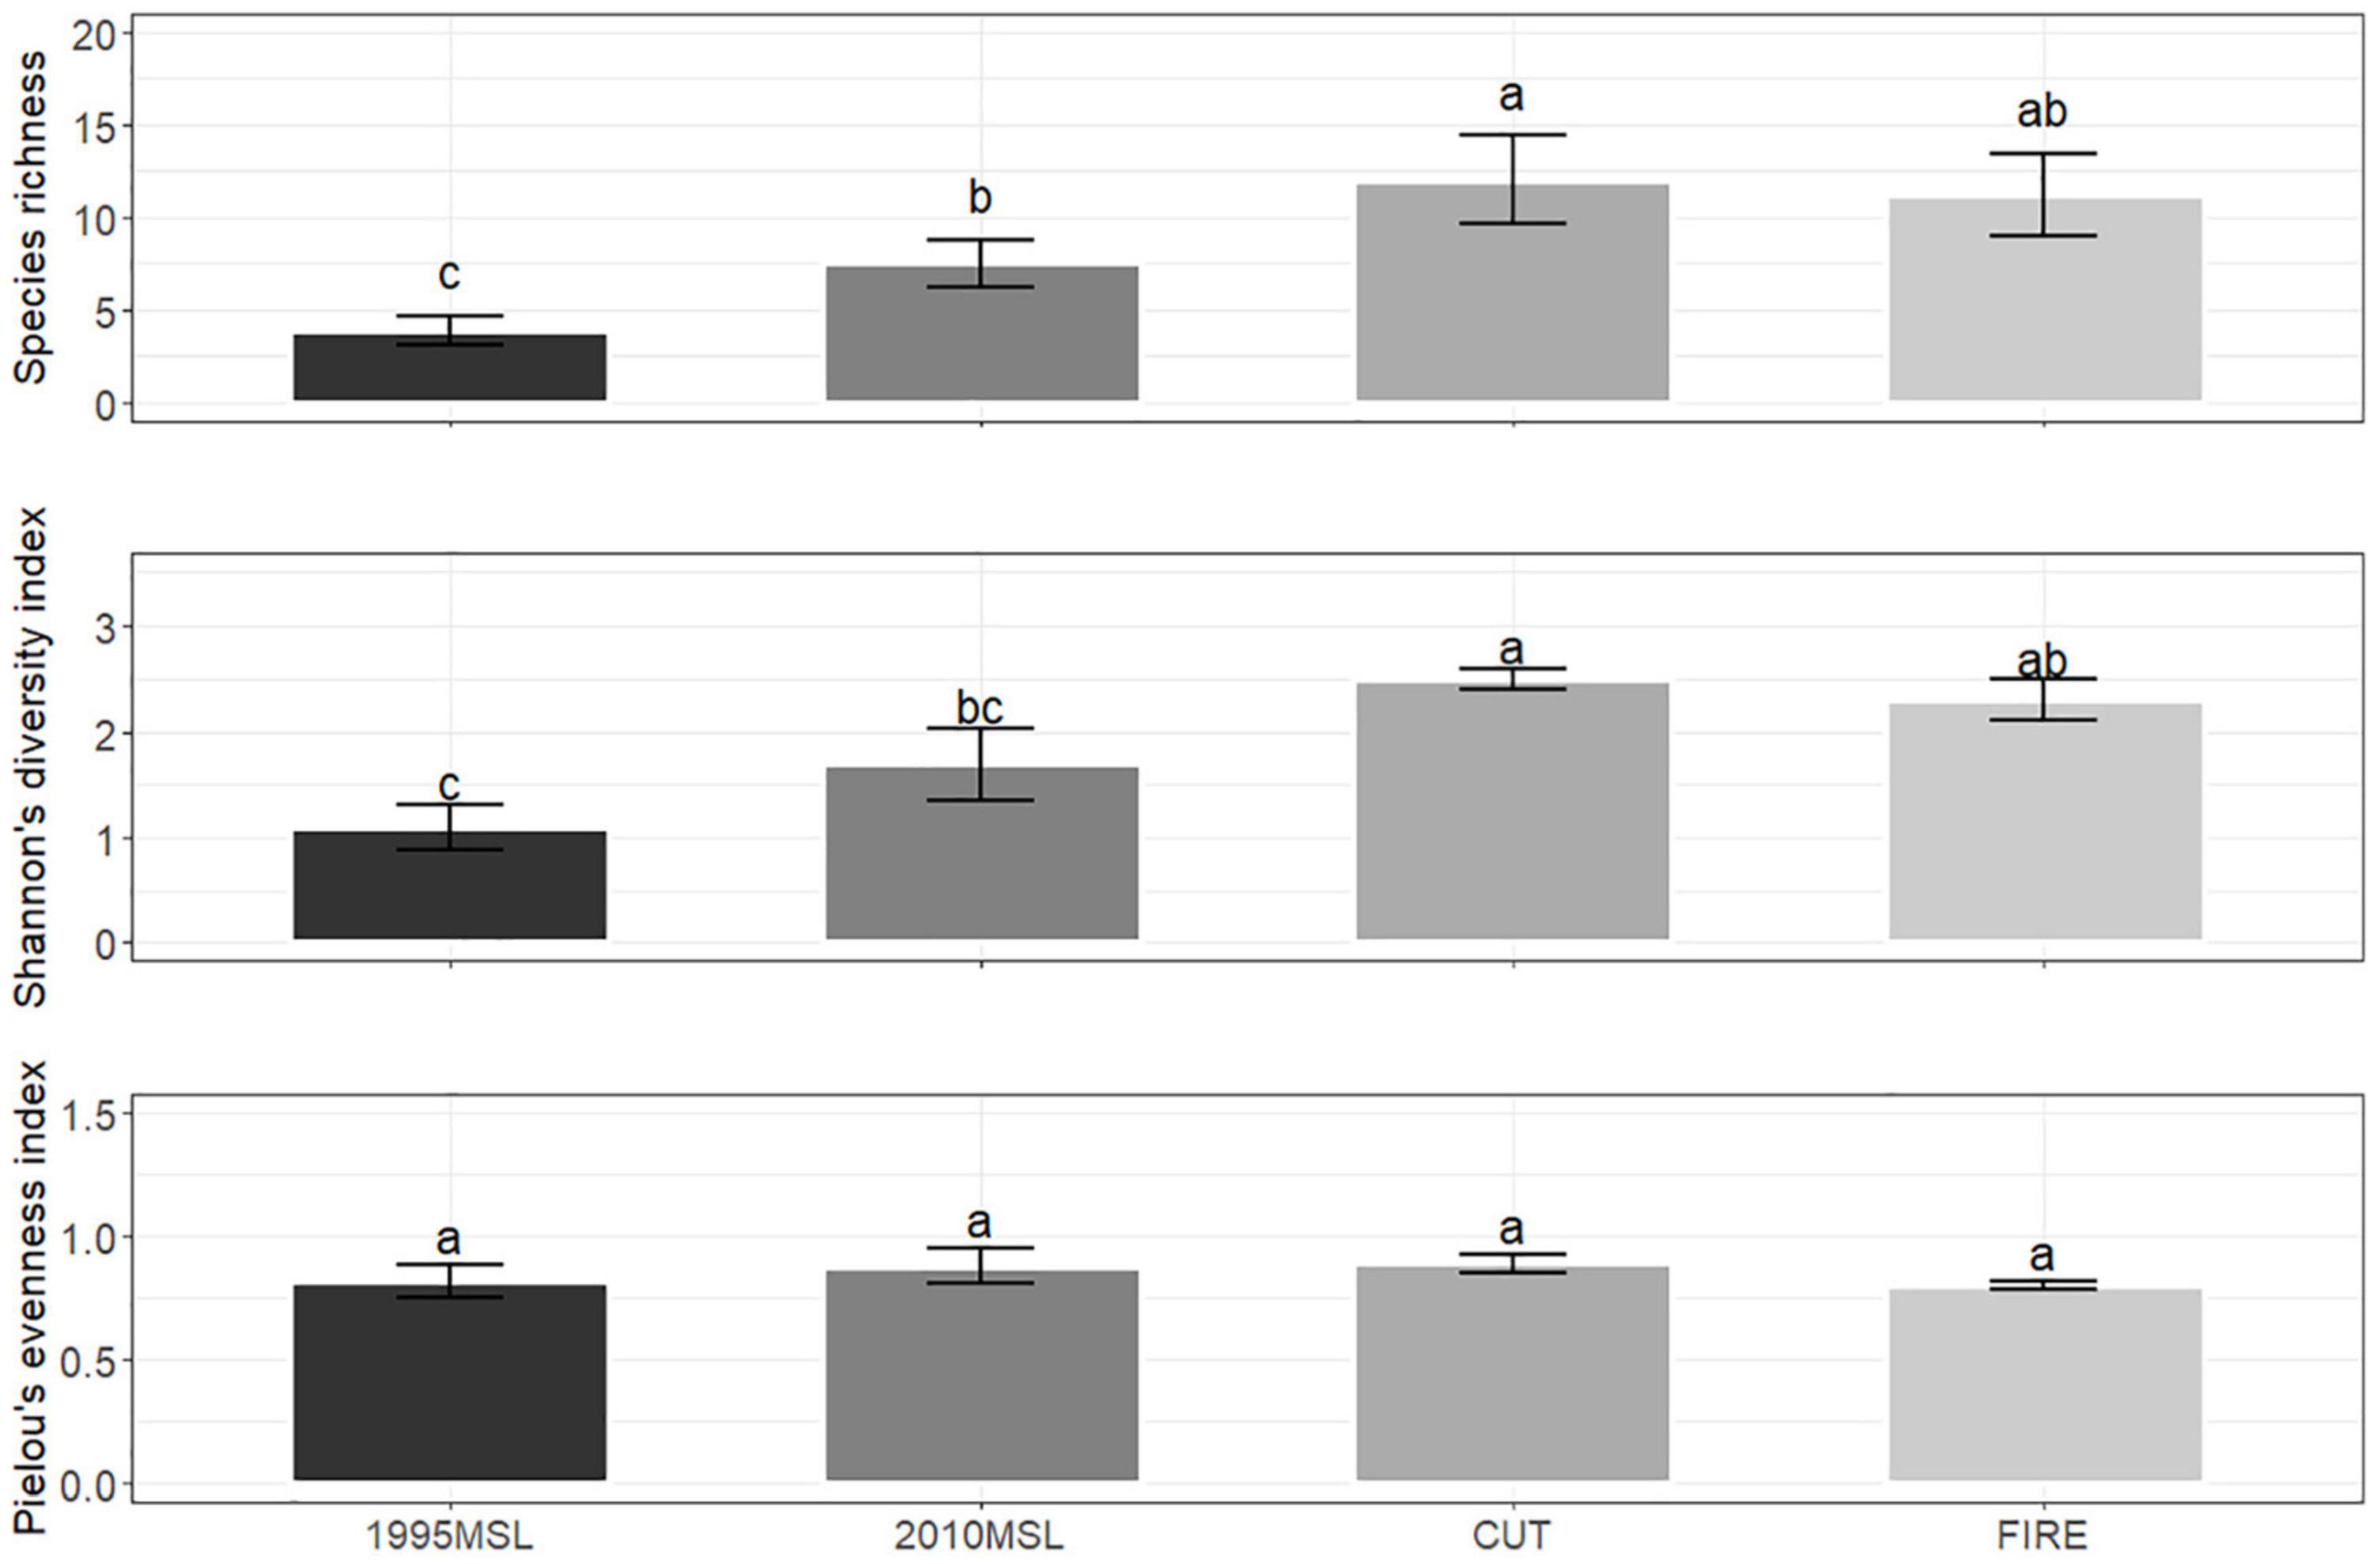
Figure 4. Least squares means (lsmeans) of species richness (species per plot) (A), Shannon’s diversity index (B), and Pielou’s evenness index (C) by reclaimed (1995 and 2010MSL) and reference (CUT and FIRE) site types. Letters indicate significant differences between treatments after Tukey adjustment (P < 0.05). Mean (±SE) values with different lowercase letter(s) were significantly different among the site types at P < 0.10.
Community Description
The final NMDS two-dimensional output had produced a stress value of 0.2, instability < 0.001, and R2 of 0.653 (axis 1 = 0.524, axis 2 = 0.129; data not shown). The reclaimed and reference sites were overlain on the biplot, and it was apparent that the species assemblages of these site types occupy different regions of the ordination plot (Figure 5). The 2010MSL plant communities shared a greater degree of similarity to the FIRE and CUT sites than the 1995MSLs. The 2010MSLs and CUT and FIRE sites were characterized by hardwood trees, tall and medium shrubs, and native forbs. The 1995MSLs tended to be dominated by a herbaceous cover, especially native and non-native grasses. The 2010MSLs did support some non-native grass cover, but it was significantly lower than the 1995MSLs. It is noteworthy that non-native grass development was a unique feature of all MSLs as these species were not found on the FIRE or CUT sites. Results of the PERMANOVA analysis confirmed those of NMDS. The PERMANOVA showed significant differences in coverage of most of the species’ groupings (hardwood trees, medium shrub, native and non-native grasses, and non-native forbs) between the 1995MSLs and either of the CUT and FIRE sites (Table 5). Medium shrub and native forbs were the only species groupings that were significantly distinct between the 2010MSLs and either of the reference sites.
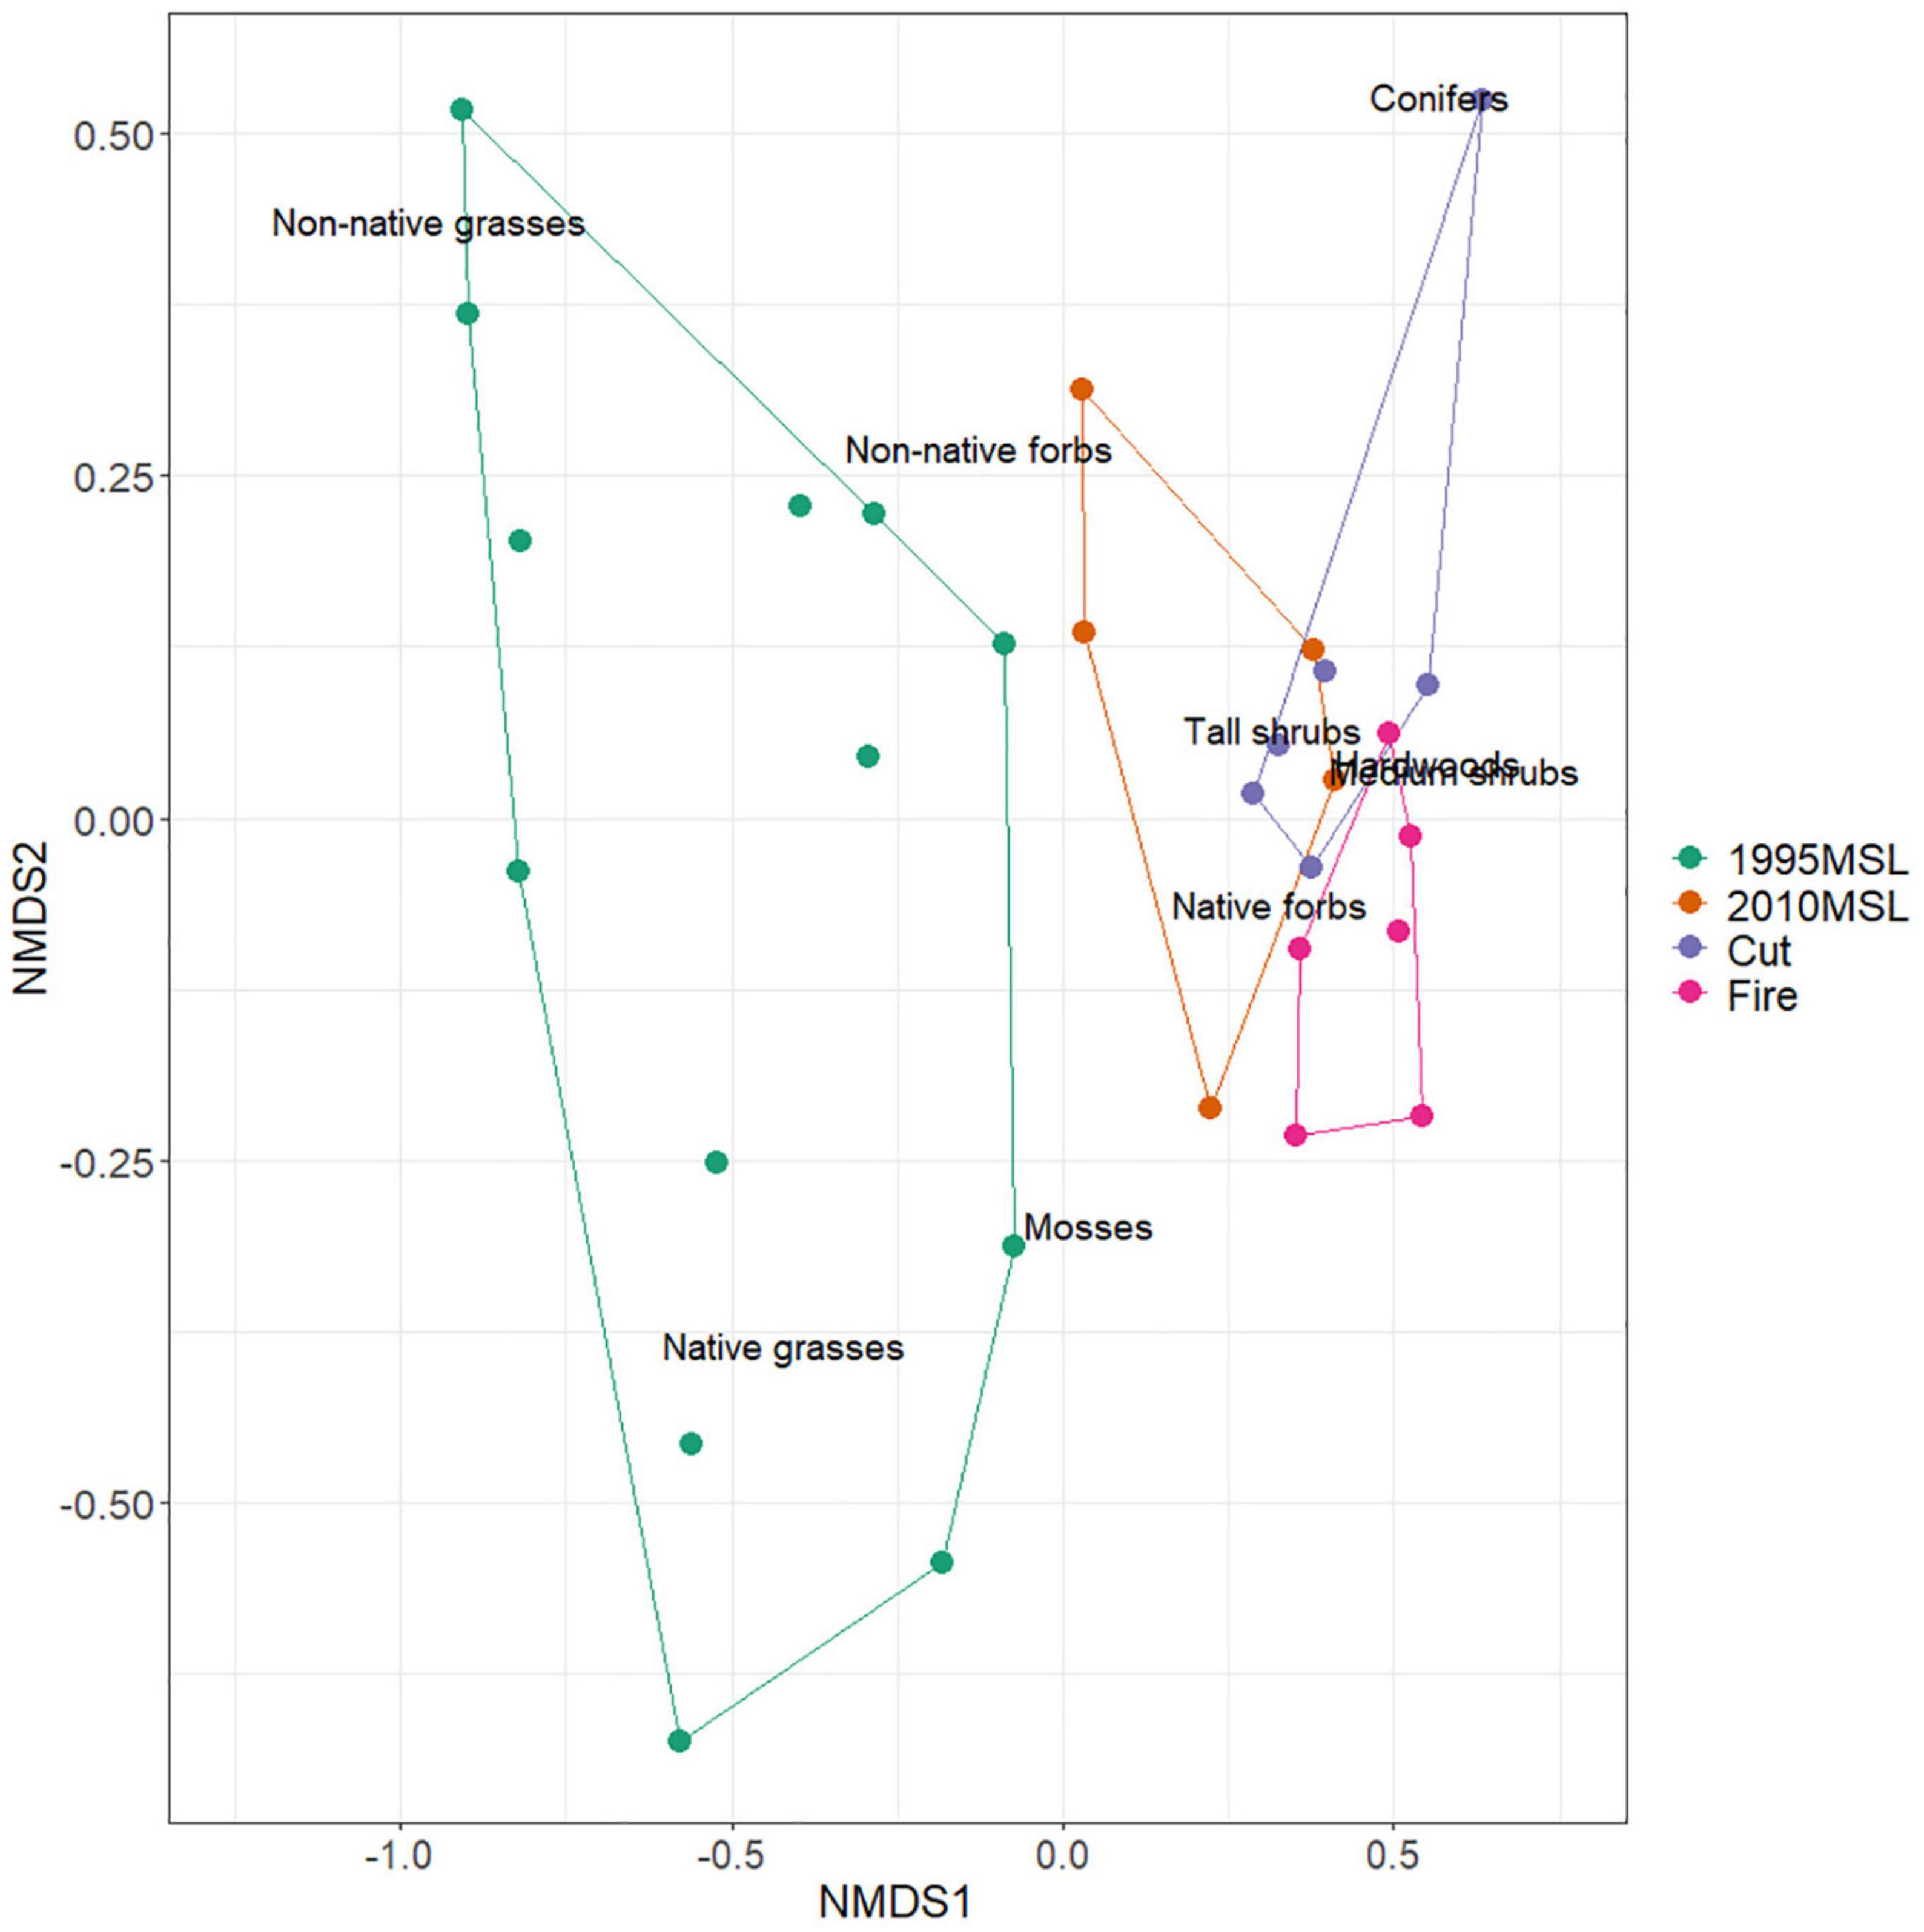
Figure 5. Non-metric multidimensional scaling (NMDS) analysis of vegetation cover for the corresponding test sites. Ellipses constructed around each site indicate 95% confidence intervals.
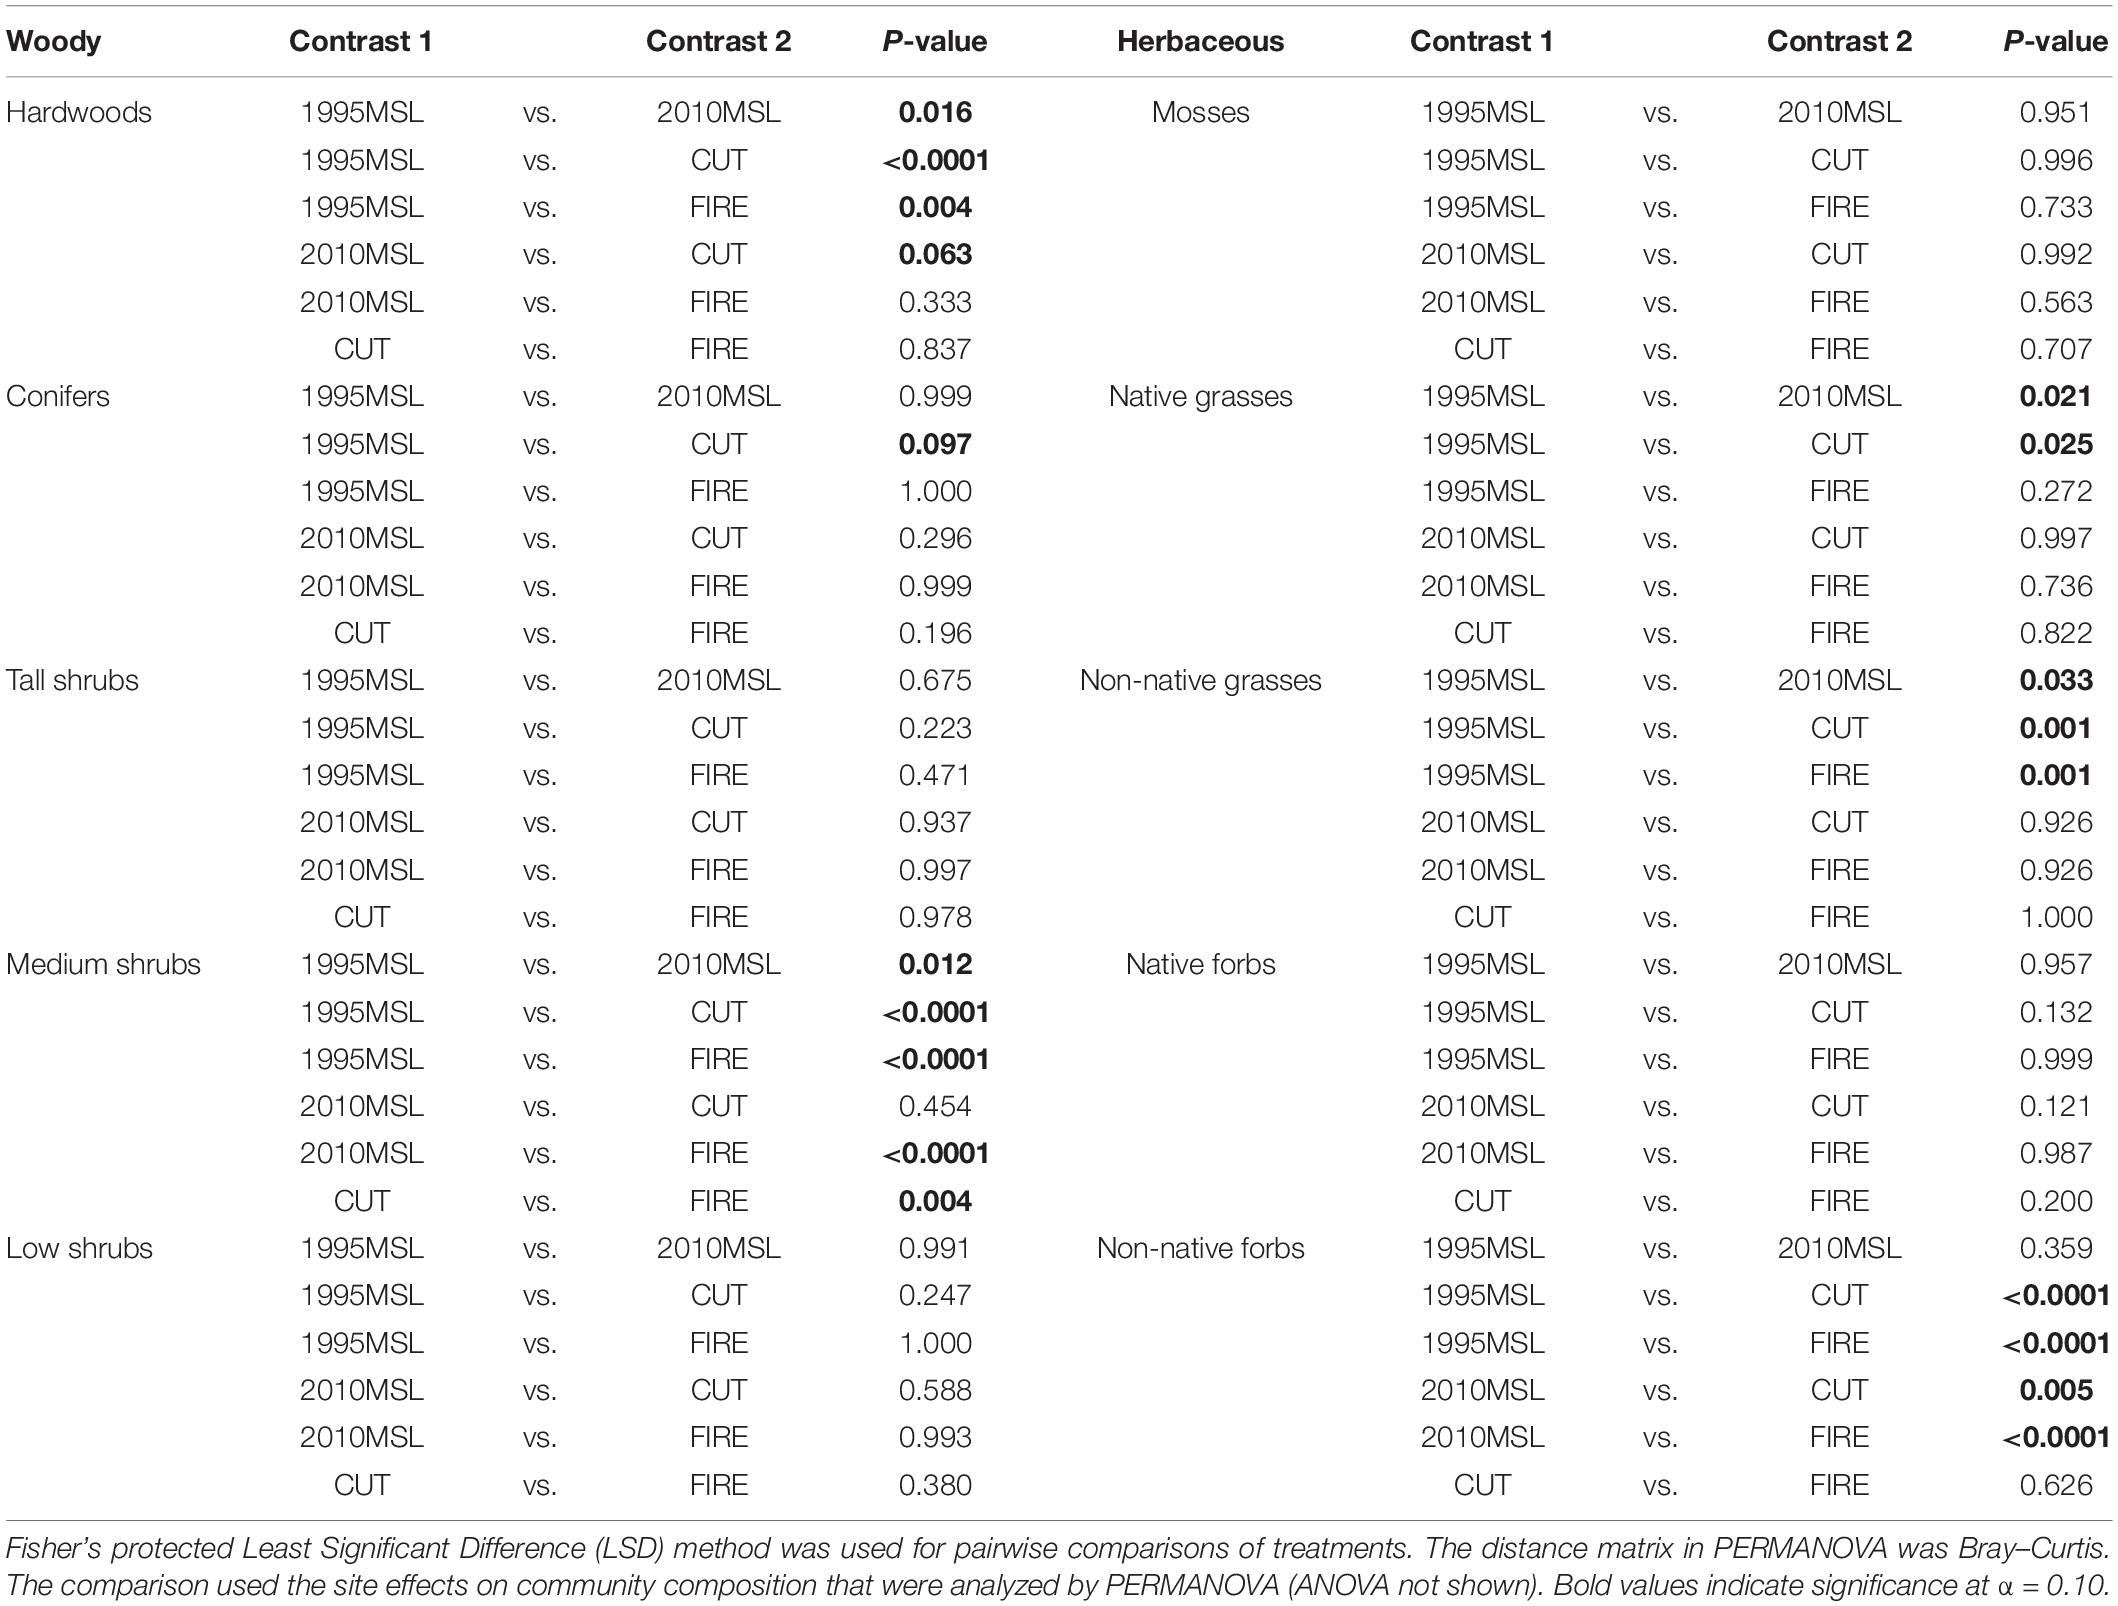
Table 5. Pairwise comparison of similarity in community composition (percent cover) by species groups (hardwoods, conifers, shrubs, mosses, grasses, forbs) and site type (1995MSL, 2010MSL, CUT, FIRE).
Discussion
In the present study, ecological recovery on reclaimed sites (1995 and 2010MSLs) is assumed to follow the typical early recovery process in the natural boreal forests if the range of ecological indicators measured in the reclaimed site mirror that in the reference areas (Lupardus et al., 2019). Five years after disturbance, the range of most soil values measured in FIRE and CUT reference sites remained within the range of natural variability of the region (Schmidt et al., 1996; Howat, 2000; Sorenson et al., 2011). Soil pH, bulk density, EC, and total carbon stock differed significantly between the reclaimed and reference sites. The deviations from the reference sites were consistent with patterns found in other studies where this change was related to the long-term effects of soil stripping, stockpiling and redistribution which is a common feature of these types of industrial disturbance (Lupardus et al., 2019). Soil pH and bulk density can be reasonable predictors of vegetation community structure due to their ability to affect soil nutrient availability (Janz et al., 2019). High pH levels outside the natural range of variability are not uncommon on former industrial sites in northern Alberta. This is a product of two things: elevated calcium sulfate in lower soil horizons which is naturally occurring throughout the region and the fact that stripping of topsoil during initial site development invariably results in these deeper (higher pH) soils being brought closer to the surface, especially when stripped soils are stockpiled and then redistributed. When the soils are replaced during reclamation, the topsoil will be a mixture of LFH, A and some B horizon, depending on the experience and expertise of the operators. Effectively this mixing of surface and subsurface soil substrates may have contributed to the higher pH at most reclamation sites when compared to the reference areas. This finding is consistent with the results of Jamro et al. (2014), who reported pH increases of 180% when LFH was mixed with mineral substrates. In our study, five (41%) of the 1995MSLs sites had pH values > 8.5, which is outside the acceptable range for most vascular plants in the region which is cited at a pH range from 3.5 to 8.0 (Larcher, 1980). These included both young (5–7 years) and more mature (16–18 years) sites. Our high pH sites also had unusually low storage of carbon and nitrogen stored in soils and were comprised of grasses with non-native forbs. This lingering industrial reclamation effect on pH recovery is important to acknowledge as it may cause other processes such as nutrient cycling to recover at a slower rate or become permanently inhibited (Zhalnina et al., 2015; Neina, 2019). It may be possible to alter the pH conditions on these sites by introducing native species that may have a higher tolerance for elevated pH and through time, the impact of these species may lower pH through leaf litter inputs and other belowground processes effectively creating a positive feedback loop (e.g., organic matter accumulation, nutrient cycling, microbial symbiont activity).
The requirements of the 2010 criteria appeared to result in decreased bulk density (and decreased compaction) compared to sites certified under the 1995 criteria, even though sites certified under the 2010 criteria have had a relatively shorter time to recover since reclamation.
The apparent improvement in bulk densities on 2010MSL soils may be due to the specified requirements around topsoil placement, soil physical characteristics, as well as the criteria specifying rooting restrictions (Environment and Sustainable Resource Development [ESRD]., 2013). These criteria likely facilitated changes in soil handling and replacement practices. For example, it is possible that sites were more consistently decompacted (particularly the lower soil horizons that received repeated industrial traffic) to better ensure the rooting restriction criteria were met. Even if the differences in bulk density in 20–30 cm of soil layer are small, they may be important because tree growth can be affected by even small differences in soil bulk density. For instance, in a study of the impacts of forest harvesting operations on soil characteristics, Binkley and Fisher (2019) found that tree growth started to decline when bulk density reached approximately 1.4 g cm–3. Since the 2010 MSLs averaged 1.34 g cm–3 and the 1995MSLs averaged 1.49 g cm–3 at the 20–30 cm soil depth, it is reasonable to suggest that the 2010 criteria are enabling increased growth of desirable species simply due to decreased soil compaction, at least on some sites. Other studies are consistent in identifying 1.4 g cm–3 as an important bulk density threshold above which reduced growth can be expected on fine-textured soils, similar to those found on most of our study sites (Mitchell et al., 1982; Da Silva et al., 1994; Senyk, 2001).
Greater quantities of LFH can be a good indicator of ecosystem recovery as the thickness is positively correlated with soil water and nutrient status (Beckingham and Archibald, 1996; Rowland et al., 2009). The LFH thickness in 2010MSLs was similar to those observed in 1995MSLs. They showed average thicknesses of 2.9 cm in 2010MSLs and 3.4 cm in 1995MSLs, which were comparable to those observed (2.0–3.6 cm) in reclaimed sites, ranging in age from 16 to 33 years (Sorenson et al., 2011). The fact that the 2010MSLs had a similar thickness to the 1995MSLs suggests their forest floor is developing faster where this change could come from the adjustments in the 2010 criteria requiring thicker top and subsoil cover and establishment of the woody canopy. Forest floor development is modulated by two opposing processing: litter inputs from vegetation and decomposition outputs. When woody cover surpasses a threshold value of 30%, significant increases in litter inputs emerged, which can have direct positive impacts on early forest floor development (Sorenson et al., 2011). In comparison, the average LFH thickness in the reclaimed sites had not yet reached a thickness similar to those found in FIRE (7.3 cm) and CUT (8.5) sites. For each centimeter of LFH present on the reclaimed sites, the CUT and FIRE sites had 2.5 times as much LFH by approximately the same age since disturbance. Mineral soil depth in the 2010MSLs was comparable to the reference sites and was substantially higher than 1995MSLs; this difference again may be attributable to the inclusion of key soil criteria as well as potential changes in soil handling practices where both the subsoil and topsoil were required to be conserved (stockpiled) (Environment and Sustainable Resource Development [ESRD]., 2013).
Most of the 2010MSLs sites demonstrated similar woody plant density and diversity to reference areas, with corresponding declines in the 1995MSLs sites. These parameters are considered important components of plant community structure and are good indicators for assessing the direction of plant succession (Salinas and Guirado, 2002; Prach et al., 2019; Rydgren et al., 2020). The total woody plant density of the 1995MSLs averaged 6,250 stems ha-1 after 12–20 years, while the 2010MSLs sites averaged 50,000 stems ha-1 after 7–10 years. Most of the species found on the 2010MSLs sites were early-to-mid successional hardwood trees, with a mix of shrubs were (medium and tall), and some coniferous trees, whereas those on the 1995MSLs were primarily tall shrubs (>65%). This mixture of woody species on the 2010MSLs sites follows the typical early successional pattern or recovery process of the Central Mixedwood, Dry Mixedwood and Lower Boreal Highlands Natural Sub-Regions (Rowe, 1972; Beckingham and Archibald, 1996). Total herbaceous cover on the 1995MSLs sites was high (75%), with almost 40% coming from both non-native forbs and grasses. The presence of high amounts of non-native herbaceous cover on the 1995MLs and related sites assessed by Forsch et al. (2021) is not necessarily a positive indicator of ecosystem function. These non-native species may be an indicator of ecological impairment in some systems, as these species negatively impact vegetation diversity and ecosystem processes (K. Kemball, personal communication, May 3, 2020.) thereby leaving the site in a state of arrested development (Kurek et al., 2013; Chowdhury et al., 2017; Dhar et al., 2020).
Vegetation richness, diversity, and evenness have been recognized as strong indicators of ecological recovery from disturbance, as well as ecosystem resilience (Ruiz-Jaen and Aide, 2005). It was encouraging that plant community evenness resulted from both the 1995 and 2010 criteria were similar to the FIRE and CUT plant communities. However, despite these similarities, plant richness and diversity appeared to be depressed on the 1995MSLs compared with the CUT and FIRE sites. As for the 2010MSLs, plant richness and diversity were lower compared with the CUT sites but not always statistically distinct from the FIRE sites. A stronger presence of woody plants and tree species on the 2010MSLs may be facilitating the improvement of species richness and diversity observed from the 1995 to 2010MSL site types; Pensa et al. (2008) similarly suggested the recovery of plant richness and diversity was associated with the ingress of woody plants replacing early successional herbaceous species on abandoned mine land sites after 10–30 years in succession.
From the viewpoint of vegetation classes, we found evidence to suggest that most of our certified, 2010MSL sites appear to be in transition and were moving toward a more similar compositional mixture of vegetation classes as that observed in both reference site types. As for the 1995MSLs, there is so far little evidence that suggests these sites are becoming more similar in community structure to that of the reference sites. Both the NMDS ordination and PERMANOVA test provided some support for this assertion. The NMDS showed a clear separation between the site types; the CUT and FIRE areas, while also distinct from each other, were clustered, with the 2010MSLs sites sitting adjacent to both reference site types and a certain degree overlapping with the CUT site type in particular. The 1995MSLs were more distant from all other site types and shared no common features with the reference site types. The NMDS also revealed that agronomic species form a higher proportion of plant cover on most of the 1995MSLs; this has also been reported on other certified reclaimed sites in the region where the grasses and forbs sowed initially were still evident after 5 (Forsch et al., 2021), 34 (Rowland et al., 2009), and 48 (Lupardus et al., 2019) years post-certification. Due to the striking coverage of agronomic species, most of these sites are suspected to be in a state of arrested succession, thereby leaving long-term legacy effects on the landscape (Kurek et al., 2013; Chowdhury et al., 2017; Dhar et al., 2020).
Our approach of comparing a range of ecological indicators on former industrial sites that have been reclaimed within the last 20 years with those in areas recovering from harvest and fire disturbances appears to have been a useful exercise. This enabled us to evaluate whether either reclamation criteria (pre-1995 vs. 2010) were creating forest ecosystems that could be considered similar to those that develop after other types of stand-replacing disturbances. We do appreciate that a true like-with-like comparison with sites of the same age would have been ideal to evaluate this question. However, since the reclamation criteria changed over time and we restricted our study sites to similar edatopic grid positions (at least pre-treatment), it was not possible to find reclaimed, burned, and harvested sites of the same age in the same geographic area that were accessible. At the time of measurement, the s1995MSL sites averaged 16 years since reclamation (range: 12–20 years), whereas the 2010MSL sites averaged 8.8 years (range: 7–10 years) since reclamation. It was also interesting to see that the 2010MSLs were characterized by many of the same native species as the FIRE and CUT sites; there would be value in revisiting the sites in the current investigation in future to determine whether they continue progressing toward the reference sites as they progress in age.
Conclusion and Suggestions for Future Work
To strengthen the present analysis, we recommend that additional 2010MSLs be evaluated because of the small and variable sample size; it has also now been more than 10 years since these criteria were established and there are likely many more sites that have been reclaimed-certified to these criteria compared with our investigation which was conducted between 2015 and 2016. These efforts should also broaden the geographic area and include a wider progression of site ages, which was not possible to do in the present investigation. Similar efforts should continue to use CUT and FIRE sites of similar seral stages or ages, as they were found to be very useful analogs for comparison, and they will be important in target setting. In the long term, additional inventories from nearby intact, mature forests would also help to improve our ability to detect whether reclamation success has been achieved.
Lastly, while this case study illustrated the potential benefits of relatively straightforward changes to reclamation criteria in terms of including indicators around soil quality and conservation, woody stem requirements and native plant coverage, there is ultimately always room for improvement. For jurisdictions where the objective of the criteria is to restore a forest ecosystem, including criteria specific to tree stems (rather than woody stems in general) and additional considerations regarding tree growth and site occupation of trees (such as stocking) would likely be of value in ensuring the speedy return to a forest canopy state. Adding criteria with measures of native plant species diversity, perhaps with targets grounded in known or expected diversity incomparable aged reference sites may also be of utility as it is well understood that having plant diversity is also a beneficial metric in creating a more resilient vegetation community.
Data Availability Statement
The original contributions presented in this study are included in the article/Supplementary Material, further inquiries can be directed to the corresponding author.
Author Contributions
AS and MD conceived and planned the experiment. AS, SS, EF, and MD carried out the experiment and supervised the findings of this work. MB-A wrote the manuscript with support from AS, SS, EF, and MD. All authors contributed to the article and approved the submitted version.
Funding
Funding for this work was provided by grants from the Government of Alberta and the Natural Sciences and Engineering Research Council of Canada (NSERC).
Conflict of Interest
SS was employed by EnviroStats Solutions Inc.
The remaining authors declare that the research was conducted in the absence of any commercial or financial relationships that could be construed as a potential conflict of interest.
Publisher’s Note
All claims expressed in this article are solely those of the authors and do not necessarily represent those of their affiliated organizations, or those of the publisher, the editors and the reviewers. Any product that may be evaluated in this article, or claim that may be made by its manufacturer, is not guaranteed or endorsed by the publisher.
Acknowledgments
We thank Susan McGillivray with Alberta Environment and Parks for her assistance with locating candidate sites for this study, Adam Mathison and Trevor Floreani as well as numerous student research assistants for participating in field data collection, and Kera Yucel and Jasmeen Kaur for their contributions during interim reporting on the results of this work. We also thank the forestry companies who allowed us access to their management areas and the two reviewers for their constructive comments that greatly improved the manuscript.
Supplementary Material
The Supplementary Material for this article can be found online at: https://www.frontiersin.org/articles/10.3389/ffgc.2022.849246/full#supplementary-material
Footnotes
References
Alberta Environment and Protection [AEP]. (1995). 1995 Reclamation Criteria for Well Sites and Associated Facilities. Edmonton. Alberta Environmental Protection. Land Reclamation Division. Edmonton, AB: University of Alberta.
Arbogast, B. (2002). An Overview of Reclamation Law Dealing With Mineral Resource Development in the USA. Industrial Minerals and Extractive Industry Geology. London: The Geological Society of London, 283–293.
Baker, S., and Eckerberg, K. (2016). Ecological restoration success: a policy analysis understanding. Restor. Ecol. 24, 284–290. doi: 10.1111/rec.12339
Beckingham, J. D., and Archibald, J. H. (1996). Field Guide to Ecosites of Northern Alberta. Edmonton: Canadian Forest Serv.
Bergeron, Y., Gauthier, S., Kafka, V., Lefort, P., and Lesieur, D. (2001). Natural fire frequency for the eastern Canadian boreal forest: consequences for sustainable forestry. Can. J. For. Res. 31, 384–391. doi: 10.1139/x00-178
Binkley, D., and Fisher, R. F. (2019). Ecology and Management of Forest Soils. Hoboken, NJ: John Wiley & Sons. doi: 10.1002/9781119455745
Carleton, T. J., and Maclellan, P. (1994). Woody vegetation responses to fire versus clear-cutting logging: a comparative survey in the central Canadian boreal forest. Ecoscience 1, 141–152. doi: 10.1080/11956860.1994.11682238
Chambers, J. C., Brown, R. W., and Williams, B. D. (1994). An evaluation of reclamation success on Idaho’s phosphate mines. Restor. Ecol. 2, 4–16. doi: 10.1111/j.1526-100X.1994.tb00037.x
Chowdhury, S., Chao, D. K., Shipman, T. C., and Wulder, M. A. (2017). Utilization of Landsat data to quantify land-use and land-cover changes related to oil and gas activities in West-Central Alberta from 2005 to 2013. GIsci. Remote Sens. 54, 700–720. doi: 10.1080/15481603.2017.1317453
Da Silva, A., Kay, B., and Perfect, E. (1994). Characterization of the least limiting water range of soils. Soil Sci. Soc. Am. J. 58, 1775–1781. doi: 10.2136/sssaj1994.03615995005800060028x
Dhar, A., Comeau, P. G., Karst, J., Pinno, B. D., Chang, S. X., Naeth, A. M., et al. (2018). Plant community development following reclamation of oil sands mine sites in the boreal forest: a review. Env. Rev. 26, 286–298. doi: 10.1139/er-2017-0091
Dhar, A., Comeau, P. G., Naeth, M. A., Pinno, B. D., and Vassov, R. (2020). Plant community development following reclamation of oil sands mines using four cover soil types in northern Alberta. Restor. Ecol. 28, 82–92. doi: 10.1111/rec.13039
Environment and Sustainable Resource Development [ESRD]. (2013). 2010 Reclamation Criteria for Wellsites and Associated Facilities for Forested Lands. Edmonton: University of Alberta.
Forsch, K. B. C., Dhar, A., and Naeth, M. A. (2021). Effects of woody debris and cover soil types on soil properties and vegetation 4–5 years after oil sands reclamation. Restor. Ecol. 29, 1–9. doi: 10.1111/rec.13420
Frerichs, L. A., Bork, E. W., Osko, T. J., and Naeth, M. A. (2017). Effects of boreal well site reclamation practices on long-term planted spruce and deciduous tree regeneration. Forests 8:201. doi: 10.3390/f8060201
Gerwing, T. G., Hawkes, V. C., Gann, G. D., and Murphy, S. D. (2021). Restoration, reclamation, and rehabilitation: on the need for, and positing a definition of, ecological reclamation. Restor. Ecol. e13461. doi: 10.1111/rec.13461
Government of Alberta [GoA]. (1999). Conservation and Reclamation Information Letter Guidelines for Reclamation to forest vegetation in the Athabasca Oil Sands Region. C and R/IL/99–1. Edmonton, AB: Gov. of Alberta.
Government of Alberta [GoA]. (2020). Oil and Gas Liabilities Management. Edmonton, AB: Gov. of Alberta.
Howat, D. (2000). Acceptable Salinity, Sodicity and pH Values for Boreal forest Reclamation. Edmonton, AB: Environmental Sciences Division, 191.
Jamro, G. M., Chang, S. X., and Naeth, M. A. (2014). Organic capping type affected nitrogen availability and associated enzyme activities in reconstructed oil sands soils in Alberta, Canada. Ecol. Eng. 73, 92–101. doi: 10.1016/j.ecoleng.2014.09.005
Janz, A., Whitson, I. R., and Lupardus, R. (2019). Soil quality and land capability of reclaimed oil and gas well pads in southern Alberta: long-term legacy effects. Can. J. Soil Sci. 99, 262–276. doi: 10.1139/cjss-2019-0020
Kalra, Y. P., and Maynard, D. G. (1991). Methods Manual for Forest Soil and Plant Analysis, Vol. 319. Edmonton, AB: Forestry Canada.
Kurek, J., Kirk, J. L., Muir, D. C., Wang, X., Evans, M. S., and Smol, J. P. (2013). Legacy of a half-century of Athabasca oil sands development recorded by lake ecosystems. Proc. Natl. Acad. Sci. U.S.A. 110, 1761–1766. doi: 10.1073/pnas.1217675110
Lafleur, B., Cazal, A., Leduc, A., and Bergeron, Y. (2015). Soil organic layer thickness influences the establishment and growth of trembling aspen (Populus tremuloides) in boreal forests. For. Ecol. Manag. 347, 209–216. doi: 10.1016/j.foreco.2015.03.031
Lupardus, R. C., McIntosh, A. C., Janz, A., and Farr, D. (2019). Succession after reclamation: identifying and assessing ecological indicators of forest recovery on reclaimed oil and natural gas well pads. Ecol. Ind. 106:105515. doi: 10.1016/j.ecolind.2019.105515
Mitchell, M., Hassan, A. E., Davey, C., and Gregory, J. (1982). Loblolly pine growth in compacted greenhouse soils. Trans. ASAE 25, 304–0307. doi: 10.13031/2013.33525
Natural Regions Committee [NRC]. (2006). Natural Regions and Subregions of Alberta. Compiled by D.J. Downing and W.W. Pettapiece. Government of Alberta. Pub. No. T/852. Edmonton, AB: Gov. of Alberta.
Neina, D. (2019). The role of soil pH in plant nutrition and soil remediation. Appl. Environ. Soil Sci. 2019:5794869. doi: 10.1155/2019/5794869
Oksanen, J., Kindt, R., Legendre, P., O’Hara, B., Simpson, G., Solymos, P., et al. (2008). The Vegan Package Version 1.15-0. Available online at: http://cran.r-project.org (April 27, 2009).
Pensa, M., Karu, H., Luud, A., Rull, E., and Vaht, R. (2008). The effect of planted tree species on the development of herbaceous vegetation in a reclaimed opencast. Can. J. For. Res. 38, 2674–2686. doi: 10.1139/X08-098
Pinheiro, J. (2017). nlme: Linear and Nonlinear Mixed Effects Models. R Package Version 3.1-98. nlme.
Powter, C., Chymko, N., Dinwoodie, G., Howat, D., Janz, A., Puhlmann, R., et al. (2012). Regulatory history of Alberta’s industrial land conservation and reclamation program. Can. J. Soil Sci. 92, 39–51. doi: 10.4141/cjss2010-033
Prach, K., Durigan, G., Fennessy, S., Overbeck, G. E., Torezan, J. M., and Murphy, S. D. (2019). A primer on choosing goals and indicators to evaluate ecological restoration success. Restor. Ecol. 27, 917–923. doi: 10.1111/rec.13011
R Core Team. (2020). R: A Language and Environment for Statistical Computing. Vienna: R Foundation for Statistical Computing.
Rayner, J., Howlett, M., and Wellstead, A. (2017). Policy mixes and their alignment over time: patching and stretching in the oil sands reclamation regime in Alberta. Canada. Environ. Policy Gov. 27, 472–483. doi: 10.1002/eet.1773
Redente, E. F., Sowards, W. E., Steward, D. G., and Ruiter, T.F., editors (1983). Symposium on Western Coal Mining Regulatory Issues. Land Use, Revegetation, and Management. Science Series No. 35. Fort Collins, CO: Colorado State University.
Rigby, R. A., and Stasinopoulos, D. M. (2005). Generalized additive models for location, scale and shape. J. R. Stat. Soc. Series C 54, 507–554. doi: 10.1111/j.1467-9876.2005.00510.x
Ripley, B., Venables, B., Bates, D. M., Hornik, K., Gebhardt, A., Firth, D., et al. (2013). Package ‘mass’. Cran r 538, 113–120.
Rowe, J. S. (1972). Forest regions of Canada. Publ. 1300. Ottawa, ON: Government of Canada, Department of Environment, Canadian Forestry Service.
Rowland, S., Prescott, C., Grayston, S., Quideau, S., and Bradfield, G. (2009). Recreating a functioning forest soil in reclaimed oil sands in northern Alberta: an approach for measuring success in ecological restoration. J. Environ. Qual. 38, 1580–1590. doi: 10.2134/jeq2008.0317
Ruiz-Jaen, M. C., and Aide, T. M. (2005). Restoration success: How is it being measured? Restor. Ecol. 13, 569–577. doi: 10.1111/j.1526-100X.2005.00072.x
Rydgren, K., Auestad, I., Halvorsen, R., Hamre, L. N., Jongejans, E., Töpper, J. P., et al. (2020). Assessing restoration success by predicting time to recovery—But by which metric? J. Appl. Ecol. 57, 390–401. doi: 10.1111/1365-2664.13526
Salinas, M. J., and Guirado, J. (2002). Riparian plant restoration in summer-dry riverbeds of southeastern Spain. Res. Ecol. 10, 695–702. doi: 10.1046/j.1526-100X.2002.01050.x
Sasaki, T., Ishii, H., and Morimoto, Y. (2018). Evaluating restoration success of a 40-year-old urban forest in reference to mature natural forest. Urban For. Urban Green 32, 123–132. doi: 10.1016/j.ufug.2018.04.008
Schmidt, M. G., Macdonald, S. E., and Rothwell, R. L. (1996). Impacts of harvesting and mechanical site preparation on soil chemical properties of mixed-wood boreal forest sites in Alberta. Can. J. Soil Sci. 76, 531–540. doi: 10.4141/cjss96-066
Senyk, J. P. (2001). Tree Growth on Displaced and Compacted Soils: Natural Resources Canada, Canadian Forest Service. Victoria, BC: Pacific Forestry Centre.
Skousen, J., Ziemkiewicz, P., and Yang, J. E. (2012). Use of coal combustion by-products in mine reclamation: review of case studies in the USA. Geosystem Eng. 15, 71–83. doi: 10.1080/12269328.2012.676258
Sorenson, P. T., Quideau, S. A., MacKenzie, M. D., Landhäusser, S. M., and Oh, S. W. (2011). Forest floor development and biochemical properties in reconstructed boreal forest soils. Appl. Soil Ecol. 49, 139–147. doi: 10.1016/j.apsoil.2011.06.006
Vanhala, P., Tamminen, P., and Fritze, H. (2005). Relationship between basal soil respiration rate, tree stand and soil characteristics in boreal forests. Environ. Monit. Assess. 101, 85–92. doi: 10.1007/s10661-005-9134-0
Wortley, L., Hero, J., and Howes, M. (2013). Evaluating ecological restoration success: a review of the literature. Restor. Ecol. 21, 537–543. doi: 10.1111/rec.12028
Keywords: ecosystem recovery, reclamation, species diversity, species richness, vegetation structure
Citation: Baah-Acheamfour M, Dewey M, Fraser EC, Schreiber SG and Schoonmaker A (2022) Assessing Ecological Recovery of Reclaimed Well Sites: A Case Study From Alberta, Canada. Front. For. Glob. Change 5:849246. doi: 10.3389/ffgc.2022.849246
Received: 05 January 2022; Accepted: 24 May 2022;
Published: 16 June 2022.
Edited by:
Raymond Thomas, Memorial University of Newfoundland, CanadaReviewed by:
Robert Slesak, Pacific Northwest Research Station, USDA Forest Service, United StatesAnnabel Arnott, Memorial University of Newfoundland, Canada
Copyright © 2022 Baah-Acheamfour, Dewey, Fraser, Schreiber and Schoonmaker. This is an open-access article distributed under the terms of the Creative Commons Attribution License (CC BY). The use, distribution or reproduction in other forums is permitted, provided the original author(s) and the copyright owner(s) are credited and that the original publication in this journal is cited, in accordance with accepted academic practice. No use, distribution or reproduction is permitted which does not comply with these terms.
*Correspondence: Amanda Schoonmaker, YXNjaG9vbm1ha2VyQG5haXQuY2E=
†ORCID: Stefan G. Schreiber, orcid.org/0000-0001-5033-8884
 Mark Baah-Acheamfour
 Mark Dewey2
 Erin C. Fraser