 Danielle S. Tan1*
 Ritwik Maiti1
 Yi Wei Tan1†Brendan Zhi Jie Wong1†Yuqiang Liew1†Jia Hao Tan1†Daryl Tsen-Tieng Lee2Daniel C. Burcham3
- 1Department of Mechanical Engineering, National University of Singapore, Singapore, Singapore
- 2National Parks Board, Singapore, Singapore
- 3Department of Horticulture and Landscape Architecture, Colorado State University, Fort Collins, CO, United States
We tested both real and model branches of four local tree species in a wind tunnel, for wind speeds up to 20 m/s. The model branches were same-size replicas of the real branches obtained via photogrammetry and 3D-printed or CNC-machined. Real leaves were attached to the models in approximately similar configuration. After comparing the streamwise force, drag coefficient (based on initial frontal area) and streamwise deflection, we found that the models exhibited similar trends to that of the real branches. Although not identical in value, the measurements for the model branches were similar in magnitude to the real branches. In particular, the drag coefficients appeared to approach very similar plateaus. We believe the differences in streamwise force and deflection to be due to the plastic used for the models, as well as perhaps how the leaves were attached to the models. We thus consider these physical models to be generally feasible for studying tree branches.
Introduction
Singapore is a country with one of the highest Green View Index (GVI) (Seiferling et al., 2017), with large numbers of trees planted in the dense urban landscape. The health of these trees is monitored regularly by arborists but there are still risks, especially during thunderstorms where higher wind speeds can induce significantly increased drag forces on the tree canopies. As such, it is of interest to study the wind loads on trees, in particular on tree canopies where the drag forces have the highest effects due to the elevation of the projected frontal areas above the ground level.
Such research is not new; for instance, Angelou et al. (2019) studied a single oak tree in Denmark, while Morinaga et al. (2012) investigated the effects of a tree upstream of another in Sri Lanka. Understandably, it is difficult to have exact and reproducible conditions in nature, so laboratory studies such as Bai et al. (2013, 2015) and Hao et al. (2020) where model trees (or tree-like objects) were involved have also been conducted, as well as numerical simulations such as the work of Endalew et al. (2008a,b), Hu et al. (2008), and Dellwik et al. (2019). These all vary from studies of individual trees to canopies, and many accommodations have to be made to ensure similarity in geometry of the models. Even in simulations, simplifications have to be included to represent the effect of leaves and/or canopy, e.g., in Rubol et al. (2018) where the canopy is considered to be a “porous medium,” and in Dellwik et al. (2019) where a tree is a “momentum sink” in the usual fluid dynamics equations.
In this article, we focus on four local species: sea apple (Syzygium grande), yellow flame (Peltophorum pterocarpum), rain tree (Samanea saman) and tembusu (Cyrtophyllum fragrans). Specifically we compare the force and deflection measurements of both real branches of these species and fabricated models, taken over a range of wind speeds in a wind tunnel, to determine the feasibility of using physical models for future wind-tree interaction studies specific to Singapore. Note that unlike in most other studies, we used tree branches rather than full-sized trees in order to avoid scaling issues incurred by fabricating scaled-down models to fit inside the wind tunnel.
Materials and Methods
Tree Branches
As mentioned, four tree species were studied in this project. A real branch of each species, with height between 0.6 and 0.8 m was scanned and a point cloud created using photogrammetry. This point cloud was then converted (the details of which are in Lim et al. (2020)) into a format suitable for fabrication of a model via 3D-printing or CNC machining.
The material chosen for fabrication was Acrylonitrile Butadiene Styrene (ABS), as this plastic has a Young’s modulus (2.2 GPa) similar to some tree species and has a smooth finish which would not add unnecessary drag force during testing. ABS also has a density of 1,040 kg/m3, tensile yield strength of 31 MPa, flexural strength of 35 MPa, and Rockwell hardness of 109.5, values which may be useful to readers conducting similar studies. The choice between 3D-printing or CNC machining was made based only on ease of manufacturing for each model individually.
For the fabricated models, real leaves were attached to the models using tape, in a similar configuration to that of the real branch. Although a similar number and size of leaves were attached, the resulting frontal area was not fully identical as attaching the leaves securely usually caused some differences in orientation. Figure 1 shows photographs of the real and fabricated tree branches.
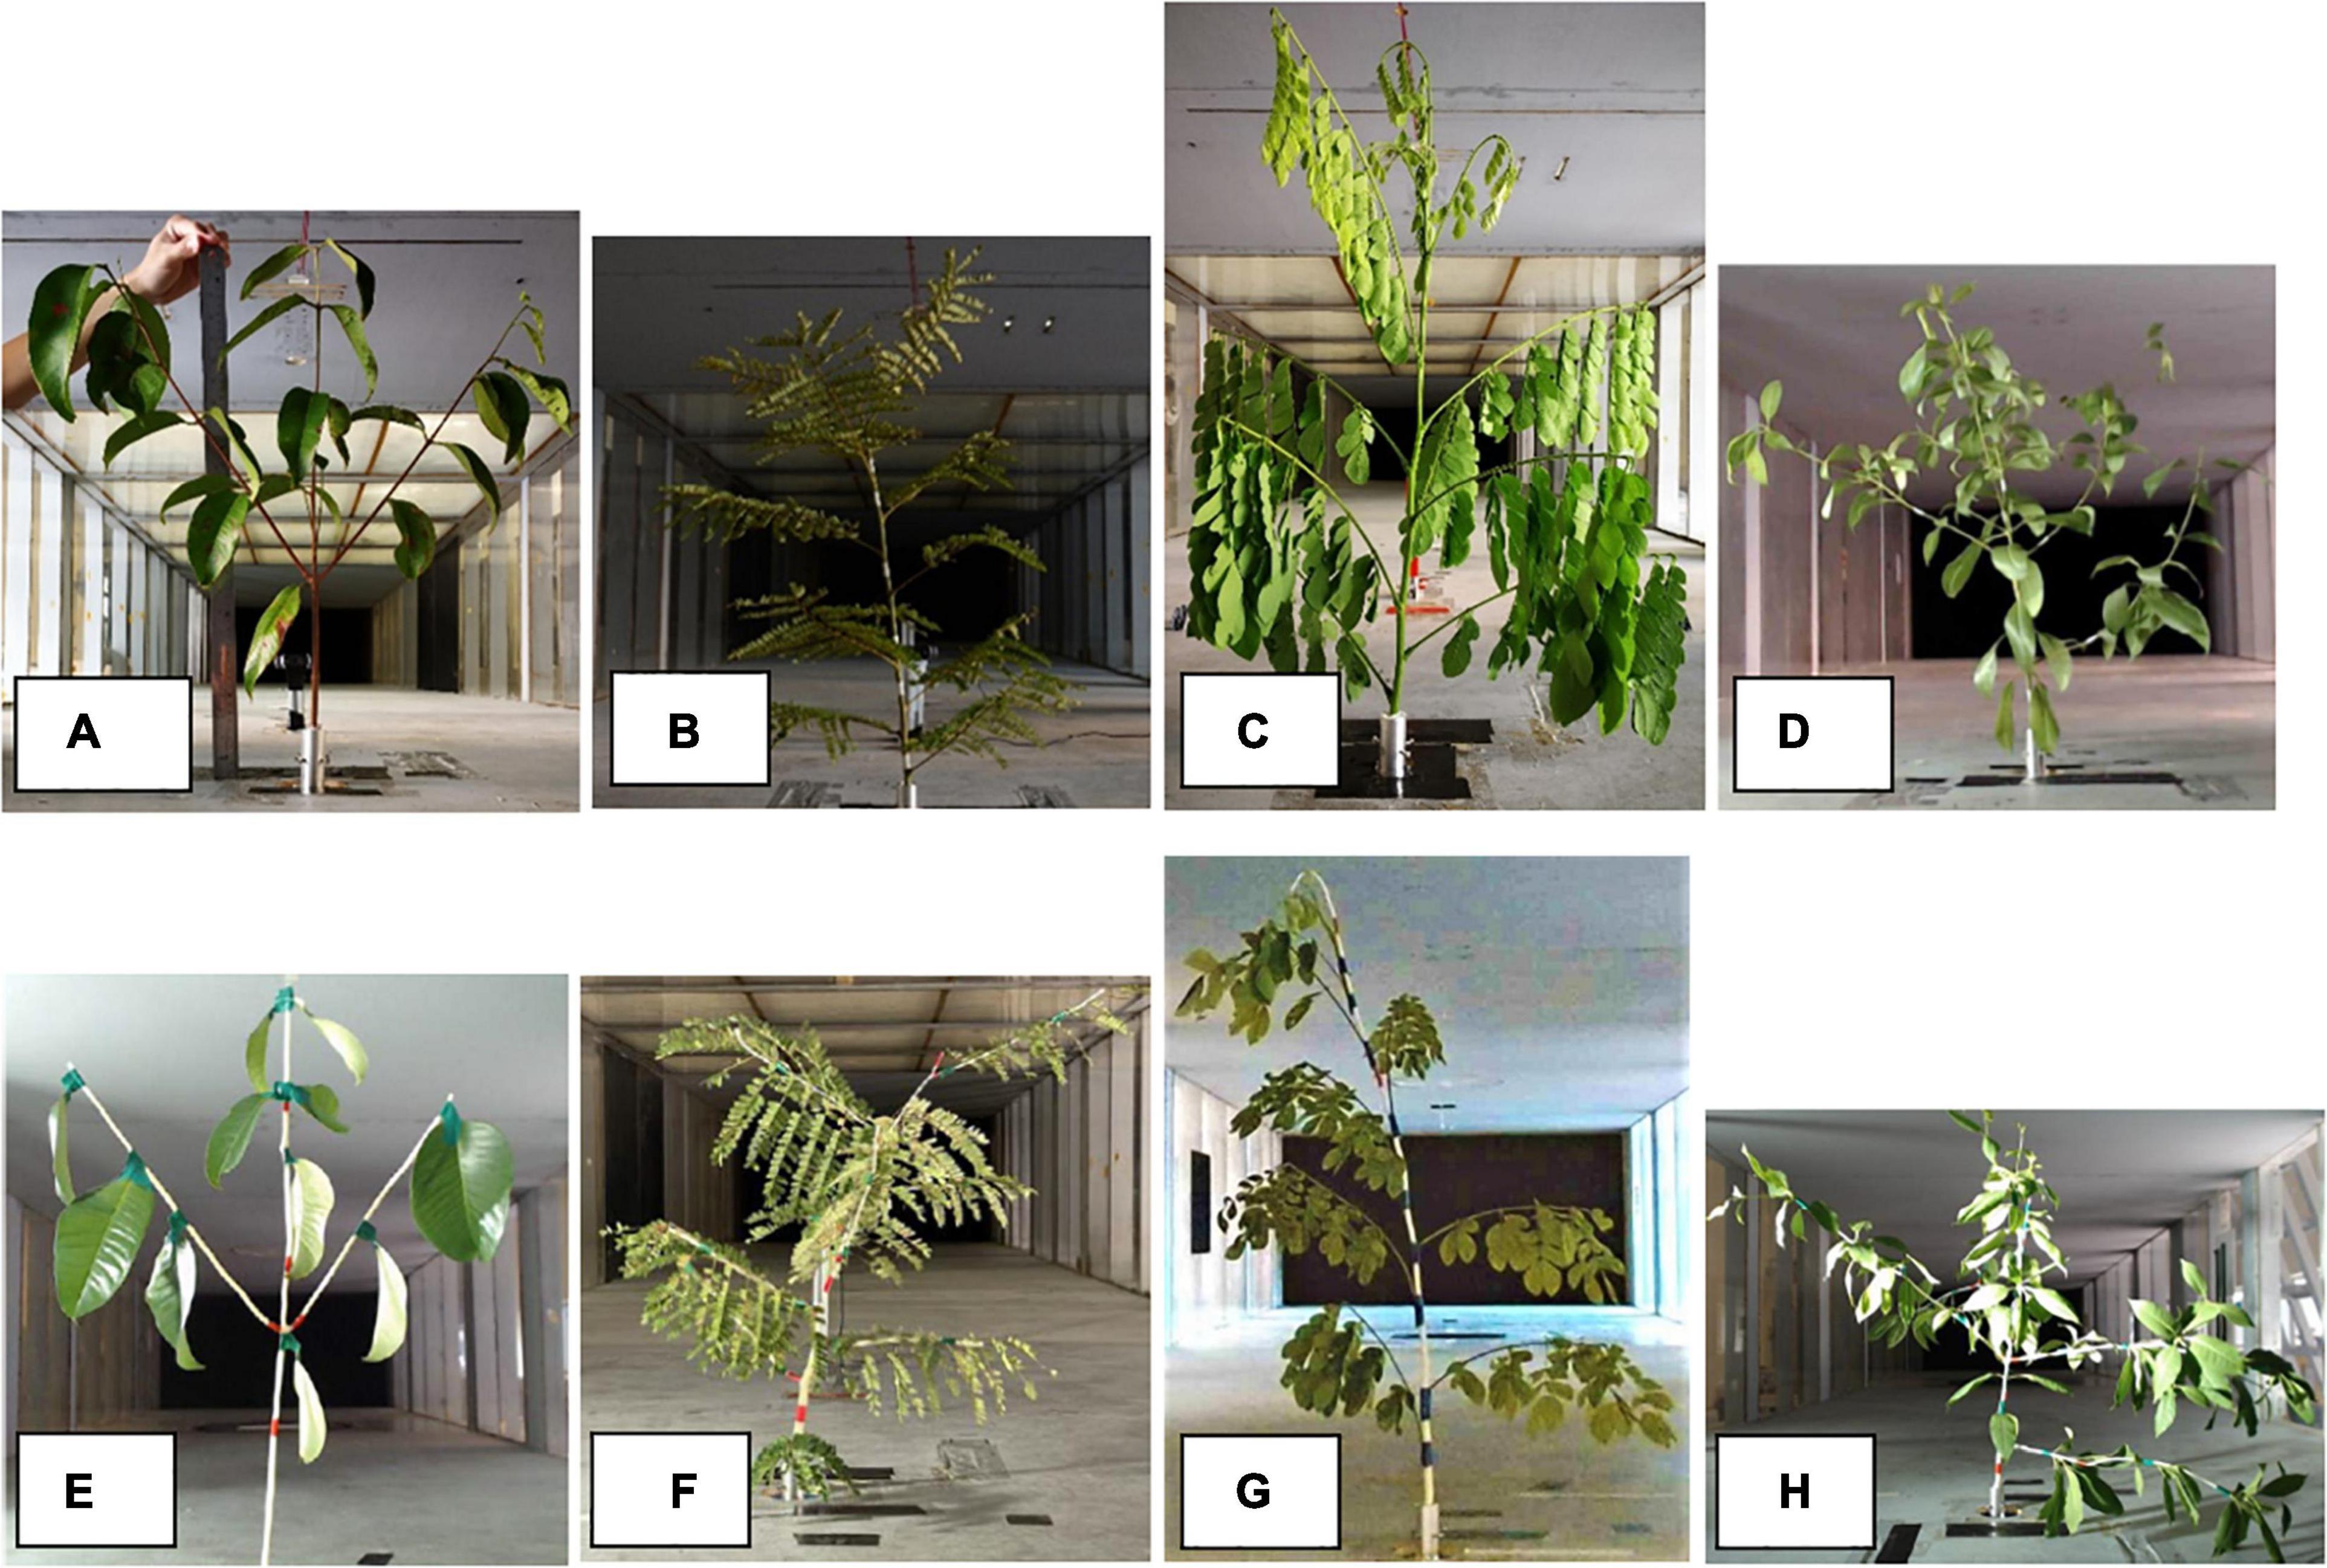
Figure 1. Photographs of real branches (A–D) and corresponding fabricated models (E–H) of the four species: sea apple (A,E), yellow flame (B,F), rain tree (C,G), and tembusu (D,H).
Readers may note that for the rain tree model (Figure 1G), only the main branch is artificial (white) while the smaller branches are real (green). This is because those smaller branches were identified to be part of the rain tree’s compound leaves, and thus not included for fabrication.
Each specimen was tested only once, with the exception of the rain tree model, due to the rapid drying out of the branch and leaves. For the rain tree model, enough real leaves were acquired to run the experiment twice, on different days. Figure 1G is from the first test run; the second looks similar and is thus not included in Figure 1.
Wind Tunnel and Equipment
The industrial wind tunnel at the National University of Singapore, with a cross-section of 1 m height by 2 m width was used. The test specimen (real branch or model branch) was secured in a mount protruding from the floor of the wind tunnel, and the mount itself was affixed to a load cell (ATI-9105-T-GAMMA). Two cameras (a Logitech C920 and a Nikon D7000) were placed 1 m downstream of the model and outside the wind tunnel, respectively, to capture both the back and side views. For the experiments, the wind tunnel was run at speeds ranging from 0 (stationary air) to just under 20 m/s.
Data Measurements and Processing
Streamwise Force
For each wind speed used, a 300 s recording from the load cell was taken at a frequency of 1,000 Hz. The streamwise force Fx was obtained by averaging over the last 180 s, when the force readings had reached a semi-steady state.
Drag Coefficient
The drag coefficient was calculated using the equation:
Where ρ = 1.1644 kg/m3 is the air density, A0 is the initial frontal area of the test specimen, and v is the current wind speed (specifically the wind speed in the middle of the wind tunnel, where the velocity profile is uniform, upstream of the test specimen). ImageJ (Schneider et al., 2012) was used to obtain the initial frontal area from a photograph of the specimen in stationary air. The frontal areas of all the specimens, in stationary air, are listed in Table 1.
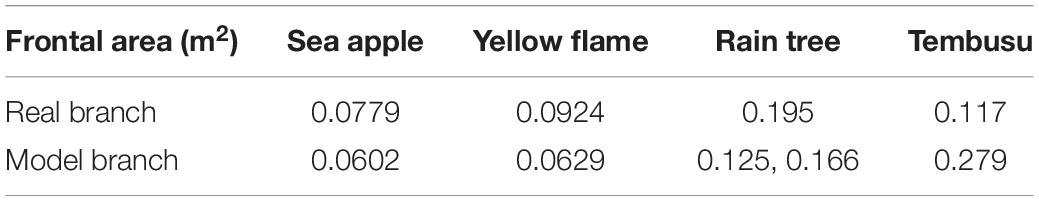
Table 1. Frontal area of specimens in stationary air.
Streamwise Deflection
Colored tape was attached to the test specimens to help identify specific locations and differentiate sub-branches. ImageJ (Schneider et al., 2012) was then used to superimpose photos of the side view of the specimens, over the corresponding photo of the specimen in stationary air. The highest point visible was used to determine the streamwise deflection δx. Unfortunately the leaves sometimes blocked the view, so it was not always possible to use the same point. Thus, the deflection was normalized by the vertical height h of the measurement location, for a more consistent comparison:
Reynolds Number
In all following figures, we present the data as a function of trunk Reynolds number instead of wind speed for better translation of our results to other studies. Here, we calculate it as:
Where D is the specimen’s trunk diameter (average diameter of the main part of the branch) and μ = 1.88 × 10⁻⁵ kg/ms is the viscosity of air.
Results
Streamwise Force Fx
Figures 2–5 show the time-averaged streamwise force acting on both the real and model branches of all four species. The trend of increasing force with increasing trunk Reynolds number is observed in all of them, but the level of similarity between real and model branches differs. For the sea apple (Figure 2) and tembusu (Figure 5) the measured values are similar at low Reynolds number but is significantly larger after Retr = 4000; for the yellow flame (Figure 3), the values are closer but the model experiences lower force; lastly for the rain tree (Figure 4), one set of model values are very similar to that of the real branch, while the other set is obviously higher. The closer set has a frontal area (see Table 1) that is more similar to that of the real branch than the other (further) set, which seems to imply that matching the initial frontal area is important. This hypothesis is supported by the yellow flame results (Figure 3), which has a similar discrepancy in frontal area.
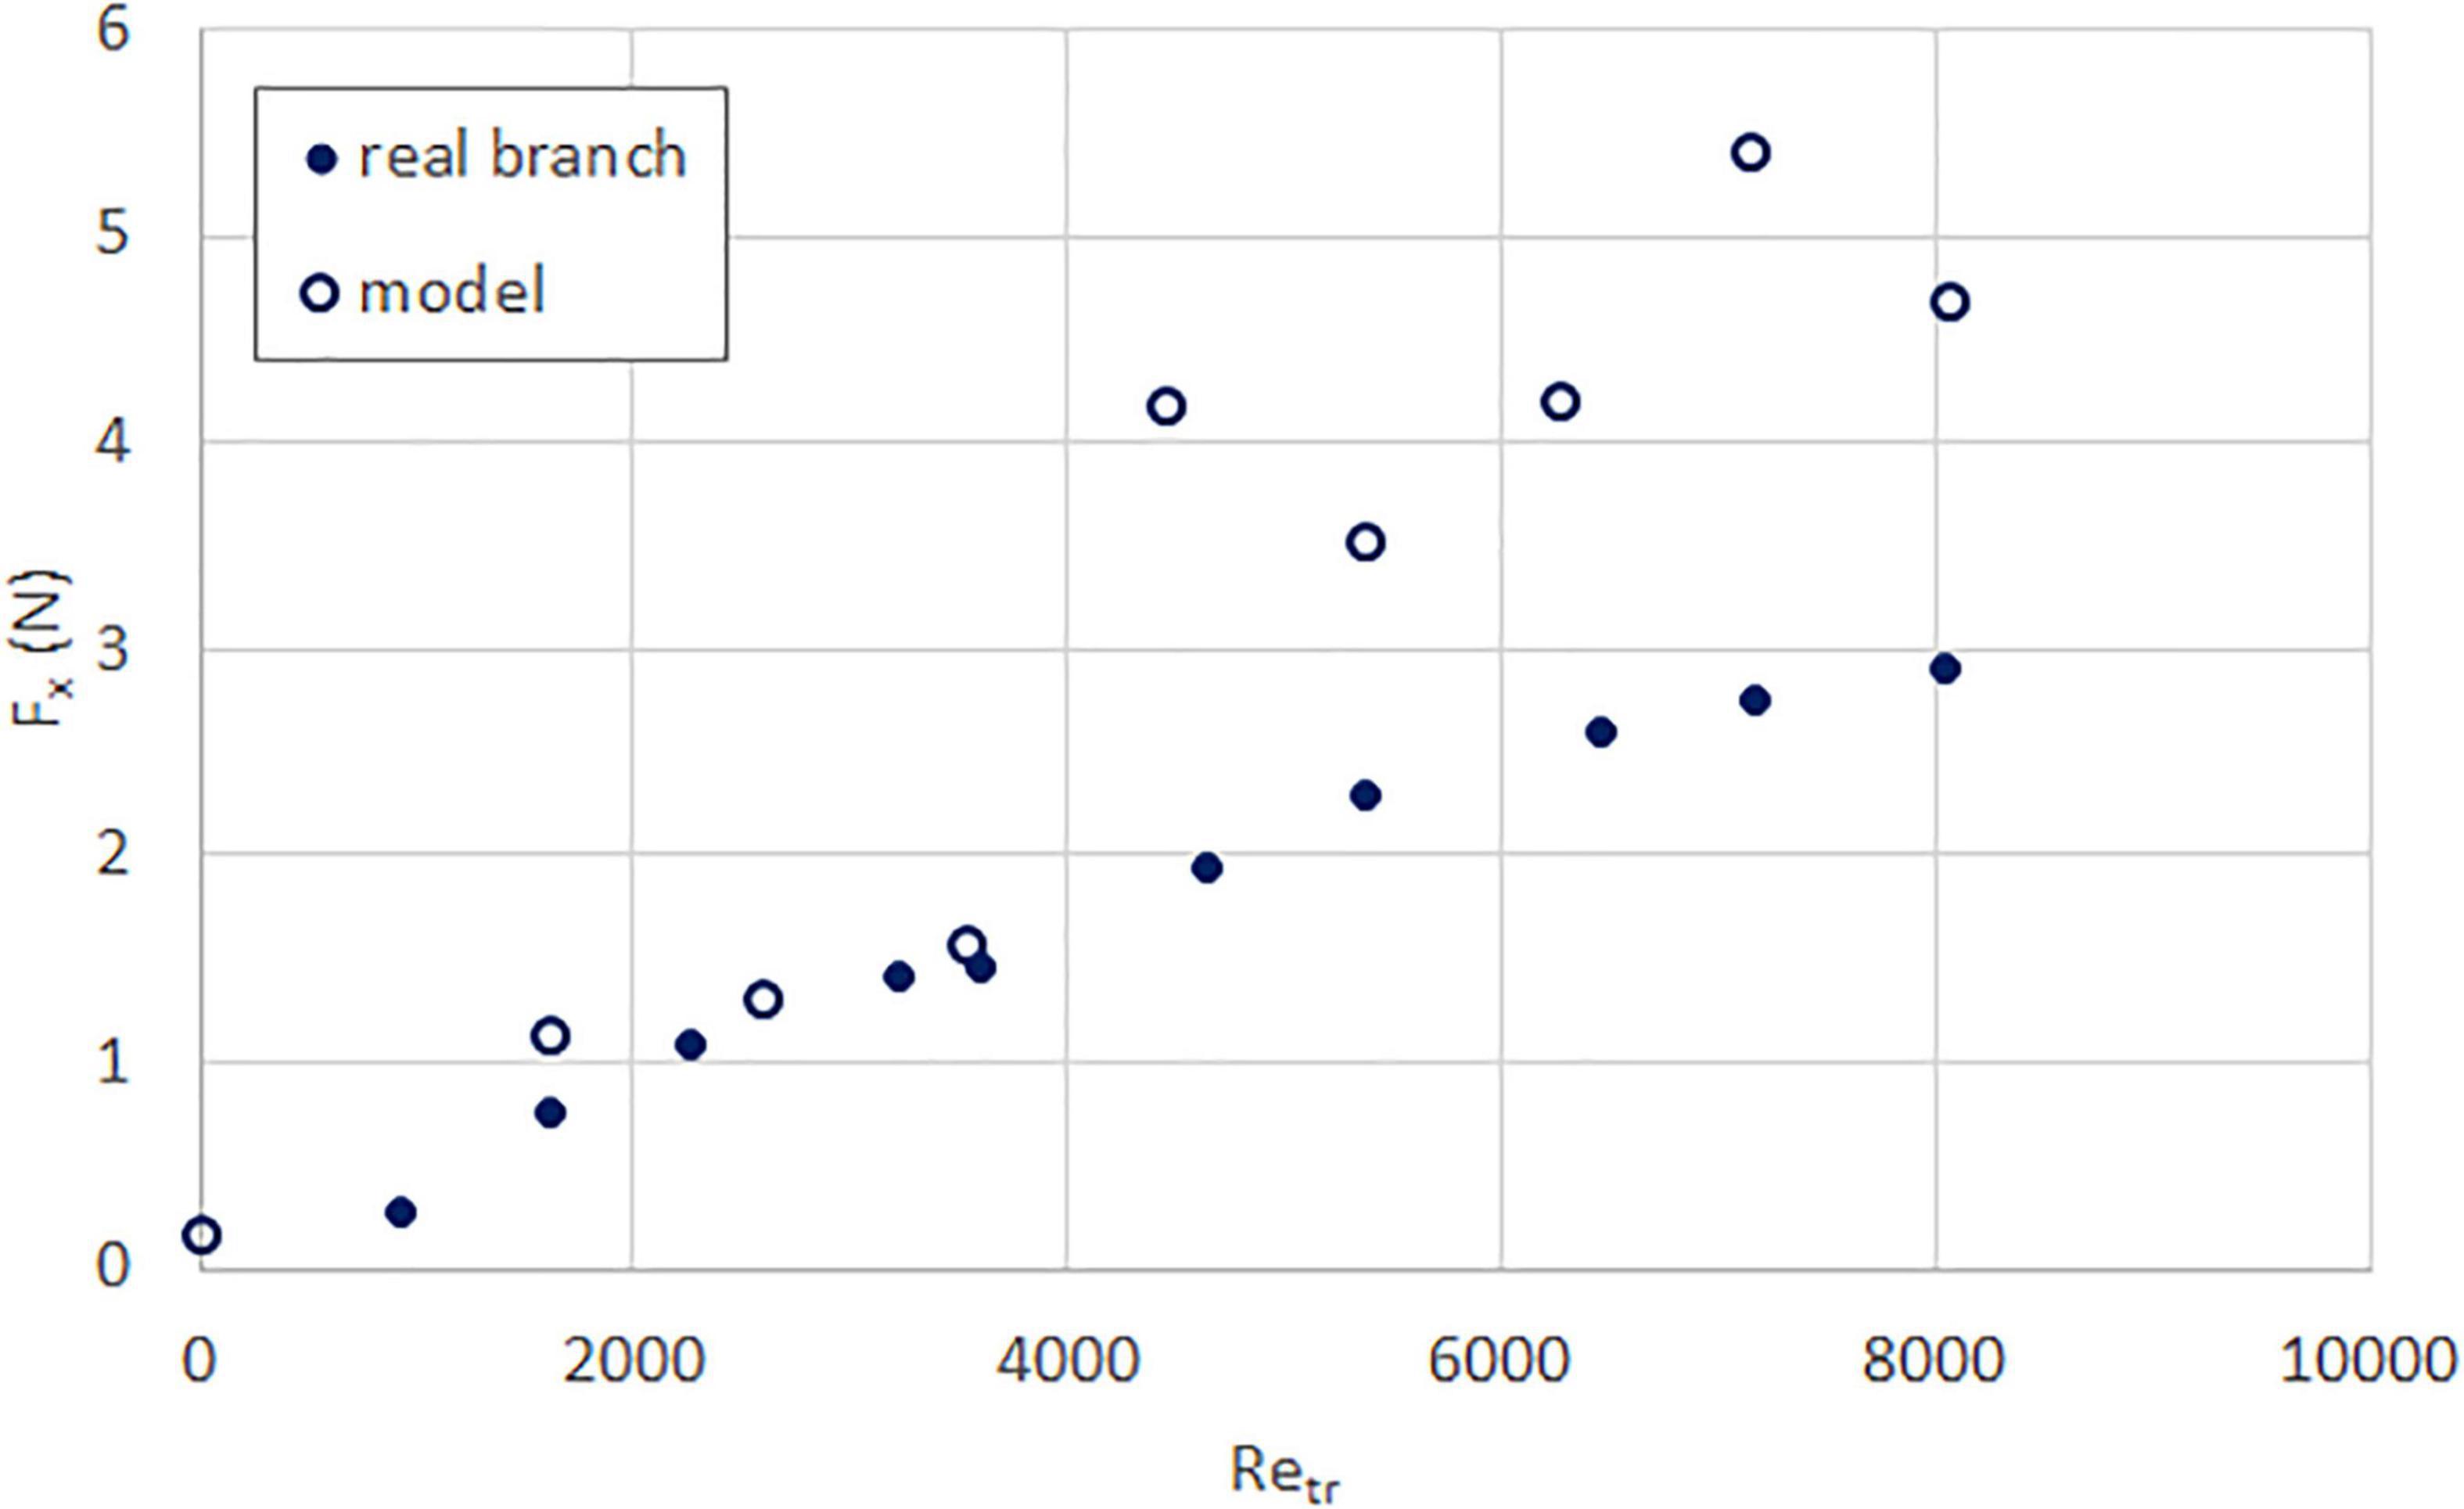
Figure 2. Streamwise force (time-averaged) as a function of trunk Reynolds number, for real (solid circle) and model (hollow circle) sea apple branches.

Figure 3. Streamwise force (time-averaged) as a function of trunk Reynolds number, for real (solid circle) and model (hollow circle) yellow flame branches.
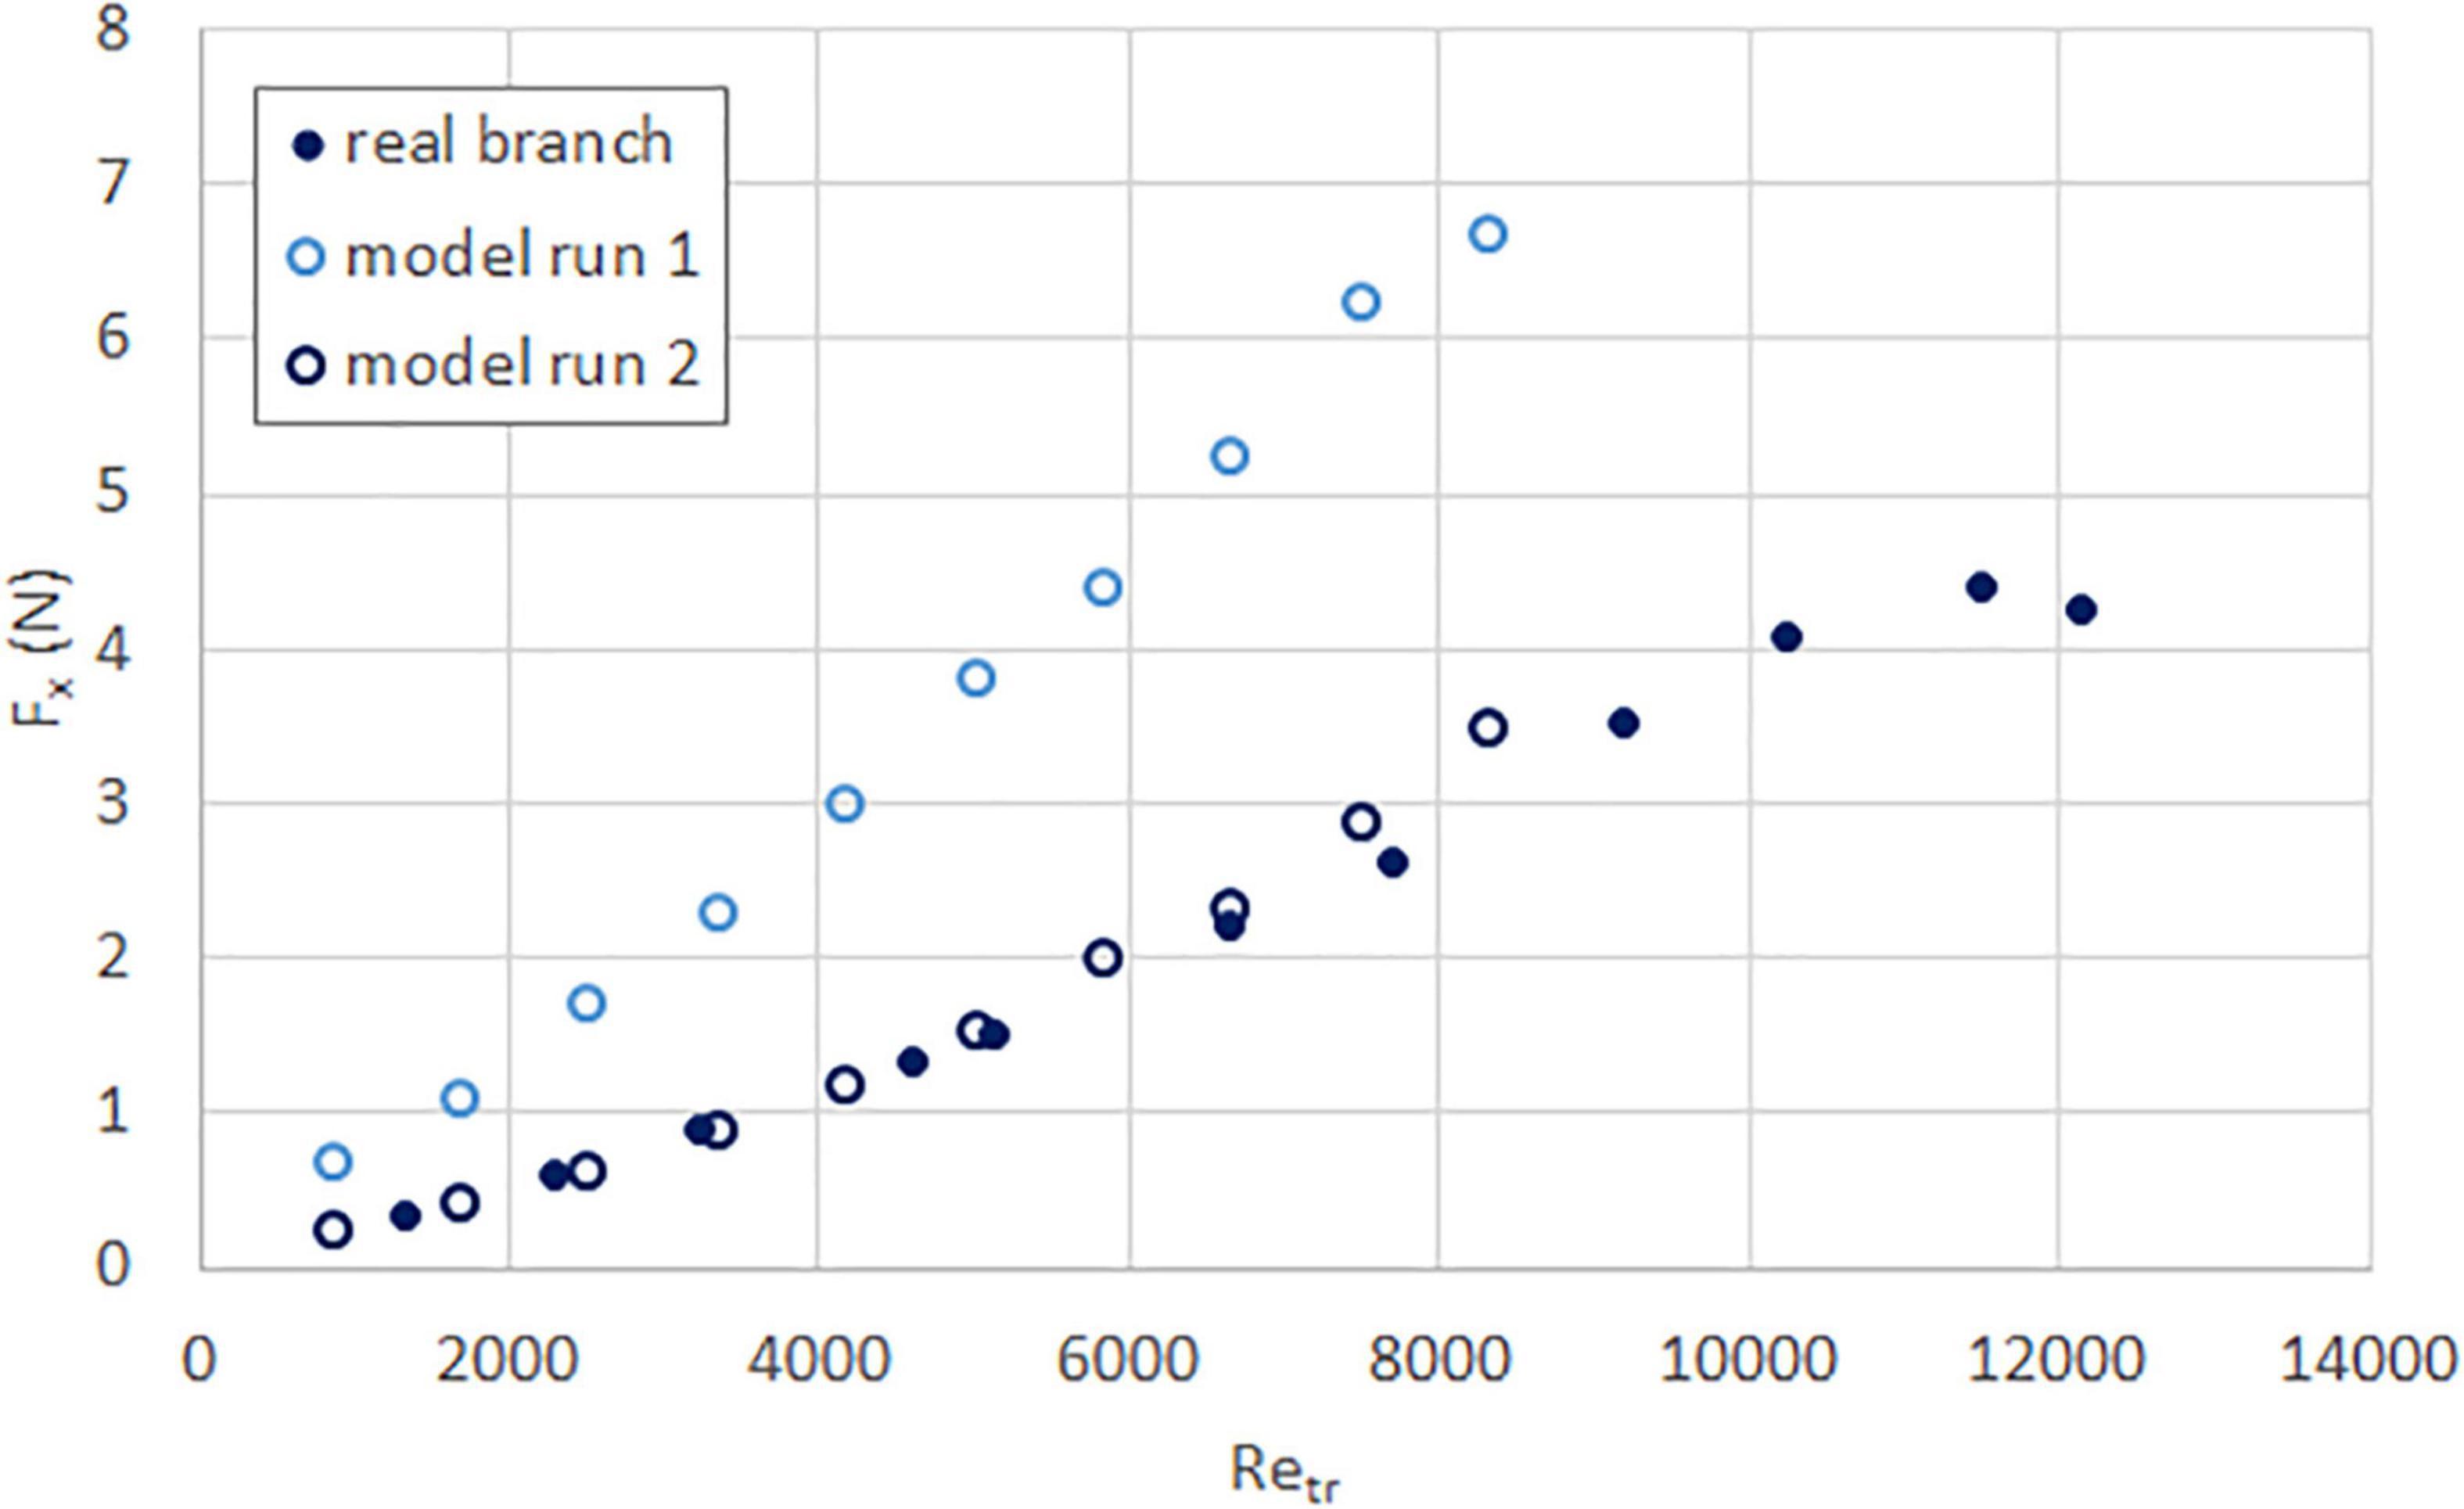
Figure 4. Streamwise force (time-averaged) as a function of trunk Reynolds number, for real (solid circle) and model (hollow circle) rain tree branches.
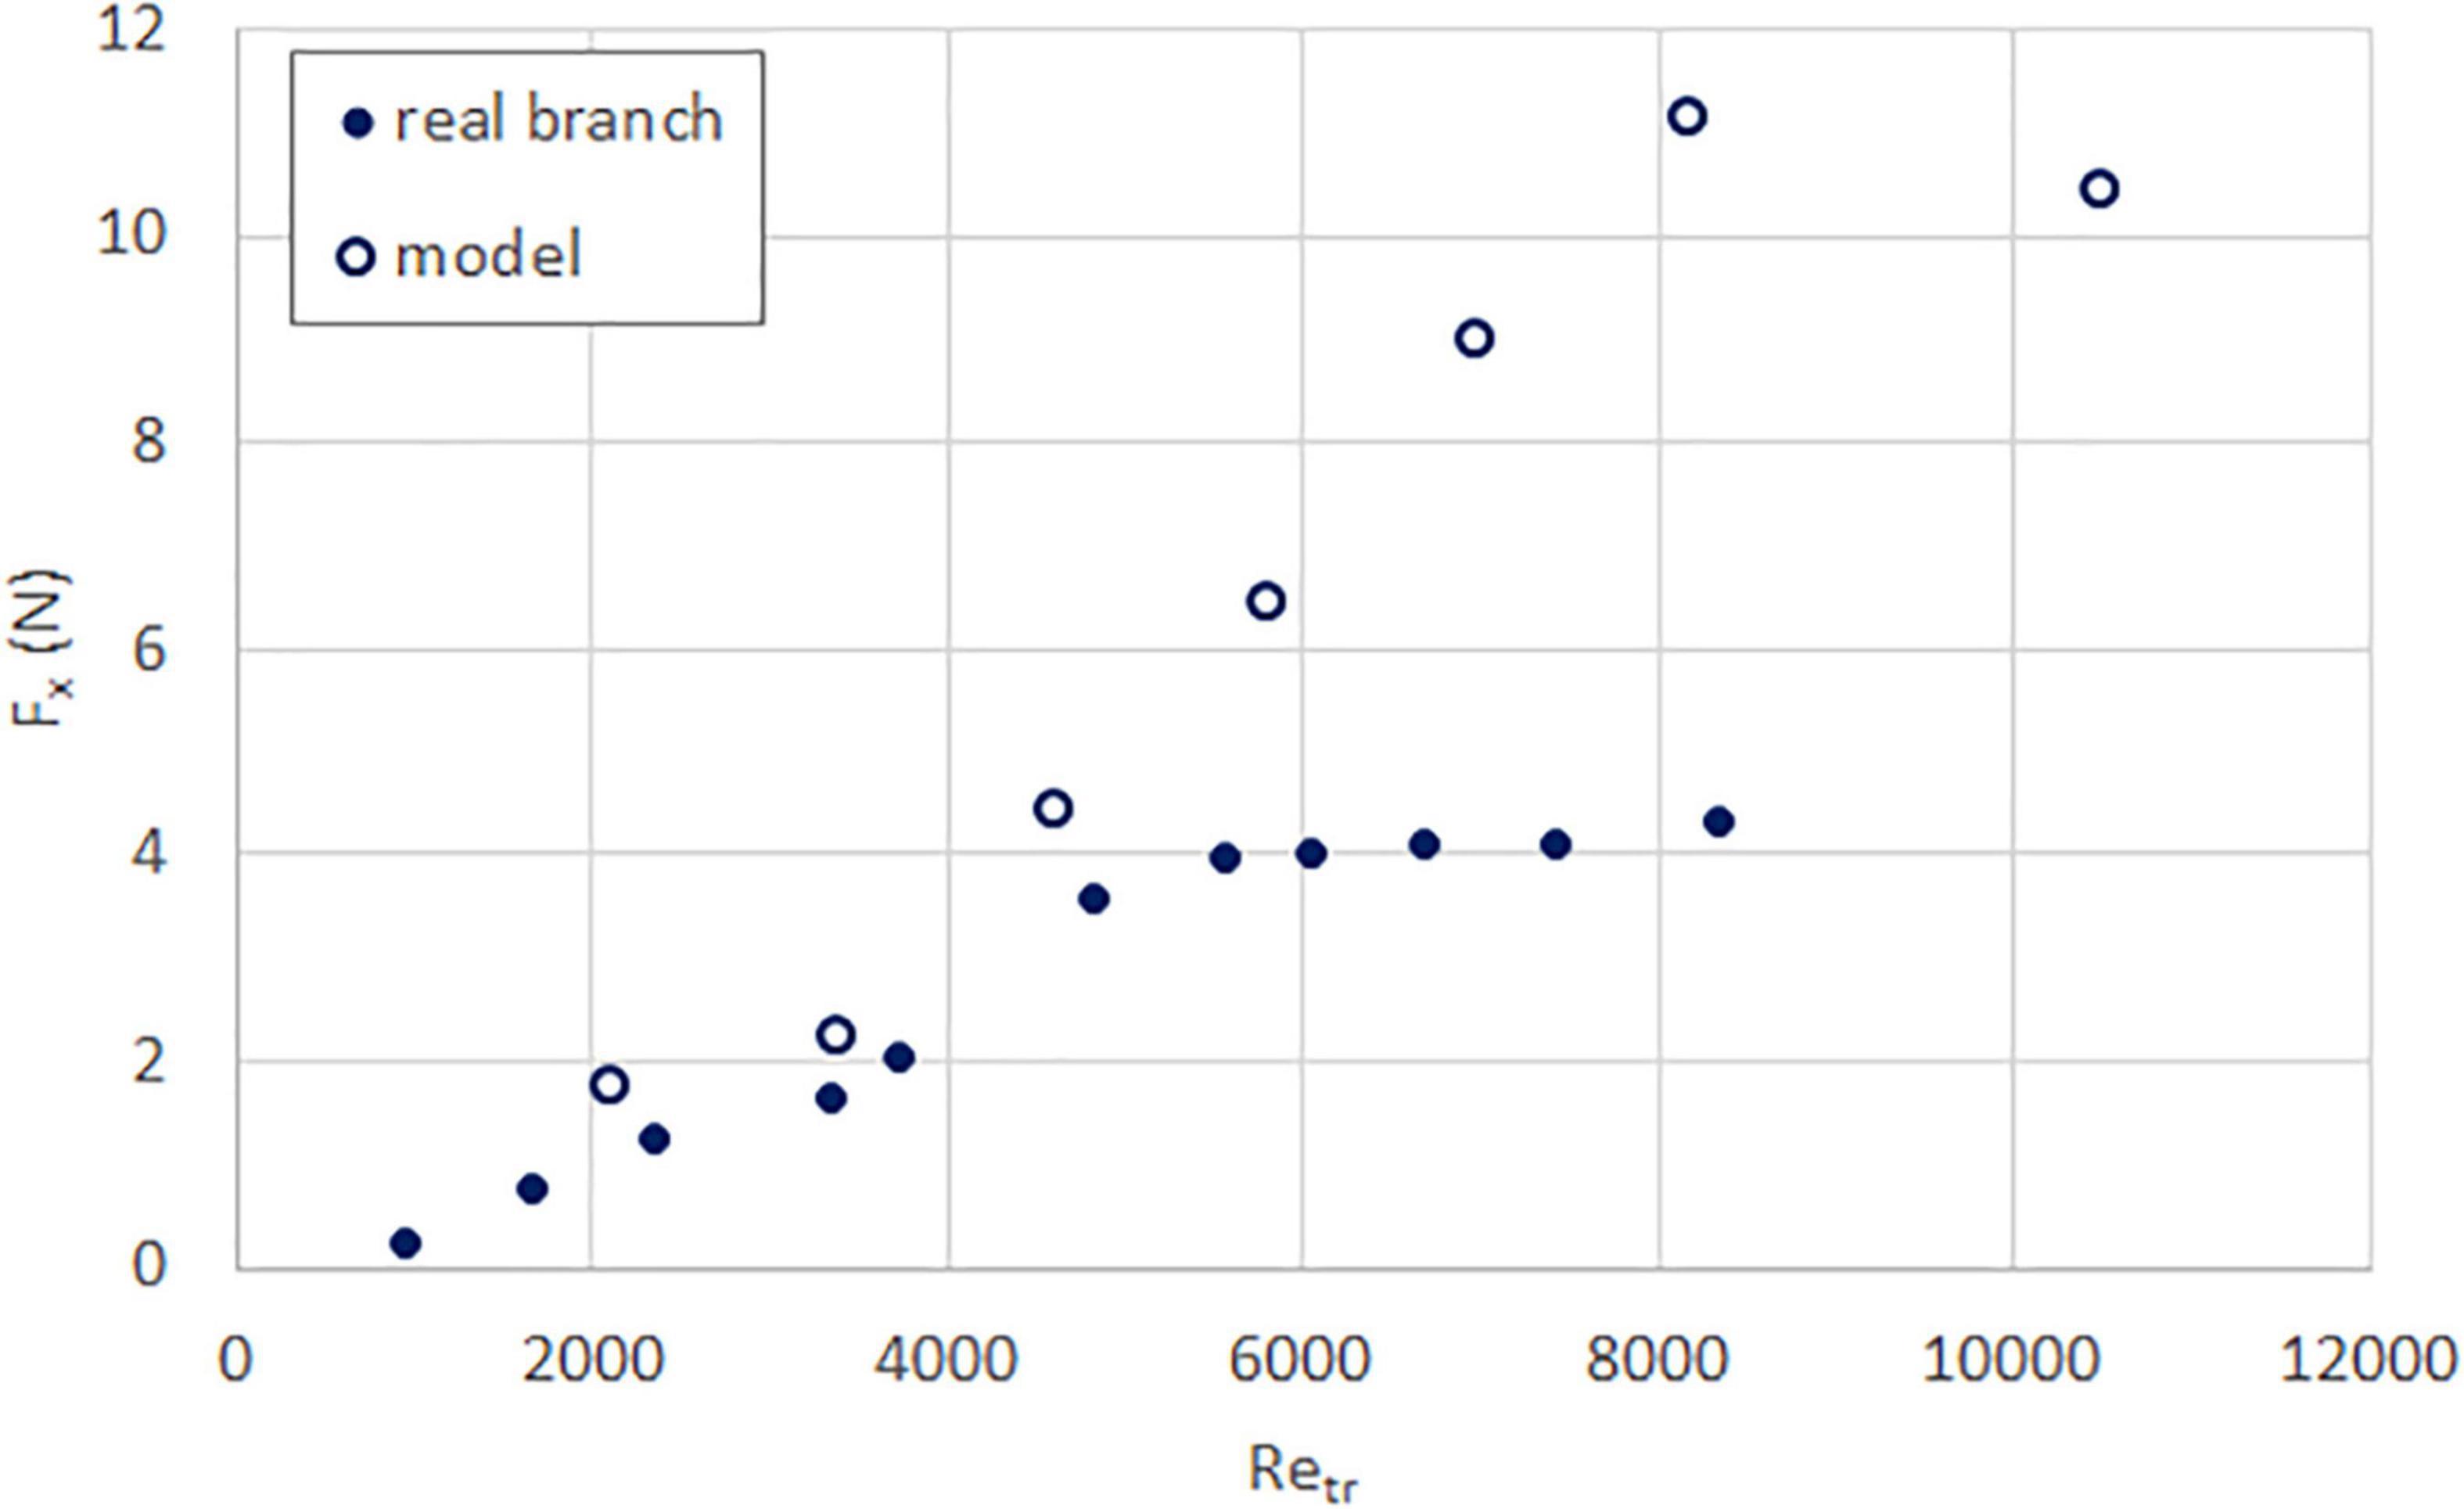
Figure 5. Streamwise force (time-averaged) as a function of trunk Reynolds number, for real (solid circle) and model (hollow circle) tembusu branches.
Given the small number of specimens, we can only tentatively hypothesize that (1) having a similar initial frontal area is important; but (2) for species with simple leaves (sea apple and tembusu) this is insufficient to ensure close similarity in magnitude at high Reynolds number. We theorize that this is because taping the simple leaves to the branches does not allow the leaves to deflect as much as they would on a real branch. This effect is not obvious at low Reynolds number because at this point the leaves would only flutter; but at higher Reynolds number the leaves are unable to streamline and therefore the specimens experience greater drag. For the compound leaves, however, even though their main stems are taped to the branches similarly, the leaflets themselves are able to move naturally and streamline at higher Reynolds number.
Drag Coefficient CD,0
The drag coefficient for both the real and model branches of all four species are plotted in Figures 6–9. Except for the yellow flame, the model and real branches are much closer in similarity than when comparing force values. This is unsurprising because the squared-velocity in the drag coefficient expression means that the wind speed has a much more significant influence compared to drag force and frontal area, especially at high Reynolds number.
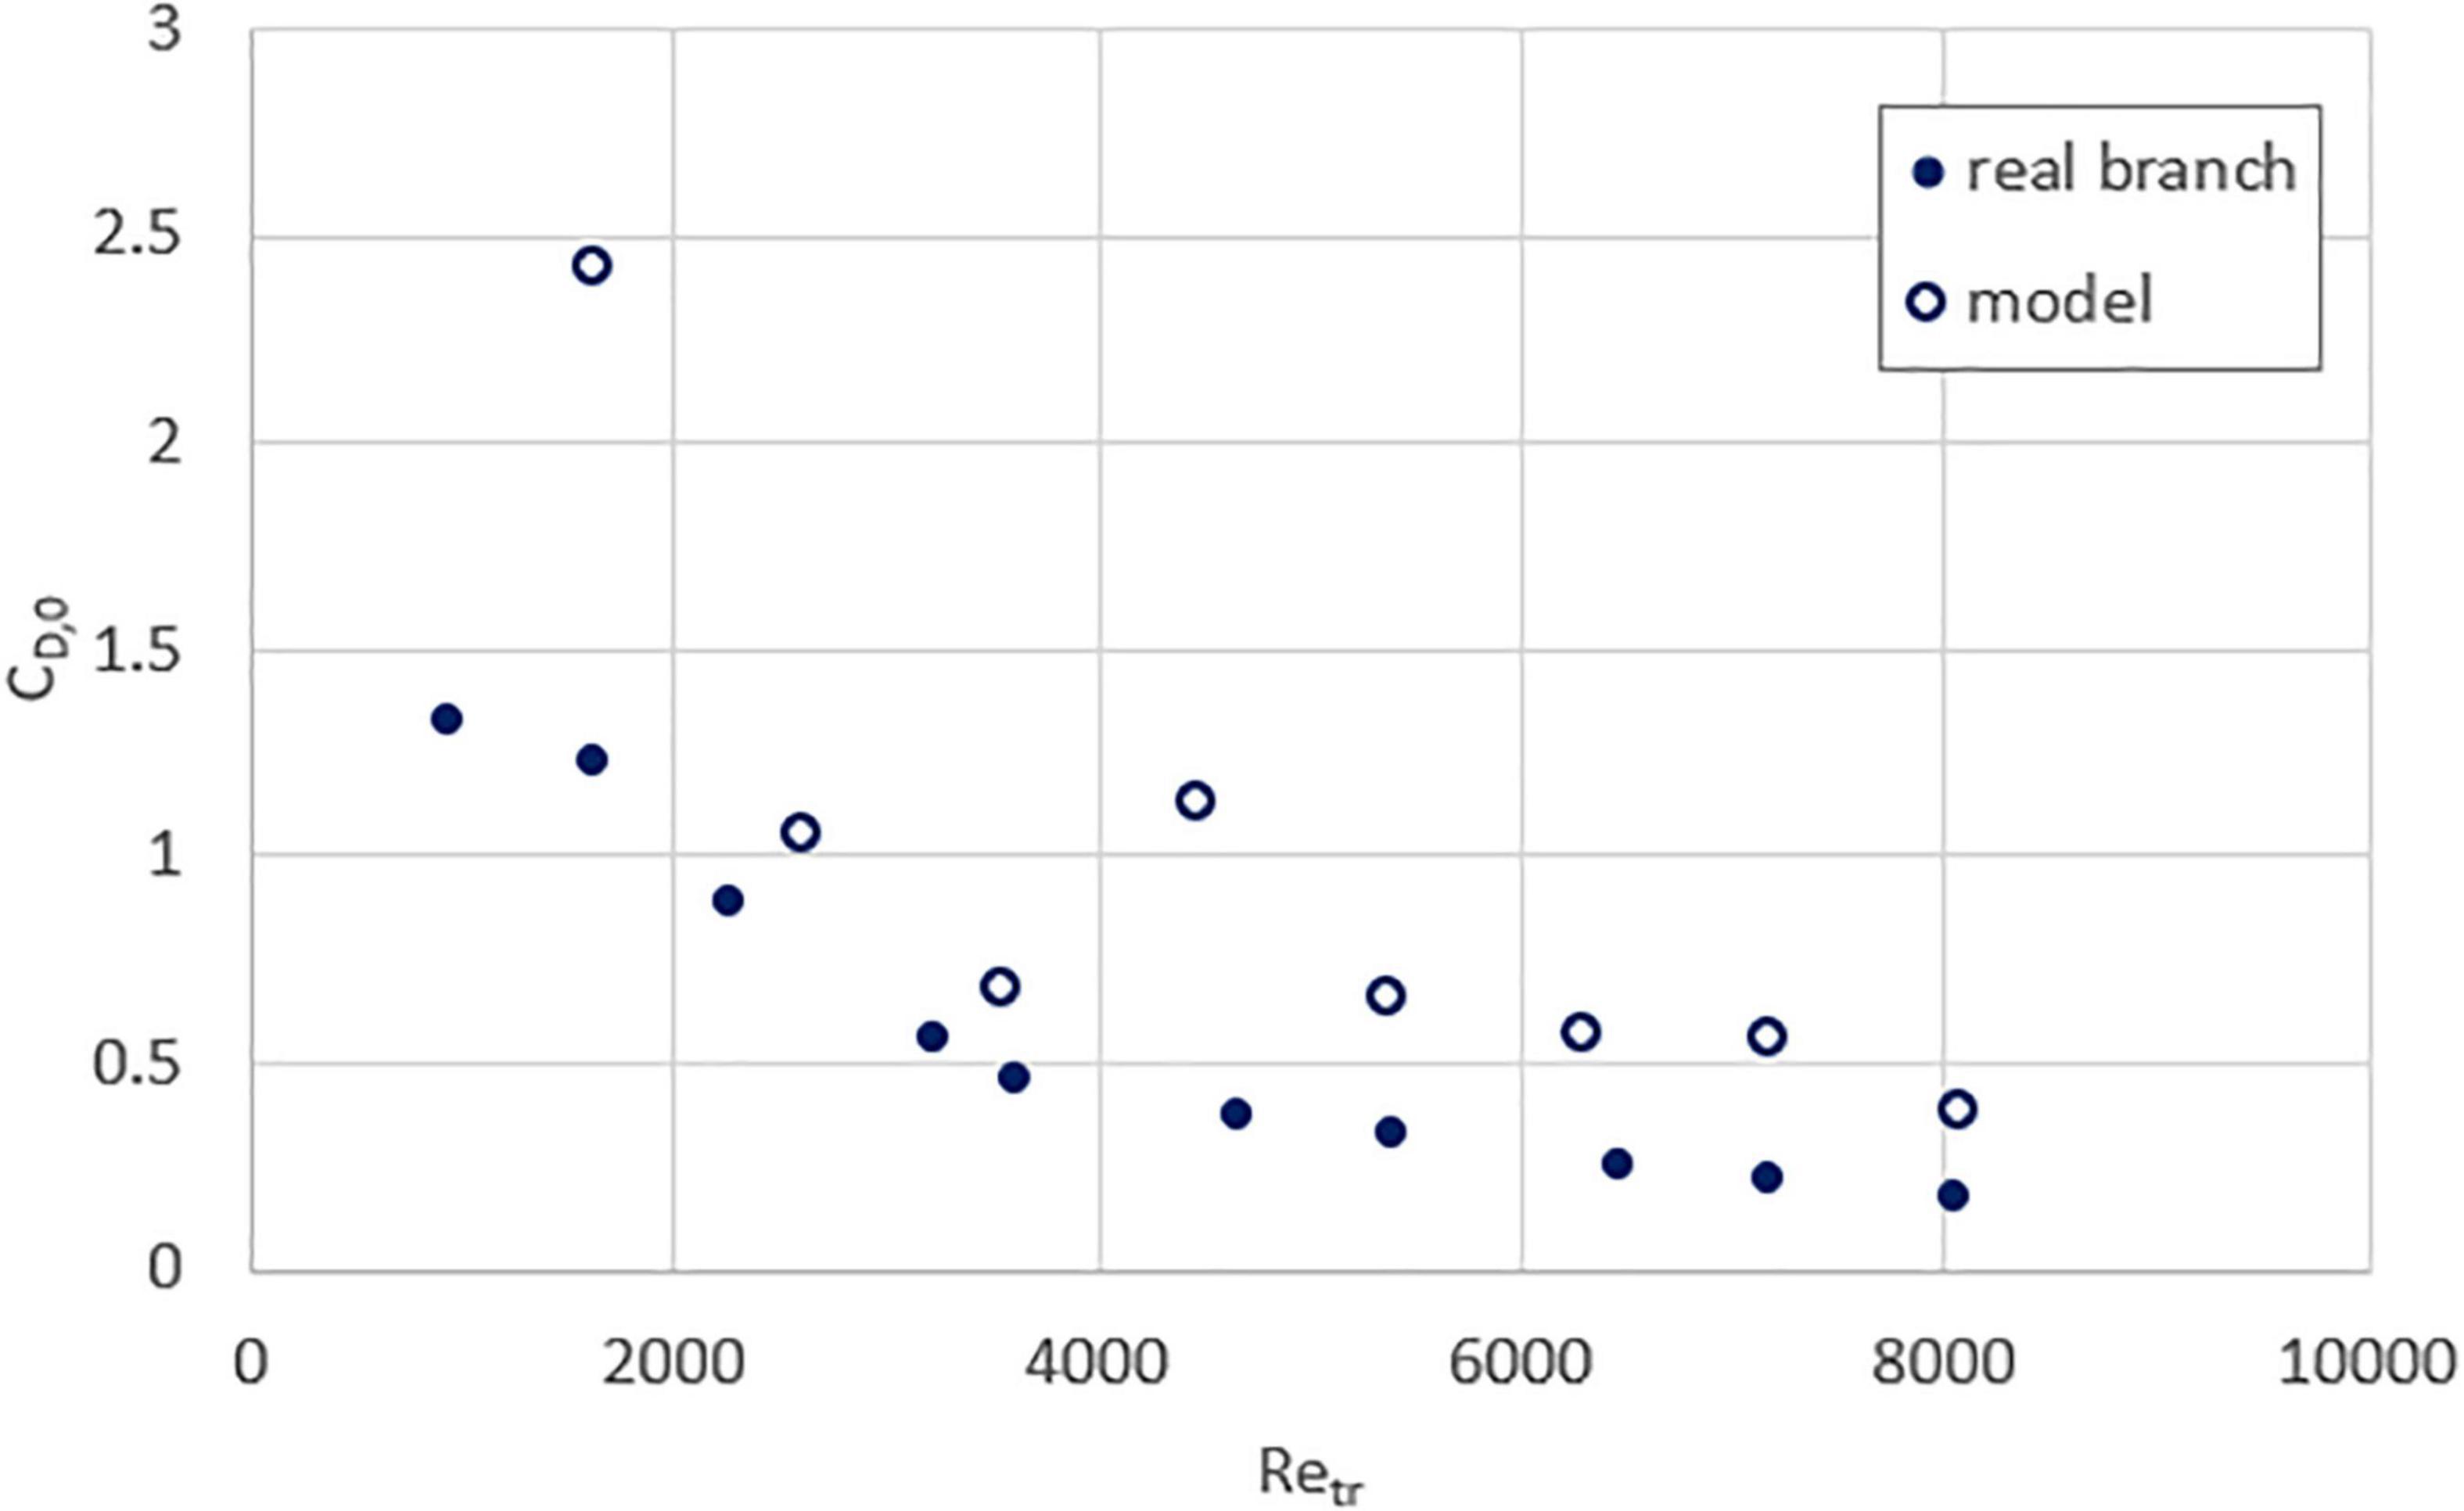
Figure 6. Drag coefficient as a function of trunk Reynolds number, for real (solid circle) and model (hollow circle) sea apple branches.
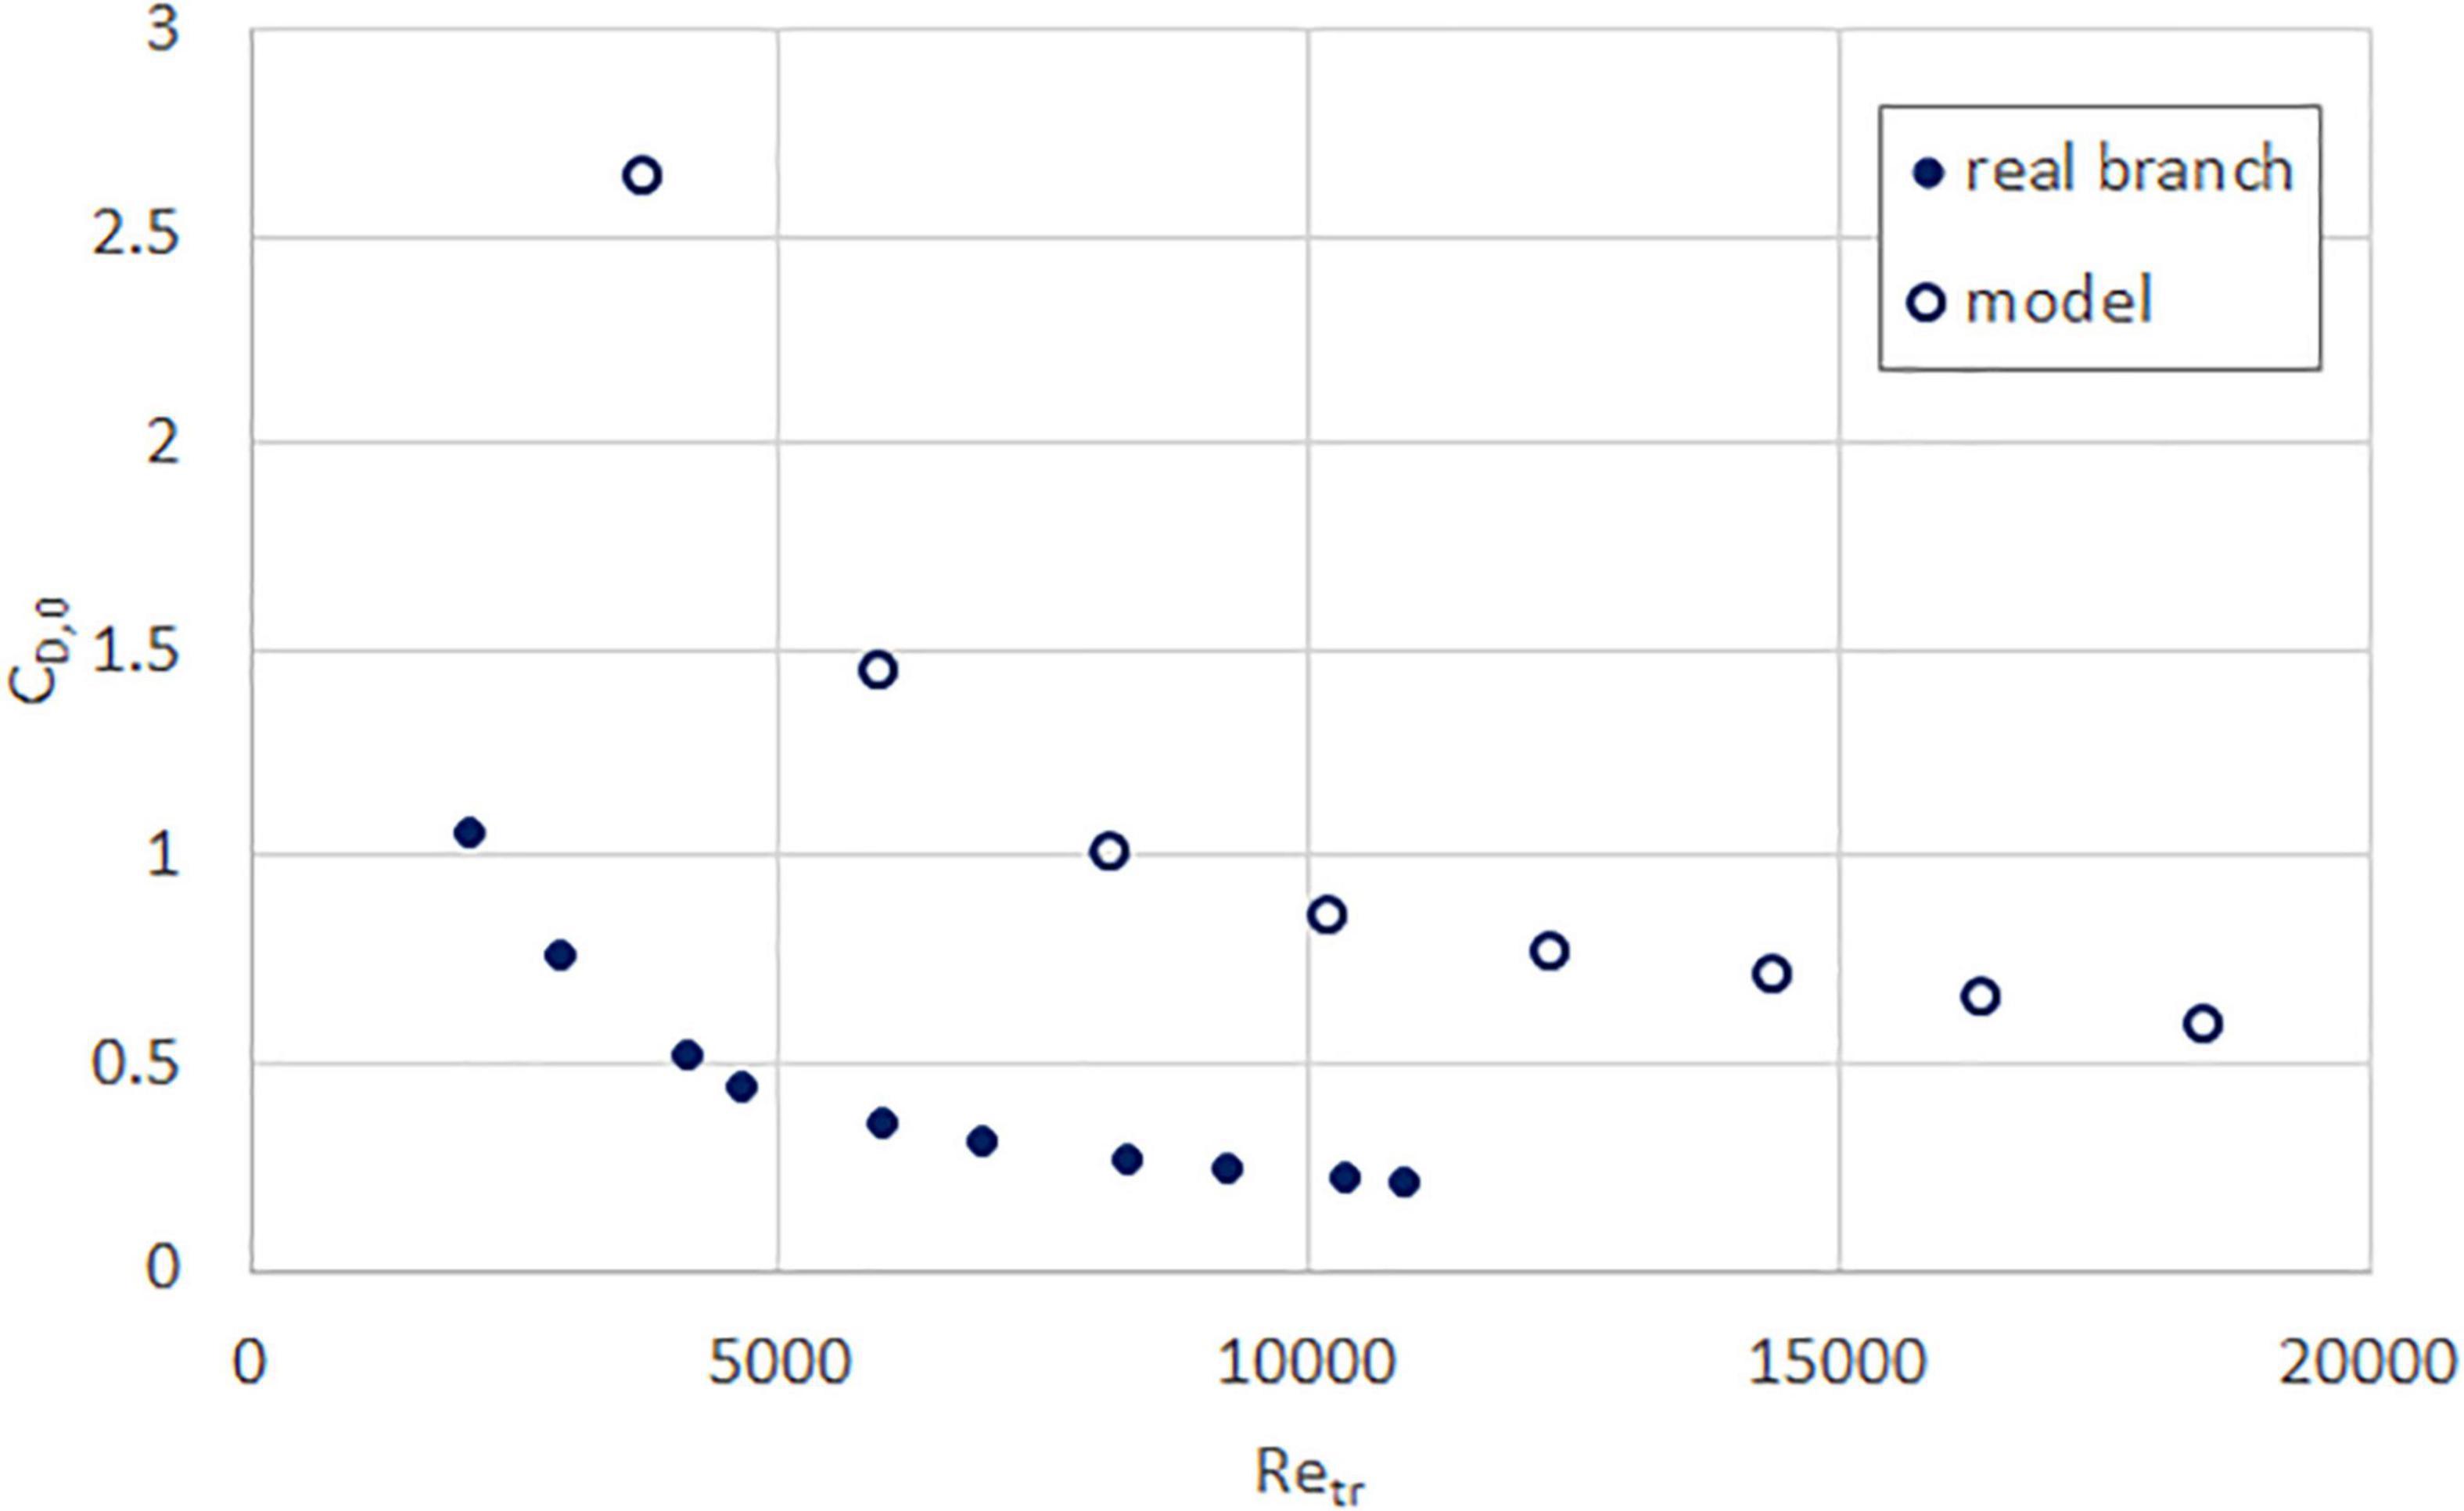
Figure 7. Drag coefficient as a function of trunk Reynolds number, for real (solid circle) and model (hollow circle) yellow flame branches.
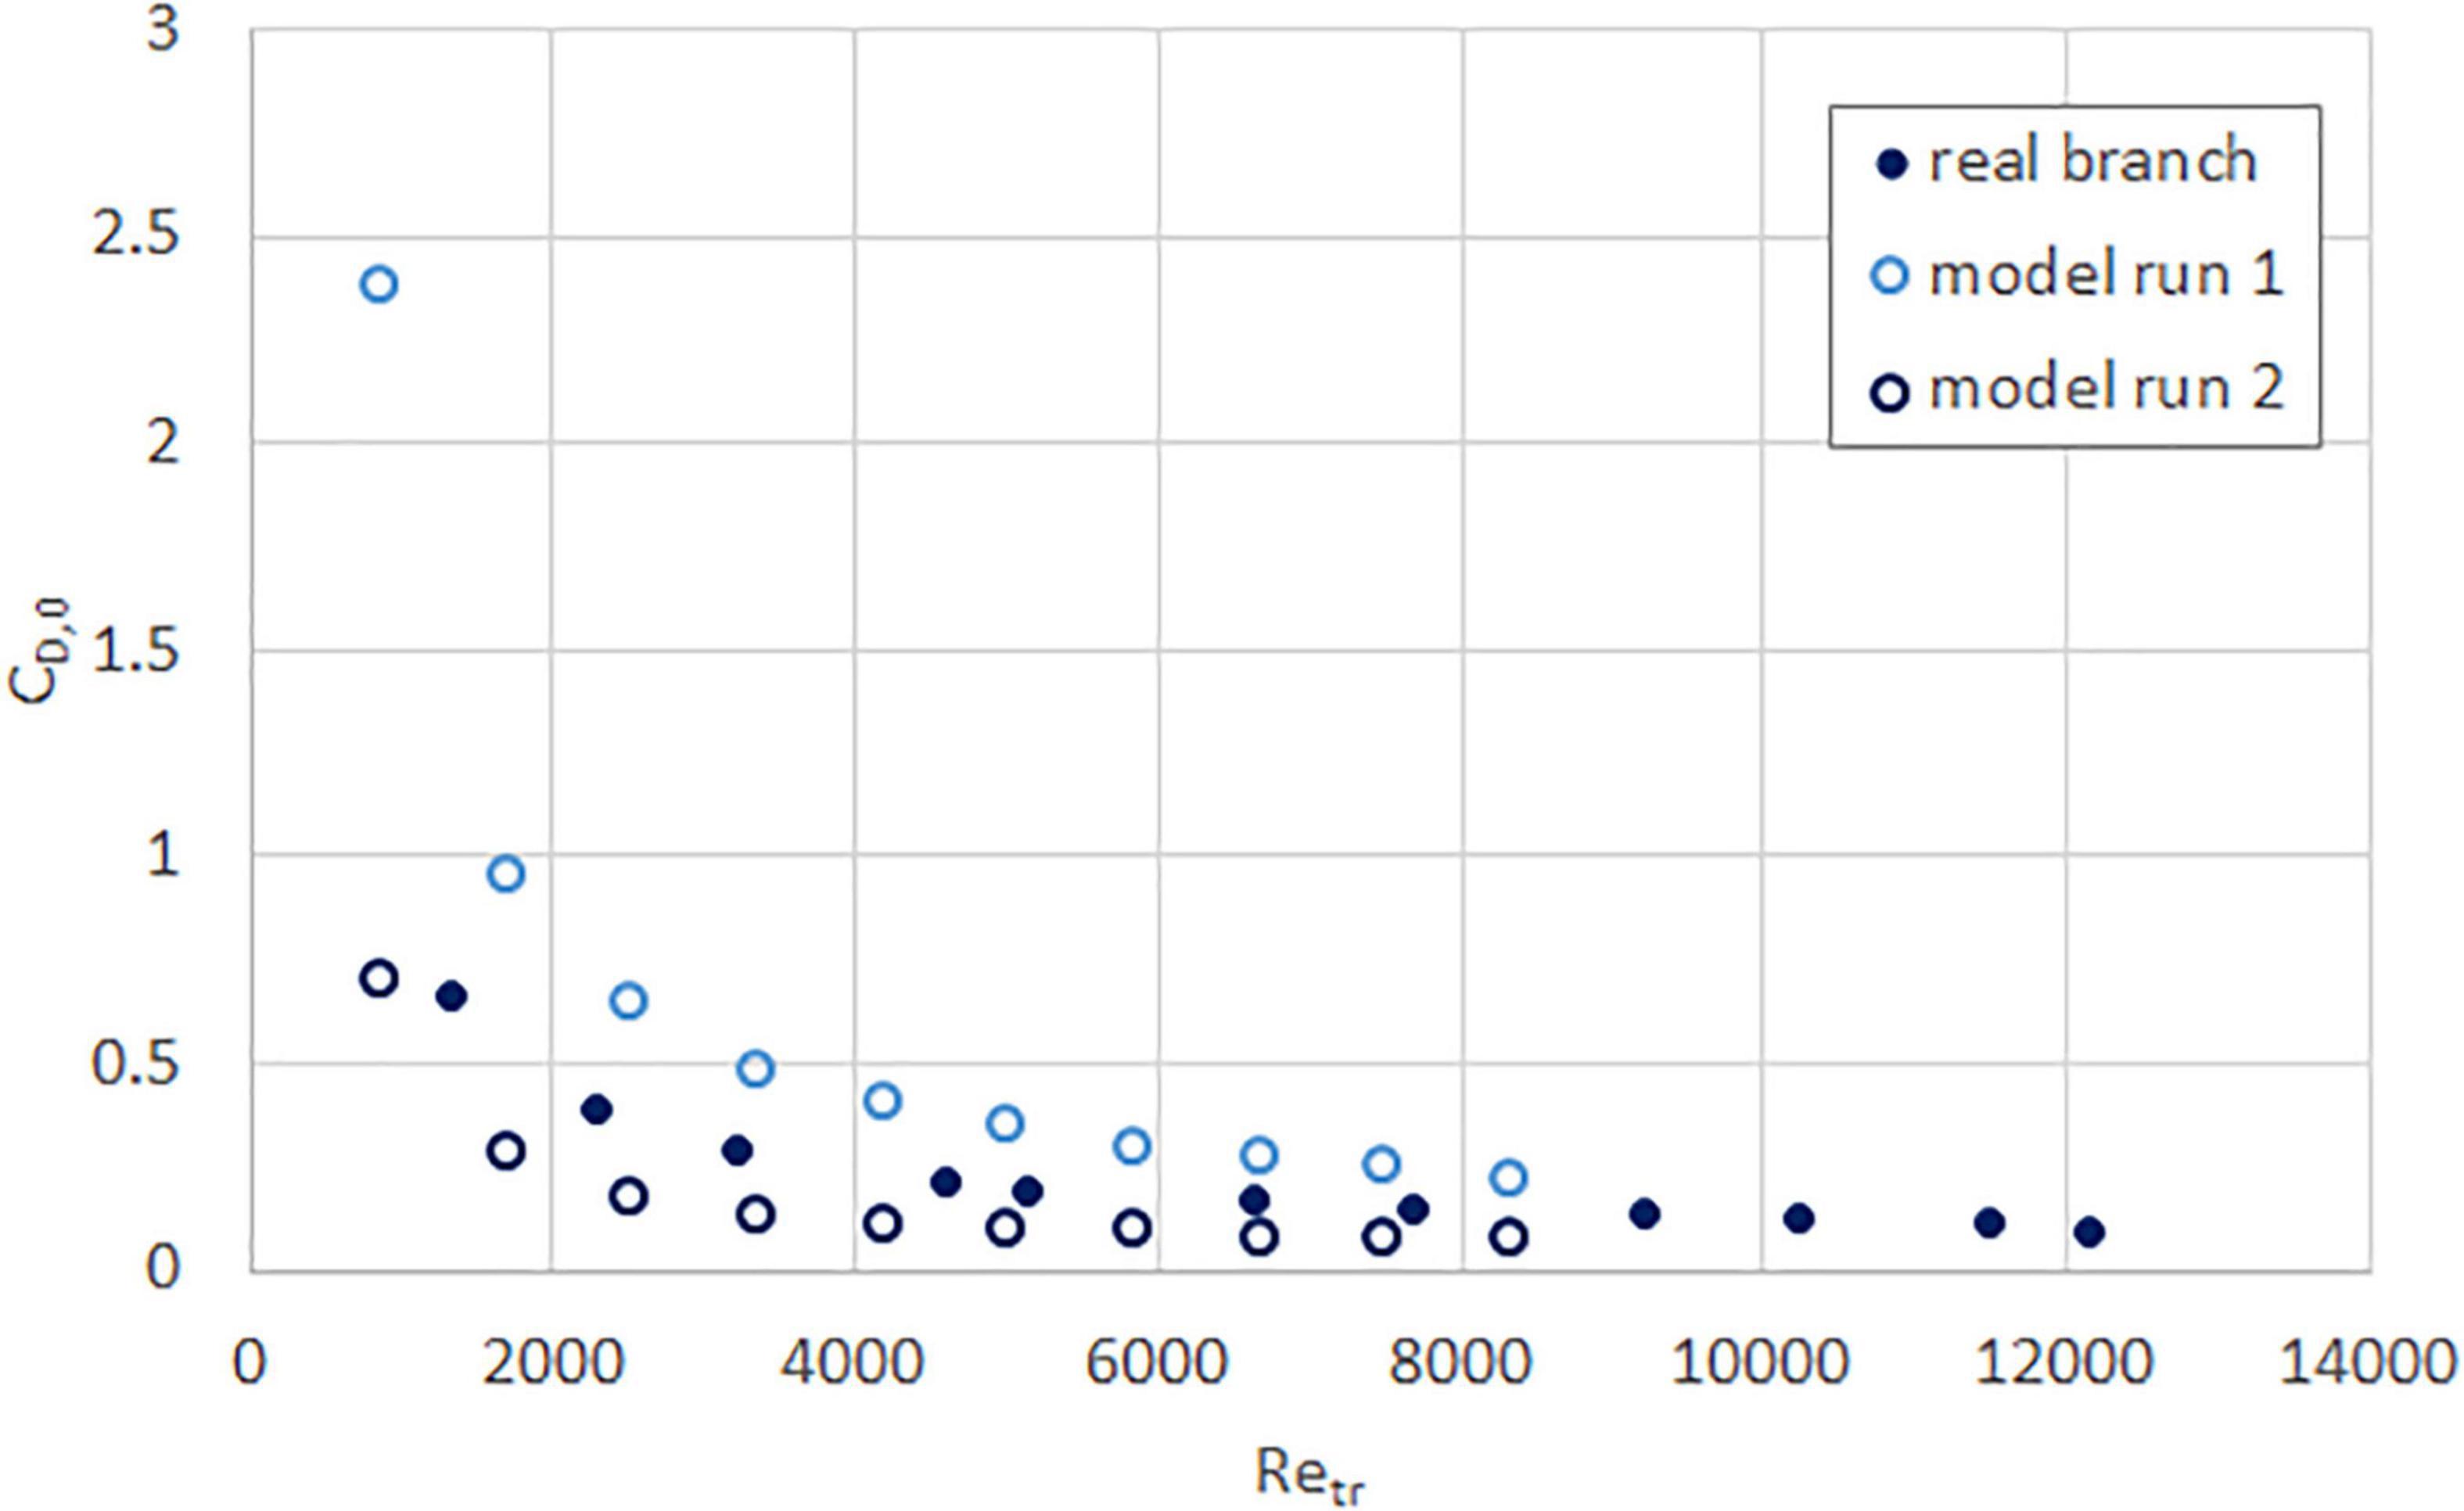
Figure 8. Drag coefficient as a function of trunk Reynolds number, for real (solid circle) and model (hollow circle) rain tree branches.
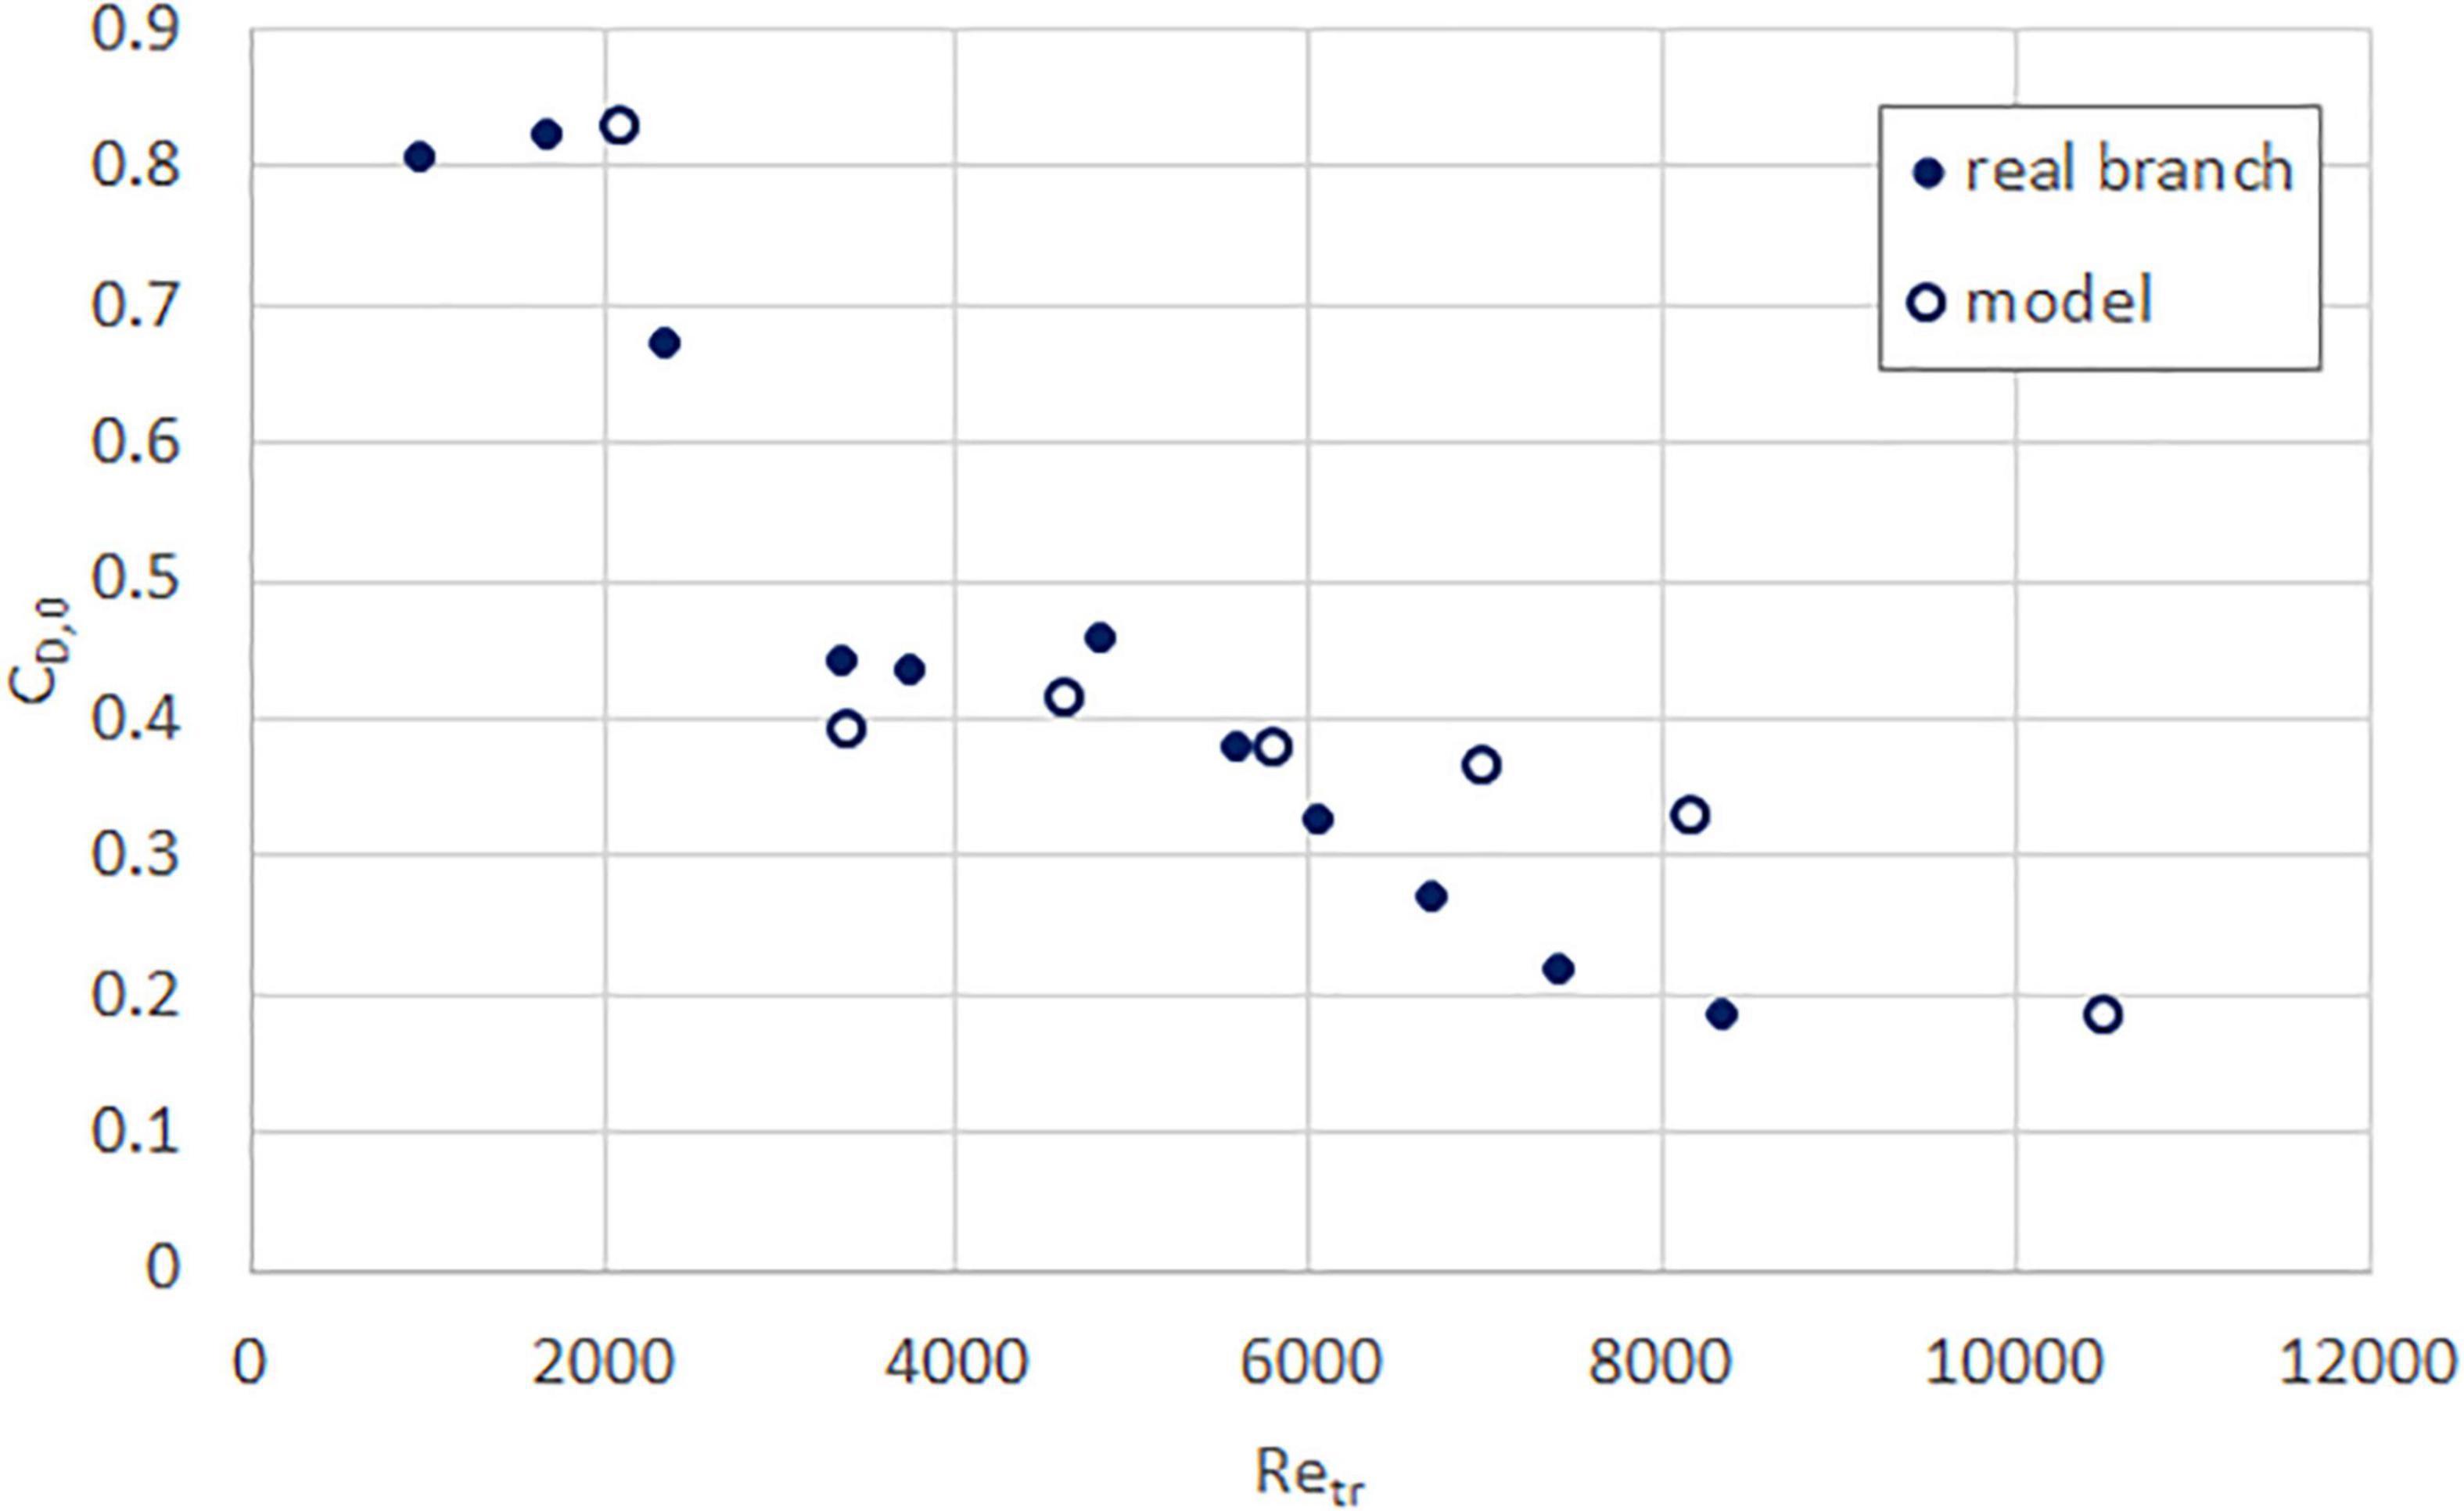
Figure 9. Drag coefficient as a function of trunk Reynolds number, for real (solid circle) and model (hollow circle) tembusu branches.
As the trunk Reynolds number increases, the drag coefficient decreases toward a plateau. This is reflective of the streamlining exhibited by all specimens, where the branches and leaves are blown into a smaller, approximately constant area with increasing wind speeds. Although this plateau is not yet achieved, both the real and model specimens appear to be approaching the same value. The value is different for each species, likely due to differences in branch structure and leaf type, although all are between 0 and 0.5.
Normalized Streamwise Deflection δx*
In the experiments, apart from streamwise deflection, all the specimens exhibited some deflection in the vertical and cross-stream directions also. However, we only present the normalized streamwise deflection here, in Figures 10–13, as these are typically much greater in magnitude. Perhaps unsurprisingly, although all specimens show the expected increase in deflection with Reynolds number, the similarity between real and model branches varies for each species. The sea apple (Figure 10) and rain tree (Figure 12) models both show more deflection than the real branch, the tembusu (Figure 13) deflection values are relatively similar for both real and model, while the yellow flame (Figure 11) model deflects less than the real branch. There is no similarity in behavior between species with simple or compound leaves. Thus, we believe that the mismatch in deflection is likely due to the fabricated models having a uniform Young’s modulus rather than the non-uniform range that real branches are likely to have.
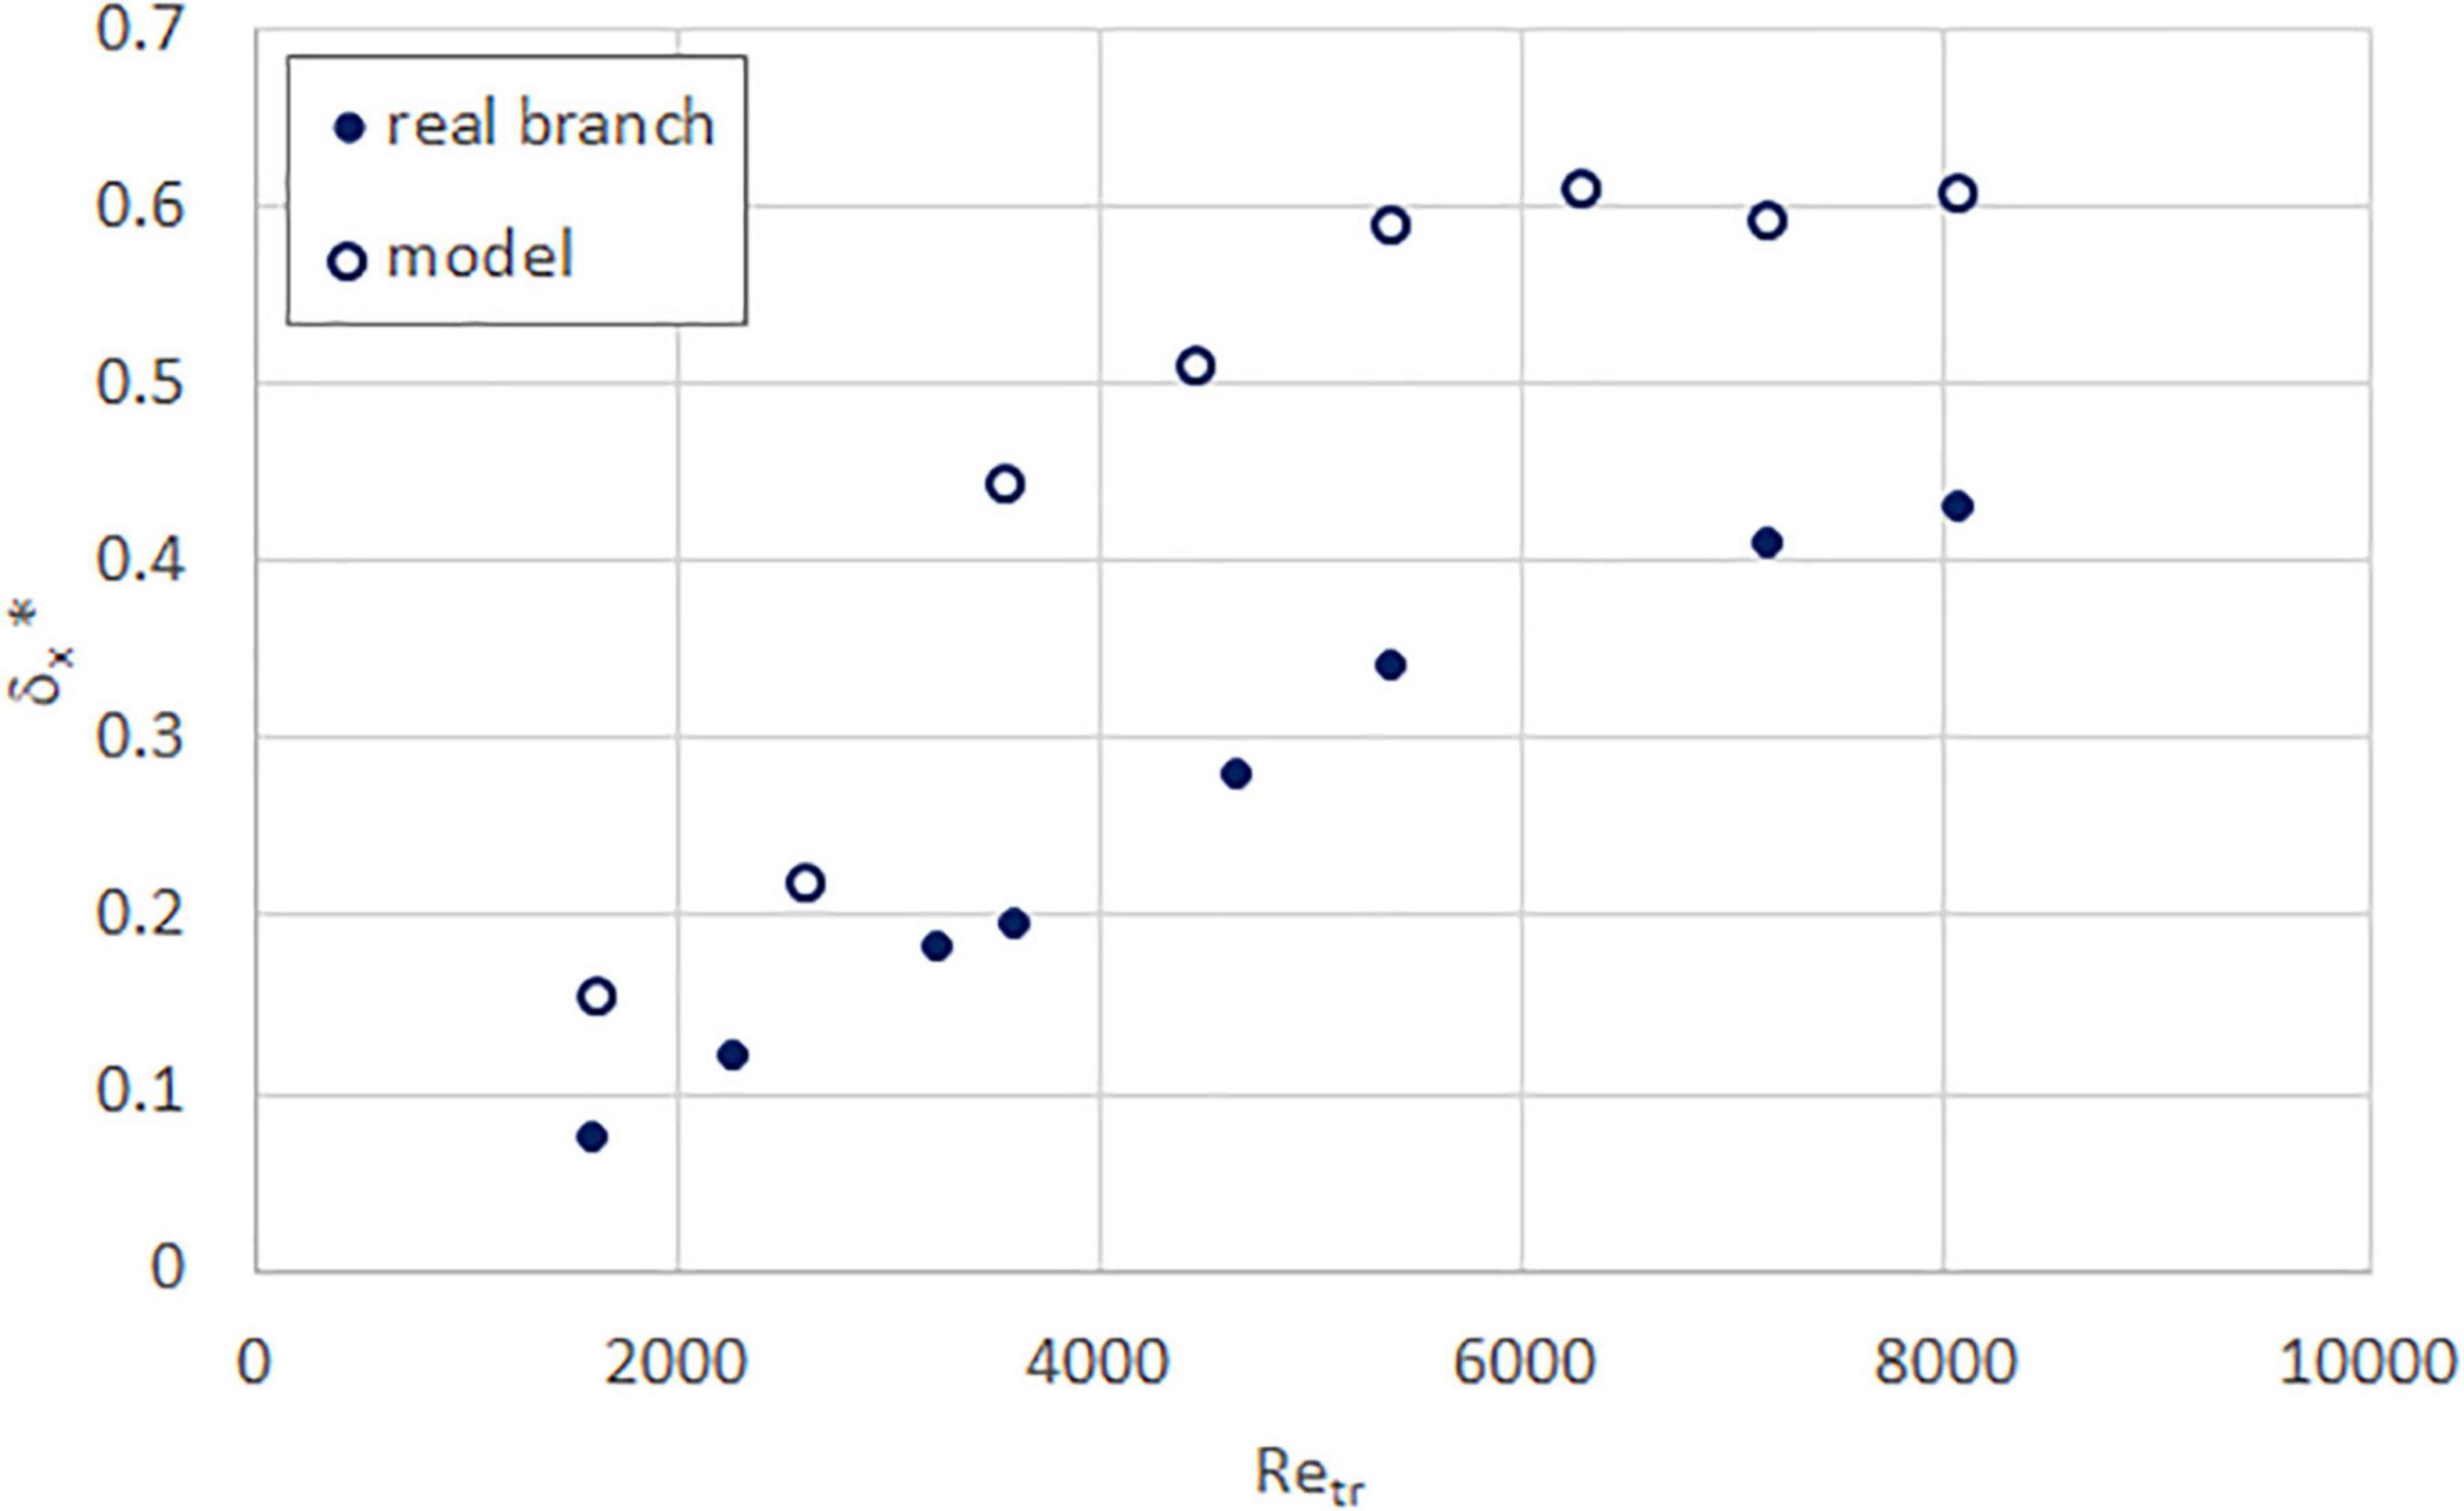
Figure 10. Normalized streamwise deflection as a function of trunk Reynolds number, for real (solid circle) and model (hollow circle) sea apple branches.
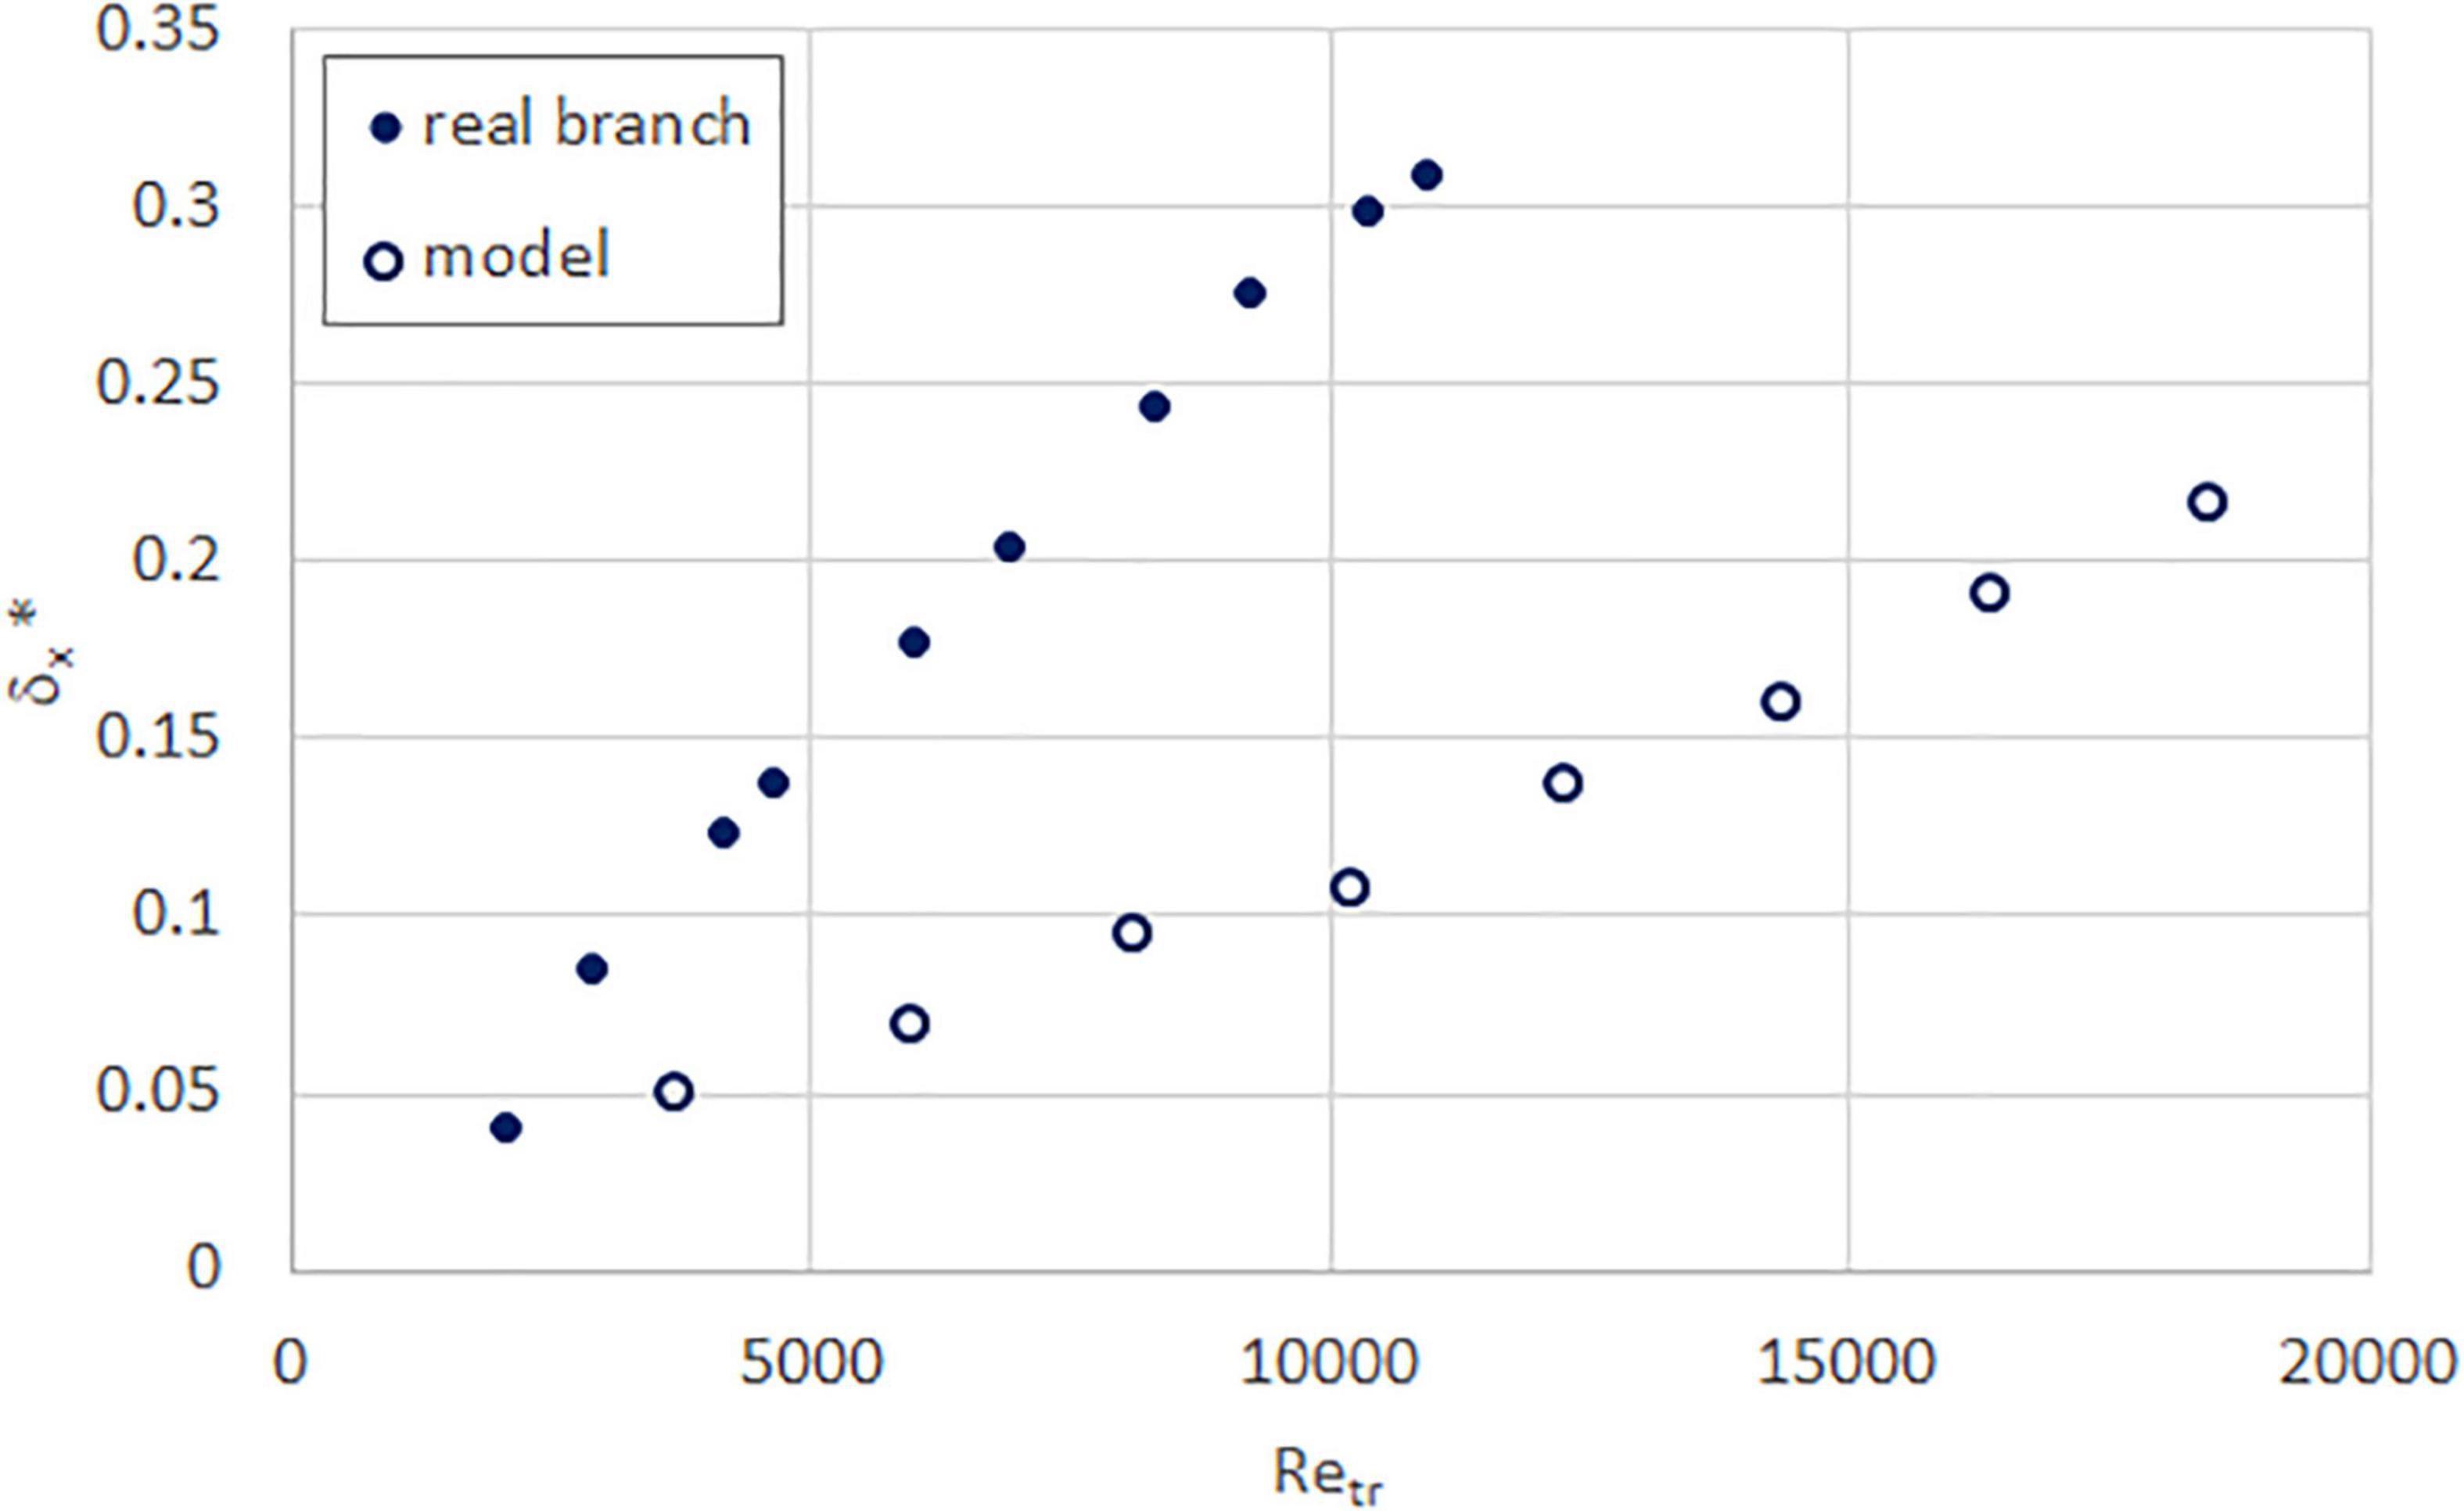
Figure 11. Normalized streamwise deflection as a function of trunk Reynolds number, for real (solid circle) and model (hollow circle) yellow flame branches.
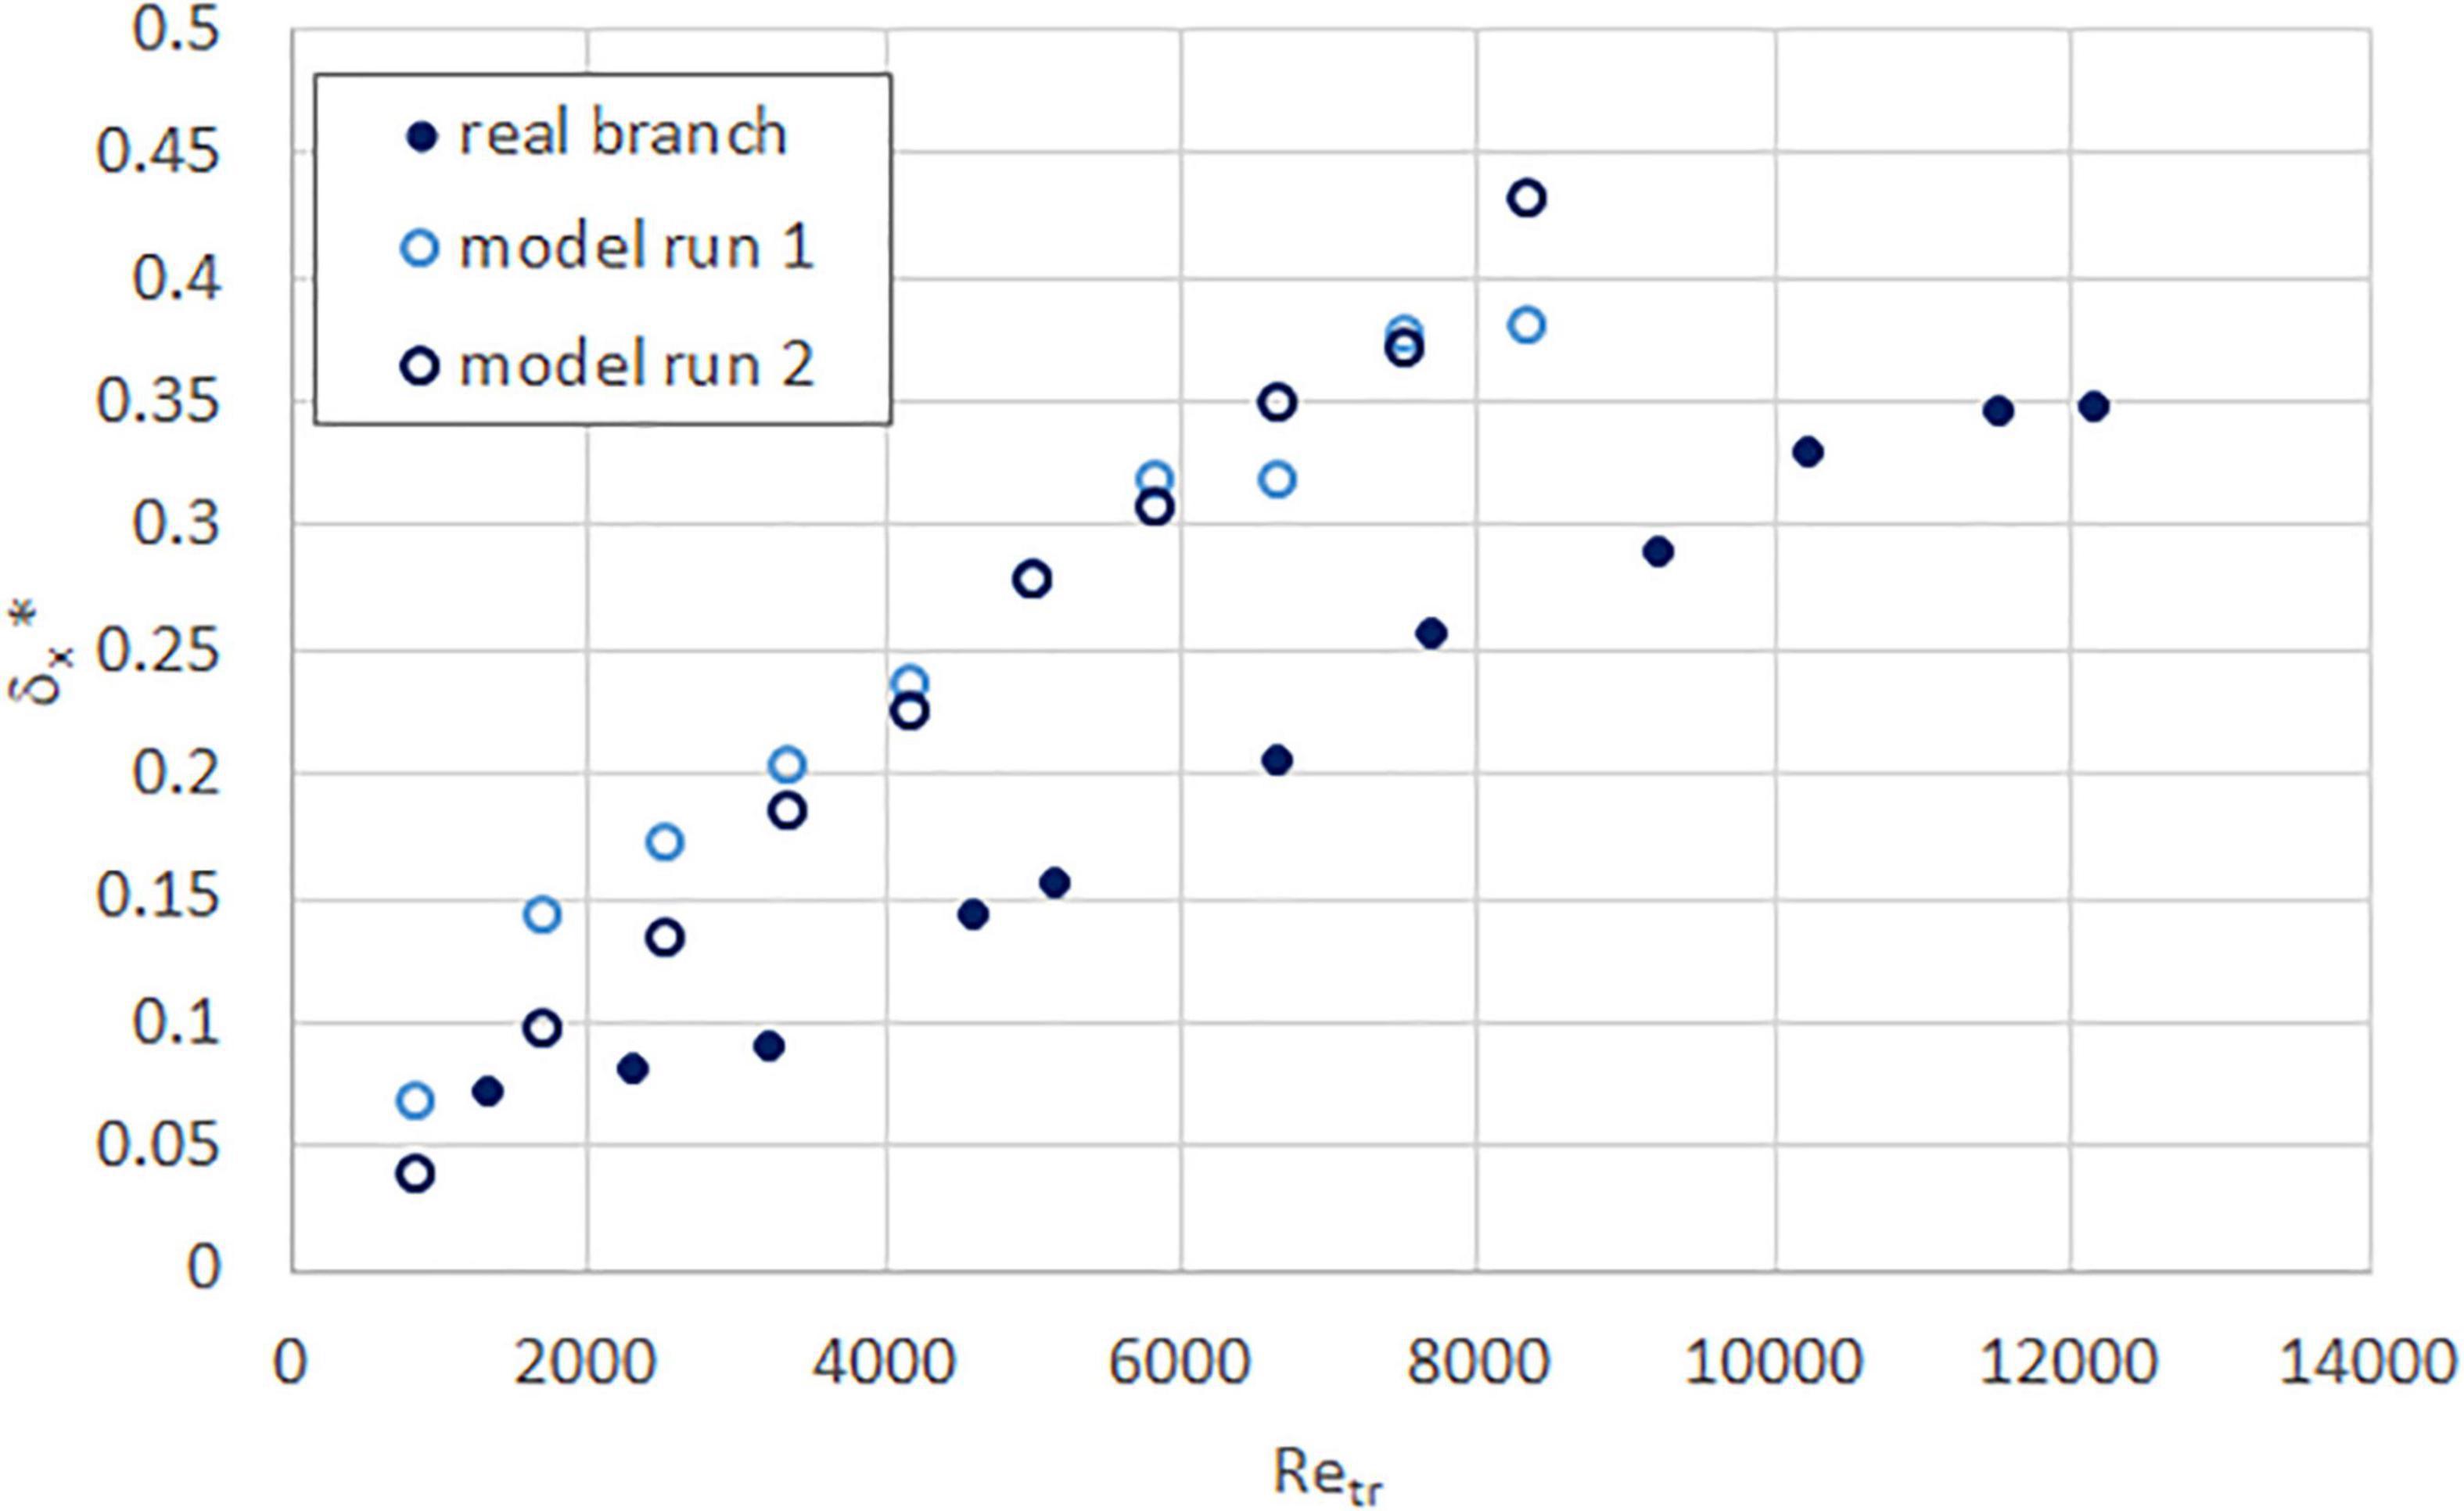
Figure 12. Normalized streamwise deflection as a function of trunk Reynolds number, for real (solid circle) and model (hollow circle) rain tree branches.
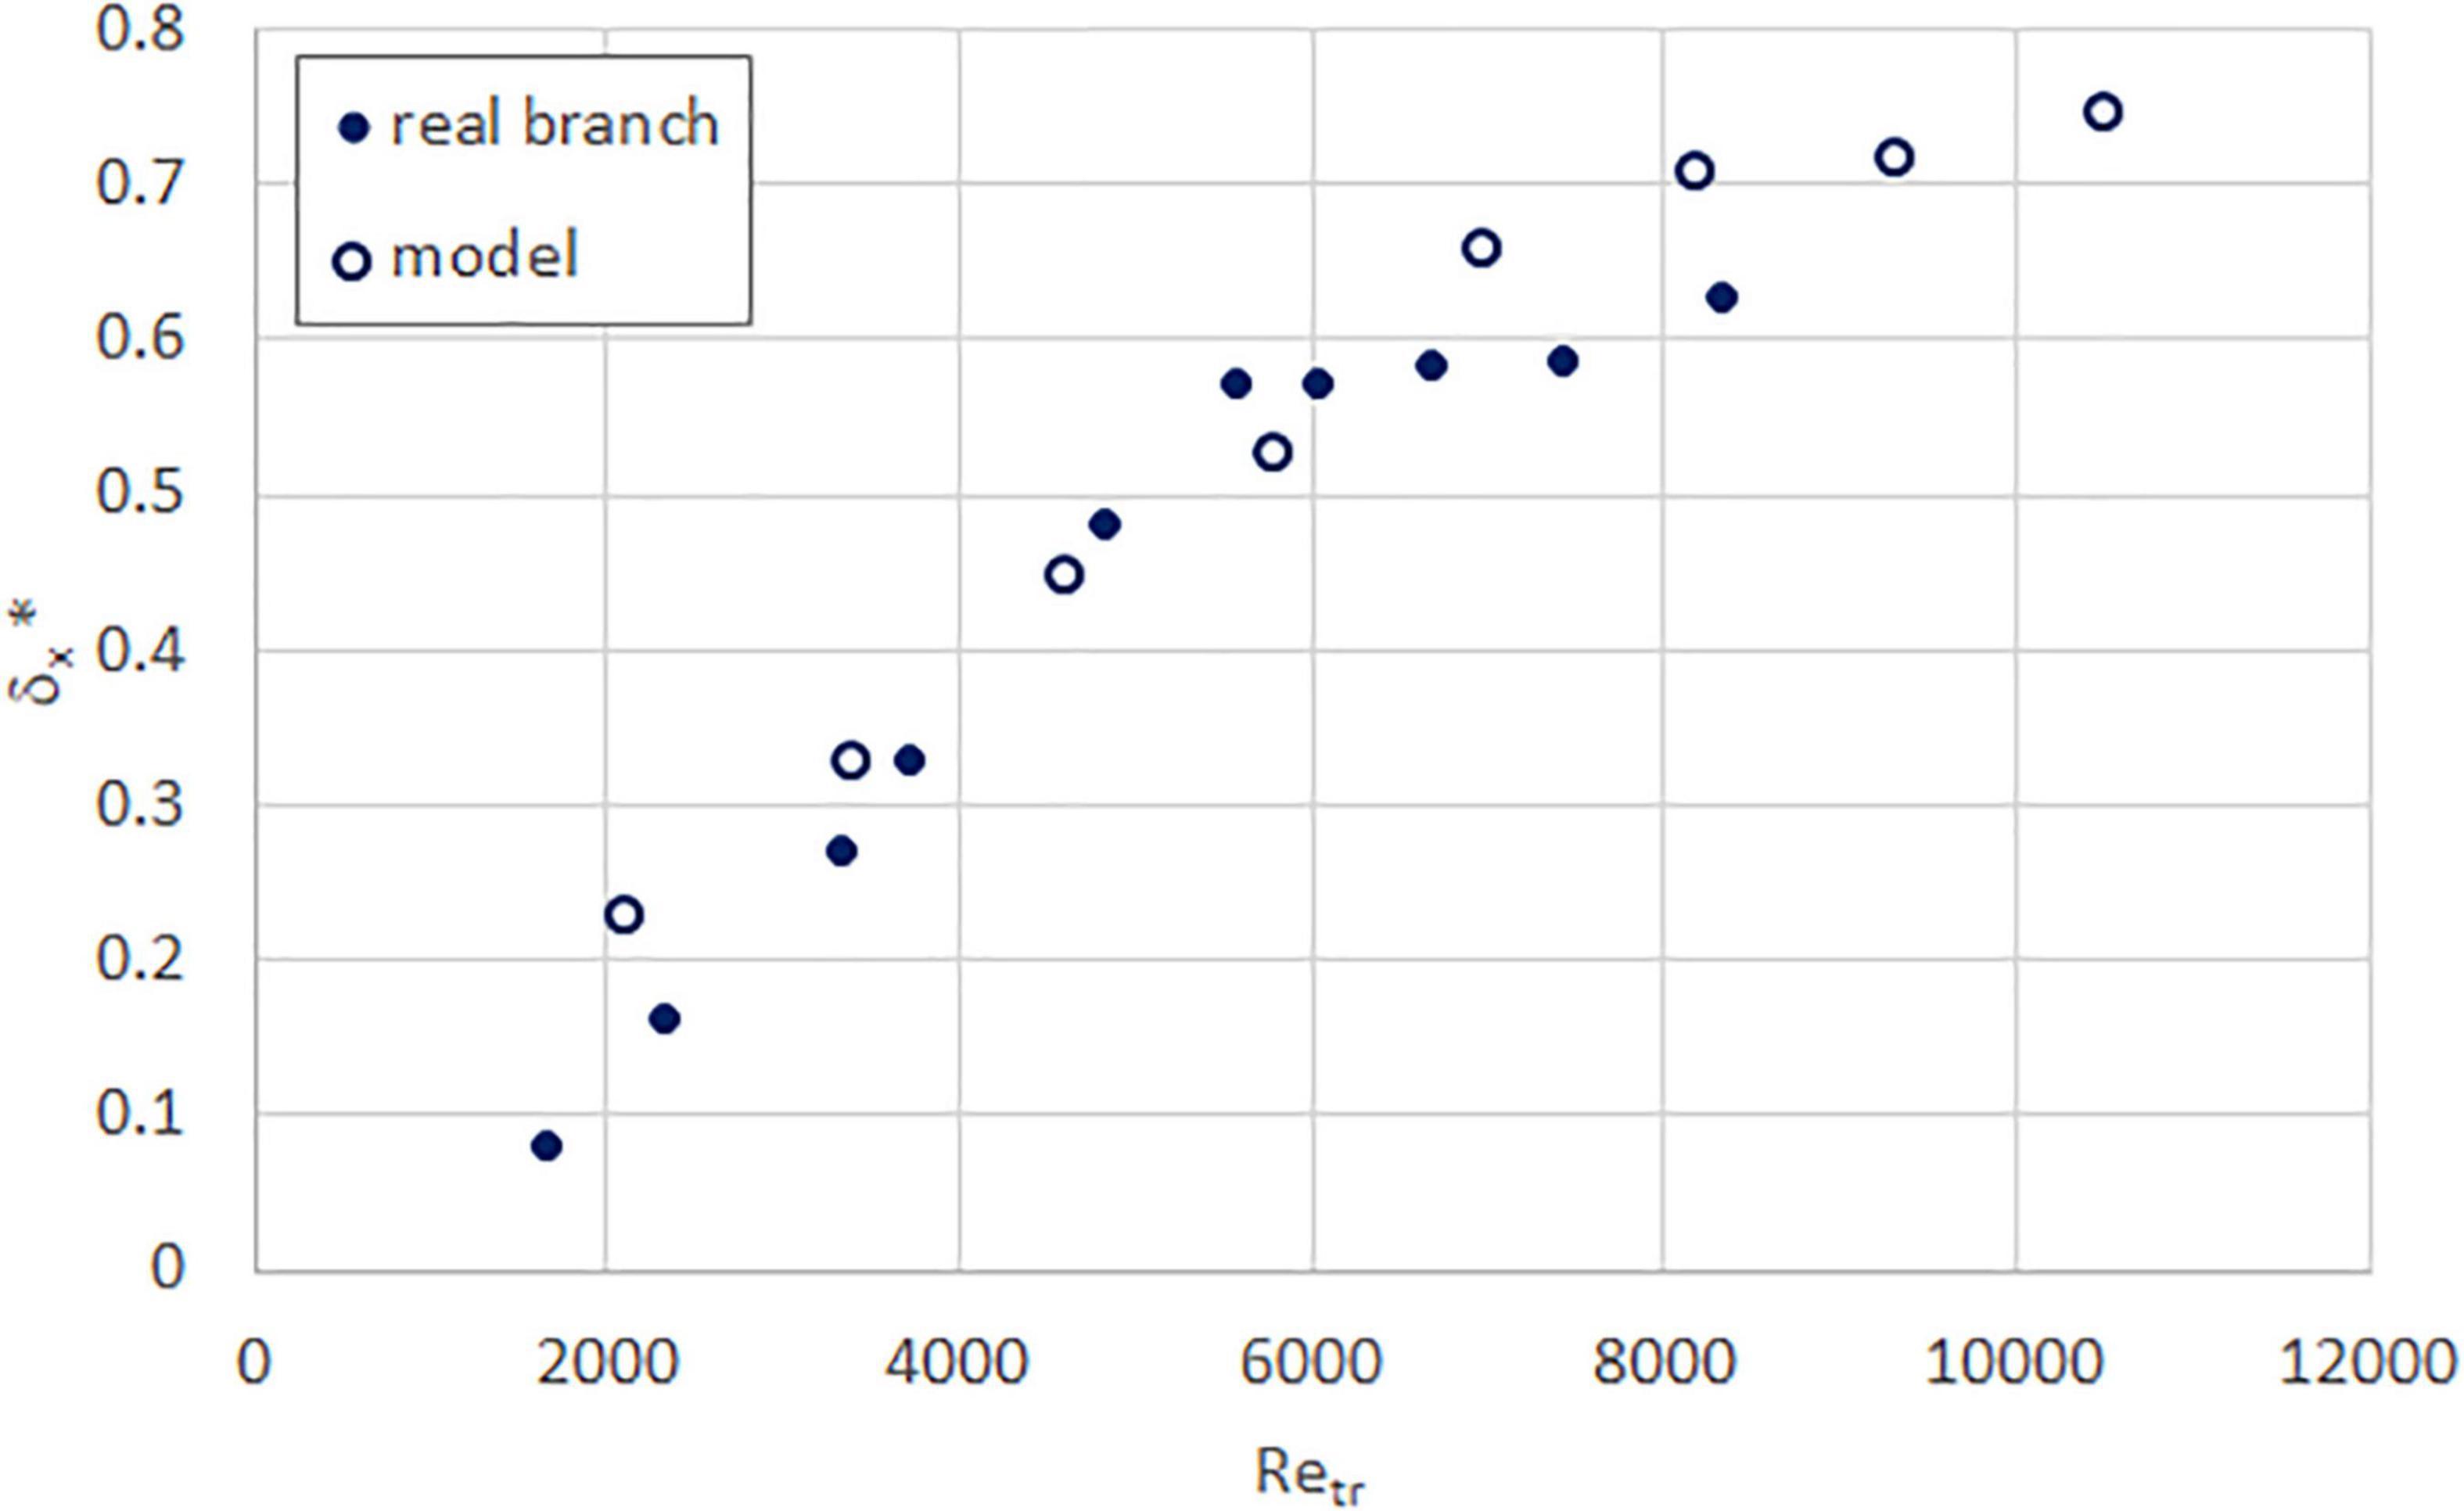
Figure 13. Normalized streamwise deflection as a function of trunk Reynolds number, for real (solid circle) and model (hollow circle) tembusu branches.
Discussion
Considering the observations from the graphs of streamwise force, drag coefficient, and normalized streamwise deflection, we conclude that the current model of tree branch – specifically, a 3D-printed or CNC-machined branch of uniform plastic with real leaves attached – is generally able to reproduce the drag coefficient of real branches. However, the models are still too crude to be able to exhibit similar values of deflection, perhaps because of the way the leaves are attached limiting their capability to reduce drag via streamlining.
For the four species in this paper, ABS may not be fully suitable as a representative “wood” material. From the photographs in Figure 1, we intuitively expect branches like tembusu to be more flexible than sea apple, and sea apple to be more flexible than the yellow flame. In terms of practical application, we would expect that the branches are only part of the crown and therefore the trunk would also come into play. However, given that trees grow both upward and concentrically, we expect that the stiffness of the bark would change with age. This also culminates in a great variation in material properties for a single tree, which is not easy to reproduce currently. If we are limiting our interest to just a single branch though, we find it promising that the experimental results obtained are of similar magnitude.
At this time, we have not come across any literature that compares empirical measurements of a solo model tree to that of a real tree (or branch, as in our case), which would be useful to us for comparison. The closest is the work by Dellwik et al. (2019), in which numerical simulations are made of a real, deciduous tree. Unfortunately, our results are not directly comparable primarily because their focus was on the wake flow behind the tree rather than drag force and deflection experienced by the tree. However, we do believe it worth noting that after matching the bending moment calculated from simulation to that of the real tree, Dellwik et al. found that the resulting local drag coefficient (from the simulations) varied between 0.264 and 0.389, for the three model resolutions and three flow domain grid resolutions tested. This variability indicates to us that the drag coefficient is a very sensitive parameter, and that although we think our results show relatively good similarity there is definitely still room for improvement.
One reviewer commented that our sample size is small; it is certainly true that having more species or, even better, more samples per species would provide a better perspective. However, due to project constraints, we were limited to one sample each of the four models presented here. Our statements are therefore more to give a general big picture of the solid models’ feasibility.
In the future, we plan to improve the solid model in two ways: (1) how to more closely represent the branch material, for instance by changing the internal structure rather than having it totally solid; and (2) a more realistic attachment of the leaves (real or artificial) such that they are secure yet still able to deflect naturally.
Conclusion
We believe that the current version of these solid models are fairly good for studying tree branches due to the similar reproduction of drag coefficients. Arguably, this is the most important of the measured parameters as they could be used (with the actual tree’s initial frontal area) to determine the force and thus stress experienced, which will then enable some determination of how close the branch is to breaking.
Data Availability Statement
The raw data supporting the conclusions of this article will be made available by the authors, without undue reservation.
Author Contributions
RM (research fellow) obtained the experimental data, YT, BW, YL, and JT (undergraduate students) under the supervision of DT (principal investigator). RM was responsible for the real branches, while the others were each responsible for one to two of the models. DL and DB (research collaborators) provided guidance and insight to the results. All authors contributed to the article and approved the submitted version.
Funding
This research was funded under the research collaboration agreement between the National University of Singapore, National Parks Board, and Institute of High Performance Computing, A*STAR; WBS no. R-265-000-649-490.
Conflict of Interest
The authors declare that the research was conducted in the absence of any commercial or financial relationships that could be construed as a potential conflict of interest.
Publisher’s Note
All claims expressed in this article are solely those of the authors and do not necessarily represent those of their affiliated organizations, or those of the publisher, the editors and the reviewers. Any product that may be evaluated in this article, or claim that may be made by its manufacturer, is not guaranteed or endorsed by the publisher.
Acknowledgments
We thank Poh Hee Joo, Bharathi Boppana, Calvin Lim, Hoang Huy, and other team members from the Institute of High Performance Computing, A*STAR, for discussions on the direction and findings of this research. We also thank Tanya Puri and Mohammad Azfar bin Saari for their wind tunnel work which preceded this phase of the research.
References
Angelou, N., Dellwik, E., and Mann, J. (2019). Wind load estimation on an open-grown European oak tree. Forestry 92, 381–392. doi: 10.1093/forestry/cpz026
Bai, K., Katz, J., and Meneveau, C. (2015). Turbulent flow structure inside a canopy with complex multi-scale elements. Boundary-Layer Meteorol. 155, 435–457. doi: 10.1007/s10546-015-0011-2
Bai, K., Meneveau, C., and Katz, J. (2013). Experimental study of spectral energy fluxes in turbulence generated by a fractal, tree-like object. Phys. Fluids 25:110810. doi: 10.1063/1.4819351
Dellwik, E., van der Laan, M. P., Angelou, N., Mann, J., and Sogachev, A. (2019). Observed and modeled near-wake flow behind a solitary tree. Agric. For. Meteorol. 265, 78–87. doi: 10.1016/j.agrformet.2018.10.015
Endalew, A. M., Hertog, M., Gebrehiwot, M. G., Baelmans, M., Ramon, H., Nicolaï, B. M., et al. (2008a). Modelling airflow within model plant canopies using an integrated approach. Comput. Electron. Agric. 66, 9–24. doi: 10.1016/j.compag.2008.11.002
Endalew, A. M., Hertog, M., Delele, M. A., Baetens, K., Persoons, T., and Baelmans, M. (2008b). CFD modelling and wind tunnel validation of airflow through plant canopies using 3D canopy architecture. Int. J. Heat Fluid Flow 30, 356–368. doi: 10.1016/j.ijheatfluidflow.2008.12.007
Hao, Y., Kopp, G. A., Wu, C. H., and Gillmeier, S. (2020). A wind tunnel study of the aerodynamic characteristics of a scaled, aeroelastic, model tree. J. Wind Eng. Ind. Aerodyn. 197:104088. doi: 10.1016/j.jweia.2019.104088
Hu, X.-Y., Tao, W.-M., and Guo, Y.-M. (2008). Using FEM to predict tree motion in a wind field. J. Zhejiang Univ. Sci. A 9, 907–915. doi: 10.1631/jzus.A0720035
Lim, C. W., Gobeawan, L., Wong, S. T., Wise, D. J., Cheng, P., Poh, H. J., et al. (2020). “Generation of tree surface mesh models from point clouds using skin surfaces,” in Proceedings of the 15th International Joint Conference on Computer Vision, Imaging and Computer Graphics Theory and Applications – Volume 1:GRAPP, (Valletta: VISIGRAPP). 83–92.
Morinaga, T., Tanaka, N., Yagisawa, J., Karunaratne, S., and Weerakoon, W. M. S. B. (2012). “Estimation of drag coefficient of trees considering the tree bending or overturning situations,” in Proceedings of International Symposium on Advances in Civil and Environmental Engineering Practices for Sustainable Development (ACEPS), (Matara: University of Ruhuna). 142–149.
Rubol, S., Ling, B., and Battiato, I. (2018). Universal scaling-law for flow resistance over canopies with complex morphology. Sci. Rep. 8:4430. doi: 10.1038/s41598-018-22346-1
Schneider, C. A., Rasband, W. S., and Eliceiri, K. W. (2012). NIH Image to ImageJ: 25 years of image analysis. Nat. Methods 9, 671–675. doi: 10.1038/nmeth.2089
Keywords: tree branches, solid models, wind tunnel, drag coefficient, deflection
Citation: Tan DS, Maiti R, Tan YW, Wong BZJ, Liew Y, Tan JH, Lee DT-T and Burcham DC (2022) General Feasibility of Physical Models of Tree Branches. Front. For. Glob. Change 5:835930. doi: 10.3389/ffgc.2022.835930
Received: 15 December 2021; Accepted: 22 February 2022;
Published: 30 March 2022.
Edited by:
Paul-Antoine Santoni, University of Corsica Pascal Paoli, FranceReviewed by:
Paulo Victor Souza, Instituto Federal do Rio de Janeiro, BrazilJianlin Liu, China University of Petroleum, Huadong, China
Like Gobeawan, A*STAR, Institute of High Performance Computing, Singapore
Copyright © 2022 Tan, Maiti, Tan, Wong, Liew, Tan, Lee and Burcham. This is an open-access article distributed under the terms of the Creative Commons Attribution License (CC BY). The use, distribution or reproduction in other forums is permitted, provided the original author(s) and the copyright owner(s) are credited and that the original publication in this journal is cited, in accordance with accepted academic practice. No use, distribution or reproduction is permitted which does not comply with these terms.
*Correspondence: Danielle S. Tan, mpetds@nus.edu.sg
†These authors have contributed equally to this work