 Jianqiang Zeng1,2,3†
 Wei Song1,2†
 Yanli Zhang1,2*
 Zhaobin Mu1,2Weihua Pang1,2,3Huina Zhang1,2
 Xinming Wang1,2,3
- 1State Key Laboratory of Organic Geochemistry and Guangdong Key Laboratory of Environmental Protection and Resources Utilization, Guangzhou Institute of Geochemistry, Chinese Academy of Sciences, Guangzhou, China
- 2Chinese Academy of Sciences (CAS) Center for Excellence in Deep Earth Science, Guangzhou, China
- 3College of Resources and Environment, University of Chinese Academy of Sciences, Beijing, China
Emission factors (Es) are among the major sources of uncertainty in regional or global emission estimates of biogenic volatile organic compounds (BVOCs). Tropical vegetation contributes approximately 70% of global BVOC emissions, yet in situ measurements of BVOC emissions from tropical tree species, especially naturally grown mature trees, are quite limited. In this study, BVOC emissions from twenty mature trees (15 evergreen broad-leaved and 5 evergreen needle-leaved) were measured using dynamic chambers, and the emitted BVOCs were collected using sorbent tubes and speciated with a thermal desorption-gas chromatography/mass spectrometry system (TD-GC/MS). Twenty BVOC compounds including, isoprene, 14 monoterpene (MT) species and 9 sesquiterpene (SQT) species were quantified to calculate their Es. The results showed that Eucalyptus urophylla had the largest Es of isoprene (26.47 ± 3.70 μg g–1 h–1) among all the measured trees, followed by Ficus hispida (20.74 ± 1.78 μg g–1 h–1), Syzygium hainanense (20.49 ± 1.36 μg g–1 h–1), Casuarina equisetifolia (18.70 ± 2.91 μg g–1 h–1), and Mangifera indica (11.71 ± 7.04 μg g–1 h–1). α-Pinene, β-pinene, and limonene were the most abundant MTs, of which the largest Es were observed for Magnolia denudata (8.33 ± 2.05 μg g–1 h–1), Castanopsis hystrix (5.29 ± 3.24 μg g–1 h–1), and Magnolia denudata (3.11 ± 1.07 μg g–1 h–1), respectively. The Es of SQTs for the measured trees were lower than 0.50 μg g–1 h–1 except for Magnolia denudata (1.10 ± 0.41 μg g–1 h–1). β-Caryophyllene was the most common SQT, with Magnolia denudata having the highest Es of 0.09 ± 0.03 μg g–1h–1. The localized Es for dominant tree species could be used to update BVOC emission factors for typical vegetation types and help improve BVOC emission estimates in typical subtropical regions and narrow their uncertainties.
Highlights
- BVOC emissions from subtropical tree species were measured in situ by a dynamic chamber.
- Fifteen evergreen broad-leaved and five needle-leaved mature trees were measured.
- Emission factors of speciated monoterpenes and sesquiterpenes were obtained.
1 Introduction
Terrestrial vegetation emits large amounts of biogenic volatile organic compounds (BVOCs), which play important roles in the biosphere and atmosphere (Loreto and Schnitzler, 2010). For plants, these compounds are infochemicals in communication with other organisms and can also provide protection against biotic and abiotic stresses (Niinemets, 2010a,b; Šimpraga et al., 2016). They can be oxidized by oxidants to form ozone and secondary organic aerosols (Di Carlo et al., 2004; Xu et al., 2015; Edwards et al., 2017; Hamilton et al., 2021; He et al., 2021; Zhang et al., 2022), and thus have profound impacts on regional air quality and climate change (Peñuelas and Staudt, 2010; Scott et al., 2017).
The global BVOC emissions from vegetation are estimated to be ∼1,000 Tg yr–1, of which approximately 70% is contributed by isoprene, monoterpenes (MTs) and sesquiterpenes (SQTs) (Guenther et al., 1995, 2012). There are large uncertainties in BVOC emission estimates, and in some specific regions, such as China, a factor of 3–5 may occur among different estimations (Klinger et al., 2002; Arneth et al., 2008; Guenther et al., 2012; Wang et al., 2017; Li et al., 2020). A measurement-model comparison study in China showed that there were geographical differences in the consistency between predicted and measured isoprene mixing ratios (Zhang et al., 2020). Previous studies have demonstrated that the emission factor (Es) is one of the most important factors that induces large gaps among different studies (Guenther et al., 2006, 2012; Tsui et al., 2009; Leung et al., 2010; Zheng et al., 2010; Wang et al., 2011, 2016, 2017; Situ et al., 2014; Li et al., 2020). For decades, a large number of field and laboratory measurements have been carried out worldwide to obtain Es of BVOCs, yet most measurements were conducted for temperate or boreal plants (Evans et al., 1982; Tarvainen et al., 2005; Helmig et al., 2006, 2007; 2013; Ortega et al., 2008; Guenther, 2013; Aydin et al., 2014; Mu et al., 2022). On a global scale, tropical trees account for about 18% of the forest area (Jardine et al., 2020), but they contribute approximately 70% of the total emissions of BVOCs and 80% of the emissions of isoprene and MTs (Guenther et al., 2012). Apart from higher emission rates of BVOCs relative to temperate and boreal regions, tropical regions have richer vegetation diversity with more uneven spatial distribution, and emissions of BVOCs in the tropics may have stronger spatial differences (Batista et al., 2019). However, to date, measurements of BVOC emissions from tropical trees are quite limited, and most of them were conducted in South America (the Amazon region), South Africa and India (Mu et al., 2022). In addition, due to limitations in measurement methods or experimental facilities, most field measurements for tropical trees only reported emissions of isoprene (Keller and Lerdau, 1999; Lerdau and Throop, 1999; Geron et al., 2002; Singh and Varshney, 2006; Singh et al., 2007, 2008), total MTs (Singh et al., 2011, 2014) and total SQTs, and lacked emissions of individual MT and SQT compounds (Guenther et al., 1996; Klinger et al., 1998, 2002; Otter et al., 2002; Harley et al., 2003, 2004; Varshney and Singh, 2003; Padhy and Varshney, 2005a,b; Jardine et al., 2020; Taylor et al., 2021). Due to their different reactivities in atmospheric oxidation processes (Atkinson and Arey, 2003; Di Carlo et al., 2004; Edwards et al., 2017), it is necessary to further characterize the emissions of MT or SQT monomers from tropical plants.
In the tropical/subtropical Asia, field measurements of BVOC emissions from trees were mostly conducted more than a decade ago based on static enclosure or leaf cuvettes (Yang et al., 2001; Klinger et al., 2002; Zhao et al., 2004; Huang et al., 2011), and laboratory measurements were conducted on seedlings (Tsui et al., 2009; Leung et al., 2010). The reported emission rates for isoprene and total MTs varied by up to several orders of magnitude. The reliability of static enclosure measurements is questionable in comparison with dynamic enclosure measurements (Niinemets et al., 2011; Li et al., 2019; Zeng et al., 2022). The laboratory control measurements for seedlings (Tsui et al., 2009; Leung et al., 2010), however, may not well-represent real-world emissions from mature trees under natural growing environments (Niinemets et al., 2011; Emmerson et al., 2016). In addition, default proportions of MTs and SQTs were widely adopted in the Model of Emissions of Gases and Aerosols from Nature (MEGAN) to estimate emissions of individual MTs/SQTs (Leung et al., 2010; Wang et al., 2011; Li and Xie, 2014; Situ et al., 2014; Li et al., 2020; Ma et al., 2021). Therefore, field measurements of BVOCs emissions in tropical/subtropical regions are far from satisfying the accurate, timely and detailed emission estimations of BVOCs.
In this study, we conducted field measurements of BVOC emissions in Guangdong Province, which is located in a tropical/subtropical area in south China with a forest coverage of 53.5% and relatively high BVOCs emissions (Li et al., 2020; Ma et al., 2021). However, there are large uncertainties in both the amounts and the compositions of BVOC emissions (Klinger et al., 2002; Li et al., 2020; Ma et al., 2021). Unlike previous studies in this region that mostly involved static enclosures with seedlings in the laboratory to measure emissions of isoprene and total MTs, the present study aims: (1) to obtain real-world emission factors of isoprenoids for dominant tropical/sub-tropical tree species under natural growing environments by applying a dynamic chamber that was systematically evaluated (Zeng et al., 2022); (2) to quantify the emission rates of individual MTs and SQTs along with isoprene; and (3) to provide the localized emission factors that can be used to update BVOC emission estimates in the region.
2 Materials and methods
2.1 Field measurements
The field measurements were carried out in a sub-tropical region, Guangdong Province (Figure 1A). Twenty species of mature trees, including 15 evergreen broad-leaved trees and 5 needle-leaved trees, were measured (Table 1 and Supplementary Table 1). These trees are 8–25 m in height and 4–60 years old, and they are among the dominant tree species in Guangdong Province (Figure 1B). As a tree species widely distributed in the tropical/subtropical regions of the world (He et al., 2000), Eucalyptus accounts for 24.11% of the forest area in Guangdong (Figure 1B). Other dominant broad-leaved trees in Guandong include Schima superba (1.98%), Acacia spp. (1.36%), and Casuarina equisetifolia (0.06%). Pines are widely distributed in boreal, temperate and subtropical areas. The dominant pines in Guangdong are Pinus massoniana (5.08%) and Pinus elliottii (3.28%); while the most abundant needle-leaved species is Cunninghamia lanceolata (10.41%) in Guangdong. According to the Ninth National Forest Inventory,1 the dominant tree species measured in this study are also widely distributed in other tropical/subtropical areas of southern China, such as Guangxi, Hainan, Yunnan, Jiangxi, and Fujian. In addition, we also measured some common tree species used in urban greening, such as Ficus spp., Mangifera indica, Syzygium sp., Caryota maxima and Magnolia denudata.
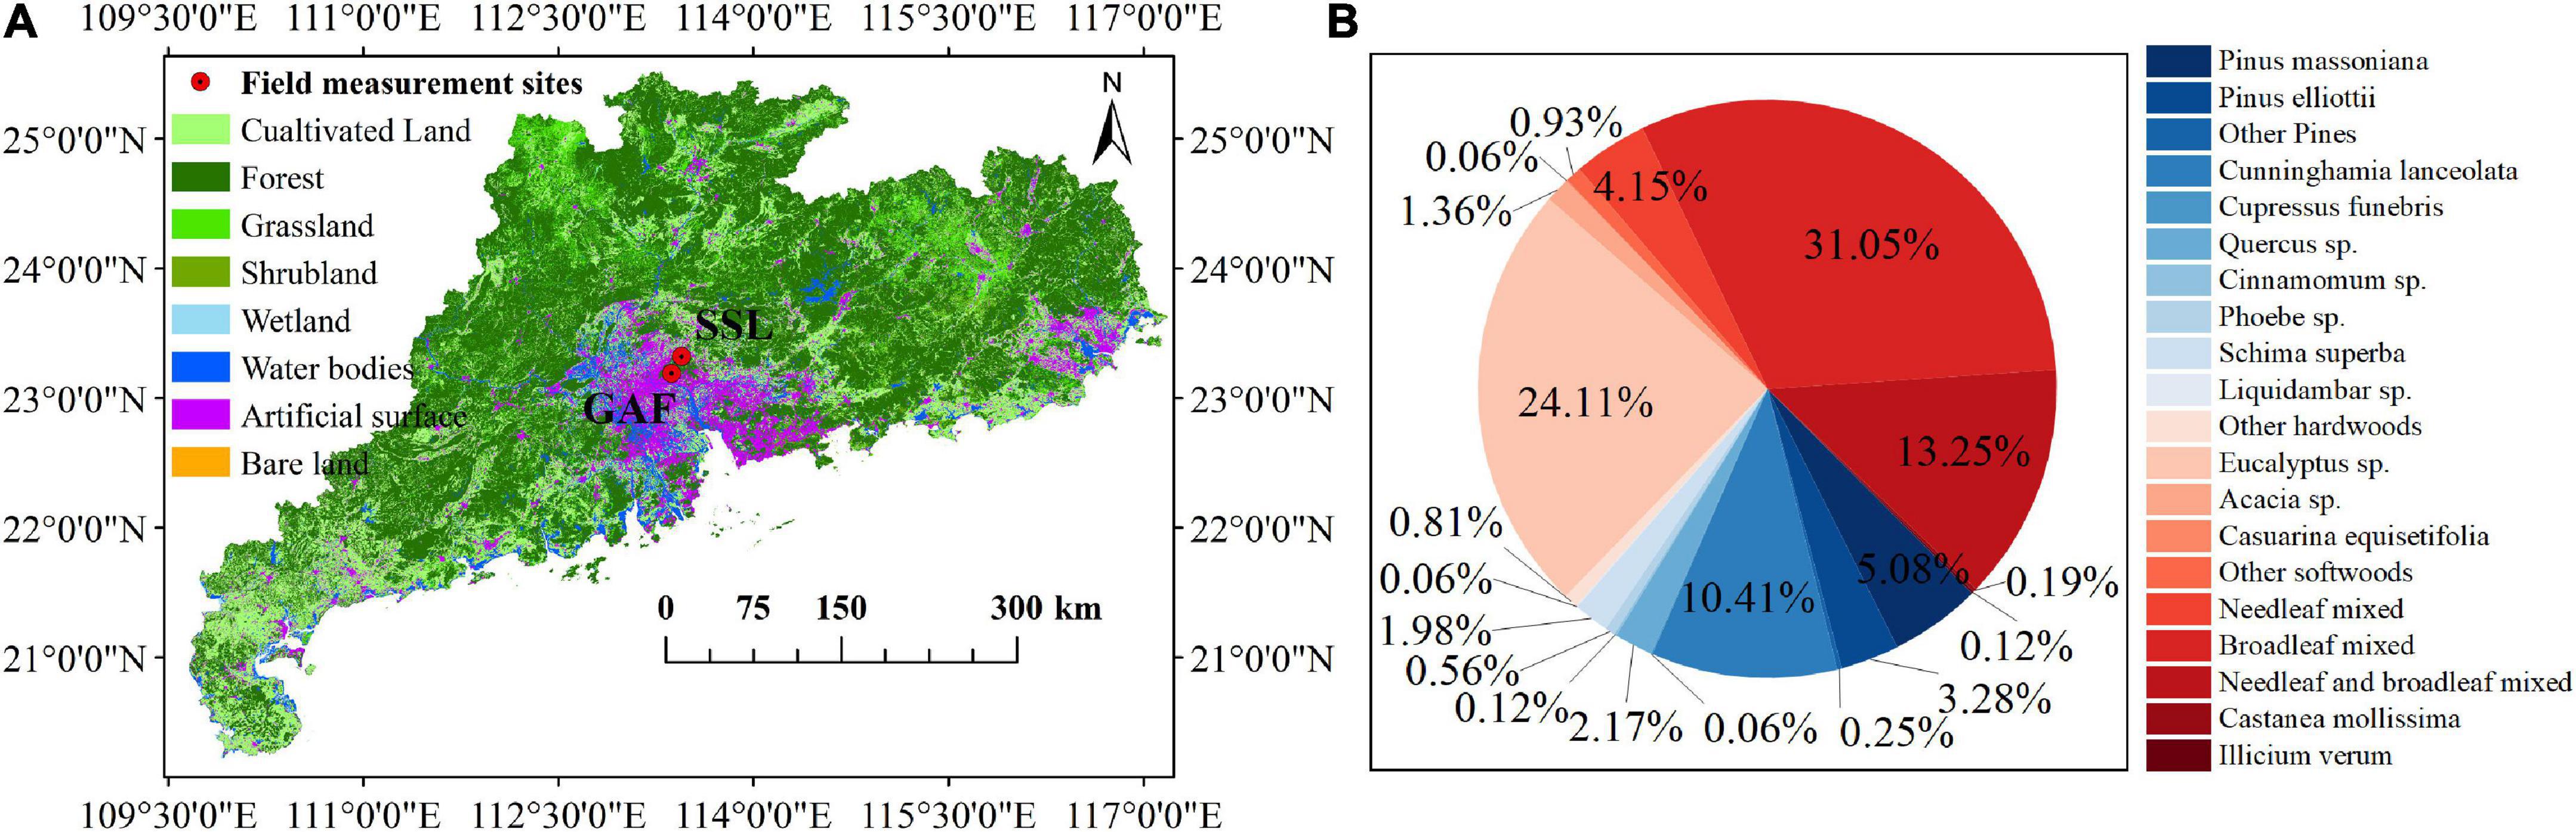
Figure 1. The locations of field campaigns. GAF and SSL are the abbreviations of the Guangdong Academy of Forestry (GAF, 23.195°N, 113.374°E) and Song Shu Ling (23.322°N, 113.450°E), respectively; Land cover data were downloaded from http://www.globallandcover.com/ (A); and the coverage (%) of dominant trees in Guangdong Province. Data were obtained from http://www.forestdata.cn (B).
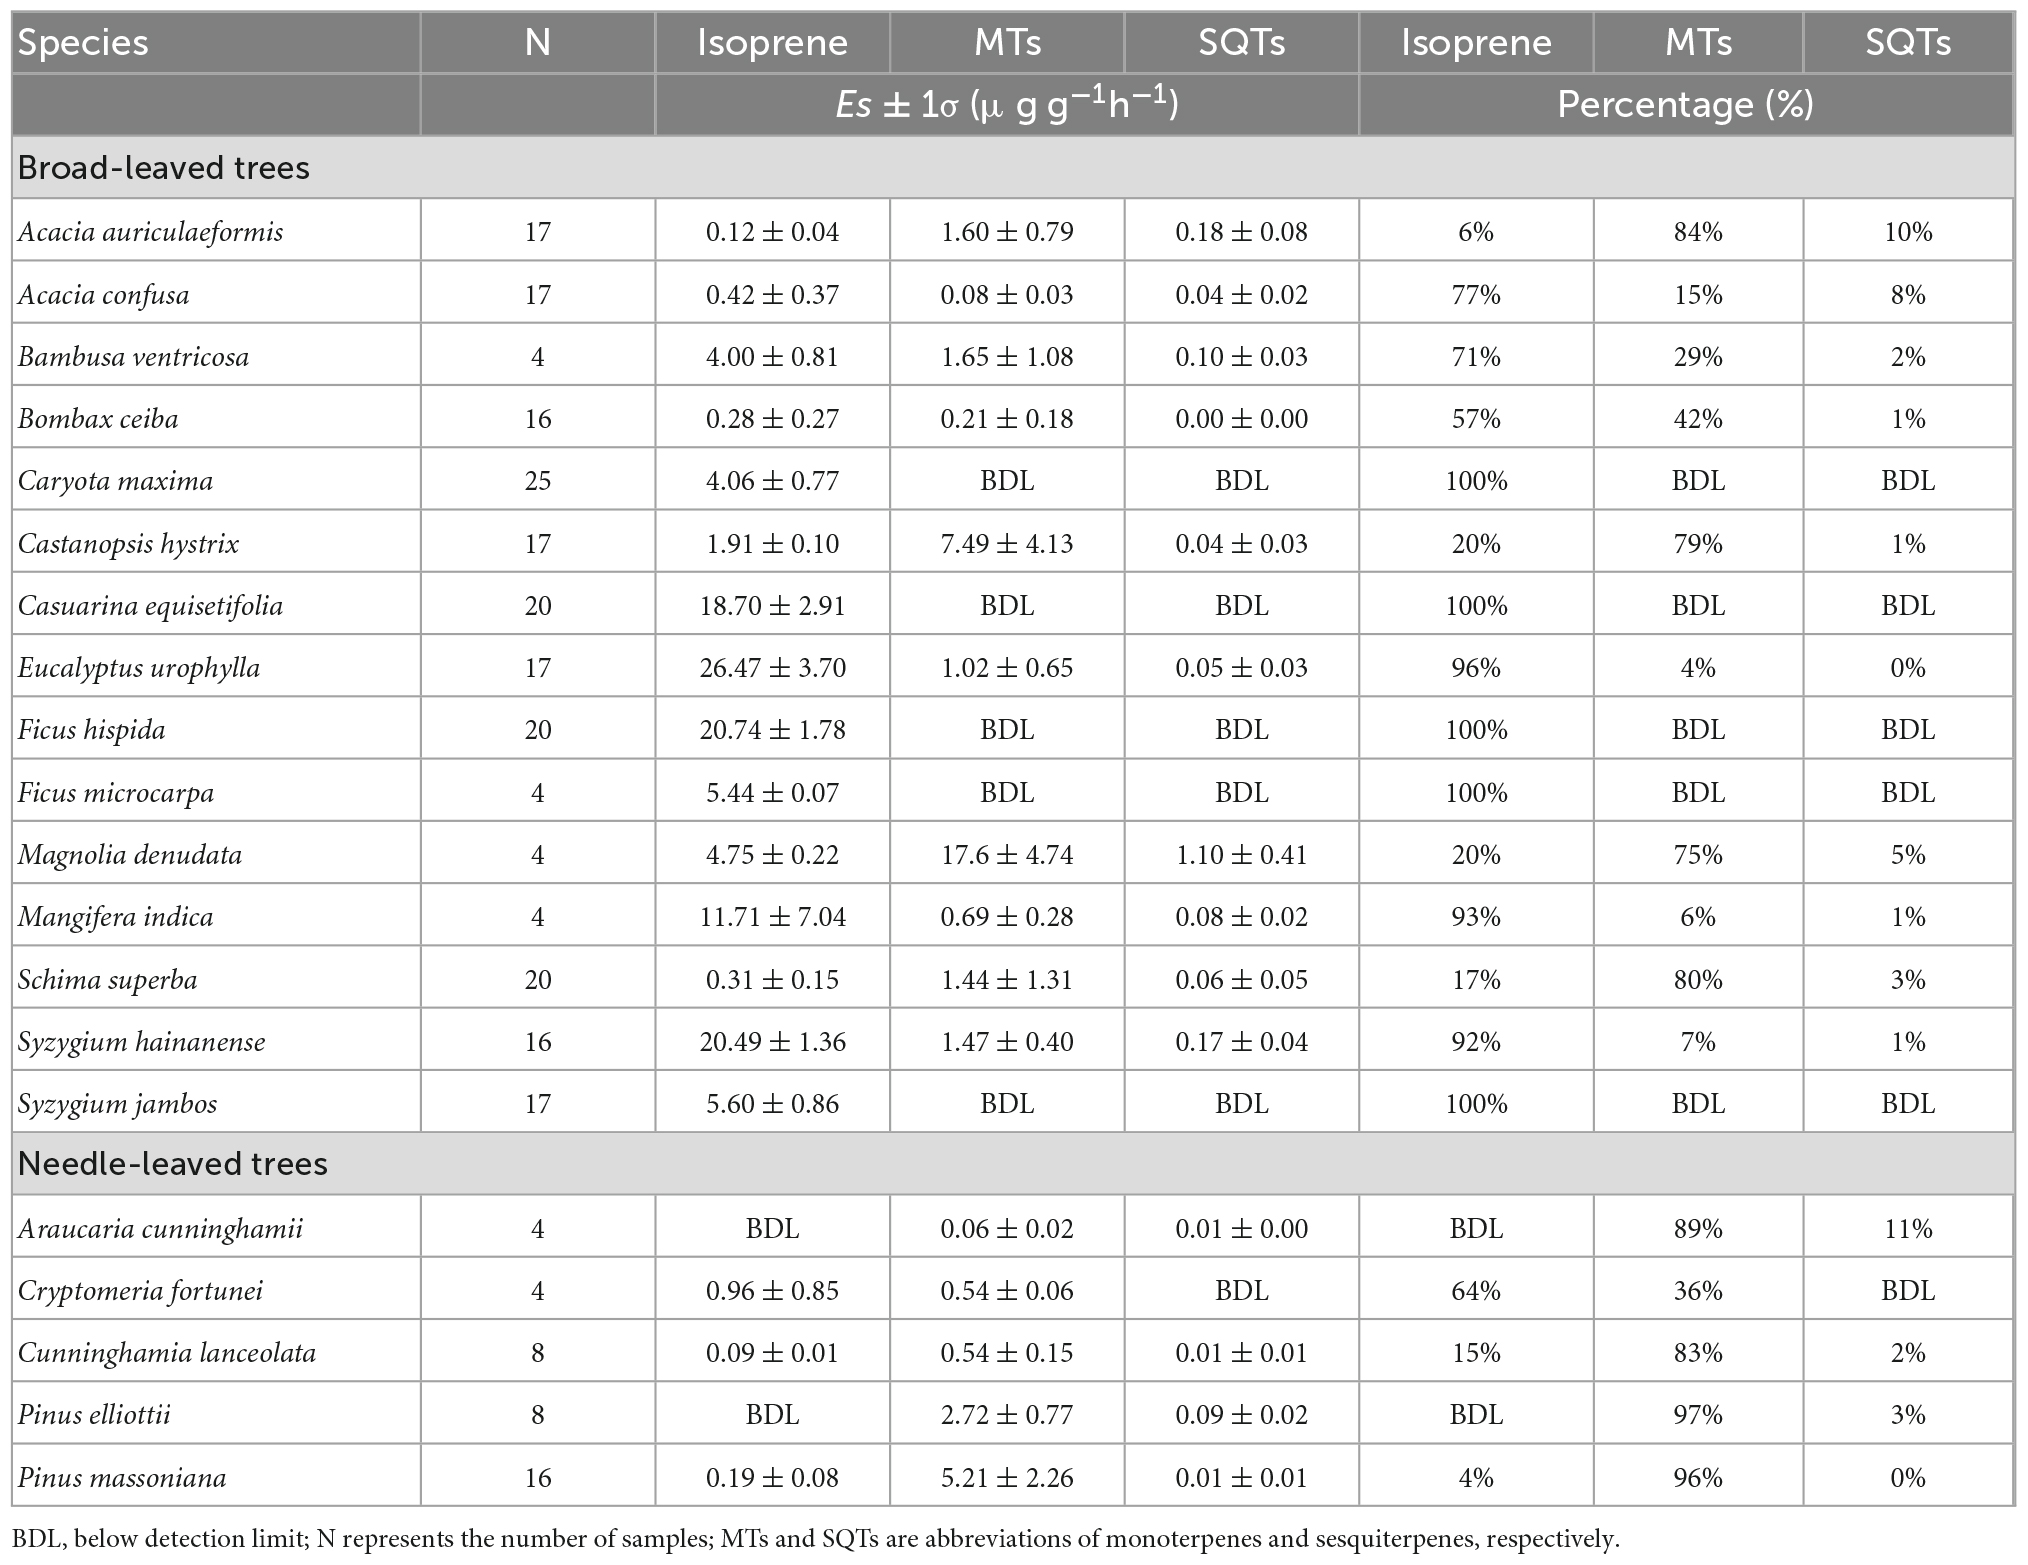
Table 1. Emission factors and percentages of isoprene, monoterpenes (MTs) and sesquiterpenes (SQTs) for the 20 measured trees.
Branch-level BVOC emissions were measured by a cylindrical semi-open dynamic chamber, which is made of polymethyl methacrylate with an inner surface coated with fluorinated ethylene propylene (FEP) Teflon film (FEP 100, Type 200A, DuPont, Witton, USA). Detailed information about the design and characterization of this dynamic chamber was described in our previous study (Zeng et al., 2022). Briefly, the chamber has a volume of 13.7 L with a diameter of 250 mm and a height of 280 mm, the flow of circulating air is maintained at a rate of 9 L min–1 by a mass flow controller (Alicat Scientific, Inc., Tucson, AZ, USA) connected to an air pump (MPU2134-N920-2.08, KNF, Freiburg, Germany). Air in the chamber is mixed by a Teflon fan (Shenzhen Shuangmu Plastic Material Co. Ltd., Shenzhen, China) to establish homogeneous chamber conditions. In the field, measurements were conducted from 9:00 a.m. to 17:00 p.m. (local time), sunlit healthy branches of 1–4 individuals for each tree species at a height of 3–5 m were enclosed in the chamber. Then, the chamber was initially flushed with ambient air for 1–2 h to avoid erratic emissions caused by artificial disturbance on the physiological state of the enclosed leaves and to ensure that the emissions in the chamber were stable (Niinemets et al., 2011). Subsequently, the chamber air flowed through an ozone scrubber (Na2S2O3, Helmig et al., 2007; Zeng et al., 2022), followed by an automatic sampler (JEC921, Jectec Science and Technology, Co., Ltd., Beijing, China) equipped with adsorbent cartridges with a constant flow rate of 200 mL min–1, and the emitted BVOCs were retained in commercial adsorbent cartridges bedded with Tenax TA (35/60 mesh, 150 mg) and Carbograph 5TD (35/60 mesh, 150 mg) (C2-AAXX-5149, Markes International Ltd., Bridgend, UK) for 10 min. Ambient air near the inlet was collected concurrently in the same way with another automatic sampler to determine the background concentration. The sampled adsorbent cartridges were detached from the automatic sampler, sealed with copper caps, and then stored in a portable refrigerator at 4°C in the field and at −20°C after being taken to the laboratory. Temperature and relative humidity in the chamber were measured by sensors (HC2A-S, Rotronic, Bathersdorf, Switzerland). A light sensor (Li-1500; Li-Cor Inc., Lincoln, USA) was installed on the top of the chamber to monitor the photosynthetically active radiation (PAR). The sampled branches were cut and taken to the laboratory where they were oven-dried at 60°C to constant weights.
2.2 Laboratory analysis
In the laboratory, cartridge samples were analyzed by an automatic thermal desorption system (TD-100, Markes International Ltd., Bridgend, UK) coupled to a mode 7,890 gas chromatography (GC) with a model 5,975 mass selective detector (MSD) (Agilent Technologies, Inc., CA, USA). The adsorbent cartridges were thermally desorbed by the TD-100 at 280°C for 10 min and then the desorbed analytes were transferred by pure helium into a cryogenic trap (U-T11PGC-2S, Markes International Ltd., Bridgend, UK) at −10°C. Then the trap was rapidly heated to transfer the analytes to the GC/MSD system with an HP-5MS capillary column (30 m × 0.25 mm × 0.25 μm, Agilent Technologies, CA, USA). The GC oven temperature was programmed to be initially at 35°C (held for 3 min), then increased to 100°C at 5°C min–1 and held for 3 min, to 150°C at 10°C min–1 and held for 3 min, and then to 280°C with a final hold time of 2.5 min. The MSD was operated under the mode of selected ion monitoring (SIM) with ionization of electron impacting at 70 eV. Target compounds were identified by comparing their retention times with authentic standards (Supplementary Table 2 and Supplementary Figure 1); and the specific ions for each BVOC species are shown in Supplementary Table 3. Target compounds are quantified with standard calibration curves. More detailed descriptions of the identification and quantification were provided in our previous study (Zeng et al., 2022).
2.3 Quality assurance and quality control (QA/QC)
The cartridges were conditioned with pure helium at a flow rate of 100 mL min–1 for 60 min at 330°C. To ensure that each group of cartridges had been cleaned, one of them was extracted randomly and analyzed in the same way as the field samples with TD-GC/MSD. If the target compounds were higher than the detection limits, re-cleaning of this group of cartridges was performed. During sampling, a field blank was collected by installing the cartridge onto the automatic sampler for 10 min but without air flow across it. To check if there was any breakthrough during sampling, two cleaned cartridges were connected in series to collect BVOC samples in the same way as the other field samples. The results showed that target compounds were not detected or were below the method detection limits (MDLs) in the second cartridge. Two repeated analyses of the same samples showed that the target compounds in the second analysis were less than 1% of those in the first analysis. Each day, one-point calibration was performed to ensure that the retention times of the target compounds did not deviate. The instrument detection limits (IDLs) were determined by seven parallel analyses of standards with a concentration of 0.5 μg mL–1. The IDLs vary from 0.011 to 0.109 ng for MTs and from 0.002 to 0.016 ng for SQTs. The measurement precision varied from 3 to 9% for MTs and from 3 to 15% for SQTs. Based on a sampling volume of 2 L, the MDLs ranged from 5 to 17 ng m–3 for MTs and from 1 to 8 ng m–3 for SQTs. For isoprene, the MDL and measurement precision were 56 ng m–3 and 1%, respectively (Zeng et al., 2022).
2.4 Calculation of emission rates and emission factors
The BVOC emission rates (E, μg g–1 min–1) can be calculated according to the following equation:
where F (L min–1) is the flow rate of circulating air, Cin (μg L–1) and Cout (μg L–1) are the BVOC concentrations of inlet air and outlet air, respectively; and gdw is the dry mass of the leaves in the chamber. The standardized emission rates, also called basal emission rates or emission factors (Es) in models, are calculated by Eq. (2) for isoprene (Guenther et al., 1993). The algorithm for light-and temperature-dependent compounds, such as isoprene, is expressed as:
where E (μg g–1 h–1) is the emission rate at actual leaf temperature and light, Es (μg g–1 h–1) is emission rate under standard conditions (30°C and 1,000 μmol m–2 s–1), and CT and CL are the light and temperature dependences of isoprene emission, respectively, which can be calculated by Eqs. (3) and (4), respectively. CT is expressed as:
where T is the temperature inside the chamber, Ts is the leaf temperature under standard conditions (303.15 K), R is the ideal gas constant (8.314 J K–1 mol–1), and CT1, CT2, and TM are empirical coefficients of 95,000 J mol–1, 230,000 J mol–1, and 314 K, respectively. CL is expressed as:
where Q (μmol m–2 s–1) is the quantum flux density. Both α (0.0027) and CL1 (1.066) are empirical coefficients. The algorithm for temperature-dependent compounds, such as MTs and SQTs, is expressed as:
where β is an empirical coefficient that reflects the exponential relationship between emission rates and temperature. In the present study, β values of 0.1 K–1 and 0.17 K–1 were applied to calculate theEs of MTs and SQTs, respectively (Ortega et al., 2008; Guenther et al., 2012).
For the comparison of canopy-scale emission factors (EFs, μg m–2 h–1) in the models, the leaf Es (μg g–1 h–1) were up-scaled to canopy-scale EFs according to the widely used Eq. 6 below (Guenther et al., 1995; Harley et al., 2004; Wang et al., 2016; Purser et al., 2021):
where EFs is the canopy-scale (landscape) emission factor; Es is the standard leaf emission factor calculated in this study; SLM is the specific leaf mass (g m–2); and LAI is the leaf area index (m2 m–2).
3 Results and discussion
3.1 Standardized BVOC emission rates (Es)
Among the 20 tree species measured, 18 species are isoprene emitters, while 15 and 14 species are MT and SQT emitters, respectively (Table 1). Isoprene and MTs accounted for over 85% of BVOC emissions for all species, and SQTs accounted for less than 15% of the total emissions. All 15 broad-leaved trees were found to emit isoprene, and consistent with previous studies reporting that broad-leaved trees mainly emit isoprene (Aydin et al., 2014; Yuan et al., 2020), BVOC emissions from 11 of the 15 broad-leaved trees were dominated by isoprene: F. hispida, S. jambos, F. macrocarpa, C. equisetifolia, and C. maxima are isoprene-only emitters; BVOC emissions from Eucalyptus urophylla, M. indica, S. hainanense, A. confuse, Bombax ceiba, Bambusa ventricosa, and Cryptomeria fortunei are dominated by isoprene (> 50%). In contrast, BVOC emissions from needle-leaved species such as P. massoniana, P. elliottii and C. lanceolata are dominated by MTs (> 80%). However, some broad-leaved species, such as A. auriculaeformis, Castanopsis hystrix, S. superba and M. denudata, emitted more MTs than isoprene. In fact, MTs have also been reported previously as major BVOCs from broad-leaved trees including Quercus coccifera, Q. ilex, Q. aucheri and Ligustrum vicaryi (Staudt and Lhoutellier, 2011; Yaman et al., 2015; Jing et al., 2020).
The Es of isoprene for isoprene emitters ranged from 0.09 ± 0.01 (C. lanceolata) to 26.47 ± 3.70 μg g–1h–1 (E. urophylla) (Table 1). Other broad-leaved trees, such as F. hispida, S. hainanense, C. equisetifolia and M. indica, also showed relatively higher isoprene emissions, with Es values of 20.74 ± 1.78, 20.49 ± 1.36, 18.70 ± 2.91, and 11.71 ± 7.04 μg g–1h–1, respectively. Meanwhile, the Es of MTs ranged from 0.06 ± 0.02 (Araucaria cunninghamii) to 17.60 ± 4.74 μg g–1h–1 (M. denudata) for MT emitters. Higher emissions of MTs were also observed from C. hystrix (7.49 ± 4.13 μg g–1h–1), P. massoniana (5.21 ± 2.26 μg g–1h–1), and P. elliottii (2.72 ± 0.77 μg g–1h–1). The Es of SQTs were less than 0.5 μg g–1h–1 for all measured tree species except for M. denudata with an Es of 1.10 ± 0.41 μg g–1h–1.
It is worth noting that the reported Es of isoprene and MTs were highly variable among different studies, even for the same tree species (Table 2). For example, isoprene emissions from C. maxima varied from 1.88 μg g–1h–1 (Huang et al., 2011) to as high as 250 μg g–1h–1 (Klinger et al., 2002), and emissions of MTs from S. superba ranged from 0.16 to 119 μg g–1h–1 (Yang et al., 2001; Klinger et al., 2002; Zhao et al., 2004). In this study, the Es of isoprene for A. auriculaeformis, A. confuse, C. maxima, F. hispida, F. microcarpa, S. superba, and P. massoniana were comparable or within the ranges in previous studies (Bai et al., 2001; Yang et al., 2001; Klinger et al., 2002; Zhao et al., 2004; Baker et al., 2005; Tsui et al., 2009; Leung et al., 2010; Huang et al., 2011). However, the Es of isoprene for E. urophylla (26.47 ± 3.70 μg g–1h–1) in this study was much higher than those of 0.45 μg g–1h–1 (Yang et al., 2001) or 1.40 μg g–1h–1 (Zhao et al., 2004), while the Es of isoprene for C. maxima (4.06 ± 0.77 μg g–1h–1) in this study was much lower than the previously reported 56.1–250 μg g–1h–1 (Bai et al., 2001; Klinger et al., 2002). The Es of MTs from P. massoniana (5.21 ± 2.26 μg g–1h–1) in this study were significantly higher than those of 0.96 μg g–1h–1 in Yang et al. (2001), 1.00 μg g–1h–1 in Zhao et al. (2004) and 1.39 μg g–1h–1 in Huang et al. (2011) but lower than that of 11.50 μg g–1h–1 in Klinger et al. (2002). In this study, the Es of the SQTs for the measured tree species (0.01–1.10 μg g–1h–1) are within the ranges (0.0028–1.25 μg g–1h–1) in previous studies (Ortega et al., 2008; Ormeno et al., 2010; Aydin et al., 2014). For the typical needle-leaved trees, P. massoniana and P. elliottii had SQT Es of 0.01 ± 0.01 and 0.09 ± 0.02 μg g–1h–1, respectively, which on average are near those for pine trees in Turkey (0.0059–0.16 μg g–1h–1; Aydin et al., 2014), but lower than those for pine trees in the USA (< 0.004–0.35 μg g–1h–1; Helmig et al., 2007). The Es of SQTs for E. urophylla in our study (0.05 ± 0.03 μg g–1h–1) lies in the middle range of Es for E. globulus (0.01–1.2 μg g–1h–1) reported by Ortega et al. (2008).
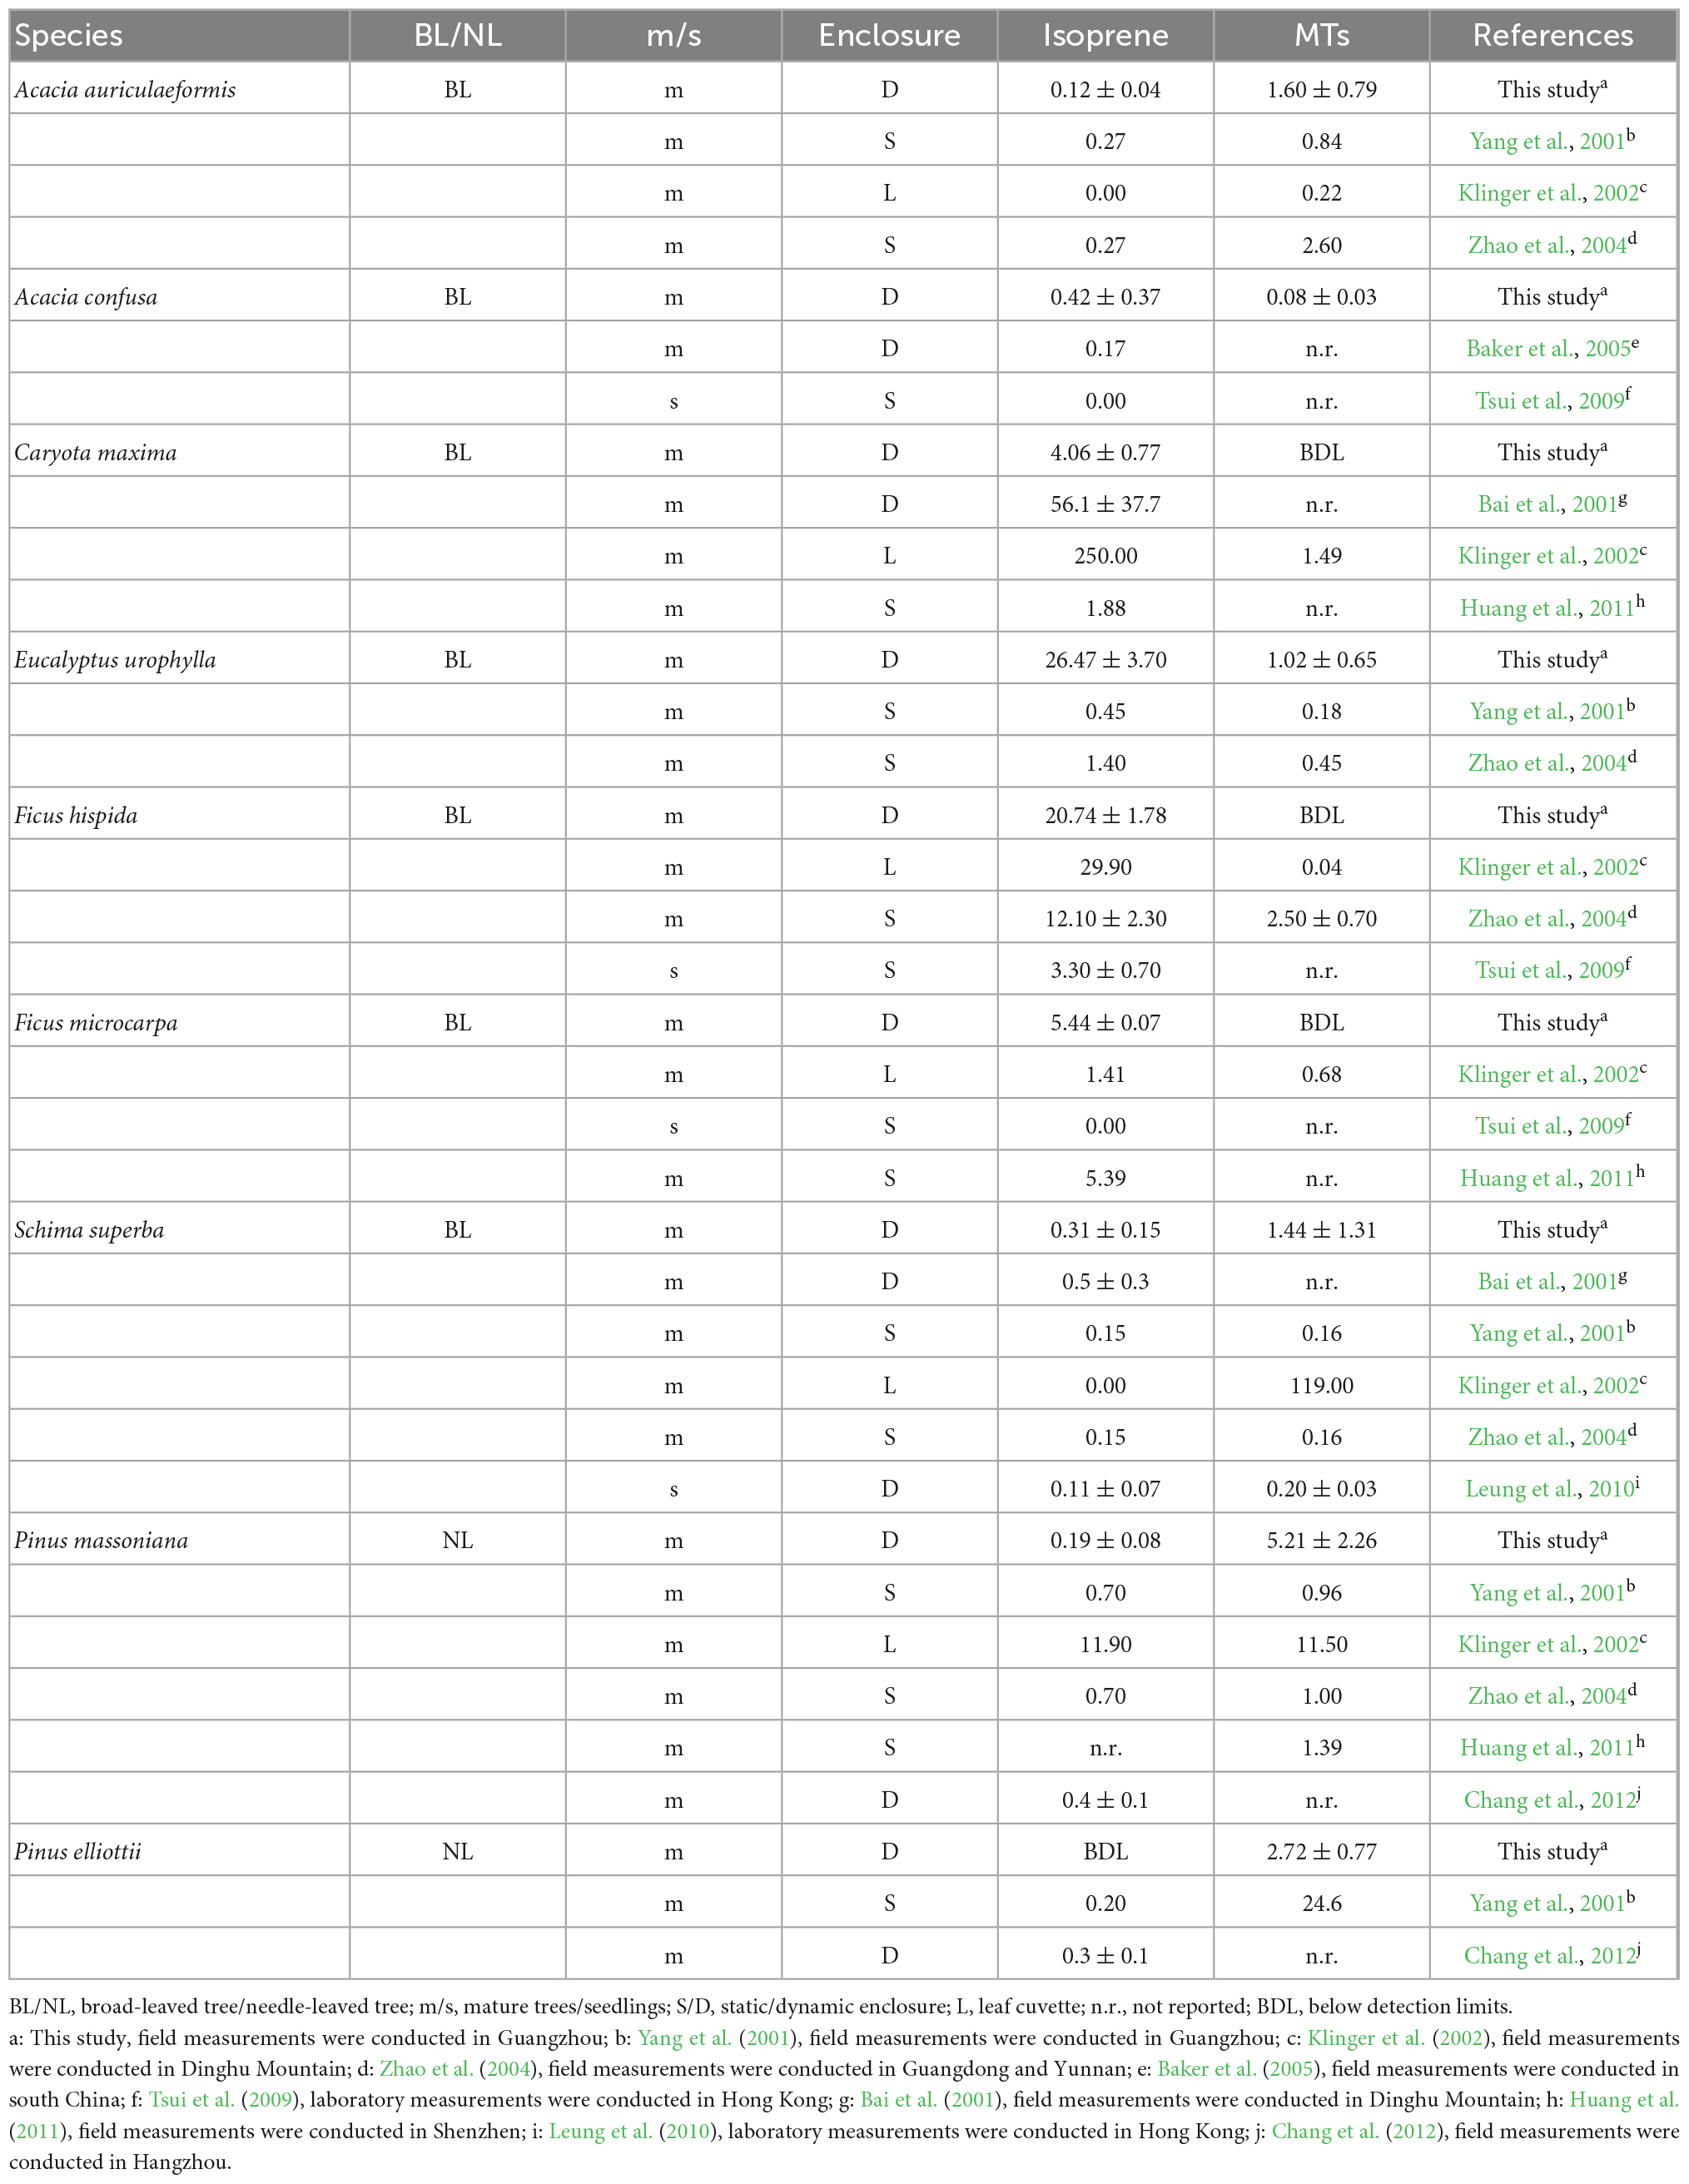
Table 2. Comparison of Es for isoprene and monoterpenes (MTs) with previous studies in this subtropical region.
The large variations in the Es of BVOCs could be partly derived from inter- and intra-specific variations (Staudt et al., 2001; Tarvainen et al., 2005; Lim et al., 2011; Welter et al., 2012; Jing et al., 2020). Welter et al. (2012) found that the intraspecific variation in the Es of MTs among 17 Quercus afares individuals (6–89 μg g–1h–1) could reach over an order of magnitude. Other factors, such as genetic and geographic differences, leaf age, plant age, growth stage, physiological status of plants, seasonality, soil moisture and nutrient status, shading and microclimate, can also result in variations in emission rates (Harley et al., 1997; Loreto et al., 2009; Singh et al., 2011; Welter et al., 2012; Llusià et al., 2013). Moreover, the inconsistent measurement enclosure systems used in different studies may be an important factor that introduces substantial uncertainty for Es (Ortega and Helmig, 2008; Niinemets et al., 2011; Li et al., 2019). Overall, the Es of isoprene from all the measured tree species measured by dynamic chambers are higher than those from static chambers except for A. auriculaeformis and F. macrocarpa (Table 2). The Es of isoprene for E. urophylla and the Es of MTs for P. massoniana in this study by a dynamic enclosure were much higher than those measured by static enclosures (Yang et al., 2001; Zhao et al., 2004; Huang et al., 2011). When compared to the Es reported previously also by the dynamic chamber method for Eucalyptus trees at different locations, our results were within the range (1.76–70.00 μg g–1h–1) and very close to the mean values of those studies (26.44 ± 22.73 μg g–1 h–1) (Supplementary Figure 2).
The underestimated isoprene Es by the static enclosure is probably because the static enclosure completely isolates the plant leaves from the ambient environment, causing a rapid decrease in CO2 concentration inside the enclosure due to the photosynthetic uptake of CO2 by the leaves, and resulting in a decrease in isoprene biosynthesis and its emission rate (Niinemets et al., 2011). In addition, accumulation of BVOCs in a static chamber would result in elevated levels of BVOCs inside the chamber and thereby hinder the diffusion of BVOCs from leaves into the chamber (Niinemets et al., 2011). Meanwhile, significant adsorption of BVOCs, especially MTs and SQTs, could occur in the inner surface of the static enclosure (Ortega and Helmig, 2008; Niinemets et al., 2011; Zeng et al., 2022), also leading to a lower Es.
The twenty tree species measured in this study could be divided into five categories by cluster analysis according to their emission rates of isoprene, MTs and SQTs (Figure 2). Twelve tree species (A. cunninghamii, B. ceiba, A. confuse, C. fortune, C. lanceolata, F. macrocarpa, S. jambos, C. maxima, P. elliottii, S. superba, A. auriculaeformis, and B. ventricosa) are classified as the low BVOC emission potential group with much lower Es of isoprene, MTs and SQTs. Two tree species (C. hystrix and P. massoniana) are identified as low isoprene and SQT emitters but moderate MT emitters. Four species (E. urophylla, F. hispida, S. hainanense and C. equisetifolia) show low emission potential of both MTs and SQTs but high emission potential of isoprene. M. indica is identified as having low MT and SQT emissions but moderate isoprene emissions, and M. denudata is identified as having low isoprene emissions but high MT and SQT emissions. Regional emissions of BVOCs depend on the coverage of dominant trees and their emission potentials. These results can have implications in the selection of tree species for urban greening plans, as more emissions of highly reactive BVOCs in urban areas would enhance photochemical ozone formation and therefore would not benefit ozone pollution control (Gu et al., 2021; Wang et al., 2022). In the subtropical regions, such as Guangdong Province, E. urophylla is the most dominant broad-leaved tree (24.11%; Figure 1B) and has a high isoprene emission rate, making it a major source of regional isoprene emissions; therefore, it should be avoided as a tree species for urban or rural greening in this region afflicted with ozone pollution (Willis and Petrokofsky, 2017; Wang et al., 2022). M. indica, F. hispida and S. hainanense are common tree species for urban greening (Jim and Liu, 2001; Singh et al., 2014). They have moderate to high isoprene emission potentials and thus might not be good choices for widely planted tree species in urban areas when ozone air pollution is serious.
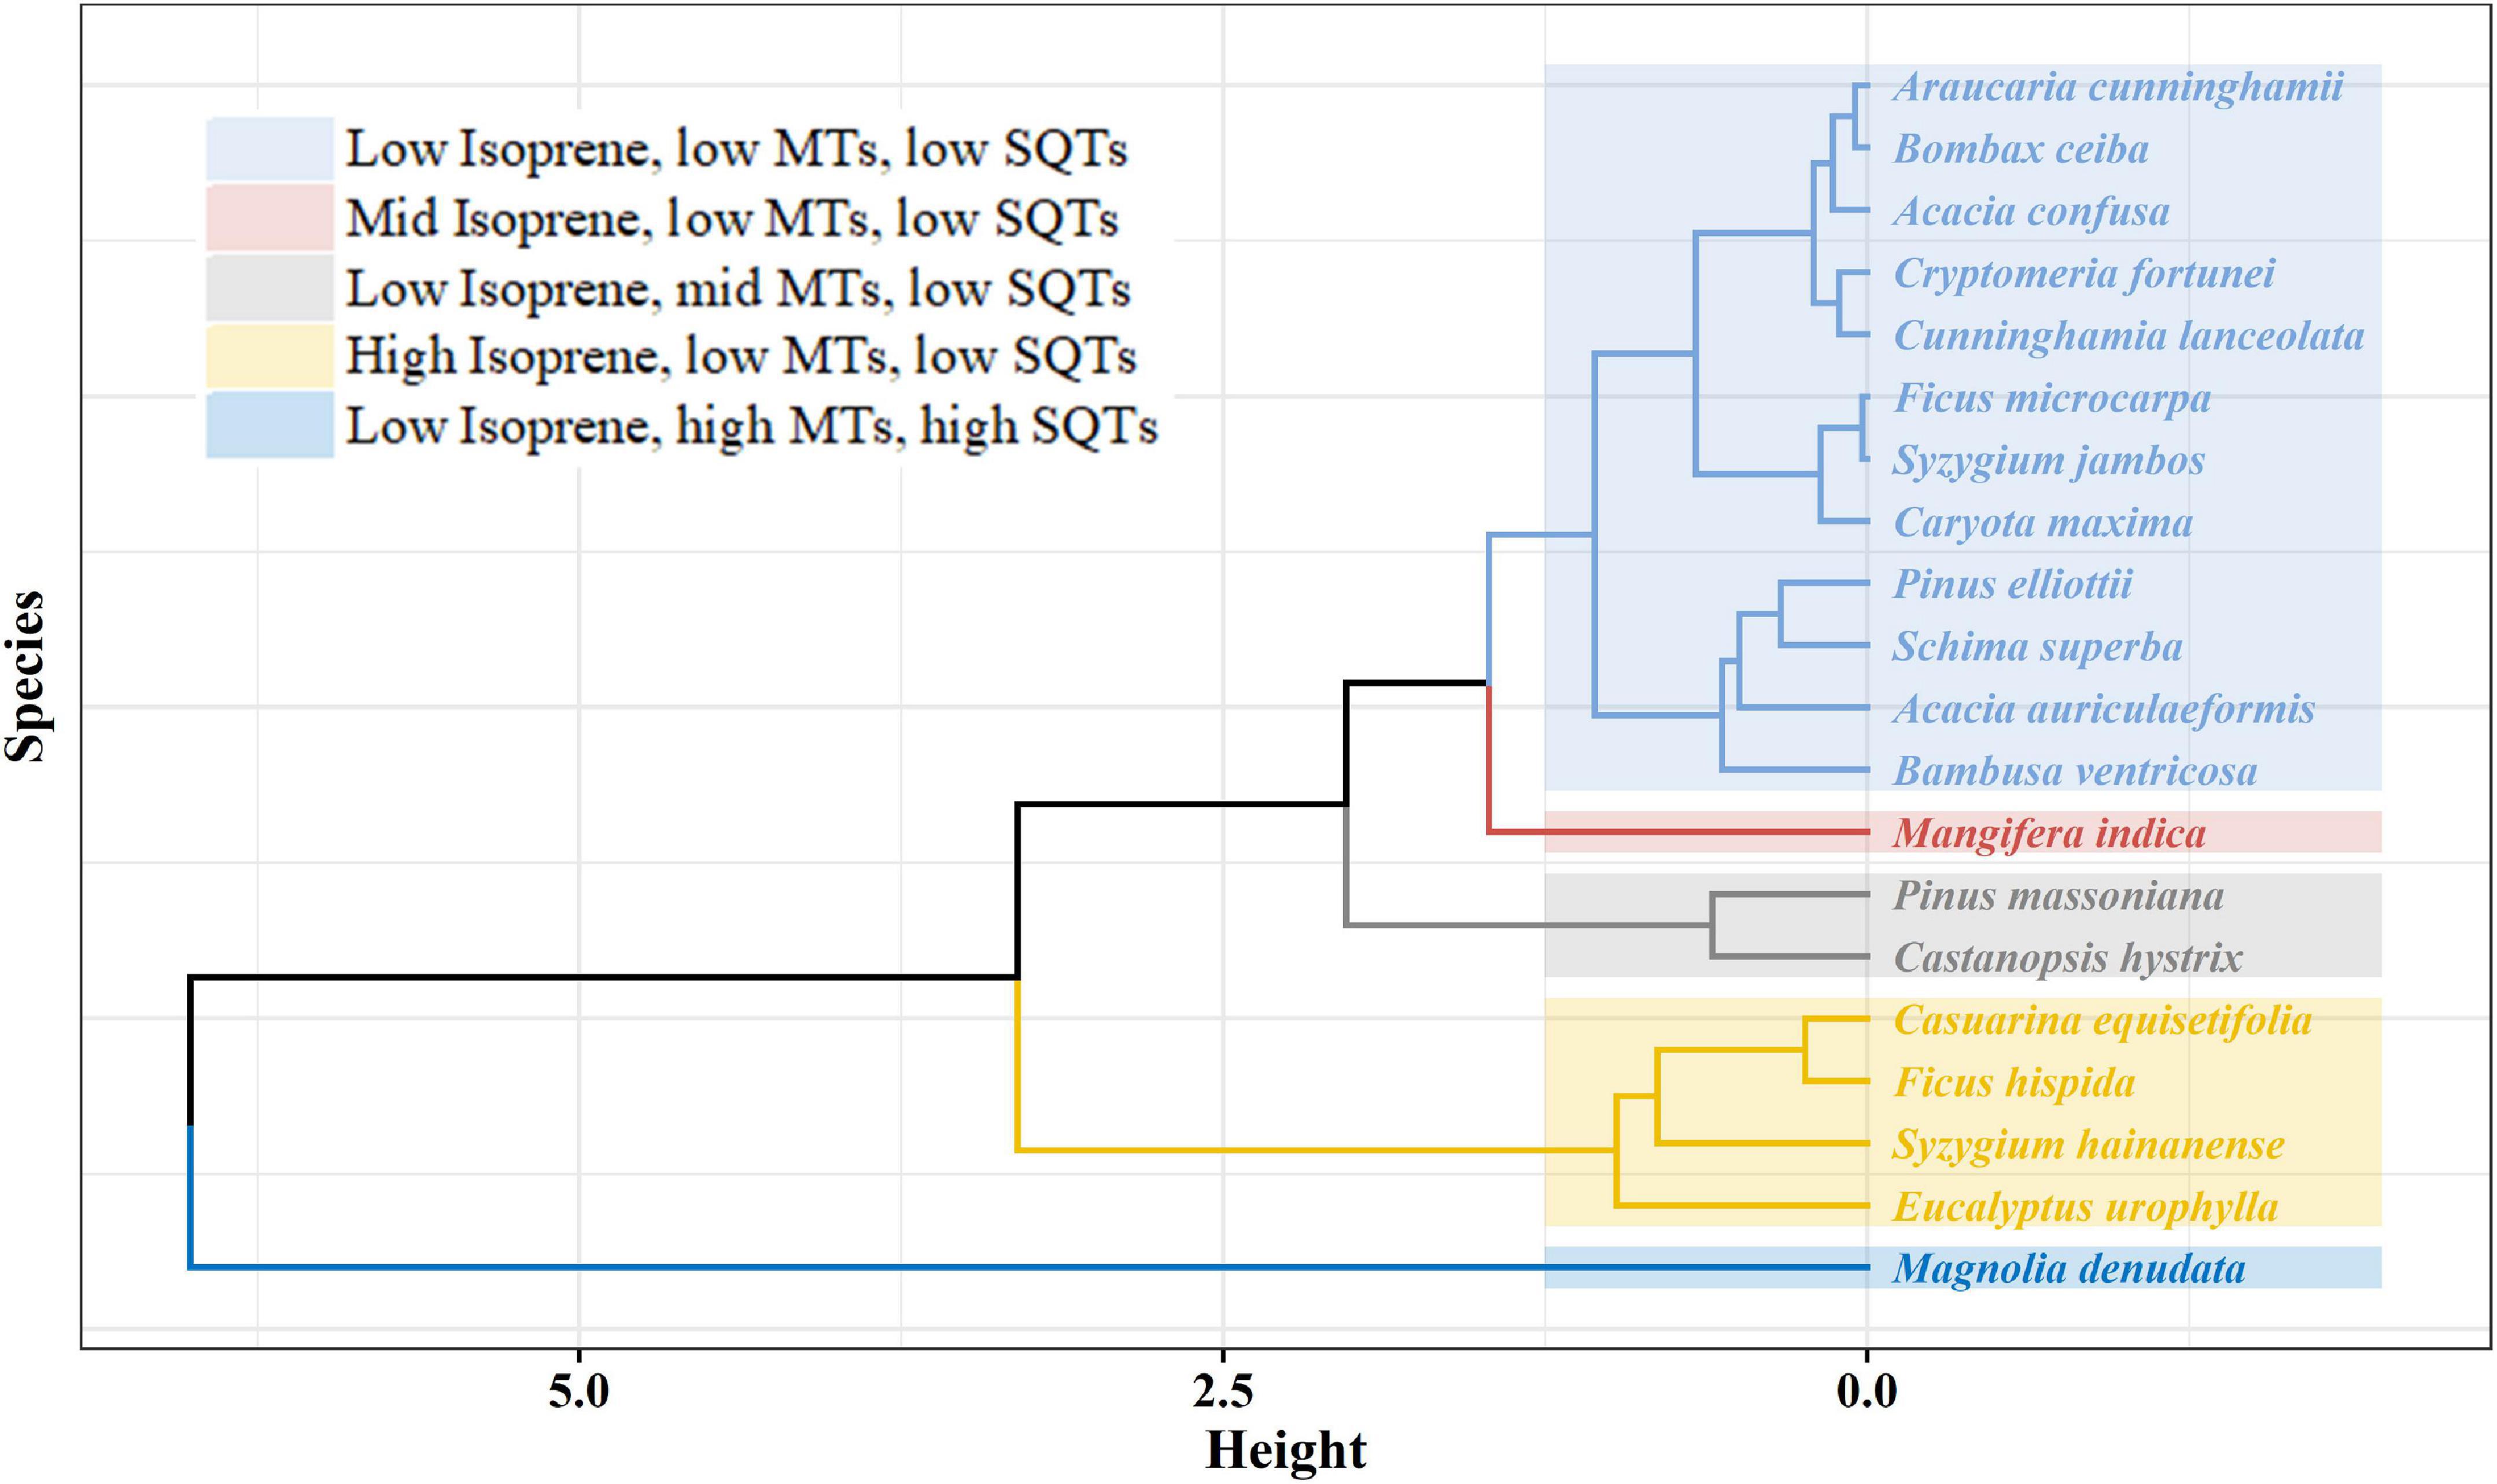
Figure 2. Tree species classification based on cluster analysis.
3.2 Compositions and emission rates of MT and SQT monomers
Table 3 shows the Es of 11 MTs and 3 oxygenated MTs emitted from 15 tree species (Supplementary Figure 3), and their compositions are shown in Figure 3. Overall, α-pinene, β-pinene, and limonene were the most common MT species emitted. M. denudata showed the highest Es of α-pinene (8.33 ± 2.05 μg g–1 h–1) and limonene (3.11 ± 1.07 μg g–1h–1), while C. hystrix had the highest Es of β-pinene (5.29 ± 3.24 μg g–1h–1). α-Pinene was the most abundant MT emitted from C. lanceolata (62.1 %), B. ventricose (59.5 %), E. urophylla (57.7 %), M. denudata (47.3 %), M. indica (45.4 %), and P. massoniana (36.5 %) (Figure 3), β-pinene was the dominant MT from S. superba (76.9 %), C. hystrix (73.8 %), P. elliottii (49.8 %), and C. fortune (41.7 %), limonene was the major MT in emissions from A. auriculaeformis (76.6 %) and S. hainanense (37.1 %), camphene was the most abundant MT from B. ceiba (65.2 %), and oxygenated MTs were the most abundant species from A. cunninghamii (87.2%) (Supplementary Table 4). Compositions of MTs from C. lanceolata, which covers a large forest area (10.41 %) in south China, were not characterized before, and in this study, its MT emissions were found to be dominated by α-pinene (62.1 %).
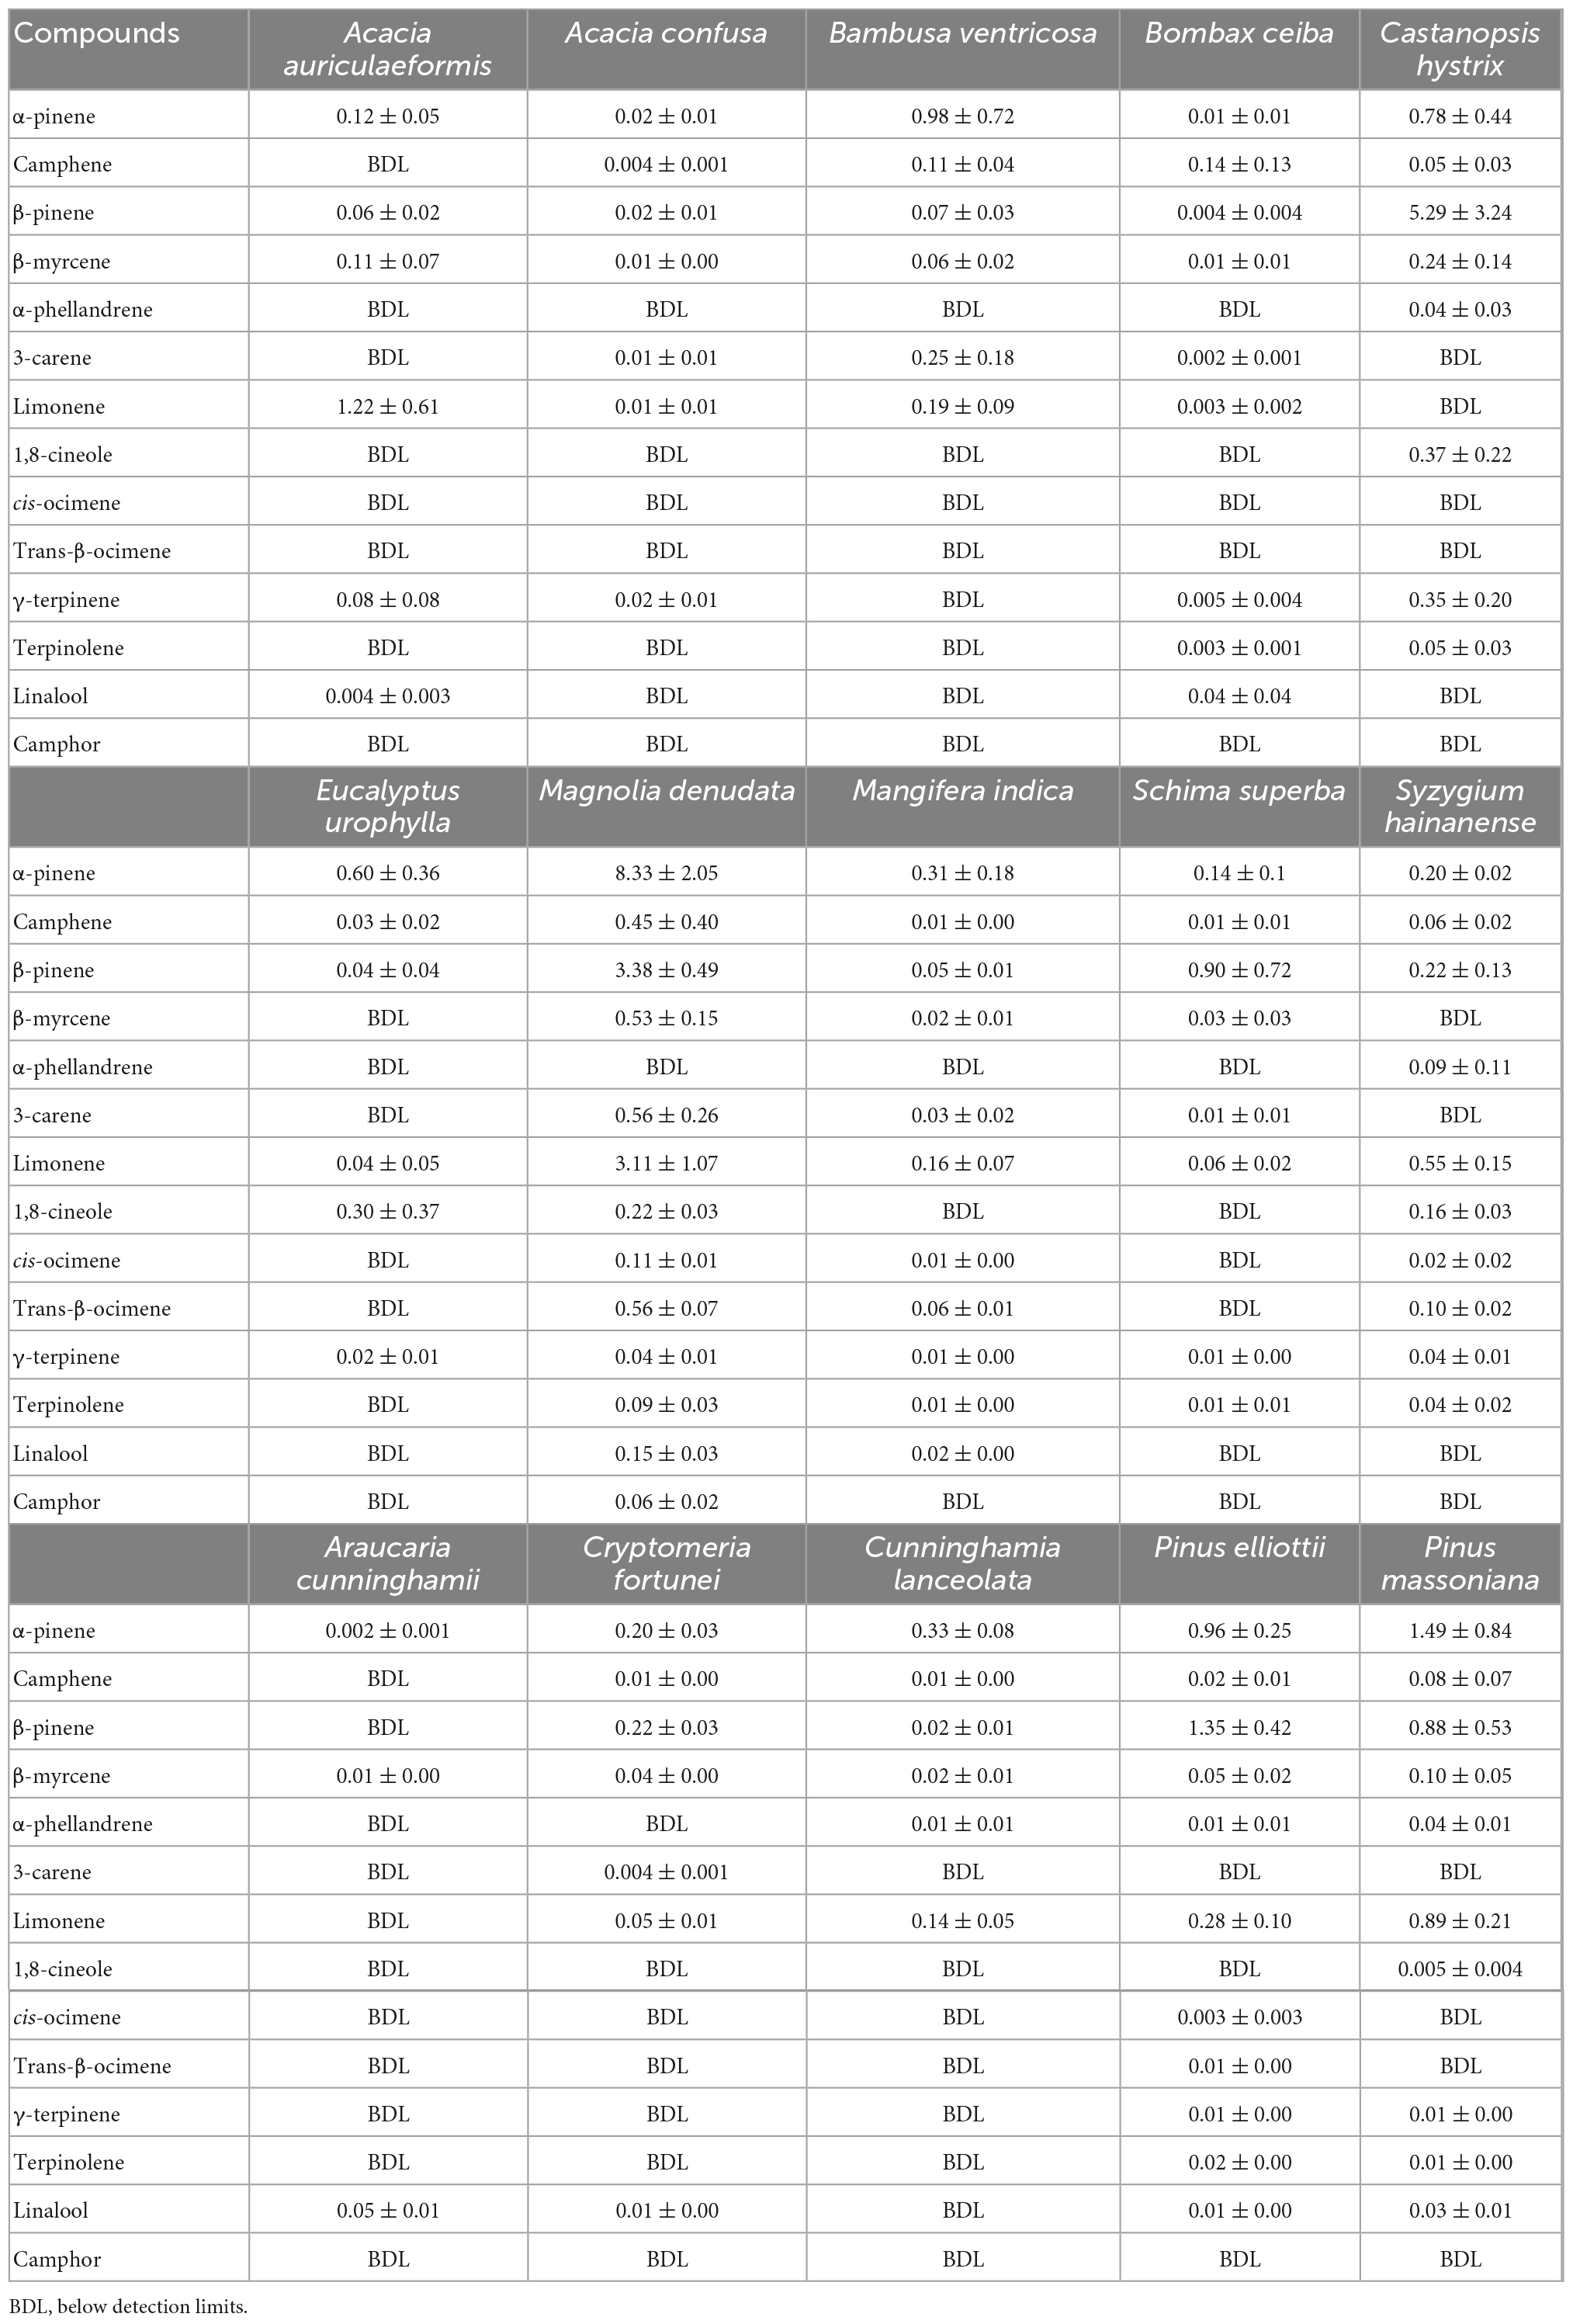
Table 3. Emission factors (μg g–1h–1) of different monoterpene (MT) species emitted from the measured trees.
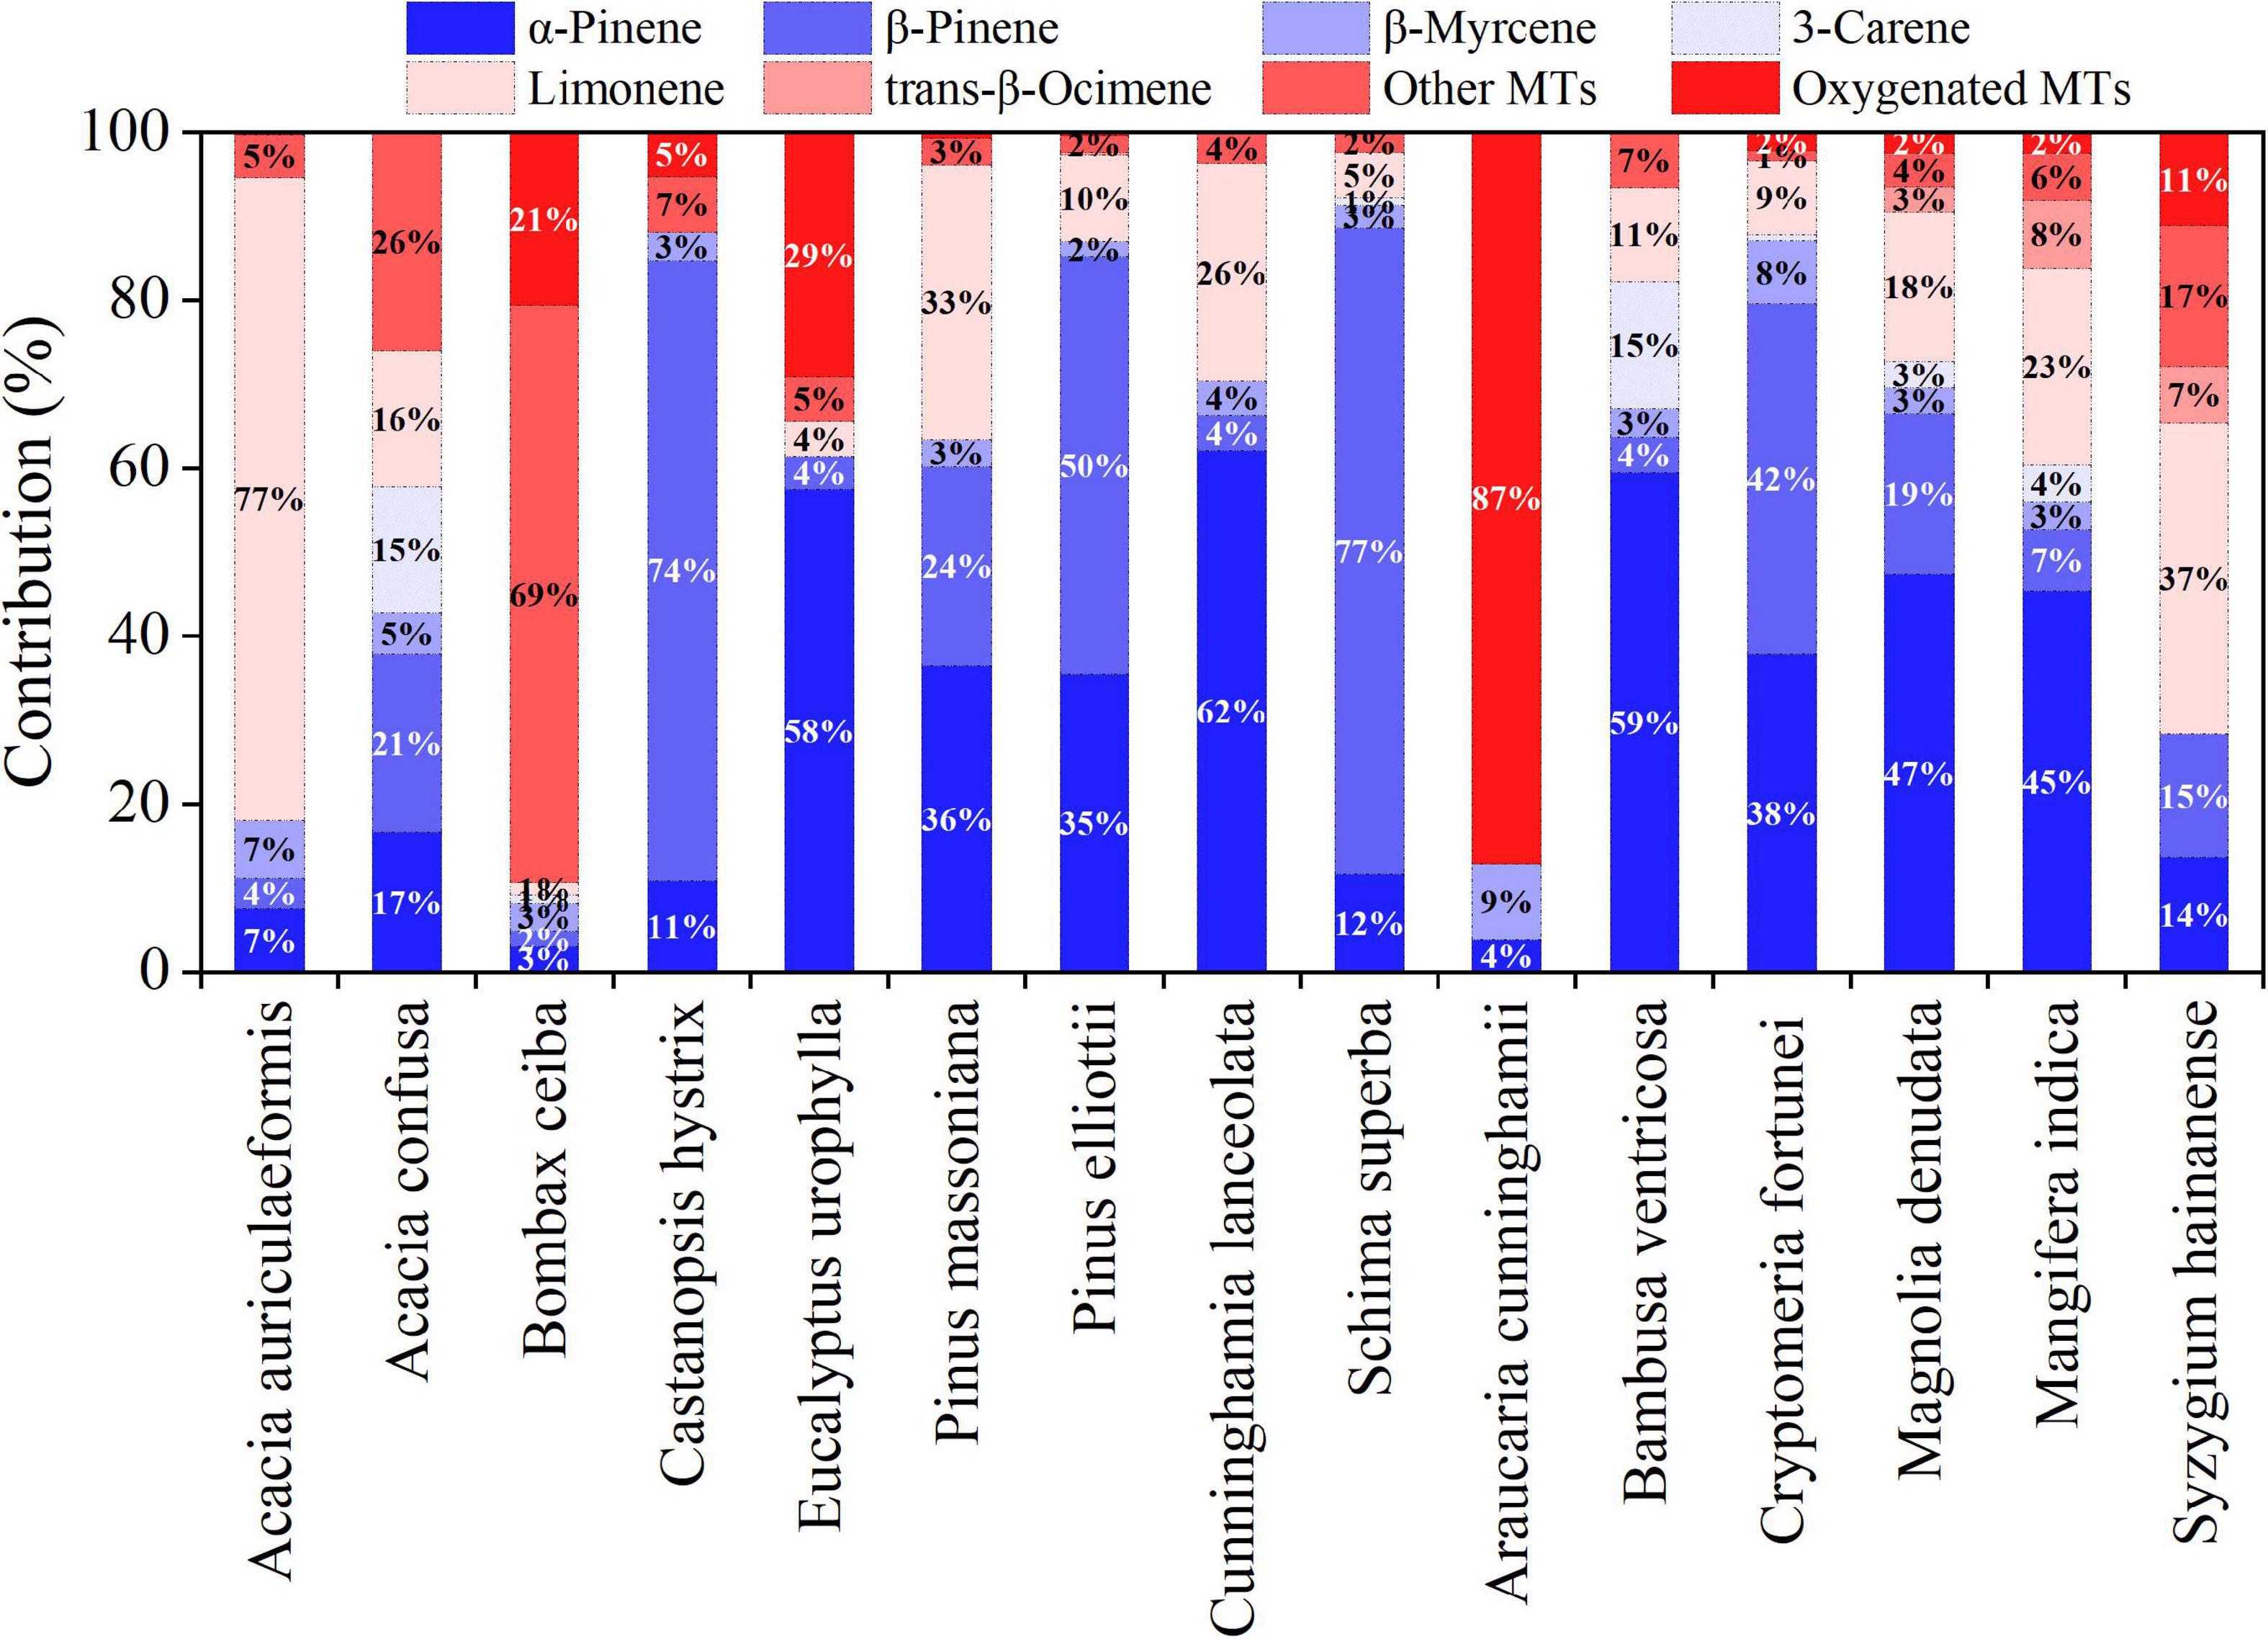
Figure 3. Compositions of different monoterpenes (MTs) emitted from measured trees.
As shown in Supplementary Table 5, α-pinene and 1,8-cineole are the two most abundant MTs emitted from E. urophylla, consistent with those reported in previous studies for Eucalyptus trees (Street et al., 1997; He et al., 2000; Winters et al., 2009). The Es of α-pinene for E. urophylla (0.60 ± 0.36 μg g–1h–1) from this study was very close to that for E. calophylla (0.64 μg g–1h–1), E. cladocalyx (0.57 μg g–1h–1), E. robusta (0.55 μg g–1h–1), and E. rudis (0.58 μg g–1h–1) reported by He et al. (2000), but lower than that for young E. globulus (0.89–2.47 μg g–1h–1; Evans et al., 1982; Street et al., 1997; He et al., 2000; Purser et al., 2020). The Es of 1,8-cineole for E. urophylla (0.30 ± 0.37 μg g–1h–1) was within the range of the Es for Eucalyptus trees in previous studies (Supplementary Table 5), but significantly lower than that for young E. globulus (1.67–8.56 μg g–1h–1; Evans et al., 1982; Street et al., 1997; He et al., 2000; Purser et al., 2020). For the main MTs emitted from both P. massoniana and P. elliottii (Table 3), the Es of α-pinene and β-pinene for P. massoniana (1.49 ± 0.84 and 0.88 ± 0.53 μg g–1h–1) and P. elliottii (0.96 ± 0.25 and 1.35 ± 0.42 μg g–1h–1) were higher than those measured in Europe for pine trees (Tarvainen et al., 2005; Hakola et al., 2006; Bracho-Nunez et al., 2011; Staudt et al., 2017) and in the United States (Helmig et al., 2013; Supplementary Table 6), but lower than those for pine trees (e.g., Pinus griffithii, Pinus armandii) in northern China (Jing et al., 2020). In this study, P. massoniana showed higher Es of limonene (0.89 ± 0.21 μg g–1h–1) than most other pines except for P. griffithii (3.7944 μg g–1h–1; Jing et al., 2020), and the Es of limonene for P. elliottii (0.28 ± 0.10 μg g–1h–1) from this study were within those reported for other pines (Helmig et al., 2013; Jing et al., 2020). These differences also demonstrated geographical and intraspecific variabilities in MTs emissions (Staudt et al., 2001; Tarvainen et al., 2005; Loreto et al., 2009; Welter et al., 2012), implying that more field measurements are necessary to overcome the variability.
In this study, fourteen tree species were found to be emitters of SQTs (Table 4), and β-caryophyllene was the most commonly detected among the nine species of SQTs measured in this study (Supplementary Figure 3), with 12 tree species being β-caryophyllene emitters. M. denudata had the highest Es of the SQTs (1.10 ± 0.41 μg g–1h–1) with a dominance of α-gurjunene (72.2 %) (Supplementary Table 7). Two SQTs, longicyclene and β-caryophyllene, were observed to emit from E. urophylla with Es values of 0.02 ± 0.01 and 0.03 ± 0.02 μg g–1h–1, respectively, higher than those from E. yarraensis (Sørensen et al., 2020; Supplementary Table 8). Four SQTs monomers were identified from P. massoniana, six were identified from P. elliottii, and β-caryophyllene and α-humulene were the common SQTs emitted from the pine trees. The Es of β-caryophyllene and α-humulene from P. elliottii were 0.02 ± 0.01 and 0.01 ± 0.00 μg g–1h–1, respectively, but all were below 0.005 μg g–1h–1 from P. massoniana. Five trees emitted α-copaene with Es ranging from 0.002 to 0.04 μg g–1h–1, twelve trees emitted β-caryophyllene with Es ranging from 0.002 to 0.09 μg g–1h–1, and five trees emitted α-humulene with Es from 0.001 to 0.03 μg g–1h–1. These ranges are similar to the Es from plants in Turkey (0.0002–0.043 μg g–1h–1; Yaman et al., 2015), Mediterranean plants (0.02–0.20 μg g–1h–1; Bracho-Nunez et al., 2013), and Hawaii (0.01–8.04 μg g–1h–1; Llusià et al., 2010; Supplementary Table 8). The large variability in the Es of SQTs from plants come from many factors, such as the diversity of plants, and seasonal changes in SQT emissions (Hakola et al., 2006). In fact, more in-situ measurements are needed for emissions of SQTs from plants since far fewer field campaigns are available for emissions of SQTs than for emissions of isoprene and MTs.
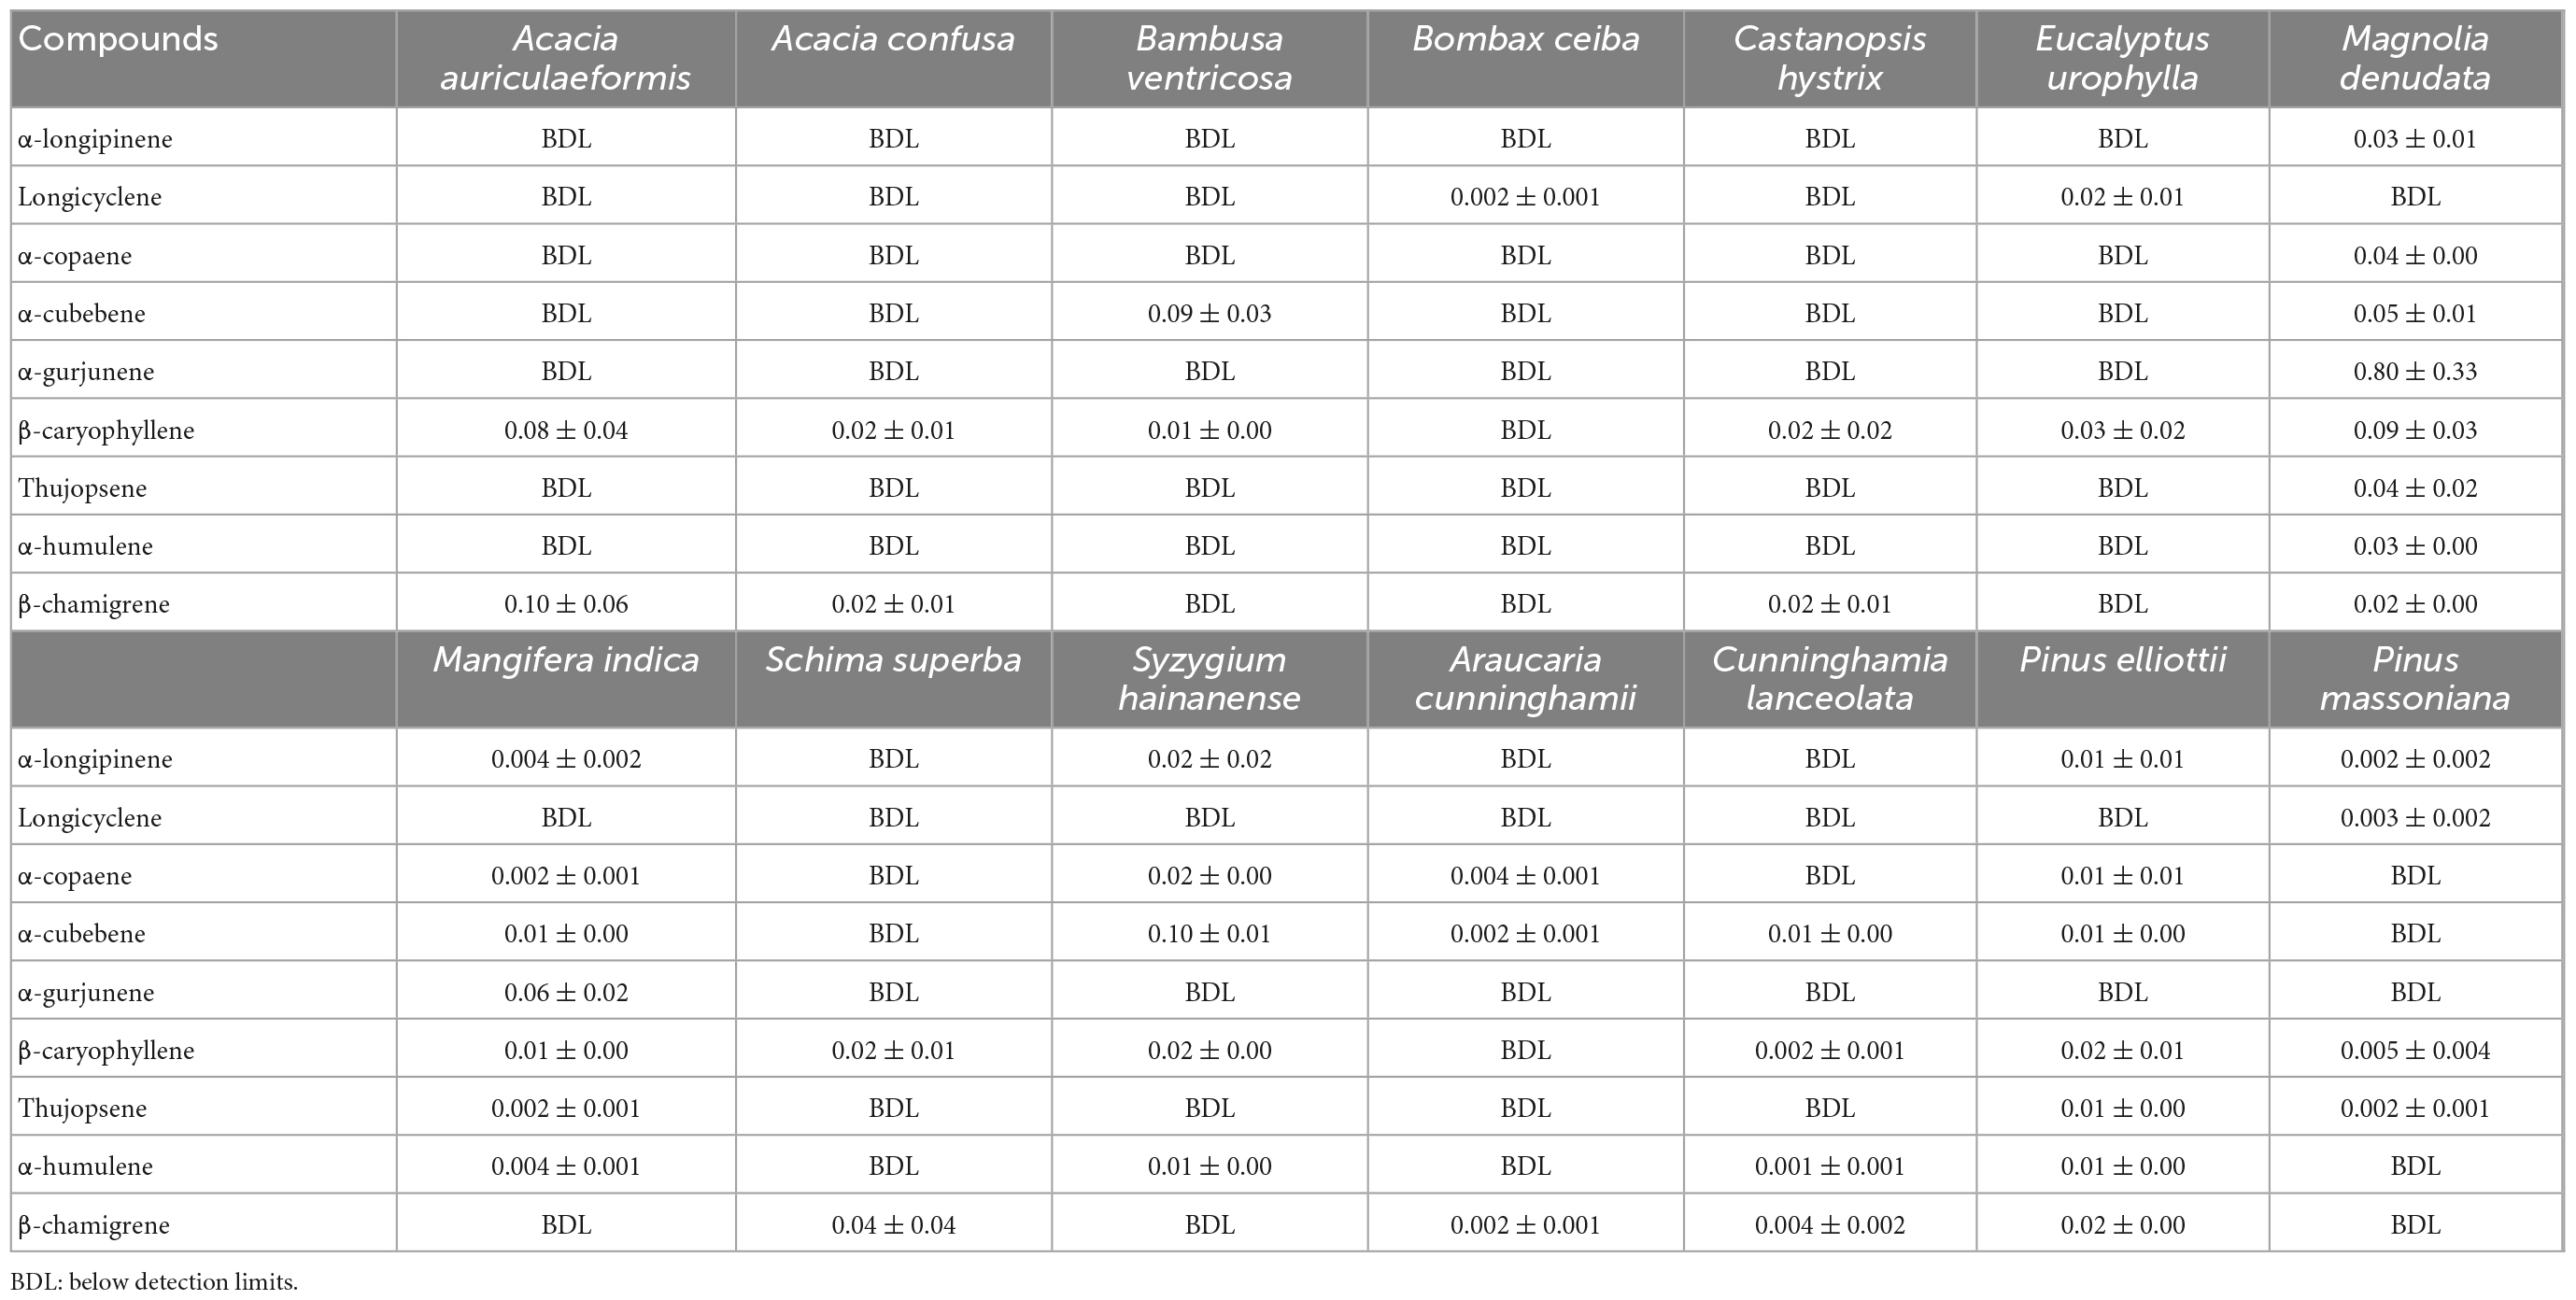
Table 4. Emission factors (μg g–1h–1) of different sesquiterpene (SQT) species emitted from the measured trees.
3.3 The Canopy-scale emission factors
The coverage-weighted EFs of the broad-leaved trees and needle-leaved trees were calculated based on the EFs of dominant trees and their coverage proportions (Figure 1B). According to previous studies, the leaf mass area (LMA) of broad-leaved trees and needle-leaved trees were chosen to be 100 and 150 g m–2, respectively (Guenther et al., 1995; Zheng et al., 2010; Wang et al., 2016), and the standard value of 5 m2 m–2 was adopted for the LAI (Wang et al., 2016). However, the measured LAI of Eucalyptus plantations in south China ranged from 0.65 to 3 m2 m–2 with an average of about 2 m–2 m–2 (Wen et al., 2008; Ouyang et al., 2021; Zhang et al., 2021). Therefore, the LAI of Eucalyptus trees was chosen to be 2 m2 m–2 when calculating the weighted average EFs by Eucalyptus trees due to the large proportion and high isoprene Es of Eucalyptus trees. For broad-leaved trees, the EFs of 43% of all broad-leaved trees (Figure 1B) were updated using our measured values and the EFs of the remaining broad-leaved trees (57%) adopted the default values in MEGAN v2.1. The updated localized average isoprene EFs of broad-leaved trees (7,657 μg m–2 h–1) is ∼24% lower than the default value (10,000 μg m–2 h–1) for broadleaf evergreen temperate trees (BETT) in the MEGAN v2.1 (Supplementary Figure 4), indicating that the model might overestimate the regional isoprene emissions if the default EFs are used. This is consistent with results from a previous model-measurement comparison study (Zhang et al., 2020), which showed that the MEGAN estimation might overestimate isoprene emissions in south China. The overestimation of the model might be partly because the default isoprene EF (10,000 m–2 h–1) was nearly twice that of E. urophylla (5,294 m–2 h–1). This overestimation of isoprene emissions also occurred in Eucalyptus-dominated areas in Australia (Emmerson et al., 2016), and the default isoprene EFs for BETT in MEGAN v2.1 were suggested to decrease by up to a factor of 4 or 5 in that area to bridge the gap. In addition, the localized canopy-scale EFs of MT and SQT monomers for broad-leaved trees were also lower than the default values in MEGAN v2.1. The localized canopy-scale EFs of the total MTs (667 μg m–2 h–1) and the total SQTs (108 μg m–2 h–1) were ∼33 and ∼41% lower than those of the default values for BETT in MEGAN v2.1, respectively.
For needle-leaved trees, the localized canopy-scale EFs of isoprene and total SQTs of needle-leaved evergreen temperate trees (NETT) were nearly 7 and 11 times lower than the default values in MEGAN v2.1, respectively. Nevertheless, the localized canopy-scale EFs of MTs for α-pinene, β-pinene and limonene were 30, 47, and 300% higher than the default values in MEGAN v2.1, respectively. In addition, the emissions of sabinene, 3-carene and trans-β-ocimene from the dominant needle-leaved trees (e.g., C. lanceolata, P. elliottii, P. massoniana) were below the detection limits (Table 3). However, the default EFs of these three MTs are 70, 160, and 70 μg m–2 h–1 for NETT, respectively. If the default EFs of BVOCs were used for NETT in the model, it may not only lead to the overestimation of isoprene, sabinene, 3-carene and trans-β-ocimene and SQTs, but also lead to the underestimation of α-pinene, β-pinene, and limonene from needle-leaved trees in south China with changed emission profiles of MTs. The results showed that the localized EFs of BVOCs may help to reduce the uncertainties of BVOC emission estimations by MEGAN or other emission models in typical regions.
4 Conclusion
In this study, BVOC emission factors from 20 tropical/subtropical mature trees, including 15 broad-leaved trees and 5 needle-leaved trees, were measured in-situ by a dynamic chamber. Concurrent dynamic and static chamber measurements revealed substantially higher emission factors by the dynamic chamber method than by the static chamber method. The localized compound-specific emission factors of isoprene, 14 MTs and 9 SQTs for the dominant tree species were obtained and applied to update and compare with default emission factors for typical tropical vegetation types in the MEGAN model. The results showed that more localized emission factors would help improve BVOC emission estimates in typical/subtropical regions and narrow their uncertainties. Nevertheless, more extensive in situ branch-scale and ecosystem-scale measurements of BVOC emissions with a good representation of tree species and vegetation types are urgently needed in tropical regions with globally dominant BVOC emissions.
Data availability statement
The original contributions presented in this study are included in the article/Supplementary material, further inquiries can be directed to the corresponding author.
Author contributions
JZ and WS: field measurement, laboratory analysis, data curation, and original draft preparation. YZ: conceptualization, methodology, visualization, writing—reviewing and editing, and funding acquisition. ZM and WP: field measurement and laboratory analysis. HZ: methodology, laboratory analysis, and validation. XW: conceptualization, methodology, reviewing and editing, and funding acquisition. All authors contributed to the article and approved the submitted version.
Funding
This work was supported by the National Natural Science Foundation of China (42022023 and 41673116), the Hong Kong Research Grant Council (T24-504/17-N), the Chinese Academy of Sciences (XDA23010303), the Youth Innovation Promotion Association, CAS (Y2021096), the Department of Science and Technology of Guangdong (2020B1111360001 and 2020B1212060053), and the Guangzhou Municipal Science and Technology Bureau (202206010057).
Conflict of interest
The authors declare that the research was conducted in the absence of any commercial or financial relationships that could be construed as a potential conflict of interest.
Publisher’s note
All claims expressed in this article are solely those of the authors and do not necessarily represent those of their affiliated organizations, or those of the publisher, the editors and the reviewers. Any product that may be evaluated in this article, or claim that may be made by its manufacturer, is not guaranteed or endorsed by the publisher.
Supplementary material
The Supplementary Material for this article can be found online at: https://www.frontiersin.org/articles/10.3389/ffgc.2022.1089676/full#supplementary-material
Footnotes
References
Arneth, A., Monson, R. K., Schurgers, G., Niinemets, U., and Palmer, P. I. (2008). Why are estimates of global terrestrial isoprene emissions so similar (and why is this not so for monoterpenes)? Atmos. Chem. Phys. 8, 4605–4620. doi: 10.5194/acp-8-4605-2008
Atkinson, R., and Arey, J. (2003). Gas-phase tropospheric chemistry of biogenic volatile organic compounds: A review. Atmos. Environ. 37, S197–S219. doi: 10.1016/s1352-2310(03)00391-1
Aydin, Y. M., Yaman, B., Koca, H., Dasdemir, O., Kara, M., Altiok, H., et al. (2014). Biogenic volatile organic compound (BVOC) emissions from forested areas in Turkey: Determination of specific emission rates for thirty-one tree species. Sci. Total Environ. 490, 239–253. doi: 10.1016/j.scitotenv.2014.04.132
Bai, J. H., Wang, M. X., John, G., and Ronald, G. P. (2001). A study of nonmethane hydrocarbons at subtropical forest Part II: Dinual variation. Clim. Environ. Res. 6, 456–456.
Baker, B., Graessli, M., Guenther, A., Li, N., Huang, A., and Bai, J. H. (2005). “Biogenic volatile organic compound emission rates from urban vegetation in Southeast China,” in Presented at AGU fall meeting, San Francisco, CA.
Batista, C. E., Ye, J., Ribeiro, I. O., Guimaraes, P. C., Medeiros, A. S. S., Barbosa, R. G., et al. (2019). Intermediate-scale horizontal isoprene concentrations in the near-canopy forest atmosphere and implications for emission heterogeneity. Proc. Natl. Acad. Sci. U.S.A. 116, 19318–19323. doi: 10.1073/pnas.1904154116
Bracho-Nunez, A., Knothe, N. M., Welter, S., Staudt, M., Costa, W. R., Liberato, M. A. R., et al. (2013). Leaf level emissions of volatile organic compounds (VOC) from some Amazonian and Mediterranean plants. Biogeosciences 10, 5855–5873. doi: 10.5194/bg-10-5855-2013
Bracho-Nunez, A., Welter, S., Staudt, M., and Kesselmeier, J. (2011). Plant-specific volatile organic compound emission rates from young and mature leaves of Mediterranean vegetation. J. Geophys. Res. Atmos. 116:D16304. doi: 10.1029/2010jd015521
Chang, J., Ren, Y., Shi, Y., Zhu, Y., Ge, Y., Hong, S., et al. (2012). An inventory of biogenic volatile organic compounds for a subtropical urban-rural complex. Atmos. Environ. 56, 115–123. doi: 10.1016/j.atmosenv.2012.03.053
Di Carlo, P., Brune, W. H., Martinez, M., Harder, H., Lesher, R., Ren, X. R., et al. (2004). Missing OH reactivity in a forest: Evidence for unknown reactive biogenic VOCs. Science 304, 722–725. doi: 10.1126/science.1094392
Edwards, P. M., Aikin, K. C., Dube, W. P., Fry, J. L., Gilman, J. B., de Gouw, J. A., et al. (2017). Transition from high- to low-Nox control of night-time oxidation in the southeastern US. Nat. Geosci. 10, 490–495. doi: 10.1038/ngeo2976
Emmerson, K. M., Galbally, I. E., Guenther, A. B., Paton-Walsh, C., Guerette, E.-A., Cope, M. E., et al. (2016). Current estimates of biogenic emissions from eucalypts uncertain for southeast Australia. Atmos. Chem. Phys. 16, 6997–7011. doi: 10.5194/acp-16-6997-2016
Evans, R. C., Tingey, D. T., Gumpertz, M. L., and Burns, W. F. (1982). Estimates of isoprene and monoterpene emission rates in plants. Bot. Gaz. 143, 304–310.
Geron, C., Guenther, A., Greenberg, J., Loescher, H. W., Clark, D., and Baker, B. (2002). Biogenic volatile organic compound emissions from a lowland tropical wet forest in Costa Rica. Atmos. Environ. 36, 3793–3802. doi: 10.1016/s1352-2310(02)00301-1
Gu, S., Guenther, A., and Faiola, C. (2021). Effects of anthropogenic and biogenic volatile organic compounds on Los Angeles air quality. Environ. Sci. Technol. 55, 12191–12201. doi: 10.1021/acs.est.1c01481
Guenther, A. (2013). Biological and chemical diversity of biogenic volatile organic emissions into the atmosphere. ISRN Atmos. Sci. 2013:786290. doi: 10.1155/2013/786290
Guenther, A., Hewitt, C. N., Erickson, D., Fall, R., Geron, C., Graedel, T., et al. (1995). A global model of natural volatile organic compound emissions. J. Geophys. Res. Atmos. 100, 8873–8892. doi: 10.1029/94jd02950
Guenther, A., Karl, T., Harley, P., Wiedinmyer, C., Palmer, P. I., and Geron, C. (2006). Estimates of global terrestrial isoprene emissions using MEGAN (model of emissions of gases and aerosols from nature). Atmos. Chem. Phys. 6, 3181–3210. doi: 10.5194/acp-6-3181-2006
Guenther, A., Otter, L., Zimmerman, P., Greenberg, J., Scholes, R., and Scholes, M. (1996). Biogenic hydrocarbon emissions from southern African savannas. J. Geophys. Res. Atmos. 101, 25859–25865. doi: 10.1029/96jd02597
Guenther, A. B., Jiang, X., Heald, C. L., Sakulyanontvittaya, T., Duhl, T., Emmons, L. K., et al. (2012). The model of emissions of gases and aerosols from nature version 2.1 (MEGAN2.1): An extended and updated framework for modeling biogenic emissions. Geosci. Model Dev. 5, 1471–1492. doi: 10.5194/gmd-5-1471-2012
Guenther, A. B., Zimmerman, P. R., Harley, P. C., Monson, R. K., and Fall, R. (1993). Isoprene and monoterpene emission rate variability-model evaluations and sensitivity analyses. J. Geophys. Res. Atmos. 98, 12609–12617. doi: 10.1029/93jd00527
Hakola, H., Tarvainen, V., Back, J., Ranta, H., Bonn, B., Rinne, J., et al. (2006). Seasonal variation of mono- and sesquiterpene emission rates of Scots pine. Biogeosciences 3, 93–101. doi: 10.5194/bg-3-93-2006
Hamilton, J. F., Bryant, D. J., Edwards, P. M., Ouyang, B., Bannan, T. J., Mehra, A., et al. (2021). Key role of NO3 radicals in the production of isoprene nitrates and nitrooxyorganosulfates in Beijing. Environ. Sci. Technol. 55, 842–853. doi: 10.1021/acs.est.0c05689
Harley, P., Guenther, A., and Zimmerman, P. (1997). Environmental controls over isoprene emission in deciduous oak canopies. Tree Physiol. 17, 705–714. doi: 10.1093/treephys/17.11.705
Harley, P., Otter, L., Guenther, A., and Greenberg, J. (2003). Micrometeorological and leaf-level measurements of isoprene emissions from a southern African savanna. J. Geophys. Res. Atmos. 108:8468. doi: 10.1029/2002jd002592
Harley, P., Vasconcellos, P., Vierling, L., Pinheiro, C. C. D. S., Greenberg, J., Guenther, A., et al. (2004). Variation in potential for isoprene emissions among Neotropical forest sites. Glob. Chang. Biol. 10, 630–650. doi: 10.1111/j.1529-8817.2003.00760.x
He, C. R., Murray, F., and Lyons, T. (2000). Monoterpene and isoprene emissions from 15 Eucalyptus species in Australia. Atmos. Environ. 34, 645–655. doi: 10.1016/s1352-2310(99)00219-8
He, Q., Tomaz, S., Li, C., Zhu, M., Meidan, D., Riva, M., et al. (2021). Optical properties of secondary organic aerosol produced by nitrate radical oxidation of biogenic volatile organic compounds. Environ. Sci. Technol. 55, 2878–2889. doi: 10.1021/acs.est.0c06838
Helmig, D., Daly, R. W., Milford, J., and Guenther, A. (2013). Seasonal trends of biogenic terpene emissions. Chemosphere 93, 35–46. doi: 10.1016/j.chemosphere.2013.04.058
Helmig, D., Ortega, J., Duhl, T., Tanner, D., Guenther, A., Harley, P., et al. (2007). Sesquiterpene emissions from pine trees – Identifications, emission rates and flux estimates for the contiguous United States. Environ. Sci. Technol. 41, 1545–1553. doi: 10.1021/es0618907
Helmig, D., Ortega, J., Guenther, A., Herrick, J. D., and Geron, C. (2006). Sesquiterpene emissions from loblolly pine and their potential contribution to biogenic aerosol formation in the Southeastern US. Atmos. Environ. 40, 4150–4157. doi: 10.1016/j.atmosenv.2006.02.035
Huang, A., Li, N., Guenther, A., Greenberg, J., Baker, B., Graessli, M., et al. (2011). Investigation on emission properties of biogenic VOCs of landscape plants in Shenzhen. Chin. J. Environ. Sci. 32, 3555–3559.
Jardine, K. J., Zorzanelli, R. F., Gimenez, B. O., Oliveira Piva, L. R., Teixeira, A., Fontes, C. G., et al. (2020). Leaf isoprene and monoterpene emission distribution across hyperdominant tree genera in the Amazon basin. Phytochemistry 175:112366. doi: 10.1016/j.phytochem.2020.112366
Jim, C. Y., and Liu, H. T. (2001). Patterns and dynamics of urban forests in relation to land use and development history in Guangzhou City, China. Geogr. J. 167, 358–375. doi: 10.1111/1475-4959.00031
Jing, X., Lun, X., Fan, C., and Ma, W. (2020). Emission patterns of biogenic volatile organic compounds from dominant forest species in Beijing, China. J. Environ. Sci. 95, 73–81. doi: 10.1016/j.jes.2020.03.049
Keller, M., and Lerdau, M. (1999). Isoprene emission from tropical forest canopy leaves. Glob. Biogeochem. Cycles 13, 19–29. doi: 10.1029/1998gb900007
Klinger, L. F., Greenberg, J., Guenther, A., Tyndall, G., Zimmerman, P., M’Bangui, M., et al. (1998). Patterns in volatile organic compound emissions along a savanna-rainforest gradient in central Africa. J. Geophys. Res. Atmos. 103, 1443–1454. doi: 10.1029/97jd02928
Klinger, L. F., Li, Q. J., Guenther, A. B., Greenberg, J. P., Baker, B., and Bai, J. H. (2002). Assessment of volatile organic compound emissions from ecosystems of China. J. Geophys. Res. Atmos. 107:4603. doi: 10.1029/2001jd001076
Lerdau, M. T., and Throop, H. L. (1999). Isoprene emission and photosynthesis in a tropical forest canopy: Implications for model development. Ecol. Appl. 9, 1109–1117. doi: 10.2307/2641381
Leung, D. Y. C., Wong, P., Cheung, B. K. H., and Guenther, A. (2010). Improved land cover and emission factors for modeling biogenic volatile organic compounds emissions from Hong Kong. Atmos. Environ. 44, 1456–1468. doi: 10.1016/j.atmosenv.2010.01.012
Li, L., Guenther, A. B., Xie, S., Gu, D., Seco, R., Nagalingam, S., et al. (2019). Evaluation of semi-static enclosure technique for rapid surveys of biogenic volatile organic compounds (BVOCs) emission measurements. Atmos. Environ. 212, 1–5. doi: 10.1016/j.atmosenv.2019.05.029
Li, L., Yang, W., Xie, S., and Wu, Y. (2020). Estimations and uncertainty of biogenic volatile organic compound emission inventory in China for 2008-2018. Sci. Total Environ. 733:139301. doi: 10.1016/j.scitotenv.2020.139301
Li, L. Y., and Xie, S. D. (2014). Historical variations of biogenic volatile organic compound emission inventories in China, 1981-2003. Atmos. Environ. 95, 185–196. doi: 10.1016/j.atmosenv.2014.06.033
Lim, Y.-J., Armendariz, A., Son, Y.-S., and Kim, J.-C. (2011). Seasonal variations of isoprene emissions from five oak tree species in East Asia. Atmos. Environ. 45, 2202–2210. doi: 10.1016/j.atmosenv.2011.01.066
Llusià, J., Peñuelas, J., Guenther, A., and Rapparini, F. (2013). Seasonal variations in terpene emission factors of dominant species in four ecosystems in NE Spain. Atmos. Environ. 70, 149–158. doi: 10.1016/j.atmosenv.2013.01.005
Llusià, J., Peñuelas, J., Sardans, J., Owen, S. M., and Niinemets, Ü. (2010). Measurement of volatile terpene emissions in 70 dominant vascular plant species in Hawaii: Aliens emit more than natives. Glob. Ecol. Biogeogr. 19, 863–874. doi: 10.1111/j.1466-8238.2010.00557.x
Loreto, F., Bagnoli, F., and Fineschi, S. (2009). One species, many terpenes: Matching chemical and biological diversity. Trends Plant Sci. 14, 416–420. doi: 10.1016/j.tplants.2009.06.003
Loreto, F., and Schnitzler, J.-P. (2010). Abiotic stresses and induced BVOCs. Trends Plant Sci. 15, 154–166. doi: 10.1016/j.tplants.2009.12.006
Ma, M., Gao, Y., Ding, A., Su, H., Liao, H., Wang, S., et al. (2021). Development and assessment of a high-resolution biogenic emission inventory from urban green spaces in China. Environ. Sci. Technol. 56, 175–184. doi: 10.1021/acs.est.1c06170
Mu, Z., Llusià, J., Zeng, J., Zhang, Y., Asensio, D., Yang, K., et al. (2022). An overview of the isoprenoid emissions from tropical plant species. Front. Plant Sci. 13:833030. doi: 10.3389/fpls.2022.833030
Niinemets, Ü. (2010a). Mild versus severe stress and BVOCs: Thresholds, priming and consequences. Trends Plant Sci. 15, 145–153. doi: 10.1016/j.tplants.2009.11.008
Niinemets, Ü. (2010b). Responses of forest trees to single and multiple environmental stresses from seedlings to mature plants: Past stress history, stress interactions, tolerance and acclimation. For. Ecol. Manag. 260, 1623–1639. doi: 10.1016/j.foreco.2010.07.054
Niinemets, U., Kuhn, U., Harley, P. C., Staudt, M., Arneth, A., Cescatti, A., et al. (2011). Estimations of isoprenoid emission capacity from enclosure studies: Measurements, data processing, quality and standardized measurement protocols. Biogeosciences 8, 2209–2246.
Ormeno, E., Gentner, D. R., Fares, S., Karlik, J., Park, J. H., and Goldstein, A. H. (2010). Sesquiterpenoid emissions from agricultural crops: Correlations to monoterpenoid emissions and leaf terpene content. Environ. Sci. Technol. 44, 3758–3764. doi: 10.1021/es903674m
Ortega, J., and Helmig, D. (2008). Approaches for quantifying reactive and low-volatility biogenic organic compound emissions by vegetation enclosure techniques – part A. Chemosphere 72, 343–364. doi: 10.1016/j.chemosphere.2007.11.020
Ortega, J., Helmig, D., Daly, R. W., Tanner, D. M., Guenther, A. B., and Herrick, J. D. (2008). Approaches for quantifying reactive and low-volatility biogenic organic compound emissions by vegetation enclosure techniques – Part B: Applications. Chemosphere 72, 365–380. doi: 10.1016/j.chemosphere.2008.02.054
Otter, L. B., Guenther, A., and Greenberg, J. (2002). Seasonal and spatial variations in biogenic hydrocarbon emissions from southern African savannas and woodlands. Atmos. Environ. 36, 4265–4275. doi: 10.1016/s1352-2310(02)00333-3
Ouyang, L., Wu, J., Zhao, P., Zhu, L. W., and Ni, G. Y. (2021). Stand age rather than soil moisture gradient mainly regulates the compromise between plant growth and water use of Eucalyptus urophylla in hilly South China. Land Degrad. Dev. 32, 2423–2436. doi: 10.1002/ldr.3921
Padhy, P. K., and Varshney, C. K. (2005a). Emission of volatile organic compounds (VOC) from tropical plant species in India. Chemosphere 59, 1643–1653. doi: 10.1016/j.chemosphere.2005.01.046b
Padhy, P. K., and Varshney, C. K. (2005b). Isoprene emission from tropical tree species. Environ. Pollut. 135, 101–109. doi: 10.1016/j.envpol.2004.10.003
Peñuelas, J., and Staudt, M. (2010). BVOCs and global change. Trends Plant Sci. 15, 133–144. doi: 10.1016/j.tplants.2009.12.005
Purser, G., Drewer, J., Heal, M. R., Sircus, R. A. S., Dunn, L. K., and Morison, J. I. L. (2021). Isoprene and monoterpene emissions from alder, aspen and spruce short-rotation forest plantations in the United Kingdom. Biogeosciences 18, 2487–2510. doi: 10.5194/bg-18-2487-2021
Purser, G., Heal, M. R., White, S., Morison, J. I. L., and Drewer, J. (2020). Differences in isoprene and monoterpene emissions from cold-tolerant eucalypt species grown in the UK. Atmos. Pollut. Res. 11, 2011–2021. doi: 10.1016/j.apr.2020.07.022
Scott, C. E., Arnold, S. R., Monks, S. A., Asmi, A., Paasonen, P., and Spracklen, D. V. (2017). Substantial large-scale feedbacks between natural aerosols and climate. Nat. Geosci. 11, 44–48. doi: 10.1038/s41561-017-0020-5
Šimpraga, M., Takabayashi, J., and Holopainen, J. K. (2016). Language of plants: Where is the word? J. Integr. Plant Biol. 58, 343–349. doi: 10.1111/jipb.12447
Singh, A. P., Singh, R., Mina, U., Singh, M. P., and Varshney, C. K. (2011). Emissions of monoterpene from tropical Indian plant species and assessment of VOC emission from the forest of Haryana state. Atmos. Pollut. Res. 2, 72–79. doi: 10.5094/apr.2011.009
Singh, A. P., and Varshney, C. K. (2006). Isoprene emission from the forest of Haryana State. Environ. Monit. Assess. 122, 145–151. doi: 10.1007/s10661-005-9170-9
Singh, A. P., Varshney, C. K., and Singh, U. K. (2007). Seasonal variations in isoprene emission from tropical deciduous tree species. Environ. Monit. Assess. 131, 231–235. doi: 10.1007/s10661-006-9471-7
Singh, R., Singh, A. P., Singh, M. P., Kumar, A., and Varshney, C. K. (2008). Emission of isoprene from common Indian plant species and its implications for regional air quality. Environ. Monit. Assess. 144, 43–51. doi: 10.1007/s10661-007-9940-7
Singh, R., Singh, M. P., and Singh, A. P. (2014). Ozone forming potential of tropical plant species of the Vidarbha region of Maharashtra state of India. Urban For. Urban Green. 13, 814–820. doi: 10.1016/j.ufug.2014.05.007
Situ, S., Wang, X., Guenther, A., Zhang, Y., Wang, X., Huang, M., et al. (2014). Uncertainties of isoprene emissions in the MEGAN model estimated for a coniferous and broad-leaved mixed forest in Southern China. Atmos. Environ. 98, 105–110. doi: 10.1016/j.atmosenv.2014.08.023
Sørensen, M., Rinnan, R., Woodrow, I., Møller, B. L., and Neilson, E. H. J. (2020). The entangled dynamics of eucalypt leaf and flower volatile emissions. Environ. Exp. Bot. 176:104032. doi: 10.1016/j.envexpbot.2020.104032
Staudt, M., Bourgeois, I., Al Halabi, R., Song, W., and Williams, J. (2017). New insights into the parametrization of temperature and light responses of mono - and sesquiterpene emissions from Aleppo pine and rosemary. Atmos. Environ. 152, 212–221. doi: 10.1016/j.atmosenv.2016.12.033
Staudt, M., and Lhoutellier, L. (2011). Monoterpene and sesquiterpene emissions from Quercus coccifera exhibit interacting responses to light and temperature. Biogeosciences 8, 2757–2771. doi: 10.5194/bg-8-2757-2011
Staudt, M., Mandl, N., Joffre, R., and Rambal, S. (2001). Intraspecific variability of monoterpene composition emitted by Quercus ilex leaves. Can. J. For. Res. 31, 174–180. doi: 10.1139/cjfr-31-1-174
Street, R. A., Hewitt, C. N., and Mennicken, S. (1997). Isoprene and monoterpene emissions from a Eucalyptus plantation in Portugal. J. Geophys. Res. Atmos. 102, 15875–15887. doi: 10.1029/97jd00010
Tarvainen, V., Hakola, H., Hellen, H., Back, J., Hari, P., and Kulmala, M. (2005). Temperature and light dependence of the VOC emissions of Scots pine. Atmos. Chem. Phys. 5, 989–998. doi: 10.5194/acp-5-989-2005
Taylor, T. C., Wisniewski, W. T., Alves, E. G., Oliveira Junior, R. C., and Saleska, S. R. (2021). A new field instrument for leaf volatiles reveals an unexpected vertical profile of isoprenoid emission capacities in a tropical forest. Front. For. Glob. Change 4:668228. doi: 10.3389/ffgc.2021.668228
Tsui, J. K.-Y., Guenther, A., Yip, W.-K., and Chen, F. (2009). A biogenic volatile organic compound emission inventory for Hong Kong. Atmos. Environ. 43, 6442–6448. doi: 10.1016/j.atmosenv.2008.01.027
Varshney, C. K., and Singh, A. P. (2003). Isoprene emission from Indian trees. J. Geophys. Res. Atmos. 108:4803. doi: 10.1029/2003jd003866
Wang, J., Zhang, Y., Wu, Z., Luo, S., Song, W., and Wang, X. (2022). Ozone episodes during and after the 2018 Chinese national day holidays in Guangzhou: Implications for the control of precursor VOCs. J. Environ. Sci. 114, 322–333. doi: 10.1016/j.jes.2021.09.009
Wang, P., Schade, G., Estes, M., and Ying, Q. (2017). Improved MEGAN predictions of biogenic isoprene in the contiguous United States. Atmos. Environ. 148, 337–351. doi: 10.1016/j.atmosenv.2016.11.006
Wang, X., Situ, S., Chen, W., Zheng, J., Guenther, A., Fan, Q., et al. (2016). Numerical model to quantify biogenic volatile organic compound emissions: The Pearl River Delta region as a case study. J. Environ. Sci. 46, 72–82. doi: 10.1016/j.jes.2015.08.032
Wang, X., Situ, S. P., Guenther, A., Chen, F., Wu, Z. Y., Xia, B. C., et al. (2011). Spatiotemporal variability of biogenic terpenoid emissions in Pearl River Delta, China, with high resolution landcover and meteorological data. Tellus B 63, 241–254. doi: 10.1111/j.16000889.2010.00523.x
Welter, S., Bracho-Nunez, A., Mir, C., Zimmer, I., Kesselmeier, J., Lumaret, R., et al. (2012). The diversification of terpene emissions in Mediterranean oaks: Lessons from a study of Quercus suber, Quercus canariensis and its hybrid Quercus afares. Tree Physiol. 32, 1082–1091. doi: 10.1093/treephys/tps069
Wen, Y., Chen, F., Liu, S., Liang, H., Yuan, C. A., and Zhu, H. (2008). Relationship between species diversity and biomass of Eucalyptus plantation in Guangxi. Sci. Silvae Sin. 44, 14–19.
Willis, K. J., and Petrokofsky, G. (2017). The natural capital of city trees. Science 356, 374–376. doi: 10.1126/science.aam9724
Winters, A. J., Adams, M. A., Bleby, T. M., Rennenberg, H., Steigner, D., Steinbrecher, R., et al. (2009). Emissions of isoprene, monoterpene and short-chained carbonyl compounds from Eucalyptus spp. in southern Australia. Atmos. Environ. 43, 3035–3043. doi: 10.1016/j.atmosenv.2009.03.026
Xu, L., Guo, H., Boyd, C. M., Klein, M., Bougiatioti, A., Cerully, K. M., et al. (2015). Effects of anthropogenic emissions on aerosol formation from isoprene and monoterpenes in the southeastern United States. Proc. Natl. Acad. Sci. U.S.A. 112, 37–42. doi: 10.1073/pnas.1417609112
Yaman, B., Aydin, Y. M., Koca, H., Dasdemir, O., Kara, M., Altiok, H., et al. (2015). Biogenic volatile organic compound (BVOC) emissions from various endemic tree species in Turkey. Aerosol Air Qual. Res. 15, 341–356. doi: 10.4209/aaqr.2014.04.0082
Yang, D. J., Bai, Y. H., Li, J. L., Pan, N. M., and Yu, K. H. (2001). Study on hydrocarbon compounds from natural source in Pearl River Delta area. China Environ. Sci. 21, 422–426.
Yuan, Y., Sun, Z., Kännaste, A., Guo, M., Zhou, G., and Niinemets, Ü. (2020). Isoprenoid and aromatic compound emissions in relation to leaf structure, plant growth form and species ecology in 45 East-Asian urban subtropical woody species. Urban For. Urban Green. 53:126705. doi: 10.1016/j.ufug.2020.126705
Zeng, J., Zhang, Y., Zhang, H., Song, W., Wu, Z., and Wang, X. (2022). Design and characterization of a semi-open dynamic chamber for measuring biogenic volatile organic compound (BVOC) emissions from plants. Atmos. Meas. Tech. 15, 79–93. doi: 10.5194/amt-15-79-2022
Zhang, P., Zhao, Z., Jia, H., Pang, S., Chen, H., Liu, S., et al. (2021). Effects of gap size on growth, morphology and biomass distribution of Erythrophleum fordii in Eucalyptus plantation. J. Northwest A F Univ. 49:40.
Zhang, Y., Han, Z., Li, X., Zhang, H., Yuan, X., Feng, Z., et al. (2022). Plants and related carbon cycling under elevated ground-level ozone: A mini review. Appl. Geochem. 144:105400. doi: 10.1016/j.apgeochem.2022.105400
Zhang, Y., Zhang, R., Yu, J., Zhang, Z., Yang, W., Zhang, H., et al. (2020). Isoprene mixing ratios measured at twenty sites in China during 2012–2014: Comparison with model simulation. J. Geophys. Res. Atmos. 125:e2020JD033523. doi: 10.1029/2020jd033523
Zhao, J., Bai, Y., Wang, Z., and Zhang, S. (2004). Studies on the emission rates of plants VOCs in China. China Environ. Sci. 24, 654–657.
Keywords: biogenic volatile organic compounds (BVOCs), isoprene, monoterpenes, sesquiterpenes, dynamic chamber, emission factors, subtropical
Citation: Zeng J, Song W, Zhang Y, Mu Z, Pang W, Zhang H and Wang X (2022) Emissions of isoprenoids from dominant tree species in subtropical China. Front. For. Glob. Change 5:1089676. doi: 10.3389/ffgc.2022.1089676
Received: 04 November 2022; Accepted: 01 December 2022;
Published: 15 December 2022.
Edited by:
Jianhuai Ye, Southern University of Science and Technology, ChinaReviewed by:
Dasa Gu, Hong Kong University of Science and Technology, Hong Kong SAR, ChinaMiguel Portillo-Estrada, University of Antwerp, Belgium
Tao Li, Sichuan University, China
Bin Liu, Estonian University of Life Sciences, Estonia
Copyright © 2022 Zeng, Song, Zhang, Mu, Pang, Zhang and Wang. This is an open-access article distributed under the terms of the Creative Commons Attribution License (CC BY). The use, distribution or reproduction in other forums is permitted, provided the original author(s) and the copyright owner(s) are credited and that the original publication in this journal is cited, in accordance with accepted academic practice. No use, distribution or reproduction is permitted which does not comply with these terms.
*Correspondence: Yanli Zhang, ✉ emhhbmdfeWw4NkBnaWcuYWMuY24=
†These authors have contributed equally to this work