
95% of researchers rate our articles as excellent or good
Learn more about the work of our research integrity team to safeguard the quality of each article we publish.
Find out more
ORIGINAL RESEARCH article
Front. For. Glob. Change , 07 November 2022
Sec. Forest Hydrology
Volume 5 - 2022 | https://doi.org/10.3389/ffgc.2022.1044447
This article is part of the Research Topic Effects of Forest Disturbance on Hydrological Processes View all 4 articles
 Qiqi Wang1,2*
 Yuquan Qu1
 Kerri-Leigh Robinson2
 Heye Bogena1
 Alexander Graf1
 Harry Vereecken1Albert Tietema2
 Roland Bol1,2
Deforestation has a wide range of effects on hydrological and geochemical processes. Dissolved organic carbon (DOC) dynamics, a sensitive environmental change indicator, is expected to be affected by deforestation, with changes in atmospheric sulfur (S) deposition compounding this. However, how precisely anthropogenic disturbance (deforestation) under a declining atmospheric S input scenario affects the underlying spatiotemporal dynamics and relationships of river DOC and sulfate with hydro-climatological variables e.g., stream water temperature, runoff, pH, total dissolved iron (Fetot), and calcium (Ca2+) remains unclear. We, therefore, examined this issue within the TERENO Wüstebach catchment (Eifel, Germany), where partial deforestation had taken place in 2013. Wavelet transform coherence (WTC) analysis was applied based on a 10-year time series (2010–2020) from three sampling stations, whose (sub) catchment areas have different proportions of deforested area (W10: 31%, W14: 25%, W17: 3%). We found that water temperature and DOC, sulfate, and Fetot concentrations showed distinct seasonal patterns, with DOC averaging concentrations ranging from 2.23 (W17) to 4.56 (W10) mg L–1 and sulfate concentration ranging from 8.04 (W10) to 10.58 (W17) mg L–1. After clear-cut, DOC significantly increased by 59, 58% in the mainstream (W10, W14), but only 26% in the reference stream. WTC results indicated that DOC was negatively correlated with runoff and sulfate, but positively correlated with temperature, Ca2+, and Fetot. The negative correlation between DOC with runoff and sulfate was apparent over the whole examined 10-year period in W17 but did end in W10 and W14 after the deforestation. Sulfate (SO4) was highly correlated with stream water temperature, runoff, and Fetot in W10 and W14 and with a longer lag time than W17. Additionally, pH was stronger correlated (higher R2) with sulfate and DOC in W17 than in W10 and W14. In conclusion, WTC analysis indicates that within this low mountainous forest catchment deforestation levels over 25% (W10 and W14) affected the coupling of S and C cycling substantially more strongly than “natural” environmental changes as observed in W17.
As one of the most important indicators of the dynamics of an ecosystem, dissolved organic carbon (DOC) plays a key role in biogeochemistry and hydrological nutrient cycling, like in acid-base chemistry, metal export, mobility, and carbon budgets of surface water (Dinsmore et al., 2010; Laudon et al., 2011). DOC dynamics are affected by complex processes, multiple environmental factors, and also anthropogenic disturbances. As a common strategy of forest management, deforestation (clearcut or selective) is an ongoing widespread phenomenon in Europe (Sánchez-Robles et al., 2022), and it exerts a strong effect on hydrological and hydrochemistry processes (Sajdak et al., 2021). Many studies have reported the change of DOC concentrations after clear-cutting (Schelker et al., 2012, 2014; Drake et al., 2019). Generally, DOC concentrations tend to increase after deforestation. This result attributes to the changes in the environmental variables after deforestation, like precipitation and temperature (Evans et al., 2005; Oni et al., 2013; Pumpanen et al., 2014), which highly affects the carbon cycling processes in the forested catchment. Additionally, deforestation would induce effects on DOC by changing hydrological processes. Runoff tends to increase in the short term after forest clear-cutting (Schelker et al., 2013), leading to an increase in nutrient loads (Webb et al., 2012). Also, the stream temperature variability tends to increase after logging (Oanh et al., 2021; Griffith and Kiffney, 2022), which further affects DOC dynamics (Wen et al., 2020).
Global climate change does affect the relative impact of disturbance rates (Dale et al., 2001). The direct impacts of deforestation are more prominent compared to climate warming in the impairment of water quality (Kong et al., 2022). However, the decline of atmospheric S inputs since the 1980s, most pronounced in Europe and the USA, affected the related nutrient dynamics in various ecosystems (Burns et al., 2006; Erlandsson et al., 2008; Li et al., 2019). Sulfur is one of the elements tightly coupled with carbon. Chuman et al. (2021) noted that that the soil organic carbon (C) stocks in the forest floor were best explained by the temporal trends in historical sulfur deposition and the forest type across the Czech Republic. It confirms that that S deposition has a great impact on the C cycling in the forest ecosystems. Meanwhile, there are clear signs of ecosystem recovery, e.g., increase in water pH appeared in water since the reduction of SO2 emission in European and North American countries (Aas et al., 2019). Sulfur deposition affects the soil pH and furthers the solubility of DOC and sulfur (Goller et al., 2006), while high soil water acidity leads to lower DOC solubility. Lepistö et al. (2021) showed that the sulfate (SO4) concentration had a strong significant correlation to total organic carbon (OC) explaining more than 65% of the change in total OC changes. This result underlined the importance of sulfate as a driver of carbon change even though the sulfur deposition has already decreased to a lower level. It indeed turns out that the decline of S deposition is one of the key factors of increasing DOC in European and North American waters (Erlandsson et al., 2008; Xu et al., 2020). Therefore, information is warranted on how deforestation affects the underlying dynamics of C and S dynamics under a declining or lower S deposition scenario. This will also contribute to the wider understanding on how anthropogenic disturbance affects nutrient cycling in ecosystems under climate change.
As we mentioned previously, the solubility of DOC and sulfur could be modified by changes in pH values, this may affected their binding to mineral elements, such as iron, and calcium (Stolpe et al., 2013; Hirst et al., 2022). In soils, carbon is often bound to iron phases and can be released as DOC, by binding with organic matter in surface complexes and aggregates, iron minerals do play an important role in the retention of carbon belowground (Bhattacharyya et al., 2018a,b), and the increasing adsorption of DOC by minerals resulting from desorption of sulfate (Borken et al., 2011). For surface water, DOC concentration shows a positive correlation with iron, and DOC exports partly be caused by increasing activities in iron reduction (Knorr, 2013). Sulfate concentration also links with iron forms and the release of metal elements in water (Yang et al., 2014; Sun et al., 2017). The rising organic carbon concentration tends to coincide with iron increases, and this phenomenon may be linked to the declining sulfur deposition (Björnerås et al., 2017). Additionally, seasonal variations of DOC concentration and transportation are highly driven by water temperature (Rosset et al., 2020). For example, Egea et al. (2019) found that water temperatures positively affected DOC transportation. Hence, how deforestation affects the spatiotemporal relationship between DOC/sulfate and some chemical/hydroclimatic variables (e.g., temperature, runoff, iron, calcium, pH) needs to be addressed.
As a part of the TERENO1 network (Bogena et al., 2018), observations in the Wüstebach catchment were established to address some specific hydrological and biogeochemical questions by providing detailed monitoring of changes from environmental disturbances (Bogena et al., 2015; Wiekenkamp et al., 2016, 2019; Gottselig et al., 2017). Based on the observation platform, Bol et al. (2015) studied the spatiotemporal variations of dissolved organic matter during a 4-year period (2009–2013), covering both stream water and groundwater DOC quality and quantity. They demonstrated that sub- and whole-catchment streams had differences in DOC, pH, and iron dynamics, and extremely dry weather had little effect on stream water catchment chemistry. Another study in this catchment quantified and highlighted the contributions of particulate, colloids, and nanoparticles to weather-driven organic carbon, nitrogen, phosphorus, and sulfur losses (Burger et al., 2021). Weigand et al. (2017) examined the spatio-temporal relationships between DOC and nitrate before the clear-cut by using Wavelet analysis. Their results indicated that water transit time was a key driver for the carbon/nitrogen relationships. Carbon and nitrogen transport in stream water can be explained by the mixing of groundwater and subsurface runoff. In 2013, a part of the spruce trees (23% of the catchment forestation) was logged mostly close to the stream. Several studies reported the effects of this disturbance on hydrological fluxes, for example, the transit time distribution (Stockinger et al., 2016) and water flow paths (Bogena et al., 2020). The deforestation in the Wüstebach catchment caused an increase in discharge and sequential flow occurrence (Wiekenkamp et al., 2016, 2019). Altogether, the detailed monitoring data sets provide deep insights into the hydrological effects before and after the disturbance.
Wavelet analysis overcomes the well-known limits of the widely known Fourier transform, which is not suitable for non-stationary signals with fluctuations as they frequently occur in hydrology. It accounts for non-stationary relationships among data sets and is an effective tool that has been widely applied in hydrology (Labat, 2005; Carey et al., 2013; Graf et al., 2014; Su et al., 2019). We use wavelet analysis to investigate the effects of deforestation on the spatio-temporal relationships between stream water DOC and sulfate (SO4) concentrations and other variables (i.e., water temperature, runoff, iron, calcium, and pH).
The study site Wüstebach catchment (50°30′N, 6°20′E), Germany, is located in the Eifel National Park. It is also part of the Eifel/Lower Rhine Valley Observatory of the Terrestrial Environmental Observatories (TERENO) network, (see text footnote 1) which is a large-scale project aimed at monitoring the long-term impacts of environmental change on a regional scale. The site was equipped with measurements starting in 2004. Norway spruce [Picea abies (L.) Karst.] and Sitka spruce [Picea sitchensis (Bong.) Carrière] are dominating the vegetation (Etmann, 2009). There are mainly four soil types including Cambisols and Planosols (according to the World Reference Base; IUSS Working Group, 2006) in the drier regions and Gleysols and Histosols around the stream (Figure 1). The climate is humid temperate with a mean annual precipitation of ∼1,200 mm (Bogena et al., 2010) and a mean annual temperature of 7°C (Zacharias et al., 2011). The investigated catchment has an area of 38.5 ha with altitudes ranging from 595 to 628 m (Stockinger et al., 2014; Bogena et al., 2015).
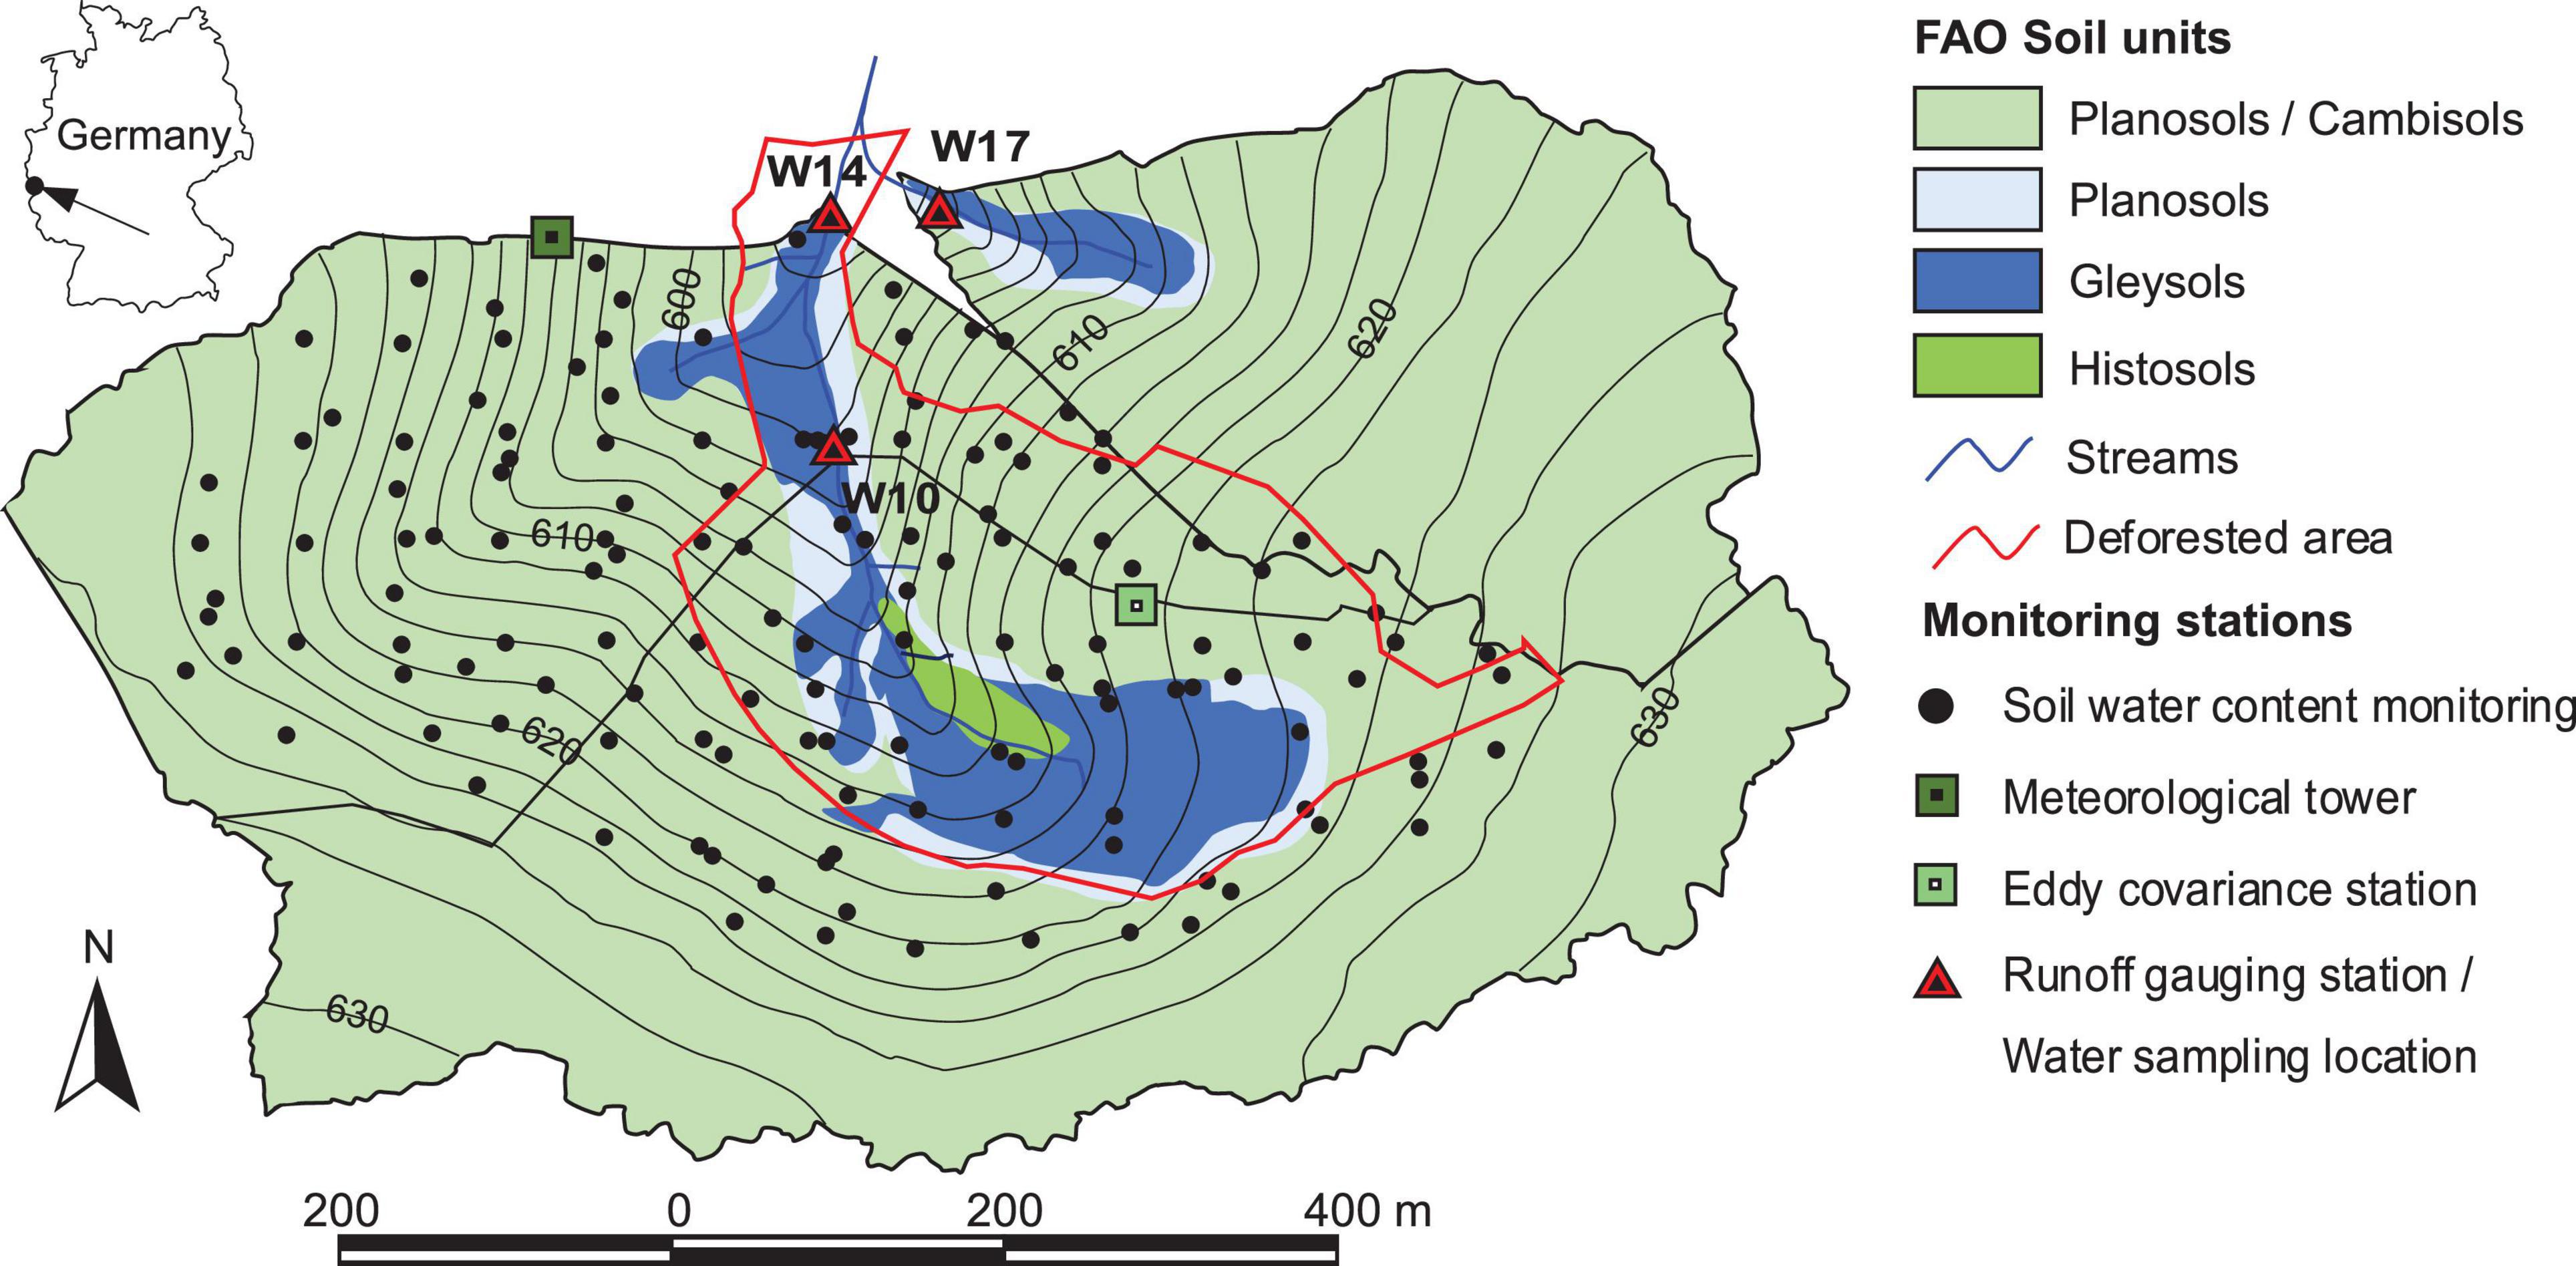
Figure 1. Map of Wüstebach catchment including soil type, the three water sampling stations (W10, W14, W17) and their (sub) catchment area (modified from Wiekenkamp et al., 2016).
In late summer (August–September) of 2013, ∼8.6 ha of spruce trees [Picea abies L. and Picea sitchensis (Bong.) Carrière, planted ∼1948] were logged (97% of the forest biomass) close to the stream (22.3% of the catchment forestation) to allow for the natural regeneration of deciduous forest (Figure 1). In our study, there are 30.81 and 25.36% of the deforested area in W10 and W14, respectively. A smaller tributary catchment (11.4 ha), situated immediately northeast of the Wüstebach (Figure 1), was used as a reference catchment for comparison purposes because it has similar site specifics but little deforested (3.07%).
Runoff is measured by both of a V-notch weir and a Parshall flume, for water levels below 5 cm and water levels greater than 10 cm, respectively. Runoff associated with intermediate water levels is computed as a linear combination of both (Bogena et al., 2015). Water chemistry properties are measured in the laboratory with weekly samples collecting. DOC is determined as non-purgeable organic carbon with a Shimadzu TOC-VCPN analyzer, sulfate, dissolved calcium (Ca2+), and total dissolved iron (Fetot) are measured using ion chromatography. Water temperature and pH were measured manually at each sampling station using field instruments (WTW, Xylem Inc., Bol et al., 2015). Details about sampling and measurement can be found in Bogena et al., 2015, 2018.
Equidistant and continuous data sets were needed for the wavelet analysis. Therefore, data gaps were gap-filled before the analysis. For DOC, sulfate, temperature and runoff, weekly data from 4th January 2010 to 30th December 2019 (522 weeks) were used, for Fetot, Ca2+ and pH, weekly data from 4th January 2011 to 30th December 2019 (470 weeks) were used. Descriptive statistics for these datasets (Supplementary Table 1) and gap-filling methods are described in Supplementary material.
The Wavelet Transform Coherence (WTC) is a correlation coefficient localized in time and frequency space and is used to quantify the degree of the linearity relationship between two non-stationary series in the time and frequency domains (Cazelles et al., 2008). WTC analysis reveals regions in this time-frequency space where time series of two variables covary but do not necessarily have high power. In addition, it accounts for the frequency, duration, degree, and point in time of the correlation within the investigation period, as well as possible lagging between the two compared variables (Weigand et al., 2017). Before the WTC can be calculated, continuous wavelet transforms (CWT) need to be calculated. A wavelet is a function with zero mean localized in both frequency and time. In particular, the Morlet wavelet used here is defined as in Grinsted et al. (2004).
where ω0 is dimensionless frequency and η is dimensionless time, i is the imaginary part.
The effect of CWT is to apply the wavelet as bandpass filter to the time series. The wavelet is stretched in time by varying its scale (s), so that η = s?δt, and normalizing it to have unit energy. For the Morlet wavelet (with ω0 = 6) the Fourier period (λωt = 1.03s) is almost equal to the scale (λωt = 1.03s). The CWT of a time series (xn,n = 1,…,N) with uniform time steps δt, is defined as the convolution of xn with the scaled and normalized wavelet.
The detailed definition of WTC can be found in Labat (2005); Weigand et al. (2017), and Su et al. (2019). Grinsted et al. (2004) defined the WTC of two time series as follows:
S is the smoothing operator; s is the scale. X is the time series x = [xn], and Y is the time series y = [yn]. A smoothing operator (Stime) is used that has a similar footprint to the Morlet wavelet (Torrence and Webster, 1999):
Where Sscaleis the smoothing along the wavelet scale x-axis and Stime is the smoothing in time. The thin solid line indicates the cone of influence (COI), the 95% confidence level based on Monte Carlo test is indicated by thick black contour lines. In the graphical representations, the x-axis indicates the time and the y-axis displays the periods (in weeks). The direction of the arrows indicates both the orientation of the correlation and the time delay between the two variables. Right-directed arrows indicate positive relationships (in-phase), while left-directed arrows indicate negative relationships (anti-phase). An upward-pointed arrow means the second variable lags behind the first by 90° (one-fourth period, at a period of 64 weeks this equals 16 weeks).
In this study, the WTC analysis was conducted using the Matlab package developed by Grinsted et al. (2004). The differences in variables among the 3 observation sites were tested by the One-Way ANOVA method (Duncan significant differences P = 0.05) in SPSS 26.
The average DOC concentrations were 4.56 mg L–1 (± 2.44), 3.52 mg L–1 (± 1.90), and 2.24 mg L–1 (± 1.10) in W10, W14, and W17, respectively. The average sulfate (SO4) concentrations were 7.68 mg L–1 (± 1.75, W14), 8.04 mg L–1 (± 2.11, W10), and 10.85 mg L–1 (± 1.41, W17). The temperature in W10 (8.70°C) and W14 (9.13°C) was significantly higher than in W17 (8.04°C) (Supplementary Table 1 and Supplementary Figure 1). The DOC, Fetot concentration, and DOC/sulfate ratio in W10 were significantly higher than in W14 and W17. The Ca2+ concentration in W10 (5.91 mg L–1) and W14 (6.83 mg L–1) were obviously higher than that in W17 (3.05 mg L–1). The sulfate concentration in W17 was significantly higher than in W10 and W14 (Supplementary Table 1 and Supplementary Figure 1).
Runoff, temperature, DOC, sulfate, and DOC/sulfate ratio all showed obvious seasonal patterns (Figure 2 and Supplementary Figure 2). The highest temperature, DOC concentrations, and DOC/sulfate ratios showed in the summer, while the lowest values showed in the winter. The highest sulfate content was mostly observed in winter and the lowest was mostly in summer. Compared with runoff and sulfate, the DOC concentrations showed more interannual variability, including an increasing trend, and the fluctuation was higher after the deforestation at all 3 stations. Fluctuations in W10 and W17 were higher and lasted longer compared to W17. At none of the stations pH showed a clear seasonal pattern. Fetot and Ca2+ concentrations in W10 and W14 showed more obvious seasonal patterns and higher values than in W17, where the concentrations peaked in summer (Figure 3).

Figure 2. Time series of dissolved organic carbon (DOC)/sulfate with runoff and temperature, respectively at the three Wüstebach catchment stations (W10, W14, W17). The vertical red line indicates the moment deforestation occurred in late summer 2013.
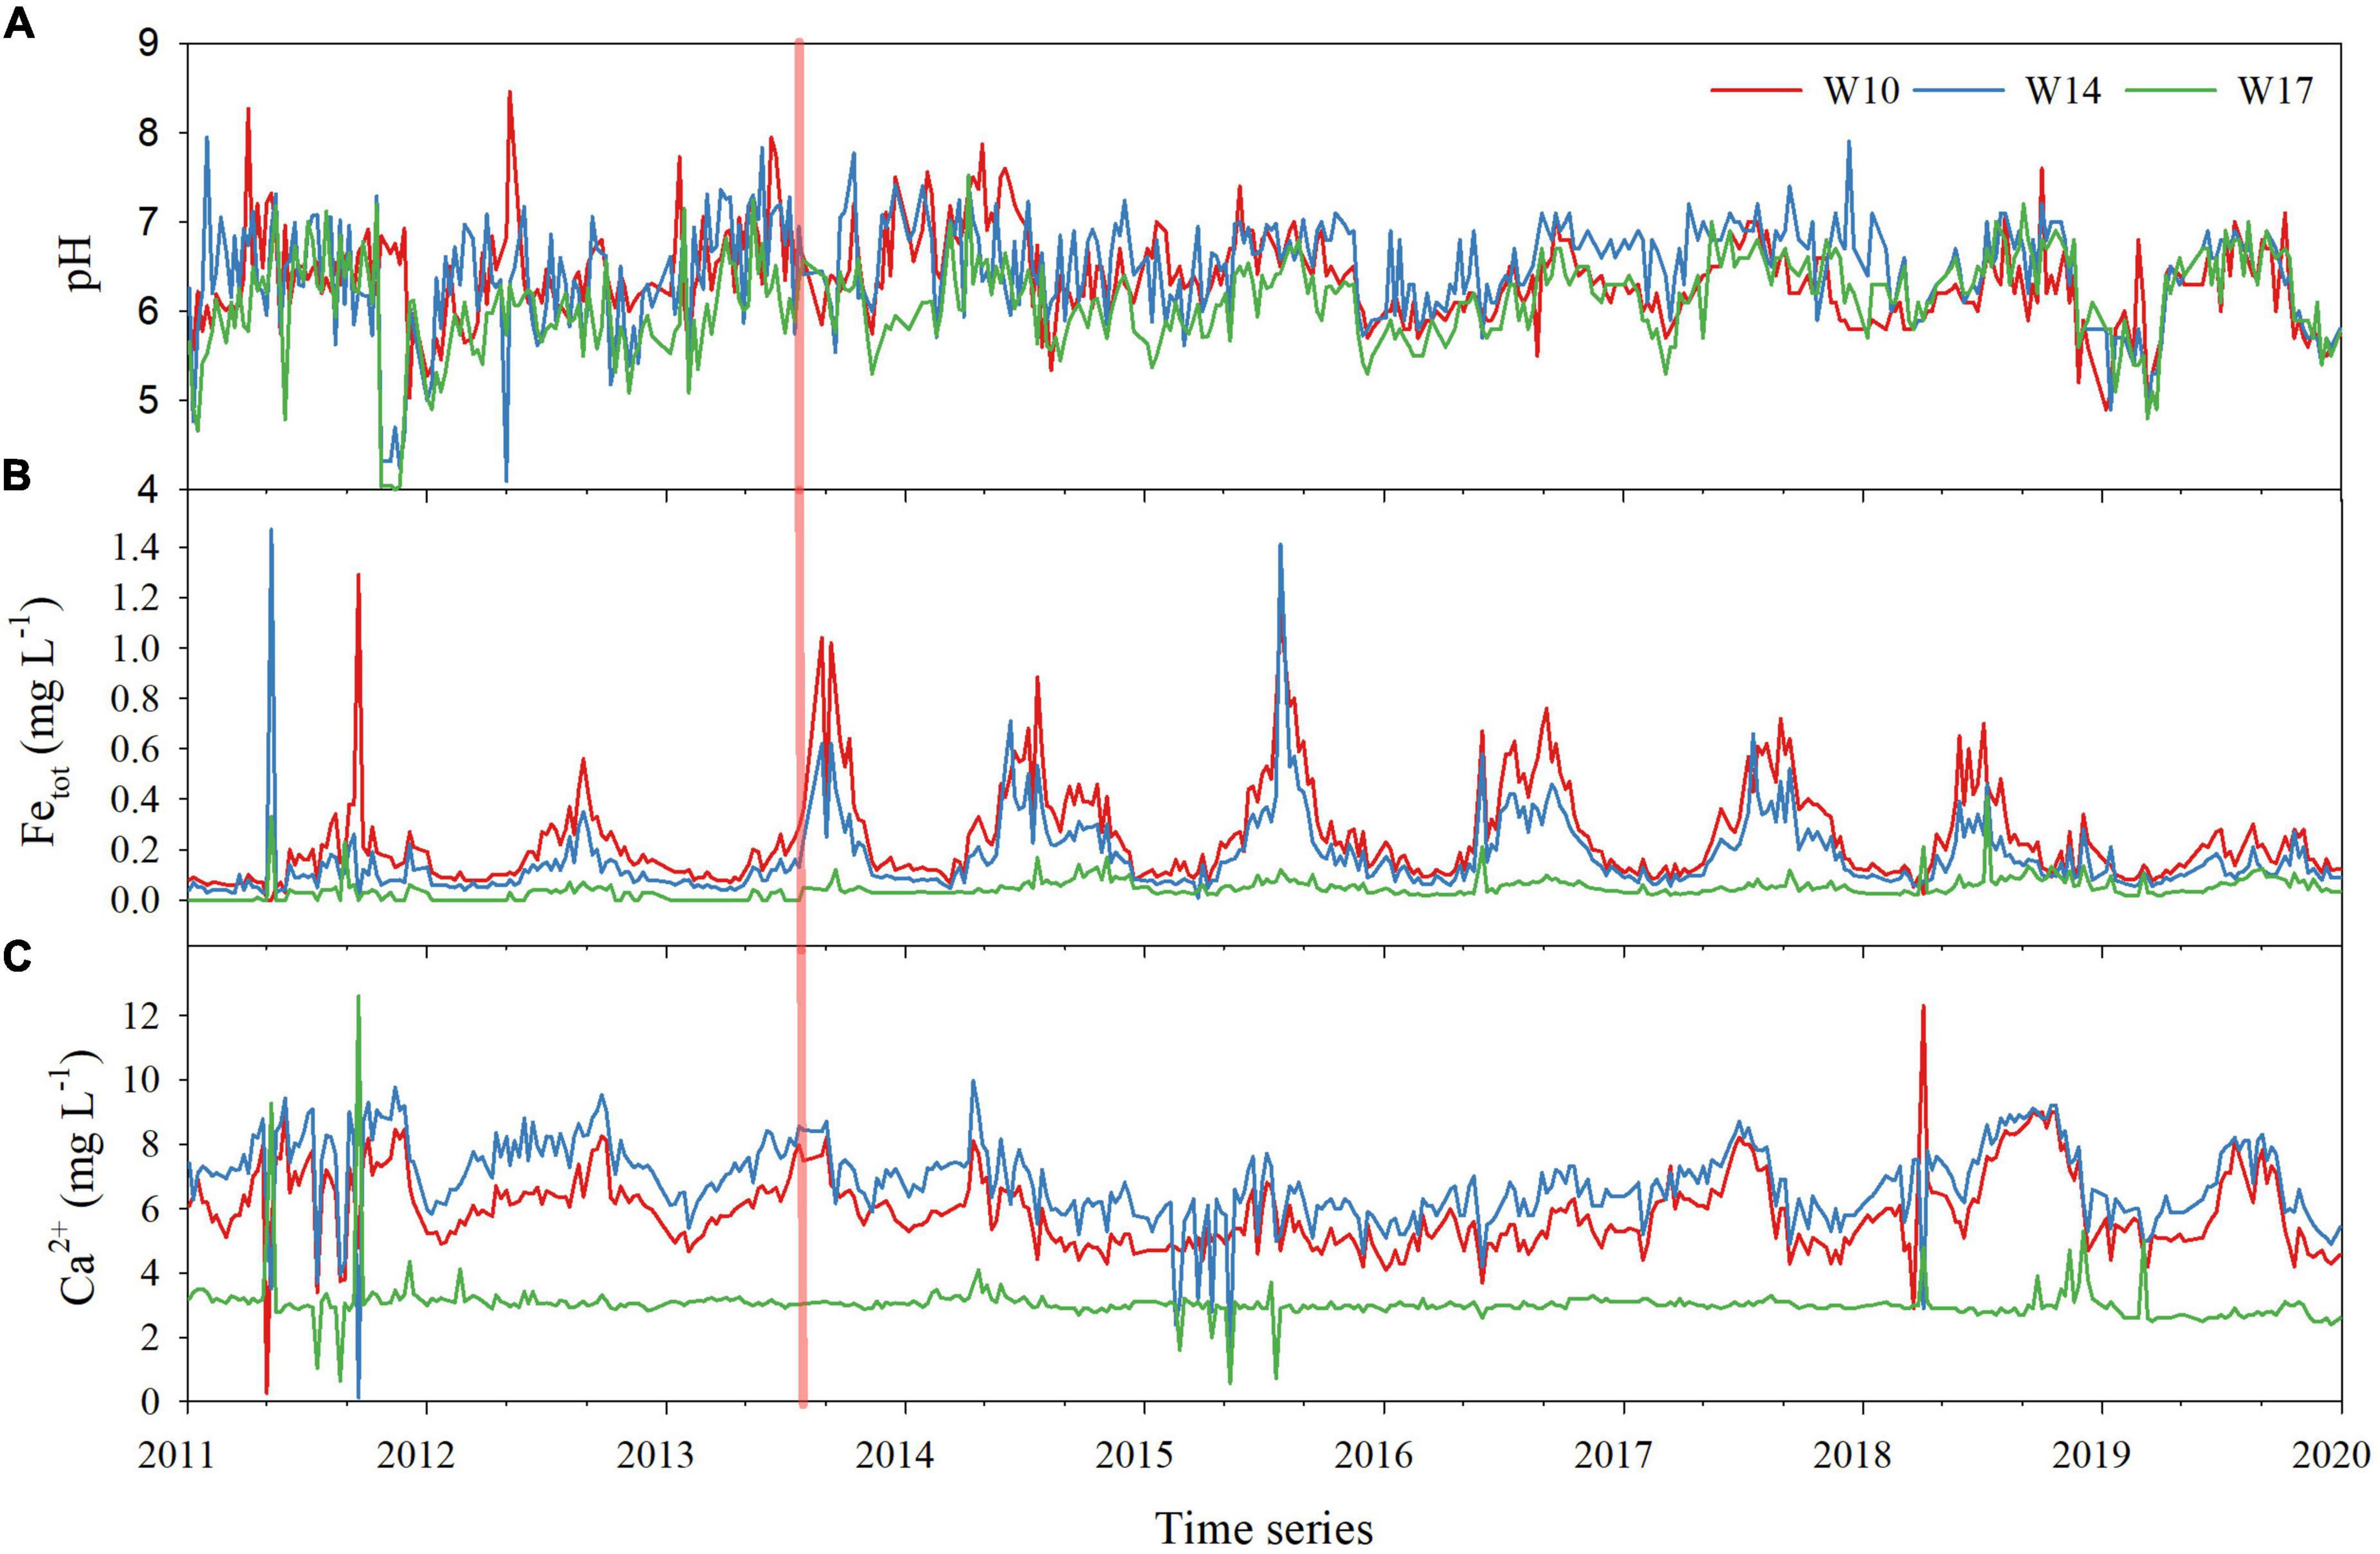
Figure 3. Time series of pH, (A) total dissolved iron (B), (Fetot), Ca2+ (C) concentrations at the three Wüstebach catchment stations (W10, W14, W17). The vertical red line indicates the moment deforestation occurred in late summer 2013.
Runoff and sulfate concentration in the 3 observation stations showed slight change after the deforestation, however, temperature, DOC, DOC/sulfate ratio, pH, Fetot and Ca2+ changed significantly (Figure 4). Specifically, DOC concentrations in W10, W14, and W17 were 5.25, 4.05, and 2.41 mg L–1 after deforestation, corresponding to an increase by 59, 58, and 26%, respectively. Similarly, the DOC to sulfate ratio significantly increased by 66, 68, and 27% in W10, W14, and W17, respectively. The temperature in W10, W14, and W17 increased from 6.90, 7.14, and 7.01°C to 9.66, 10.21, and 8.59°C, respectively. The Fetot concentrations in W10, W14, W17 increased from 0.17, 0.11, 0.02 mg L–1 to 0.28, 0.19, 0.05 mg L–1, respectively. However, the Ca2+ concentrations in W10, W14, W17 decreased from 6.25, 7.43, 3.22 mg L–1 to 5.78, 6.59, 2.98 mg L–1, respectively.
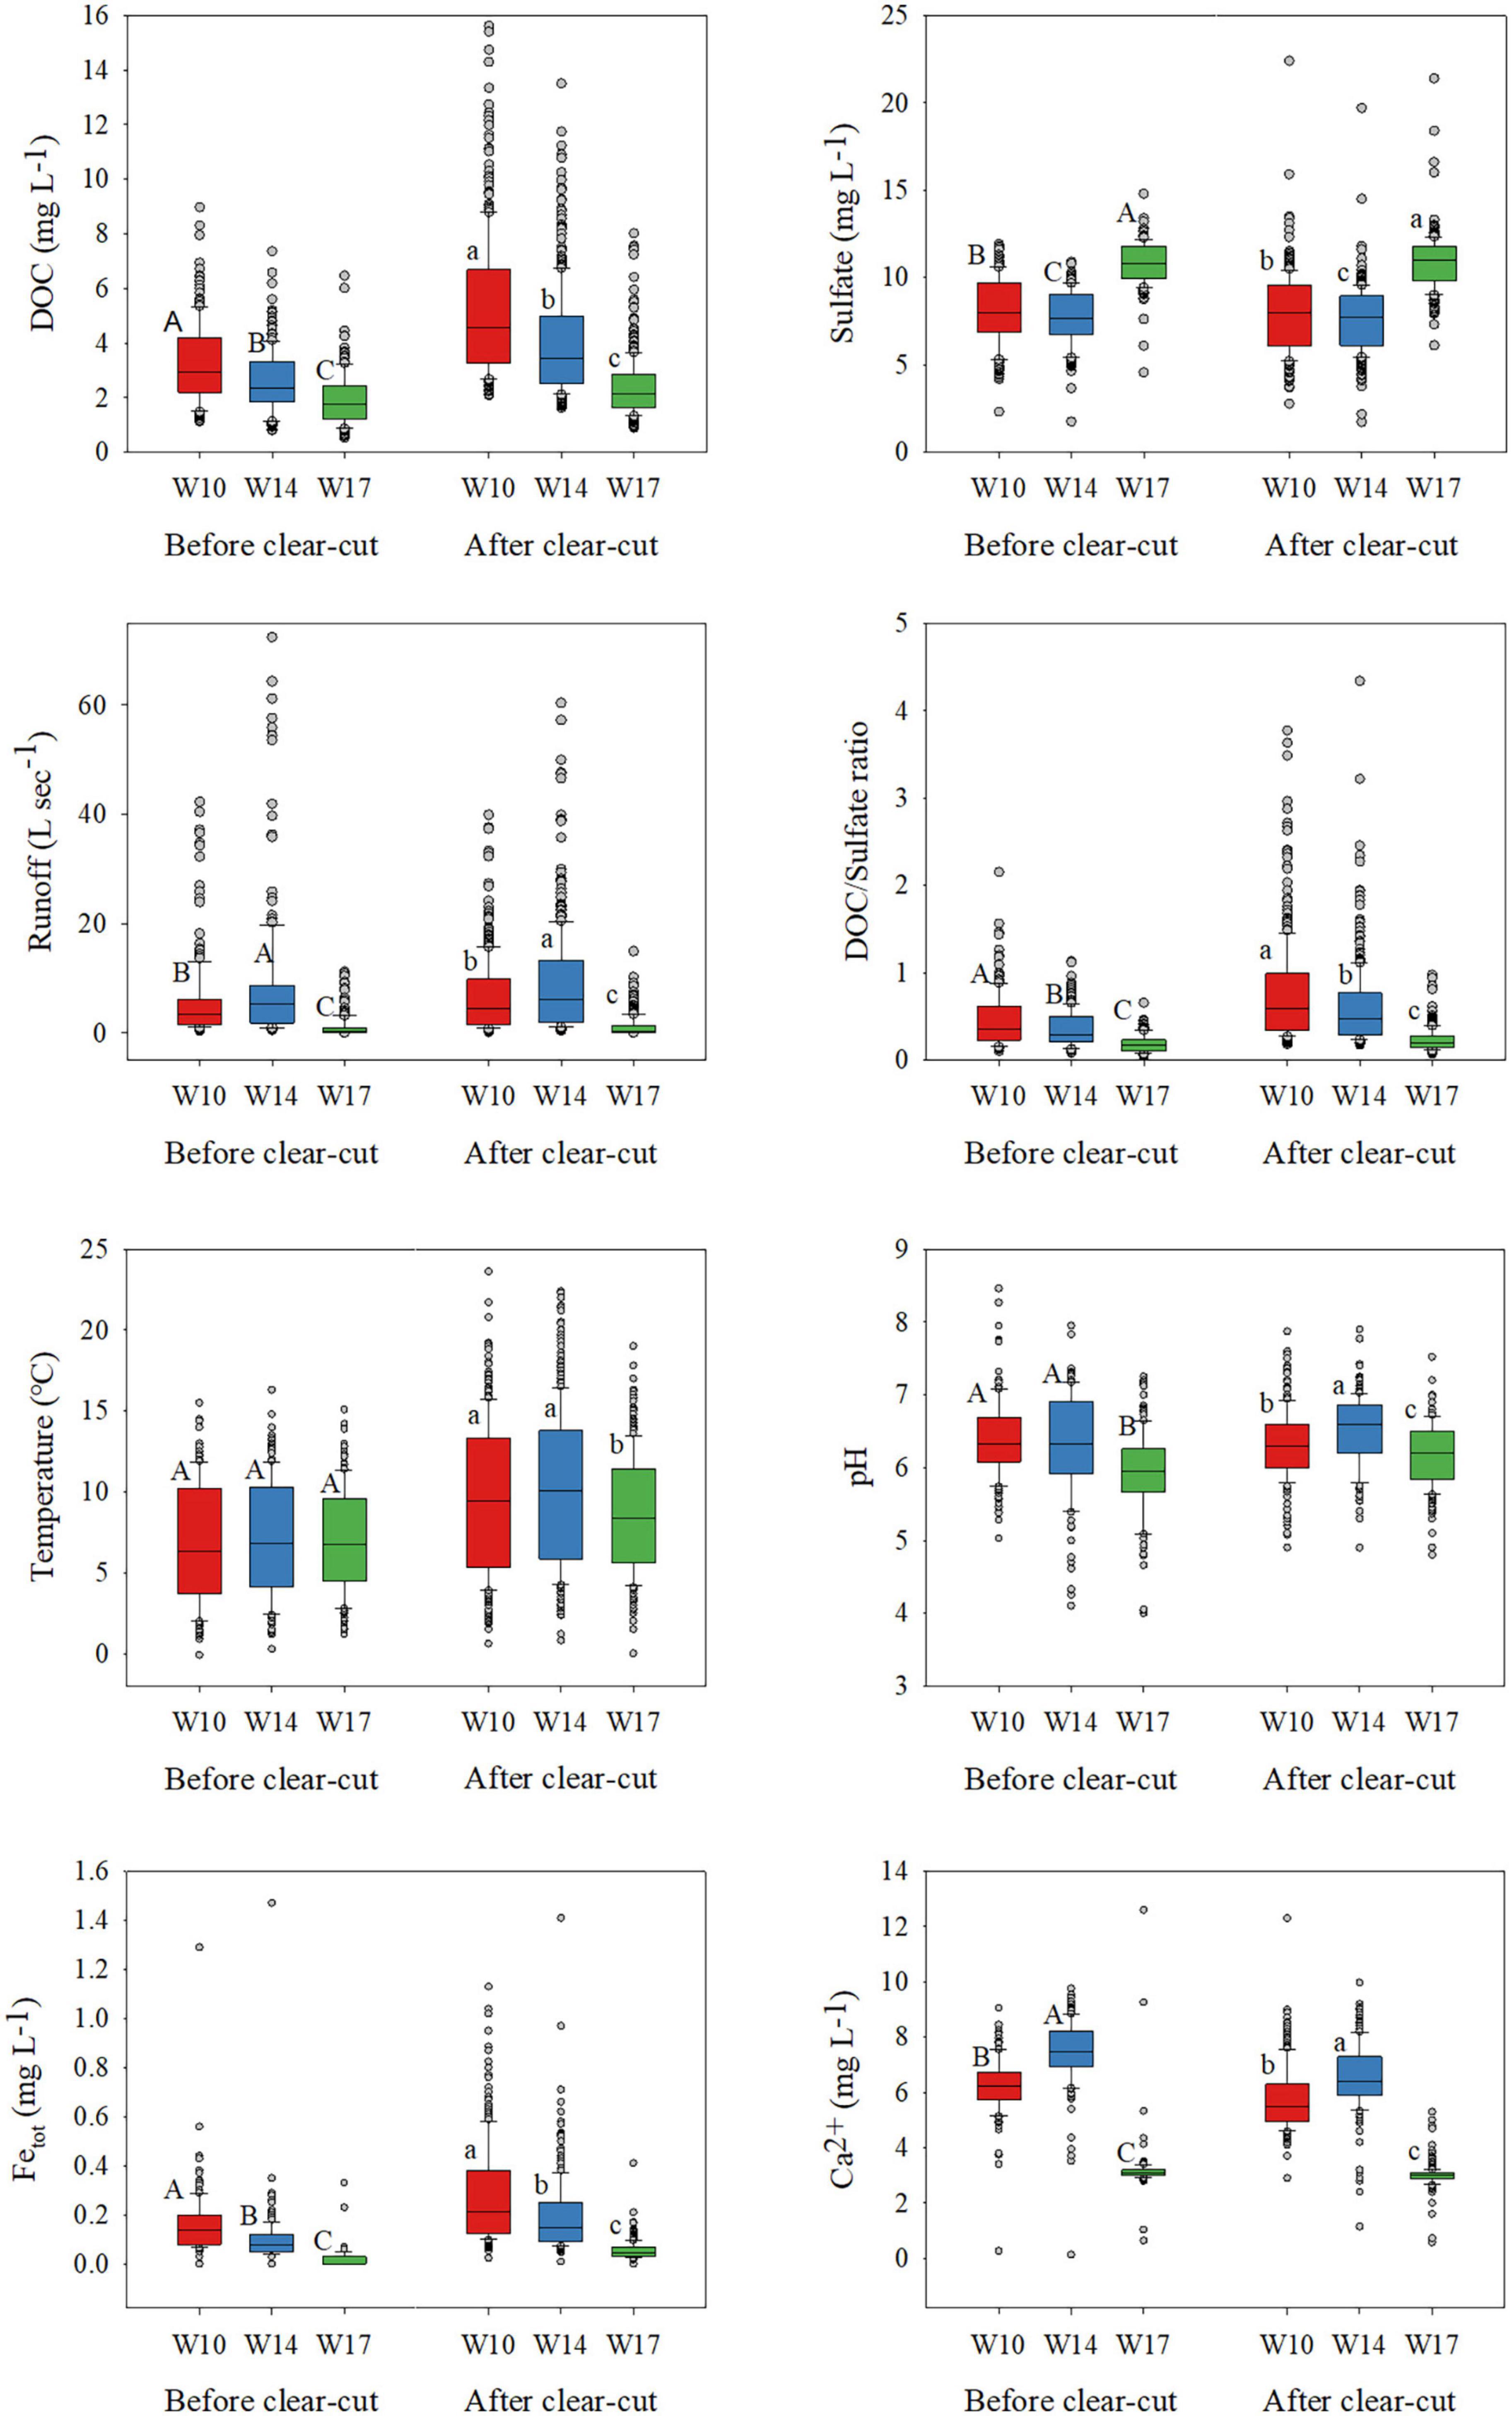
Figure 4. Boxplots before and after clear-cut of different variables at the three Wüstebach catchment stations (W10, W14, W17). DOC: dissolved organic carbon, DOC/Sulfate ratio: DOC to sulfate ratio, Fetot: Total dissolved iron. Different upper and lower letters indicate significant differences among 3 stations before and after the clear-cut, respectively.
Regarding the WTC results of runoff, DOC, sulfate, and DOC/sulfate ratio, disconnected patches of significant high correlations for periods < 32 weeks at all the stations were observed at all stations (Figure 5). Runoff and DOC had negative relationships at all stations in the 32–64 weeks period. In W17 (Figure 5G), this correlation lasted throughout the whole investigated period, while in W10 and W14 (Figures 5A,D), the correlation ended in the summer of 2017. The dominating phase shift indicated runoff led DOC by 45° at all stations, which means runoff peaked between 4 and 8 weeks before DOC. Runoff and sulfate had positive relationships from 32 to 100 weeks period at all stations (Figures 5B,E,H). The dominating phase shifted to a perfect positive correlation after 2015. It is worth noting that strong coherence between runoff and sulfate was observed at a long-term scale (128 weeks period onward) in W10 and W14, but not in W17. With DOC/sulfate ratio lagging by 45° to a perfect anti-phase correlation, DOC/sulfate ratio showed a negative correlation with runoff. This correlation showed in the 32–64 weeks period at all stations (Figures 5C,F,I).
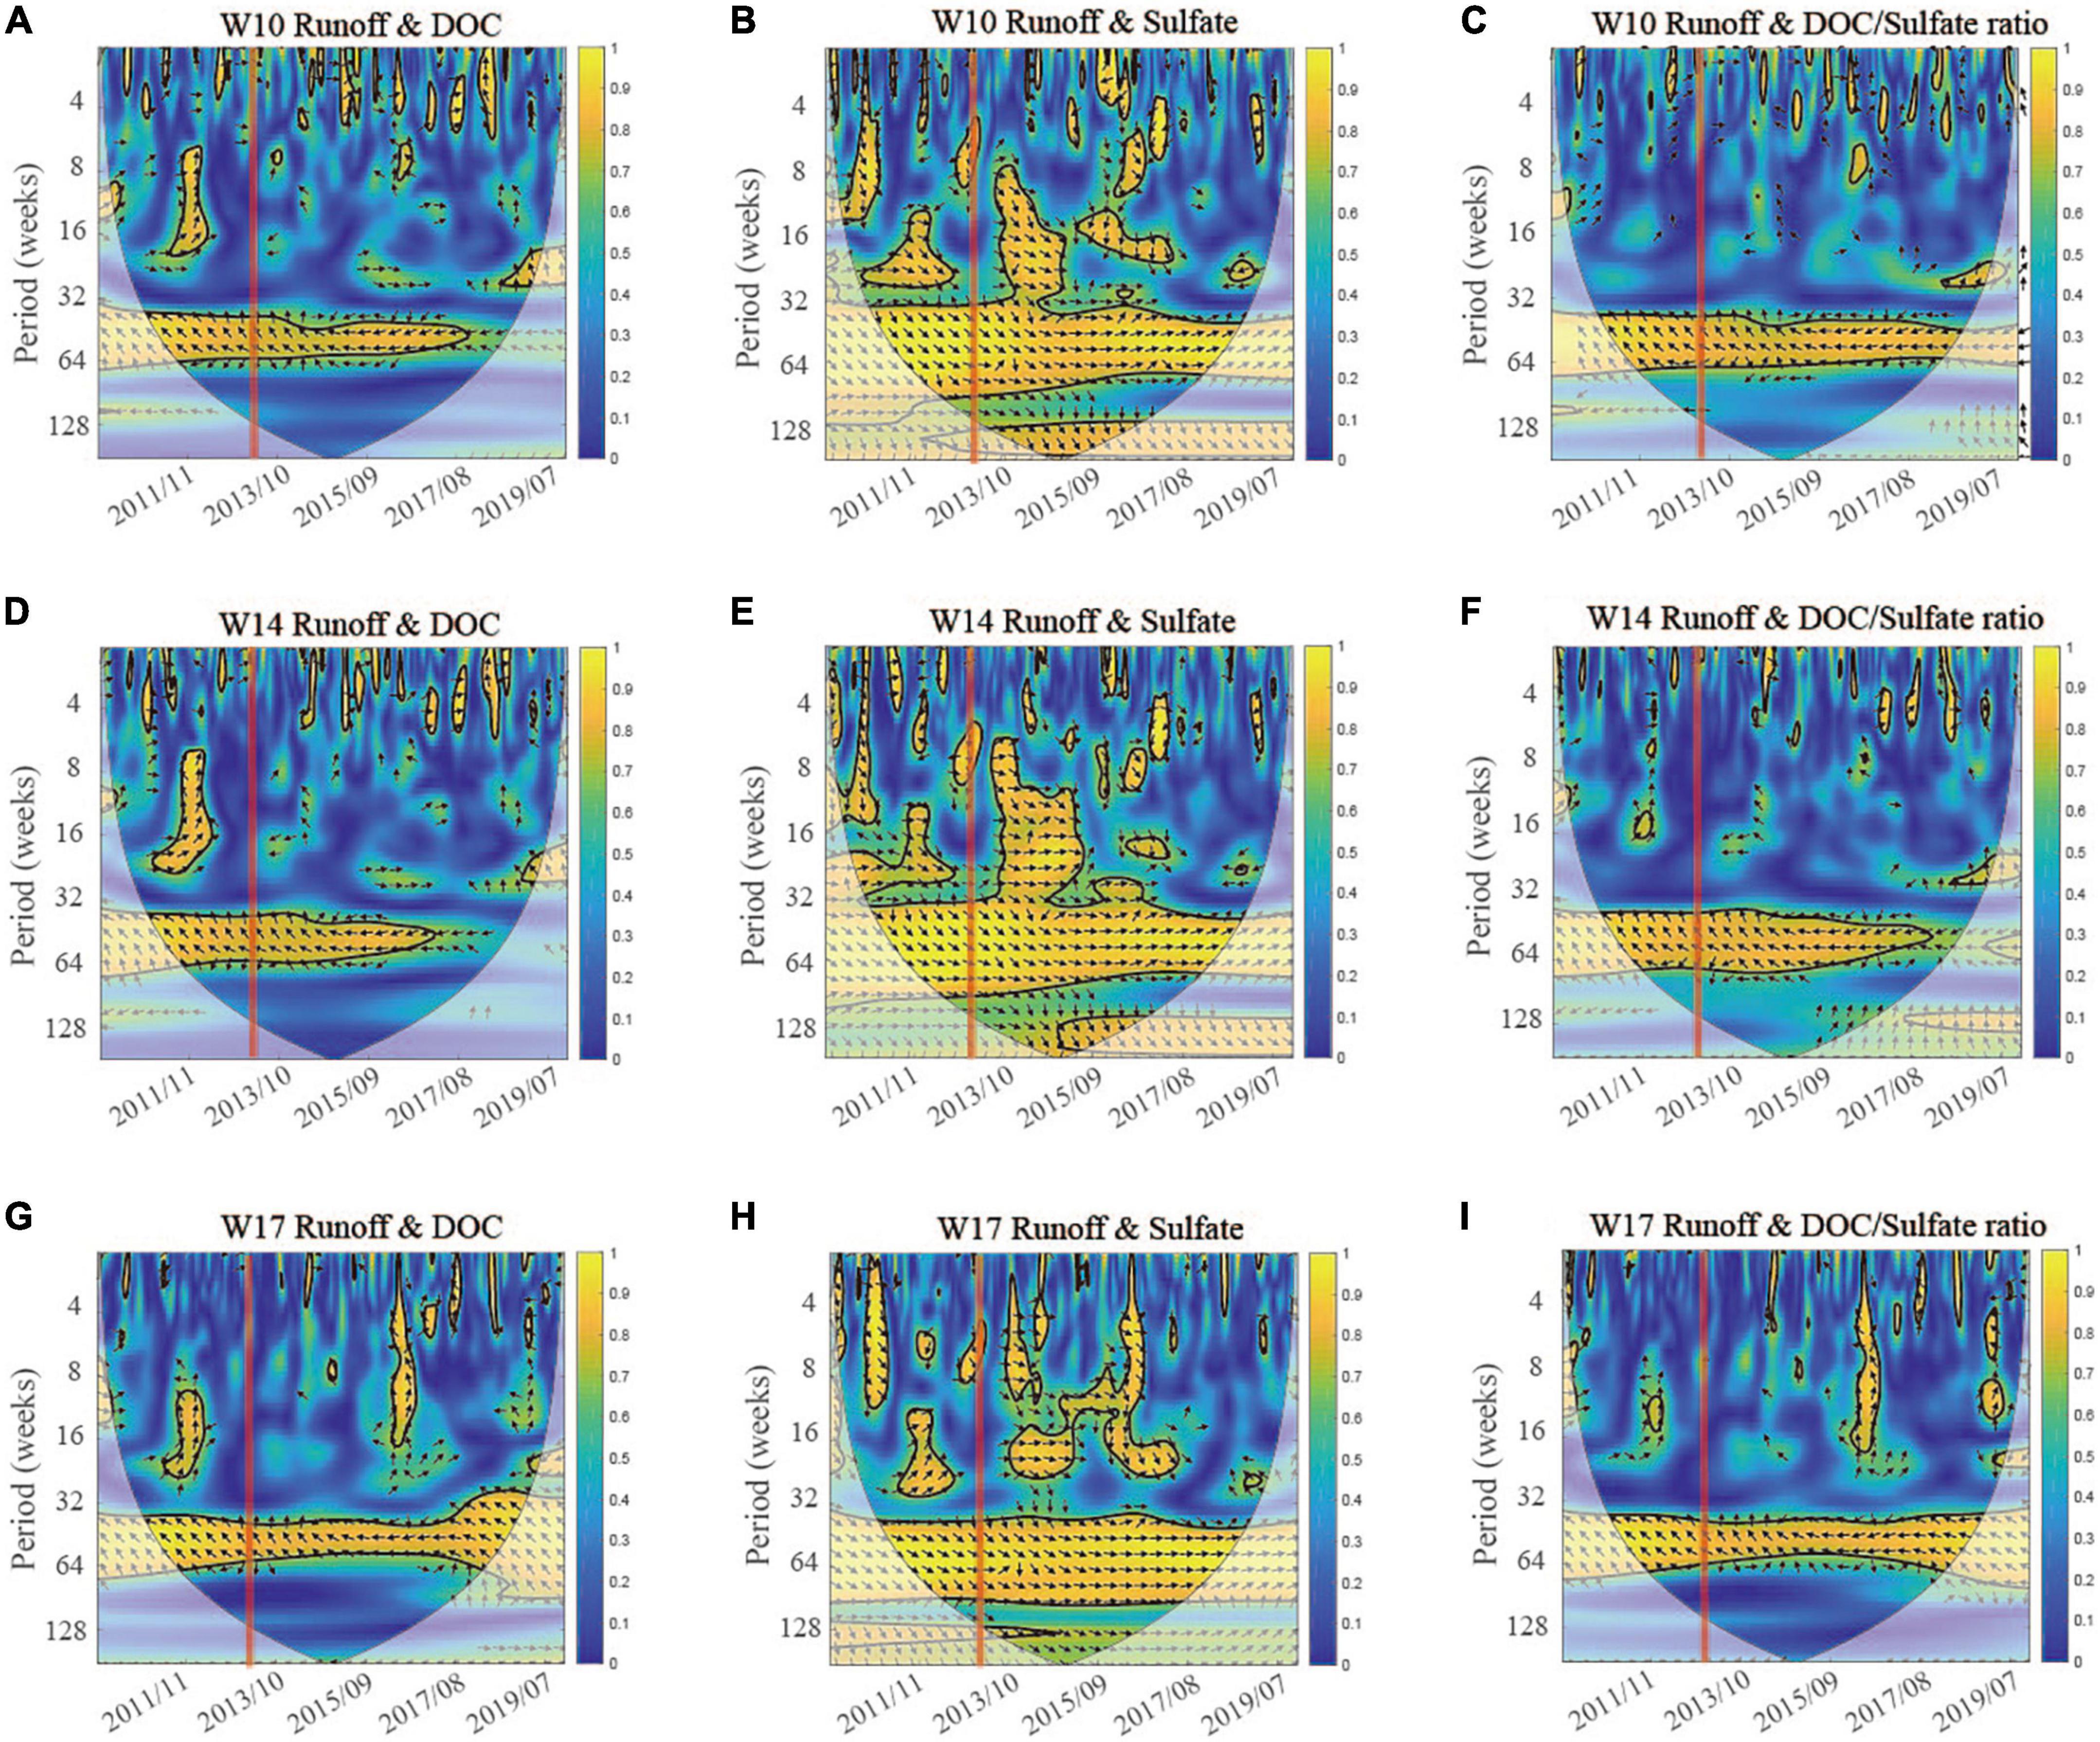
Figure 5. The WTC analysis between runoff and dissolved organic carbon (DOC), sulfate, DOC/Sulfate ratio at 3 Wüstebach catchment stations (W10, W14, W17). The X-axis indicates the time and the y-axis displays the periods (in weeks). The cone of influence (COI) is shown as a cone-shaped area with thick black line (95% confidence level based on Monte Carlo test). The different colors indicate the strength of the correlation (R2) from 0 to 1. The black arrows indicate the orientation of the correlation with R2 > 0.5 and the phase shifts between two variables (right directed: in-phase, positive, left directed: anti-phase, negative). The vertical red line indicates the moment deforestation occurred in late summer 2013.
Considering the wavelet results between temperature and DOC, sulfate, and their ratio (Figure 6), perfect positive correlations were observed between temperature and DOC, and DOC/sulfate ratio in 32–64 weeks period in W10, W14, and W17. Conversely, anti-phase correlations between temperature and sulfate in the 32–64 weeks period were found in all stations (Figures 6B,E,H). Also, compared with W17 (Figure 6H), there was no considerable change in terms of phase shift, and frequency band in the 32–64 weeks period in W10 and W14. However, the correlation changed to a period of ca. 80–100 weeks from 2013 to 2015 in W10 and W14, with sulfate leading temperature by approximately 45° and a larger frequency band showed around 128 weeks period from 2010 to 2014 (Figures 6B,E).
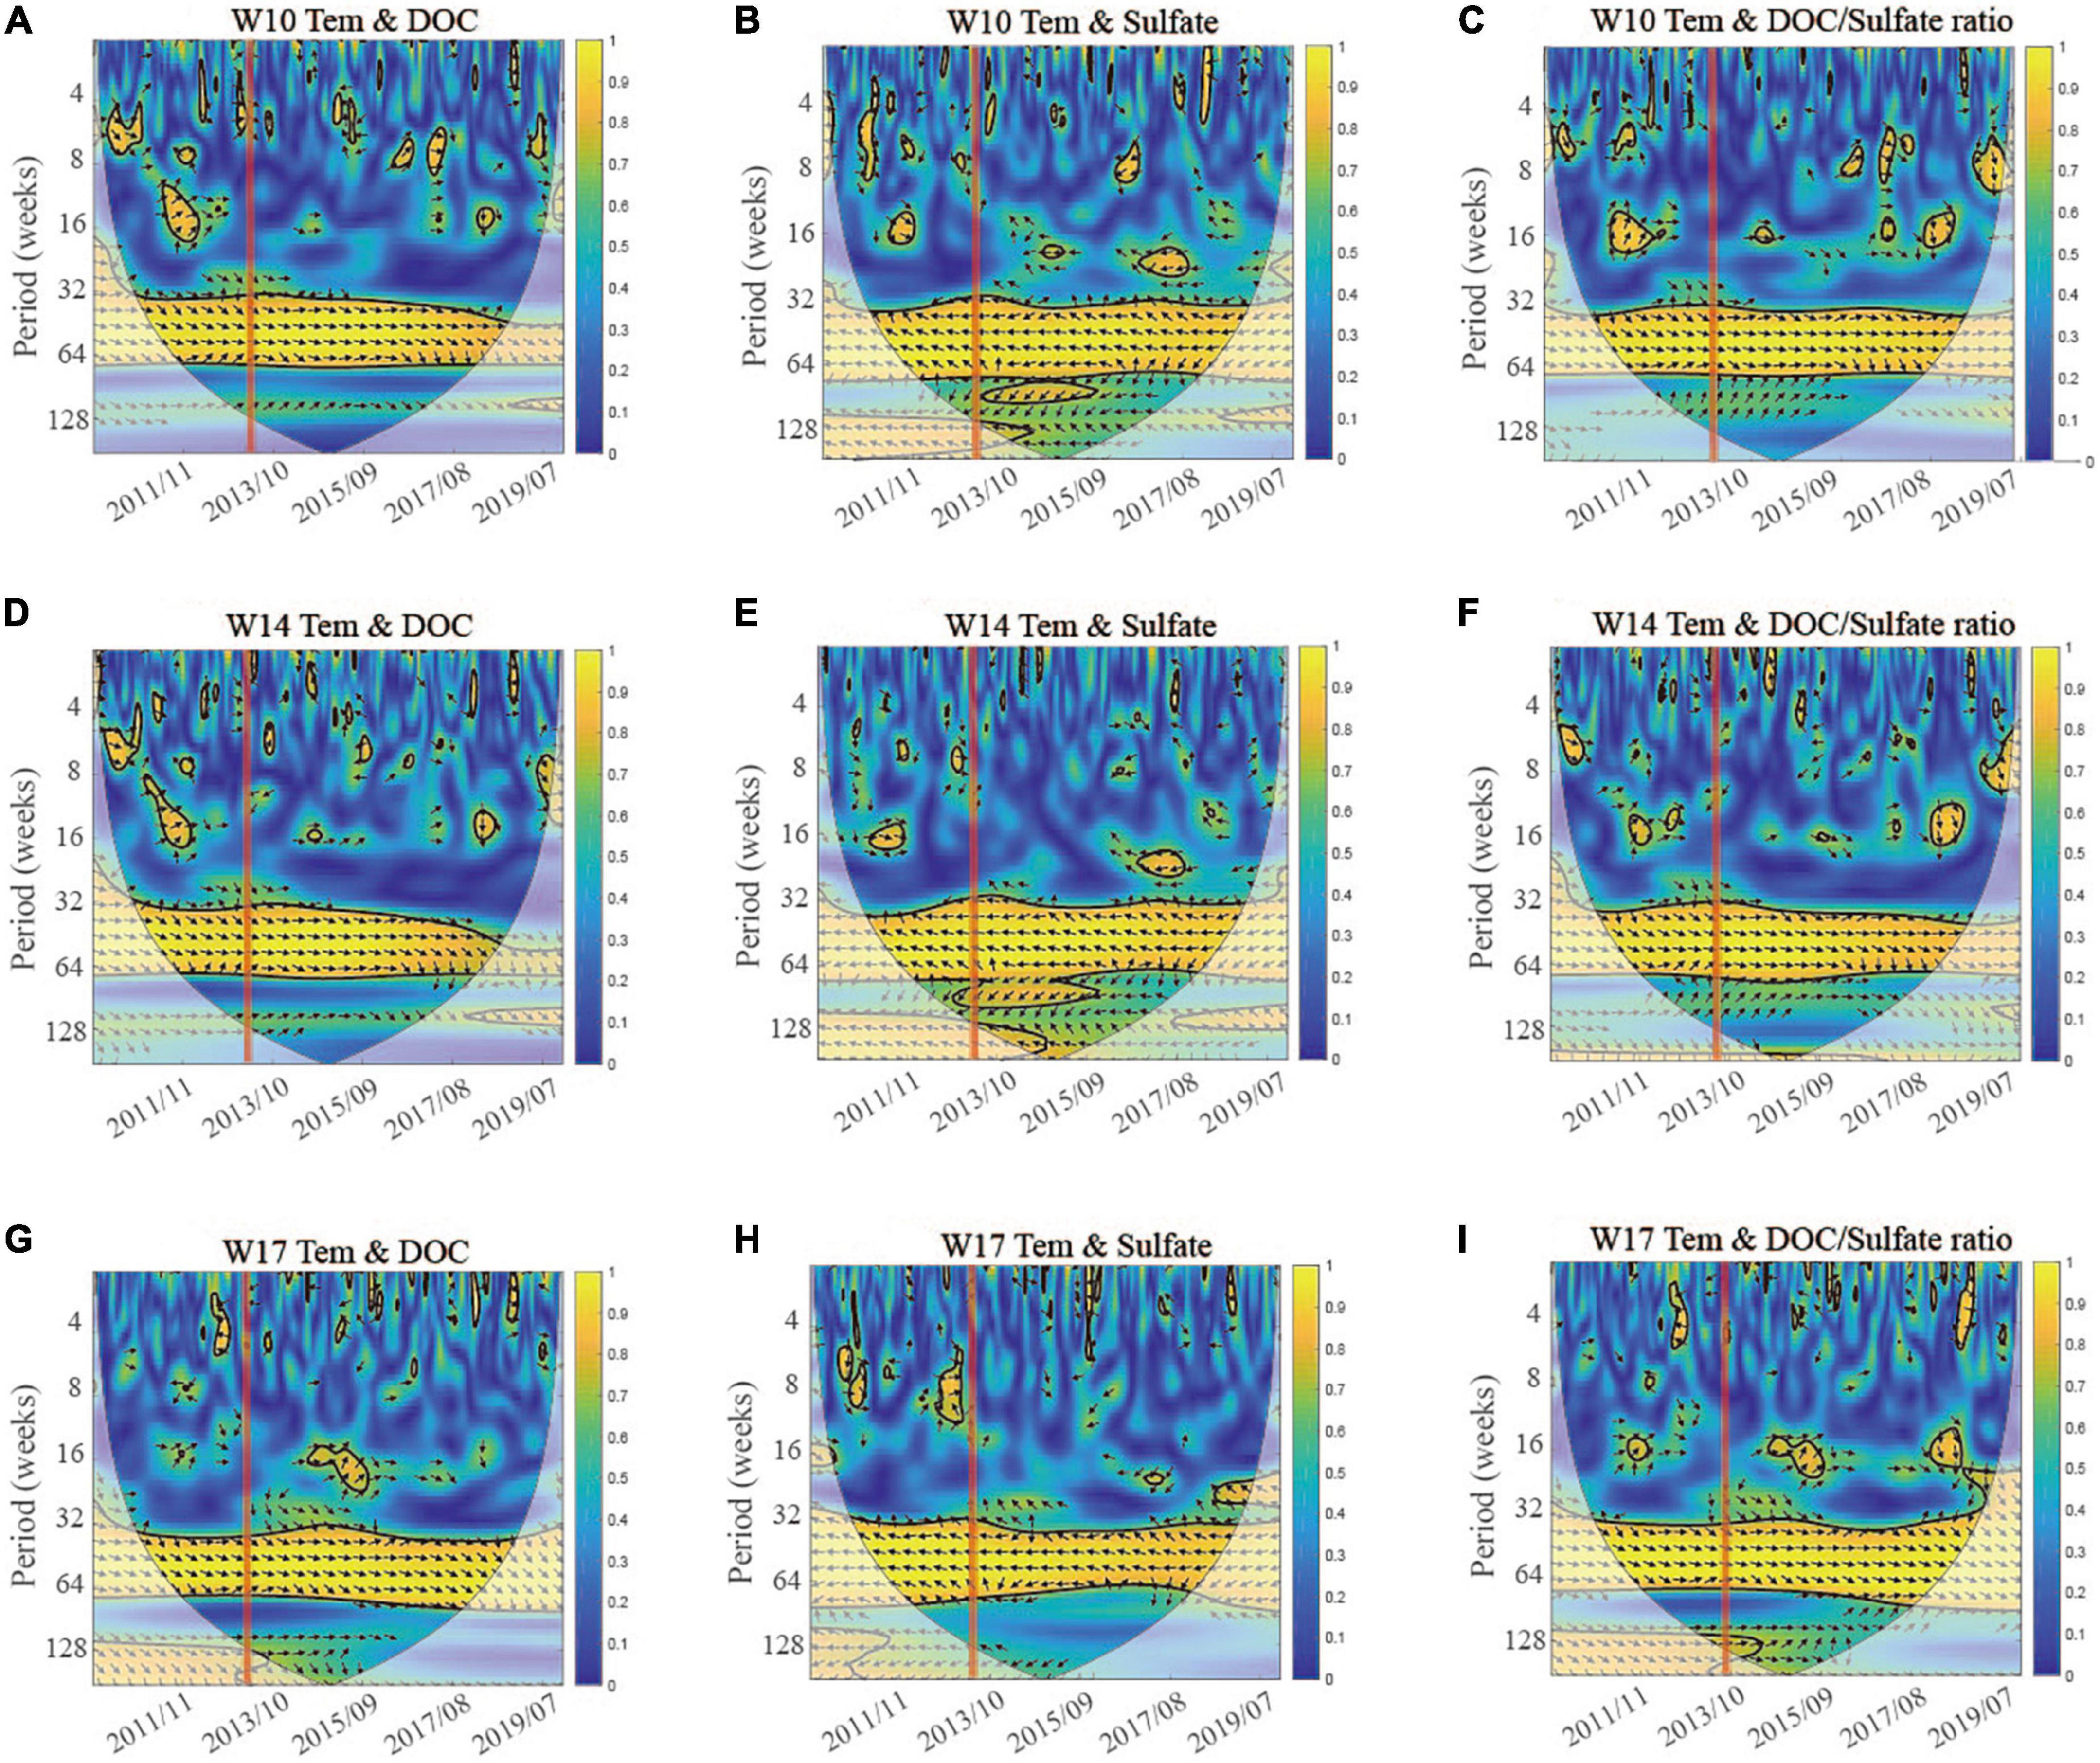
Figure 6. The WTC analysis between temperature (Tem) and dissolved organic carbon (DOC), sulfate, DOC/Sulfate ratio at 3 Wüstebach catchment stations (W10, W14, W17). The X-axis indicates the time and the y-axis displays the periods (in weeks). The cone of influence (COI) is shown as a cone-shaped area with thick black line (95% confidence level based on Monte Carlo test). The different colors indicate the strength of the correlation (R2) from 0 to 1. The black arrows indicate the orientation of the correlation with R2 > 0.5 and the phase shifts between two variables (right directed: in-phase, positive, left directed: anti-phase, negative). The vertical red line indicates that the moment deforestation occurred in late summer 2013.
DOC and sulfate in W17 had an almost perfect negative correlation from period lengths of 32 to 64 weeks (Figure 7G). The correlation lasted over the entire period investigated. Different from W17, the profound correlation between DOC and sulfate between 32 and 64 weeks vanished in 2017. In addition, DOC and sulfate negatively correlated in W10 and W14 for periods of about 100–128 weeks (Figures 7A,D). For the wavelet results between Fetot and DOC, sulfate, positive relationships between Fetot and DOC were observed in all stations, with Fetot either leading DOC by about 45° or in phase (Figures 7B,E,H). In the mainstream (W10, W14), the correlation between Fetot and DOC occupied a larger frequency band and longer period lengths than in W17. Specifically, in-phase relationships between Fetot and DOC were found in the 32–100 weeks period in W10, in the 32–80 weeks period in W14, and in the 40–64 weeks period in W17. Almost anti-phase relationships were observed between Fetot and sulfate in the 32–64 weeks period in three stations from 2011 to 2019 (Figures 7C,F,I). However, from 2015 in W10 and 2013 in W14, the correlation between Fetot and sulfate showed a higher frequency band (100–128 weeks period) with sulfate leading to Fetot by a 45° (Figures 7C,F), which was not observed in W17. Additionally, in W17, a short-term correlation between Fetot and sulfate was observed in the 16–24 weeks period during 2012–2016, which was not found in W10 and W14.
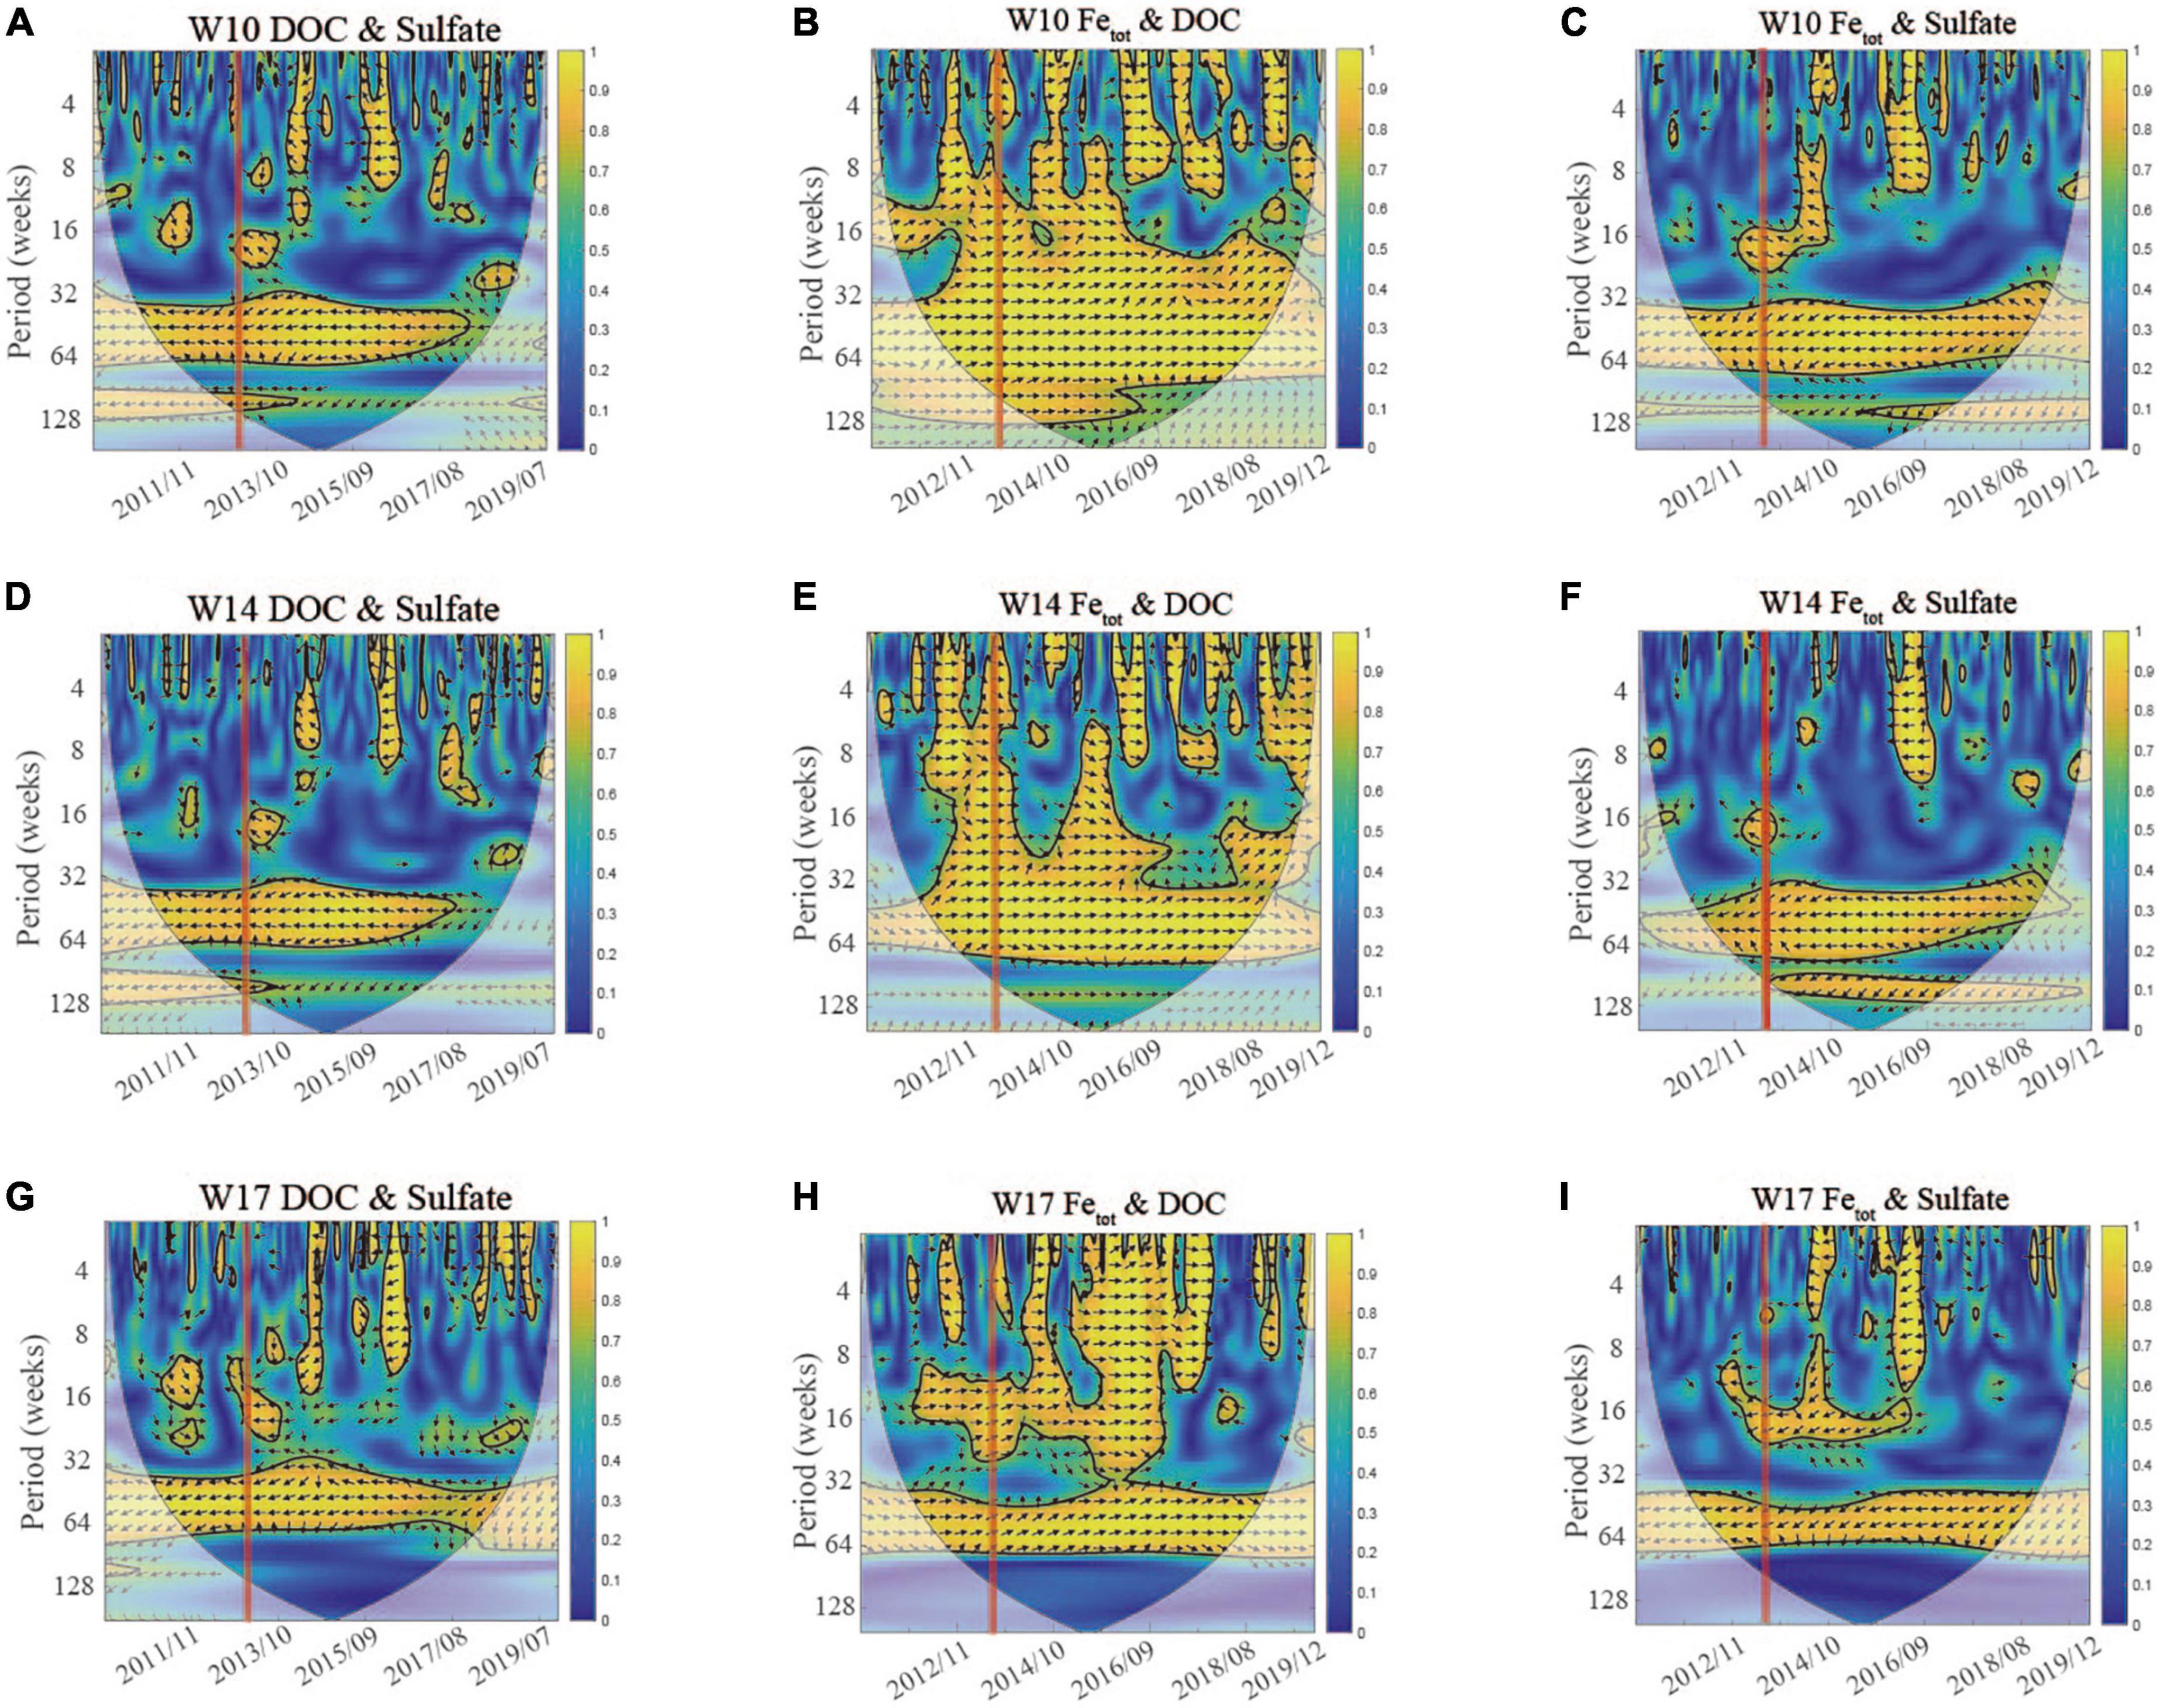
Figure 7. The WTC analysis between dissolved organic carbon (DOC), total dissolved iron (Fetot) and sulfate at the 3 Wüstebach catchment stations (W10, W14, W17). The X-axis indicates the time and the y-axis displays the periods (in weeks). The cone of influence (COI) is shown as a cone-shaped area with thick black line (95% confidence level based on Monte Carlo test). The different colors indicate the strength of the correlation (R2) from 0 to 1. The black arrows indicate the orientation of the correlation with R2 > 0.5 and the phase shifts between two variables (right directed: in-phase, positive, left directed: anti-phase, negative). The vertical red line indicates that the moment deforestation occurred in late summer 2013.
In W10 and W14, the pH only correlated with DOC in a short-term period (2011–2013) or had no significant correlation with DOC (Supplementary Figures 3B,F). However, in W17, a remarkable relationship was found between pH and DOC from 2011 to 2014 and from 2016 to 2019 in the 32–64 weeks frequency band (Supplementary Figure 3J). It is obvious that pH is better correlated with sulfate than DOC for all stations (Supplementary Figure 3 and Supplementary Table 2). In W10 and W14 (Supplementary Figures 3D,H), pH correlated negatively with sulfate in the 32–64 weeks period over the investigated period except for a break after the deforestation, which means the relationship between pH and sulfate disappeared during 2014–2016. In W17, the correlation between pH and sulfate was constant in the 32–96 weeks period during the whole investigated time (Supplementary Figure 3L). Except for the apparent correlation between Ca2+ and DOC during 2012–2016 in W10, there was hardly any significant relationship between Ca2+ and DOC in W17 and W14 (Supplementary Figures 3A,E,I). In W10 and W14, Ca2+ correlated with sulfate negatively in the 48–60 weeks period during 2012–2016 (Supplementary Figures 3C,G), while Ca2+ and sulfate had no significant relationship before 2016 (Supplementary Figure 3K).
With a long-term dataset, we examined the dynamics and their relationships of DOC, sulfate, runoff, temperature, Ca2+, Fetot, and pH after deforestation. Runoff showed higher values in winter and early spring mainly due to snowmelt. At W17, the smaller reference stream, which was slightly deforested, DOC increased gradually during 2009–2019, which indicated a natural increasing trend of DOC. In contrast, at W10 and W14, which were highly affected by deforestation, the increase of DOC after deforestation was almost twice as in W17. This indicates that deforestation had a greater disturbance on DOC concentration than under natural conditions. This result contrasts with the study by Wen et al. (2021), who found that both natural factors and anthropogenic activities influence DOC dynamics, but that natural factors better explain larger fluctuations in DOC than anthropogenic activities.
We found strong negative relationships between DOC and sulfate for all three hydrological stations. This is consistent with Ledesma et al. (2016), who found that sulfate is an important driver of DOC trends in boreal catchments. Oni et al. (2013) found that sulfate showed declining trends along a time series from 1990 to 2007 in Northern Sweden, whereas DOC had a negative correlation with sulfate, however, the results indicated that climate change rather than recovery from acidification was the main driver of the increase of DOC concentration. DOC concentration was not always negatively correlated with sulfate concentration in previous river studies (Clair et al., 2008; Chow et al., 2017). Eimers et al. (2008) reported that DOC had no relationship with sulfate in annual data series, rather than as a result of the acidification effect. They explain the negative relationship between sulfate and DOC in seasons by underlying hydrological phenomena in this wetland-dominated catchment. Evans et al. (2005) found that DOC concentrations in 22 UK upland waters increased by an average of 91% during 1988–2002, and this increase also showed in northern Europe and North America. Their results suggested that DOC may increase in response to a combination of declining acid deposition and rising temperature.
In our study, DOC is mainly affected by Fetot, temperature, and sulfate, less correlated with Ca2+ and pH (Supplementary Table 2). Previous reports also showed that forest harvesting resulted in a significant increase of stream water DOC in forest catchments, underlining the great impact effect of clear-cutting on stream water quality and nutrient cycling (Laudon et al., 2009; Schelker et al., 2012). In forest catchments, DOC in runoff mostly originates from soil organic matter (Strohmeier et al., 2013; Ma et al., 2019), and forest management strongly influenced soil organic carbon export to streams (Lajtha and Jones, 2018; Le et al., 2019). Forest harvesting leads to an increase of litter inputs from logging residues and the decomposition of soil organic carbon (Kalbitz et al., 2004), which further increases the soil DOC concentration and leaching to the stream. Additionally, in terms of the relationship between DOC and Fetot, a larger coherence band and higher correlation coefficient (r) is shown in W10 and W14 than in W17, indicating the co-transport of Fe-DOC in the form of organic metallic complex. As a result, compared with the reference W17, iron play a more important role in regulating DOC in the main stream. A similar finding was reported by Bol et al. (2015), indicating DOC transport via organic-mineral complexes in this catchment.
In our study, DOC, sulfate, and Fetot both showed obvious seasonal patterns, which we mainly attribute to the seasonal temperature changes. High temperatures are known to increase microbial activity and further lead to higher organic carbon and lower inorganic S concentrations. Eimers et al. (2008) found that low sulfate concentrations occur with low water flows as a result of sulfate reduction. Compared with DOC, sulfate had a tighter relationship with pH. Sulfate concentration is not only tightly correlated with temperature, but also with runoff, pH and Fetot. Previous studies showed that sulfate decreased and streams recovered from acidification over a time period of 16 years, reflecting a strong link between sulfur emissions, and precipitation sulfate concentration (Burns et al., 2006; Chow et al., 2017). In our study, sulfate is mainly negatively correlated with pH, but as pH increased after deforestation, the sulfate concentrations at the 3 stations showed no significant yearly change. This indicated that the sulfate concentrations were better explained by runoff and temperature rather than by stream acidification. Our Pearson correlation results also confirmed that sulfate concentrations correlated better with temperature, followed by runoff at 3 stations (Supplementary Table 2). Other explanations could be that our study period was too short to detect such long-term trends, or that the sulfate concentrations in the Wüstebach were already in equilibrium with the reduced atmospheric deposition. Ide et al. (2013) found that the effect of clear-cutting on runoff continued for 18 years in forest catchment in Eastern Finland. In our study, the spatiotemporal relationship between sulfate and other chemical/hydroclimatic variables changed after deforestation even though the sulfate concentration only showed a slight change. It indicated the necessity for continuous long-term monitoring of some underlying chemical dynamics and proved the WTC analysis effective to identify the underlying hydrological dynamics under climatic change or anthropogenic disturbance, which cannot be revealed by the time series analysis.
In soils, the stoichiometric ratios of carbon, nitrogen, phosphorus, and occasionally sulfur are often used for indicating substrate quality and climate change and land management (Zhang et al., 2018; Luo et al., 2020; Veldkamp et al., 2020). They also play a vital role in regulating nutrient cycling and geochemistry processes by mediating soil microbial activities (Wang et al., 2022). But relatively little information is available on the relevant stoichiometry of sulfur in stream waters. In our study, we therefore also investigated the dynamics of the DOC/sulfate ratio. This parameter reflects the concurrent dynamics of DOC and sulfate and is therefore a useful and sensitive indicator for ecosystem disturbances. From the Pearson analysis (Supplementary Table 2), we found that the DOC/sulfate ratio was more correlated with DOC than sulfate, which reflected similar seasonal patterns and similar wavelet results to DOC (Figures 2, 5). The temporal trend in DOC/sulfate ratio was better explained by the Fetot concentration than for DOC alone. Furthermore, the ratio correlated better (higher r-value) with runoff and water temperature data than DOC alone (Supplementary Table 2). This would indicate that the parameter might be more sensitive to the hydrological variables than DOC when monitoring the effects of deforestation.
The in-stream DOC concentrations in this low mountainous forest catchment increased during the 10-year time series both under “minimal” (3%) (W17), and “more severe” catchment deforestation > 25% (W10 and W14). Anthropogenic disturbance (deforestation) and natural changes (in climate) both contributed to rising DOC concentrations in the partially deforested catchments, but the importance of deforestation was much greater. Sulfate concentrations showed only minor changes for all 3 stations during the 10-year time series analysis. But the WTC analysis identified an altered relationship between sulfate concentrations and other variables (Fetot, pH, temperature) in the “more severe” (W10 and W14) but not found under “minimal” deforestation (W17). Negative relationships between DOC and sulfate ended in W10 and W14 after deforestation but not in W17. Therefore, severe deforestation (in W10 and W14) substantially affects the coupling of catchment S and C cycling. Relative to time series analysis, by providing additional information on both the lag time and direction of the relationships between two variables at different time scales, WTC analysis was shown to be a more effective tool to pinpoint the underlying catchment relationships between variables to anthropogenic impact. Our study also highlights the benefits of continuous long-term monitoring data to elucidate the underlying effect of deforestation on hydrological and biochemistry processes.
The datasets presented in this study can be found in online repositories. The names of the repository/repositories and accession number(s) can be found below: The original datasets can be downloaded at the TERENO data portal www.tereno.net, further inquiries can be directed to the corresponding author.
QW, RB, and HB contributed to the concept and design of the study. QW collected and processed the data and drafted the text. QW, KR, YQ, and AG conducted the wavelet analysis code. QW, AG, YQ, AT, HV, and RB contributed to the revision of the manuscript. All authors reviewed and made substantial contributions to this work and approved it for publication.
We gratefully acknowledged the TERENO (Terrestrial Environmental Observatories) funded by the Helmholtz-Gemeinschaft, and this study was supported by the Helmholtz Association grant 2173 “Toward a Sustainable Bioeconomy—Resources, Utilization, Engineering and Agroecosystems” (POF IV:2021-2026). QW acknowledged the Ph.D grant from the China Scholarship Council (No. 201903250108).
The authors declare that the research was conducted in the absence of any commercial or financial relationships that could be construed as a potential conflict of interest.
All claims expressed in this article are solely those of the authors and do not necessarily represent those of their affiliated organizations, or those of the publisher, the editors and the reviewers. Any product that may be evaluated in this article, or claim that may be made by its manufacturer, is not guaranteed or endorsed by the publisher.
The Supplementary Material for this article can be found online at: https://www.frontiersin.org/articles/10.3389/ffgc.2022.1044447/full#supplementary-material
Aas, W., Mortier, A., Bowersox, V., Cherian, R., Faluvegi, G., Fagerli, H., et al. (2019). Global and regional trends of atmospheric sulfur. Sci. Rep. 9:953. doi: 10.1038/s41598-018-37304-0
Bhattacharyya, A., Campbell, A. N., Tfaily, M. M., Lin, Y., Kukkadapu, R. K., and Silver, W. L. (2018a). Redox fluctuations control the coupled cycling of iron and carbon in tropical forest soils. Environ. Sci. Technol. 52, 14129–14139.
Bhattacharyya, A., Schmidt, M. P., Stavitski, E., and Martínez, C. E. (2018b). Iron speciation in peats: Chemical and spectroscopic evidence for the co-occurrence of ferric and ferrous iron in organic complexes and mineral precipitates. Org. Geochem. 115, 124–137.
Björnerås, C., Weyhenmeyer, G. A., Evans, C. D., Gessner, M. O., Grossart, H. P., and Kangur, K. (2017). Widespread increases in iron concentration in European and North American freshwaters. Glob. Biogeochem. Cycles 31, 1488–1500. doi: 10.1002/2017GB005749
Bogena, H. R., Bol, R., Borchard, N., Brüggemann, N., Diekkrüger, B., Drüe, C., et al. (2015). A terrestrial observatory approach to the integrated investigation of the effects of deforestation on water, energy, and matter fluxes. Sci. China Earth Sci. 58, 61–75. doi: 10.1007/s11430-014-4911-7
Bogena, H. R., Herbst, M., Huisman, J. A., and Rosenbaum, U. (2010). Potential of wireless sensor networks for measuring soil water content variability. Vadose Zone J. 9, 1002–1013. doi: 10.2136/vzj2009.0173
Bogena, H. R., Montzka, C., Huisman, J. A., Graf, A., Schmidt, M., Stockinger, M., et al. (2018). The TERENO-Rur hydrological observatory: A multiscale multi-compartment research platform for the advancement of hydrological science. Vadose Zone J. 17, 1–22. doi: 10.2136/vzj2018.03.0055
Bogena, H. R., Stockinger, M. P., and Lücke, A. (2020). Long-term stable water isotope and runoff data for the investigation of deforestation effects on the hydrological system of the Wüstebach catchment Germany. Hydrol. Process. 35:e14006. doi: 10.1002/hyp.14006
Bol, R., Lücke, A., Tappe, W., Kummer, S., Krause, M., Weigand, S., et al. (2015). Spatio-temporal variations of dissolved organic matter in a German forested mountainous headwater catchment. Vadose Zone J. 14, 1–12. doi: 10.2136/vzj2015.01.0005
Borken, W., Ahrens, B., Schulz, C., and Zimmermann, L. (2011). Site-to-site variability and temporal trends of DOC concentrations and fluxes in temperate forest soils. Glob. Change Biol. 17, 2428–2443.
Burger, D. J., Vogel, J., Kooijman, A. M., Bol, R., de Rijke, E., Schoorl, J., et al. (2021). Colloidal catchment response to snowmelt and precipitation events differs in a forested headwater catchment. Vadose Zone J. 20:e20126. doi: 10.1002/vzj2.20126
Burns, D. A., McHale, M. R., Driscoll, C. T., and Roy, K. M. (2006). Response of surface water chemistry to reduced levels of acid precipitation: Comparison of trends in two regions of New York USA. Hydrol. Process. 20, 1611–1627. doi: 10.1002/hyp.5961
Carey, S. K., Tetzlaff, D., Buttle, J., Laudon, H., McDonnell, J., McGuire, K., et al. (2013). Use of color maps and wavelet coherence to discern seasonal and interannual climate influences on streamflowvariability in northern catchments. Water Resour. Res. 49, 6194–6207. doi: 10.1002/wrcr.20469
Cazelles, B., Chavez, M., Berteaux, D., Menard, F., Vik, J. O., Jenouvrier, S., et al. (2008). Wavelet analysis of ecological time series. Oecologia 156, 287–304. doi: 10.1007/s00442-008-0993-2
Chow, M., Lai, C.-C., Kuo, H.-Y., Lin, C.-H., Chen, T.-Y., and Shiah, F.-K. (2017). Long-term trends and dynamics of dissolved organic carbon (DOC) in a subtropical reservoir basin. Water 9:545. doi: 10.3390/w9070545
Chuman, T., Oulehle, F., Zajícová, K., and Hruška, J. (2021). The legacy of acidic deposition controls soil organic carbon pools in temperate forests across the Czech R epublic. Eur. J. Soil Sci. 72, 1780–1801.
Clair, T. A., Dennis, I. F., Vet, R., and Laudon, H. (2008). Long-term trends in catchment organic carbon and nitrogen exports from three acidified catchments in Nova Scotia Canada. Biogeochemistry 87, 83–97. doi: 10.1007/s10533-007-9170-7
Dale, V. H., Joyce, L. A., McNulty, S., Neilson, R. P., Ayres, M. P., and Flannigan, M. D. (2001). Climate change and forest disturbances: Climate change can affect forests by altering the frequency, intensity, duration, and timing of fire, drought, introduced species, insect and pathogen outbreaks, hurricanes, windstorms, ice storms, or landslides. BioScience 51, 723–734.
Dinsmore, K. J., Billett, M. F., Skiba, U. M., Rees, R. M., Drewer, J., and Helfter, C. (2010). Role of the aquatic pathway in the carbon and greenhouse gas budgets of a peatland catchment. Global Change Biol. 16, 2750–2762. doi: 10.1111/j.1365-2486.2009.02119.x
Drake, T. W., Van Oost, K., Barthel, M., Bauters, M., Hoyt, A. M., Podgorski, D. C., et al. (2019). Mobilization of aged and biolabile soil carbon by tropical deforestation. Nat. Geosci. 12, 541–546. doi: 10.1038/s41561-019-0384-9
Egea, L. G., Jiménez–Ramos, R., Hernández, I., and Brun, F. G. (2019). Effect of In Situ short–term temperature increase on carbon metabolism and dissolved organic carbon (DOC) fluxes in a community dominated by the seagrass Cymodocea nodosa. PLoS One 14:e0210386. doi: 10.1371/journal.pone.0210386
Eimers, M. C., Watmough, S. A., Buttle, J. M., and Dillon, P. J. (2008). Examination of the potential relationship between droughts, sulfate and dissolved organic carbon at a wetland-draining stream. Global Change Biol. 14, 938–948. doi: 10.1111/j.1365-2486.2007.01530.x
Erlandsson, M., Buffam, I., Fölster, J., Laudon, H., Temnerud, J., Weyhenmeyer, G. A., et al. (2008). Thirty-five years of synchrony in the organic matter concentrations of Swedish rivers explained by variation in flow and sulfate. Global Change Biol. 14, 1191–1198. doi: 10.1111/j.1365-2486.2008.01551.x
Etmann, M. (2009). Dendrological Recordings in the Water Catchment Area of the Upper Wustebach using Various Measuring and Estimation Methods. Munster: Westphalian Wilhelms University.
Evans, C. D., Monteith, D. T., and Cooper, D. M. (2005). Long-term increases in surface water dissolved organic carbon: Observations, possible causes and environmental impacts. Environ. Pollut. 137, 55–71. doi: 10.1016/j.envpol.2004.12.031
Goller, R., Wilcke, W., Fleischbein, K., Valarezo, C., and Zech, W. (2006). Dissolved nitrogen, phosphorus, and sulfur forms in the ecosystem fluxes of a montane forest in Ecuador. Biogeochemistry 77, 57–89. doi: 10.1007/s10533-005-1061-1
Gottselig, N., Wiekenkamp, I., Weihermuller, L., Bruggemann, N., Berns, A. E., Bogena, H. R., et al. (2017). A Three-Dimensional View on Soil Biogeochemistry: A Dataset for a Forested Headwater Catchment. J. Environ. Q. 46, 210–218. doi: 10.2134/jeq2016.07.0276
Graf, A., Bogena, H. R., Drüe, C., Hardelauf, H., Pütz, T., Heinemann, G., et al. (2014). Spatiotemporal relations between water budget components and soil water content in a forested tributary catchment. Water Resour. Res. 50, 4837–4857. doi: 10.1002/2013WR014516
Griffith, J., and Kiffney, P. (2022). Seasonal and temporal variation in the effects of forest thinning on headwater stream benthic organisms in coastal British Columbia. For. Ecol. Manag. 504:119801. doi: 10.1016/j.foreco.2021.119801
Grinsted, A., Moore, J. C., and Jevrejeva, S. (2004). Application of the cross wavelet transform and wavelet coherence to geophysical time series. Nonlinear Process. Geophys. 11, 561–566. doi: 10.5194/npg-11-561-2004
Hirst, C., Mauclet, E., Monhonval, A., Tihon, E., Ledman, J., Schuur, E. A. G., et al. (2022). Seasonal Changes in Hydrology and Permafrost Degradation Control Mineral Element-Bound DOC Transport From Permafrost Soils to Streams. Global Biogeochem. Cycles 36:e2021GB007105. doi: 10.1029/2021GB007105
Ide, J. I., Finér, L., Laurén, A., Piirainen, S., and Launiainen, S. (2013). Effects of clear-cutting on annual and seasonal runoff from a boreal forest catchment in eastern Finland. For. Ecol. Manage. 304, 482–491. doi: 10.1016/j.foreco.2013.05.051
IUSS Working Group (2006). World reference base for soil resources. World Soil resources Report 103. FAO: Rome.
Kalbitz, K., Glaser, B., and Bol, R. (2004). Clear-cutting of a Norway spruce stand: Implications for controls on the dynamics of dissolved organic matter in the forest floor. Eur. J. Soil Sci. 55, 401–413.
Knorr, K. H. (2013). DOC-dynamics in a small headwater catchment as driven by redox fluctuations and hydrological flow paths–are DOC exports mediated by iron reduction/oxidation cycles? Biogeosciences 10, 891–904. doi: 10.5194/bg-10-891-2013
Kong, X., Ghaffar, S., Determann, M., Friese, K., Jomaa, S., and Mi, C. (2022). Reservoir water quality deterioration due to deforestation emphasizes the indirect effects of global change. Water Res. 221:118721.
Labat, D. (2005). Recent advances in wavelet analyses: Part 1. A review of concepts. J. Hydrol. 314, 275–288. doi: 10.1016/j.jhydrol.2005.04.003
Lajtha, K., and Jones, J. (2018). Forest harvest legacies control dissolved organic carbon export in small watersheds, western Oregon. Biogeochemistry 140, 299–315. doi: 10.1007/s10533-018-0493-3
Laudon, H., Berggren, M., Ågren, A., Buffam, I., Bishop, K., Grabs, T., et al. (2011). Patterns and dynamics of dissolved organic carbon (DOC) in boreal streams: The role of processes, connectivity, and scaling. Ecosystems 14, 880–893. doi: 10.1007/s10021-011-9452-8
Laudon, H., Hedtjarn, J., Schelker, J., Bishop, K., Sorensen, R., and Agren, A. (2009). Response of dissolved organic carbon following forest harvesting in a boreal forest. J. Hum. Environ. 38, 381–386. doi: 10.1579/0044-7447-38.7.381
Le, H. T., Rochelle Newall, E., Ribolzi, O., Janeau, J. L., Huon, S., Latsachack, K., et al. (2019). Land use strongly influences soil organic carbon and bacterial community export in runoff in tropical uplands. Land Degrad. Dev. 31, 118–132. doi: 10.1002/ldr.3433
Ledesma, J. L., Futter, M. N., Laudon, H., Evans, C. D., and Kohler, S. J. (2016). Boreal forest riparian zones regulate stream sulfate and dissolved organic carbon. Sci. Total Environ. 56, 110–122. doi: 10.1016/j.scitotenv.2016.03.230
Lepistö, A., Räike, A., Sallantaus, T., and Finér, L. (2021). Increases in organic carbon and nitrogen concentrations in boreal forested catchments — Changes driven by climate and deposition. Sci. Total Environ. 780:146627. doi: 10.1016/j.scitotenv.2021.146627
Li, X., Tang, C., Cao, Y., and Li, X. (2019). Carbon, nitrogen and sulfur isotopic features and the associated geochemical processes in a coastal aquifer system of the Pearl River Delta China. J. Hydrol. 575, 986–998. doi: 10.1016/j.jhydrol.2019.05.092
Luo, G., Xue, C., Jiang, Q., Xiao, Y., Zhang, F., and Guo, S. (2020). Soil carbon, nitrogen, and phosphorus cycling microbial populations and their resistance to global change depend on soil C: N: P stoichiometry. Msystems 5, e162–e120.
Ma, Q., Jin, H., Yu, C., and Bense, V. F. (2019). Dissolved organic carbon in permafrost regions: A review. Sci. China Earth Sci. 62, 349–364. doi: 10.1007/s11430-018-9309-6
Oanh, D. Q., Gomi, T., Moore, R. D., Chiu, C.-W., Hiraoka, M., Onda, Y., et al. (2021). Stream temperature response to 50% strip-thinning in a temperate forested headwater catchment. Water 13:1022. doi: 10.3390/w13081022
Oni, S. K., Futter, M. N., Bishop, K., Köhler, S. J., Ottosson-Löfvenius, M., and Laudon, H. (2013). Long-term patterns in dissolved organic carbon, major elements and trace metals in boreal headwater catchments: Trends, mechanisms and heterogeneity. Biogeosciences 10, 2315–2330. doi: 10.5194/bg-10-2315-2013
Pumpanen, J., Lindén, A., Miettinen, H., Kolari, P., Ilvesniemi, H., Mammarella, I., et al. (2014). Precipitation and net ecosystem exchange are the most important drivers of DOC flux in upland boreal catchments. J. Geophys. Res. Biogeosci. 119, 1861–1878. doi: 10.1002/2014JG002705
Rosset, T., Binet, S., Antoine, J. M., Lerigoleur, E., Rigal, F., and Gandois, L. (2020). Drivers of seasonal-and event-scale DOC dynamics at the outlet of mountainous peatlands revealed by high-frequency monitoring. Biogeosciences 17, 3705–3722.
Sajdak, M., Siwek, J. P., Wasak-Sêk, K., Kosmowska, A., Stańczyk, T., and Małek, S. (2021). Stream water chemistry changes in response to deforestation of variable origin (case study from the Carpathians, southern Poland). Catena 202:105237.
Sánchez-Robles, J. M., García-Castaño, J. L., Balao, F., García, C., Terrab, A., and Talavera, S. (2022). Anthropogenic deforestation and climate dryness as drivers of demographic decline and genetic erosion in the southernmost European fir forests. Eur. J. For. Res. 141, 649–663.
Schelker, J., Eklöf, K., Bishop, K., and Laudon, H. (2012). Effects of forestry operations on dissolved organic carbon concentrations and export in boreal first-order streams. J. Geophys. Res. Biogeosci. 117:1011. doi: 10.1029/2011JG001827
Schelker, J., Kuglerová, L., Eklöf, K., Bishop, K., and Laudon, H. (2013). Hydrological effects of clear-cutting in a boreal forest Snowpack dynamics, snowmelt and streamflow responses. J. Hydrol. 484, 105–114. doi: 10.1016/j.jhydrol.2013.01.015
Schelker, J., Öhman, K., Löfgren, S., and Laudon, H. (2014). Scaling of increased dissolved organic carbon inputs by forest clear-cutting – What arrives downstream? J. Hydrol. 508, 299–306. doi: 10.1016/j.jhydrol.2013.09.056
Stockinger, M. P., Bogena, H. R., Lücke, A., Diekkrüger, B., Cornelissen, T., and Vereecken, H. (2016). Tracer sampling frequency influences estimates of young water fraction and streamwater transit time distribution. J. Hydrol. 541, 952–964. doi: 10.1016/j.jhydrol.2016.08.007
Stockinger, M. P., Bogena, H. R., Lücke, A., Diekkrüger, B., Weiler, M., and Vereecken, H. (2014). Seasonal soil moisture patterns: Controlling transit time distributions in a forested headwater catchment. Water Resour. Res. 50, 5270–5289. doi: 10.1002/2013WR014815
Stolpe, B., Guo, L., Shiller, A. M., and Aiken, G. R. (2013). Abundance, size distributions and trace-element binding of organic and iron-rich nanocolloids in Alaskan rivers, as revealed by field-flow fractionation and ICP-MS. Geochim. Cosmochim. Acta 105, 221–239. doi: 10.1016/j.gca.2012.11.018
Strohmeier, S., Knorr, K. H., Reichert, M., Frei, S., Fleckenstein, J. H., Peiffer, S., et al. (2013). Concentrations and fluxes of dissolved organic carbon in runoff from a forested catchment: Insights from high frequency measurements. Biogeosciences 10, 905–916. doi: 10.5194/bg-10-905-2013
Su, L., Miao, C., Duan, Q., Lei, X., and Li, H. (2019). Multiple-Wavelet Coherence of World’s Large Rivers With Meteorological Factors and Ocean Signals. J. Geophys. Res. Atmos. J. 124, 4932–4954. doi: 10.1029/2018JD029842
Sun, H., Shi, B., Yang, F., and Wang, D. (2017). Effects of sulfate on heavy metal release from iron corrosion scales in drinking water distribution system. Water Res. 114, 69–77. doi: 10.1016/j.watres.2017.02.021
Torrence, C., and Webster, P. (1999). Interdecadal changes in the ESNO–monsoon system. J. Clim. 12, 2679–2690. doi: 10.1175/1520-04421999012<2679
Veldkamp, E., Schmidt, M., Powers, J. S., and Corre, M. D. (2020). Deforestation and reforestation impacts on soils in the tropics. Nat. Rev. Earth Environ. 1, 590–605. doi: 10.1038/s43017-020-0091-5
Wang, Q., Gao, W., Bol, R., Xiao, Q., Wu, L., and Zhang, W. (2022). Microbial regulation of net N mineralisation is driven by C. N, P content and stoichiometry. Eur. J. Soil Sci. 73:e13257. doi: 10.1111/ejss.13257
Webb, A. A., Dragovich, D., and Jamshidi, R. (2012). Temporary increases in suspended sediment yields following selective eucalypt forest harvesting. For. Ecol. Manage. 283, 96–105. doi: 10.1016/j.foreco.2012.07.017
Weigand, S., Bol, R., Reichert, B., Graf, A., Wiekenkamp, I., Stockinger, M., et al. (2017). Spatiotemporal Analysis of Dissolved Organic Carbon and Nitrate in Waters of a Forested Catchment Using Wavelet Analysis. Vadose Zone J. 16, 1–14. doi: 10.2136/vzj2016.09.0077
Wen, H., Perdrial, J., Abbott, B. W., Bernal, S., Dupas, R., Godsey, S. E., et al. (2020). Temperature controls production but hydrology regulates export of dissolved organic carbon at the catchment scale. Hydrol. Earth Syst. Sci. 24, 945–966. doi: 10.5194/hess-24-945-2020
Wen, Z., Song, K., Shang, Y., Lyu, L., Tao, H., and Liu, G. (2021). Natural and anthropogenic impacts on the DOC characteristics in the Yellow River continuum. Environ. Pollut. 287:117231. doi: 10.1016/j.envpol.2021.117231
Wiekenkamp, I., Huisman, J. A., Bogena, H. R., Graf, A., Lin, H. S., Drüe, C., et al. (2016). Changes in measured spatiotemporal patterns of hydrological response after partial deforestation in a headwater catchment. J. Hydrol. 542, 648–661. doi: 10.1016/j.jhydrol.2016.09.037
Wiekenkamp, I., Huisman, J. A., Bogena, H. R., and Vereecken, H. (2019). Effects of Deforestation on Water Flow in the Vadose Zone. Water 12:35. doi: 10.3390/w12010035
Xu, J., Morris, P. J., Liu, J., Ledesma, J. L. J., and Holden, J. (2020). Increased Dissolved Organic Carbon Concentrations in Peat-Fed UK Water Supplies Under Future Climate and Sulfate Deposition Scenarios. Water Resour. Res. 56:e2019WR025592. doi: 10.1029/2019WR025592
Yang, F., Shi, B., Bai, Y., Sun, H., Lytle, D. A., and Wang, D. (2014). Effect of sulfate on the transformation of corrosion scale composition and bacterial community in cast iron water distribution pipes. Water Res. 59, 46–57. doi: 10.1016/j.watres.2014.04.003
Zacharias, S., Bogena, H., Samaniego, L., Mauder, M., Fuß, R., Pütz, T., et al. (2011). A network of terrestrial environmental observatories in Germany. Vadose Zone J. 10, 955–973. doi: 10.2136/vzj2010.0139
Keywords: dissolved organic carbon, sulfate, runoff, deforestation, wavelet transform coherence
Citation: Wang Q, Qu Y, Robinson K, Bogena H, Graf A, Vereecken H, Tietema A and Bol R (2022) Deforestation alters dissolved organic carbon and sulfate dynamics in a mountainous headwater catchment—A wavelet analysis. Front. For. Glob. Change 5:1044447. doi: 10.3389/ffgc.2022.1044447
Received: 14 September 2022; Accepted: 20 October 2022;
Published: 07 November 2022.
Edited by:
Licong Dai, Hainan University, ChinaReviewed by:
Xiao Yuan Ming, Northwest Institute of Plateau Biology (CAS), ChinaCopyright © 2022 Wang, Qu, Robinson, Bogena, Graf, Vereecken, Tietema and Bol. This is an open-access article distributed under the terms of the Creative Commons Attribution License (CC BY). The use, distribution or reproduction in other forums is permitted, provided the original author(s) and the copyright owner(s) are credited and that the original publication in this journal is cited, in accordance with accepted academic practice. No use, distribution or reproduction is permitted which does not comply with these terms.
*Correspondence: Qiqi Wang, cS53YW5nQGZ6LWp1ZWxpY2guZGU=
Disclaimer: All claims expressed in this article are solely those of the authors and do not necessarily represent those of their affiliated organizations, or those of the publisher, the editors and the reviewers. Any product that may be evaluated in this article or claim that may be made by its manufacturer is not guaranteed or endorsed by the publisher.
Research integrity at Frontiers
Learn more about the work of our research integrity team to safeguard the quality of each article we publish.