 Yaru Zhang
 Yongshuo Fu
 Xiaojun Geng
 Shouzhi Chen
 Yahui Guo
 Zhaofei Wu
 Hans J. De Boeck
- 1College of Water Science, Beijing Normal University, Beijing, China
- 2Plants and Ecosystems (PLECO), Department of Biology, University of Antwerp, Antwerp, Belgium
Leaf-out phenology plays a key role in ecosystem structure and functioning. Phenological changes have often been linked to climatic factors and have received considerable attention, with most studies focusing on trends of leaf-out phenology. Leaf-out variation (LOV), which reflects the stability of phenological responses, may also be affected by climate change, yet this has received less scientific attention. In this study, we examined spring LOV in response to climate change in China during the period 1963–2008 using in situ records of 15 species at 25 phenological observation sites across several climate zones and explored spatiotemporal changes of LOV and the underlying mechanisms. We observed a significant decrease of LOV toward higher latitudes (−0.2 ± 0.1 days⋅°N–1; P < 0.001) across all species. Temporally, we found that the LOV was significantly increased from the period 1963–1986 (6.9 ± 2.8 days) to the period 1987–2008 (7.9 ± 3.7 days, P < 0.05). Furthermore, the LOV changes between 1987–2008 and 1963–1986 were significantly smaller at high latitudes (average decrease of 1.0 day) than at low latitudes (average increase of 1.5 days). The spatial pattern of LOV is likely due to both increased heat requirements and greater temperature sensitivity at low latitudes compared with high latitudes. The temporal pattern of LOV is likely related to increased heat requirements for leaf-out during 1987–2008 when the average air temperature was higher. Our analysis indicated that the phenology response to climate change is reflected not only in the temporal trends for long time series but also in the variation of phenological dates. Results from this study improve our understanding of phenological responses to climate change and could be applied in the assessment of regional phenology changes to evaluate better the impacts of climate change on ecosystem structure and function.
Introduction
Phenology, the timing of recurrent natural events (Leith, 1975), is one of the most sensitive biological indicators of climate change (Cleland et al., 2007; Piao et al., 2019). Climate warming has advanced spring phenological events, such as flowering and leaf-out, across temperate and boreal biomes (Cahoon et al., 2012; Fu Y. et al., 2014; Prevéy et al., 2017; Piao et al., 2019; Menzel et al., 2020). Except for the temperature, the photoperiod has been widely accepted as a codominant driver in spring phenology processes (Körner and Basler, 2010; Flynn and Wolkovich, 2018; Fu et al., 2019a). The relative roles of temperature and photoperiod in driving spring phenology may be significantly different among species and along with their geographic distributions (Zohner et al., 2016; Fu et al., 2019a,b). Previous studies demonstrated that the leaf-out dates of species from high latitudes with long winters were mainly regulated by temperature (Chuine, 2010; Hänninen, 2016), whereas species from low latitudes were more dependent on the interaction between temperature and photoperiod, which was generally explained by the phenological strategy to maximize plants fitness under specific biogeographical conditions (Zohner et al., 2016; Peaucelle et al., 2019). In addition, the rate of warming is amplified at high latitudes and elevations (Pepin et al., 2015), implying that changes in environmental climate are highly ununiform across bioclimatic gradients. The variability of both environmental factors and plant local adaptions may thus drive the variability of phenological events (Wang et al., 2015). However, how the variability of spring phenology changes over time and space is still unclear. Spring leaf-out is closely related to growing season dynamics and directly affects ecosystem structure and functioning, including the carbon and water balance (Peñuelas, 2009; Richardson et al., 2013; Keenan et al., 2014; Piao et al., 2017). To improve our understanding of ecosystem responses to ongoing climate change, it is therefore essential to study phenological spatiotemporal changes in leaf-out variability.
The response of phenology to climate change has generally been defined as the average trend, i.e., advance or delay, over some time (Matsumoto, 2010; Wang et al., 2014). Based on long-term phenological records, previous studies have reported earlier trends of spring phenology, with a mean rate of 2.5 days per degree Celsius warming since the 1970s (Ge et al., 2015; Piao et al., 2019; Keenan et al., 2020), generally based on linear regression models (Dunn and Winkler, 1999; Gordo and Sanz, 2005; Yang and Rudolf, 2010; Fu et al., 2015a). However, the slope of linear models, i.e., the temporal changes of leaf-out dates against years, only reflect the trend of leaf-out in response to average warming. The variation of leaf-out dates, which reflects the range of phenology responses to changes in climate variables, especially to extreme climate conditions (Mulder et al., 2017), could not be examined in this manner. For example, a cold spring may result in a substantial delay in leaf-out dates and subsequently lead to disturbances in the ecosystem, but this cannot be derived from the linear trends (Both et al., 2009; Lloret et al., 2012; Schleip et al., 2012). Furthermore, larger leaf-out variation (LOV) means a more dispersed phenological date, which would have significant implications on the ecological community itself, as well as the relationship between ecosystem and local climate system. For example, pollinators and herbivores who failed to match the phenological fluctuations in time would face a challenge to survive (Miller-Rushing et al., 2007; López-Uribe et al., 2015; Park et al., 2021). Meanwhile, the interspecific differences in LOV would lead to changes in dominant species and biodiversity and then affect ecosystem structure and function (Flynn and Wolkovich, 2018; Peaucelle et al., 2019). The unstable ecosystem structure would directly exert great impacts on carbon balance and further influence the atmospheric CO2 concentration and local climate system (Piao et al., 2010, 2019; Lan et al., 2021). Therefore, it is important to also investigate the spatiotemporal differences of LOV and identify the mechanism underlying such spatiotemporal heterogeneity of phenological responsiveness.
In this study, we estimated the spring LOV in response to climate change using in situ observations from the Chinese Phenological Observation Network (CPON) from 1963–2008 (Ge et al., 2015). We aimed to answer three main questions: (1) Is there a spatial difference of LOV along latitude? In other words, is there a significant difference in LOV over the past five decades between northern and southern regions in China? (2) How does the LOV change over time, both within and across species? (3) What are the mechanisms behind the spatiotemporal heterogeneity of LOV?
Materials and Methods
Phenological and Meteorological Datasets
Data for phenology were obtained from the CPON1. Leaf-out was defined as the stage when the first leaf is fully visible in its typical form and was recorded as day of year (DOY). To ensure accuracy, only mature trees with leaf-out records for more than 15 years over the period 1963–2008 and not less than 5 years over both 1963–1986 and 1987–2008 were retained. In total, 15 tree species from 25 phenological observation sites were used to study the spatiotemporal variability of LOV in this analysis (Figure 1 and Supplementary Table 2). Selected sites spanned a latitudinal gradient across central and eastern China (between 22°N and 49°N), including temperate, subtropical, and tropical regions (Figure 1). Meteorological data, including daily mean air temperature (degrees Celsius), daily precipitation (millimeter), and daily sunshine duration (hours), were obtained from the China Meteorological Data Sharing Service System2. The meteorological stations were selected according to the geographic information, i.e., the nearest station was matched with each phenological observations site (<30 km).
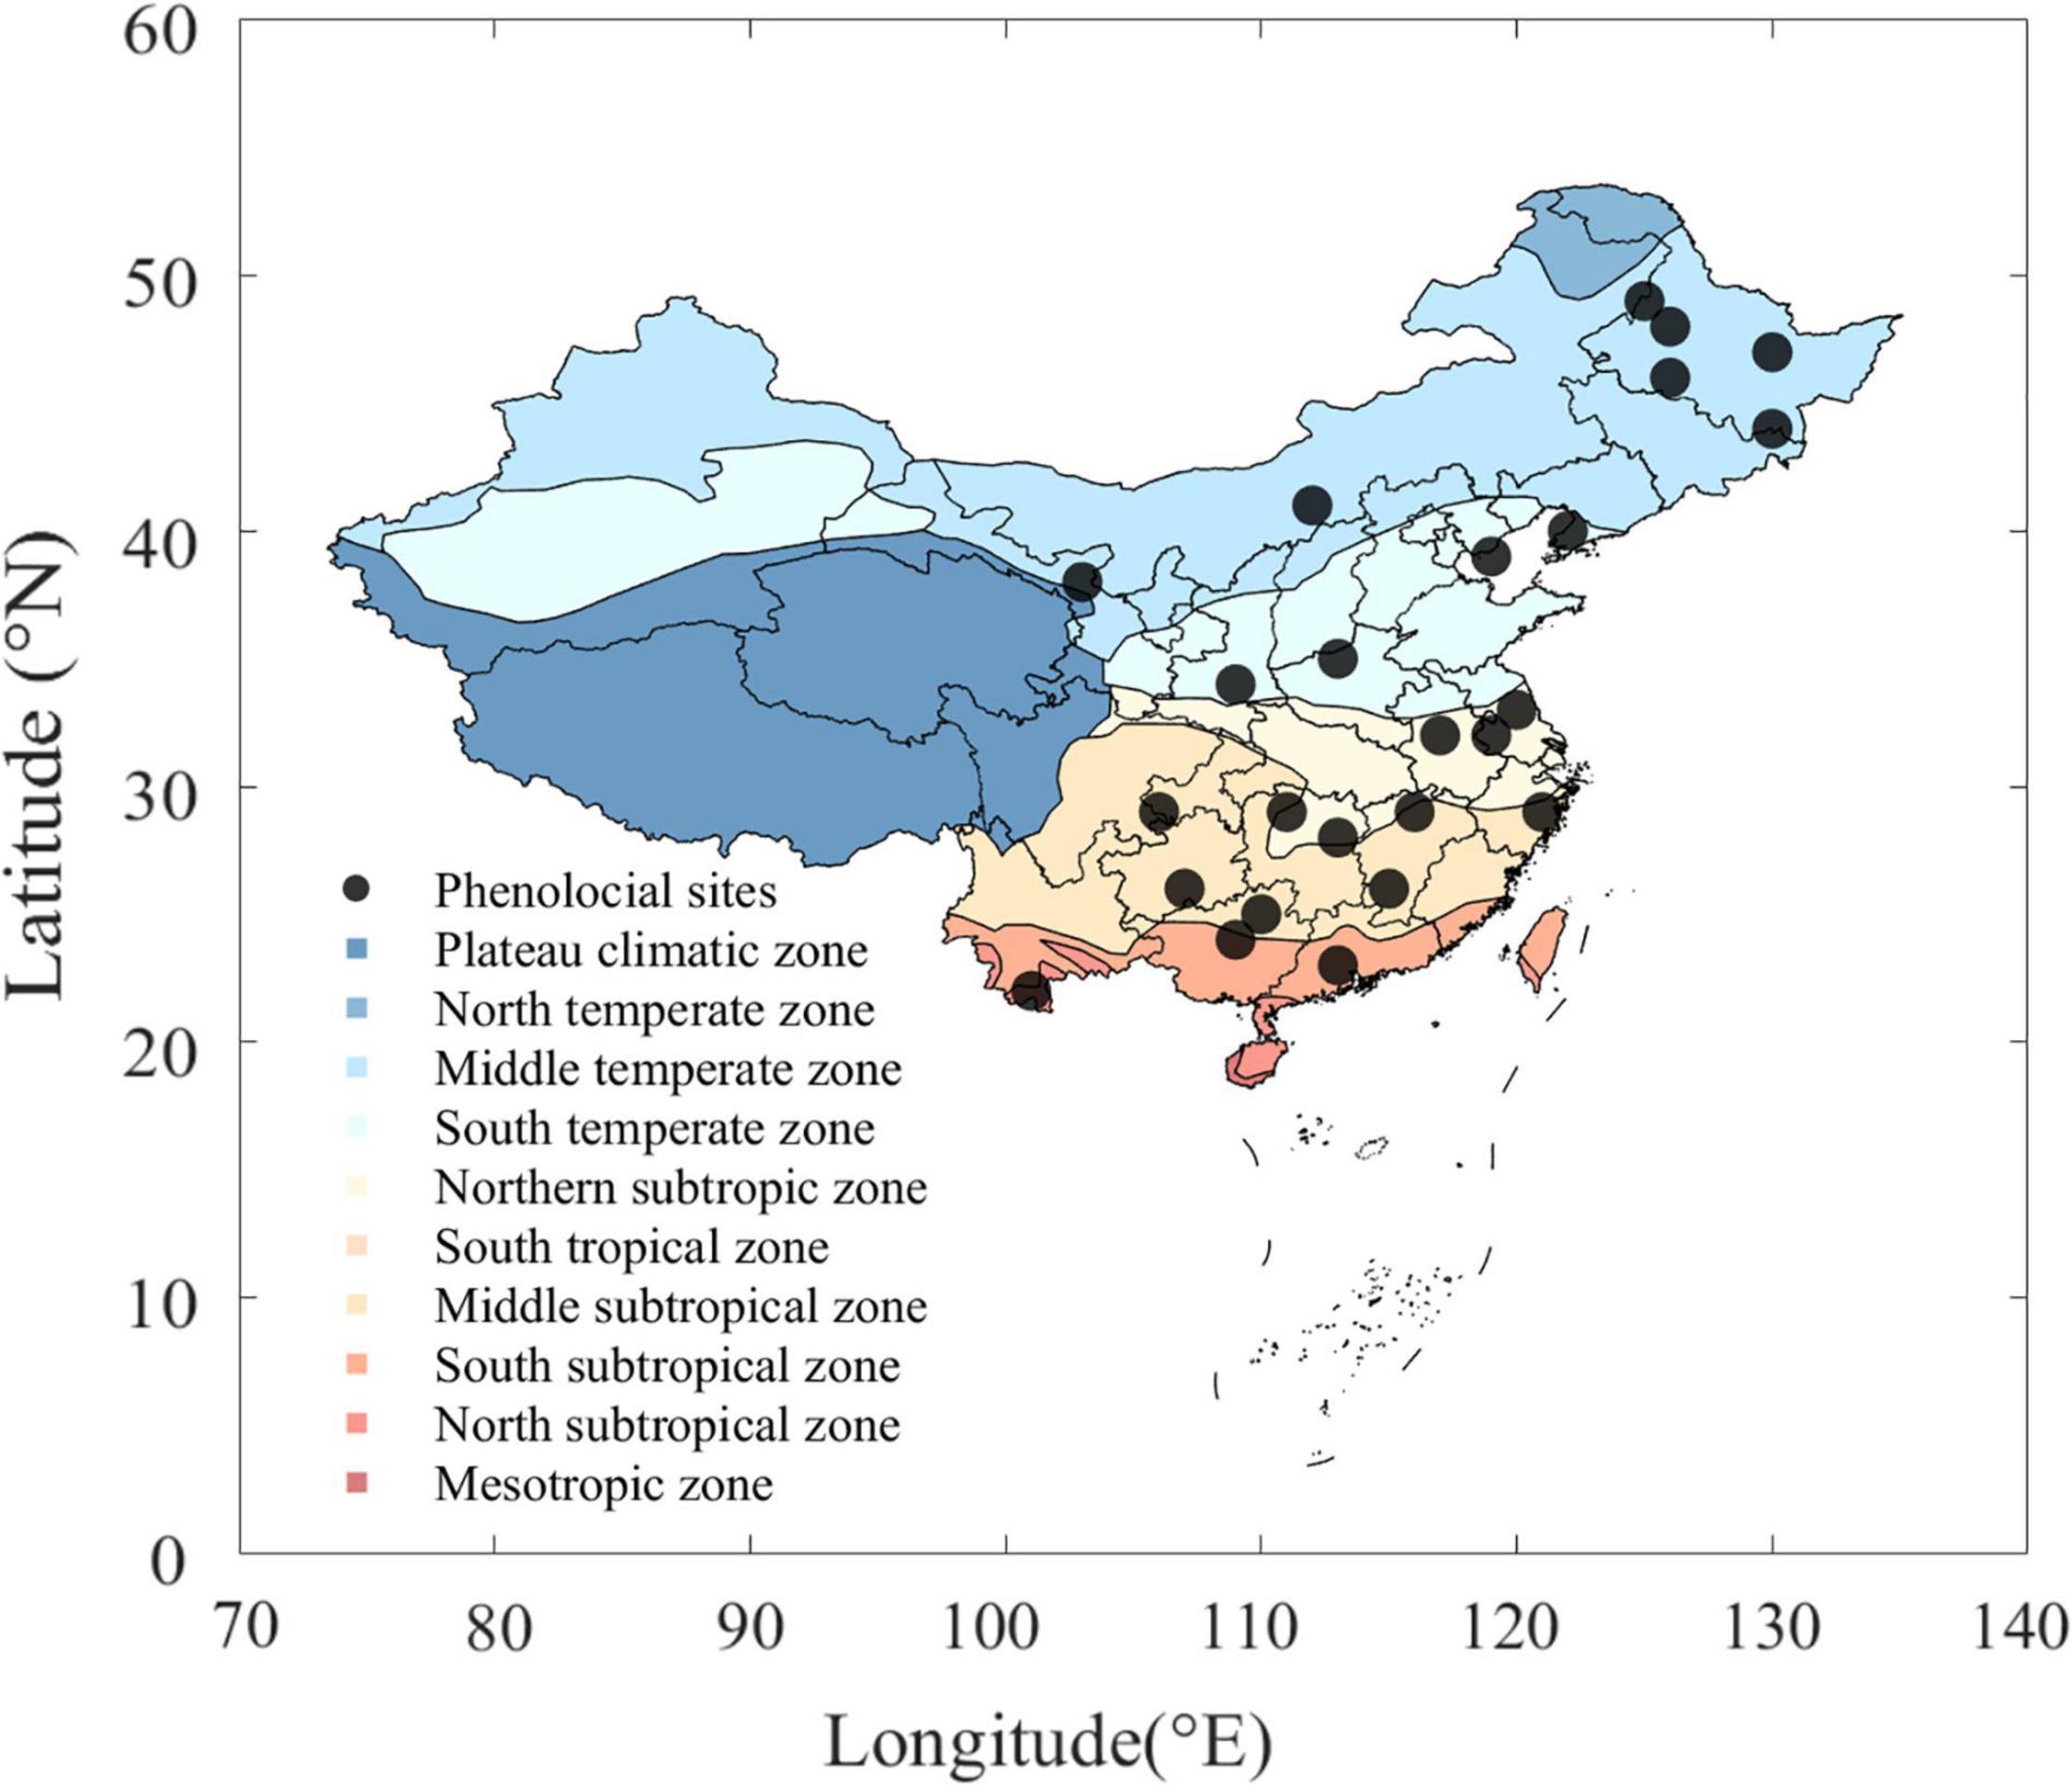
Figure 1. Spatial distribution of 25 selected phenological sites. Different colors denote climate zones across China. Black dots represent phenological sites we used in this analysis, which span central and eastern China along with a wide latitudinal range (between 22°N and 49°N).
Estimation of Chilling and Growing Degree Days
Effective chilling period and heat accumulation were calculated to investigate the factors associated with temporal and spatial changes of LOV. The effective chilling period was defined as the number of days when the daily mean air temperature was between 0 and 8°C, following previous studies (Fu Y.H. et al., 2014; Vitasse et al., 2018):
The start day t1 of the chilling period was fixed at September 1 of the previous year, whereas the end day t2 was a species-specific and site-specific leaf-out date.
The heat accumulation was defined as growing degree days (GDD) and calculated by a linear function (2), a piecewise function (3), a sigmoidal function (4), which used different temperature thresholds.
1. Linear function. GDD was calculated as the accumulated daily average air temperature above a threshold of 5°C.
2. Piecewise function. GDD was calculated as the linear function when the daily mean air temperature was between 5 and 10°C, and the accumulated value was fixed when the daily mean air temperature was above 10°C.
3. Sigmoidal function. GDD was calculated by sigmoidal function:
xtin the functions is the daily mean air temperature during the growing season. The start day of the heat accumulation period, t2, was the start of the temperature-relevant period. The end day t3 was the actual leaf-out day of every year.
Temperature Sensitivity of Leaf-Out Phenology
To explore the phenological responses to air temperature, we examined the temperature sensitivity (ST) of leaf-out, which was calculated as the slope between leaf-out dates and mean air temperature during preseason (Fu et al., 2015b). The preseason was defined as the period before the average leaf-out day of each species at each site, with the highest absolute partial correlation coefficient between leaf-out day and mean air temperature. Its length ranges from 15 to 180 days, determined with 15-day steps. We used geometric mean regression (reduced major axis regression) to fit the date of phenology and mean air temperature during the preseason and then addressed the temperature sensitivity for each species at each site (Fu et al., 2015b; Keenan et al., 2020).
Data Analysis
Spring LOVs for each species at each site were defined as one standard deviation (1 SD) of long-term phenological records following previous studies (Menzel et al., 2006a; Wang et al., 2015). To discuss the temporal changes of LOV, we divided the entire period into two parts with the splitting line 1986, as 1986 is the midpoint of period 1963–2008. Besides, we applied the Mann–Kendall test to analyze the average splitting point across all species at all sites. Interestingly, the average splitting point was 1986 as well; we thus believe the year 1986 should be the best point to split the entire period (Supplementary Figure 3). In the present study, the LOV was calculated over the whole study period 1963–2008 and two periods with different warming rates, i.e., 1963–1986 (slight warming) and 1987–2008 (strong warming) (Supplementary Figure 4). Linear regression was used to calculate the LOV changes against latitudes. The reduced major axis regression was used to determine the temporal changes in LOV over the whole study period and between the two subperiods, i.e., 1963–1986 and 1987–2008, and the significance of differences in LOV between two periods was tested using student paired t-tests across species.
Results
Spatial Distribution in Variation of Spring Leaf-Out Phenology
Across the studied 15 tree species, the mean leaf-out date from 1963 to 2008 was DOY 95 ± 21 (mean ± 1 SD, Supplementary Table 2). Species with the earliest leaf-out date were SB (Salix babylonica) in Guiyang and Guiliin (DOY = 51), two subtropical regions in China and the species with the latest leaf-out date was AT (Amygdalus triloba) in Dedu (DOY = 145), a typical cold temperate region in China. Along the latitudinal gradient, the leaf-out dates were significantly delayed toward higher latitudes, with a mean rate of 2.7 ± 0.4 days⋅°N–1 across all species (P < 0.001, Figure 2A and Supplementary Figure 2). Significantly delayed leaf-out dates toward high latitudes were found in 73% of the species. The largest spatial variation was found in SM (Salix matsudana, slope = 4.0 days⋅°N–1, P < 0.01), and smallest spatial variation was found in CC (Cercis chinensis, slope = 2.0 days⋅°N–1, P < 0.05).
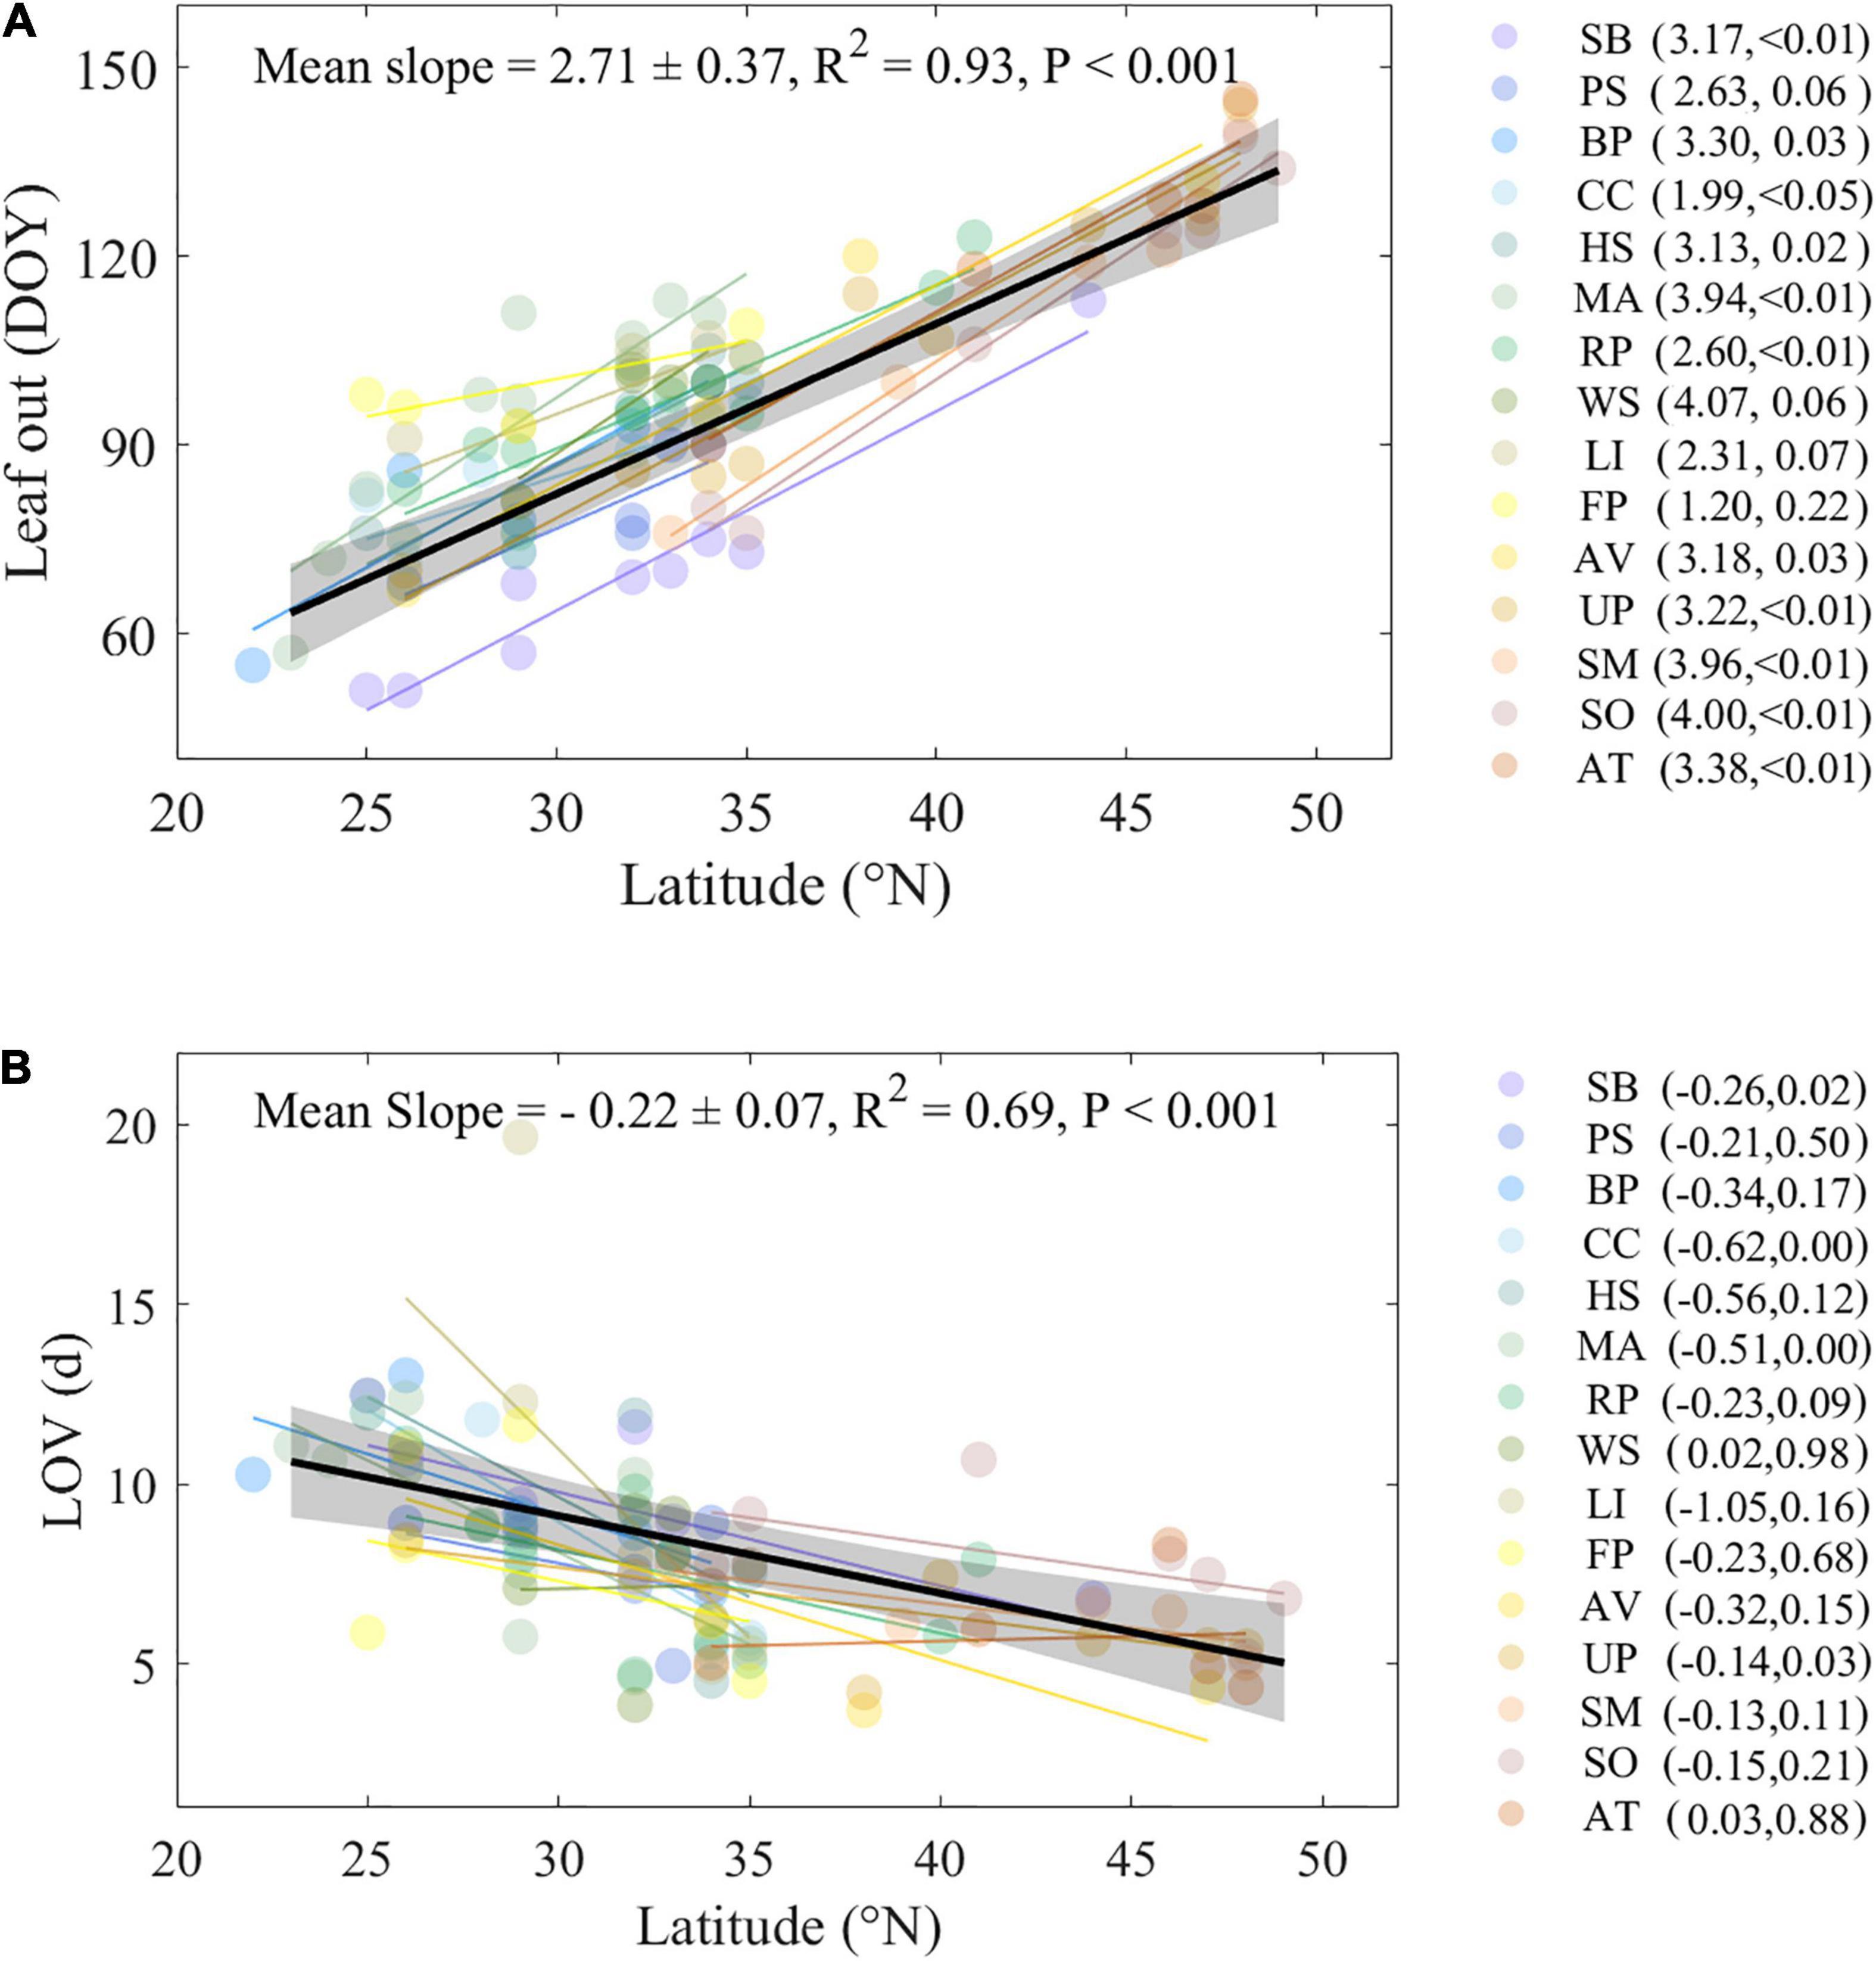
Figure 2. Relationships between latitude and leaf-out date (A) and LOV (B) within and across species. Colored circles represent multiyear average leaf-out date (A) and mean LOV (B) at each site for each species, respectively. Colored lines represent linear regression for each species. Data were averaged per 1°N; shaded areas represent 95% confidence intervals. Slope, R2, and P-value were provided of linear regression across all species. Abbreviations of species are as follows: SB, Salix babylonica; PS, Pterocarya stenoptera; BP, Broussonetia papyrifera; CC, Cercis chinensis; HS, Hibiscus syriacus; MA, Melia azedarach; RP, Robinia pseudoacacia; WS, Wisteria sinensis; LI, Lagerstroemia indica; FP, Firmiana platanifolia; AV, Armeniaca vulgaris; UP, Ulmus pumila; SM, Salix matsudana; SO, Syringa oblata; AT, Amygdalus triloba.
The average spring LOV over the period 1963–2008 was 7.9 days (Supplementary Table 2) but with a large difference among species. The species with the smallest LOV was AV (Armeniaca vulgaris) in Minqin (LOV = 3.7 days), and the species with the largest LOV was LI (Lagerstroemia indica) in Nanchang (LOV = 19.7 days). Over the study area, larger LOV were mainly found in southern regions and lower LOV in northern regions. Across all species, the LOV was significantly reduced by 0.2 ± 0.1 days⋅°N–1 (Figure 2B, P < 0.001). We found that the LOV was reduced with latitudinal increases across all species, ranging from 0.1 to 1.1 days per °N. Among these species, the LOV of SB (Salix babylonica, slope = −0.3 days⋅°N–1, P < 0.05), MA (Melia azedarach, slope = −0.5 days⋅°N–1, P < 0.001), UP (Ulmus pumila, slope = −0.1 days⋅°N–1, P < 0.05), and CC (Cercis chinensis, slope = −0.6 days⋅°N–1, P < 0.001) were changed significantly.
Temporal Changes in Variation of Spring Leaf-Out Phenology
To further explore the temporal changes of LOV, we divided the entire study period into two subperiods, and we found that, compared with the slight warming period 1963–1986 (LOV = 6.9 ± 2.8 days), the LOV was significantly increased during the strong warming period 1987–2008 (LOV = 7.9 ± 3.7 days, P < 0.05) across all species (Figure 3A). We further explored the LOV differences between the two subperiods against latitude and found that, across species, LOV differences were significantly reduced as latitude increases (slope = −0.2 days⋅°N–1, P < 0.001, Supplementary Figure 1). Interestingly, we found different patterns of LOV changes above and below 40°N. The LOV was increased in the strong warming period 1987–2008 compared with 1963–1986 at low latitudes (<40°N), by 1.5 days on average, but was decreased at high latitudes (>45°N) by 1.0 days on average (Figure 3B). Among all species, 10 of 15 species reported higher LOV during the period 1987–2008 than the period 1963–1986 (Figure 3C). The largest difference in LOV between the two periods was found in BP (B. papyrifera, 3.2 days increase) and CC (C. chinensis, 3.2 days increase, Figure 3C).
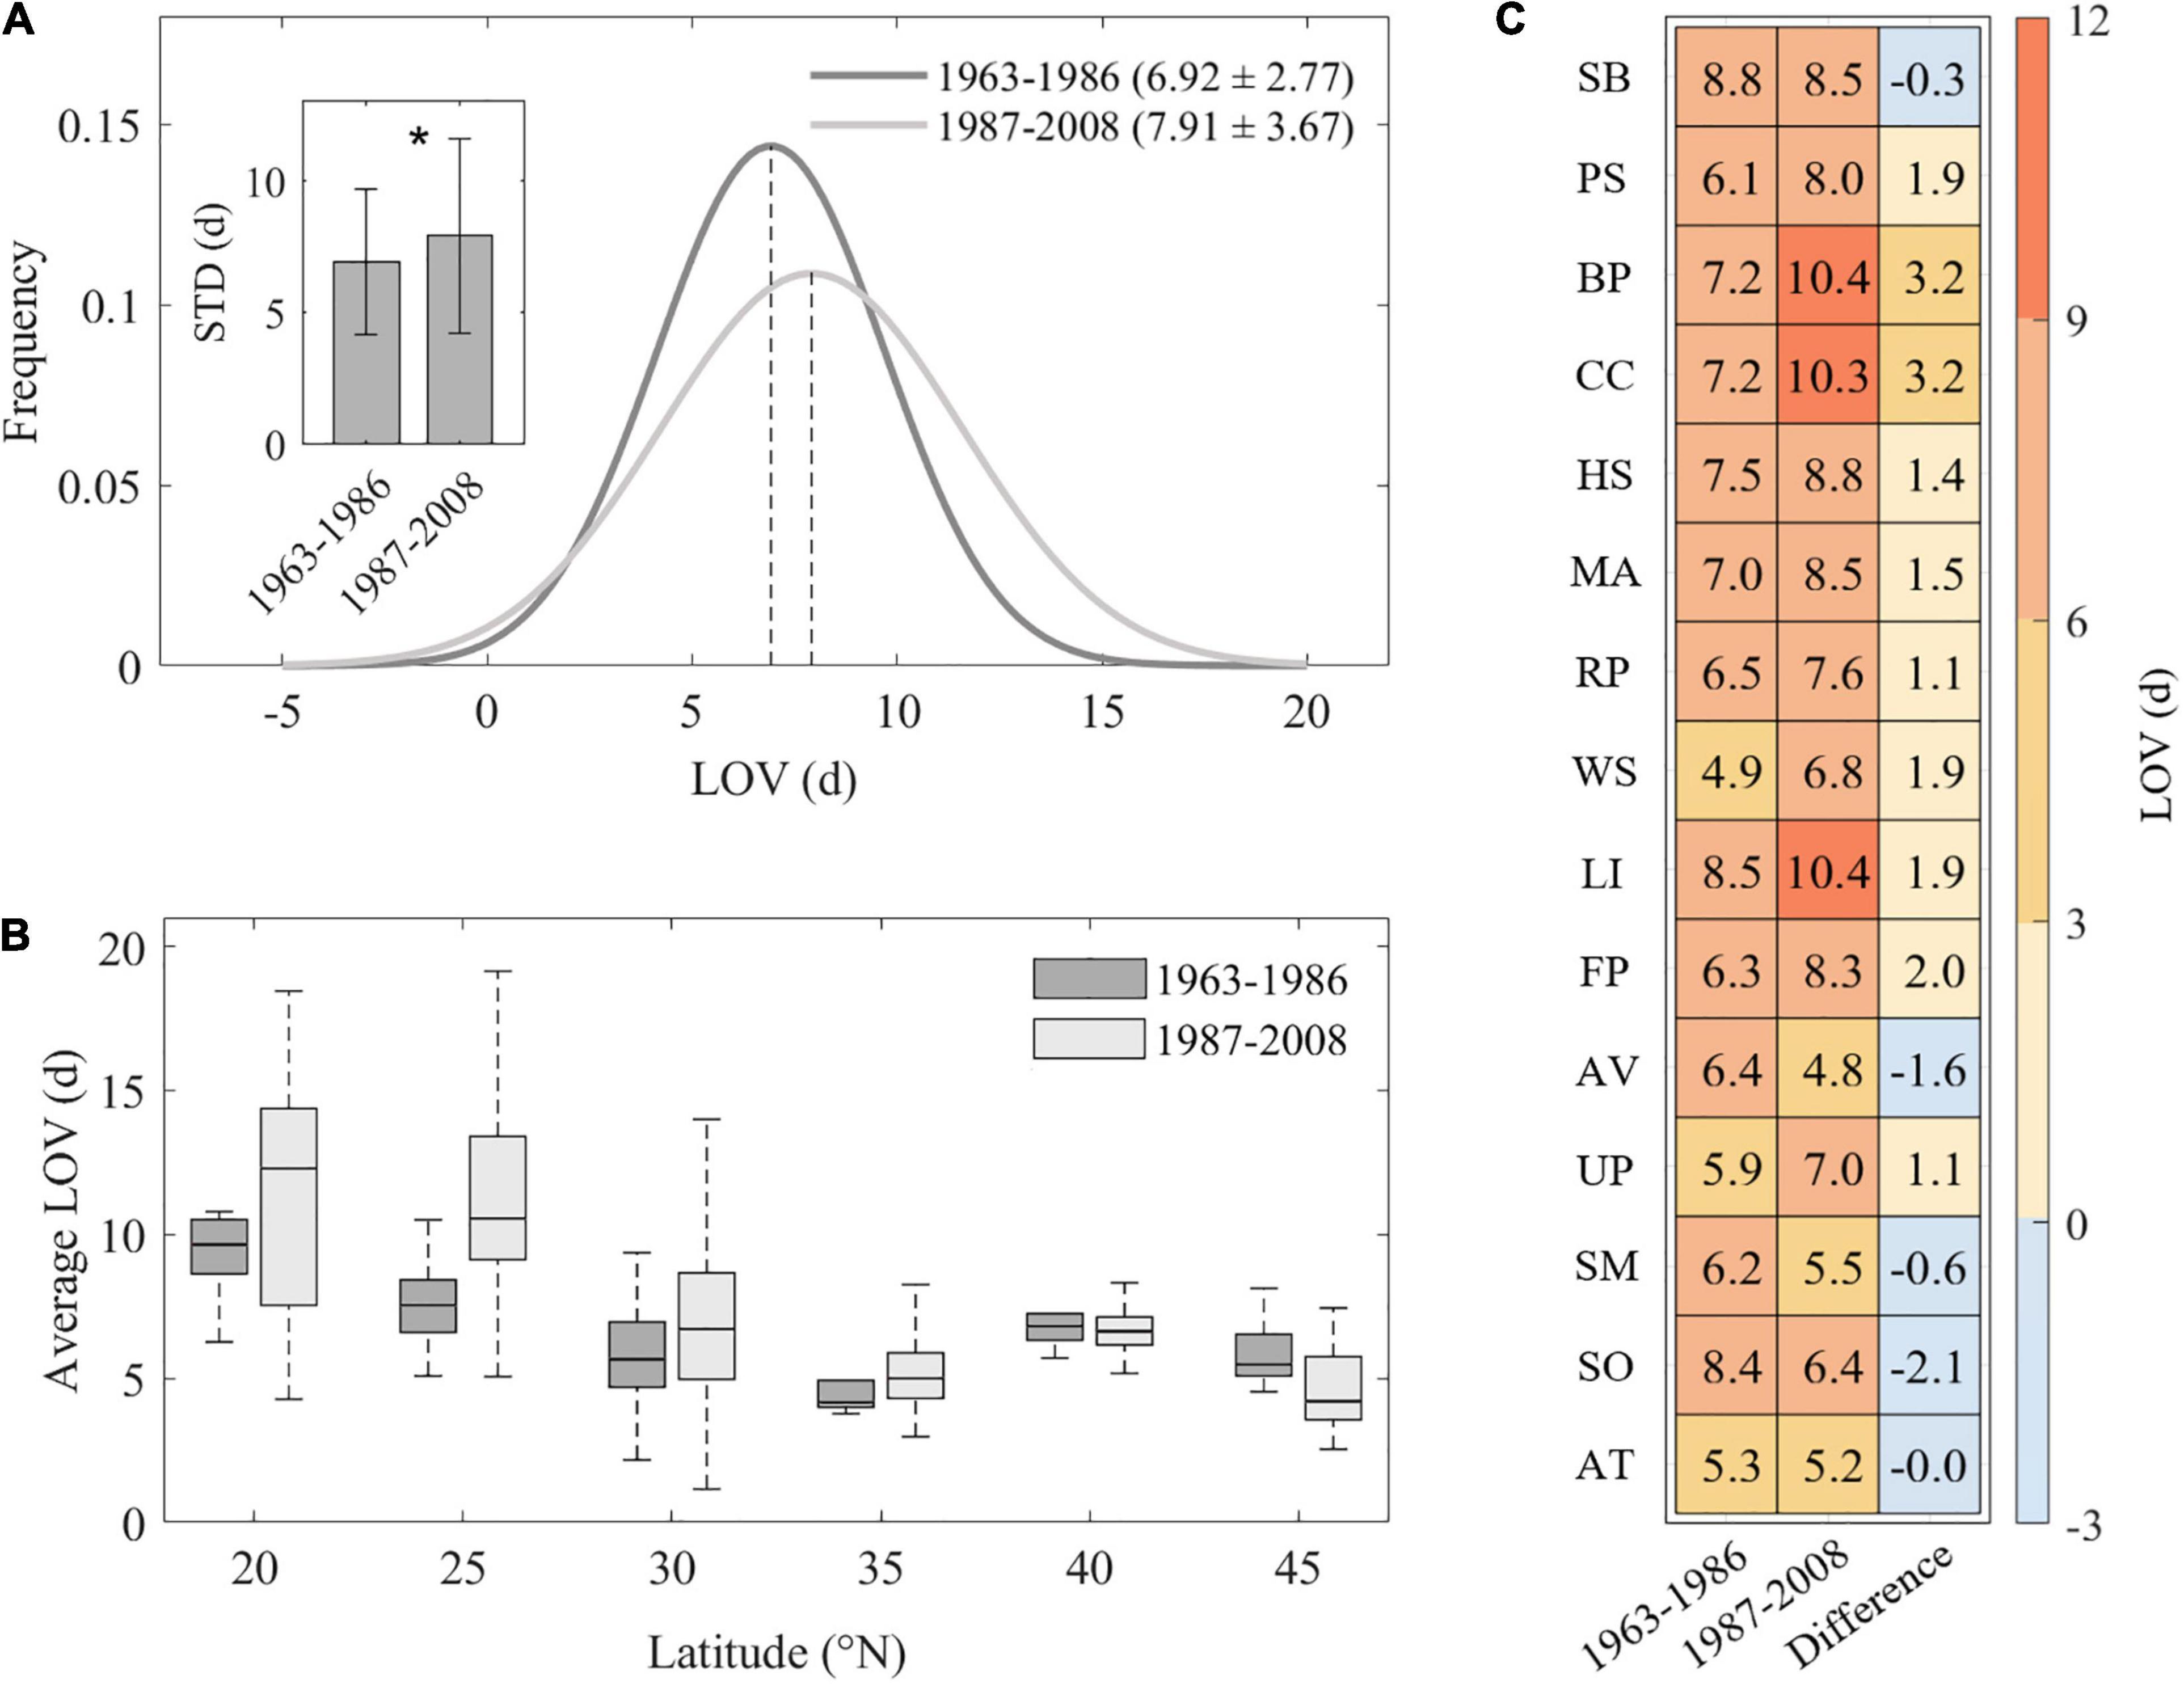
Figure 3. Frequency distribution of spring leaf-out variation (LOV) over period 1963–1986 and period 1987–2008 (A). Changes of spring leaf-out variation (LOV) against latitude (B). Species-specific LOV over two periods and its difference between 1987–2008 and 1963–1986 (C). Inset figure in panel (A) depicts mean LOV value across all species in two different periods 1983–1986 and 1987–2008, and * represents significant differences at P < 0.05 level (Student’s t-test). Abbreviations of species are as follows: SB, Salix babylonica; PS, Pterocarya stenoptera; BP, Broussonetia papyrifera; CC, Cercis chinensis; HS, Hibiscus syriacus; MA, Melia azedarach; RP, Robinia pseudoacacia; WS, Wisteria sinensis; LI, Lagerstroemia indica; FP, Firmiana platanifolia; AV, Armeniaca vulgaris; UP, Ulmus pumila; SM, Salix matsudana; SO, Syringa oblata; AT, Amygdalus triloba.
Variation of Preseason Temperature
We calculated the temporal variation of preseason temperature (TSD) during the two subperiods and did not find significant differences between the two periods across all species and sites (1963–1986: 1.10 ± 0.44°C, 1987–2008: 1.10 ± 0.48°C, Figure 4A). Spatial differences in the magnitude of TSD of the preseason were detected across 1963–2008, with the TSD increasing significantly by 0.01°C⋅°N–1 (Figure 4B).
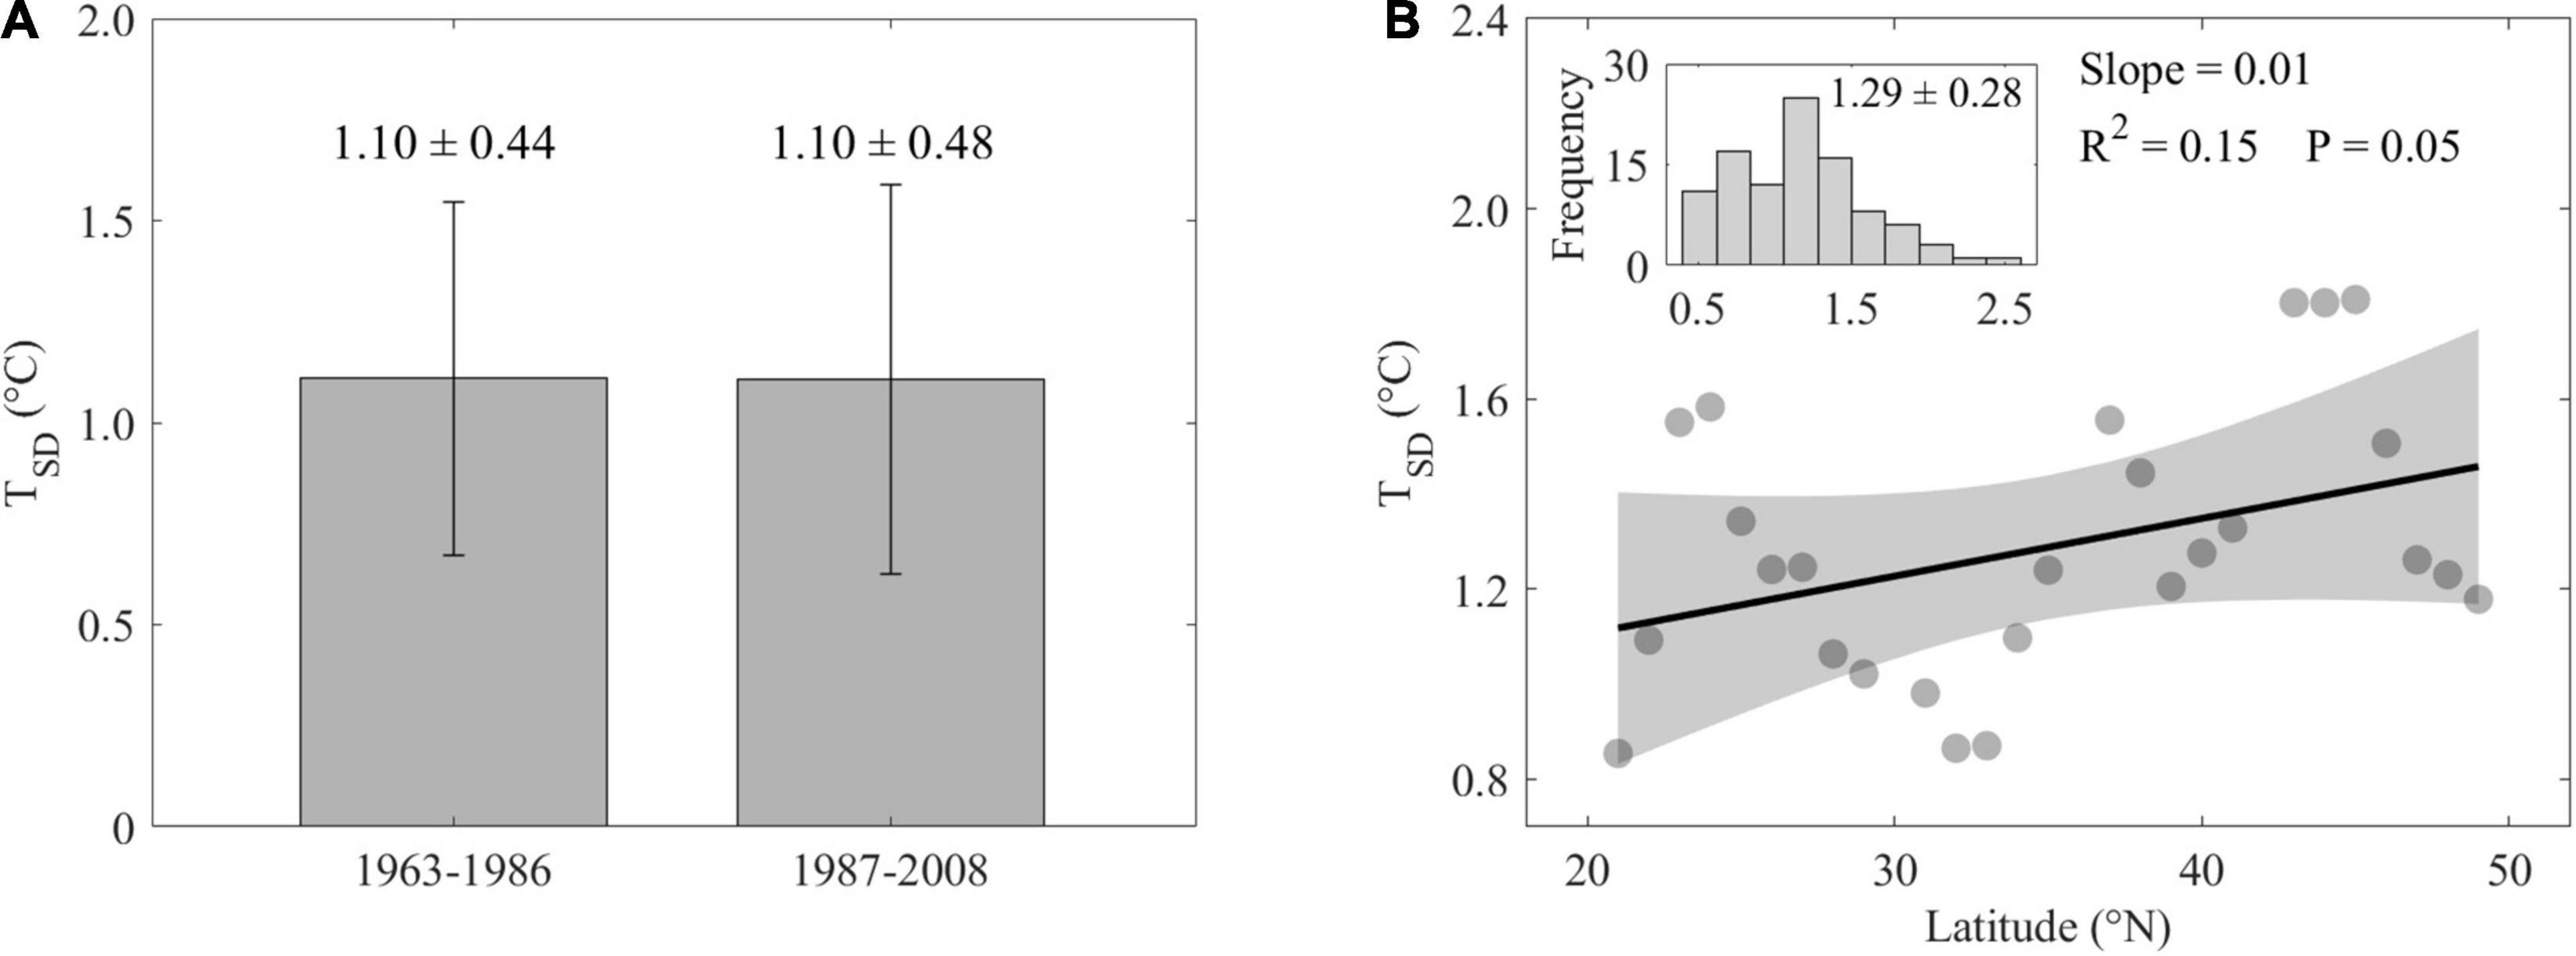
Figure 4. Temporal differences of variation of preseason mean air temperature (TSD) across all species during 1963–1986 and 1987–2008 (A). Spatial distribution of variation of preseason mean air temperature (B). In panel (B), all data were averaged per 1°N. Shaded areas represent 95% confidence intervals. Inset represents histogram of frequency distribution of ordinate values across all sites and all species.
Spatiotemporal Patterns of Chilling and Growing Degree Days
Across species, insignificant interannual variability was found in chilling during the period 1963–2008 (P = 0.70, Figure 5A), but the heat requirement of spring leaf-out, i.e., GDD, was significantly increased by a mean rate of 8.90°C per decade (P = 0.02, Figure 5B). Along latitude, chilling displayed large spatial differences but no significant trend (P = 0.19, Figure 5C). However, significant spatial differences in GDD were detected and driven by much smaller GDD requirements for trees at high latitudes; across all species, the GDD requirements were reduced with a mean rate at −15.13°C⋅°N–1 (P < 0.001, Figure 5D). The GDD calculated by a linear function, a piecewise function, and a sigmoidal function showed similar results, so we only present the results of the linear function in the main text; others can be found in Supplementary Figure 5.
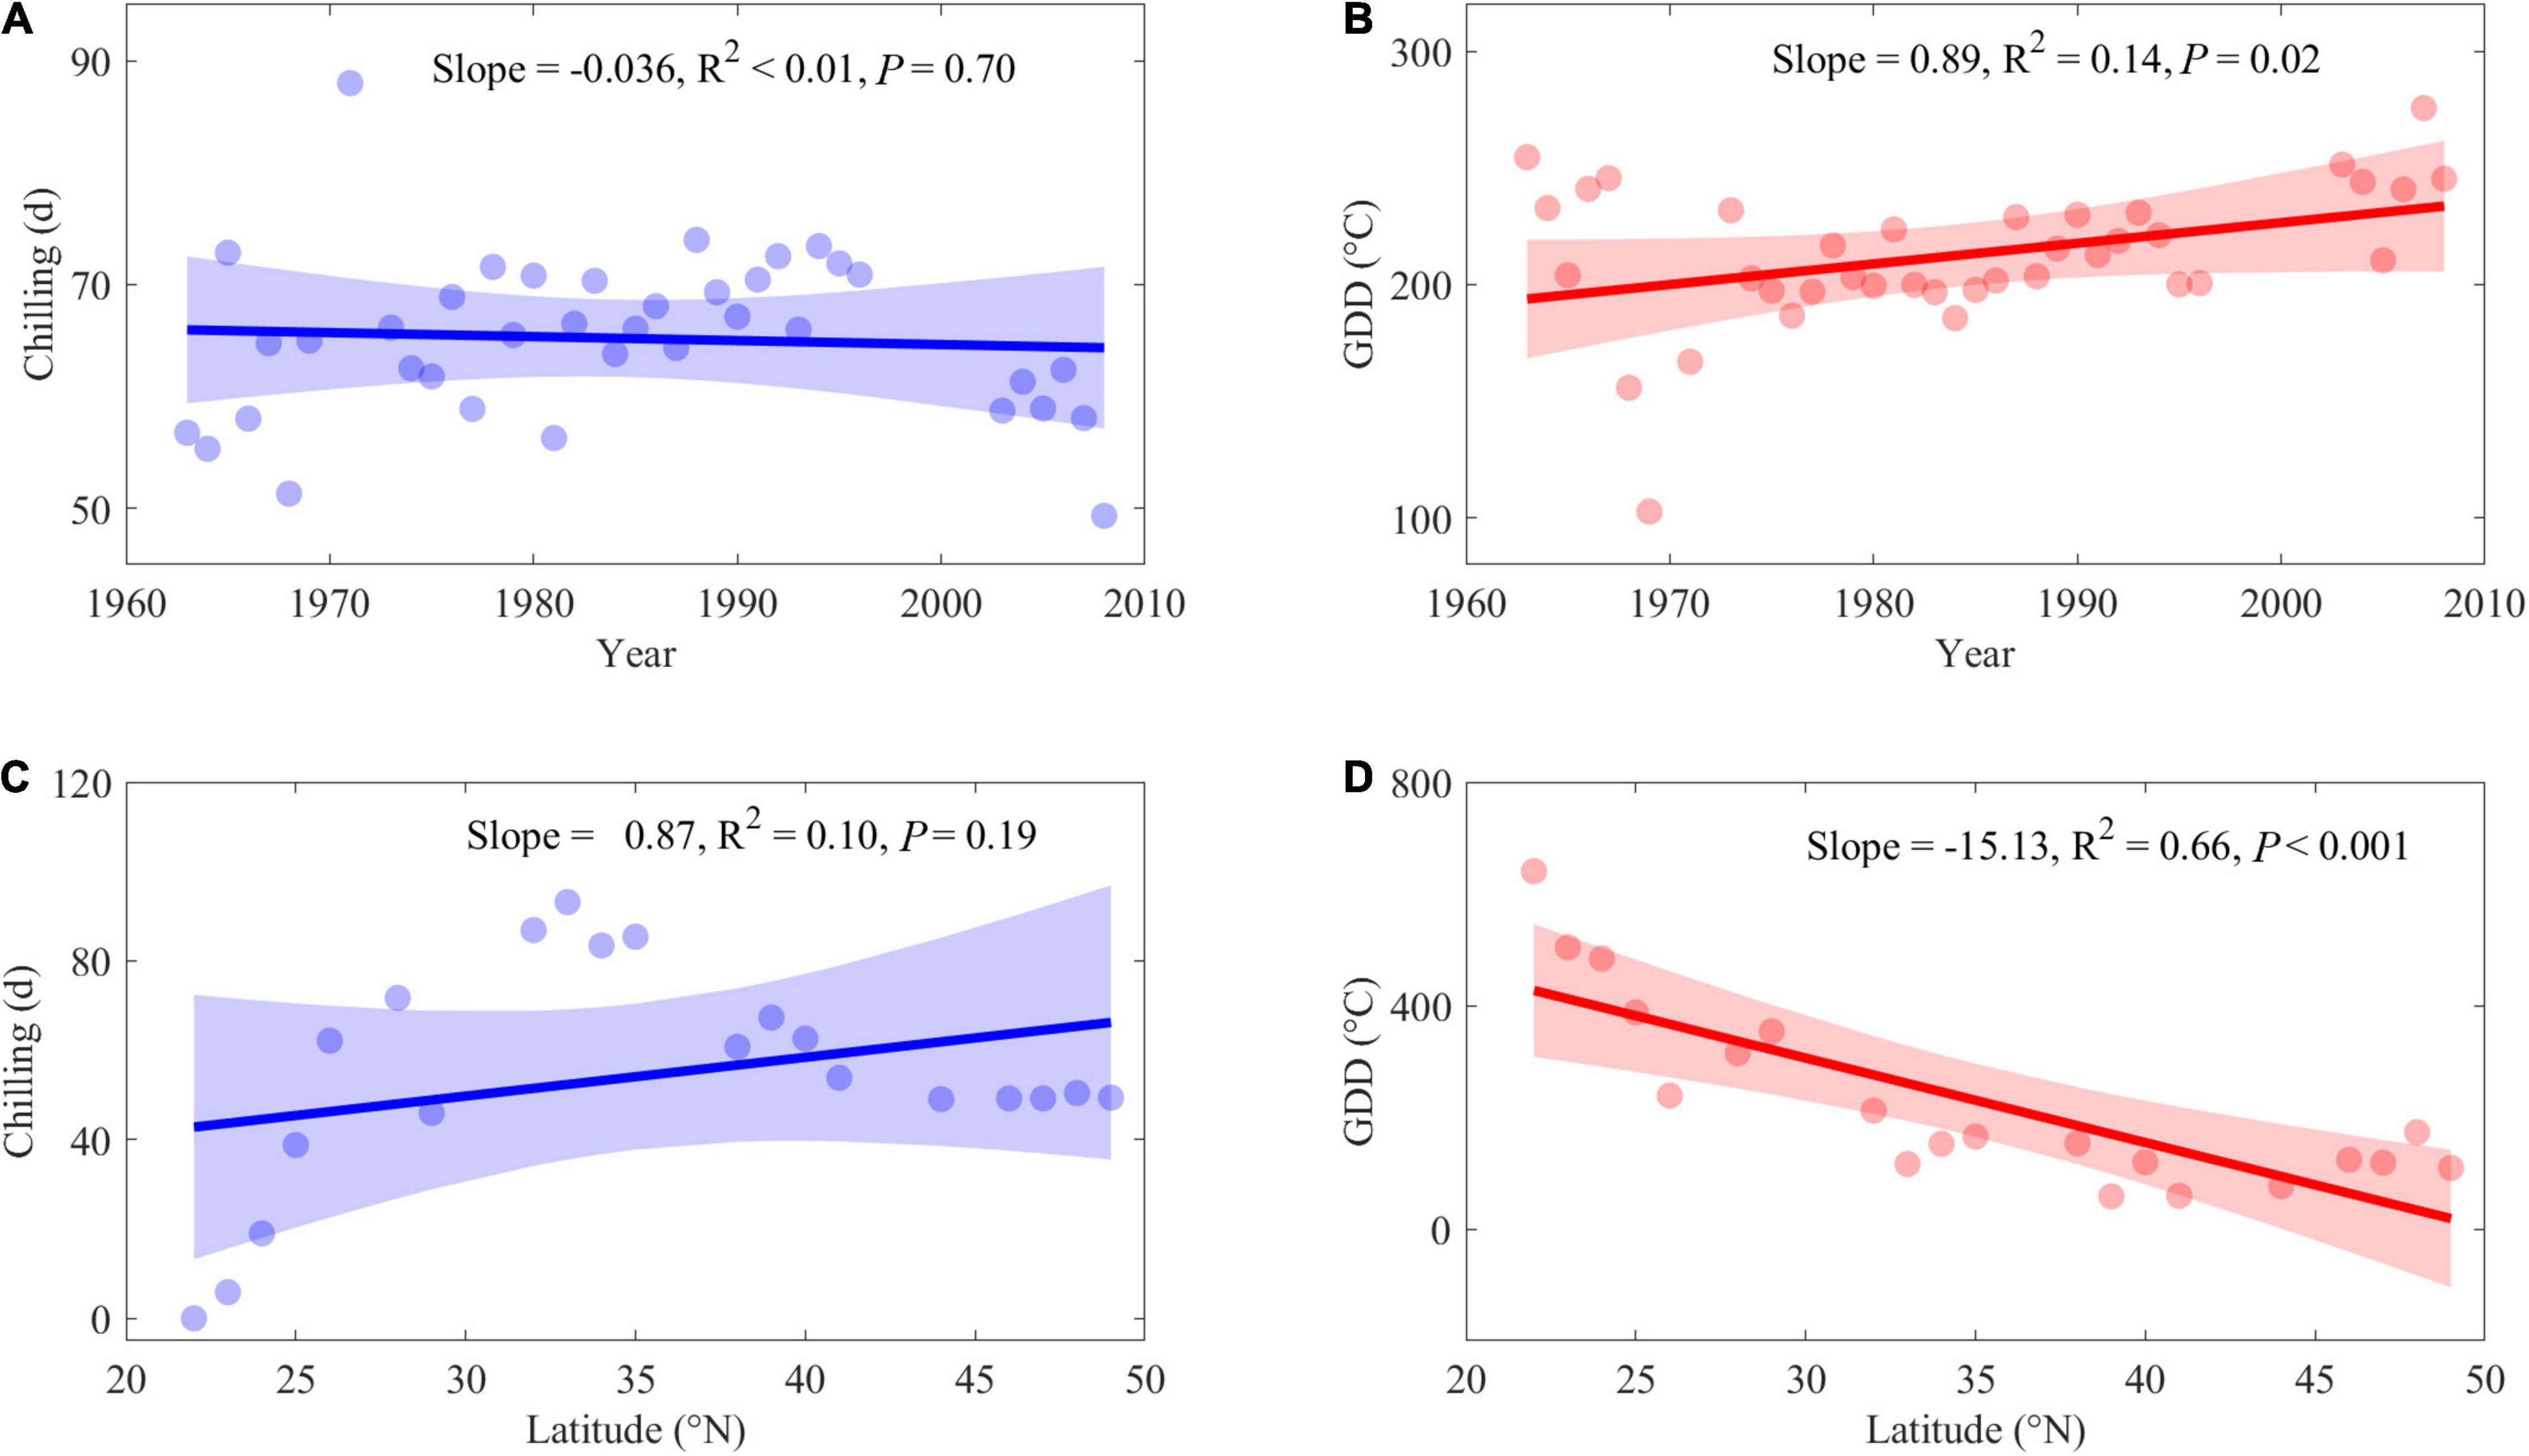
Figure 5. Interannual variability in averages of chilling and GDD during 1963–2008 (A,B) and spatial variability along latitude (C,D). Blue dots: average chilling. Blue lines: Linear regression of chilling along with time series and latitudinal series. Red dots: average GDD. Red lines: Linear regression of GDD along with time series and latitudinal series.
Changes of Apparent Temperature Sensitivity of Leaf-Out
For most species, the correlations between leaf-out date and preseason mean air temperature were negative, suggesting earlier leaf-out under preseason warming. Weaker sensitivity at higher latitude was found when analyzing the geographical pattern of temperature sensitivity (ST). Across all species and sites, we found that the ST was significantly reduced by 0.20 days⋅°C–1⋅°N–1 on average (P < 0.005, Figure 6A). As for the temporal pattern, the ST changed from −6.45 ± 4.60 days⋅°C–1 during 1963–1986 to −7.78 ± 5.22 days⋅°C–1 during 1987–2008 across all species (Figure 6B), but this difference was not significant.
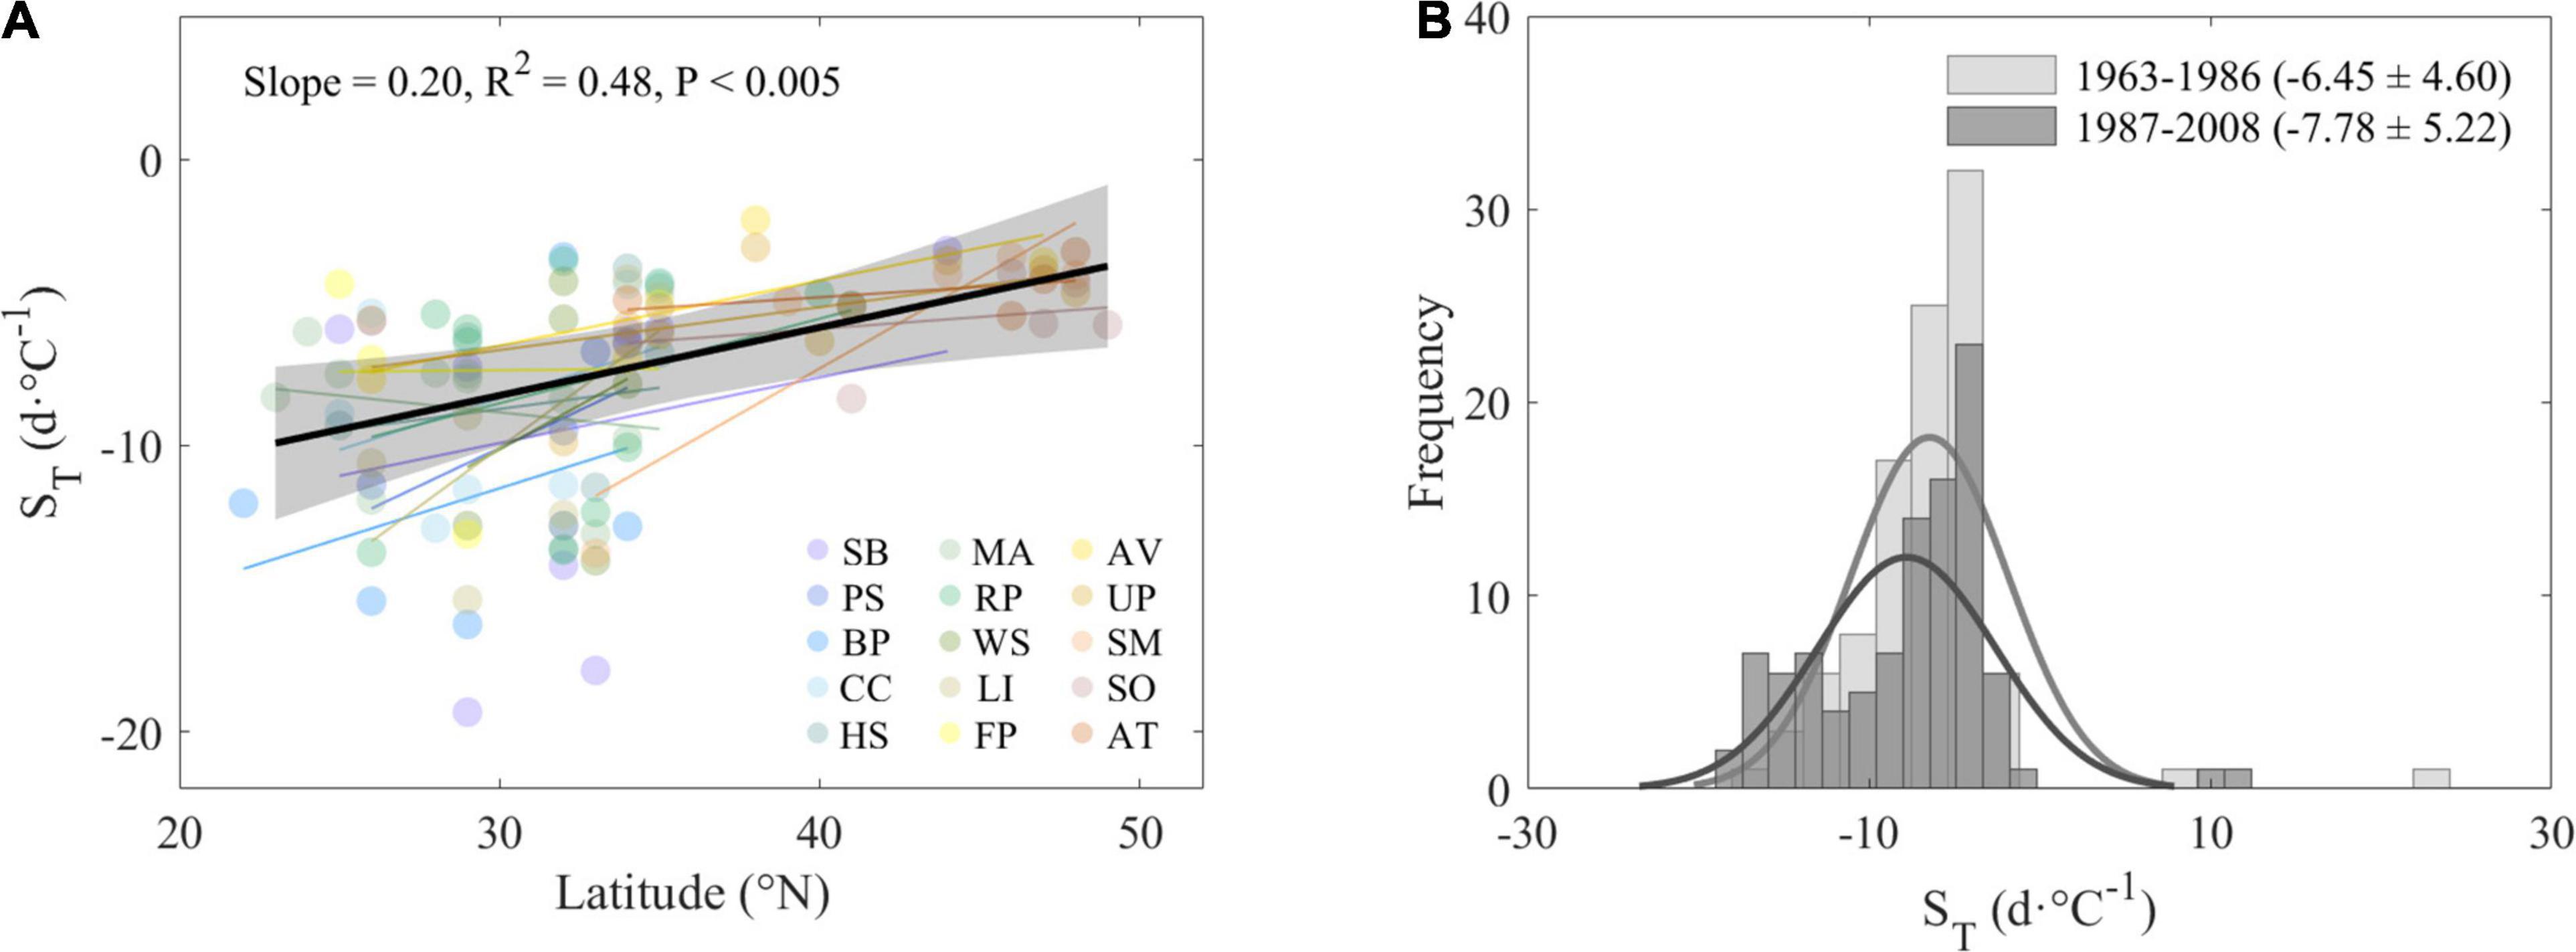
Figure 6. Changes of apparent sensitivity of leaf-out (ST) along with latitude (A) and in two different periods (B). Species-specific ST at each site and each species were plotted and fitted along latitude in panel (A). Average ST across species during 1963–1986 and 1987–2008 (B). Abbreviations of species are as follows: SB, Salix babylonica; PS, Pterocarya stenoptera; BP, Broussonetia papyrifera; CC, Cercis chinensis; HS, Hibiscus syriacus; MA, Melia azedarach; RP, Robinia pseudoacacia; WS, Wisteria sinensis; LI, Lagerstroemia indica; FP, Firmiana platanifolia; AV, Armeniaca vulgaris; UP, Ulmus pumila; SM, Salix matsudana; SO, Syringa oblata; AT, Amygdalus triloba.
Discussion and Conclusion
In line with previous studies (Fu et al., 2015a; Menzel et al., 2020), we found advanced spring leaf-out dates over the study period, and leaf-out dates were later toward higher latitudes. The latter is consistent with the “Hopkins bioclimatic law,” i.e., under the same conditions, the vegetation growth stages would advance in spring and be delayed in autumn with increasing latitude and elevation. Importantly, we found that the temporal and spatial patterns of variations of leaf-out (LOV) have significantly changed across China during the past five decades. Specifically, we found larger LOV at low latitudes where it is warmer, and the LOV was significantly increased over the period 1986–2008 with climate warming. We propose three potential explanations for our observations: 1) preseason temperature effect: larger variation in preseason temperature leads to larger variation in leaf-out; 2) chilling and heat accumulation effect: temporal and spatial differences in the restriction of chilling and heat accumulation influence the leaf-out variation; 3) differences in temperature sensitivity of leaf-out lead to the spatial and temporal changes in LOV.
The first explanation is related to the fact that spring leaf-out is highly sensitive to preseason temperature, and changes in preseason temperature may directly result in fluctuations in leaf-out date (Menzel et al., 2006b; Wang et al., 2014; Fu et al., 2015b). However, we did not find significant changes in the variation of preseason air temperature between the period 1963–1986 (1.10 ± 0.44°C) and 1987–2008 (1.10 ± 0.48°C), suggesting that the variation of preseason temperature could not explain the temporal changes of LOV. The preseason temperature variation did increase with latitude, which may lead to greater LOV at high latitudes. However, this expectation is contrary to the fact that LOV decreased with increasing latitude, suggesting that other stronger factors offset the direct impacts of temperature variation, and resulted in lower LOV at high latitudes.
The second potential explanation relates to the physiological processes of leaf-out. Previous studies have reported that trees need to be exposed to low temperatures (chilling) during winter to break dormancy, after which a certain amount of high forcing temperatures, i.e., GDD, need to be accumulated to initiate the phenological development, i.e., leaf-out (Chuine et al., 2016; Fu et al., 2020). The GDD requirement is spatially different, and we found a higher GDD requirement at low latitudes, which is consistent with a study by Fu Y.S.H. et al. (2014). In addition, the GDD requirements are not constant with climate warming, and a previous study found that 50% higher heat accumulation was required for leaf-out in European temperate trees over the past decades (Fu et al., 2015a), which is likely due to the winter warming inducing insufficient chilling (Laube et al., 2014; Hänninen, 2016). Except that, a positive correlation between GDD and precipitation, as well as a negative correlation between GDD and insolation sum, were also detected (Fu et al., 2015a). Although we did not find significant decreases in chilling requirements, a significantly higher GDD requirement was found with climate warming (Figures 4A,B), i.e., during the warmer period 1987–2008 compared with the colder period 1963–1986 (Supplementary Figure 4). This non-antiphase between GDD and chilling might be attributed to the unclear mechanism of the interaction between vegetation temperature demand and external environmental factors; further experimental and simulation researches are thus needed. A higher GDD requirement implies a longer period or higher air temperature is needed to accumulate heat for spring leaf-out. Due to the considerable uncertainty of environmental factors, the interannual variation of leaf-out would logically increase with higher GDD requirements (Supplementary Figures 6A, 7). Therefore, the high spatiotemporal consistency between GDD requirement and LOV indicated that the differences of GDD requirement play an important role in shaping both spatial and temporal patterns of LOV.
The third explanation is related to the temperature sensitivity of leaf-out. Under the same temperature variability, plants with higher temperature sensitivity are expected to have a larger variation in leaf-out dates. Consistent with this hypothesis, we indeed found a higher temperature sensitivity of leaf-out at low latitudes, which is in line with previous studies (Wang et al., 2014; Liu et al., 2016; Prevéy et al., 2017), suggesting the spatial difference in temperature sensitivity could also partially explain the spatial difference in leaf-out variation (Supplementary Figure 6B). Temporally, we found that the temperature sensitivity increased from 1963–1986 to 1987–2008 (−6.45 vs. −7.78 days⋅°C–1) but not significant. Therefore, it cannot fully explain the reason for LOV temporal changes. Moreover, recent studies found that leaf-out sensitivity was reduced due to climate warming (Fu et al., 2015b). The inconsistent results may be due to the difference in winter chilling accumulation. For example, winter chilling was significantly reduced in Europe and related to the reduced temperature sensitivity of leaf-out (Fu et al., 2015b), whereas, in the present study, we did not find significant reductions in chilling. Furthermore, photoperiod effects, precipitation, and other climatic factors may also partially explain such inconsistent outcomes (Peaucelle et al., 2019). However, how the chilling, forcing, photoperiod, and precipitation interact and determine the leaf-out processes is still unclear, which could be resolved by conducting manipulative experiments that allow separating different drivers of phenology.
Plant phenology is considered one of the most apparent fingerprints of climate change (Peñuelas, 2009; Richardson et al., 2013; Piao et al., 2019). Although most studies used linear temporal and spatial trends to link phenological responses to climate change, in this analysis, in addition to the linear trends, we revealed significant spatiotemporal changes of leaf-out variation in the context of climate change. These hint at different adaptation mechanisms evolved by species under different climatic conditions and a spatial difference in GDD requirement and temperature sensitivity. However, there are limitations in our analysis that need to be pointed out. First, the amount and spatial distribution of observations derived from the phenology database varied among species, with the number of sites ranging from 4 to more than 10, which is attributed to the lack of original observation data and may bring uncertainty to the estimation of LOV. Data of higher quality or remote sensing datasets could be selected for future analyses to reduce the uncertainty. Second, our conclusions are based on 15 tree species across China and thus need to be confirmed for other regions and species. Overall, we found a larger variation of leaf-out at low latitudes, and climate warming significantly increased the variation of leaf-out across tree species in China. Our analysis highlights that both the trends and the variation need to be considered when assessing phenological changes to better understand ecosystem responses to climate change.
Data Availability Statement
The original contributions presented in the study are included in the article/Supplementary Material, further inquiries can be directed to the corresponding author/s.
Author Contributions
YF designed the research and drafted the manuscript. YZ performed the analysis. All authors contributed to the interpretation of the results and to the text.
Funding
This study was supported by the National Science Fund for Distinguished Young Scholars (grant no. 42025101), the National Natural Science Foundation of China (grant no. 41801057), General Program (grant no. 31770516), and Higher Education Discipline Innovation Project (111 Project, grant no. B18006).
Conflict of Interest
The authors declare that the research was conducted in the absence of any commercial or financial relationships that could be construed as a potential conflict of interest.
Publisher’s Note
All claims expressed in this article are solely those of the authors and do not necessarily represent those of their affiliated organizations, or those of the publisher, the editors and the reviewers. Any product that may be evaluated in this article, or claim that may be made by its manufacturer, is not guaranteed or endorsed by the publisher.
Acknowledgments
The authors would like to thank the CPON (http://www.geodata.cn) for providing phenological datasets and China Meteorological Data Sharing Service System (http://data.cma.cn) for providing meteorological datasets.
Supplementary Material
The Supplementary Material for this article can be found online at: https://www.frontiersin.org/articles/10.3389/ffgc.2021.806719/full#supplementary-material
Footnotes
References
Both, C., Van Asch, M., Bijlsma, R. G., Van Den Burg, A. B., and Visser, M. E. (2009). Climate change and unequal phenological changes across four trophic levels: Constraints or adaptations? J. Anim. Ecol. 78, 73–83. doi: 10.1111/j.1365-2656.2008.01458.x
Cahoon, S. M. P., Sullivan, P. F., Shaver, G. R., Welker, J. M., and Post, E. (2012). Interactions among shrub cover and the soil microclimate may determine future Arctic carbon budgets. Ecol. Lett. 15, 1415–1422. doi: 10.1111/j.1461-0248.2012.01865.x
Chuine, I. (2010). Why does phenology drive species distribution? Philos. Trans. R. Soc. B Biol. Sci. 365, 3149–3160. doi: 10.1098/rstb.2010.0142
Chuine, I., Bonhomme, M., Legave, J. M., García de Cortázar-Atauri, I., Charrier, G., Lacointe, A., et al. (2016). Can phenological models predict tree phenology accurately in the future? The unrevealed hurdle of endodormancy break. Glob. Chang. Biol. 22, 3444–3460. doi: 10.1111/gcb.13383
Cleland, E. E., Chuine, I., Menzel, A., Mooney, H. A., and Schwartz, M. D. (2007). Shifting plant phenology in response to global change. Trends Ecol. Evol. 22, 357–365. doi: 10.1016/j.tree.2007.04.003
Dunn, P. O., and Winkler, D. W. (1999). Climate change has affected the breeding date of tree swallows throughout North America. Proc. R. Soc. B Biol. Sci. 266, 2487–2490. doi: 10.1098/rspb.1999.0950
Flynn, D. F. B., and Wolkovich, E. M. (2018). Temperature and photoperiod drive spring phenology across all species in a temperate forest community. New Phytol. 219, 1353–1362. doi: 10.1111/nph.15232
Fu, Y., Li, X., Zhou, X., Geng, X., Guo, Y., and Zhang, Y. (2020). Progress in plant phenology modeling under global climate change. Sci. China Earth Sci. 63, 1237–1247. doi: 10.1007/s11430-019-9622-2
Fu, Y., Zhang, H., Dong, W., and Yuan, W. (2014). Comparison of Phenology Models for Predicting the Onset of Growing Season over the Northern Hemisphere. PLoS One 9:e109544. doi: 10.1371/journal.pone.0109544
Fu, Y. H., Piao, S., Vitasse, Y., Zhao, H., De Boeck, H. J., Liu, Q., et al. (2015a). Increased heat requirement for leaf flushing in temperate woody species over 1980-2012: Effects of chilling, precipitation and insolation. Glob. Chang. Biol. 21, 2687–2697. doi: 10.1111/gcb.12863
Fu, Y. H., Zhao, H., Piao, S., Peaucelle, M., Peng, S., Zhou, G., et al. (2015b). Declining global warming effects on the phenology of spring leaf unfolding. Nature 526, 104–107. doi: 10.1038/nature15402
Fu, Y. H., Piao, S., Zhao, H., Jeong, S. J., Wang, X., Vitasse, Y., et al. (2014). Unexpected role of winter precipitation in determining heat requirement for spring vegetation green-up at northern middle and high latitudes. Glob. Chang. Biol. 20, 3743–3755. doi: 10.1111/gcb.12610
Fu, Y. H., Piao, S., Zhou, X., Geng, X., Hao, F., Vitasse, Y., et al. (2019a). Short photoperiod reduces the temperature sensitivity of leaf-out in saplings of Fagus sylvatica but not in horse chestnut. Glob. Chang. Biol. 25, 1696–1703. doi: 10.1111/gcb.14599
Fu, Y. H., Geng, X., Hao, F., Vitasse, Y., Zohner, C. M., Zhang, X., et al. (2019b). Shortened temperature-relevant period of spring leaf-out in temperate-zone trees. Glob. Chang. Biol. 25, 4282–4290. doi: 10.1111/gcb.14782
Fu, Y. S. H., Campioli, M., Vitasse, Y., De Boeck, H. J., Van Den Berge, J., AbdElgawad, H., et al. (2014). Variation in leaf flushing date influences autumnal senescence and next year’s flushing date in two temperate tree species. Proc. Natl. Acad. Sci. U.S.A. 111, 7355–7360. doi: 10.1073/pnas.1321727111
Ge, Q., Wang, H., Rutishauser, T., and Dai, J. (2015). Phenological response to climate change in China: a meta-analysis. Glob. Chang. Biol. 21, 265–274. doi: 10.1111/gcb.12648
Gordo, O., and Sanz, J. J. (2005). Phenology and climate change: a long-term study in a Mediterranean locality. Oecologia 146, 484–495. doi: 10.1007/s00442-005-0240-z
Hänninen, H. (2016). Boreal and Temperate Trees in a Changing Climate: Modelling the Ecophysiology of Seasonality. Dordrecht: Springer.
Keenan, T. F., Gray, J., Friedl, M. A., Toomey, M., Bohrer, G., Hollinger, D. Y., et al. (2014). Net carbon uptake has increased through warming-induced changes in temperate forest phenology. Nat. Clim. Chang. 4, 598–604. doi: 10.1038/nclimate2253
Keenan, T. F., Richardson, A. D., and Hufkens, K. (2020). On quantifying the apparent temperature sensitivity of plant phenology. New Phytol. 225, 1033–1040. doi: 10.1111/nph.16114
Körner, C., and Basler, D. (2010). Phenology under global warming. Science 327, 1461–1462. doi: 10.1126/science.1186473
Lan, X., Liu, Z., Chen, X., Lin, K., and Cheng, L. (2021). Trade-off between carbon sequestration and water loss for vegetation greening in China. Agric. Ecosyst. Environ. 319:107522. doi: 10.1016/j.agee.2021.107522
Laube, J., Sparks, T. H., Estrella, N., Höfler, J., Ankerst, D. P., and Menzel, A. (2014). Chilling outweighs photoperiod in preventing precocious spring development. Glob. Chang. Biol. 20, 170–182. doi: 10.1111/gcb.12360
Leith, H. (1975). Phenology and seasonality modeling. Soil Sci. 120:461. doi: 10.1097/00010694-197512000-00011
Liu, Q., Fu, Y. H., Zhu, Z., Liu, Y., Liu, Z., Huang, M., et al. (2016). Delayed autumn phenology in the Northern Hemisphere is related to change in both climate and spring phenology. Glob. Chang. Biol. 22, 3702–3711. doi: 10.1111/gcb.13311
Lloret, F., Escudero, A., Iriondo, J. M., Martínez-Vilalta, J., and Valladares, F. (2012). Extreme climatic events and vegetation: the role of stabilizing processes. Glob. Chang. Biol. 18, 797–805. doi: 10.1111/j.1365-2486.2011.02624.x
López-Uribe, M. M., Morreale, S. J., Santiago, C. K., and Danforth, B. N. (2015). Nest suitability, fine-scale population structure and male-mediated dispersal of a solitary ground nesting bee in an urban landscape. PLoS One 10:e0125719. doi: 10.1371/journal.pone.0125719
Matsumoto, K. (2010). Causal factors for spatial variation in long-term phonological trends in Ginkgo biloba L. in Japan. Int. J. Climatol. 30, 1280–1288. doi: 10.1002/joc.1969
Menzel, A., Sparks, T. H., Estrella, N., and Roy, D. B. (2006a). Altered geographic and temporal variability in phenology in response to climate change. Glob. Ecol. Biogeogr. 15, 498–504. doi: 10.1111/j.1466-822X.2006.00247.x
Menzel, A., Sparks, T. H., Estrella, N., Koch, E., Aasa, A., Ahas, R., et al. (2006b). European phenological response to climate change matches the warming pattern. Glob. Chang. Biol. 12, 1969–1976.
Menzel, A., Yuan, Y., Matiu, M., Sparks, T., Scheifinger, H., Gehrig, R., et al. (2020). Climate change fingerprints in recent European plant phenology. Glob. Chang. Biol. 26, 2599–2612. doi: 10.1111/gcb.15000
Miller-Rushing, A. J., Katsuki, T., Primack, R. B., Ishii, Y., Sang, D. L., and Higuchi, H. (2007). Impact of global warming on a group of related species and their hybrids: cherry tree (Rosaceae) flowering at Mt. Takao, Japan. Am. J. Bot. 94, 1470–1478. doi: 10.3732/ajb.94.9.1470
Mulder, C. P. H., Iles, D. T., and Rockwell, R. F. (2017). Increased variance in temperature and lag effects alter phenological responses to rapid warming in a subarctic plant community. Glob. Chang. Biol. 23, 801–814. doi: 10.1111/gcb.13386
Park, D. S., Newman, E. A., and Breckheimer, I. K. (2021). Scale gaps in landscape phenology: challenges and opportunities. Trends Ecol. Evol. 36, 709–721. doi: 10.1016/j.tree.2021.04.008
Peaucelle, M., Janssens, I. A., Stocker, B. D., Descals Ferrando, A., Fu, Y. H., Molowny-Horas, R., et al. (2019). Spatial variance of spring phenology in temperate deciduous forests is constrained by background climatic conditions. Nat. Commun. 10:5388. doi: 10.1038/s41467-019-13365-1
Peñuelas, J. (2009). Phenology feedbacks on climate change. Science 324, 887–888. doi: 10.1126/science.1173004
Pepin, N., Bradley, R. S., Diaz, H. F., Baraer, M., Caceres, E. B., Forsythe, N., et al. (2015). Elevation-dependent warming in mountain regions of the world. Nat. Clim. Chang. 5, 424–430. doi: 10.1038/nclimate2563
Piao, S., Ciais, P., Huang, Y., Shen, Z., Peng, S., Li, J., et al. (2010). The impacts of climate change on water resources and agriculture in China. Nature 467, 43–51. doi: 10.1038/nature09364
Piao, S., Liu, Q., Chen, A., Janssens, I. A., Fu, Y., Dai, J., et al. (2019). Plant phenology and global climate change: current progresses and challenges. Glob. Chang. Biol. 25, 1922–1940. doi: 10.1111/gcb.14619
Piao, S., Liu, Z., Wang, T., Peng, S., Ciais, P., Huang, M., et al. (2017). Weakening temperature control on the interannual variations of spring carbon uptake across northern lands. Nat. Clim. Chang. 7, 359–363. doi: 10.1038/nclimate3277
Prevéy, J., Vellend, M., Rüger, N., Hollister, R. D., Bjorkman, A. D., Myers-Smith, I. H., et al. (2017). Greater temperature sensitivity of plant phenology at colder sites: implications for convergence across northern latitudes. Glob. Chang. Biol. 23, 2660–2671. doi: 10.1111/gcb.13619
Richardson, A. D., Keenan, T. F., Migliavacca, M., Ryu, Y., Sonnentag, O., and Toomey, M. (2013). Climate change, phenology, and phenological control of vegetation feedbacks to the climate system. Agric. For. Meteorol. 169, 156–173. doi: 10.1016/j.agrformet.2012.09.012
Schleip, C., Ankerst, D. P., Böck, A., Estrella, N., and Menzel, A. (2012). Comprehensive methodological analysis of long-term changes in phenological extremes in Germany. Glob. Chang. Biol. 18, 2349–2364. doi: 10.1111/j.1365-2486.2012.02701.x
Vitasse, Y., Signarbieux, C., and Fu, Y. H. (2018). Global warming leads to more uniform spring phenology across elevations. Proc. Natl. Acad. Sci. U.S.A. 115, 1004–1008. doi: 10.1073/pnas.1717342115
Wang, H., Ge, Q., Dai, J., and Tao, Z. (2015). Geographical pattern in first bloom variability and its relation to temperature sensitivity in the USA and China. Int. J. Biometeorol. 59, 961–969. doi: 10.1007/s00484-014-0909-2
Wang, T., Ottlé, C., Peng, S., Janssens, I. A., Lin, X., Poulter, B., et al. (2014). The influence of local spring temperature variance on temperature sensitivity of spring phenology. Glob. Chang. Biol. 20, 1473–1480. doi: 10.1111/gcb.12509
Yang, L. H., and Rudolf, V. H. W. (2010). Phenology, ontogeny and the effects of climate change on the timing of species interactions. Ecol. Lett. 13, 1–10. doi: 10.1111/j.1461-0248.2009.01402.x
Keywords: leaf-out variation, climate warming, temperate trees, temperature sensitivity, latitude pattern
Citation: Zhang Y, Fu Y, Geng X, Chen S, Guo Y, Wu Z and De Boeck HJ (2021) Climate Warming Increased Spring Leaf-Out Variation Across Temperate Trees in China. Front. For. Glob. Change 4:806719. doi: 10.3389/ffgc.2021.806719
Received: 01 November 2021; Accepted: 16 November 2021;
Published: 16 December 2021.
Edited by:
Jian Tao, Shandong Institute of Business and Technology, ChinaReviewed by:
Hongfang Zhao, East China Normal University, ChinaXiran Li, Central China Normal University, China
Copyright © 2021 Zhang, Fu, Geng, Chen, Guo, Wu and De Boeck. This is an open-access article distributed under the terms of the Creative Commons Attribution License (CC BY). The use, distribution or reproduction in other forums is permitted, provided the original author(s) and the copyright owner(s) are credited and that the original publication in this journal is cited, in accordance with accepted academic practice. No use, distribution or reproduction is permitted which does not comply with these terms.
*Correspondence: Yongshuo Fu, eWZ1QGJudS5lZHUuY24=; Hans J. De Boeck, aGFucy5kZWJvZWNrQHVhbnR3ZXJwZW4uYmU=