 Mathias Neumann
 Mark A. Adams
 Tom Lewis3,4
- 1Department of Chemistry and Biotechnology, Faculty of Science, Engineering and Technology, Swinburne University of Technology, Hawthorn, VIC, Australia
- 2Institute of Silviculture, University of Natural Resources and Life Sciences, Vienna, Austria
- 3Department of Agriculture and Fisheries, Brisbane, QLD, Australia
- 4University of the Sunshine Coast, Maroochydore, QLD, Australia
There is little published information on effects of management on the structure of mixed species forests in Queensland, Australia. We used long-term growth, abundance and dimension data from permanent plots to test the hypothesis that harvesting would reduce numbers of large trees and growth increments, while increasing recruitment. This hypothesis is key to policy and management decisions for forests covering about 9.5 million hectares. Inclusion of data on changes in forest structure (e.g., tree diameter, stem density) helps in assessment of forest suitability as habitat for a range of species. Growth rate (basal area) varied widely among forest types. Growth of each of four key species (i.e., Eucalyptus pilularis, Corymbia citriodora ssp. variegata, Callitris glaucophylla, and Eucalyptus crebra) reflected variation in rainfall across the study region. Callitris glaucophylla, a native conifer, is dominant when rainfall is < 600 mm per year. Corymbia citriodora ssp. variegata grows across much wider ranges in rainfall (600–1,200 mm year–1) at rates similar to Callitris glaucophylla. Historic harvesting increased recruitment and also increased the symmetry of diameter distributions. Harvesting has not reduced the current density of larger trees (diameter at breast height, DBH ≥ 60 cm) at a regional scale. Stand growth was unaffected by management principally owing to an increase in the density of trees of smaller diameter (10–20 cm DBH). Self-thinning limits potential stocking and we tested 3 methods for predicting self-thinning across forest types. We found that the slope of self-thinning lines under drier conditions is mostly < –2, suggesting highly dynamic self-thinning. Using a species-boundary line approach, growth is predicted to slow when basal areas reach around 66.1 m2 ha–1 in E. pilularis, 19.0 m2 ha–1 in C. citriodora ssp. variegata, 16.5 m2 ha–1 in Callitris glaucophylla, and 14.2 m2 ha–1 in E. crebra. The slope of the self-thinning line for E. pilularis was –1.662, similar to Reineke’s Stand Density Index (slope –1.605). To date, there is little evidence that selective harvesting and thinning have had negative impacts on rates of growth, on timber production, carbon sequestration or on aspects of forest structure regarded as important for biodiversity.
Introduction
The latest data show that naturally-regenerating forests represent 93% of the world’s forest cover (FAO and UNEP, 2020). Native species dominate these forests. Fire-adapted native “eucalypt” forests—dominated by trees in the genera Eucalyptus, Corymbia and Angophora—are the most widespread forest type in Australia (Montreal Process Implementation Group for Australia and National Forest Inventory Steering Committe, 2018), with Queensland providing almost 40% of the Australian forest estate of approximately 131 million hectares.
Patterns of forest harvesting across the world have changed markedly in recent decades. Harvesting has decreased in the United States and Australia, but increased in Canada, China and Europe. Much of the change is driven by changes in policy, by disturbance, and by localized intensification of use (Houghton and Hackler, 2003; USDA Forest Service, 2014; Forest Europe, 2015; Montreal Process Implementation Group for Australia and National Forest Inventory Steering Committe, 2018). Queensland native forests present a useful and informative case study of harvesting effects in native forests.
In keeping with patterns elsewhere in Australia, harvesting in native forests in Queensland has been steadily reduced in recent decades. Sawlog volumes from public native forest (hardwood and cypress pine sawlogs) declined from around 341,000 m3 year–1 in 1992 to 186,000 m3 year–1 in 2016 (Montreal Process Implementation Group for Australia and National Forest Inventory Steering Committe, 2018). This reduction reflects changes in policy (e.g., the 1999 Forest Agreement in south east Queensland, Norman et al., 2004) that seek to replace wood from native forests with wood and fiber sourced from planted forests. A similar pattern is observed in privately owned native forests (Francis et al., 2020), arguably due to tightening of regulatory requirements (Jay et al., 2007). Impacts of harvesting on attributes such as structure and growth (and other aspects of sustainability) have received considerable attention (e.g., Attiwill, 1994; Lindenmayer, 1995; Attiwill and Adams, 2008; Lindenmayer et al., 2012). The effects of harvesting has been rarely considered in forests within conservation tenures (e.g., Munks et al., 2020; Richit et al., 2021) although some studies suggest it can enhance structural complexity (McKenny et al., 2006; Thom and Keeton, 2020) with flow-on effects for a range of other attributes.
The global recognition that sustainably managed forests provide significant environmental services (e.g., carbon storage, water yield, biodiversity), as well as timber (Dare et al., 2017; Francis et al., 2020), emphasizes the need for quantitative data. To date, species composition of regenerating eucalypt forests (i.e., species mix) usually matches well that prior to harvesting. Most available evidence suggests this is due to a pattern of (re)growth from lignotubers or the soil seedbank (Florence, 1964, 1996; Henry and Florence, 1966; Lewis, 2020). Maintenance of biodiversity is more difficult to assess. Evidence from elsewhere (e.g., eastern United States) suggests selective harvesting increases stand diversity compared to unharvested reference areas (Schuler, 2004). However underlying variation in biodiversity across spatial and temporal scales, and across taxonomic groups (e.g., Rosenzweig, 1995; May et al., 2018) can mask local harvesting effects. A key biodiversity concern in Australia and elsewhere is loss of habitat trees. Large trees provide habitat for a range of fauna species, some of which rely on floral and other nutritional resources, and hollows for nesting and sheltering (Eyre and Goldingay, 2005; Smith et al., 2007; Eyre et al., 2009; Goldingay, 2009; Lindenmayer, 2016).
Large trees without defects were historically sought by timber cutters, owing to smaller proportional losses to waste during harvesting and milling (Carron, 1985; Florence, 1996). As a result, large trees have often been removed in productive landscapes (Wilson et al., 2002). For example, Eyre et al. (2015) found that thinning and harvesting reduced measured density of large living eucalypts. Requirements for retention of habitat trees and potential habitat trees is now routinely part of management prescriptions for native forests managed for timber production (Queensland Parks and Wildlife Service, 2020). In Queensland, for example, four live hollow-bearing trees ha–1 is a general standard for maintaining species richness of arboreal mammals, notwithstanding more specific requirements for individual species (e.g., greater glider, Petauroides volans, requires 6 ha–1; Wormington et al., 2002; Eyre, 2005). Habitat trees are often selected based on size (> 80 cm diameter at breast height preferred), habitat characteristic (e.g., hollows), and species (reflecting the species mix of the site) (Queensland Parks and Wildlife Service, 2020).
In contrast to biodiversity, productivity is most commonly assessed using long-term data of changes in basal area (units of m2 ha–1), accounting for mortality. Since the mid-1960s, management regimes in Queensland’s native forests have been focused on ensuring retention of canopy cover and recovery of basal area (Grimes and Pegg, 1979; Florence, 1996; Ngugi et al., 2014). Apart from fire-regenerated E. pilularis or E. grandis forests, management in Queensland has generally favored single tree harvesting (or single tree selection) over clear-felling or group-selection harvesting. Policy aims to avoid losses of productivity are given effect through management guidelines (Queensland Parks and Wildlife Service, 2020). Climate is likely a determinant of long-term productivity (Lewis et al., 2010; Jay, 2018). Modeling, long-term monitoring programs and tree ring studies all suggest changes in climate, especially reduced rainfall and higher temperatures, could lead to losses of productivity (Kirschbaum, 2004; Ruiz-Benito et al., 2014; Vlam et al., 2014).
Here we analyze long-term data for native forests in southern Queensland. Parts of the forest estate in this region have been managed for timber production for more than a century (Carron, 1985; Florence, 1996; Gough, 2018). We sought to disentangle species effects on productivity from climatic effects, using rainfall as a metric that might reflect changing climates and that is correlated with forest productivity (e.g., Lewis et al., 2004; Haverd et al., 2013; Ngugi et al., 2015). We include analysis of spatial variation since elucidating temporal patterns requires robust data for climate at fine scales (Hasenauer et al., 2003), as opposed to data derived by interpolation between often distant stations (Jeffrey et al., 2001; Beesley et al., 2009). Our null hypotheses were that previous harvesting would have: (1) reduced the density of large trees (i.e., important for biodiversity habitat); (2) increased the recruitment of trees (important for resilience to disturbances and recovery of carbon storage); and (3) reduced the basal area increment of forest stands (important for maintaining productivity and carbon storage).
In the absence of disturbances, many forests self-thin. As individual trees grow larger, stem density declines. This phenomenon is usually interpreted as being an outcome of competition for resources. If size/density data are expressed in logarithmic form, general relationships can be formalized whereby the slope of the log-log plot of density vs. size is a defining species characteristic (self-thinning lines; Reineke, 1933; Yoda et al., 1963; Curtin, 1964; Westoby, 1984; Sterba and Monserud, 1993; Bi et al., 2000; Long and Vacchiano, 2014). Size/density relationships can be used to help predict maximum stocking and can help provide benchmarks for potential carbon storage (Roxburgh et al., 2006) and habitat value (Wormington et al., 2002). A recent study of Australian eucalypts showed that “self-thinning lines” provided comparable results to more complex dynamic mortality models (Trouvé et al., 2017). We tested if self-thinning lines varied among species (e.g., Pretzsch and Biber, 2005) and how they compared to generic self-thinning lines (i.e., with a slope of ∼ –1.605; sensu Reineke, 1933). We also tested if basal area limited maximum stocking (equates to a fixed slope of –2.000 for self-thinning). We discuss our findings in terms of changes in stand structure and productivity over time, and in the context of helping frame future options for management of sub-tropical native forests.
Materials and Methods
Permanent Growth Plots
Long-term growth data were sourced from the Department of Agriculture and Fisheries, Forestry Science database, combining permanent sample plots in State Forests (described by Ngugi et al., 2015 and tested for representativeness by Beetson et al., 1992) with long-running thinning trials in Queensland State Forests (Table 1). This mix ensured we captured forests with and without harvesting effects (including non-commercial thinning) measured over a minimum of 5 years, and up to 79 years. The earliest measurements began in 1931 and the latest measurements were made in 2011. Individual trees were tagged with a unique identifier. Plot sizes varied from 0.0405 to 0.5 ha (mean ± standard deviation 0.179 ± 0.145 ha) and were generally rectangular in shape. Given the age of many plots, their dimensions used imperial units, now rarely used, e.g., 0.1 acre (0.0405 ha) is limited by a 1 chain × 1 chain plot with 1 chain, equal to 66 feet or 20.1168 m. No plots in the dataset were completely free of tree removal since European settlement, as far as we can determine. We calculated the contribution of tree species to stand basal area (Eq. 1) and grouped the plots by dominant species (that contribute most to stand basal area in Table 1).
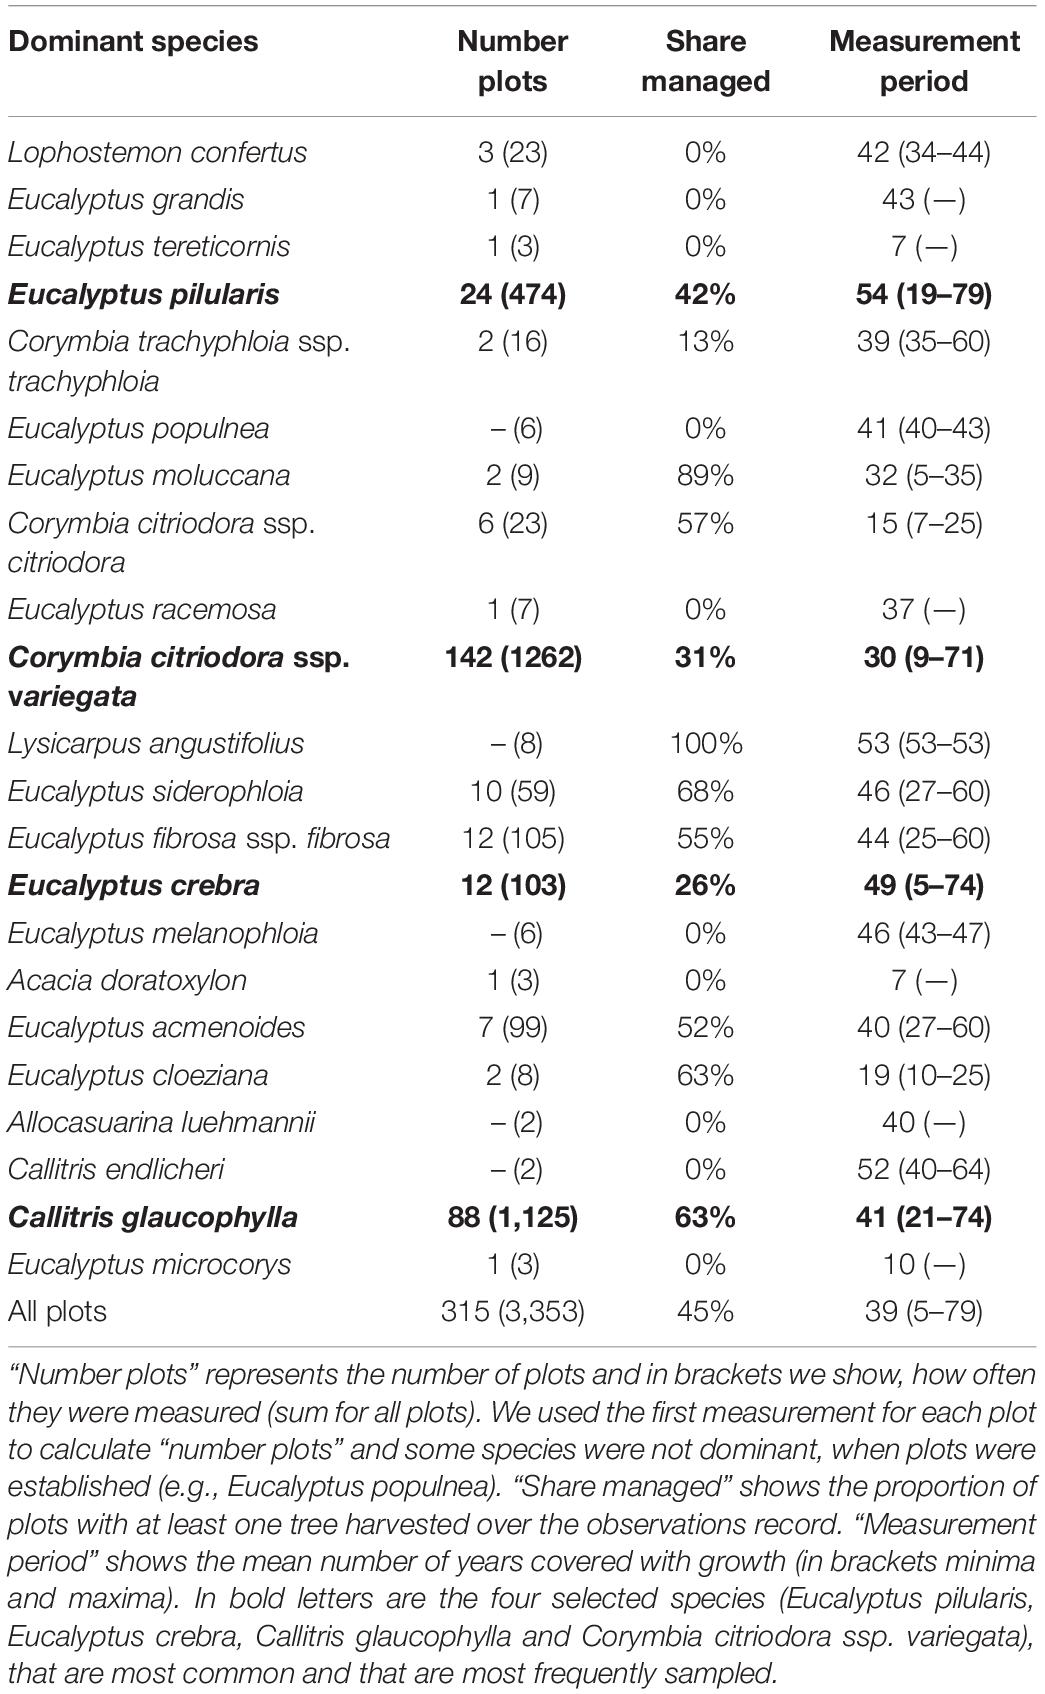
Table 1. Number of observations, the share of managed plots and the time period over which they were measured, grouped by dominant species.
We calculated basal area BA (m2 ha–1) and stem density N (ha–1) as the sum of individual trees with DBH of at least 10 cm (Eqs. 1, 2).
Where DBH is the diameter at 1.3 m height above ground (cm) measured over-bark, A is the plot area (ha) and “count” is the number of trees per plot. DBH was measured at 4.5 feet above ground until 1974, which is equivalent to 1.37 m. As there are no suitable taper functions available for all tree species to correct this, we decided to not modify our data. Our paired analysis (see section “Effect of Management on Stand Structure”) ensures that this effect has no effect on our analysis.
We also calculated quadratic mean diameter (DG, cm) as a measure of mean tree size.
For every period (years) with subsequent repeated measurements, we calculated the basal area increment of existing trees (BAI), recruitment (BA1 = zero), and losses due to mortality and harvesting (BA2 = zero) based on basal area (m2 ha–1 year–1) (Eq. 4).
Sapling trees were counted as recruits when they reached 10 cm DBH. Measurement protocols changed over time (Beetson et al., 1992) and differed among the different types of plots (i.e., permanent sample plots vs. thinning trials). In permanent sample plots (i.e., those described by Ngugi et al., 2015) the minimum tree size for recruitment used from 1975 to 1991 was 7.5 m in height, which is approximately equivalent to a DBH of 10–15 cm. After 1991, on all plots all trees ≥ 10 cm DBH were measured. Such differences in measurement protocols were accounted for in our analysis by splitting the results by first and last measurements (see section “Effect of Management on Stand Structure”). Further, stems < 10 cm DBH were measured in some plots, but were excluded from analysis to ensure we retained comparability among plots. Trees ≥ 10 cm DBH are generally considered to be a permanent part of the stand and able to survive effects of low intensity fire, browsing and drought (Hurst et al., 2011; Lawes et al., 2011).
Mixed-species native forests in southern Queensland cover an area of around 9.5 million hectares (Figure 1). About one quarter (2.6 million ha) are state forests and the remainder are private forests, national parks and reserves (Ngugi et al., 2015; Lewis et al., 2020). For each plot, we identified annual rainfall and annual average temperature between 1970 and 2000 (Fick and Hijmans, 2017). The great majority of plots were located south of the Tropic of Capricorn and all plots received annual rainfall greater 500 mm (Figure 1). The regions has a humid sub-tropical climate and the plots have an average daily temperature of 20°C (min-max 16–22°C) and annual rainfall ∼ 960 mm (min-max 572–1620 mm year–1; Fick and Hijmans, 2017).
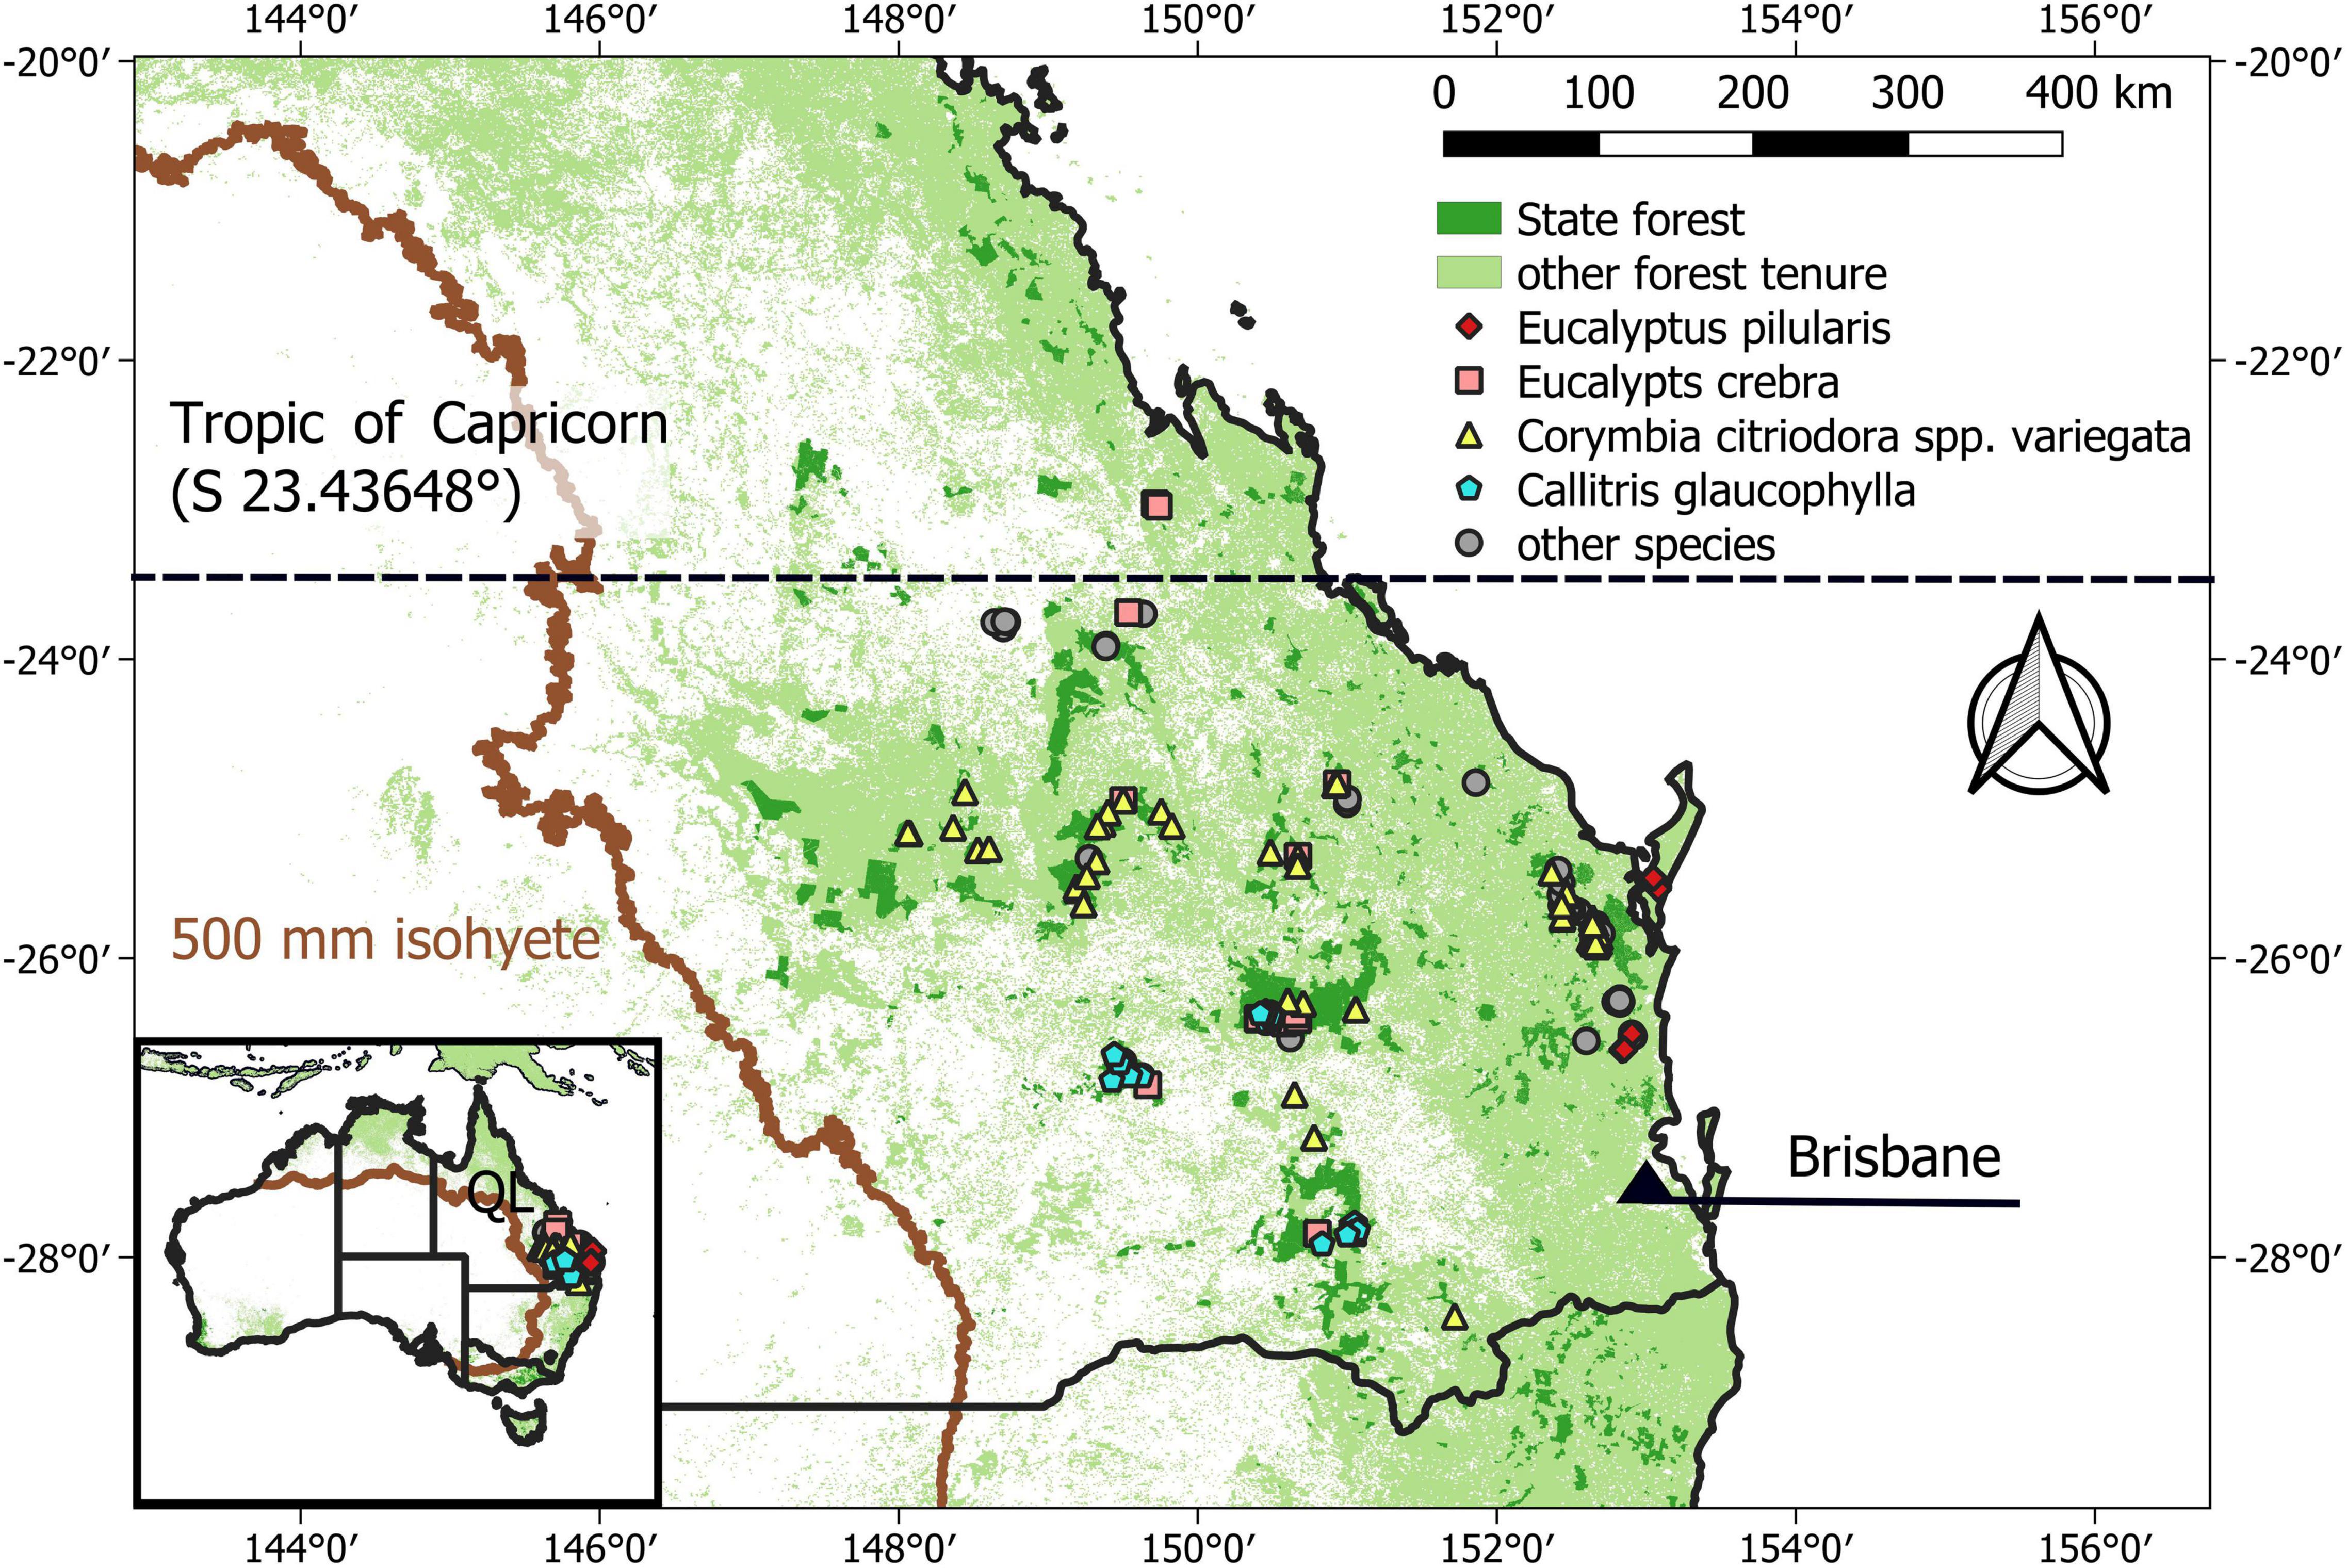
Figure 1. Southern Queensland’s forest cover and forest tenure. Locations of sample plots used in this study are marked. Forest cover includes forest and savanah classified by MODIS landcover (Friedl et al., 2010). The four most frequent dominant tree species (Table 1) are identified by colors and shapes. Overlapping plot locations explain discrepancies to plot numbers shown in Table 1. We marked the Tropic of Capricorn, dividing the Subtropics from the Tropics. We also show the 500 mm isohyet—a common threshold used in Australia for delineating semi-arid ecosystems. The data source is WorldClim data representing annual average precipitation sum in 1970–2000 (Fick and Hijmans, 2017).
Maximum Stocking and Self-Thinning
A large number of plots were unthinned and had not been harvested during the measurement period (Table 1). Using three models for predicting self-thinning (i.e., similar to the approach used by Trouvé et al., 2017), we sought to identify maximum stocking using only unmanaged plot data. First, we assessed predicted self-thinning on the basis of basal area (BA = N × π/40,000 × DG2) applying a self-thinning line with slope of –2.000 (STBA). Secondly, we assessed predicted self-thinning on the basis of stand density index (SDI = N × (DG/25)1.605; Reineke, 1933), assuming a slope of –1.605 (STReineke). For both models we calculated the 95th quantile (P95) of BA and SDI for the four most frequent species, E. pilularis, E. crebra, Callitris glaucophylla, and Corymbia citriodora ssp. variegata (see Table 1 and Figure 1). Finally, we used quantile regression to fit self-thinning lines with variable slope (STvariable) to the point cloud, again using 95th quantile. We compared these lines to those with fixed slopes derived from either density (STReineke) or basal area (STBA). We thus evaluated self-thinning without prior assumption of fixed slopes for self-thinning lines (Trouvé et al., 2017). The 95th quantile of BA is an easy-to-measure proxy for maximum potential stocking.
Effect of Management on Stand Structure
Individual tree information included measures of status (alive, standing dead or removed/ring-barked). For standing dead trees, the reason for tree death was assessed. We assigned all plots, as being either managed (n = 130) or unmanaged (n = 175) and used only the first and last measurement for each plot. We excluded plots with measurement period less than 10 years (n = 10), to allow for time needed to respond to management. Managed plots were subject to non-commercial thinning of small trees or ring-barking of undesired trees up until 1990, as well as selective harvesting on a 20–30 year cycle. Managed plots benefitted from fire protection. We cannot preclude that harvesting of nearby trees outside the plots changed growth conditions within the plots. Most plots (76%) had a buffer to accommodate such effects. No trees had been removed or killed in unmanaged plots (as far as we can determine). For every plot we calculated stem density and assessed the skewness of DBH distributions. We assumed the same year-to-decade variation due to climate change, CO2 fertilization or nitrogen deposition (Kirschbaum, 2004; Ruiz-Benito et al., 2014; Adams et al., 2021) for all plots. We checked for differences in rainfall (Supplementary Figure 2) and sampled area (Supplementary Figure 3) between managed and unmanaged plots. Average rainfall on unmanaged E. pilularis plots was 180 mm greater than that on managed counterparts (Supplementary Figure 2). There were no other significant differences. Temporal variations in climate or fire frequency were beyond the scope of this study.
Statistical Analysis
We used QGIS, version 3.2.2, for preparing Figure 1 and R statistical software, version 4.0.3 (R Development Core Team, 2021) for processing and analysis. We used analysis of variance to determine whether management has had an effect on stand structure, increment and recruitment and whether managed plots have different plot area or precipitation than unmanaged plots (see previous sections). We assessed both parametric statistical tests (Student’s t-tests with logarithmic transformation) and non-parametric tests (Kruskal-Wallis tests). Both accommodated skewness in the data and produced similar results; results from Kruskal-Wallis tests were reported unless otherwise noted.
Results
Productivity Varies by Tree Species and Rainfall
Sample plots used in this study were distributed over a large proportion of southern Queensland (an area of about 9.5 million hectares, slightly greater than the area of Austria; Figure 1) and span a large gradient in rainfall (Figure 2). Eucalyptus pilularis is a dominant tree near the coast, where rainfall exceeds 1,200 mm per year. Rates of growth of E. pilularis (average basal area increment BAI 0.84 m2 ha–1 year–1) were much faster than those of other species (see also Supplementary Figure 1). Corymbia citriodora ssp. variegata dominates at higher rainfall in coastal areas, but also on sites further inland with annual rainfall < 600 mm. Rates of growth of C. citriodora ssp. variegata decreased (mean BAI 0.23 m2 ha–1 year–1) with precipitation (Supplementary Figure 1). Eucalyptus crebra (mean BAI 0.09 m2 ha–1 year–1) dominates large areas in the 600–700 mm rainfall zone, but grows slowly. Callitris glaucophylla (mean BAI 0.23 m2 ha–1 year–1) is increasingly dominant as annual rainfall declines from 700 mm. Callitris glaucophylla maintains rates of growth similar to those of C. citriodora ssp. variegata (at higher rainfall). Species distributions are clearly influenced by climate, as well as topographic and soil conditions (not analyzed here).
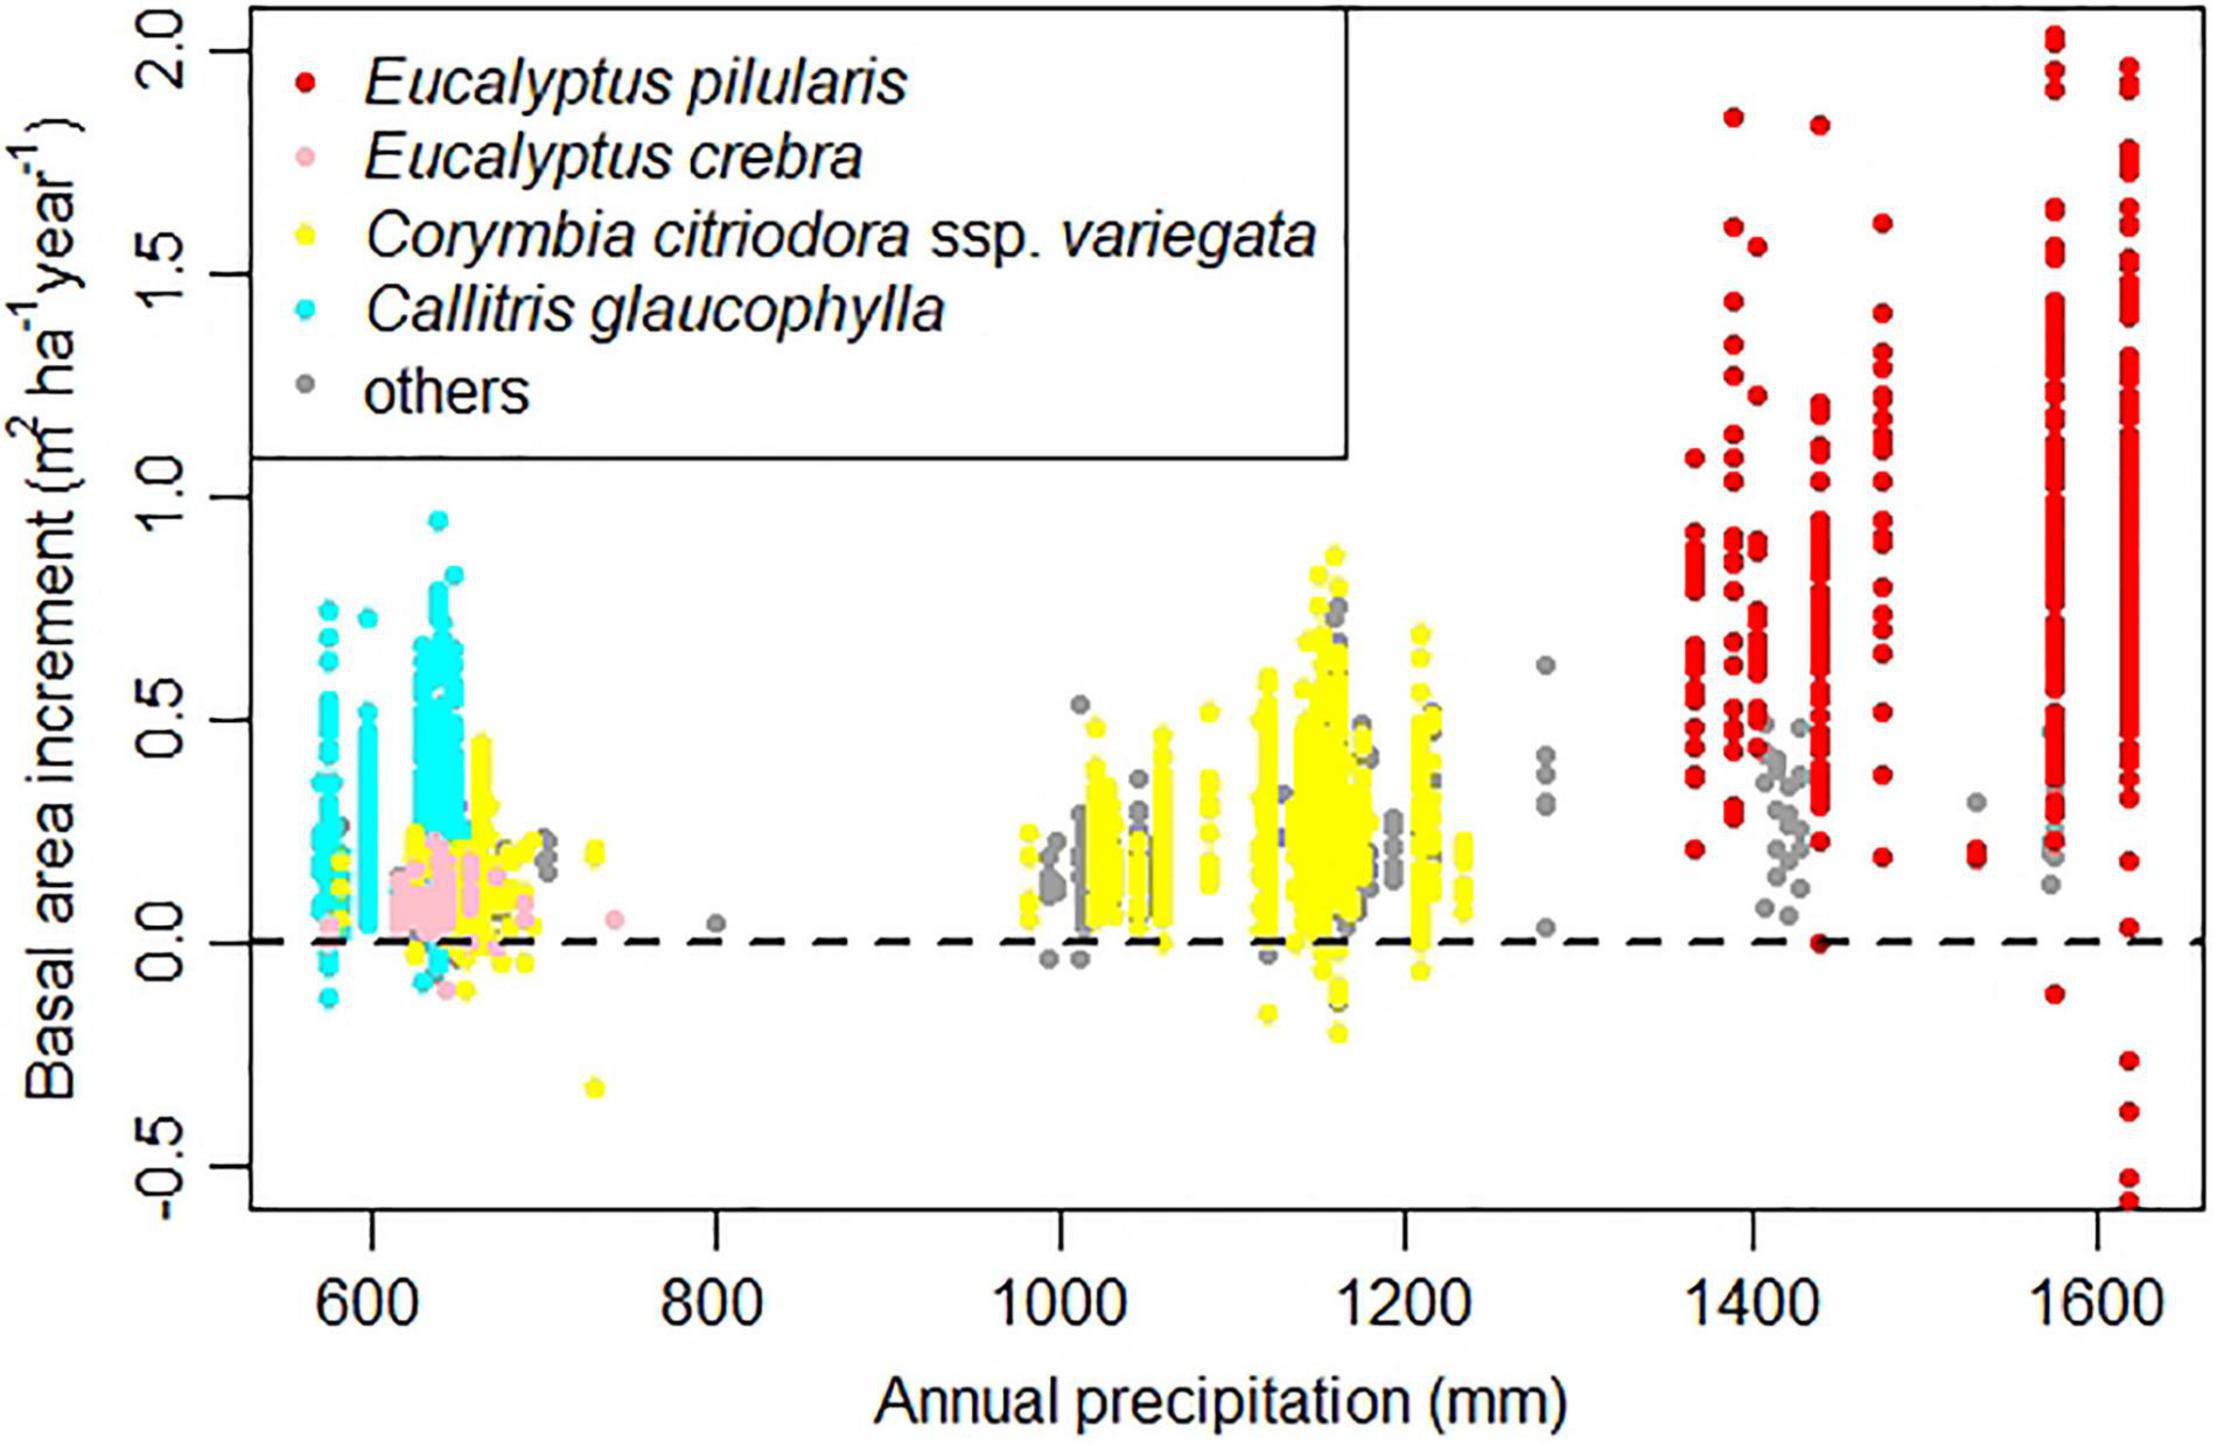
Figure 2. Basal area increment vs. annual precipitation (Fick and Hijmans, 2017). We highlight four target species.
Fifty-five plots recorded negative BAI (Figure 2); mostly associated with drought years between 1979 and 1983 (the Eastern Australian drought or “great Australian drought,” associated with a strong El Niño event, Gibbs, 1984; Allan et al., 1991).
Density-Tree Size Relationships and Self-Thinning
Stocking of unmanaged plots was clearly affected by self-thinning (Figure 3). Increases in tree size (based on quadratic mean diameter, Eq. 1) were accompanied by strong reductions in stem density. All variants of self-thinning models (STReineke, STBA, STvariable) showed similar results. The slope of the self-thinning line (–1.662) of E. pilularis was similar to Reineke’s SDI. Self-thinning was thus weakest (density declined more slowly with increasing diameter) in E. pilularis among our four target species (Figure 3A). Stronger self-thinning was observed in plots in drier areas (cf. Figure 2; slope for Callitris glaucophylla –2.021; slope for C. citriodora ssp. variegata –2.253). Moderate self-thinning in plots dominated by E. crebra (slope –1.795) is conditional of fewer observations for this species (Figure 3D). While many managed Callitris glaucophylla plots have already reached the self-thinning line (potential stocking), managed E. pilularis plots are still below potential stocking (Figures 3A,C).
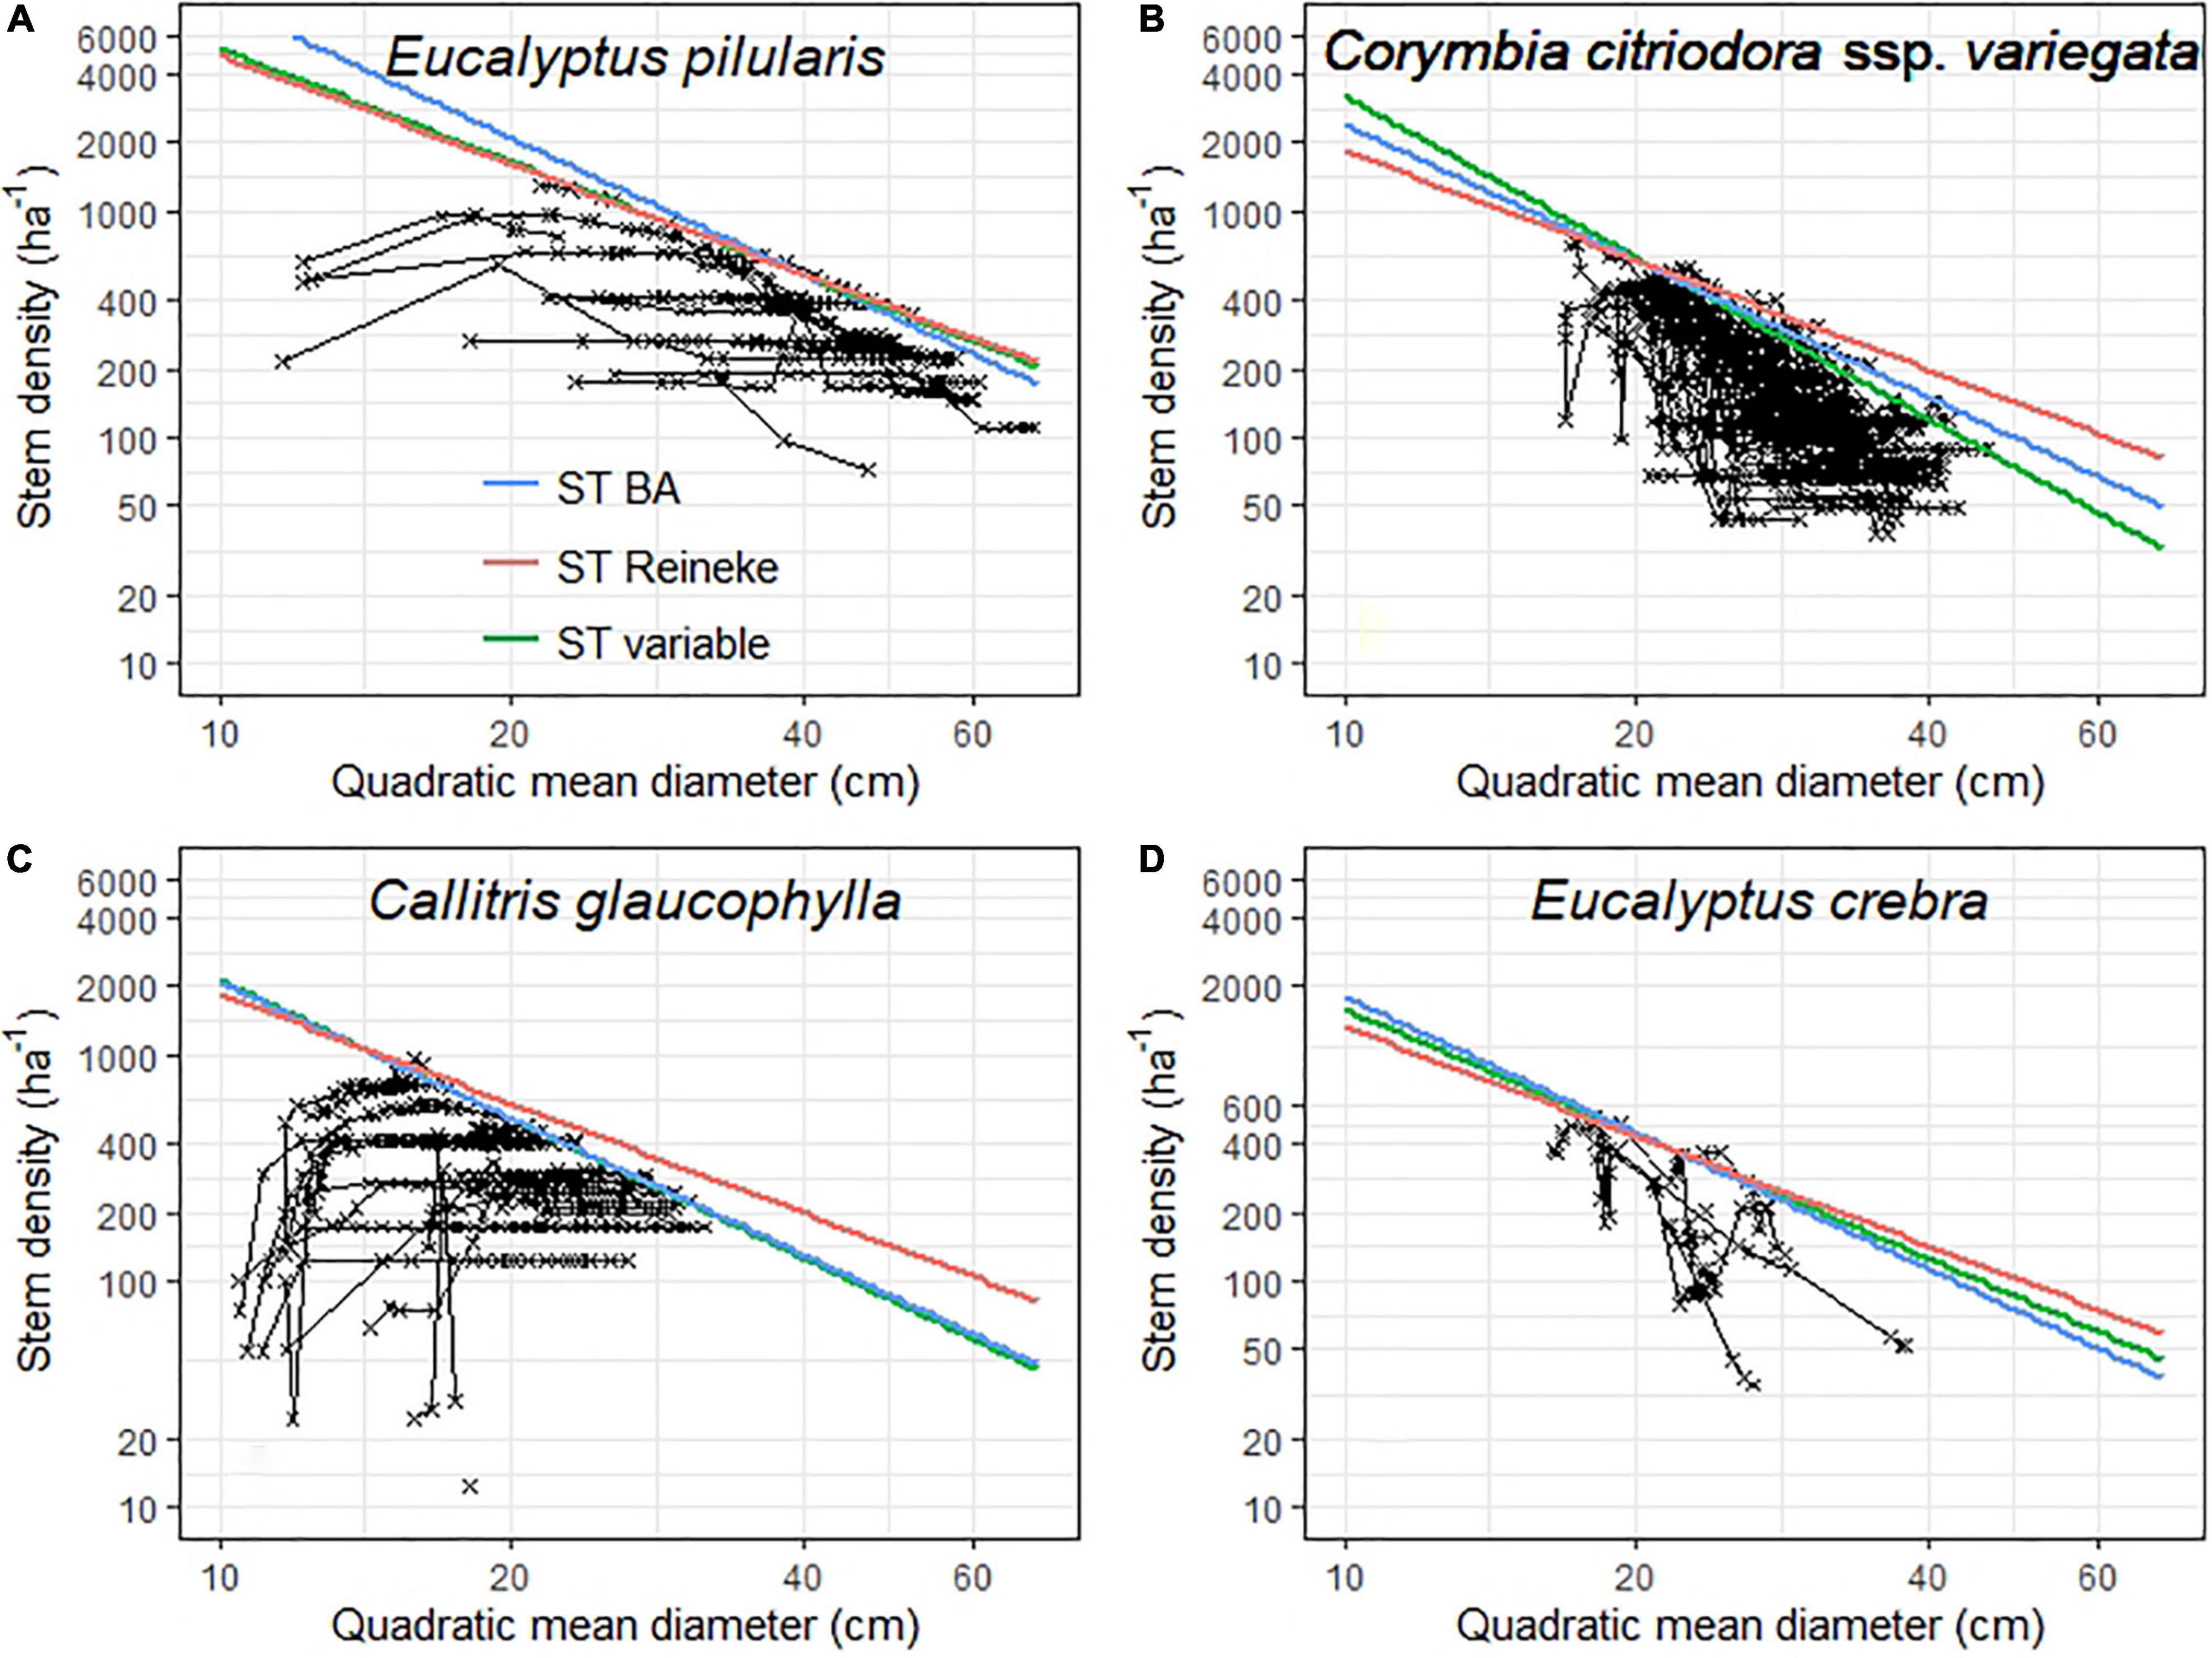
Figure 3. Self-thinning lines for the four main tree species (A for Eucalyptus pilularis; B for Corymbia citriodora ssp. variegata; C for Callitris glaucophylla; D for Eucalyptus crebra) and unmanaged conditions. In each case, stem density is plotted as a function of tree size, where size was determined as the quadratic mean tree diameter (Eq. 3). Repeatedly measured plots are connected with line segments. We show two theoretically based self-thinning lines. (1) blue lines have a fixed slope of –2.000 (i.e., based on basal area), (2) red lines are a generalized model with slope of –1.605 (based on Reineke, 1933). A third line is shown in green and is derived from quantile regression for each study species. Slopes of the species self-thinning lines were: E. pilularis –1.662; C. citriodora –2.366, Callitris glaucophylla –2.042, E. crebra –1.832). In panel C, the blue and green lines overlap.
Basal area (BA) provides a good index of maximum stocking, taking into account self-thinning (see Figure 3). As with BAI (Figure 2), P95 BA also varied by species. P95 BA was 56.3 m2 ha–1 for E. pilularis, 19.0 m2 ha–1 for C. citriodora, 16.8 m2 ha–1 for Callitris glaucophylla and 14.5 m2 ha–1 for E. crebra.
Forest Management Effects on Stand Structure, Increment, and Recruitment
In Figures 4–6, we contrast first and last measurements of repeatedly measured sample plots (n = 305, with a measurement period of at least 10 years). There were 10 plots without remeasurements. Initially, stem density was greater (p < 0.001) in managed plots (n = 130) than unmanaged plots (n = 175), but there was no difference in basal area (Figures 4A,C). After an average interval of four decades (min. 10, max. 79 years), stem density had clearly declined in E. pilularis plots, but was constant or had increased in plots dominated by other species (Supplementary Figures 2–5). At the time of last measurements, basal area of unmanaged plots was greater than that of managed plots (p = 0.032; Figure 4B). Stem densities were not statistically different between managed and unmanaged plots (Figure 4D). E. pilularis and Callitris glaucophylla were major contributors to this pattern (Supplementary Figures 4, 6) as the two other species showed no differences in basal area or stem density (Supplementary Figures 5, 7).
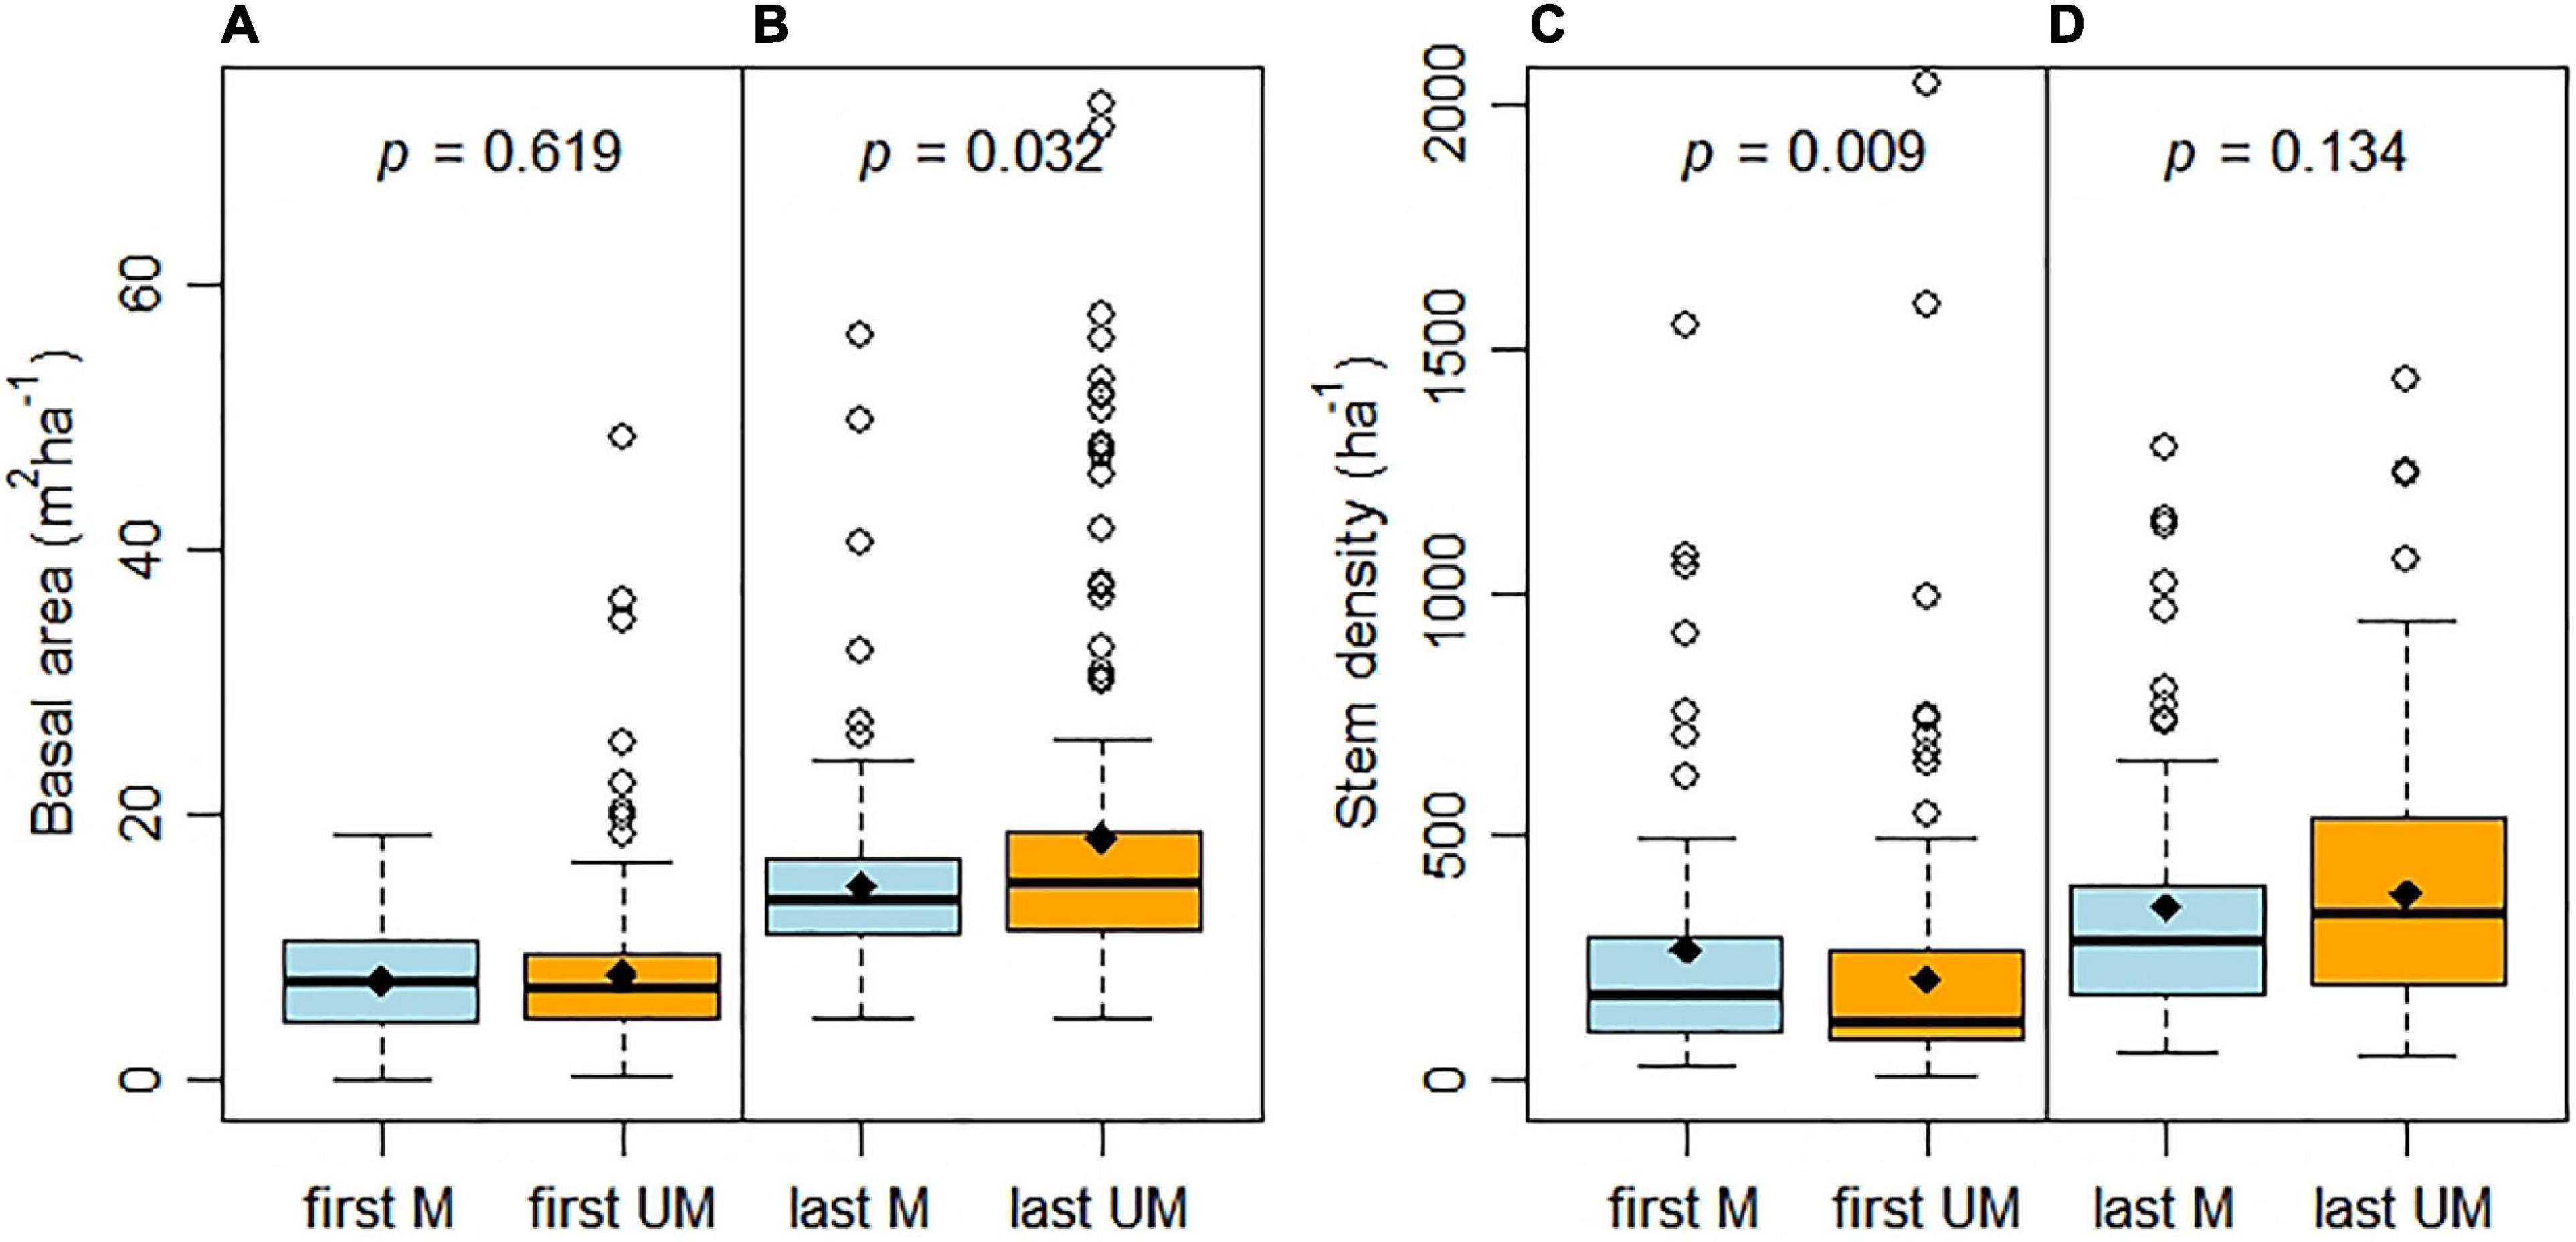
Figure 4. Basal area (A,B) and stem density (C,D) at first and last measurements for managed (M) and unmanaged (UM) plots. Observation numbers were the same, n = 130 (M) and n = 175 (UM) in each case. At least one tree was harvested between first and last measurement in managed plots. We only used plots where measurement periods were 10 years or longer (mean 40 years; min–max 10–79 years). p-values of covariance analysis are based on Kruskal-Wallis tests. Boxes represent the median and the 25th and 75th quantile. Diamonds indicate arithmetic means, while whiskers extend to 1.5 of the interquartile range, values outside this range are indicated by circles.
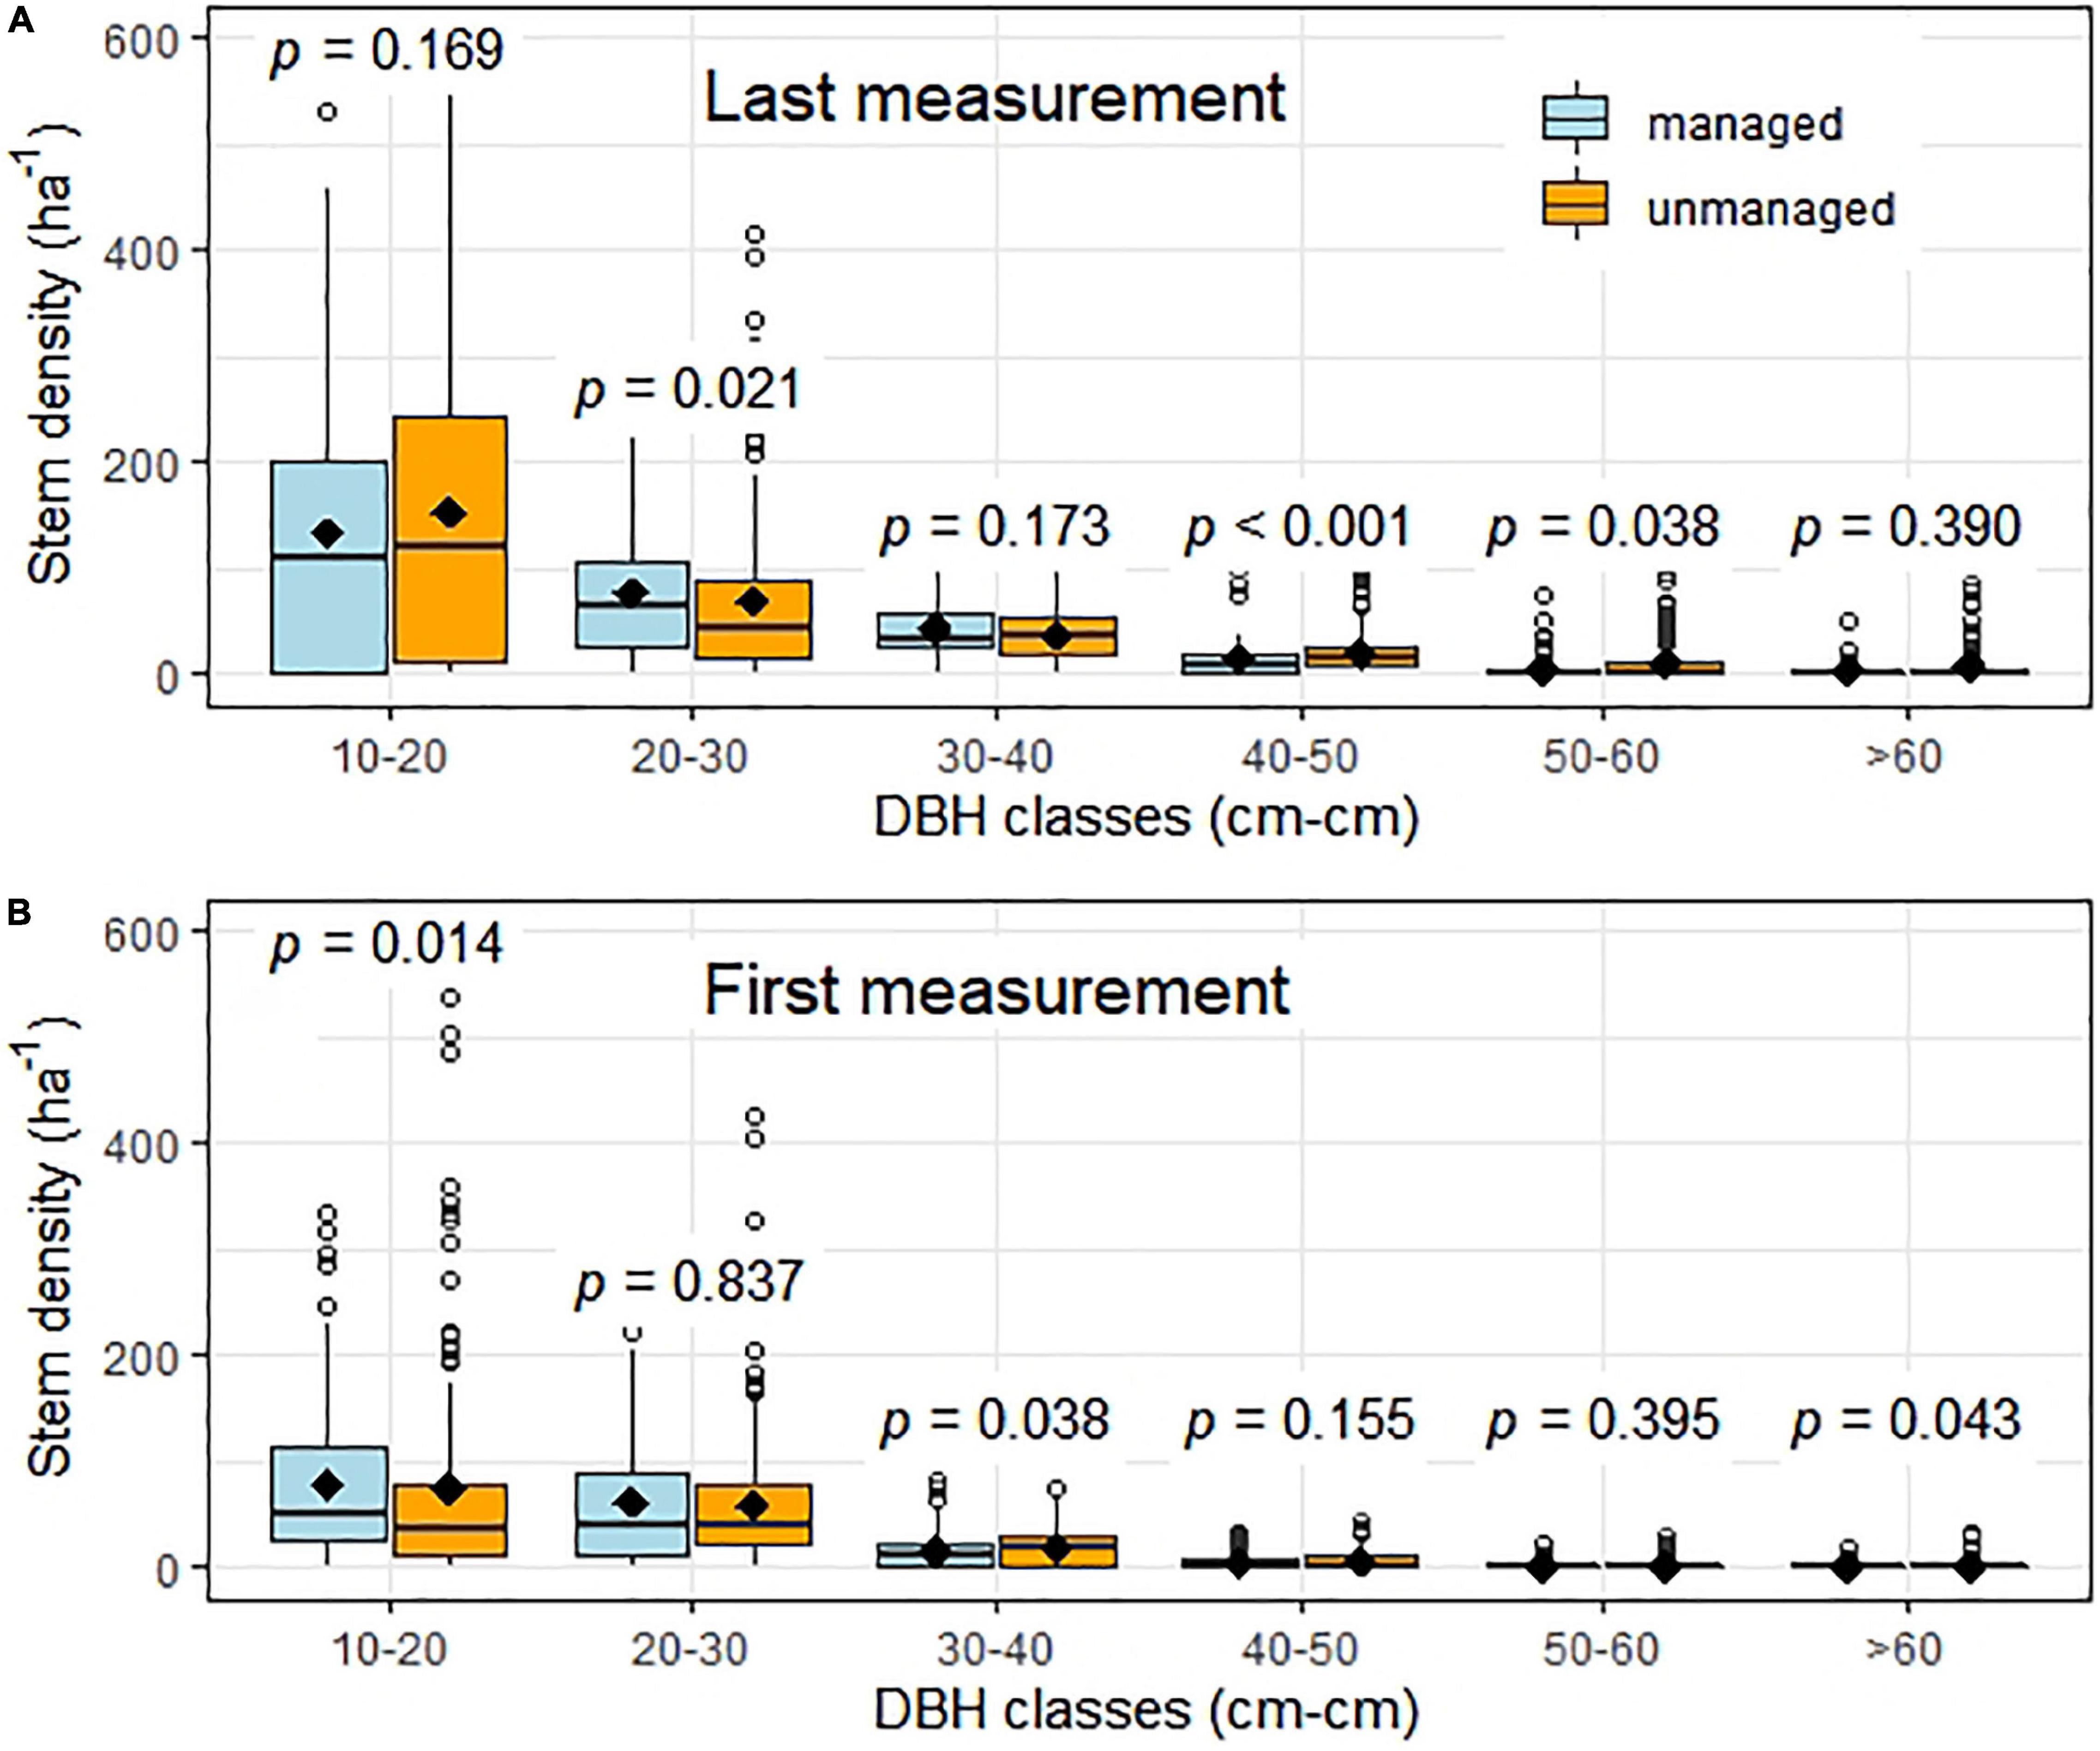
Figure 5. Stem density distribution using 10 cm classes of diameter at breast height (DBH) for managed (left) and unmanaged plots (right). In panel (A), we show results for the last measurement and in (B) for the first measurement. For details on boxplots see caption of Figure 4.
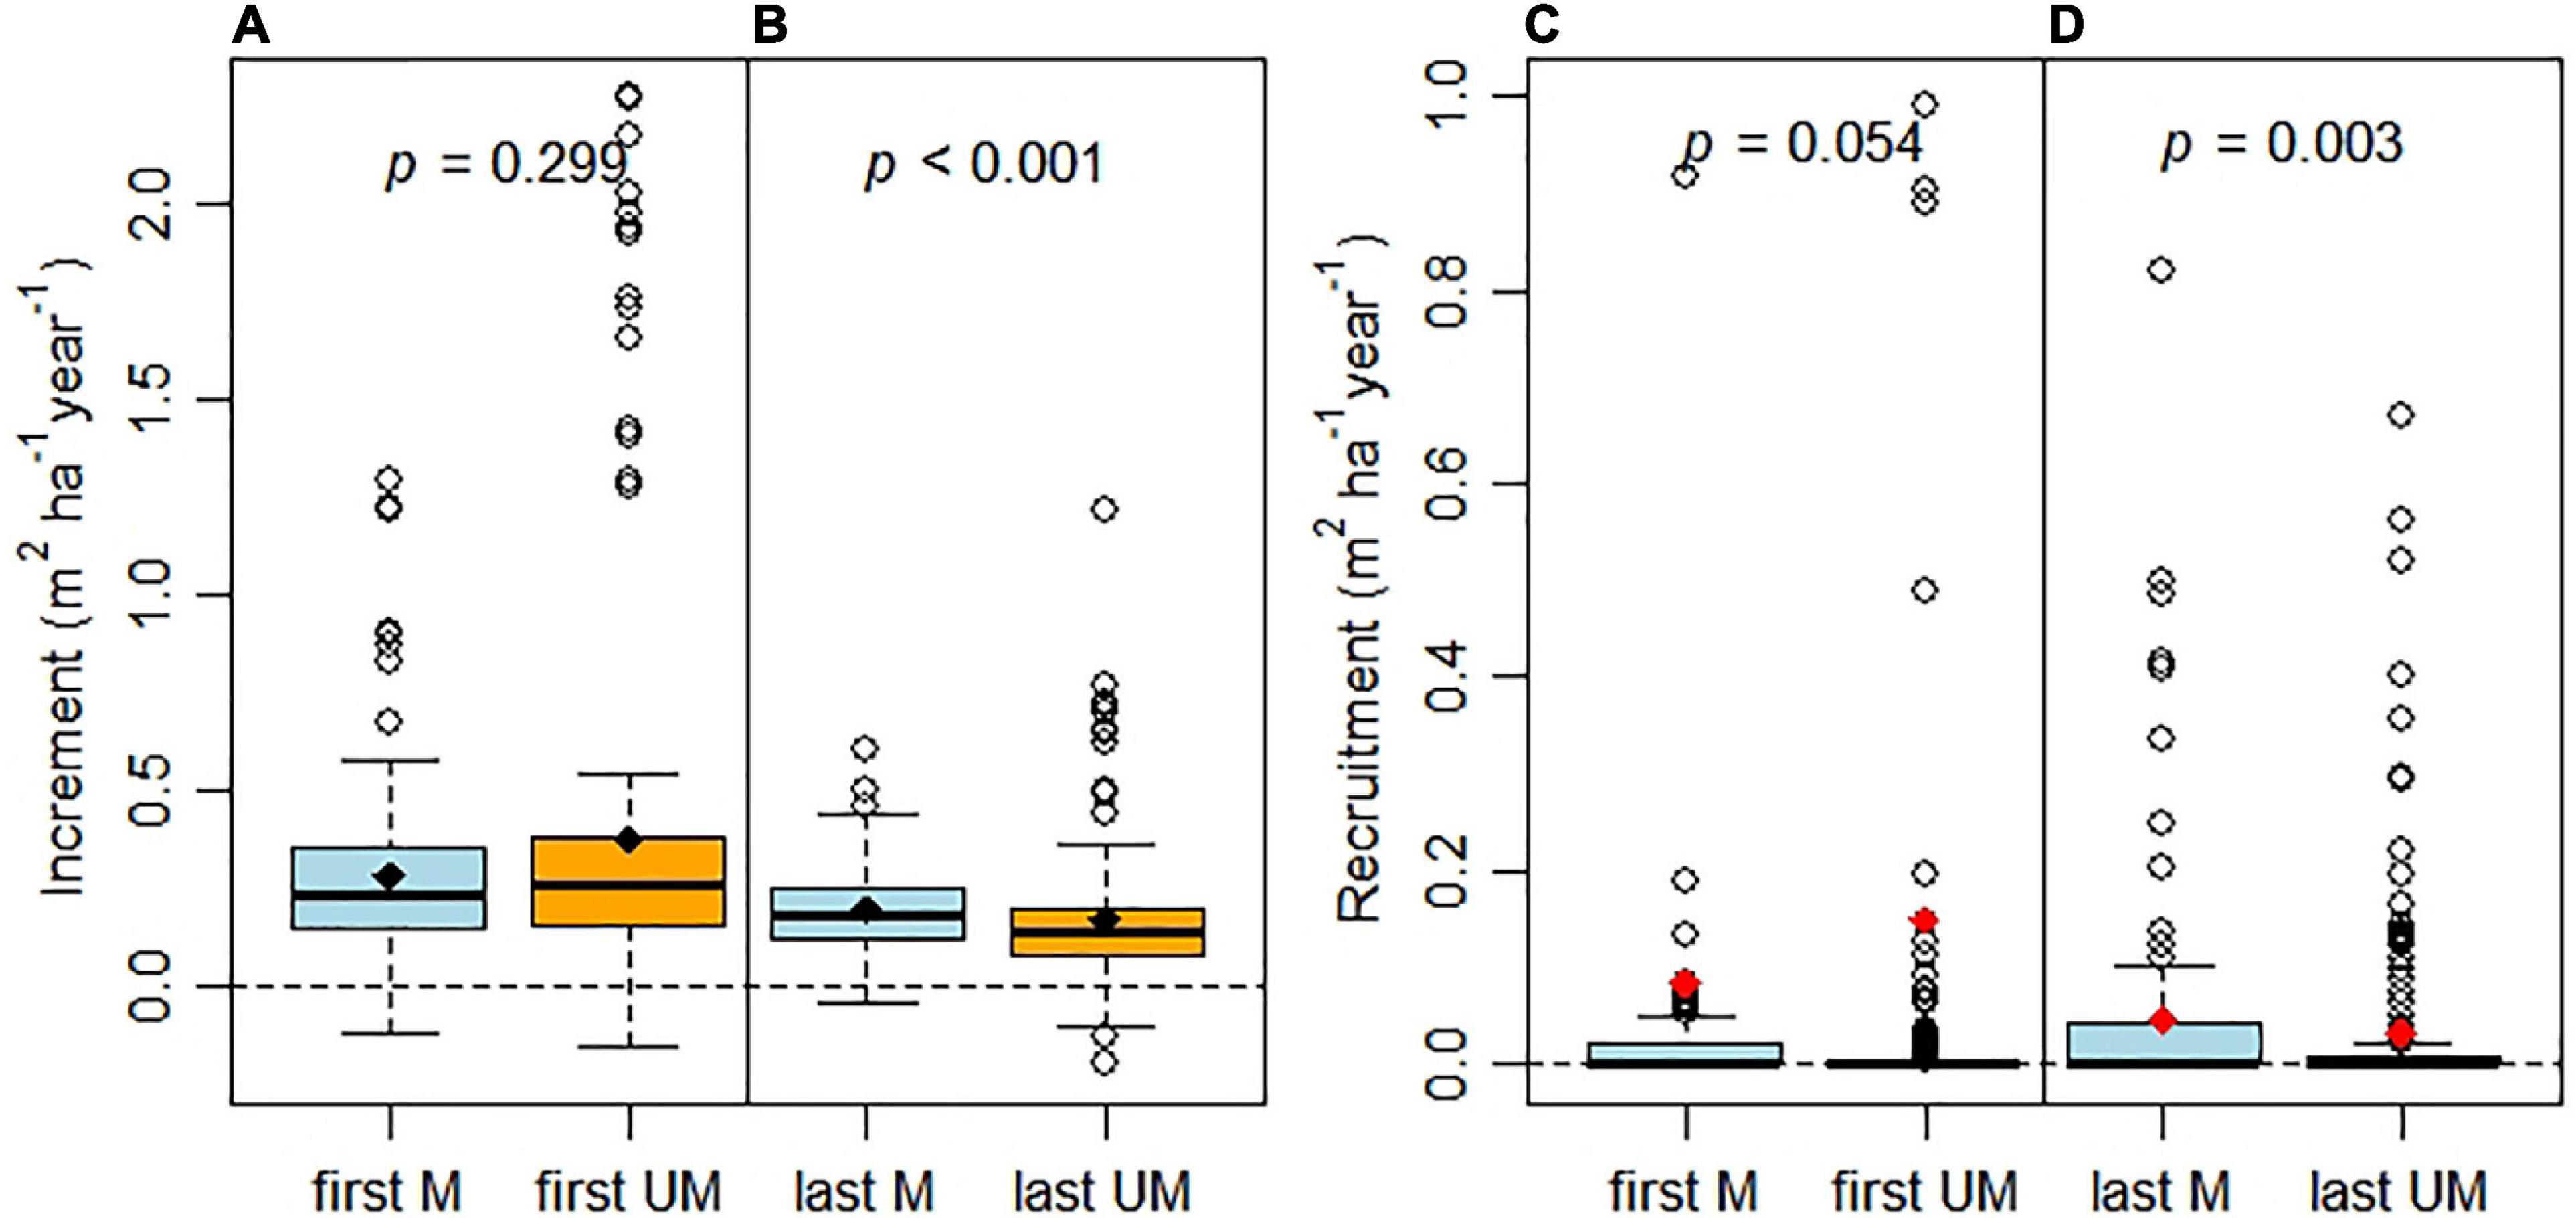
Figure 6. Basal area increment (A,B) and recruitment (C,D) at the time of first and last measurements for managed (M) and unmanaged (UM) plots. For details see Figure 4. In (C,D), we used red dots to highlight the means.
DBH distributions varied markedly between the first and last measurements. There were significant differences between managed and unmanaged plots (Figure 5) albeit data were heavily skewed. The skewness at the last measurement was greater for the unmanaged plots (1.225 vs. 0.839 for managed plots), while initially greater in managed plots (0.657 unmanaged vs. 0.722 managed). Initial significant differences in stem densities (10–20 cm, 30–40 cm, > 60 cm DBH) between managed and unmanaged plots (p < 0.05, Figure 5B) were not sustained to the last measurement (Figure 5A). At the last measurement, only the 40–50 cm DBH class showed statistically greater stem density (p < 0.001) in unmanaged plots. A similar trend (although less significant) was evident for the 50–60 cm DBH class. These results suggest that early stand structure is more important than management for determining long-term density of large trees. The density of larger trees (> 60 cm DBH) increased between the first and last measurements for all plots (Figure 5). Hence, our first hypothesis, that the density of larger trees would be reduced in harvested stands, was not supported.
Figure 4 shows change in basal area of stands that increase due to growth and recruitment and decrease due to mortality or harvesting. BAIs (i.e., growth rate of repeatedly measured trees) were significantly smaller in unmanaged plots than managed plots at the last measurement (p < 0.001; Figure 6B). Negative BAIs were observed in some plots (Figures 6A,B). While there was evidence of greater recruitment in managed plots—in particular at the last measurement—the data were highly skewed and differences between managed and unmanaged plots were not highly significant with p = 0.003 (Figure 6D). BAIs at the last measurement were considerably less than those recorded initially, irrespective whether plots were managed or unmanaged. Our results supported our second hypothesis, that management increased recruitment. Our third hypothesis (i.e., management reduced increment) was not supported by the results of our study. We note the importance of initial stand conditions. As differences in BAI and recruitment were less pronounced at the initial measurement relative to the last measurement (based on levels of significance), we conclude that management had (unexpected) effects on stand structure and dynamics.
DBH distributions in Queensland forests were increasingly skewed over the study period. Recruitment increased the density of trees < 20 cm DBH. Management, most likely through thinning, result in more evenly distributed tree sizes from 10 to +60 cm DBH and reduced the skewing of density (skewness for managed plots = 0.839, skewness for unmanaged plots = 1.225; see Figure 7). Fifty years without active management resulted in changes in distribution of tree size (Figure 7B).
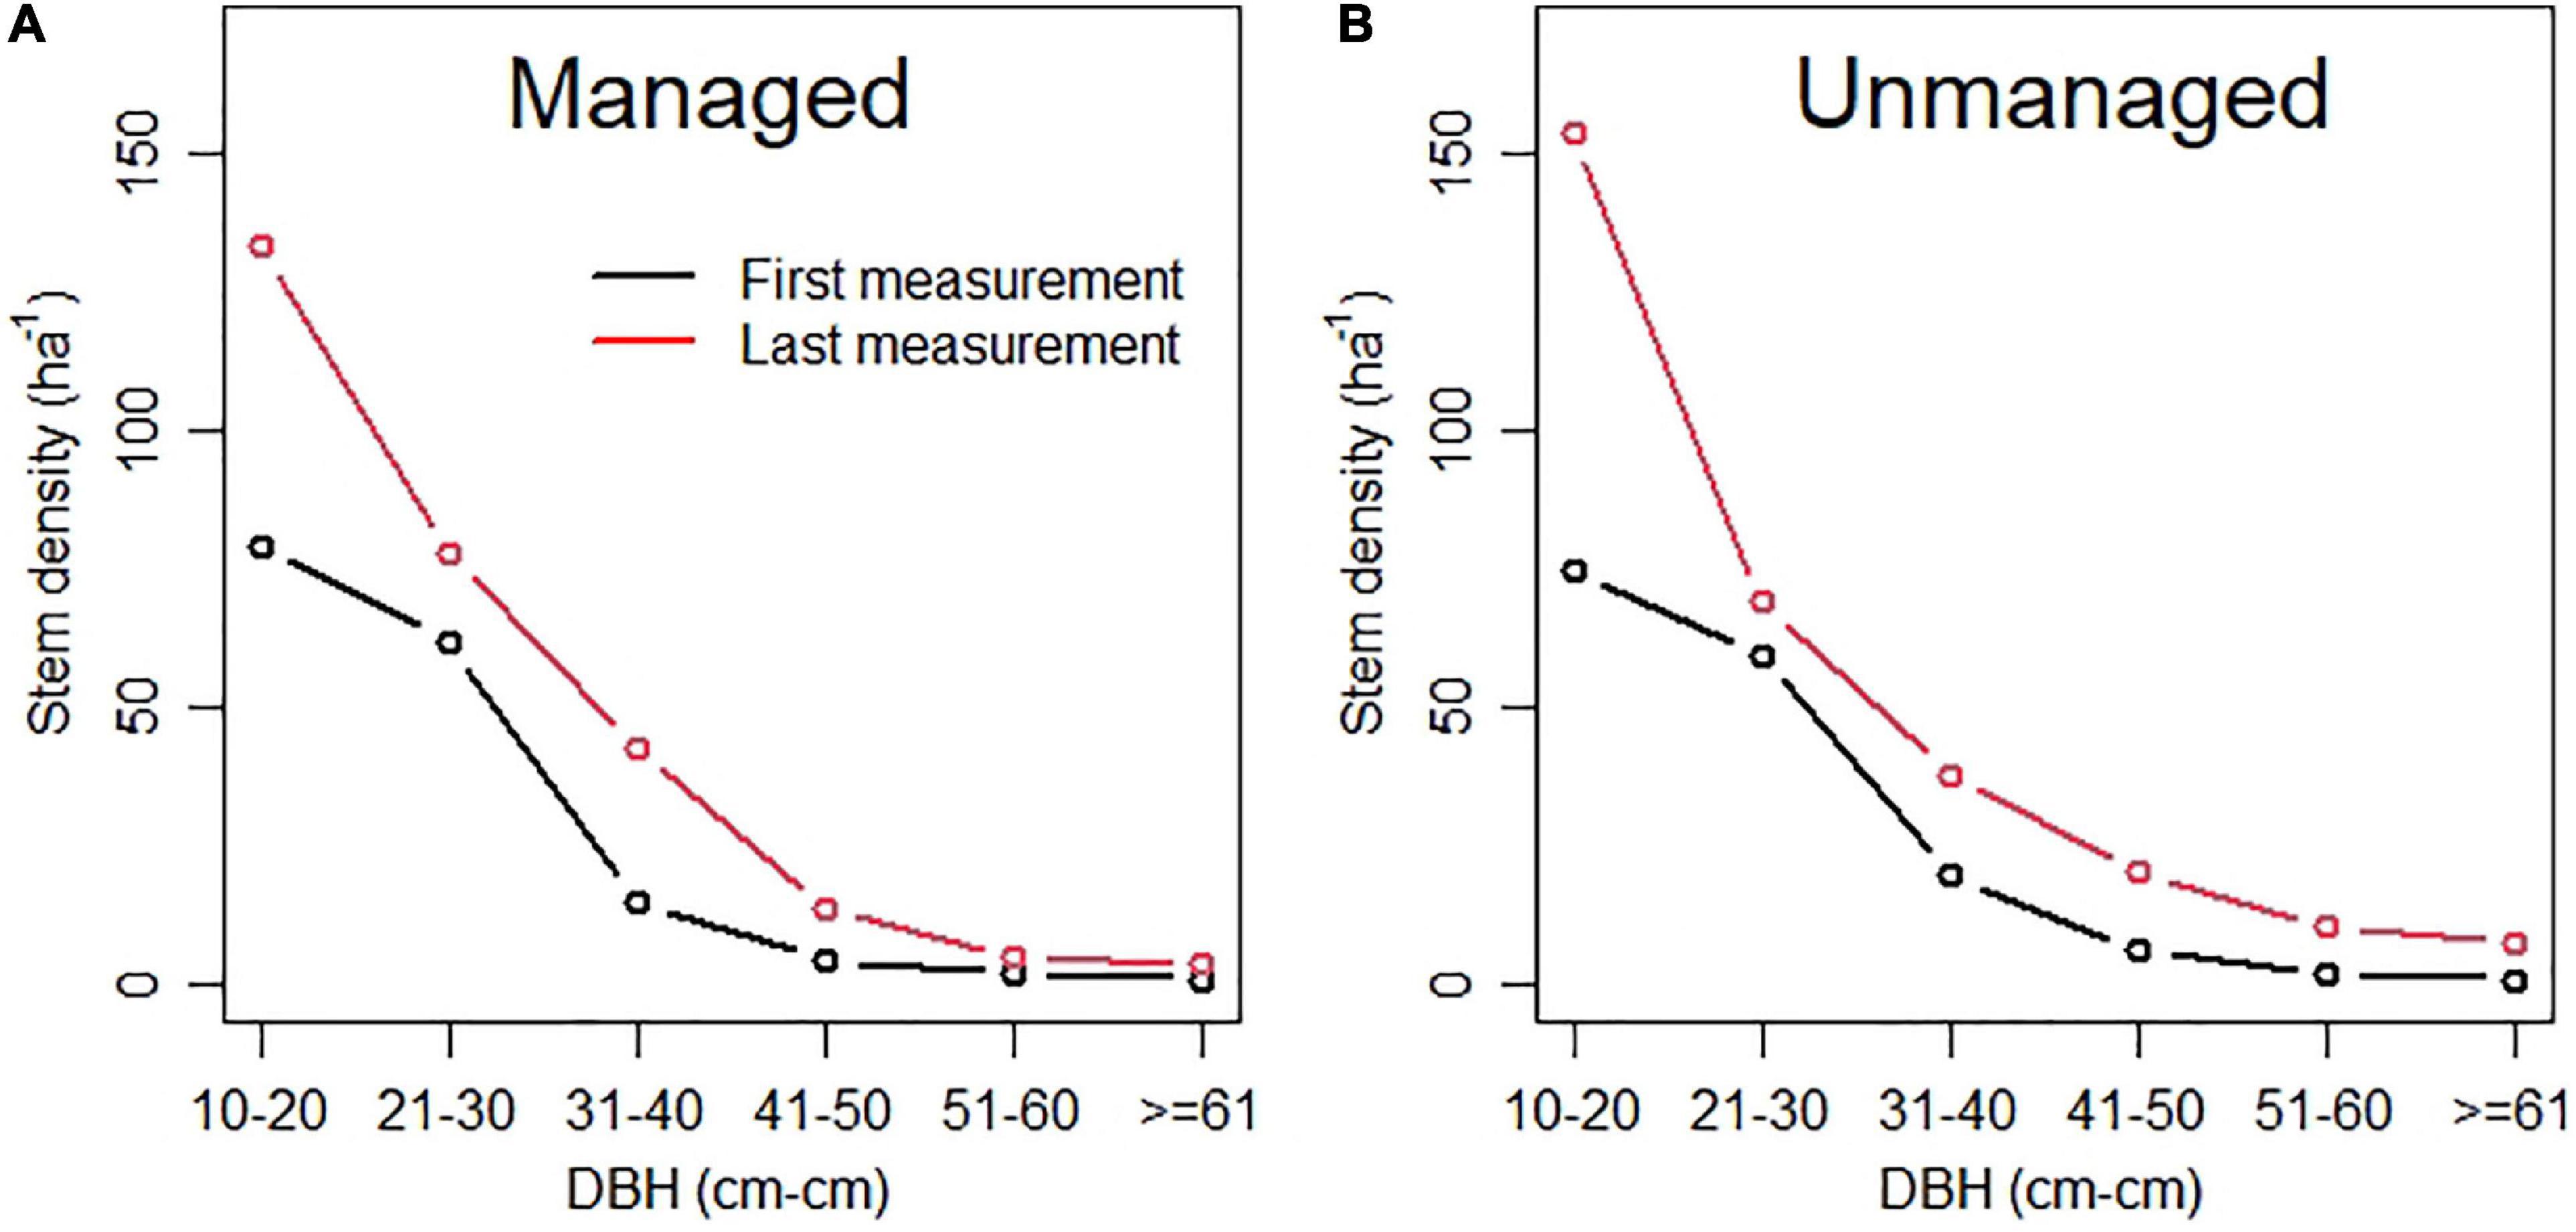
Figure 7. Diameter distribution of managed (A) and unmanaged (B) plots. The lower black line shows the conditions at first measurement, the upper red line at the last measurements about five decades later.
Mortality and Harvesting
Assessed across all measurements, BAIs in managed plots (0.294 m2 ha–1 year–1) were on average less than those of unmanaged plots (0.333 m2 ha–1 year–1, Table 2). This pattern matches the analysis of first measurements (Figure 6A), but is contrary to that based on last measurements (Figure 6B). Existing trees (BAI) contributed at least an order of magnitude more to BA than recruitment (i.e., > 90% of basal area gains were due to growth of existing trees). Managed stands lost significantly more BA than unmanaged stands (p < 0.001) with harvesting accounting for 74% of the total loss (Table 2). There was a positive net change in basal area (gains due to increment and recruitment exceeded losses due to mortality and harvesting, Table 2) irrespective of whether forests were managed or unmanaged. Increases in BA were almost twice as great for unmanaged compared to managed forests (p < 0.001), largely due to harvesting removals in the latter. In turn, the rate at which unmanaged forests approached potential stocking (see self-thinning lines in Figure 3), was twice as fast as that of managed counterparts.
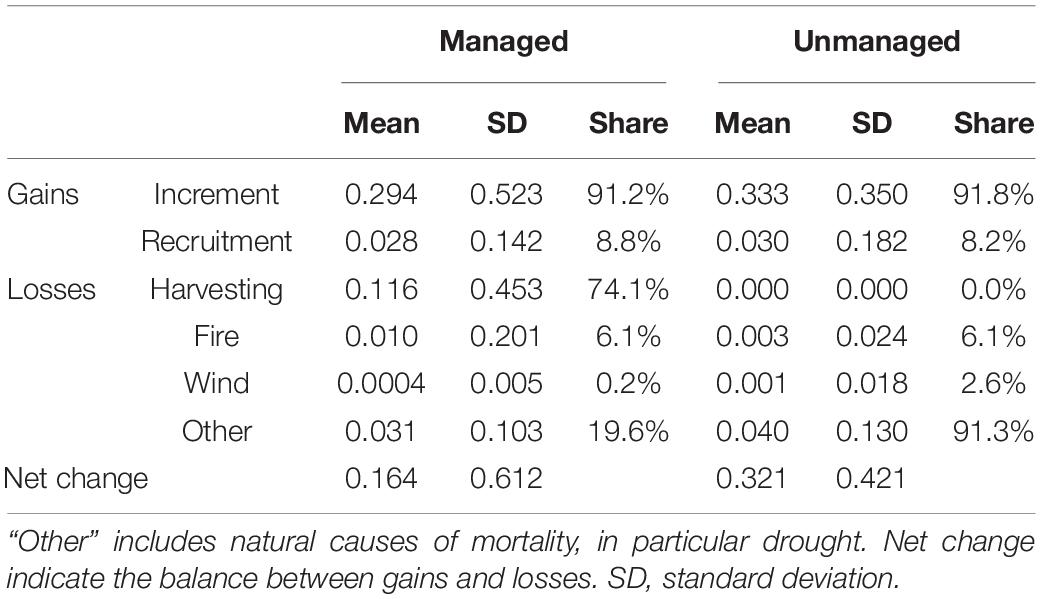
Table 2. Gains (increment, recruitment) and losses (harvesting, mortality) in basal area (m2 ha–1 year–1).
Discussion
There are many studies on the impact of harvesting on stand structure, but few have observations on unmanaged sites exceeding 10–20 sites (e.g., eight unmanaged plots used in Neuendorff et al., 2007). In this study, more than 170 plots were unmanaged with about 1,800 observations, in total.
Negative exponential shapes (for definitions see, Janowiak et al., 2008) typify current diameter distributions of both managed and unmanaged forests studied here. This distribution feature was not visible, when the plots were first measured (Figure 7). We note that such start-end comparisons may not capture long-term dynamics or events outside the measurement period. For instance, severe decline in rabbit populations due to Myxomatosis, an insect-born poxvirus, introduced in Australia in 1950, facilitated large-scale regeneration and recruitment of Callitris (Gibbons et al., 2010; Whipp et al., 2012).
Productivity in Context
Native forests dominated by Eucalyptus and Callitris are limited to Australia. BAIs recorded here are mostly small by comparison with other Australian forests and forests elsewhere. Eucalyptus pilularis grew most quickly with an average BAI of 0.84 m2 ha–1 year–1. This species is often dominant where precipitation is at least 1,400 mm per year. Average BAI for 3–7 year old regrowth of Eucalyptus regnans in Victoria was 4.8 m2 ha–1 year–1 (Attiwill, 1992). BAI for Eucalyptus obliqua in Victoria was recorded (Attiwill, 1979) as 1 m2 ha–1 year–1, while that for E. fastigata in New South Wales was 1.14 m2 ha–1 year–1 (Bi, 1994). Coastal mixed eucalypt forests in New South Wales (mean BAI 0.27 m2 ha–1 year–1; Curtin, 1970) and coastal spotted gum (Corymbia maculata, mean BAI 0.11–0.54 m2 ha–1 year–1; Bauhus et al., 2002) show similar rates of growth to the forests studied here. Within Queensland, BAIs of dry sclerophyll spotted gum-ironbark (Corymbia citriodora—Eucalyptus siderophloia) forest ranged from 0.22 to 0.34 m2 ha–1 year–1 (Grimes and Pegg, 1979). Higher temperatures largely account for reduced rates of growth in Queensland compared to more southern states of Australia. Average annual temperatures for study plots are mostly greater than 16°C (average 19.7°C) and growth increments generally reduce sharply once average temperatures exceed 15°C (Prior et al., 2011). Internationally, there are limited published examples of native forests that accumulate basal area at similar (slow) rates to those reported here. Native Prosopis forests in Texas and Argentina (Felker and Guevara, 2003) and the miombo woodlands of sub-Saharan Africa (Pelletier et al., 2018; Chidumayo, 2019) share some similarities.
BAIs also varied with precipitation (Figure 2, Eq. 5). Callitris glaucophylla—a native conifer—showed much faster rates of growth (0.23 m2 ha–1 year–1) than E. crebra (0.09 m2 ha–1 year–1) at intermediate rainfall (600–650 mm, Figure 2). Callitris glaucophylla is often dominant on deep sandy soils (Horne and Robinson, 1987; Whipp et al., 2012) and the closely related species Callitris columellaris has been shown to more effectively reduce transpiration during drought than sympatric eucalypts (E. microcarpa) (Attiwill and Clayton-Greene, 1984). Ability of drought-resistant C. glaucophylla (Prior et al., 2012) to “conserve” water and maintain foliage in drought periods (in contrast to eucalypts shedding their leaves) may underpin its relatively faster overall rates of growth.
Self-Thinning in Sub-Tropical Forests
Natural thinning (“self-thinning”) in the absence of disturbances is a widely acknowledged feature of forests as shown in numerous studies (Sterba and Monserud, 1993; Bi et al., 2000; Berger et al., 2004; Trouvé et al., 2017). Self-thinning limits maximum stocking. Such limits also feature in deliberations of critical species abundance and carbon uptake by vegetation (Wilson and Puettmann, 2007; Finkral and Evans, 2008; Verschuyl et al., 2011; Blakey et al., 2016).
While Trouvé et al. (2017) studied self-thinning in temperate Australian forests, ours is among the first studies for sub-tropical forests (see Vanclay and Sands, 2009). We also found clear species differences in slopes of self-thinning lines. For temperate forests, slopes range from –1.90 to –1.52 (Trouvé et al., 2017). The range recorded here for sub-tropical forests is greater (–2.336 to –1.662), likely due to a greater range in rainfall (Figure 2). E. pilularis growing in high-rainfall coastal regions shows similar self-thinning to Victorian eucalypt forests (slope of –1.662; c.f. Trouvé et al., 2017) and to temperate coniferous and broadleaved forests in Europe and North America (Reineke, 1933; Monserud et al., 2004; Pretzsch and Mette, 2008). While reductions in increment and basal area with rainfall are expected, the increasing slope of self-thinning lines are less well appreciated (Figures 2, 3). The steepest slope we recorded was –2.253 for C. citriodora ssp. variegata growing in open forests and woodlands. Absent from our data are unmanaged plots with large diameters for C. citriodora ssp. variegata, that if present may have changed the slope of the self-thinning line. Basal area (slope = –2.000) is arguably a better metric for delineating species “boundary curves” than Reineke’ SDI (slope = –1.605) for C. citriodora ssp. variegata. Reineke used a hand-drawn line, while MacKinney and Chaiken (1935) using the same data and statistical methods, determined a slope of –1.707. Further analysis and more data for forests with rainfall between 1,200 and 1,400 mm (see Figure 2) are needed to confirm that self-thinning slopes in drier Australian forests show consistent differences with forests elsewhere. We note that basal area is a potent and simple to measure index for self-thinning, using Bitterlich sampling (“sampling by diameter” or “angle count sampling,” Eastaugh and Hasenauer, 2013).
Impacts of Past Management on Stand Structure and Habitat Value
Our study showed that unmanaged stands have higher overall stem densities than managed plots, particularly where DBH was < 20 cm and > 40 cm (Figures 4, 5, 7). Density of trees with DBH 20–40 cm increased more on managed plots. These differences are likely due to thinning prior to ∼1980 in State Forests (Norman et al., 2004), removing mostly trees < 20 cm DBH. The large increase in stem density of the 10–20 cm DBH class in unmanaged plots has to be viewed considering the combined effects of abandoning silvicultural thinning as common management practice and changes in policy from 1999. Prior to 1999 trees >60 cm DBH were selectively harvested (Norman et al., 2004). The 1999 South-East Queensland Forest Agreement extended harvesting to trees > 40 cm DBH. This would have presumably promoted recruitment of trees < 20 cm DBH (Henry and Florence, 1966). Data reported here show recruitment was greater in managed plots relative to unmanaged plots (Figures 6C,D) and this is supported by studies of other forest ecosystems (Espelta et al., 1995; Albrecht and McCarthy, 2006; Ouédraogo et al., 2011; Seiwa et al., 2012; Hu et al., 2020). We add a note of caution in that recruitment data are skewed.
Increasing density of trees < 20 cm DBH will likely result in dense stands, slow growth and increased mortality of individual trees (Vanclay, 1988; Bauhus et al., 2002; Lewis, 2020). Selective thinning of small to middle sized trees, can reduce competition and hence promote growth of larger trees that may grow to become important habitat trees (e.g., Jones et al., 2015; Lewis et al., 2020; Bhandari et al., 2021). The presence of large and tall habitat trees and diverse canopy cover are particularly important for native forest management (Franklin et al., 2000; Norman et al., 2004; Bollmann et al., 2005; North et al., 2017) with implications for timber and habitat value (Wormington et al., 2002; Norman et al., 2004). In Queensland, arboreal mammals have been the focus for determining the minimum number of habitat trees in relevant “Codes of Practice” (Department of National Parks Recreation Sports and Racing, 2014; Queensland Parks and Wildlife Service, 2020). Suggested lower limits for arboreal mammals in Queensland are four hollow-bearing trees ha–1 (Wormington et al., 2002). The presence of hollow-bearing trees was not assessed on the plots used here. Wormington and Lamb, 1999) reported that tree hollows become frequent in trees with a DBH greater 60 cm, depending on species. In this study, density of trees > 60 cm DBH was 7.8 ha–1 for unmanaged plots and 3.6 ha–1 for managed plots, on average (Figure 7). Both managed and unmanaged plots had similar initial densities of 1.0 ha–1. Thus, although we rejected our hypothesis that harvesting reduced density of potential habitat trees, we note that there was a trend of increased density of these trees in unmanaged plots.
Unmanaged plots exhibited a large net increase in basal area (+0.321 m2 ha–1 year–1) over five decades. This suggests that these plots were previously managed or disturbed and were certainly not in equilibrium (i.e., growth and recruitment balanced by mortality) during the study period. This underpins the importance of self-thinning lines (at least as rough guides) to quantify deviations from the maximum stocking.
Conclusion
Long-term monitoring data reveal that selectively harvested forests are resilient to harvesting compared to unmanaged forests, when assessed via growth increments, recruitment and stand structure. Sub-tropical forests of southern Queensland can be delineated by species boundary lines and are—like most forest ecosystems—subject to self-thinning. Maximum basal area decreases with rainfall from 66 m2 ha–1 in Eucalyptus pilularis, 20 m2 ha–1 in Corymbia citriodora ssp. variegata, to 17 m2 ha–1 in Callitris glaucophylla, and 14 m2 ha–1 in Eucalyptus crebra. Many unmanaged forests are still below these limits. The speed at which southern Queensland forests approach their potential stocking likewise varies by species (from 0.84 m2 ha–1 year–1 for E. pilularis, 0.23 m2 ha–1 year–1 for C. citriodora ssp. variegata, 0.23 m2 ha–1 year–1 for Callitris glaucophylla to 0.09 m2 ha–1 year–1 in E. crebra) associated with distinct rainfall zones. Until now, net changes in basal area (the balance of gains and losses) were positive, irrespective of harvesting and/or thinning, but were twice as great in unmanaged forests. Harvesting had no negative effect on tree recruitment or on the density of trees with a DBH ≥ 60 cm and both managed and unmanaged forests reached the recommended threshold for habitat trees. Unmanaged forests were notably denser based on DBH distribution, basal area and stem density with likely implications for the habitat they provide (or lack thereof) for various biodiversity components.
Data Availability Statement
The raw data supporting the conclusions of this article will be made available by the authors, without undue reservation.
Author Contributions
MN: funding acquisition, conceptualization, methodology, formal analysis, and writing—original draft. MAA: methodology, supervision, writing—review, and editing. TL: data curation, field measurements, methodology, supervision, writing—review and editing. All authors contributed to the article and approved the submitted version.
Funding
This work on this study was partly funded by the Austrian Science Fund (FWF) (Grant No. J4211-N29 (MN), and by an anonymous benefactor.
Conflict of Interest
The authors declare that the research was conducted in the absence of any commercial or financial relationships that could be construed as a potential conflict of interest.
Publisher’s Note
All claims expressed in this article are solely those of the authors and do not necessarily represent those of their affiliated organizations, or those of the publisher, the editors and the reviewers. Any product that may be evaluated in this article, or claim that may be made by its manufacturer, is not guaranteed or endorsed by the publisher.
Acknowledgments
This analysis would have been impossible without the foresight and hard work of colleagues whom established and maintained the monitoring plots we utilize here. We appreciate feedback from reviewers and editors that improved the manuscript. We are grateful for comments by Kerrie Catchpoole on an earlier version of the manuscript.
Supplementary Material
The Supplementary Material for this article can be found online at: https://www.frontiersin.org/articles/10.3389/ffgc.2021.750350/full#supplementary-material
References
Adams, M. A., Buckley, T. N., Binkley, D., Neumann, M., and Turnbull, T. L. (2021). CO2, nitrogen deposition and a discontinuous climate response drive water use efficiency in global forests. Nat. Commun. 12:5194. doi: 10.1038/s41467-021-25365-1
Albrecht, M. A., and McCarthy, B. C. (2006). Effects of prescribed fire and thinning on tree recruitment patterns in central hardwood forests. For. Ecol. Manage. 226, 88–103. doi: 10.1016/j.foreco.2005.12.061
Allan, R. J., Nicholls, N., Jones, P. D., and Butterworth, I. J. (1991). A further extension of the Tahiti-Darwin SOI, early ENSO events and Darwin pressure. J. Clim. 4, 743–749. doi: 10.1175/1520-0442(1991)004<0743:afeott>2.0.co;2
Attiwill, P. (1992). Productivity of Eucalyptus regnans forest regenerating after bushfire. S. Afr. For. J. 160, 1–6. doi: 10.1080/00382167.1992.9630403
Attiwill, P. M. (1979). Nutrient cycling in a Eucalyptus obliqua (L’Herit.) forest. III. Growth, biomass, and net primary production. Aust. J. Bot. 27, 439–458.
Attiwill, P. M. (1994). Ecological disturbance and the conservative management of eucalypt forests in Australia. For. Ecol. Manage. 63, 301–346. doi: 10.1016/0378-1127(94)90115-5
Attiwill, P. M., and Adams, M. A. (2008). Harnessing forest ecological sciences in the service of stewardship and sustainability. A perspective from “down-under”. For. Ecol. Manage. 256, 1636–1645. doi: 10.1016/j.foreco.2008.07.024
Attiwill, P. M., and Clayton-Greene, K. A. (1984). Studies of gas exchange and development in a Subhumid Woodland. J. Ecol. 72:285. doi: 10.2307/2260020
Bauhus, J., McElhinny, C. M., and Alcorn, P. (2002). Stand structure and tree growth in uneven-aged spotted gum (Corymbia maculata) forests: some implications for management. Forestry 75, 451–456. doi: 10.1093/forestry/75.4.451
Beesley, C., Frost, A., and Zajaczkowski, J. (2009). “A comparison of the BAWAP and SILO spatially interpolated daily rainfall datasets,” in Proceedings of the 18th World IMACS/MODSIM Congr, Cairns.
Beetson, T., Nester, M., and Vanclay, J. (1992). Enhancing a permanent sample plot system in natural forests. Statistician 41, 525–538. doi: 10.2307/2348919
Berger, U., Hildenbrandt, H., and Grimm, V. (2004). Age-related decline in forest production: modelling the effects of growth limitation, neighbourhood competition and self-thinning. J. Ecol. 92, 846–853. doi: 10.1111/j.0022-0477.2004.00911.x
Bhandari, S. K., Veneklaas, E. J., McCaw, L., Mazanec, R., Whitford, K., and Renton, M. (2021). Effect of thinning and fertilizer on growth and allometry of Eucalyptus marginata. For. Ecol. Manage. 479:118594. doi: 10.1016/j.foreco.2020.118594
Bi, H. (1994). South-east regrowth forest growth and yield modelling: design, methods and progress. Res. Pap. State For. New South Wales 24:46.
Bi, H., Wan, G., and Turvey, N. D. (2000). Estimating the self-thinning boundary line as a density-dependent stochastic biomass frontier. Ecology 81, 1477–1483.
Blakey, R. V., Law, B. S., Kingsford, R. T., Stoklosa, J., Tap, P., and Williamson, K. (2016). Bat communities respond positively to large-scale thinning of forest regrowth. J. Appl. Ecol. 53, 1694–1703. doi: 10.1111/1365-2664.12691
Bollmann, K., Weibel, P., and Graf, R. F. (2005). An analysis of central Alpine capercaillie spring habitat at the forest stand scale. For. Ecol. Manage. 215, 307–318. doi: 10.1016/j.foreco.2005.05.019
Carron, L. T. (1985). A History of Forestry in Australia. Canberra, ACT: Australian National University Press.
Chidumayo, E. N. (2019). Management implications of tree growth patterns in miombo woodlands of Zambia. For. Ecol. Manage. 436, 105–116. doi: 10.1016/j.foreco.2019.01.018
Curtin, R. A. (1964). Stand density and the relationship of crown width to diameter and height in Eucalyptus obliqua. Aust. For. 28, 91–105. doi: 10.1080/00049158.1964.10675358
Dare, L., Schirmer, J., and Mylek, M. (2017). Private Native Forest Owner Attitudinal Survey-Northern NSW. Understanding Forest Owners Value and Use of Their Forest Resource. Canberra, ACT: University of Canberra.
Department of National Parks Recreation Sports and Racing (2014). Code of Practice for Native Forest Timber Production on the QPWS Forest Estate. Brisbane, Qld: Department of National Parks Recreation Sports and Racing.
Eastaugh, C. S., and Hasenauer, H. (2013). Biases in volume increment estimates derived from successive angle count sampling. For. Sci. 59, 1–14. doi: 10.5849/forsci.11-007
Espelta, J. M., Riba, M., and Javier, R. (1995). Patterns of seedling recruitment in West-Mediterranean Quercus ilex forest influenced by canopy development. J. Veg. Sci. 6, 465–472. doi: 10.2307/3236344
Eyre, T. J. (2005). Hollow-bearing trees in large glider habitat in south-east Queensland, Australia: abundance, spatial distribution and management. Pac. Conserv. Biol. 11, 23–37. doi: 10.1071/pc050023
Eyre, T. J., Ferguson, D. J., Kennedy, M., Rowland, J., and Maron, M. (2015). Long term thinning and logging in Australian cypress pine forest: changes in habitat attributes and response of fauna. Biol. Conserv. 186, 83–96. doi: 10.1016/j.biocon.2015.03.009
Eyre, T. J., and Goldingay, R. L. (2005). Characteristics of sap trees used by yellow-bellied gliders in southern Queensland. Wildl. Res. 32, 23–35. doi: 10.1071/WR03075
Eyre, T. J., Maron, M., Mathieson, M. T., and Haseler, M. (2009). Impacts of grazing, selective logging and hyper-aggressors on diurnal bird fauna in intact forest landscapes of the Brigalow Belt, Queensland. Aust. Ecol. 34, 705–716. doi: 10.1111/j.1442-9993.2009.01979.x
FAO and UNEP (2020). The State of the World’s Forests 2020. Forests, Biodiversity and People. Rome: FAO.
Felker, P., and Guevara, J. C. (2003). Potential of commercial hardwood forestry plantations in arid lands–an economic analyses of Prosopis lumber production in Argentina and the United States. For. Ecol. Manage. 186, 271–286. doi: 10.1016/S0378-1127(03)00280-9
Fick, S. E., and Hijmans, R. J. (2017). WorldClim 2: new 1-km spatial resolution climate surfaces for global land areas. Int. J. Climatol. 37, 4302–4315. doi: 10.1002/joc.5086
Finkral, A. J., and Evans, A. M. (2008). The effects of a thinning treatment on carbon stocks in a northern Arizona ponderosa pine forest. For. Ecol. Manage. 255, 2743–2750. doi: 10.1016/j.foreco.2008.01.041
Florence, R. G. (1964). Regeneration burning with seed trees in two blackbutt (Eucalyptus pilularis Sm) forests. Aust. For. 28, 157–165. doi: 10.1080/00049158.1964.10675365
Florence, R. G. (1996). Ecology and Silviculture of Eucalypt Forests. Clayton, NC: CSIRO Publishing.
Forest Europe (2015). “State of Europe’s Forests 2015,” in Proceedings of the Ministerial Conference on the Protection of Forests in Europe FOREST EUROPE Liaison Unit, Madrid.
Francis, B., Venn, T., and Lewis, T. (2020). “Chapter 4: A review of the private native forest resource, with a focus on economic contributions,” in Improving Productivity of the Private Native Forest Resource in Southern Queensland and Northern New South Wales, eds T. Lewis, T. Venn, B. Francis, S. Ryan, J. Brawner, N. Cameron (Melbourne, VIC: Forest & Wood Products Australia), 60–95.
Franklin, A. B., Anderson, D. R., Gutiérrez, R. J., and Burnham, K. P. (2000). Climate, habitat quality, and fitness in Northern Spotted Owl populations in northwestern California. Ecol. Monogr. 70, 539–590.
Friedl, M., Sulla-Menashe, D., Tan, B., Schneider, A., Ramankutty, N., Sibley, A., et al. (2010). MODIS collection 5 global land cover: algorithm refinements and characterization of new datasets. Remote Sens. Environ. 114, 168–182. doi: 10.1016/j.rse.2009.08.016
Gibbons, P., Briggs, S. V., Murphy, D. Y., Lindenmayer, D. B., McElhinny, C., and Brookhouse, M. (2010). Benchmark stem densities for forests and woodlands in south-eastern Australia under conditions of relatively little modification by humans since European settlement. For. Ecol. Manage. 260, 2125–2133. doi: 10.1016/j.foreco.2010.09.003
Gibbs, W. (1984). The great Australian drought: 1982-1983*. Disasters 8, 89–104. doi: 10.1111/j.1467-7717.1984.tb00858.x
Goldingay, R. L. (2009). Characteristics of tree hollows used by Australian birds and bats. Wildl. Res. 36:394. doi: 10.1071/WR08172
Gough, D. (2018). Early forestry and 100 years of timber research in Queensland. Aust. For. Hist. Soc. Inc. Newsl. 75, 3–11.
Grimes, R., and Pegg, R. (1979). Growth Data for a Spotted Gum–Ironbark Forest in South-East Queensland. Technical Paper No. 17. Brisbane, Qld: Queensland Department of Forestry.
Hasenauer, H., Merganicova, K., Petritsch, R., Pietsch, S. A., and Thornton, P. E. (2003). Validating daily climate interpolations over complex terrain in Austria. Agric. For. Meteorol. 119, 87–107. doi: 10.1016/S0168-1923(03)00114-X
Haverd, V., Raupach, M. R., Briggs, P. R., Canadell, J. G., Davis, S. J., Law, R. M., et al. (2013). The Australian terrestrial carbon budget. Biogeosciences 10, 851–869. doi: 10.5194/bg-10-851-2013
Henry, N. B., and Florence, R. G. (1966). Establishment and development of regeneration in spotted gum—ironbark forests. Aust. For. 30, 304–316. doi: 10.1080/00049158.1966.10675428
Horne, R., and Robinson, G. (1987). White cypress pine in N.S.W.: growth patterns and optimal thinning regimes for 60 to 80 year old stands. Aust. For. 50, 216–223. doi: 10.1080/00049158.1987.10676019
Houghton, R. A., and Hackler, J. L. (2003). Sources and sinks of carbon from land-use change in China. Glob. Biogeochem. Cycles 17:1034. doi: 10.1029/2002gb001970
Hu, J., Herbohn, J., Chazdon, R. L., Baynes, J., and Vanclay, J. K. (2020). Above-ground biomass recovery following logging and thinning over 46 years in an Australian tropical forest. Sci. Total Environ. 734:139098. doi: 10.1016/j.scitotenv.2020.139098
Hurst, J. M., Allen, R. B., Coomes, D. A., and Duncan, R. P. (2011). Size-specific tree mortality varies with neighbourhood crowding and disturbance in a montane Nothofagus forest. PLoS One 6:e26670. doi: 10.1371/journal.pone.0026670
Janowiak, M. K., Nagel, L. M., and Webster, C. R. (2008). Spatial scale and stand structure in Northern Hardwood forests: implications for quantifying diameter distributions. For. Sci. 54, 497–506. doi: 10.1093/forestscience/54.5.497
Jay, A. (2018). Site Quality Mapping for Private Native Forestry in Southeast Queensland. Morningside, QLD: BlueChip Forest Services.
Jay, V. A., Nichols, J. D., and Vanclay, J. K. (2007). Social and ecological issues for private native forestry in north-eastern New South Wales, Australia. Small Scale For. 6, 115–126. doi: 10.1007/s11842-007-9008-0
Jeffrey, S. J., Carter, J. O., Moodie, K. B., and Beswick, A. R. (2001). Using spatial interpolation to construct a comprehensive archive of Australian climate data. Environ. Model. Softw. 16, 309–330. doi: 10.1016/S1364-8152(01)00008-1
Jones, C. S., Duncan, D. H., Rumpff, L., Thomas, F. M., Morris, W. K., and Vesk, P. A. (2015). Empirically validating a dense woody regrowth “problem” and thinning “solution” for understory vegetation. For. Ecol. Manage. 340, 153–162. doi: 10.1016/j.foreco.2014.12.006
Kirschbaum, M. (2004). “Assessing long-term trend in forest productivity under changing climatic conditions,” in Proceedings of the International Conference on Modeling Forest Production (Vienna: Department of Ecology).
Lawes, M. J., Adie, H., Russell-Smith, J., Murphy, B., and Midgley, J. J. (2011). How do small savanna trees avoid stem mortality by fire? the roles of stem diameter, height and bark thickness. Ecosphere 2, 1–13. doi: 10.1890/ES10-00204.1
Lewis, S. L., Phillips, O. L., Baker, T. R., Lloyd, J., Malhi, Y., Almeida, S., et al. (2004). Concerted changes in tropical forest structure and dynamics: evidence from 50 South American long-term plots. Philos. Trans. R. Soc. Lond. Ser. B Biol. Sci. 359, 421–436. doi: 10.1098/rstb.2003.1431
Lewis, T. (2020). Very frequent burning encourages tree growth in sub-tropical Australian eucalypt forest. For. Ecol. Manage. 459:117842. doi: 10.1016/j.foreco.2019.117842
Lewis, T., Osborne, D., Hogg, B., Swift, S., Ryan, S., Taylor, D., et al. (2010). Tree Growth Relationships and Silvicultural Tools to Assist Stand Management in Private Native Spotted Gum Dominant Forests in Queensland and Northern New South Wales. Melbourne VIC: Forest & Wood Products Australia.
Lewis, T., Venn, T., Francis, B., Ryan, S., Brawner, J., Cameron, N., et al. (2020). Improving productivity of the private native forest resource in southern Queensland and northern New South Wales. For. Wood Prod. Aust. 61, 10–16.
Lindenmayer, D. (2016). The importance of managing and conserving large old trees: a case study from victorian mountain ash forests. Proc. R. Soc. Victoria 128, 64–70. doi: 10.1071/RS16006
Lindenmayer, D. B. (1995). Forest disturbance, forest wildlife conservation and the conservative basis for forest management in the mountain ash forests of Victoria-Comment. For. Ecol. Manage. 74, 223–231. doi: 10.1016/0378-1127(94)03524-Z
Lindenmayer, D. B., Franklin, J. F., Lõhmus, A., Baker, S. C., Bauhus, J., Beese, W., et al. (2012). A major shift to the retention approach for forestry can help resolve some global forest sustainability issues. Conserv. Lett. 5, 421–431. doi: 10.1111/j.1755-263X.2012.00257.x
Long, J. N., and Vacchiano, G. (2014). A comprehensive framework of forest stand property-density relationships: perspectives for plant population ecology and forest management. Ann. For. Sci. 71, 325–335. doi: 10.1007/s13595-013-0351-3
MacKinney, A. L., and Chaiken, L. A. (1935). A Method of Determining Density of Loblolly Pine Stands. Asheville, NC: Appalachian Forest Experiment Station
May, F., Gerstner, K., McGlinn, D. J., Xiao, X., and Chase, J. M. (2018). mobsim: an R package for the simulation and measurement of biodiversity across spatial scales. Methods Ecol. Evol. 9, 1401–1408. doi: 10.1111/2041-210X.12986
McKenny, H. C., Keeton, W. S., and Donovan, T. M. (2006). Effects of structural complexity enhancement on eastern red-backed salamander (Plethodon cinereus) populations in northern hardwood forests. For. Ecol. Manage. 230, 186–196. doi: 10.1016/j.foreco.2006.04.034
Monserud, R. A., Ledermann, T., and Sterba, H. (2004). Are self-thinning constraints needed in a tree-specific mortality model? For. Sci. 50, 848–858. doi: 10.1093/forestscience/50.6.848
Montreal Process Implementation Group for Australia and National Forest Inventory Steering Committe (2018). Australia’s State of the Forests Report 2018. Canberra, ACT: ABARES.
Munks, S. A., Chuter, A. E., and Koch, A. J. (2020). ‘Off-reserve’ management in practice: contributing to conservation of biodiversity over 30 years of Tasmania’s forest practices system. For. Ecol. Manage. 465:117941. doi: 10.1016/j.foreco.2020.117941
Neuendorff, J. K., Nagel, L. M., Webster, C. R., and Janowiak, M. K. (2007). Stand structure and composition in a Northern Hardwood forest after 40 years of single-tree selection. North. J. Appl. For. 24, 197–202. doi: 10.1093/njaf/24.3.197
Ngugi, M. R., Doley, D., Botkin, D. B., Cant, M., Neldner, V. J., and Kelley, J. (2014). Long-term estimates of live above-ground tree carbon stocks and net change in managed uneven-aged mixed species forests of sub-tropical Queensland Australia. Aust. For. 77, 189–202. doi: 10.1080/00049158.2014.979979
Ngugi, M. R., Doley, D., Cant, M., and Botkin, D. B. (2015). Growth rates of Eucalyptus and other Australian native tree species derived from seven decades of growth monitoring. J. For. Res. 26, 811–826. doi: 10.1007/s11676-015-0095-z
Norman, P., Smith, G., McAlpine, C. A., and Borsboom, A. (2004). “South-east Queensland Forests agreement: conservation outcomes for forest fauna,” in Conservation of Australia’s Forest Fauna, ed. D. Lunney (Mosman, NSW: Royal Zoological Society of NSW), 208–221. doi: 10.7882/fs.2004.015
North, M. P., Kane, J. T., Kane, V. R., Asner, G. P., Berigan, W., Churchill, D. J., et al. (2017). Cover of tall trees best predicts California spotted owl habitat. For. Ecol. Manage. 405, 166–178. doi: 10.1016/j.foreco.2017.09.019
Ouédraogo, D. Y., Beina, D., Picard, N., Mortier, F., Baya, F., and Gourlet-Fleury, S. (2011). Thinning after selective logging facilitates floristic composition recovery in a tropical rain forest of Central Africa. For. Ecol. Manage. 262, 2176–2186. doi: 10.1016/j.foreco.2011.08.009
Pelletier, J., Paquette, A., Mbindo, K., Zimba, N., Siampale, A., Chendauka, B., et al. (2018). Carbon sink despite large deforestation in African tropical dry forests (miombo woodlands). Environ. Res. Lett. 13:094017. doi: 10.1088/1748-9326/aadc9a
Pretzsch, H., and Biber, P. (2005). A re-evaluation of Reineke’s rule and stand density index. For. Sci. 51, 304–320. doi: 10.1093/forestscience/51.4.304
Pretzsch, H., and Mette, T. (2008). Linking stand-level self-thinning allometry to the tree-level leaf biomass allometry. Trees Struct. Funct. 22, 611–622. doi: 10.1007/s00468-008-0231-x
Prior, L. D., Grierson, P. F., McCaw, W. L., Tng, D. Y. P., Nichols, S. C., and Bowman, D. M. J. S. (2012). Variation in stem radial growth of the Australian conifer, Callitris columellaris, across the world’s driest and least fertile vegetated continent. Trees Struct. Funct. 26, 1169–1179. doi: 10.1007/s00468-012-0693-8
Prior, L. D., Williamson, G. J., and Bowman, D. (2011). Using Permanent Forestry Plots to Understand the Possible Effects of Climate Change on Australia’s Production Forest Estate. Hobart, TAS: University of Tasmania.
Queensland Parks and Wildlife Service (2020). Code of Practice for Native Forest Timber Production on Queensland’s State Forest Estate. Brisbane, Qld: Queensland Parks and Wildlife Service.
R Development Core Team (2021). R: A Language and Environment for Statistical Computing. Vienna: R Foundation and Statistical Computing.
Reineke, L. (1933). Perfecting a stand-density index for even-aged forests. J. Agric. Res. 46, 627–638.
Richit, L. A., Richit, J. F., Bonatto, C., da Silva, R. V., and Grzybowski, J. M. V. (2021). Forest recovery prognostics in conservation units of the Atlantic rainforest. Ecol. Inform. 61:101199. doi: 10.1016/j.ecoinf.2020.101199
Rosenzweig, M. L. (1995). Species Diversity in Space and Time. Cambridge: Cambridge University Press.
Roxburgh, S. H., Wood, S. W., Mackey, B. G., Woldendorp, G., and Gibbons, P. (2006). Assessing the carbon sequestration potential of managed forests: a case study from temperate Australia. J. Appl. Ecol. 43, 1149–1159. doi: 10.1111/j.1365-2664.2006.01221.x
Ruiz-Benito, P., Madrigal-González, J., Ratcliffe, S., Coomes, D. A., Kändler, G., Lehtonen, A., et al. (2014). Stand structure and recent climate change constrain stand basal area change in European forests: a comparison across boreal, temperate, and Mediterranean biomes. Ecosystems 17, 1439–1454. doi: 10.1007/s10021-014-9806-0
Schuler, T. M. (2004). Fifty years of partial harvesting in a mixed mesophytic forest: composition and productivity. Can. J. For. Res. 34, 985–997. doi: 10.1139/x03-262
Seiwa, K., Etoh, Y., Hisita, M., Masaka, K., Imaji, A., Ueno, N., et al. (2012). Roles of thinning intensity in hardwood recruitment and diversity in a conifer, Criptomeria japonica plantation: a 5-year demographic study. For. Ecol. Manage. 269, 177–187. doi: 10.1016/j.foreco.2011.12.014
Smith, G. C., Mathieson, M., and Hogan, L. (2007). Home range and habitat use of a low-density population of greater gliders, Petauroides volans (Pseudocheiridae: Marsupialia), in a hollow-limiting environment. Wildl. Res. 34, 472–483. doi: 10.1071/WR06063
Sterba, H., and Monserud, R. A. (1993). The maximum density concept applied to uneven-aged stands mixed-species stands. For. Sci. 39, 432–453.
Thom, D., and Keeton, W. S. (2020). Disturbance-based silviculture for habitat diversification: effects on forest structure, dynamics, and carbon storage. For. Ecol. Manage. 469:118132. doi: 10.1016/j.foreco.2020.118132
Trouvé, R., Nitschke, C. R., Robinson, A. P., and Baker, P. J. (2017). Estimating the self-thinning line from mortality data. For. Ecol. Manage. 402, 122–134. doi: 10.1016/j.foreco.2017.07.027
USDA Forest Service (2014). U.S. Forest Resource Facts and Historical Trends. FS-1035, 64. Available online at: https://www.fia.fs.fed.us/library/brochures/docs/2012/ForestFacts_1952-2012_English.pdf (accessed November 29, 2021).
Vanclay, J. K. (1988). “A stand growth model for Cypress pine,” in Modelling Trees, Stands and Forests, eds J. W. Leech, R. E. McMurtrie, P. W. West, R. D. Spencer, and B. M. Spencer (Melbourne, VIC: University of Melbourne), 310–332. doi: 10.1371/journal.pone.0150992
Vanclay, J. K., and Sands, P. J. (2009). Calibrating the self-thinning frontier. For. Ecol. Manage. 259, 81–85. doi: 10.1016/j.foreco.2009.09.045
Verschuyl, J., Riffell, S., Miller, D., and Wigley, T. B. (2011). Biodiversity response to intensive biomass production from forest thinning in North American forests–a meta-analysis. For. Ecol. Manage. 261, 221–232. doi: 10.1016/j.foreco.2010.10.010
Vlam, M., Baker, P. J., Bunyavejchewin, S., and Zuidema, P. A. (2014). Temperature and rainfall strongly drive temporal growth variation in Asian tropical forest trees. Oecologia 174, 1449–1461. doi: 10.1007/s00442-013-2846-x
Westoby, M. (1984). The self-thinning rule. Adv. Ecol. Res. 14, 167–225. doi: 10.1016/S0065-2504(08)60171-3
Whipp, R. K., Lunt, I. D., Spooner, P. G., and Bradstock, R. A. (2012). Changes in forest structure over 60 years: tree densities continue to increase in the Pilliga forests, New South Wales, Australia. Aust. J. Bot. 60, 1–8. doi: 10.1071/BT11191
Wilson, B. A., Neldner, V. J., and Accad, A. (2002). The extent and status of remnant vegetation in Queensland and its implications for statewide vegetation management and legislation. Rangel. J. 24:6. doi: 10.1071/rj02001
Wilson, D. S., and Puettmann, K. J. (2007). Density management and biodiversity in young Douglas-fir forests: challenges of managing across scales. For. Ecol. Manage. 246, 123–134. doi: 10.1016/j.foreco.2007.03.052
Wormington, K., and Lamb, D. (1999). Tree hollow development in wet and dry sclerophyll eucalypt forest in south-east Queensland, Australia. Aust. For. 62, 336–345. doi: 10.1080/00049158.1999.10674801
Wormington, K. R., Lamb, D., Mccallum, H. I., and Moloney, D. J. (2002). Habitat Requirements for the conservation of Arboreal Marsupials in dry Sclerophyll Forests of Southeast Queensland, Australia. For. Sci. 48, 217–227. doi: 10.1093/forestscience/48.2.217
Keywords: Eucalyptus, Callitris, carbon storage, potential stocking, self-thinning, permanent sample plots, conservation, biodiversity
Citation: Neumann M, Adams MA and Lewis T (2021) Native Forests Show Resilience to Selective Timber Harvesting in Southeast Queensland, Australia. Front. For. Glob. Change 4:750350. doi: 10.3389/ffgc.2021.750350
Received: 30 July 2021; Accepted: 22 November 2021;
Published: 09 December 2021.
Edited by:
Marieke van der Maaten-Theunissen, Technical University Dresden, GermanyReviewed by:
Jerome Vanclay, Southern Cross University, AustraliaJürgen Bauhus, University of Freiburg, Germany
Copyright © 2021 Neumann, Adams and Lewis. This is an open-access article distributed under the terms of the Creative Commons Attribution License (CC BY). The use, distribution or reproduction in other forums is permitted, provided the original author(s) and the copyright owner(s) are credited and that the original publication in this journal is cited, in accordance with accepted academic practice. No use, distribution or reproduction is permitted which does not comply with these terms.
*Correspondence: Mathias Neumann, bWF0aGlhcy5uZXVtYW5uQGJva3UuYWMuYXQ=