 Cristobal Pais
 Jaime Carrasco
 David L. Martell
 Andres Weintraub2,3
 David L. Woodruff
- 1Department of Industrial Engineering and Operations Research (IEOR), University of California, Berkeley, Berkeley, CA, United States
- 2Department of Industrial Engineering, University of Chile, Santiago, Chile
- 3Complex Engineering System Institute-ISCI, Santiago, Chile
- 4Institute of Forestry and Conservation, University of Toronto, Toronto, ON, Canada
- 5Graduate School of Management, University of California, Davis, Davis, CA, United States
Cell2Fire is a new cell-based wildland fire growth simulator designed to integrate data-driven landscape management planning models. The fire environment is modeled by partitioning the landscape into cells characterized by fuel, weather, moisture content, and topographic attributes. The model can use existing fire spread models such as the Canadian Forest Fire Behavior Prediction System to model fire growth. Cell2Fire is structured to facilitate its use for predicting the growth of individual fires or by embedding it in landscape management simulation models. Decision-making models such as fuel treatment/harvesting plans can be easily integrated and evaluated. It incorporates a series of out-of-the-box planning heuristics that provide benchmarks for comparison. We illustrate their use by applying and evaluating a series of harvesting plans for forest landscapes in Canada. We validated Cell2Fire by using it to predict the growth of both real and hypothetical fires, comparing our predictions with the fire scars produced by a validated fire growth simulator (Prometheus). Cell2Fire is implemented as an open-source project that exploits parallelism to efficiently support the modeling of fire growth across large spatial and temporal scales. Our experiments indicate that Cell2Fire is able to efficiently simulate wildfires (up to 30x faster) under different conditions with similar accuracy as state-of-the-art simulators (above 90% of accuracy). We demonstrate its effectiveness as part of a harvest planning optimization framework, identifying relevant metrics to capture and actions to mitigate the impact of wildfire uncertainty.
1. Introduction
The effects of global warming on temperature, precipitation, soil moisture, and other forest and wildland fire regime drivers have increased and are expected to continue to increase in terms of both the number of and area burned by wildfires around the globe (Westerling, 2016). Wildfires have burned large areas and important infrastructure, thousands of homes and forest resources have been destroyed, and many lives have been lost in recent years. Recent examples include catastrophic incidents in the United States, Canada, Chile, Portugal, and southwestern Australia (Kramer et al., 2018; Radeloff et al., 2018; Bowman et al., 2019). Wildfire occurrences have also resulted in increases in expenditures by forest and wildland fire management agencies (see, e.g., Stocks and Martell, 2016; Tymstra et al., 2020). Despite concerted efforts, wildfire growth remains a complex and difficult to model process.
Two of the most important characteristics of a wildfire are its rate of spread (ROS) and intensity, which are influenced by fuel type, fuel moisture, wind velocity, and slope. The Canadian Forest Fire Behavior Prediction (FBP) System includes empirical fire spread rate models that can be used to predict the ROS and the intensity of wildfires based on weather, fuel moisture, time of year, and topographical variables for specified fuel types; e.g., for individual grid cells that contain homogeneous fuel types (Forestry-Canada, 1992). However, the FBP System alone cannot be used to predict how a fire will grow across a heterogeneous landscape/grid over time. Spatial fire growth models like Prometheus, a deterministic fire growth simulator, are designed to use FBP spread rate functions to do so (Tymstra et al., 2010). Prometheus is a vector-based fire growth model that is based on an adaptation of Huygens principle of wave propagation, i.e., the propagation of the fire front is modeled similar to a wave, shifting and moving forward continuously in time and space. It uses spatially explicit fire environment input data concerning topography (slope, aspect, and elevation) and FBP fuel types along with a weather stream and corresponding fire danger rating codes and indices to model wildfire growth (Van Wagner and Pickett, 1987). FARSITE is another widely used fire growth simulator (Finney, 2005). It is based on the U.S. Forest Service's BEHAVE fire behavior prediction system and it is also a vector-based Huygens' type model. A review of 23 simulators that can be used to predict forest fire growth can be found in Papadopoulos and Pavlidou (2011) and a review of new modeling techniques are analyzed in Bakhshaii and Johnson (2019). The two models found to best model the growth of historical fires were FARSITE in the United States and Prometheus in Canada.
Large portions of the western United States, the southern interior of the Canadian province of British Columbia, the northwestern portion of the Canadian province of Ontario, parts of Russia and several Mediterranean countries were very severely impacted by wildfires during the 2021 fire season and in some cases, the suffering continues as we write. Wildfire management has been characterized as a “wicked” problem to which there are no simple solutions (e.g., Matthew et al., 2007). That being said, there is widespread recognition of the need to treat hazardous fuel buildups near communities and infrastructure (Beverly et al., 2021) and across the larger extensive flammable landscapes in which those communities and infrastructure are embedded (e.g., Hirsch et al., 2001). Unfortunately, fuel management is very expensive (Peter et al., 2016).
However, forest companies are involved in the management of timber production on many flammable forest landscapes. They construct and maintain roads and harvest and regenerate forest stands and establish landings and sorting yards, the costs of which are underwritten by their commercial operations. Hirsch et al. (2001) recognized that it might be possible for such companies to modify some of their road building, timber harvesting and regeneration activities such that they might reduce the flammability of the landscape while satisfying their timber production objectives and coined the phrase “FireSmart forest management” to describe their novel paradigm.
Such companies could, for example, when scheduling the timing and location of harvest blocks and the roads required to access the stands to be harvested, look beyond delivered wood costs and also consider the extent to which they could plan their harvesting and road building activities to strategically fragment and thereby reduce the flammability of the landscape. It is reasonable to assume at least some of the marginal cost of modifying their road building and harvesting activities to FireSmart the landscape could to some extent, be offset by reductions in fire losses and increases in their annual allowable cut.
In order to develop and evaluate integrated FireSmart timber production strategies one must develop integrated landscape management planning models that include estimates of the probability that each forest stand will burn given the current structure of the landscape (i.e., its vegetation or fuel and topography), future weather, the fires that might be ignited, fought and grow and how the subsequent growth of those fires might be influenced by the timing and placement of roads and harvesting activities. Put simply, such strategic forest landscape management planning models must include endogenous burn probability models.
Endogenizing burn probability estimation complicates forest landscape management enormously because harvesting decisions should be influenced by stand-specific burn probabilities but any harvesting and road construction that takes place will fragment the landscape and may impact future stand specific burn probabilities. Acuna et al. (2010) developed a heuristic approach to addressing that problem and applied their methodology to a 12,964 ha portion of a forest management unit in the boreal forest region of the province of Alberta in western Canada. They found that for their study area, integrated fire forest management planning based on their methodology could result in an 8.1% increase in net present value of the timber production when compared with traditional planning in which fire loss is treated as an exogenous factor.
Both traditional burn probability modeling (e.g., Parisien et al., 2005b; Finney, 2006; Finney et al., 2011a) and the incorporation of endogenous burn probability models in landscape management planning models (e.g., Acuna et al., 2010) call for simulating many spatially explicit fire ignition and fire growth scenarios which is very computationally challenging. Our objectives were to develop an open source fire growth model in which fire spread is based on existing fire spread models developed by others (in our case, the Canadian Fire Behavior prediction system) that is designed such that users can exploit parallel processing computer architecture to speed processing when available, that can be incorporated in integrated FireSmart forest management planning models and “stand alone” burn probability models, and to illustrate how it can be used for such purposes.
This paper is organized as follows. We begin our Materials and Methods section with a brief description of the basic structure of wave-propagation Huygens type vector models and cell-based models, and a brief review of the fire growth modeling literature. We then describe the structure of our fire growth model, its requisite inputs and outputs and the methods we use to compare fire scars predicted by Prometheus and Cell2Fire. We then describe how fire growth models can be used to generate burn probability maps which can be incorporated in FireSmart forest management planning decision support systems. We describe the experimental instances (landscapes with associated fuel-type maps and weather scenarios) for which we generated and compared Prometheus and Cell2Fire fire scars and evaluated three harvest schedules for a 1,600 ha landscape in Alberta. We then present and discuss those experimental results and conclude by suggesting that Cell2Fire can be used to support FireSmart landscape management planning research and expressing our hope and expectation that our open source approach will facilitate its use for such purposes.
2. Materials and Methods
2.1. Background
Fire growth simulation requires an understanding of fire behavior. This knowledge is captured in empirical fire behavior models (e.g., non-linear systems) describing the main characteristics of fires as a function of environmental conditions, fuel cover type, and time, among others. Outputs generated by these models are then used as the main inputs of fire growth models, allowing us to simulate wildfires. The two methods that have most often been used to simulate fire growth across heterogeneous landscapes are the wave propagation and the cellular-automata approaches. We therefore begin by providing an overview of the most prominent fire behavior prediction system in Canada and a brief summary of the main characteristics of the two fire growth simulation approaches.
2.1.1. Canadian Fire Behavior Prediction System: FBP
The Canadian FBP System is a set of empirical models that can be used to predict fire spread rate, fuel consumption, and fire intensity within homogeneous spatial units (i.e., cells) as functions of fuel type, slope, fuel moisture, and current weather expressed in terms of the Canadian Forest Fire Weather Index System (FWI) codes and indices (Forestry-Canada, 1992). It includes fuel models that are used to classify vegetation into 17 fuel types that collectively represent most of the major forest cover types in Canada. In the context of landscape management, outputs generated from the FBP system can be used to inform the development of landscape management plans. This allows the planner to incorporate fire behavior outputs like the average ROS, expected flame length, and fire intensity, among other features, to evaluate the impact of proposed plans to mitigate potential effects of future wildfires on the area of interest.
2.1.2. Wave-Propagation Model: Huygens
Huygens considered every point on a wavefront of light as a source of individual wavelets and described the new wavefront as the surface tangential to the circumferences of the secondary waves. The use of Huygens Principle to simulate fire growth is based on the assumption that the shape of a fire can be represented by a polygon, a plane figure composed of a sequence of straight-line segments forming a closed path whose vertices are a tangential envelope of the elliptical “firelets.” Huygens principle was first used to model fire growth by Sanderlin and Sunderson (1975). Anderson et al. (1982) later developed a simple elliptical model based on Huygens principle of wave propagation to simulate the growth of grass fires. Richards (1990) then extended the Anderson et al. (1982) model by deriving a set of partial differential equations to model the growth of fires across a heterogeneous landscape.
Both FARSITE and Prometheus use Richards' partial differential equations to propagate each vertex on a fire's perimeter (Finney, 2004; Tymstra et al., 2010). However, these models differ with respect to the fire danger rating systems and fuel models they use to model fire spread rates. FARSITE uses the fire behavior prediction fuel models developed by Rothermel (1972) and extended by Anderson (1982) and Scott and Burgan (2005), whereas Prometheus uses the Canadian Forest Fire Behavior Prediction System (Forestry-Canada, 1992).
2.1.3. Cell-Based Fire Growth Models
Cellular-automata models that employ a raster-grid of square or hexagonal cells are widely used to model wildfire growth. Fuel and terrain conditions are usually assumed to be homogeneous within each cell in order to simplify basic fire spread rate calculations. The fire propagates through the grid-cells, typically from a cell's center to the center of an adjacent cell. Each ignited cell behaves as an ignition source that is independent of any adjacent burning cells. To spread the fire from one cell to another, a search mechanism based on an adjacency or spread template is required.
Kourtz and O'Regan (1971) developed the first computer simulation model to spatially simulate the growth of a small fire. Their model was based on a heterogeneous and discontinuous fuel-type grid but did not account for the effects of terrain and wind. Their deterministic model predicted how long it would take a fire to burn through one square area or cell within a fuel grid when the location of the fire, the starting time, and the grid resolution were known. Travel times were calculated using fixed rates of spread (based on the fuel type and the spread index for the day) and fixed spread directions from the burning cell. Later, O'Regan et al. (1973) developed a method for using directional rates of spread to predict fire growth. They also rewrote the original model for use on what was then a large computer, to simulate the growth of fires of up to 15,000 ha in size.
O'Regan et al. (1976) developed a model for average directional rates of spread and Kourtz et al. (1977) modified that model to accommodate variation in hourly wind conditions. Todd (1999) adapted the Kourtz et al. (1977) model to create an eight-point symmetric fire growth model called Wildfire, which incorporates FBP System spread rates. The features and functionalities of the Wildfire model were assessed and considered during the design of the Prometheus model (Tymstra et al., 2010). Boychuk et al. (2009) developed a stochastic model of fire spread using a lattice Markov chain model in which they associated probabilistic transition functions with each cell. Each of these cells interacts with its four nearest neighbors and a cell transitions from unburned to burning depending on the state of its neighboring cells. The use of a simplified cellular-automata model describing the dynamics of fire spread on a heterogeneous landscape accounting for weather factors (wind speed and direction) as well as the type and density of vegetation was used to successfully model the Spetses Island fire (Greece) after tuning the main parameters of the simulator (Alexandridis et al., 2008).
Arca et al. (2019) recently released a fire growth simulator designed to assist civil protection and fire management agencies with a case study in the island of Sardinia, Italy. Their model uses the level set technique (see Ghisu et al., 2015) and the Rothermel (1972) fire behavior model. Such models are designed to be used in near real-time to inform the on-going management of specific fires that are subject to active suppression action.
One alternative to the cell-based approach calls for probabilistic spatially explicit fire scenarios in the form of burn scar maps that describe what portions of the forest might burn in the future and the probability that each of those scenarios might be realized using, for example, methodologies like the one described by Kuhlmann et al. (2014). Such scenarios could be provided to planners engaged in traditional scenario planning exercises (e.g., Moats and Dooley, 2008) and incorporated in stochastic programming models (e.g., Kabli and Ntaimo, 2015) designed to support such planning.
2.2. Cell2Fire Growth Simulator
Cell2Fire is an open-source cell-based fire growth simulator developed using Python and C++ for laptop or desktop computers as well as on High-Performance Computer systems. It allows a user to simulate fire growth across a grid that represents a real forest landscape using fire environment variables such as the fuel type, topographic features of each cell, fire ignition points, and weather scenarios. It is composed of three main steps (Figure 1): i) Raw fuel, topography and fire weather data is pre-processed into Cell2Fire's format. ii) Cell2Fire calls an independent fire spread model (e.g., FBP), running multiple simulations including proposed treatment/harvesting plans provided by the user to modify the landscape (i.e., cell fuel types). These plans are then evaluated and results inform forest harvesting and fuel management decision-making. iii) Finally, outputs are generated and returned to the user.
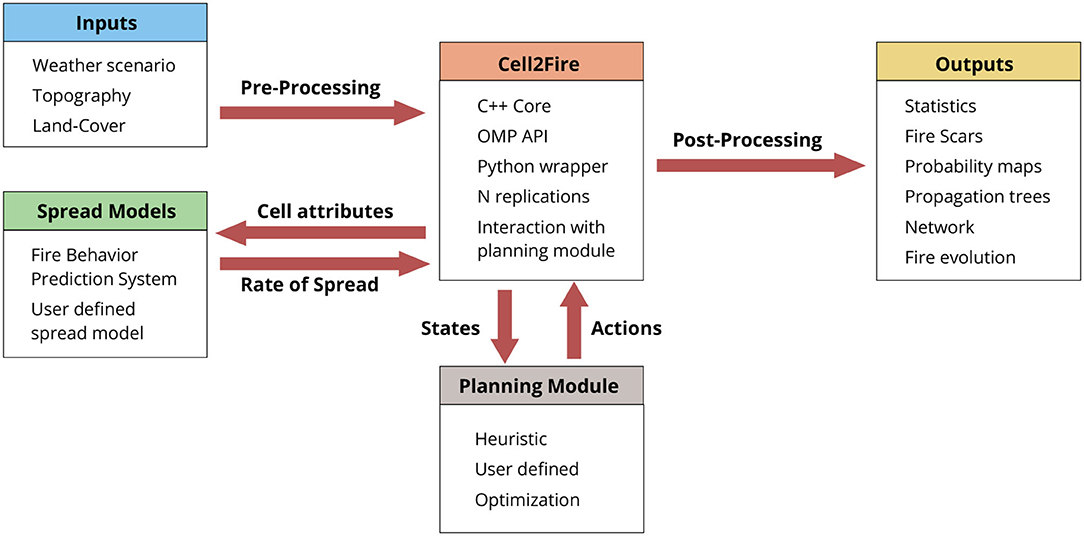
Figure 1. Cell2Fire simulation and optimization framework.
A forest landscape is divided into a rectangular region comprised of rows and columns partitioned into a series of square cells, all of which are the same size. This generates a grid in which the cell size depends on the desired spatial resolution and the granularity of the available data. Each cell represents a specific portion of the landscape and has two information layers that pertain to its topographic and fuel characteristics. Those layers define the characteristics of each cell, allowing the simulator to treat them as individual objects that can interact to model fire growth in highly-scalable parallel implementation. Algorithmically, Cell2Fire simulates the growth of fire by tracking the state of all cells as the model progresses through discrete equally-spaced time steps (e.g., seconds, minutes). The status of the fire and all the cells on the landscape are updated (see Supplementary Section 1 for more details) at the end of every time step. Once an ignition point has been specified, the fire is ignited. During each time step, the fire may spread along the axes emanating from the center of each burning cell to its eight neighboring cells with the rate on each axis imputed from an ellipse that has characteristics and orientation dictated by the fire behavior prediction system and the current weather conditions, respectively. The predicted FBP system Head Rate of Spread (HROS), Flank Rate of Spread (FROS), and Back Rate of Spread (BROS) are used to model elliptical fire growth within each cell with the focus of the ellipse at the center of the cell (details in Supplementary Section 2). The geometry of the ellipse for every burning cell is computed and used to predict fire spread rates along the axes emanating from the center of each cell at each time step. In Figure 2, we observe the elliptical fire spread distribution scheme using the ellipses defined by the Canadian FBP System. At any time t, the backfire will be BROS×t behind the point of ignition and the head fire will be HROS×t ahead of the point of ignition of the fire, expanding the ellipse. Then, if the fire spreading from cell i reaches the center of an adjacent cell j (e.g., cell j = i5 at time t(j)), a new ellipse is generated at time t′>t(j), which triggers a new set of calculations. In this example, the wind direction is assumed to be from the West (i.e., to the right of the main horizontal axis) for simplicity of the exposition. In practice, ellipses are oriented in the main wind direction and are perturbed (in magnitude and orientation) by environmental conditions. Given its dynamic generation at each time step, the model efficiently handles non-uniform conditions such as temporal (e.g., changing wind speed and direction) and environmental (e.g., changes in slope/elevation or fuel type) by perturbing the direction and size of the ellipse according to these conditions. This is translated into different HROS, FROS, and BROS values obtained from the FBP system (and thus, spread rates to any other direction), modifying the fire propagation patterns according to the observed conditions.
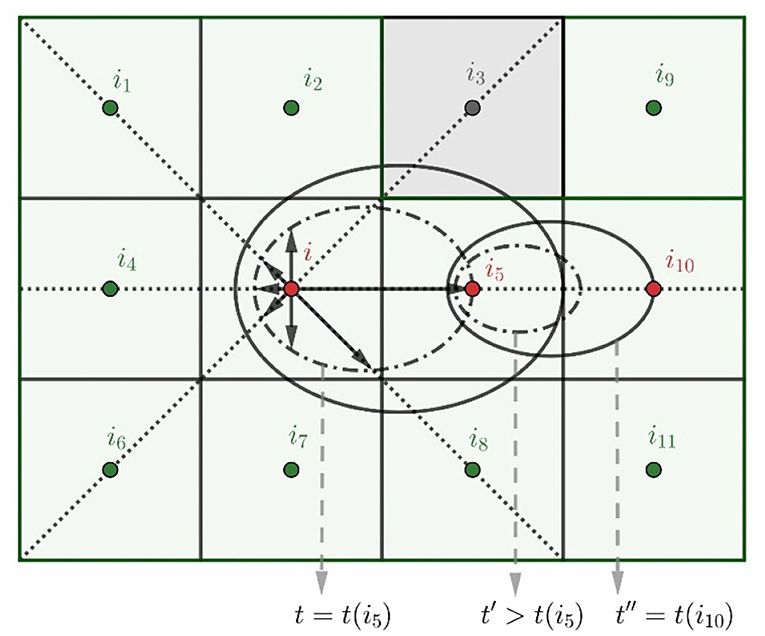
Figure 2. Elliptical fire spread distribution schematic.
If it is determined that fire would spread to the center of an adjacent cell during a simulated time step, the software sends a signal to the adjacent cell, which causes that cell to process a potential ignition, which means that it initiates the calculation of the ROS toward its eight neighboring cells based on its characteristics and the current fire weather (i.e., fire danger rating indices, wind velocity, and slope). In the present implementation, it is assumed that each cell has at most eight adjacent cells (rectangular grid). These are the only neighbors considered because the simulation time step is set small enough to ensure that the fire cannot spread beyond adjacent cells in one time step. Shorter simulation time steps result in longer running times but more accurate spatial (and thus, with incidence in temporal evolution) simulations - see Supplementary Section 4. We note that there is also a simplifying assumption because when fire enters a cell from one of its neighbors, that neighbor's cell characteristics are used to model fire spread within the destination cell until the fire reaches its center. At that point, the characteristics of the destination cell are used to model further fire spread within the destination cell. This approximation results in computational efficiencies because a cell does not have to recognize multiple fuel types.
The main ROS values are calculated by the FBP System module and fire progress is predicted along the available axes. Then, the fire's progress is updated at the end of each fire time period by examining the state of all active burning cells. Once no adjacent cells are available or a burn-out criterion (See assumption (A5) in section 5) has been satisfied, the cell becomes inactive and is excluded from further simulation steps. This process is repeated until a fire weather-related fire-ending event state is reached, i.e., the total number of fire burning periods (e.g., hours) have passed or there are no more cells available to burn.
The simulation logic is presented in Figure 3 which illustrates a forest with 9 cells where no fire has taken place (Initial State). A fire is ignited in cell 4 and it can spread to other cells during the following fire growth periods. If no messages are sent to neighboring cells based on the current environmental conditions (burned-out conditions) or the maximum simulation time for the current fire has been exceeded, the simulation advances to the time the next fire is ignited on the landscape (randomly generated or user-provided) or stop the simulation. A general pseudo-code of the simulation steps is provided in Supplementary Algorithm S1.
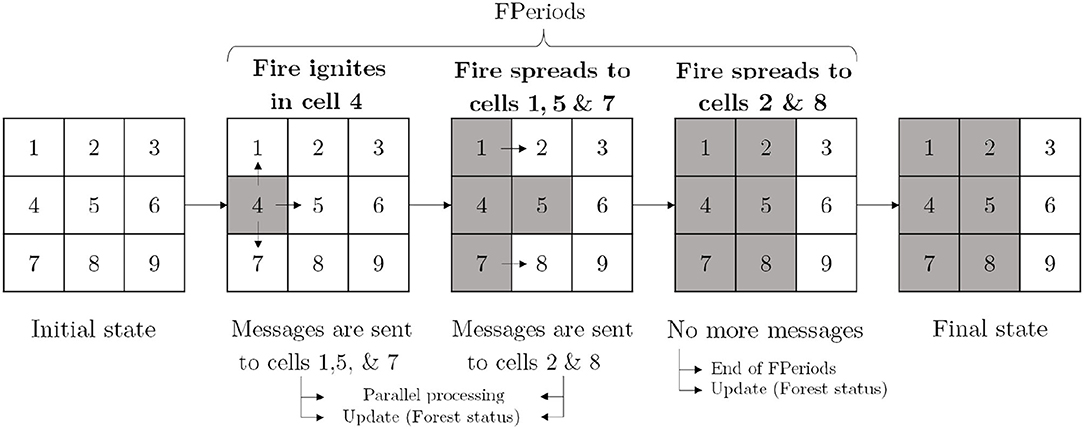
Figure 3. Simulation scheme. The send/receive messages structure facilitates natural parallelization by processing each cell independently. Messages are sent from burning cells (gray squares) to adjacent available cells (white squares) during the fire periods (FPeriods).
2.2.1. Modeling Assumptions
We can summarize the main simplifying assumptions upon which Cell2Fire is based as follows:
A1) The growth of the fire depends on the ROS from burning cells toward their neighboring cells. We assume that a cell is ignited when the fire reaches its center and conditions for burning are met (see A5). Each cell has at most eight neighbors.
A2) The ROS along the eight principal axes of each burning cell are calculated using the Canadian FBP System as functions of the weather, slope, and fuel characteristics of each cell. The major axis of each ellipse is aligned in the HROS direction and the BROS is the opposite direction. The FROS is perpendicular to the HROS/BROS axis. We note that alternative fire spread models could be used in lieu of the Canadian FBP system, as discussed in our Conclusions section.
A3) Each cell that burns serves as a new source of fire. Fire spread occurs at the cellular level and cell size depends on the spatial resolution and corresponding availability of fuel and topography data.
A4) The effect of fire suppression action is not modeled as it is beyond the scope of this paper.
A5) There are two sets of conditions for modeling the termination of fire growth in Cell2Fire: the cellular level and general fire evolution conditions. At a cellular level, each cell becomes unavailable (i.e., burned and can no longer serve as a source of fire) if (i) the cell does not have any adjacent cells that are available to burn; (ii) the residual fuel available in a cell is not sufficient to support fire spread (implicit in the FBP system), or (iii) a user-defined head fire intensity (HFI) threshold is provided and the HFI is below that threshold. Regarding the general fire dynamics, the total duration of the simulated wildfire event is determined by (1) the maximum number of hours of burning per day—a season-dependent constant (Parisien et al., 2005a), or drawn from a probability distribution—and (2) the total fuel remaining (available cells) in the forest (i.e., when it burns out).
2.2.2. Main Inputs and Outputs
As is the case with other state-of-the-art fire growth simulators, the Cell2Fire model requires a number of inputs including a minimum set of data layers that define an instance/forest. The relevant inputs needed to simulate the growth of a fire using Cell2Fire are as follows:
i) Forest raster data: gridded forest attribute files that specify the number of cells in the forest, their geographical coordinates and information concerning each cell including its fuel type, elevation, slope (% and azimuth), and the degree of curing of grass.
ii) Fuel type dictionary: Fuel type codes and descriptions that match the Canadian FBP System fuel types. Custom dictionary files including user-defined fuel types matching an alternative fire spread model can be provided.
iii) Ignition points: An optional file that specifies the cell(s) in which fires are to be ignited during the simulation, paired with their corresponding ignition times.
iv) Weather stream: Interpolated hourly weather records from one or more fire weather stations located near the area of interest. Weather scenarios using the FBP system include the date-time, precipitation, temperature, wind speed/direction, relative humidity, scenario ID, as well as the hourly fire danger rating codes and indices (FFMC, DMC, DC, ISI, BUI, and FWI) of the Canadian Forest Fire Danger Rating System (Taylor and Alexander, 2006) (see Supplementary Table S1 for reference).
Once a simulation run has been completed, the following outputs are available (see sections 2.3 and 3 for examples):
i) Burn-Grids: Files in which 1s indicate burned cells and 0s indicate those cells that have not burned. That data can be used to compare our fire growth predictions with predictions produced by other fire growth simulators as well as to generate burn probability maps, or to generate confidence intervals for cell-specific burn probability estimates.
ii) Plots: Initial forest state, fire scar evolution, and message sending/receiving can be visualized by a series of plots generated after the simulation run has been completed.
iii) Statistics: Final status of the forest with relevant information. This includes shortest propagation paths between burned cells, fire behavior data by time step (e.g., average ROS values, fire length/intensity), expected fire scar perimeter/size/location, and a series of statistics across all tested scenarios (e.g., including multiple ignition points, weather streams).
2.2.3. Comparison Methodology: Fire Growth Validation
In this study, we compare predicted burn scars/perimeters by measuring the difference between fire perimeters generated by Prometheus (baseline) and Cell2Fire simulations using three metrics. The simplest and most widely used full-reference quality metric is the mean squared error (MSE), which objectively quantifies the deviation from a known pattern. However, two distorted images with the same MSE may have very different types of errors, some of which are much more visible than others. Thus, as we are interested not only in the difference of the MSE but also in structural information, we use a measure of similarity suggested in Zhou et al. (2004) and denoted by SSIM (structural similarity index). Finally, we also include the Frobenius norm of the difference between two perimeters X, Y, δnorm = ||X−Y||, focusing on the spatial comparison between fire perimeters.
We compare the evolution of Cell2Fire and Prometheus fire perimeters on a period-to-period basis (where a period represents 1 h) in order to measure the differences in fire propagation rates. We denote by PromGridt a 0-1 Matrix at time t, which represents the fire scar obtained with Prometheus, where is equal to 1 if the cell (i, j) was burned by time t and 0 otherwise. Analogously, we define the fire scar obtained by Cell2Fire as Cell2Gridt. We use the Prometheus fire perimeters as references to validate our fire growth simulation model, comparing it to an acknowledged state-of-the-art simulation model. However, its outputs do not necessarily match historical fire perimeters due to a series of approximations/limitations (e.g., land cover data availability, not incorporating suppression efforts applied during the wildfire, etc.).
Below, , , , and represent the means, standard deviations, and cross-covariance for fire scars Xt and Yt respectively, and C1, C2, and C3, are internal parameters of the metric (Zhou et al., 2004). The methodology is as follows:
1. Choose an ignition point for each instance and run Prometheus for T time periods (e.g., hours). Thus, we obtain Xt = PromGridt, t = 1, ..., T.
2. Choose the same ignition point as above and run Cell2Fire for T time periods obtaining Yt = Cell2Gridt, t = 1, ..., T.
3. Calculate, for all t:
(a) Mean Squared Error Measure:
to measure average of the squares of the pixel differences of the fire scars (with the (i, j) component of the matrix Xt).
(b) Structural Similarity Measure:
to measure the change in structural information between the fire scars obtained from the two simulators: Cell2Fire and Prometheus.
4. Measures analyses: MSE and SSIM over time, t, and δnorm for the final fire scars.
Based on the previous definitions, we observe that larger values of MSE and δnorm indicate larger discrepancies between the pixels of both binary fire scars. A maximum value of 1 (MSE) indicates that one fire perimeter is the negative of the other (i.e., all 0s are 1s and vice versa): no match between the simulations. This is the opposite for SSIM, where the maximum value of 1 indicates perfect similarity between both fire perimeters, i.e., they are identical. However, no single metric is able to completely capture the complexity of comparing images. The evaluation of several complex metrics would be required to capture each relevant aspect, a research topic by itself that it is out of the scope of this research. Therefore, we also rely on a visual analysis to evaluate the performance of the model.
2.3. Wildfire Management
One way to mitigate the impact of fire and protect our communities and natural resources is through Forest Fuel Management (FFM). Activities such as harvesting, prescribed burning, the construction of firebreaks, commercial harvesting, and thinning can reduce the detrimental impact of fire (Loehle, 2004; Agee and Skinner, 2005; Moudio et al., 2021; Pais et al., 2021). In addition, these actions could also benefit the diversity of species (Shinneman et al., 2019) and improve the health of the forest ecosystem, among many other benefits (Finney, 2001; Hirsch et al., 2001; Moghaddas and Craggs, 2008). Land planners face difficult questions concerning what, where, when, and how to manage fuels. Moreover, there are few computational tools that address this challenging problem (Chung, 2015).
In general, for a given planning horizon, planners must decide where to locate a treatment depending on the state of the forest. The condition of the forest depends on the previous efforts of the land managers (e.g., the actions taken during previous years) and possible modifications of the vegetation due to wildfires. Now, where and when the fires will occur and what will be their severity are stochastic events. Therefore, the question we propose to answer is: What fuel management activities might best minimize expected future losses? However, regardless of who or how we make the decisions, we require an efficient modeling framework and computational tool to test the effectiveness of alternative plans.
In the next subsections, we show how Cell2Fire can be used to support the development and evaluation of FireSmart forest management plans, focusing on fuel treatment decision-making. We first indicate how the system works to perform multiple stochastic simulations on the study area, with the purpose of calculating relevant outputs such as Burn Probability maps. Then, we show how the integrated decision-making model is capable of modifying the state of the treated cells (with some predefined policy) and measure the impact on cells affected by fires in multiple replications, allowing the evaluation of the effectiveness of different policies in a quantitative framework. Finally, we discuss how the different outputs of the system can support the decision-making process.
2.3.1. Burn Probability Maps
Burn probability maps (BP-maps) are commonly used to assess the likelihood of burning (Moritz et al., 2005; Parisien et al., 2005b; Ager et al., 2007, 2010; Finney et al., 2011b). Software such as Burn-P3, FSPro, and FlamMap (Parisien et al., 2005b, 2011; Finney et al., 2011b) can calculate these values using fire growth algorithms to produce high-resolution spatial estimates. Burn probability maps of managed landscapes (e.g., landscapes on which simulated fuel treatments have been implemented) can be used to generate baseline estimates of the impact of such treatments that can be compared with fuel treatment plans generated by using more complex approaches such as network-based prioritization metrics and simulation-optimization techniques (Acuna et al., 2010; Russo et al., 2016; Moudio et al., 2021; Pais et al., 2021). We describe how Cell2Fire can be used for such purposes.
The general procedure for calculating a BP-map consists of generating multiple simulations on a landscape, in which on each replication a cell/area is selected at random, and from that point, a simulated fire is generated following given or randomly selected meteorological conditions. For example, Burn-P3 (Probability, Prediction, and Planning) (Parisien et al., 2005a) combines a deterministic fire growth model (Prometheus) and spatial data for forest fuels and topography with probabilistic fire ignitions and spread events derived from historical fire and weather data. The components of the model include the location and frequency of ignitions, the rate at which fires escape the initial attack and become large wildfires, the number of days on which each fire achieves a significant spread rate, the weather conditions associated with these spread event days, and the deterministic fire spread evolution. Other tools with similar features include FlamMap (Finney, 2006) and Fire Spread Probability (FSPro) (Finney et al., 2011a).
In order to produce the BP-maps with our system shown in Figure 4, we use similar methods to the systems just described. The three different sources of uncertainty included are: (1) Ignition point(s) selected via a user-defined probability distribution or a simple uniform approach for each period of the planning horizon. (2) A coefficient of variation (cvROS) capturing the stochastic aspects of the ROS predicted by the fire spread model and accounting for its inherent approximation error, allowing the user to obtain different fire scars by including uncertainty in the fire dynamic. (3) A set of user-generated weather stream files (scenarios) with specific probabilities that can be provided to Cell2Fire, obtaining simulations with different weather conditions such as wind direction/speed, precipitation, among others (Figure 5).
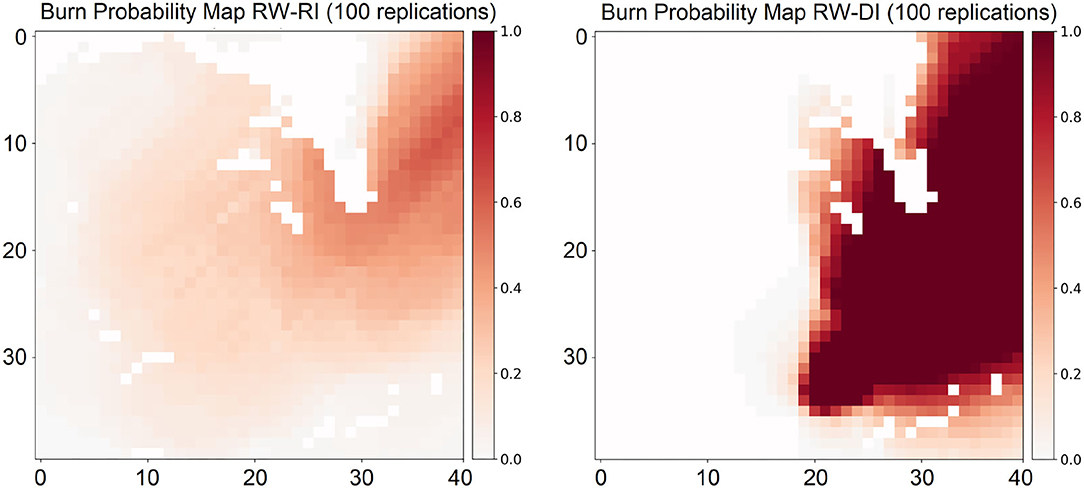
Figure 4. Burn probability maps were generated after 100 independent wildfire replications in a 40 × 40 cells landscape located in the province of Alberta. Maps were generated using random weather scenarios and ignition points (RW-RI, left) and a deterministic ignition (RW-DI, right) illustrate the impact of the stochasticity in the fire growth dynamic. Darker areas indicate higher burn probabilities.
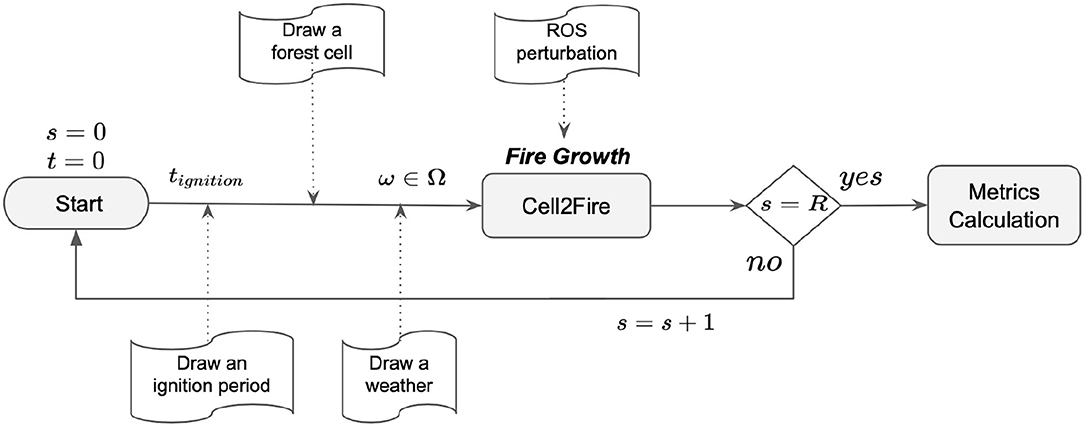
Figure 5. Framework for the inclusion of the different sources of uncertainty in the new system for multiple replications R. The ignition cell j can be specified by the user or generated using a spatial probability distribution. A set of ω∈Ω weather scenarios is provided by the user to simulate scenarios for the study area.
The general scheme is shown in Figure 5. First, we use the ignition locations as a user-defined parameter, giving control over the pattern of ignitions on the landscape. These points can be selected randomly or deterministically before the simulation begins. The latter can model, for example, the lightning strikes over the forest. When lightning strikes a cell i at time t, there is an “ignition probability” (defined by the user) that fire will be ignited. On the other hand, Cell2Fire incorporates a stochastic weather module that draws a weather scenario ω from a set provided by the user, Ω. In addition, users can assign a probability to each scenario in order to generate relevant statistical outputs while providing more flexibility when analyzing the impact of potentially extreme but rare (with low probability) events.
Although the methodologies differ somewhat, all tools incorporate the main components included in our study: random selection of ignition points, selection of weather scenarios, recording of burned cells, and repeating the process a number of times (Figure 5). The main difference with our approach is that these tools do not consider uncertainty in the ROS, therefore, in the event of randomly selecting the same ignition point and the same weather scenario, they produce the same fire scar. In addition, our system can record the cells burned in previous iterations/simulations, since cells have states, unlike Burn-P3 where this information is not recorded as the fire moves on a continuum over the landscape.
2.4. Experimental Instances
We used three sets of fire instances to compare the Cell2Fire simulations with those generated by Prometheus (Table 1). We wanted to avoid introducing comparison bias with respect to real fire scars where the intensity of suppression efforts could be uncertain. The instances are: (1) Dogrib fire landscape in Alberta province, (2) Dogrib fire sub-instances set, and (3) real landscapes in province of British Columbia with hypothetical wildfires. The largest instance from the second set is also used to illustrate the applications of the proposed management module. For the experiments, we used a simulation time step of 1 min.
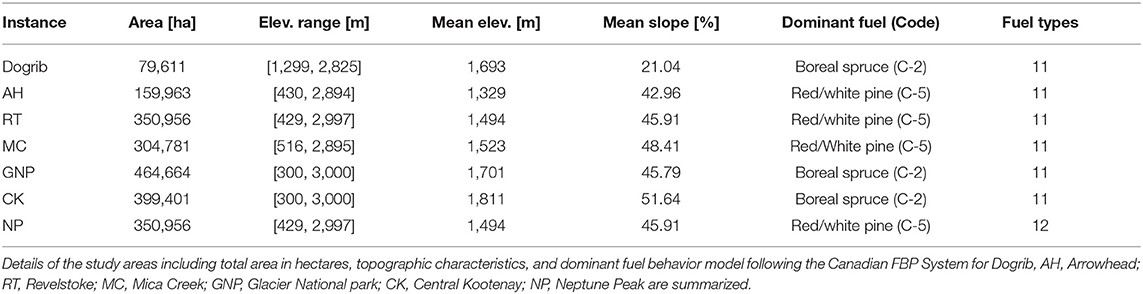
Table 1. Fire instance descriptions.
2.4.1. Dogrib Fire Instance
We chose to model this particular September-October 2001 fire in the province of Alberta due to the vast amount of documentation and observed data available (e.g., weather conditions recorded from The Yaha Tinda Automatic station, and demographic/topographic data collected from the area). It also contained a representative set of different fuel-types documented in the Canadian FBP system (see Figure 6). We divided the landscape into 79,611 1 ha. (100 × 100m) cells, used the Dogrib fire's ignition point located at (51.652876°, –115.477908°) and started growing the fire at 13:00 hrs on October 16, 2001 so as to capture the major fire run (ninety percent of the total 10,216 ha of area burned). The original ignition point is translated into an ignition area (cell) in Cell2Fire at its coordinates. This instance is provided with Prometheus (http://www.firegrowthmodel.ca/prometheus/downloads/Dogrib_v624.zip).
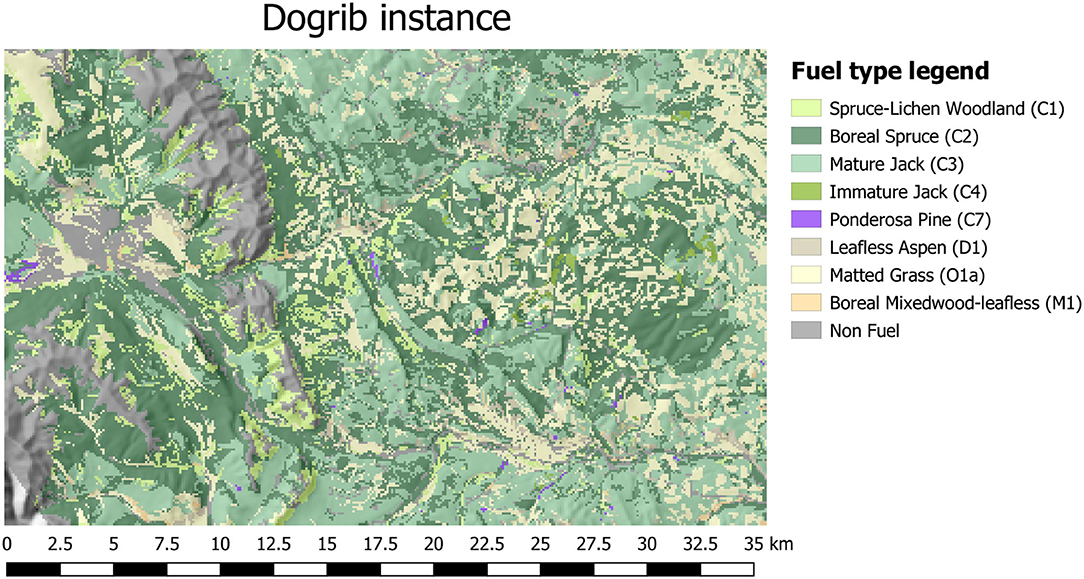
Figure 6. Map of the Dogrib fire instance. The legend indicates the color of the different fuel behavior models (fuel types) characterizing the terrain of the area. A hillshade effect has been applied to depict the elevation of the terrain.
2.4.2. Dogrib Sub-instances
In order to have moderate sized examples available for repetitive testing, we used subsets of the Dogrib landscape data (see section 3.1.3). We generated two sub-instances that we labeled Sub-1 and Sub-2 with a cell resolution of 100 × 100 meters. The first one represents a sub-forest from the Dogrib landscape that is 20 × 20 cells (400 ha) and the second a 40 × 40 cell (1,600 ha) instance. Both consist of heterogeneous landscapes that include different fuel types and non-flammable cells (e.g., mountains or rivers).
An ignition point was selected for each instance as a starting point for the fire growth validation experiments. Three weather stream files: Weather-1, Weather-2, and Weather-3 of 6, 14, and 22 h respectively, were used as inputs. The first file contains data for the 6 h during which the real Dogrib fire made a run (extreme weather conditions). The second and third files contain additional meteorological measurements from the same day of the fire, before and after that spread event. After the ignition point was fixed for both instances, we proceeded to run the simulation in Prometheus and the deterministic version of Cell2Fire, generated the hourly fire perimeters, and calculated the similarity metrics (1-MSE and SSIM).
2.4.3. British Columbia Instances
The British Columbia instances set contains fuel and topography data for five different areas—ArrowHead (265,536 ha), Revelstoke (391,314 ha), Mica Creek (348,404 ha), Glacier Natural Park (559,746 ha), and Central Kootenay (494,665 ha)—of the province. In order to validate our fire growth model, we defined two fires with random ignition points and 24-h weather stream based on the historical weather dataset from the Climate Information Section of the Agriculture and Forestry site for each area and random weather streams generated for comparison purposes. These instances are provided with BurnP3 (http://www.firegrowthmodel.ca/burnp3/software_e.php). We generated subsets of the large forests and simulated fire growth using both Prometheus and Cell2Fire.
2.5. Computational Details
Analysis of the running times reveals that the initial ignition stage is very quick. The sending-messages stage updates the fire progress in every burning cell. Because a large number of cells can be burning at the same time and there are no direct dependencies on neighboring cells, updating the fire progress for each burning cell is easily parallelizable because the calculations for each cell can be done independently. Each cell, in addition to updating its current status, can also “send a burn message” to an adjacent cell. In the receiving messages stage, we analyze the “burn messages” sent to non-burning cells and mark them as burning if the fire start conditions are met. This part is also potentially parallelizable, but because the number of newly burned cells at a single time-step is dwarfed by the number of currently burning cells, we found that a speedup here is of lower priority.
Due to the easily parallelizable structure of our algorithm, the most suitable approach for parallelizing its execution consists of a shared-memory approach using the well-known OpenMP API (Dagum and Menon, 1998). Using OpenMP is advantageous because the code is also optimized for execution on personal computers. It is important is to note that some instances may potentially experience poor parallel performance. The reason behind this behavior is that some combinations of fuel types and forests distributions may lead to a significantly smaller set of simultaneous burning cells per simulation, and thus, the parallelization will not significantly impact the overall execution times.
Comparing the running times of our pure Python prototype and C++ serial implementations with the results obtained using Prometheus on randomly generated homogeneous forests (up to 100M cells), we can see in Figure 7, how Cell2Fire (C++) is significantly faster than Prometheus (up to 30x speedups). We also note that Prometheus is not able to solve our three largest instances (80, 90, and 100 M, due to an “out of memory” error).
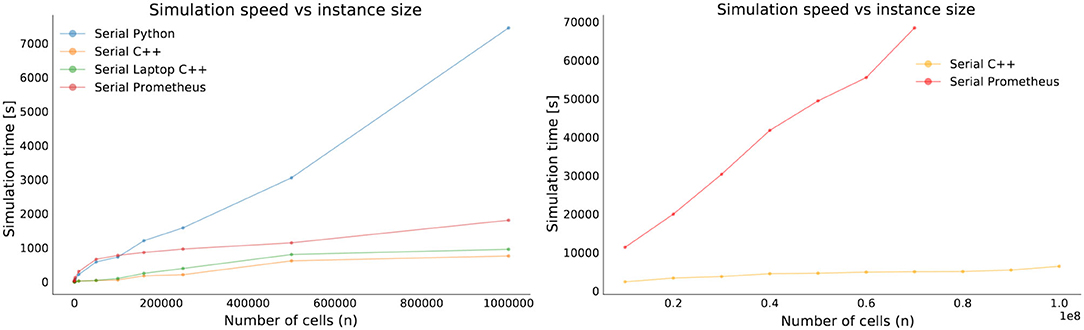
Figure 7. Running time comparisons using Cell2Fire serial versions (pure Python and C++) on a desktop and laptop computers and Prometheus on a desktop computer.
Focusing on the parallel execution of Cell2Fire, we analyze the speedup and strong-scaling efficiency plots for the experimental instances. We observe that our model is able to obtain up to 15x and 20x speedups for the small and large instances respectively, as well as averages strong efficiency factors between 75 and 82%, depending on the size of the forest. In Figure 8 we present the results obtained for the average values among 20 instances with 500,000 cells using our parallel implementation. Similar results were obtained for larger instances.
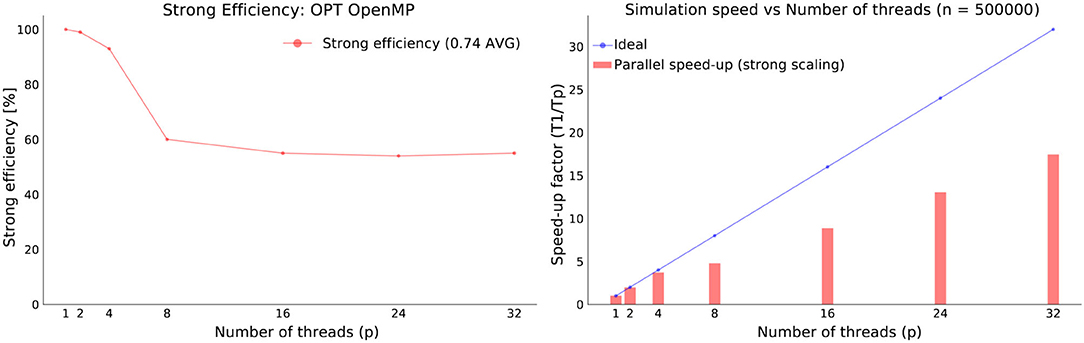
Figure 8. Strong-scaling and speedup factors for Cell2Fire's parallel version n = 500, 000.
Based on all our experiments, adding more threads leads to better execution times following a flat pattern w.r.t. the strong-scaling efficiency. Thus, Cell2Fire is able to obtain a great strong scaling performance (see more details in Supplementary Section 5).
3. Results and Discussion
We begin by describing experiments we carried out to validate our model. This is followed by illustration of the management capabilities and research issues.
3.1. Propagation Validation
In this section we compare the predicted burn perimeters produced by Cell2Fire and Prometheus for several hypothetical fire instances (described in section 2.4) created for this purpose. We did not compare either simulator with the actual fire scars in our study because it is difficult to determine the extent to which the final shapes were influenced by suppression actions.
3.1.1. Sub-instances
Based on the results shown in Figure 9 and Table 2 we can see that Cell2Fire produced results that are similar to the fire scars produced by Prometheus with respect to the hourly fire growth and final fire perimeter. When testing the 6 critical hours of the Dogrib fire, the level of difference (MSE) is <5% for the first sub-instance and <6% for the second sub-instance. For the full day simulation, the differences are slightly larger, reaching average MSE levels values close to 6% and 7 % for the Sub-2 and the Dogrib instance, respectively.
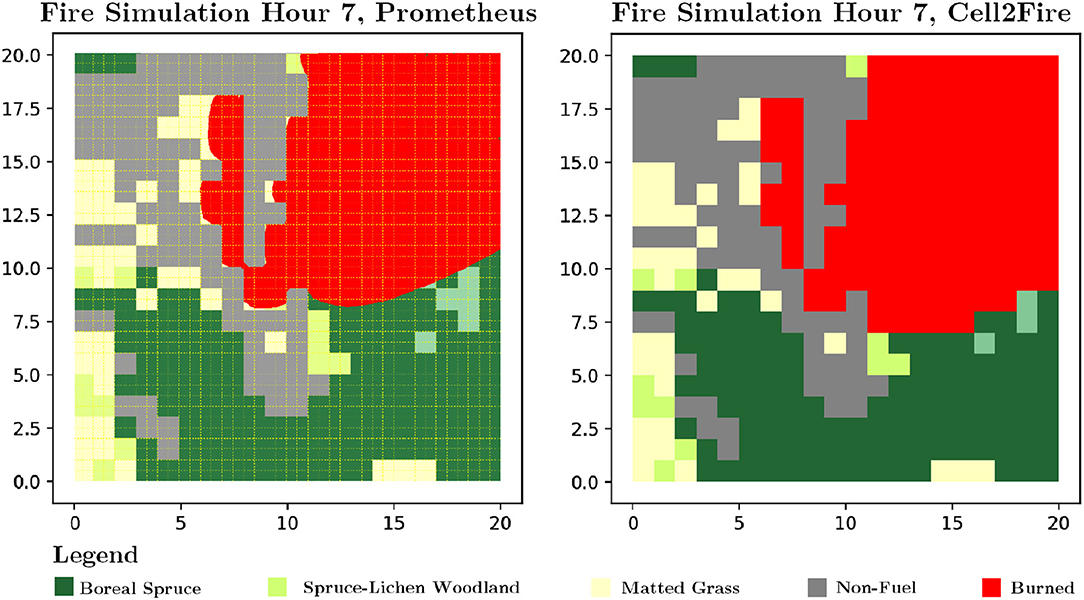
Figure 9. Fire growth visualization for sub-instance 1 using Prometheus and Cell2Fire across a heterogeneous landscape with non-flammable cells (gray cells) and different fuel-types (green and yellow cells).
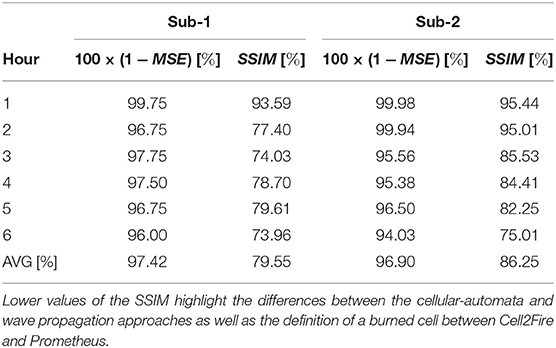
Table 2. Comparison of Cell2Fire with prometheus measured by the complement of the mean squared error (MSE) expressed as percentage and structural similarity index measure (SSIM) values per hour (6 h growth) for two sub-instances.
On the other hand, we do sometimes observe a decrease in the structural similarity measurement (Table 2). The differences are more pronounced when using the 22 h fire weather stream. These deviations indicate that the fire growth predicted by Cell2Fire differs from the one predicted by Prometheus due to: (1) the approximation of the elliptical model using a cellular-automata approach implies a different fire dynamic, increasing the differences in every time step compared to the wavefront model and (2) differences in the calculations/approximations of the effective ROS values.
The wave-propagation model based on the Huygens' principle implemented in Prometheus performs a series of approximations with respect to the burning area. Therefore, a cell is classified as a Burned cell in the Burn Grid output (0–1 Matrix) only if more than 50% of its area has been covered by fire (i.e., belongs to the interior of the approximated ellipse) whereas in Cell2Fire a cell is always either completely available or burned. In addition, an ignition point represents a complete cell in Cell2Fire (an area) while it is just a vertex/point for Prometheus, defining two different (but consistent) starting points for the fire's growth. This approximation based on discrete cells improves as the cell size decreases (i.e., higher resolution data).
3.1.2. The Hypothetical British Columbia Wildfires
The final fire scars and similarity metrics, focusing on the affected area of each fire instance for easier visualization, obtained for the 10 hypothetical British Columbia wildfires using both Prometheus (columns 1 and 3) and Cell2Fire (columns 2 and 4) can be seen in Figure 10. Those results exhibit a high similarity between the scars across the main three metrics for hypothetical fire instances, as demonstrated in Table 3. From the results, we note an average MSE of 9%, with a maximum MSE and minimum SSIM of only 18 and 46%, respectively (Revelstoke 1 instance). High-performance average SSIM and δnorm values of 68 and 27.4% are obtained across all forests, respectively, reflected in very similar final perimeters on all landscapes. The best results were obtained on the Mica Creek 1 instance, with a 3.3% MSE and an SSIM of 85%, means they were almost identical hypothetical wildfires. We note that, in general, Cell2Fire tends to burn more cells than Prometheus. As previously noted, this was expected due to the different approximations used by both approaches to defining a burned cell as well as the ignition point/area.
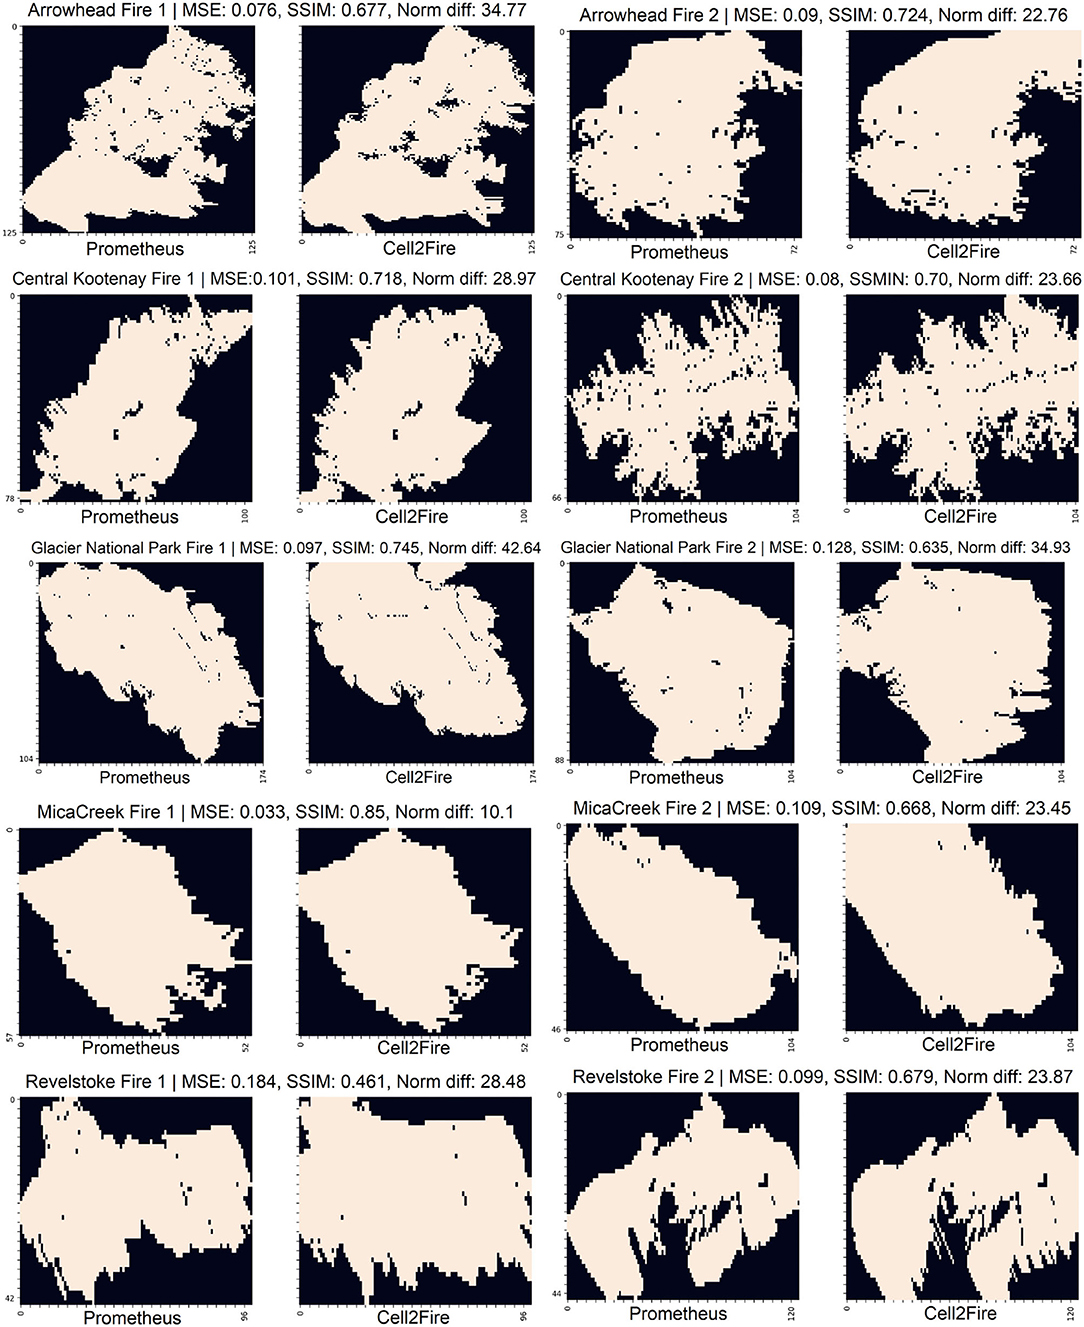
Figure 10. British Columbia hypothetical fire instances. From the final scars and statistics (left side Prometheus and right side Cell2Fire), we see how the Cell2Fire perimeters compare to the fire scars produced by Prometheus, reaching , , .
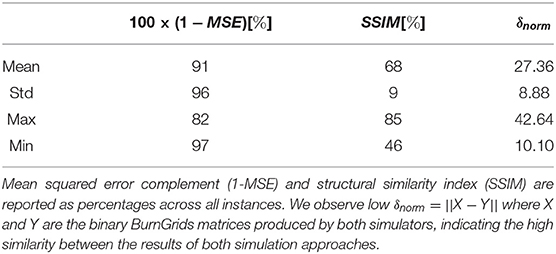
Table 3. British Columbia simulations summary statistics obtained by comparing the simulated final fire perimeters from prometheus and Cell2Fire.
These results indicate that Cell2Fire approximates the results of a state-of-the-art simulator like Prometheus for different fuel types, landscapes, and weather scenarios. Different ignition points and weather scenarios were tested on these landscapes, and produced similar similar results in terms of the main similarity metrics. A similar pattern was observed with respect to the hourly evolution of the fire perimeters.
3.1.3. Dogrib Fire Instance
The comparison of the similarity metrics after 22 h of fire growth is shown in Supplementary Figure S1 and Supplementary Table S2, where both (1−MSE) and SSIM values can be seen for each simulated hour. We observe that Cell2Fire predicted growth very similar to the Prometheus wave-front approach, obtaining good performance when compared with Prometheus, not exceeding a 12% and 18% of difference in both measurements. An average of 87.91% of structural similarity and a global average of 91.82% of accuracy (1-MSE) were obtained during the 22 h of active fire growth. A clear pattern can be seen where both similarity metrics start high and remain stable during the first 4 h of simulated fire growth, then they show a significant negative slope between 4 and 11 h, and finally reach a steady state for the rest of the simulation. The explanation behind these results is clear: during the initial 4 h of the fire, similar fire growth occurs due to weather conditions that are not extreme; however, weather factors between 4 and 11 h exhibit the most extreme conditions (strong wind speed, high temperatures, etc.) magnifying the fire growth differences/approximations between both approaches in terms of the number of burning cells per hour (fire scar). After 11 h, differences between fire scars tend to be stable due to the lack of new extreme weather episodes. However, the structural differences remain in the fire perimeters obtained in the previous hours.
In addition, some of the structural differences between the generated fire scars can be explained in part by modeling features included in Prometheus but not in Cell2Fire such as Breaching, where non-fuel grid cells or linear fuel breaks fail to stop an advancing fire front, a feature that is not currently included in Cell2Fire. We conclude that Cell2Fire produces results that are similar to those produced by Prometheus. The final fire scars are also similar as seen in Figure 11, where the simulated fires (left and right) and the satellite (center) images of the real fire are shown.
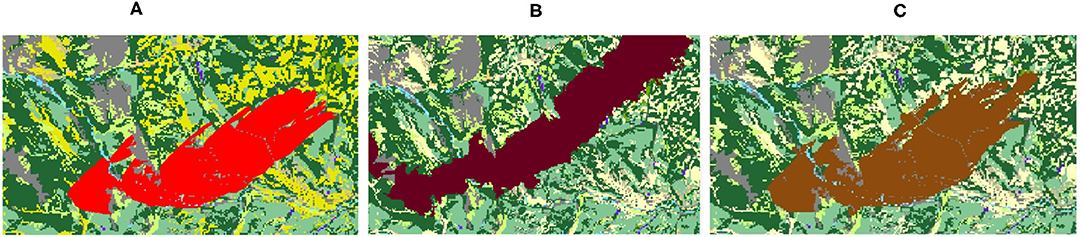
Figure 11. (A) Prometheus fire scar obtained for the region of the Dogrib fire, contrasted with (B) the real fire scar projected into grid format in 2002 and (C) Cell2Fire final output.
3.2. Managing the Landscape
To illustrate the use of the management module we focus on the evaluation of harvesting plans in the 1,600 ha landscape (sub-instance 2) located in the province of Alberta (see Figure 12). This area is characterized by a fragmented land cover distribution, including the same fuel types as in the Dogrib instance (grass, conifers, and non-flammable fuels). For evaluation purposes, we selected the ignition cell randomly for each replication and simulated multiple wildfires using representative weather scenarios obtained from the closest weather stations for a total of 12 h. A second set of experiments using a fixed ignition point is also included for comparison purposes. We compare the outputs and wildfire behavior variables obtained before and after applying three different harvesting schedules to 10% of the available cells: (1) baseline approach harvesting cells completely at random; (2) focus the harvesting on cells with higher burn probability estimated from 100 simulations conducted on the original landscape; and (3) a myopic plan focusing its attention on those cells with higher economic value. We explicitly incorporated wildfire uncertainty by running 100 independent replications for the pre and post-treatment landscapes.
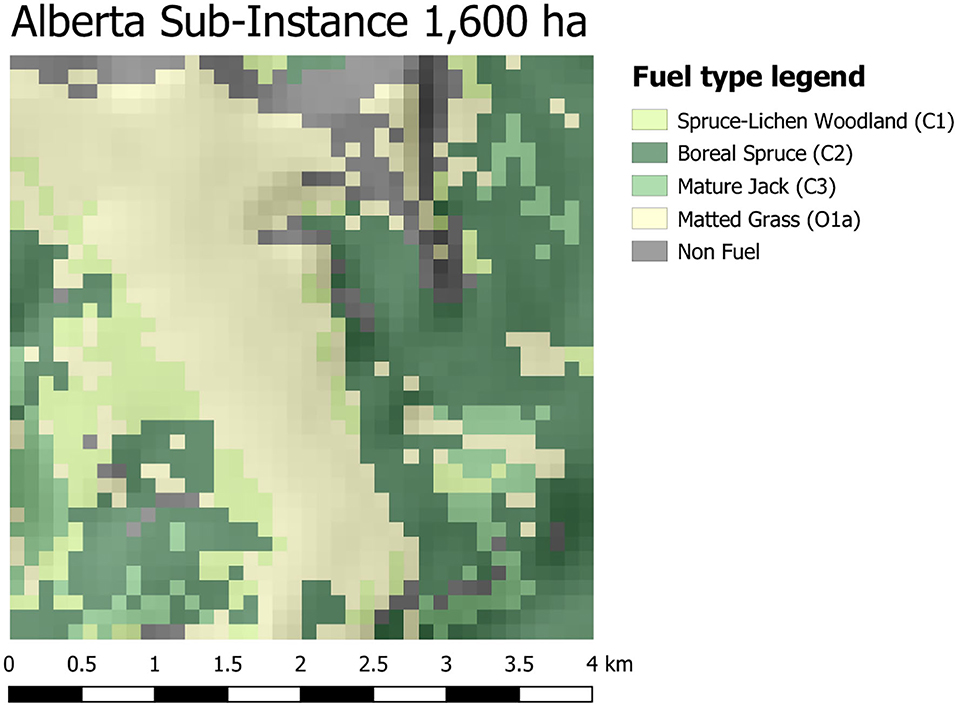
Figure 12. Map of the Alberta Sub-instance. The legend indicates the color of the different fuel behavior models (fuel types) characterizing the terrain of the area. A hillshade effect has been applied to depict the elevation of the terrain.
Multiple outputs are generated to evaluate the performance of the management plans (Figures 13, 14). These outputs include burn probability maps representing the wildfire susceptibility of each cell under the ignition and weather conditions used; ROS heatmaps indicating the average rate of spread over the simulated period as well as highlighting areas of the landscape experiencing high/low propagation rates; a consolidated shortest-path tree (directed network flow graph representing the fire spread dynamics where nodes are the cells of the landscape and edges indicate fire propagation statistics between them) representing the critical, fastest, and most frequent propagation paths of the wildfire on the landscape; and multiple plots and statistics comparing the performance of pre-treatment and post-treatment landscapes given a performance metric such as expected area burned.
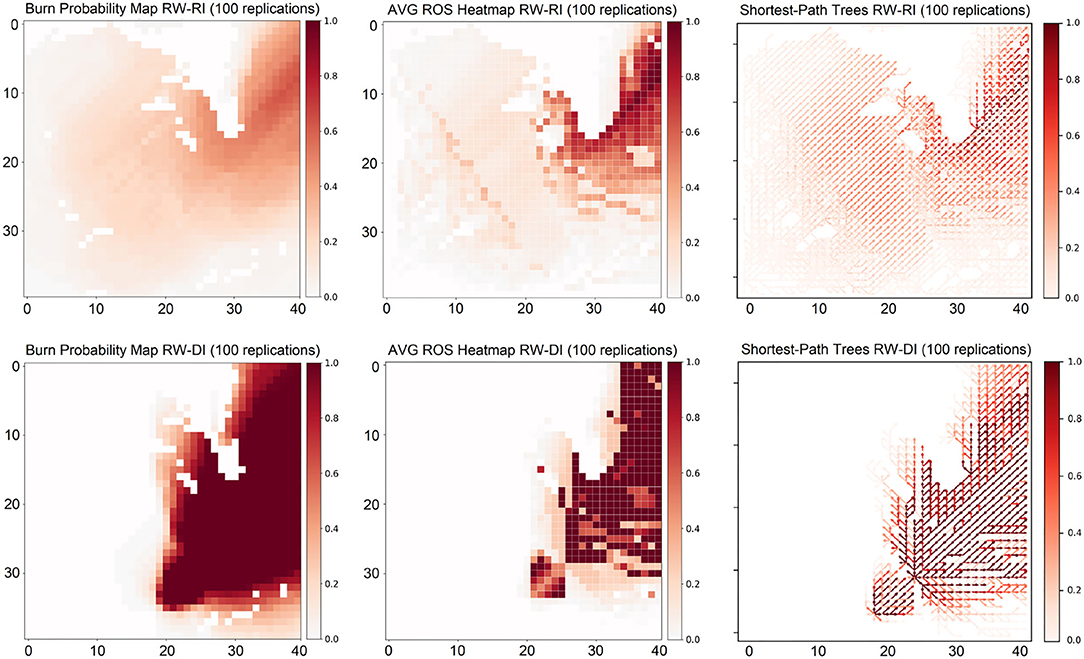
Figure 13. Pre-treatment analysis. Burn probability maps (left), average ROS heatmaps (center), and consolidated shortest-tree paths (right) are generated for the random weather-random ignition (RW-RI) and random weather-deterministic ignition (RW-DI) experiments. Darker areas indicate higher values (normalized).
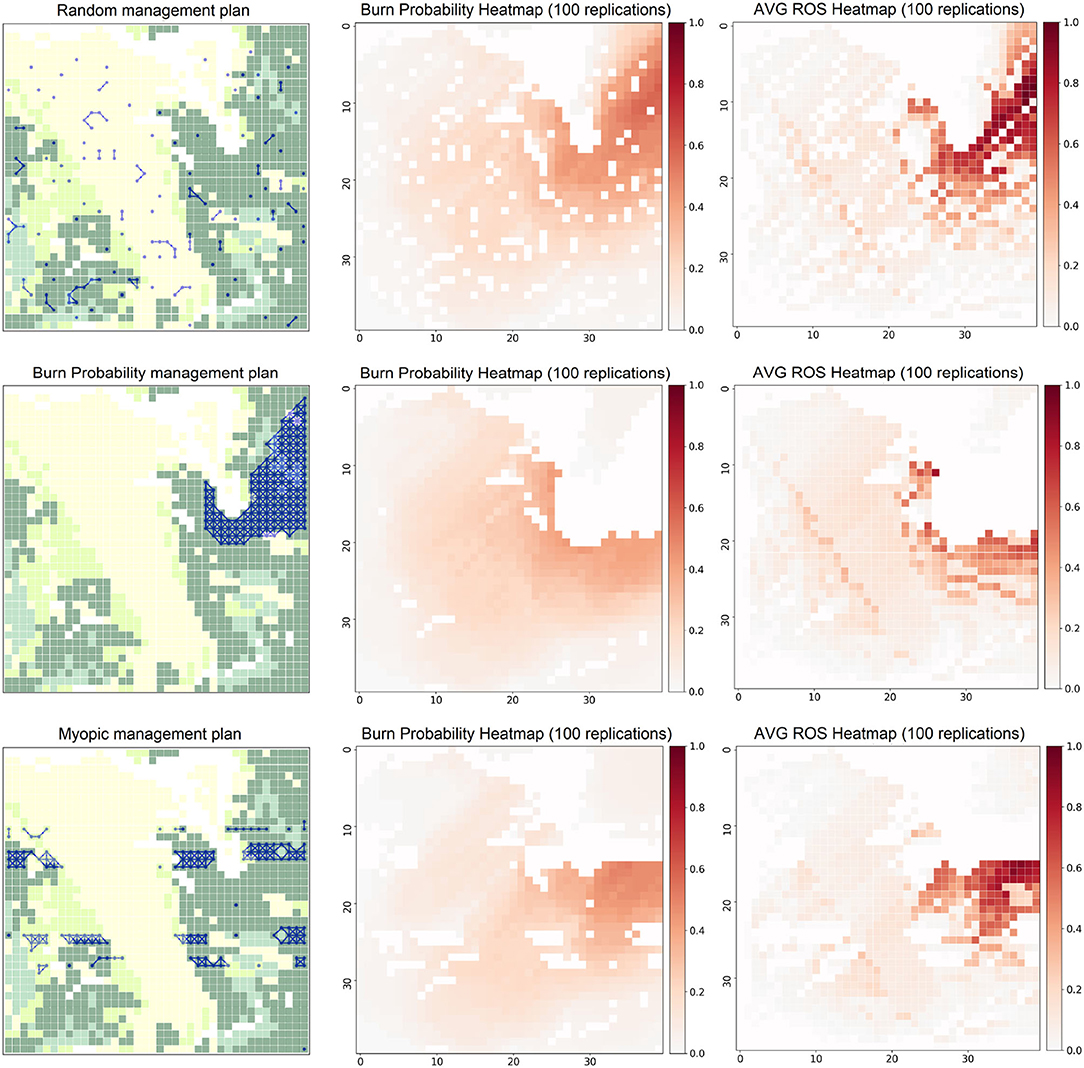
Figure 14. Post-treatment RW-RI experiments. Management plans (left) are generated using different policies to select which cells to harvest (blue dots). Non-flammable cells are represented by white cells for visualization purposes.
From the outputs of the simulations with random weather (RW) on the original pre-management landscape using random ignition (RI) and deterministic ignition (DI) points (Figure 13), we observe areas with higher burn probability values on the top right section of the landscape according to the historical wind direction distribution (northeast). This pattern is exacerbated in the fixed ignition experiments. In this case, we observe that wildfires are not able to reach the western side of the landscape, focusing the spread on the eastern and north-eastern areas. In addition, we note the non-flammable section of the landscape at the top center area of the instance characterized by a chain of mountains, preventing the spread of the fire. Therefore, fixing the ignition point (RW-DI) is translated into a very focused wildfire dynamic on the eastern side of the landscape, with no fires escaping to the western region of the instance. This results in higher ROS average values in several cells on the east given the dominant land cover in the area and a denser shortest-path tree than the one observed in the random ignition (RW-RI) experiments since all fires are condensed in a unique side of the land. Observing the ROS heatmaps, we notice that wildfires reach their maximum ROS on the areas covered by conifers (Boreal Spruce) obtaining average ROS values close to 5 [m/min] and 30 [m/min]; and peak values of 34 [m/min] and 118 [m/min] for the RW-RI and RW-DI experiments, respectively. Finally, the consolidated shortest-path trees highlight the areas where fire tends to propagate (darker zones) observing how the area covered by conifers tends to be actively involved in spreading fire to adjacent regions.
Focusing on the most interesting RW-RI experiments (Figure 14), we observe how these outputs are perturbed after applying different harvesting plans. Burn probability maps (center) and average ROS heatmaps (right) are generated from 100 independent replications to evaluate and compare different metrics for the selected treatment plans. In the case of the random management approach (top row), the uncorrelated fragmentation introduced in the landscape is not an effective measure to reduce fire spread. This is reflected in the expected area burned, which is reduced by only 22.3% compared to the non-treated landscape. In addition, the average ROS is reduced by 17.5% but reaches significant peaks (32.9 [m/min]) in the northeast areas. Moreover, it is not practical (e.g., to move the harvesting equipment across the whole landscape “at random”) and clearly not profitable for the landscape manager. The BP-based plan (center row) improves the impact on the expected area burned, decreasing it by 40%. In addition, it effectively reduces the average ROS by a 37% compared to the non-managed land (with peaks up to 24.5 [m/min]). Still, it may not produce a feasible plan from an economic perspective as it does not consider the revenue layer when selecting the cells to harvest. Finally, we observe how the myopic approach (bottom row) that focuses the harvesting plan on the areas where the most profitable cells are located. However, this may become a limitation of the plan as it does not incorporate wildfire behavior features when selecting the treated areas. Although it decreases the expected area burned by 31%, its limitations are reflected in a limited impact on the peak ROS (30.1 [m/min]) only decreasing it by 10% compared to the pre-treatment state. On the other hand, it has a significant impact on the average ROS 3.1 [m/min], decreasing it by a 38%. This is explained because, in this instance, the most profitable cells match the land covers experiencing higher ROS during the simulations, thus allowing the treatment to be effective in reducing the average ROS values. However, this management plan results in larger variance than the BP-based treatment, exposing the landscape to higher risk levels. Using this framework, planners can easily compare some of the most relevant outputs and evaluate alternative treatment plans in an effective and efficient way (less than one minute) to develop robust and objective management plans.
In addition, given the graph structure of the wildfire propagation patterns generated by the simulator, we can apply a series of complex network algorithms on top of the generated outputs (shortest-path trees) to evaluate the wildfire behavior in the original landscape and the impact of the management plan. As an example, decision makers could calculate metrics such as the average betweenness centrality (BC) (Brandes, 2001) of each cell in the landscape across all replications to identify which nodes have a more active role in the propagation of wildfire to other parts of the land (Figure 15). Alternatively, a degree heatmap indicating the average outgoing degree of each node can be generated, among several others useful metrics. Using this information, managers could decide to modify their initial plans to focus on those critical areas where wildfire tends to propagate faster and more frequently.
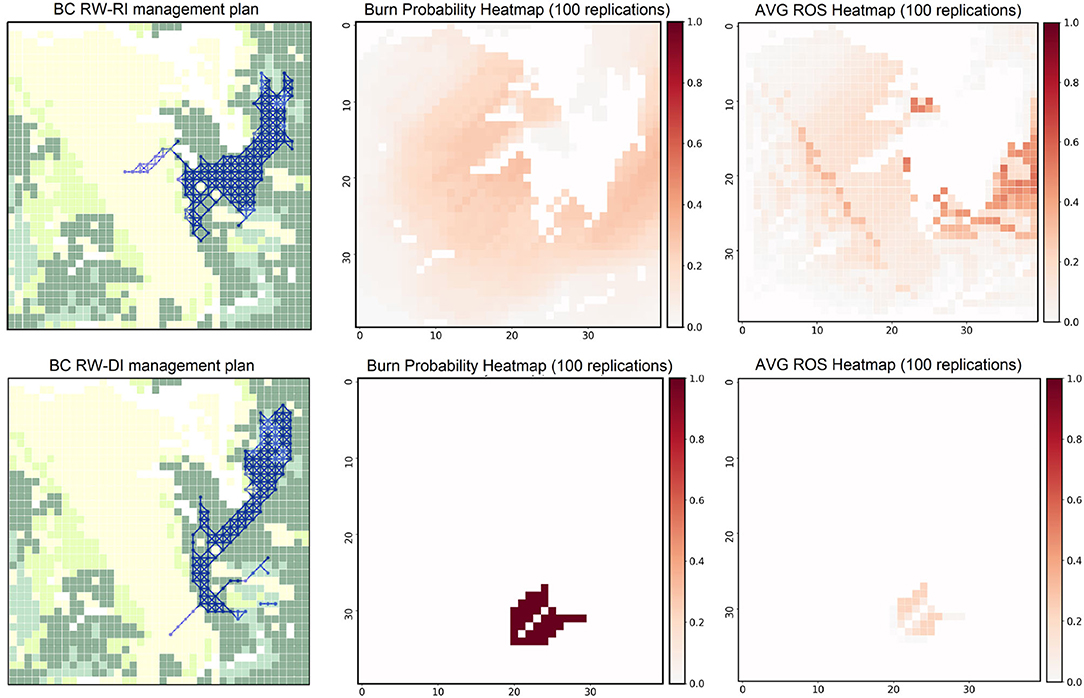
Figure 15. Post-treatment BC plans. Management plans (left) for the RW-RI and RW-DI experiments are generated using BC as the main metric to select which cells to harvest (represented with blue dots). Non-flammable cells are represented by white cells for visualization purposes. Burn probability maps (center) and average ROS heatmaps (right) are generated from 100 independent replications to evaluate and compare different metrics for the selected treatment plans.
Observing the BC-based treatments for the RW-RI and RW-DI experiments (Figure 15), we notice how nodes located in the northeast section of the landscape are selected. They tend to be frequently involved in the fire propagation dynamics, potentially playing a fundamental role to mitigate future expected losses due to large wildfire events in the area. Comparing the pre- and post-treatment simulation results, we observe how the distribution of both heatmaps is impacted: shifting the areas with highest/lowest weights across the landscape; reducing average ROS values by 42% (RW-RI) and 46% (RW-DI); and decreasing the expected area burned by 36% (RW-RI) and 93% (RW-DI). This information could play a crucial role in selecting which areas to allocate future wildfire suppression resources, focusing the efforts on those unprotected or fire-prone areas detected from the generated outputs.
Therefore, we observe how Cell2Fire can be a valuable tool to assist decision-makers when defining landscape management plans. It helps them understand and generates relevant managerial insights regarding which areas of the landscape are more/less prone to future wildfires, the most likely areas to which the fire can propagate after ignition in the treated-landscape, the expected rate of spread/burned area across the available cells, among other relevant information. Perhaps more important, is the support that Cell2Fire can provide to researchers studying methods for forest management planning [practical examples for the interested reader can be found in Moudio et al. (2021) and Pais et al. (2021)]. All this, to support and improve the whole decision-making process, providing an opportunity to analyze the complex and significant trade-offs involved in landscape management under wildfire uncertainty.
4. Conclusions
Researchers can use Cell2Fire to incorporate fire ignition and growth in their strategic harvest planning and fuel management planning models. They can easily test and modify their models to enhance their management plans and identify relevant metrics to capture and actions to mitigate the impact of wildfire uncertainty. In addition, it incorporates a series of out-of-the-box planning heuristics that provide baselines to the decision-makers and a series of complex network algorithms to evaluate the wildfire behavior on the original landscape and the impact of the management plan. We are currently using it in ongoing projects to evaluate harvest planning optimization models.
We used the FBP fire spread model to compare our Cell2Fire simulated fire perimeters (i.e., fire scars) with fire scars produced by a state-of-the-art simulator (Prometheus) for validation purposes. Other fire spread models can also be employed to extend the range of environments in which Cell2Fire can be used. In addition to supporting stochastic ignition and weather, our simulator also supports random sampling of the ROS. Stochastics are a major area of further research. We also plan to initiate research concerning slow fire growth at night as well as spotting which allows fires to jump across unburnable barriers. The software provides support for harvesting and treatment plans to facilitate future research.
The software provides multiple options to evaluate harvesting and fuel treatment plans, including (1) external input of the set of cells to treat every simulated period; (2) selecting one of the heuristics provided by our simulation-optimization model; or (3) implementing their own algorithm. Using the first and third approaches, researchers can evaluate their algorithms for creating management plans under wildfire uncertainty. Given a fixed plan or custom logic, they can simulate multiple wildfires using historical data from the region of interest to evaluate the potential impact of future wildfires in the area, observing the pre and post-treatment results. Alternatively, Cell2Fire incorporates a series of out-of-the-box planning heuristics to provide quick evaluation baselines to the decision makers as well as a guide for users to implement their own logic within the decision-making module.
Starting from one of the simplest and most studied methods (Parisien et al., 2005b), Cell2Fire can generate automatic treatment plans selecting those cells with highest wildfire susceptibility (burn probability maps, Figure 4) based on multiple wildfire replications under the given conditions. It can also select those cells that experience the highest ROS during the simulations, in an attempt to minimize the average ROS within the landscape to decrease the out-of-control wildfire propagation risk. Given an input layer representing the economic value of each cell, e.g., the value of the timber after harvesting a cell, Cell2Fire can generate harvesting plans that select those cells that maximize the total expected revenue based on a set of preliminary simulations. This revenue model can explicitly incorporate wildfire uncertainty by weighting it with a wildfire behavior metric (e.g., burn probability) or it can completely ignore its potential impact (a myopic approach). Alternatively, managers can provide custom metrics as input layers to generate optimal harvesting plans following this same logic. In addition, our decision module is integrated with a powerful network flow package (Hagberg et al., 2008), allowing us to generate a series of management plans based on network/centrality metrics and combine them with user-provided layers to establish landscape utility functions (heatmaps) to be optimized during the simulations. These metrics, that aim to identify the most relevant nodes within a network, could play a crucial role in the development of effective management plans by identifying those critical nodes where the fire tends to propagate faster, more frequently, with the higher intensity, or that maximize the propagation of the fire to multiple areas of the network, among many other relevant measurements. In addition, Cell2Fire provides access to node influence metrics aiming to assess the influence of each node in the network and the potential impact of removing/treating them, sharing concepts of previous works such as Acuna et al. (2010) and Troncoso et al. (2016). Examples of mathematical models to identify and optimize fuel treatment locations, incorporate the role of land-owners in fuel treatment activities via a cost-share approach, and maximize the effectiveness of the initial attack in the context of wildfire suppression can be found in Rashidi et al. (2017), Rashidi et al. (2018), and Bhuiyan et al. (2019). Finally, a random treatment heuristic is included where available cells are selected at random in the landscape, establishing a baseline for comparison purposes. These management plans are flexible, meaning that decision makers can easily modify their main input parameters and add specific constraints to obtain realistic plans. This includes budgetary or maximum area treated constraints, satisfy adjacency/connectivity constraints (selecting a set of continuous or fragmented set of cells to treat), prioritize specific areas (e.g., protected habitats), as well as custom ones provided by the landscape manager (see Moudio et al., 2021; Pais et al., 2021 for an application of this framework).
Because the software is open-source and modular, it lends itself to customization as needed. The simulator is fast and it scales well in parallel computing environments, so it is well-suited for use with large, flammable landscapes and in studies that require many simulations. By adding a highly parallelizable, open-source fire growth simulator to the tool set available, we hope to provide transparent support for ongoing research.
Data Availability Statement
Publicly available datasets were analyzed in this study. This data can be found here: https://github.com/cell2fire/Cell2Fire.
Author Contributions
CP and JC organized the database and wrote the first draft of the manuscript. CP and DW wrote the first version of the software. JC performed the statistical analysis and the decision module. DM, AW, and DW edited the manuscript. All authors contributed to conception and design of the study, contributed to manuscript revision, read, and approved the submitted version.
Funding
This research has been supported by Complex Engineering Systems Institute (CONICYT-PIA-FB0816) and FONDECYT 1191531. JC acknowledges the support of the Agencia Nacional de Investigación y Desarrollo (ANID), Chile, through funding Postdoctoral Fondecyt project 3210311.
Conflict of Interest
The authors declare that the research was conducted in the absence of any commercial or financial relationships that could be construed as a potential conflict of interest.
Publisher's Note
All claims expressed in this article are solely those of the authors and do not necessarily represent those of their affiliated organizations, or those of the publisher, the editors and the reviewers. Any product that may be evaluated in this article, or claim that may be made by its manufacturer, is not guaranteed or endorsed by the publisher.
Acknowledgments
We thank B. M. Wotton and D. Boychuck for their helpful comments and suggestions on an earlier version of this manuscript.
Supplementary Material
The Supplementary Material for this article can be found online at: https://www.frontiersin.org/articles/10.3389/ffgc.2021.692706/full#supplementary-material
References
Acuna, M. A., Palma, C. D., Cui, W., Martell, D. L., and Weintraub, A. (2010). Integrated spatial fire and forest management planning. Can. J. For. Res. 40, 2370–2383. doi: 10.1139/X10-151
Agee, J. K., and Skinner, C. N. (2005). Basic principles of forest fuel reduction treatments. For. Ecol. Manage. 211, 83–96. doi: 10.1016/j.foreco.2005.01.034
Ager, A. A., Finney, M. A., Kerns, B. K., and Maffei, H. (2007). Modeling wildfire risk to northern spotted owl (strix occidentalis caurina) habitat in central oregon, usa. Fo.r Ecol. Manage. 246, 45–56. doi: 10.1016/j.foreco.2007.03.070
Ager, A. A., Vaillant, N. M., and Finney, M. A. (2010). A comparison of landscape fuel treatment strategies to mitigate wildland fire risk in the urban interface and preserve old forest structure. For. Ecol. Manage. 259, 1556–1570. doi: 10.1016/j.foreco.2010.01.032
Alexandridis, A., Vakalis, D., Siettos, C. I., and Bafas, G. V. (2008). A cellular automata model for forest fire spread prediction: the case of the wildfire that swept through spetses island in 1990. Appl. Math. Comput. 204, 191–201. doi: 10.1016/j.amc.2008.06.046
Anderson, D. H., Catchpole, E. A., De Mestre, N. J., and Parkes, T. (1982). Modelling the spread of grass fires. ANZIAM J. 23, 451–466. doi: 10.1017/S0334270000000394
Anderson, H. E. (1982). Aids to Determining fuel Models for Estimating Fire Behavior. General Technical Report INT-122, United States Department of Agriculture Forest Service Intermountain Forest and Range Experiment Station, Ogden, UT.1
Arca, B., Ghisu, T., Casula, M., Salis, M., and Duce, P. (2019). A web-based wildfire simulator for operational applications. Int. J. Wildland Fire 28, 99–112. doi: 10.1071/WF18078
Bakhshaii, A., and Johnson, E. A. (2019). A review of a new generation of wildfire-atmosphere modeling. Can. J. For. Res. 49, 565–574. doi: 10.1139/cjfr-2018-0138
Beverly, J. L., McLoughlin, N., and Chapman, E. (2021) A simple metric of landscape fire exposure. Landscape Ecol. 36, 785–801. doi: 10.1007/s10980-020-01173-8
Bhuiyan, T. H., Moseley, M. C., Medal, H. R., Rashidi, E., and Grala, R. K. (2019). A stochastic programming model with endogenous uncertainty for incentivizing fuel reduction treatment under uncertain landowner behavior. Eur. J. Oper. Res. 277, 699–718. doi: 10.1016/j.ejor.2019.03.003
Bowman, D. M., Moreira-Mu noz, A., Kolden, C. A., Chávez, R. O., Mu noz, A. A., Salinas, F., et al. (2019). Human-environmental drivers and impacts of the globally extreme 2017 chilean fires. Ambio 48, 350–362. doi: 10.1007/s13280-018-1084-1
Boychuk, D., Braun, W. J., Kulperger, R. J., Kroughly, Z. L., and Stanford, D. A. (2009). A stochastic fire growth model. Environ. Ecol. Stat. 16:133–151. doi: 10.1007/s10651-007-0079-z
Brandes, U. (2001). A faster algorithm for betweenness centrality. J. Math. Sociol. 25, 163–177. doi: 10.1080/0022250X.2001.9990249
Chung, W. (2015). Optimizing fuel treatments to reduce wildland fire risk. Curr. For. Rep. 1, 44–51. doi: 10.1007/s40725-015-0005-9
Dagum, L., and Menon, R. (1998). Openmp: an industry standard api for shared-memory programming. IEEE Comput. Sci. Eng. 5, 46–55. doi: 10.1109/99.660313
Finney, M. A. (2001). Design of regular landscape fuel treatment patterns for modifying fire growth and behavior. For. Sci. 47, 219–228.
Finney, M. A. (2004). Farsite: Fire Area Simulator – Model Development and Evaluation. Research Paper RMRS-RP-4, Revised 2004, Ogden, UT: Department of Agriculture, Forest Service, Rocky Mountain Research Station, 47.
Finney, M. A. (2005). The challenge of quantitative risk analysis for wildland fire. For. Ecol. Manage. 211, 97–108. doi: 10.1016/j.foreco.2005.02.010
Finney, M. A. (2006). “An overview of flammap fire modeling capabilities,” in Fuels Management-How to Measure Success: Conference Proceedings. 28-30 March 2006; Proceedings RMRS-P-41, Vol. 41, eds A. L. Patricia and B. W. Bret (Portland, OR; Fort Collins, CO: US Department of Agriculture, Forest Service, Rocky Mountain Research Station), 213–220.
Finney, M. A., Grenfell, I. C., McHugh, C. W., Seli, R. C., Trethewey, D., Stratton, R. D., et al. (2011a). A method for ensemble wildland fire simulation. Environ. Model. Assess. 16, 153–167. doi: 10.1007/s10666-010-9241-3
Finney, M. A., McHugh, C. W., Grenfell, I. C., Riley, K. L., and Short, K. C. (2011b). A simulation of probabilistic wildfire risk components for the continental united states. Stochastic Environ. Res. Risk Assess. 25, 973–1000. doi: 10.1007/s00477-011-0462-z
Forestry-Canada (1992). Development and structure of the Canadian forest fire behavior prediction system. Technical report, Forestry Canada, Headquarters, Fire Danger Group and Science and Sustainable Development Directorate, Ottawa. Information Report ST-X-3.
Ghisu, T., Arca, B., Pellizzaro, G., and Duce, P. (2015). An optimal cellular automata algorithm for simulating wildfire spread. Environ. Model. Softw. 71, 1–14. doi: 10.1016/j.envsoft.2015.05.001
Hagberg, A., Swart, P.S, and Chult, D. (2008). Exploring network structure, dynamics, and function using networkx. Technical report, Los Alamos National Lab. (LANL), Los Alamos, NM.
Hirsch, K., Kafka, V., Tymstra, C., McAlpine, R., Hawkes, B., Stegehuis, H., et al. (2001). Fire-smart forest management: a pragmatic approach to sustainable forest management in fire-dominated ecosystems. For. Chronicle 77, 357–363. doi: 10.5558/tfc77357-2
Kabli, M. G. J. B., and Ntaimo, L. (2015). A stochastic programming model for fuel treatment management. Forests 6, 2148–2162. doi: 10.3390/f6062148
Kourtz, P., Nozaki, S., and O'Regan, W. G. (1977). Forest fires in the computer – a model to predict the perimeter location of a forest fire. Inf. Rep. FF-X- 65 Ottawa, ON: Fish Environ.
Kourtz, P. H., and O'Regan, W. G. (1971). A model for a small forest fire to simulate burned and burning areas for use in a detection model. For Sci 17, 163–169.
Kramer, H. A., Mockrin, M. H., Alexandre, P. M., Stewart, S. I., and Radeloff, V. C. (2018). Where wildfires destroy buildings in the us relative to the wildland-urban interface and national fire outreach programs. Int. J. Wildland Fire 27, 329–341. doi: 10.1071/WF17135
Kuhlmann, C. A., Martell, D. L., Wets, R. J.-B., and Woodruff, D. L. (2014). Generating stochastic ellipsoidal forest and wildland fire scar scenarios for strategic forest management planning under uncertainty. For. Sci. 61, 494–508. doi: 10.5849/forsci.14-065
Loehle, C. (2004). Applying landscape principles to fire hazard reduction. For. Ecol. Manage. 198, 261–267. doi: 10.1016/j.foreco.2004.04.010
Matthew S. C., Keith A. B., Patricia J. C., and Todd M. (2007) Managing Fire Danger in the Forests of the US Inland Northwest: A Classic “Wicked Problem” in Public Land Policy Journal of Forestry, 105, 239–244.
Moats, J. B., C. T. J, and Dooley, L. M. (2008). Using scenarios to develop crisis managers: applications of scenario planning and scenario-based training. Adv. Dev. Hum. Resour. 10, 397–424. doi: 10.1177/1523422308316456
Moghaddas, J. J., and Craggs, L. (2008). A fuel treatment reduces fire severity and increases suppression efficiency in a mixed conifer forest. Int. J. Wildland Fire 16, 673–678. doi: 10.1071/WF06066
Moritz, M. A., Morais, M. E., Summerell, L. A., Carlson, J., and Doyle, J. (2005). Wildfires, complexity, and highly optimized tolerance. Proc. Natl. Acad. Sci. U.S.A. 102, 17912–17917. doi: 10.1073/pnas.0508985102
Moudio, P. E., Pais, C., and Shen, Z.-J. M. (2021). Quantifying the impact of ecosystem services for landscape management under wildfire hazard. Natural Hazards 106, 531–560. doi: 10.1007/s11069-020-04474-y
O'Regan, W. G., Kourtz, P., and Nozaki, S. (1976). Bias in the contagion analog to fire spread. For. Sci. 2, 61–68.
O'Regan, W. G., Nozaki, S., and Kourtz, P. (1973). “A method for using directional rates of spread to predict forest fire configurations. western states section,” in Combustion Institute, WSS/CI Paper, 73–17.
Pais, C., Carrasco, J., Moudio, P. E., and Shen, Z.-J. M. (2021). Downstream protection value: detecting critical zones for effective fuel-treatment under wildfire risk. Comput. Operat. Res. 131:105252. doi: 10.1016/j.cor.2021.105252
Papadopoulos, G. D., and Pavlidou, F.-N. (2011). A comparative review on wild fire simulators. IEEE Syst. J. 5:233–243. doi: 10.1109/JSYST.2011.2125230
Parisien, M., Kafka, V., Hirsch, K., Todd, B., Lavoie, S., and Maczek, P. (2005a). Using the burn-p3 Simulation Model to Map Wildfire Susceptibility. Canadian Forest Service Report NOR-X-405, Edmonton AB.
Parisien, M.-A., Kafka, V., Hirsch, K., Todd, J., Lavoie, S., Maczek, P., et al. (2005b). Mapping Wildfire Susceptibility With the burn-p3 Simulation Model. Natural Resources Canada, Canadian Forest Service, Northern Forestry Centre, Information Report NOR-X-405, Edmonton, AB.
Parisien, M.-A., Parks, S. A., Miller, C., Krawchuk, M. A., Heathcott, M., and Moritz, M. A. (2011). Contributions of ignitions, fuels, and weather to the spatial patterns of burn probability of a boreal landscape. Ecosystems 14, 1141–1155. doi: 10.1007/s10021-011-9474-2
Peter, B., Milovanovic, M., Cataldo, N., and Scott, M.. (2016) On-reserve forest fuel management under the Federal Mountain Pine Beetle Program Mountain Pine Beetle Initiative. The Forestry Chronicle, 92, 295–297.
Radeloff, V. C., Helmers, D. P., Kramer, H. A., Mockrin, M. H., Alexandre, P. M., Bar-Massada, A., et al. (2018). Rapid growth of the us wildland-urban interface raises wildfire risk. Proc. Natl. Acad. Sci. U.S.A. 115, 3314–3319. doi: 10.1073/pnas.1718850115
Rashidi, E., Medal, H., Gordon, J., Grala, R., and Varner, M. (2017). A maximal covering location-based model for analyzing the vulnerability of landscapes to wildfires: assessing the worst-case scenario. Eur. J. Oper. Res. 258, 1095–1105. doi: 10.1016/j.ejor.2016.08.074
Rashidi, E., Medal, H., and Hoskins, A. (2018). An attacker-defender model for analyzing the vulnerability of initial attack in wildfire suppression. Naval Res. Logist. 65, 120–134. doi: 10.1002/nav.21792
Richards, G. D. (1990). An elliptical growth model of forest fire fronts and its numerical solution. Int. J. Numer. Math Eng 30:1133–1149. doi: 10.1002/nme.1620300606
Rothermel, R. C. (1972). A Mathematical Model for Predicting Fire Spread in Wildland Fires. USDA Forest Service Research Paper INT, U.S. Department of Agriculture, Intermountain Forest and Range Experiment Station, Ogden, UT.
Russo, L., Russo, P., and Siettos, C. I. (2016). A complex network theory approach for the spatial distribution of fire breaks in heterogeneous forest landscapes for the control of wildland fires. PLoS ONE 11:e0163226. doi: 10.1371/journal.pone.0163226
Sanderlin, J. C., and Sunderson, J. M. (1975). A simulation for wildland fire management planning support (fireman). Vol. 2. Prototype models for FIREMAN (Part II): Campaign fire evaluation Mission Research Corp. Contract 21-343, Spec. 222, 2:249.
Scott, J. H., and Burgan, R. E. (2005). Standard Fire Behavior Fuel Models: a Comprehensive Set for Use With Rothermel's Surface Fire Spread Model. General Technical Report RMRS-GTR-153, United States epartment of Agriculture Forest Service, Fort Collins, CO.
Shinneman, D. J., Germino, M. J., Pilliod, D. S., Aldridge, C. L., Vaillant, N. M., and Coates, P. S. (2019). The ecological uncertainty of wildfire fuel breaks: examples from the sagebrush steppe. Front. Ecol. Environ. 17:2045. doi: 10.1002/fee.2045
Stocks, B. J., and Martell, D. L. (2016). Forest fire management expenditures in Canada: 1970-2013. For. Chronicle 92, 298–306. doi: 10.5558/tfc2016-056
Taylor, S. W., and Alexander, M. E. (2006). Science, technology, and human factors in fire danger rating: the canadian experience. Int. J. Wildland Fire 15, 121–135. doi: 10.1071/WF05021
Todd, B. (1999). User Documentation for the Wildland Fire Growth Model and the Wildfire Display Program. Edmonton, AB: Fire Research Network, CFS.
Troncoso, J. J., Weintraub, A., and Martell, D. L. (2016). Development of a threat index to manage timber production on flammable forest landscapes subject to spatial harvest constraints. INFOR Inform. Syst. Operat. Res. 54, 262–281. doi: 10.1080/03155986.2016.1197543
Tymstra, C., Bryce, R. W., Wotton, B. M., Taylor, S. W., and OB, A. (2010). Development and Structure of Prometheus: The Canadian Wildland Fire Growth Simulation Model. Information Report NOR-X-Edmonton (AB), Natural Resources Canada, Canadian Forest Service, Northern Forestry Centre, Edmonton, AB.
Tymstra, C., Stocks, B. J., Cai, X., and Flannigan, M. D. (2020). Wildfire management in canada: review, challenges and opportunities. Progr. Disaster Sci. 5:100045. doi: 10.1016/j.pdisas.2019.100045
Van Wagner, C. E., and Pickett, T. L. (1987). Development and Structure of the Canadian Forest Fire Weather Index System. Technical Report 35, Canadian Forest Service, Forestry, Ottawa, ON.
Westerling, A. L. (2016). Increasing western us forest wildfire activity: sensitivity to changes in the timing of spring. Phil. Trans. R. Soc. B 371(20150178). doi: 10.1098/rstb.2015.0178
Keywords: forest fire spread, FireSmart forest management, fire growth simulation, wildfire, cellular-automata, data-driven decision making
Citation: Pais C, Carrasco J, Martell DL, Weintraub A and Woodruff DL (2021) Cell2Fire: A Cell-Based Forest Fire Growth Model to Support Strategic Landscape Management Planning. Front. For. Glob. Change 4:692706. doi: 10.3389/ffgc.2021.692706
Received: 09 April 2021; Accepted: 06 October 2021;
Published: 16 November 2021.
Edited by:
Yu Wei, Colorado State University, United StatesReviewed by:
George Mitri, University of Balamand, LebanonMarc McDill, The Pennsylvania State University (PSU), United States
Copyright © 2021 Pais, Carrasco, Martell, Weintraub and Woodruff. This is an open-access article distributed under the terms of the Creative Commons Attribution License (CC BY). The use, distribution or reproduction in other forums is permitted, provided the original author(s) and the copyright owner(s) are credited and that the original publication in this journal is cited, in accordance with accepted academic practice. No use, distribution or reproduction is permitted which does not comply with these terms.
*Correspondence: David L. Woodruff, ZGx3b29kcnVmZkB1Y2RhdmlzLmVkdQ==