 Ayumi Kotani
 Nagai Shin2
 Shunsuke Tei
 Andrey Makarov
 Tuyara Gavrilyeva
- 1Laboratory of Forest Hydrology and Disaster Mitigation Sciences, Graduate School of Bioagricultural Sciences, Nagoya University, Nagoya, Japan
- 2Research Institute for Global Change, Japan Agency for Marine-Earth Science and Technology (JAMSTEC), Yokohama, Japan
- 3Department of Forest Management, Forestry and Forest Products Research Institute, Tsukuba, Japan
- 4Institute of Engineering and Technology, North-Eastern Federal University, Yakutsk, Russia
The phenology of berry-producing plants, particularly their harvest season, is of human interest and also reflects the ecosystem’s response to the changing environment. We investigated the seasonal dynamics of human interest in berries growing in boreal, subarctic and Arctic ecosystems, mainly in Russia, based on internet search data via Google Trends. There is a typical and culture-specific pattern of seasonal variations in search volume concerning berries across Russia, Finland, and Canada. Generally, the seasonal peak of search corresponds to the common berry harvest season across these countries. We discussed the potential and limitation for detecting ecological factors from the internet search data, in which physical phenomena and socio-cultural aspects are fundamentally superimposed, and its applicability to phenological studies.
Introduction
Plant phenology, or seasonality, can affect human behavior in various ways, reflecting human interaction with specific plants (Platton and Henfrey, 2009; Spark et al., 2012). Wild berries growing in the boreal, subarctic and Arctic ecosystems benefit both humans and wildlife (e.g., Nestby et al., 2019). They are part of essential ecosystem services and provide material resources such as non-wood forest products (e.g., Turtiainen and Nuutinen, 2012; Sorrenti, 2017) and social–cultural services of recreation, culture, and livelihoods when harvested by rural and urban residents (Kangas and Markkanen, 2001; Stryamets et al., 2015). During the harvest period of the wild berries—which ranges from early summer to autumn, depending on species—they are foraged for both self-consumption and sales, with accompanying outdoor activity and seasonal jobs (e.g., Kolosova et al., 2020). Which berries are eaten raw, or processed and preserved for winter, depends on the species and culture of the region. Ongoing and projected climate changes in high latitudes may, however, change these functions as plants respond to a changing environment (Gauthier et al., 2015). Although the extended growing season may improve yields (Holmberg et al., 2019), the sensitivity of these plants to climate and environmental changes (Boulanger-Lapointe et al., 2017; Anderson et al., 2018; Herman-Mercer et al., 2020) may lead to changes in the areas where they are found. The influence of climate change on berry abundance has been recognized by local residents in northeastern Siberia (Ksenofontov et al., 2018) and Alaska (Hupp et al., 2015). Therefore, mapping and monitoring berry plants, and especially their fruiting phenology, are essential to understand and predict the human–nature interaction in this region.
Various methods are used to observe spatial and temporal variation in terrestrial ecosystem phenology. Satellite and UAV remote sensing observation is practical in monitoring ecosystem dynamics for extending space and temporal scales (e.g., Klosterman et al., 2018). It is, however, difficult to monitor the fruiting of shrub and forest floor vegetation that is shaded by overstory canopies or by its own stems and branches with these technologies, and in situ observation (i.e., field survey and fixed-point time-lapse images) is needed (Nagai et al., 2018). Even coverage across extended boreal regions is prevented in remote sites that are difficult to access. An alternative source of ecological information has been the use of social sensing data (Barve, 2014; Silva et al., 2018). Massive databases have been created by diverse crowd users who have acted as sensors by posting their experiences and interest in environmental phenomena, including vegetation dynamics, thereby extending and popularizing internet-based platforms worldwide (Kirilenko et al., 2015; Lopez et al., 2019). This information records environmental changes in real time.
One example of a social sensing data source of human interest is Google Trends (GT) (Google Inc.), which provides internet search statistics. These record how often users search for a particular term via Google over a specific period and geographical region, and cover fields such as business marketing, public health, tourism, and communication (e.g., Jun et al., 2018). In the fields of ecology and environmental research, published studies have focused on the trend of human interest in bio-environmental issues with temporal variations in searched keywords, such as “climate change,” “biodiversity,” “wildlife,” and “conservation” (Ficetola, 2013; Mccallum and Bury, 2013; Nghiem et al., 2016; Brodeur et al., 2018). Interest in specific plants and animals that may harm people, such as plant species with allergenic pollen (Bousquet et al., 2018; Hall et al., 2020), mosquitoes, invasive species (Proulx et al., 2014), and rodent outbreaks (Szymkowiak and Kuczyński, 2015) are reflected in the spatial and temporal variation in internet searches. Interest in organisms such as fireflies and beetles (Takada, 2012), and flowering times and autumn leaf coloring, also has seasonality. Seasonal variations in biological processes, therefore, will be available in the internet search data.
This study aimed to explore the potential of using internet search data to understand the temporal dynamics of berry plants, which are of human interest as seasonal delicacies, as part of recreation activities, and sometimes for subsistence. We investigated the temporal variation in human interest in berries in Russia via GT, focusing on its seasonality and regional differences in Russia and other countries such as Finland and Canada. We considered the socio-cultural and geographical background of GT data in discussing the benefits and limitations of internet search data for phenological studies.
Materials and Methods
GT1 provides a time series of relative search volume (RSV), which indicates a ratio of the number of queries—including examined keywords—to the total number of queries sent from a specific location (selectable from worldwide/national/state/city) from 2004. The value of RSV ranges from 0 to 100, owing to normalization, to set the maximum in an investigated period to 100, and RSV = 0 when the number of queries is less than a certain threshold (Stephens-Davidowitz and Varian, 2015). The magnitude of RSV is not in proportion to the number of queries. RSV is calculated with a sample taken from the total Google search corpus, which consists of “billions of searches per day” and is cached every day (Stephens-Davidowitz and Varian, 2015). Hereafter, terms in italics indicate those originally used in GT.
There are two ways of searching GT: search term and search topic (details are given in the Supplementary Text). In this study, we conducted GT searches mainly in the search topic option, with the topic of “Plants” to filter out queries not relevant to berries as a plant (e.g., trade names, titles of movies and books, and place names). The terms we examined were given in English (search topic option is executed for any language, as noted in the Supplementary Text). We checked the related queries (given in corresponding languages, i.e., Russian, Finnish, and English, for Russia, Finland, and Canada, respectively) and related topics (given in English) attributed to the examined keyword. GT returned them with a relative score; the most frequently searched query and topic were given 100.
We analyzed the period from 2011 to 2020 as there was a noisy time series of RSV for the examined terms in Russia before 2011, probably owing to the improved geographical assignment of GT data collection system from January 1, 2011 (i.e., localization of search volume; Bokelmann and Lessmann, 2019). We found there was a reduced share of each keyword, as search populations expanded and diversified owing to the popularization of internet use worldwide (Stephens-Davidowitz and Varian, 2015); this has been particularly remarkable in searches on science and environmental issues (Ficetola, 2013; Nghiem et al., 2016). We applied corrections to RSV, as proposed by Nghiem et al. (2016), in which RSV was normalized with several benchmark terms, and found no evidence of effect from the changing search population (details are given in the Supplementary Material). Thus, we assumed that the uncertainty due to technical problems in the search engine (as noted above) might be minimized by analyzing a recent decade, and so we analyzed the GT data without correction.
The calculation time steps depend on the analysis period: hourly data available for the last 7 days; daily data for < 270 days; weekly data for < 5 years; and monthly data for longer than 5 years (confirmed in February 2021). To detect seasonal patterns in RSV, we used the RSV of each year from January to December at weekly intervals (i.e., N = 52 or 53 per year). As a result, we were able to obtain normalized seasonal variation, in which each year’s seasonal peak took a maximum of RSV = 100. Although the time series of daily and monthly RSV intervals could also be obtained from the analyzed period (Supplementary Text), we chose to use weekly data to detect plant phenology because of the tradeoff between temporal resolution and noise contamination. Execution of GT was carried out using the R package GTrendR (Massicotte and Eddelbuettel, 2020) on March 6 and 7, 2021. We based GT data collection on standard time (not local time) because of its negligible effect on seasonal analysis.
We examined 10 terms for berry plants that are popular and generally used in Russia (Strakhov and Pisarenko, 1996) and in Nordic countries (Hjalmarsson and Ortiz, 2001; Li et al., 2016): lingonberry, cranberry, bog bilberry, European blueberry, currant, gooseberry, cloudberry, raspberry, honeysuckle, and sea buckthorn (Table 1). The ripening season of these berries ranges from July to October depending on species and region (Table 1). Google search frequency for these terms was relatively higher in Russia than in other countries (Table 1). Common names were examined in our GT analysis rather than scientific names. The single exception was for the term “gooseberry,” which did not return corresponding Russian queries, however, when we examined its scientific name, Ribes uva-crispa, accurate results were returned. In the case of “raspberry” searches, the topic “Fruit” instead of “Plants” was the applicable search topic option. These 10 terms were also examined for Finland and Canada and compared in terms of the 10-year mean RSV ensemble. When considering habitat distribution of common species, in the case of Canada we replaced “bog bilberry” and “European blueberry” with “bilberry” and “blueberry,” respectively.
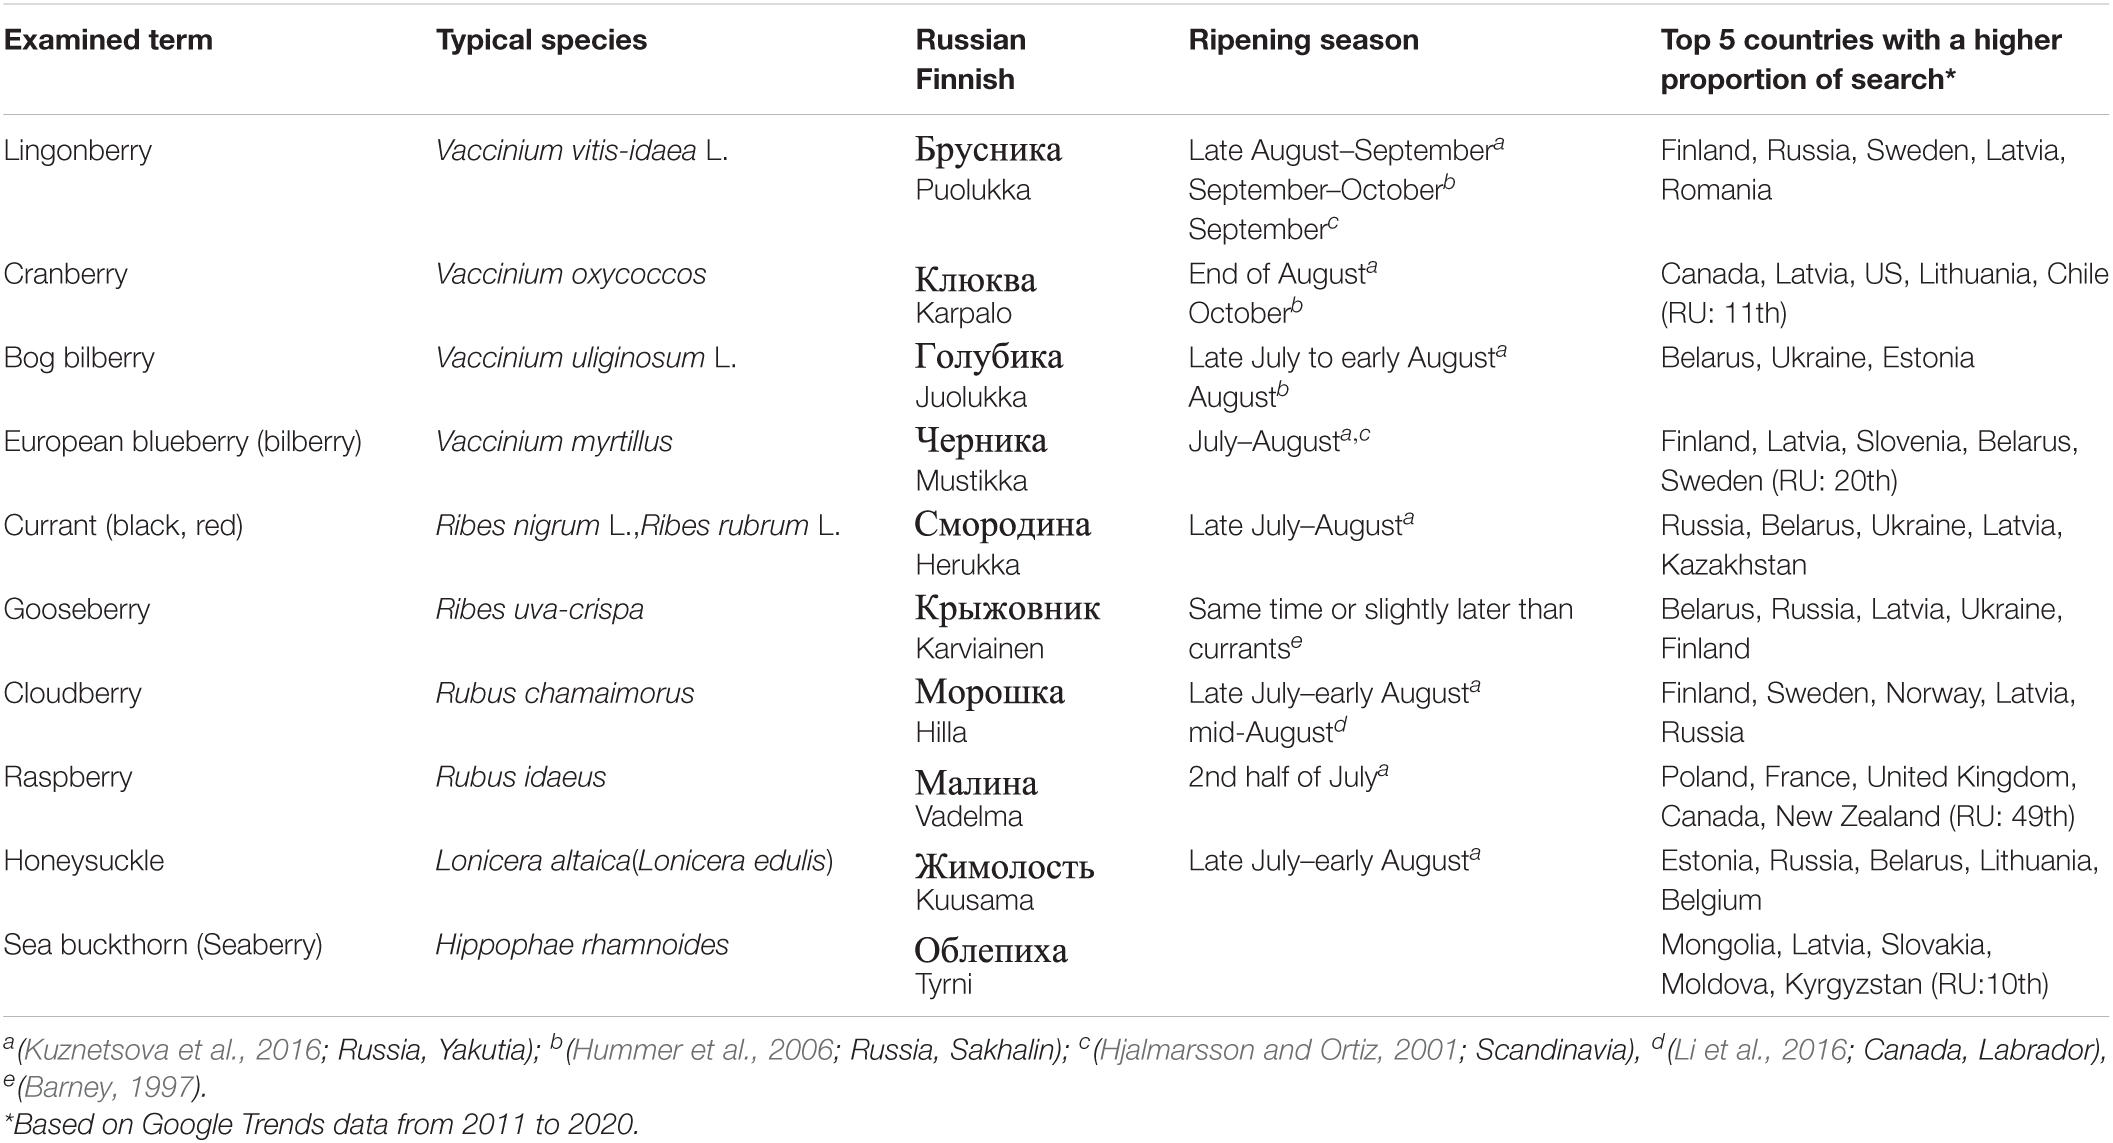
Table 1. List of examined terms.
Results
Search Results
Supplementary Table 1 shows a list of queries for the examined keywords by a search topic option. Names of the berry in question, in the language of the corresponding country, were found in the most popular queries. An exception was found in results for raspberry, in which English word “raspberry” and “raspberry pi” (expected being trade name of the computer released in 2012) got a higher score than the Russian term “малина (raspberry)” (of the third frequent query with a score of 14). These queries were not excluded, even by the search topic option. Generally, other irrelevant queries found in a search term option (Supplementary Table 2) have been excluded in Supplementary Table 1; for example, the name of a company like “брусника екатеринбург (Lingonberry Ekaterinburg)” for lingonberry and “банк клюква (Bank Cranberry)” for cranberry and literature such as “крыжовник чехов (Gooseberry Chekhov)” for gooseberry. The RSV based on search term exhibited a larger scatter than that based on search topic option, particularly during a period of relatively small RSV, probably because searches for these queries did not refer to berries as plants of the season (Figure 1).
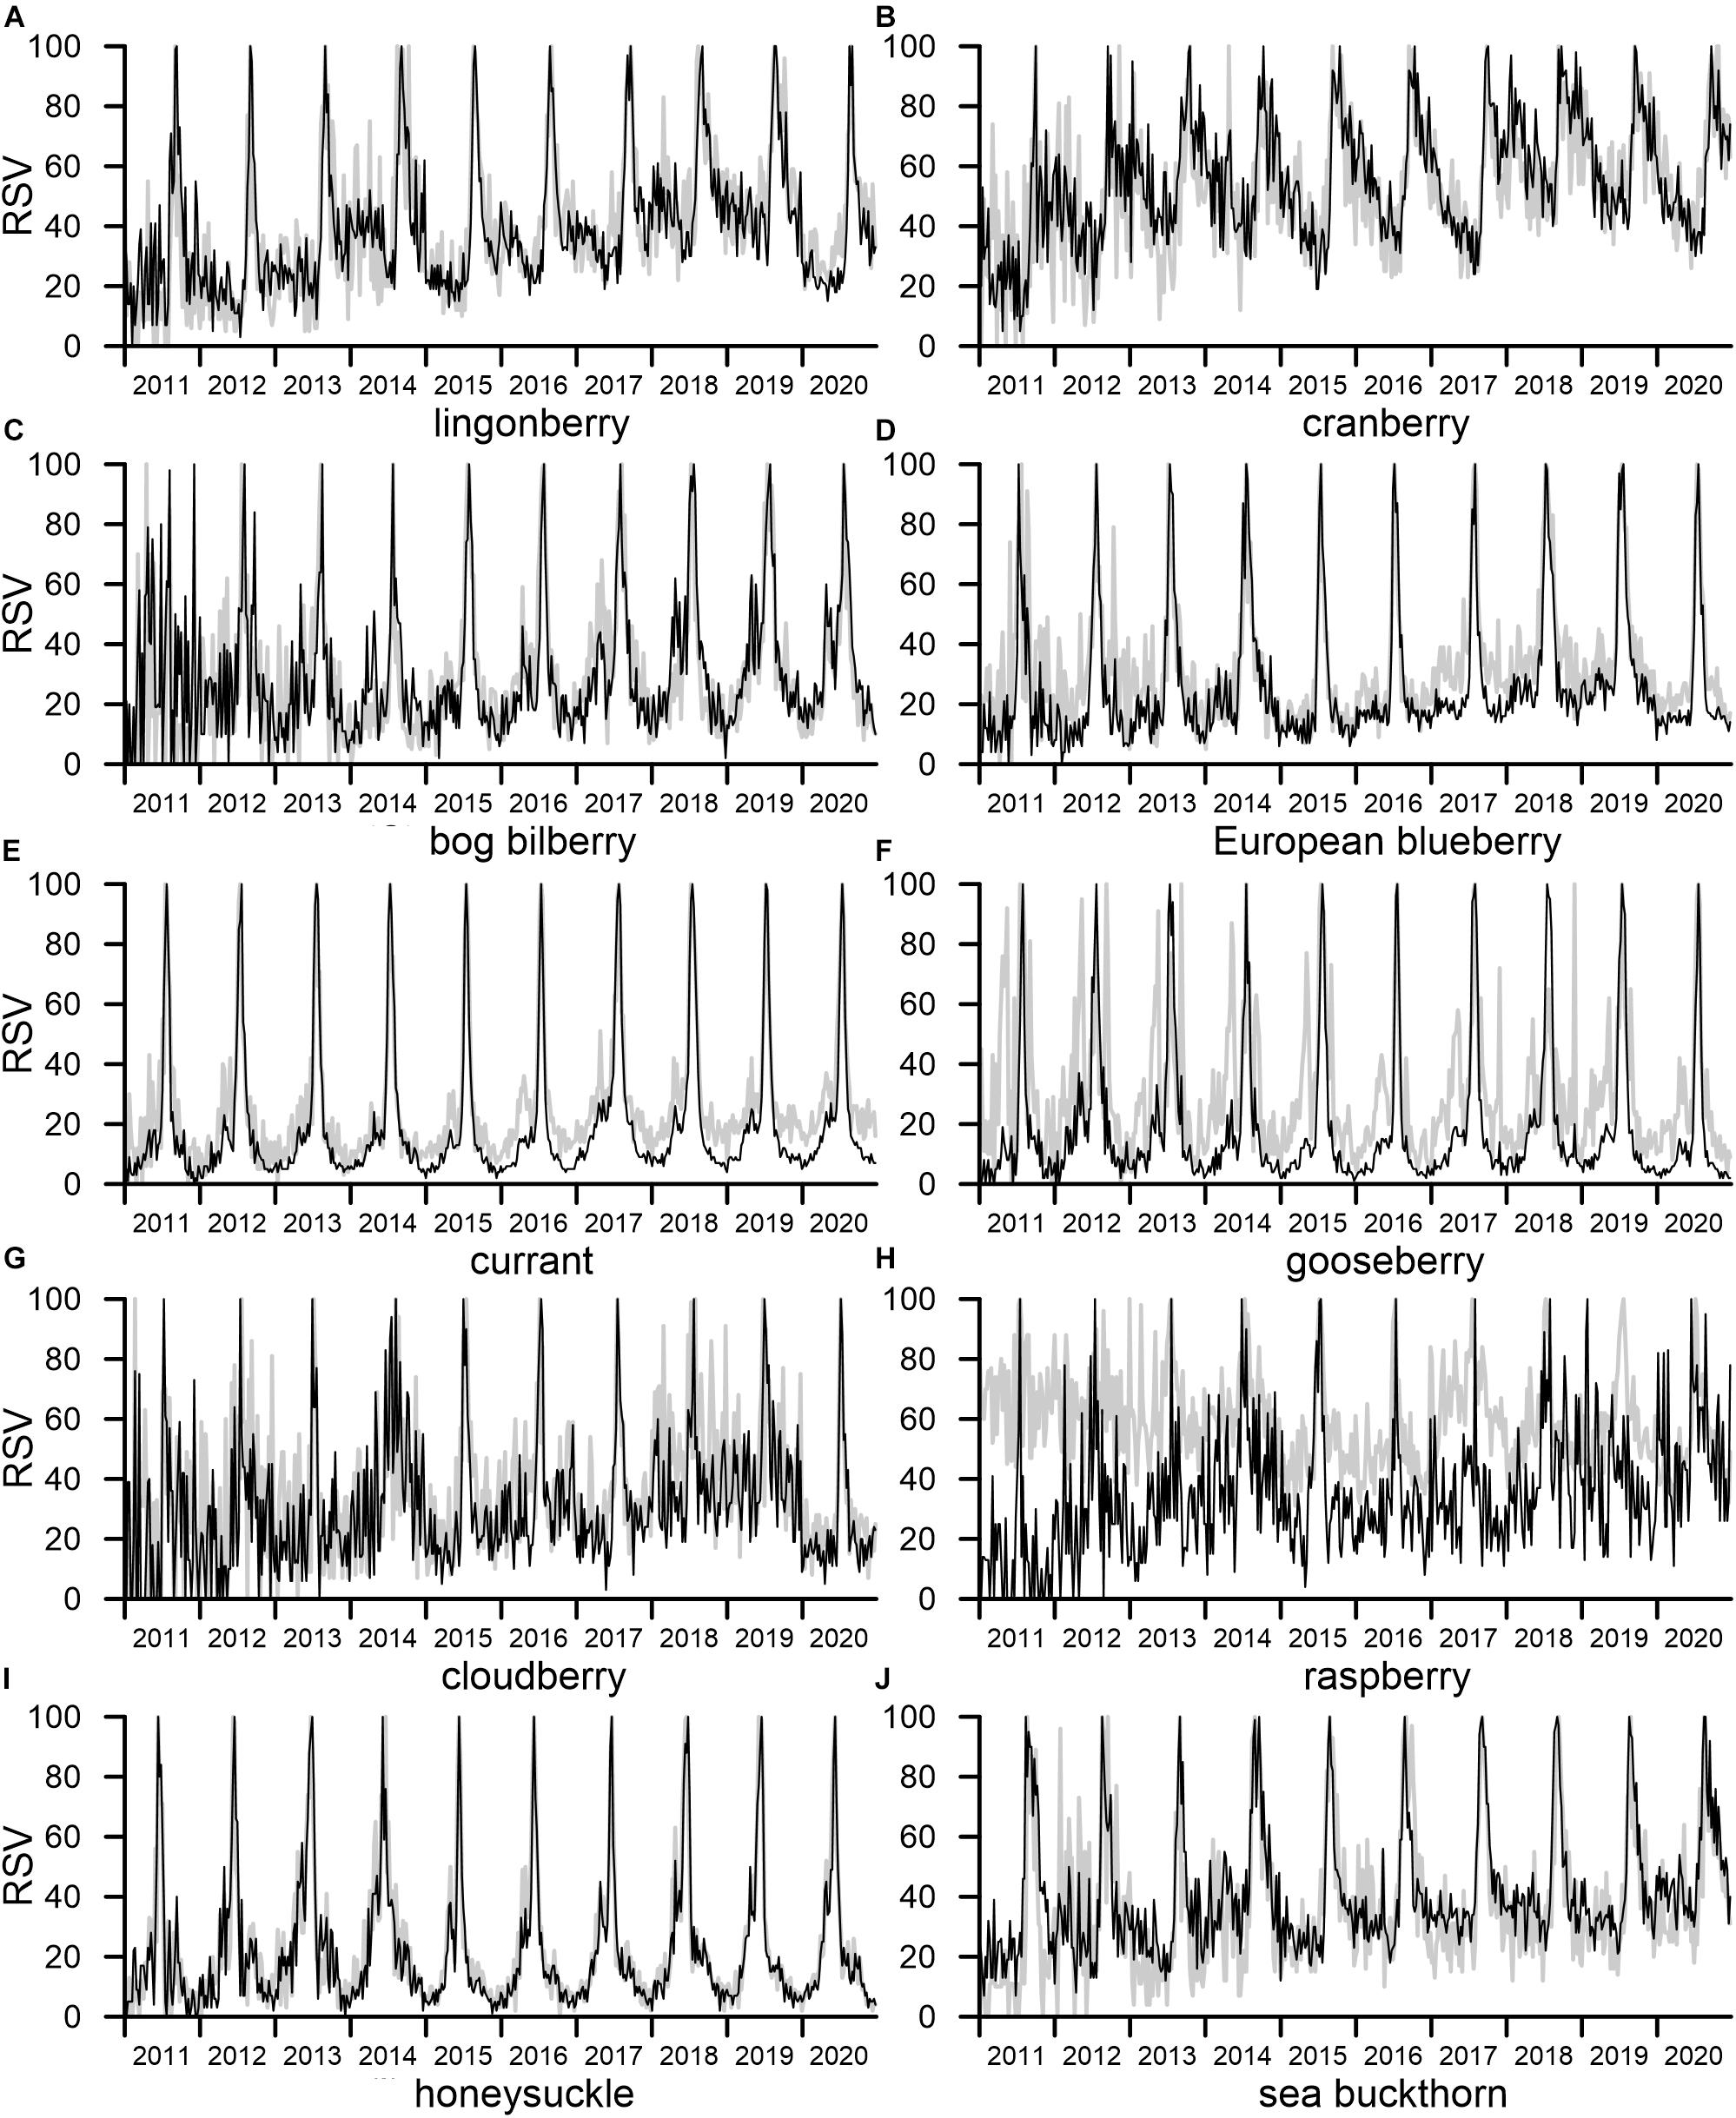
Figure 1. Weekly relative search volume (RSV) for each year of (A) lingonberry, (B) cranberry, (C) bog bilberry, (D) European blueberry, (E) currant, (F) gooseberry, (G) cloudberry, (H) raspberry, (I) honeysuckle, and (J) sea buckthorn from 2011 to 2020 across Russia. Black and gray lines indicate results of “search topic” and “search terms (Russian words),” respectively.
Supplementary Table 3 shows a list of topics linked to posted queries for each keyword. These keywords were frequently searched for in the context of other kinds of berries. For example, queries for cranberry, European blueberry, and cloudberry were searched for in the common topic “lingonberry.” Various topics indicated processed products such as “Pie,” “Sauce,” “Mors (boiled berry drink in Russian),” and “Varenye (berry preserve or jam in Russian)” in queries for most keywords, except for raspberry and sea buckthorn. “Winter” and “Sugar” might have reflected preservation for the winter season (Stryamets et al., 2015). We found unique topics for specific berries: “Leaf” was the most frequent topic for lingonberry, which may indicate the popularity of using the leaves as pharmaceuticals (Shikov et al., 2017; Raudone et al., 2019). Several topics relating to horticulture, such as “cultivar,” “pruning,” “reproduction,” and “transplants,” may connect to searches of honeysuckle. Some berry plants are popularly cultivated in private gardens or farms (Stammler and Sidorova, 2015; Rusanov, 2019). In contrast, searches for sea buckthorn concentrated on topics related to its oil, which has been used in traditional botanical medicine (e.g., Bal et al., 2011; Olisova et al., 2018). Searches relevant to a computer (“raspberry pi”) remained, even in search topic limited to “Plants.”
Seasonal Variation in Relative Search Volume in Russia
There was similar seasonal variation in RSV with different time scale settings. Figure 2 shows the lingonberry RSV across Russia for 3 years in daily, weekly, and monthly time steps. These were obtained from time settings of May–December (daily), January–December (weekly) in each year, and through 10 years from 2011 to 2020 (monthly). The weekly RSV variation maintained the general features of daily variation. When monthly RSV was a relative value over 10 years, there was small seasonal change in monthly RSV in a year when RSV was relatively low (as in 2011). Weekly and monthly results in the case of Russia are presented in Figures 1, 3, respectively. Seasonal peaks in monthly RSV generally appeared in the same month in all years. Positive trends (derived from seasonal and trend decomposition; Cleveland et al., 1990) arose in most examined terms. There was a marked maximum RSV in 2020 for some results. In the trend-deduced RSVs, the largest annual amplitude in 2020 was still consistent for some of them (Supplementary Figure 1).
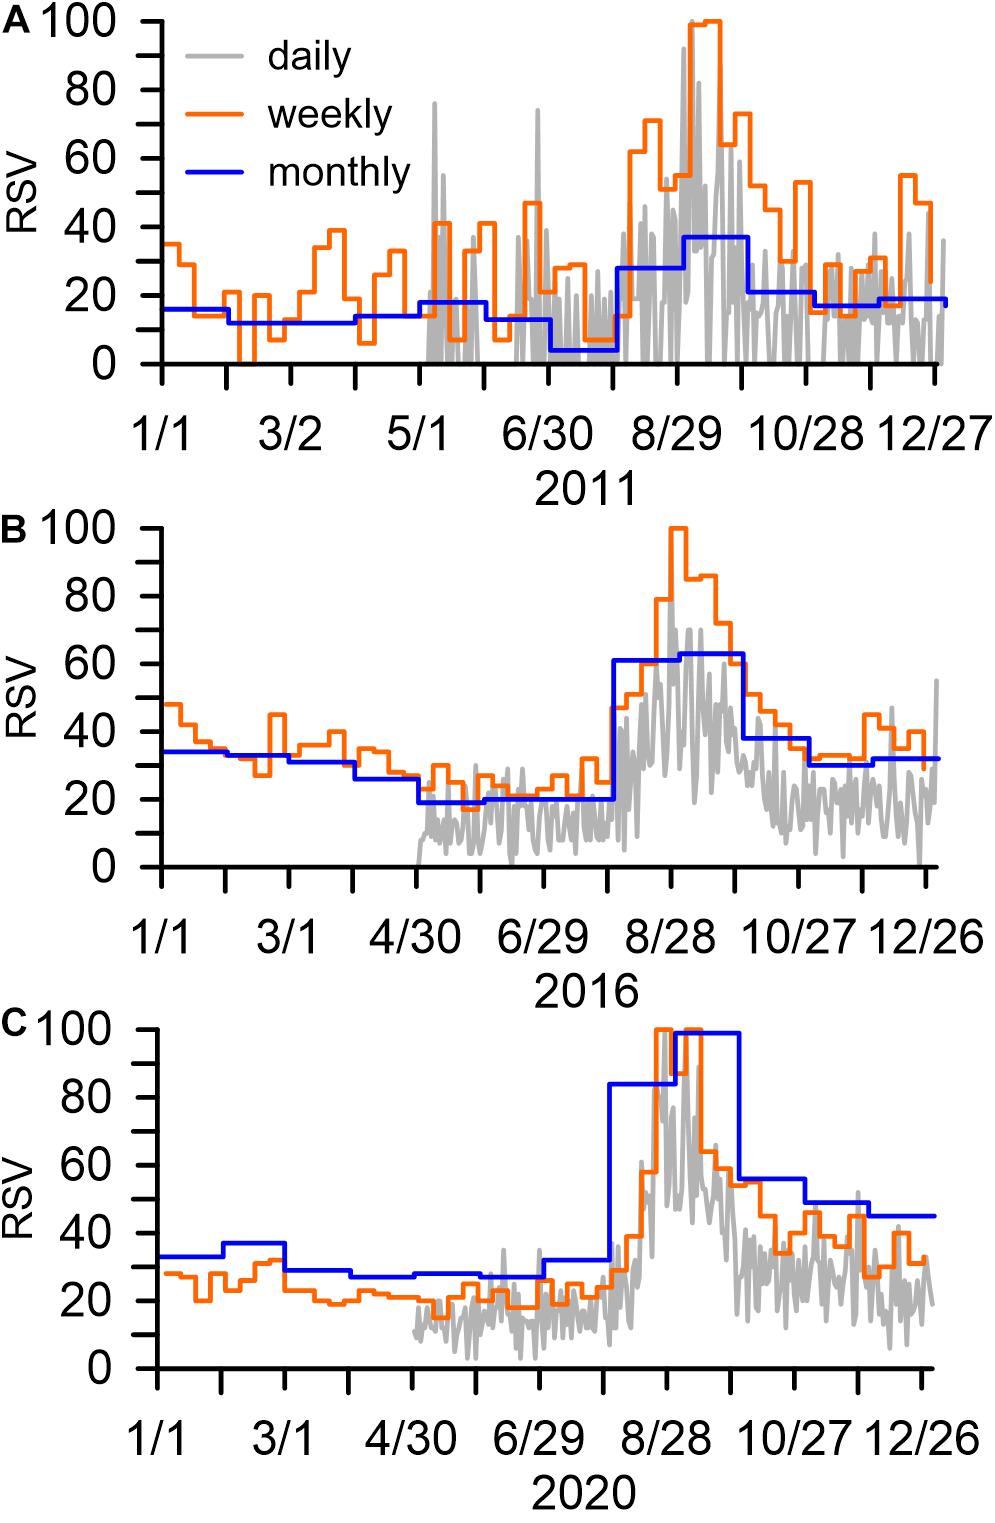
Figure 2. Relative search volume (RSV) calculated in daily, weekly, and monthly time steps for lingonberry across Russia in (A) 2011, (B) 2016, and (C) 2020.
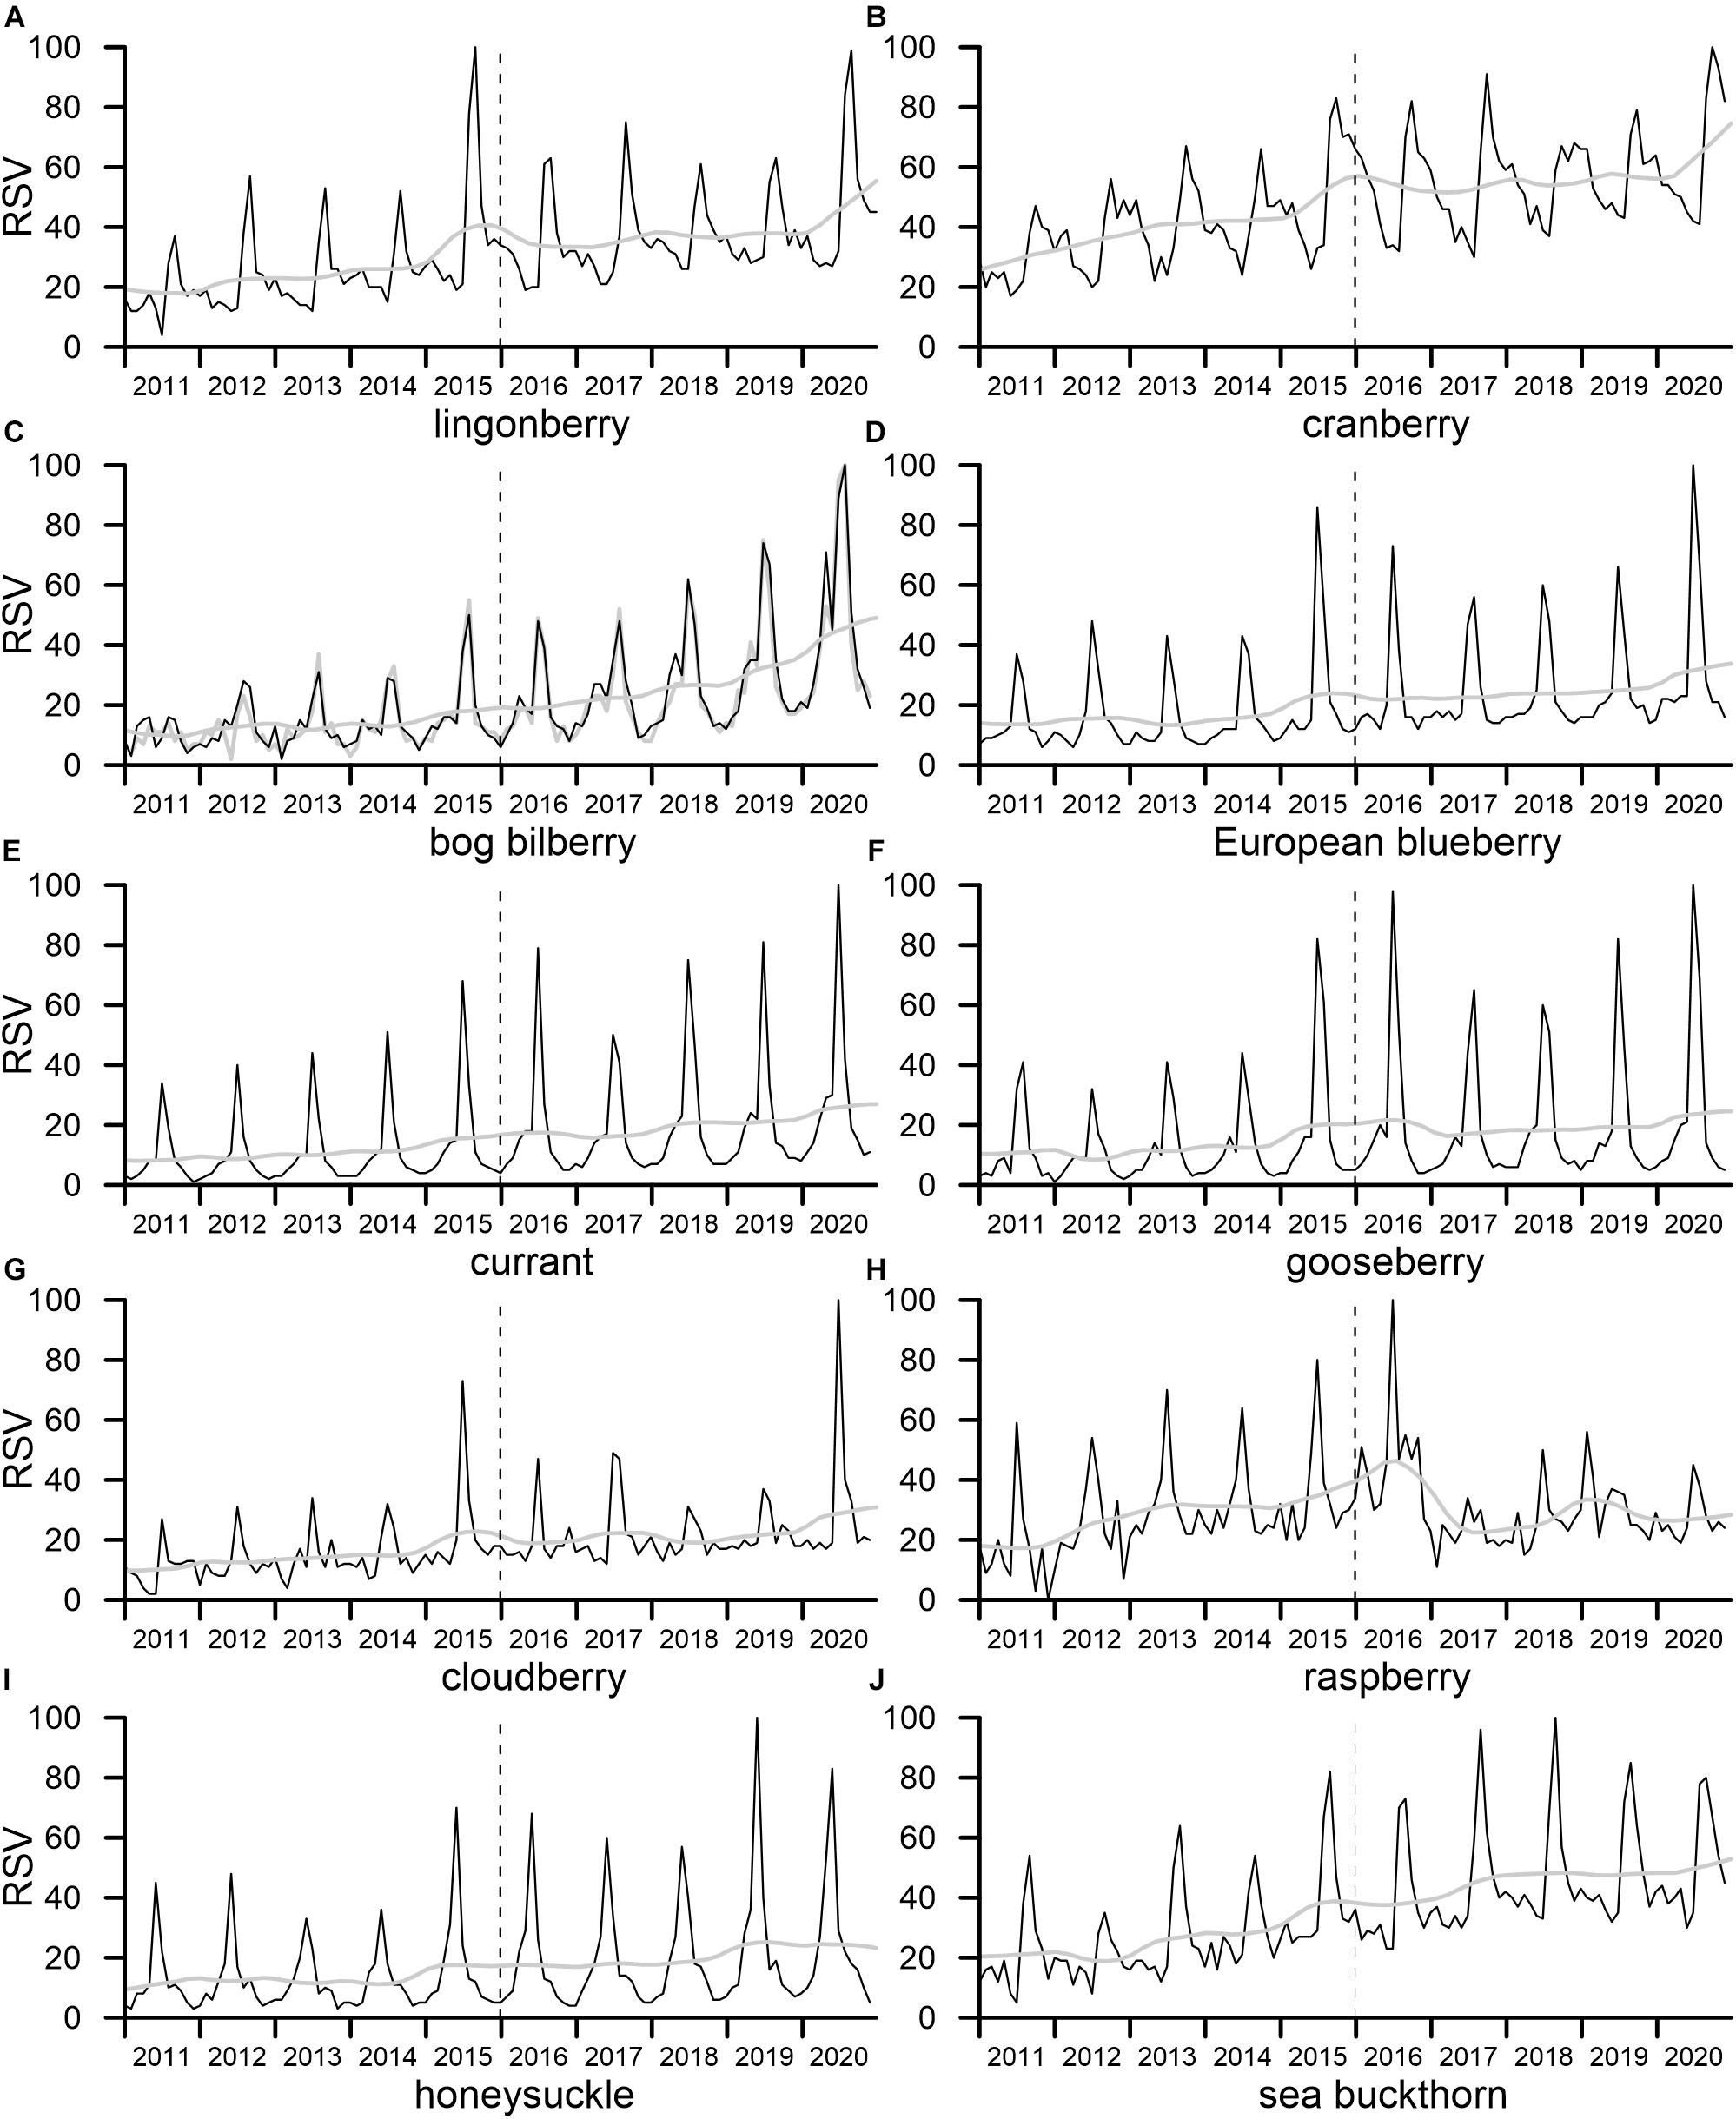
Figure 3. Monthly relative search volume (RSV) for 10 years from 2011 to 2020 of (A) lingonberry, (B) cranberry, (C) bog bilberry, (D) European blueberry, (E) currant, (F) gooseberry, (G) cloudberry, (H) raspberry, (I) honeysuckle, and (J) sea buckthorn across Russia. Black and gray lines indicate RSV and its trend component, respectively. Vertical lines indicate January 1, 2016, when the GT data collection system changed.
A seasonal cycle with a maximum in summer to autumn was a common feature for each species (Figure 4). After the seasonal peak of lingonberry, cranberry, and sea buckthorn, RSV gradually decreased until a rise occurred in the next season. The other species, mainly European blueberry, currant, gooseberry, and honeysuckle, showed relatively distinctive seasonal peaks with small and stable RSV during the other period (i.e., out of the growing season). In contrast, a relatively large variation in RSV throughout a year (except for the peak season) in the first few years of the observation period was remarkable, particularly in raspberry, cloudberry, and some other berries (e.g., cranberry, bog bilberry, and sea buckthorn) (Figure 1). Around May (before the increase to seasonal peak), a slight increase in RSV was found for bog bilberry, currant, and gooseberry, despite a large scatter by years. These trends probably relate to berry cultivation, found in related topics (i.e., cultivar, pruning, and landing) in spring months (Supplementary Table 4).
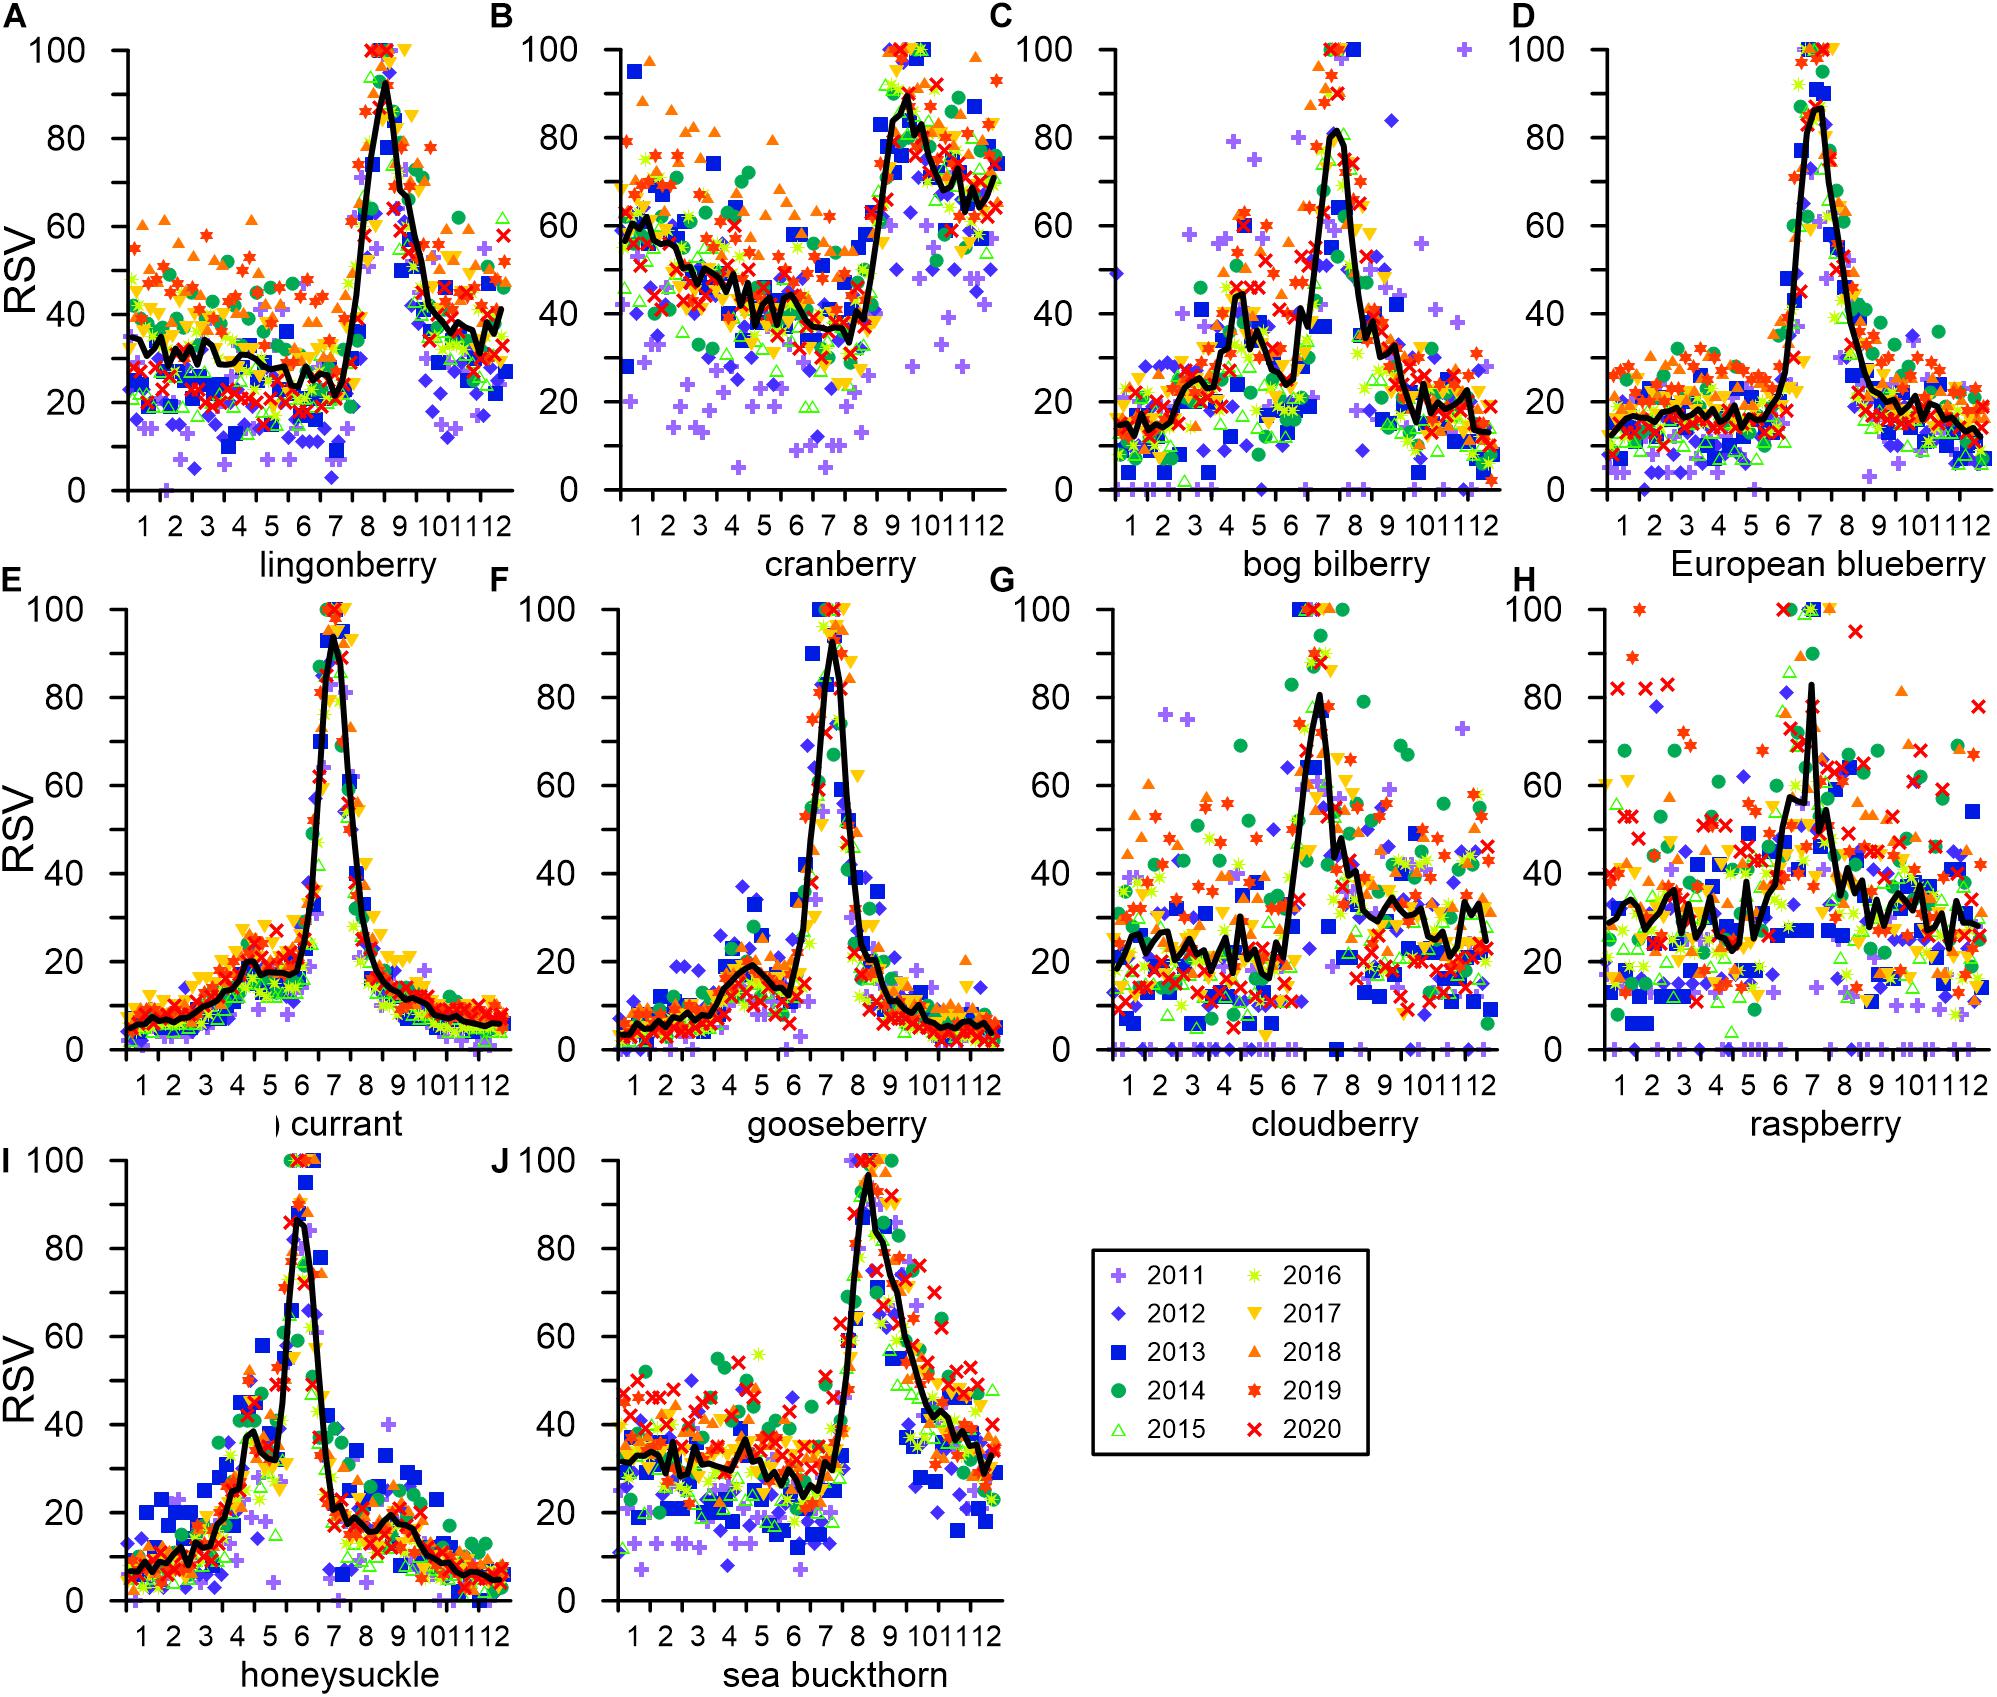
Figure 4. Weekly relative search volume (RSV) for each year of (A) lingonberry, (B) cranberry, (C) bog bilberry, (D) European blueberry, (E) currant, (F) gooseberry, (G) cloudberry, (H) raspberry, (I) honeysuckle, and (J) sea buckthorn across Russia. Lines indicate 10 year mean of weekly RSV.
A distinct period of seasonal maximum (RSV = 100) was found for each berry (Figure 5). The middle date of the week with maximum RSV (hereafter, maximum RSV date) was late June for honeysuckle (166.5, 6.6; 10 years mean and standard deviation of day of year); around July for raspberry (191.5, 46.9), cloudberry (198.0, 9.6), currant (199.0, 3.2), European blueberry (199.0, 10.4), gooseberry (208.0, 4.4), and bog bilberry (214.0, 38.2); late August to early September for sea buckthorn (241.5, 11.3) and lingonberry (242.0, 8.8); and late September for cranberry (268.0, 8.0). These dates were roughly identical to the harvest season, when the berries ripened (Table 1).
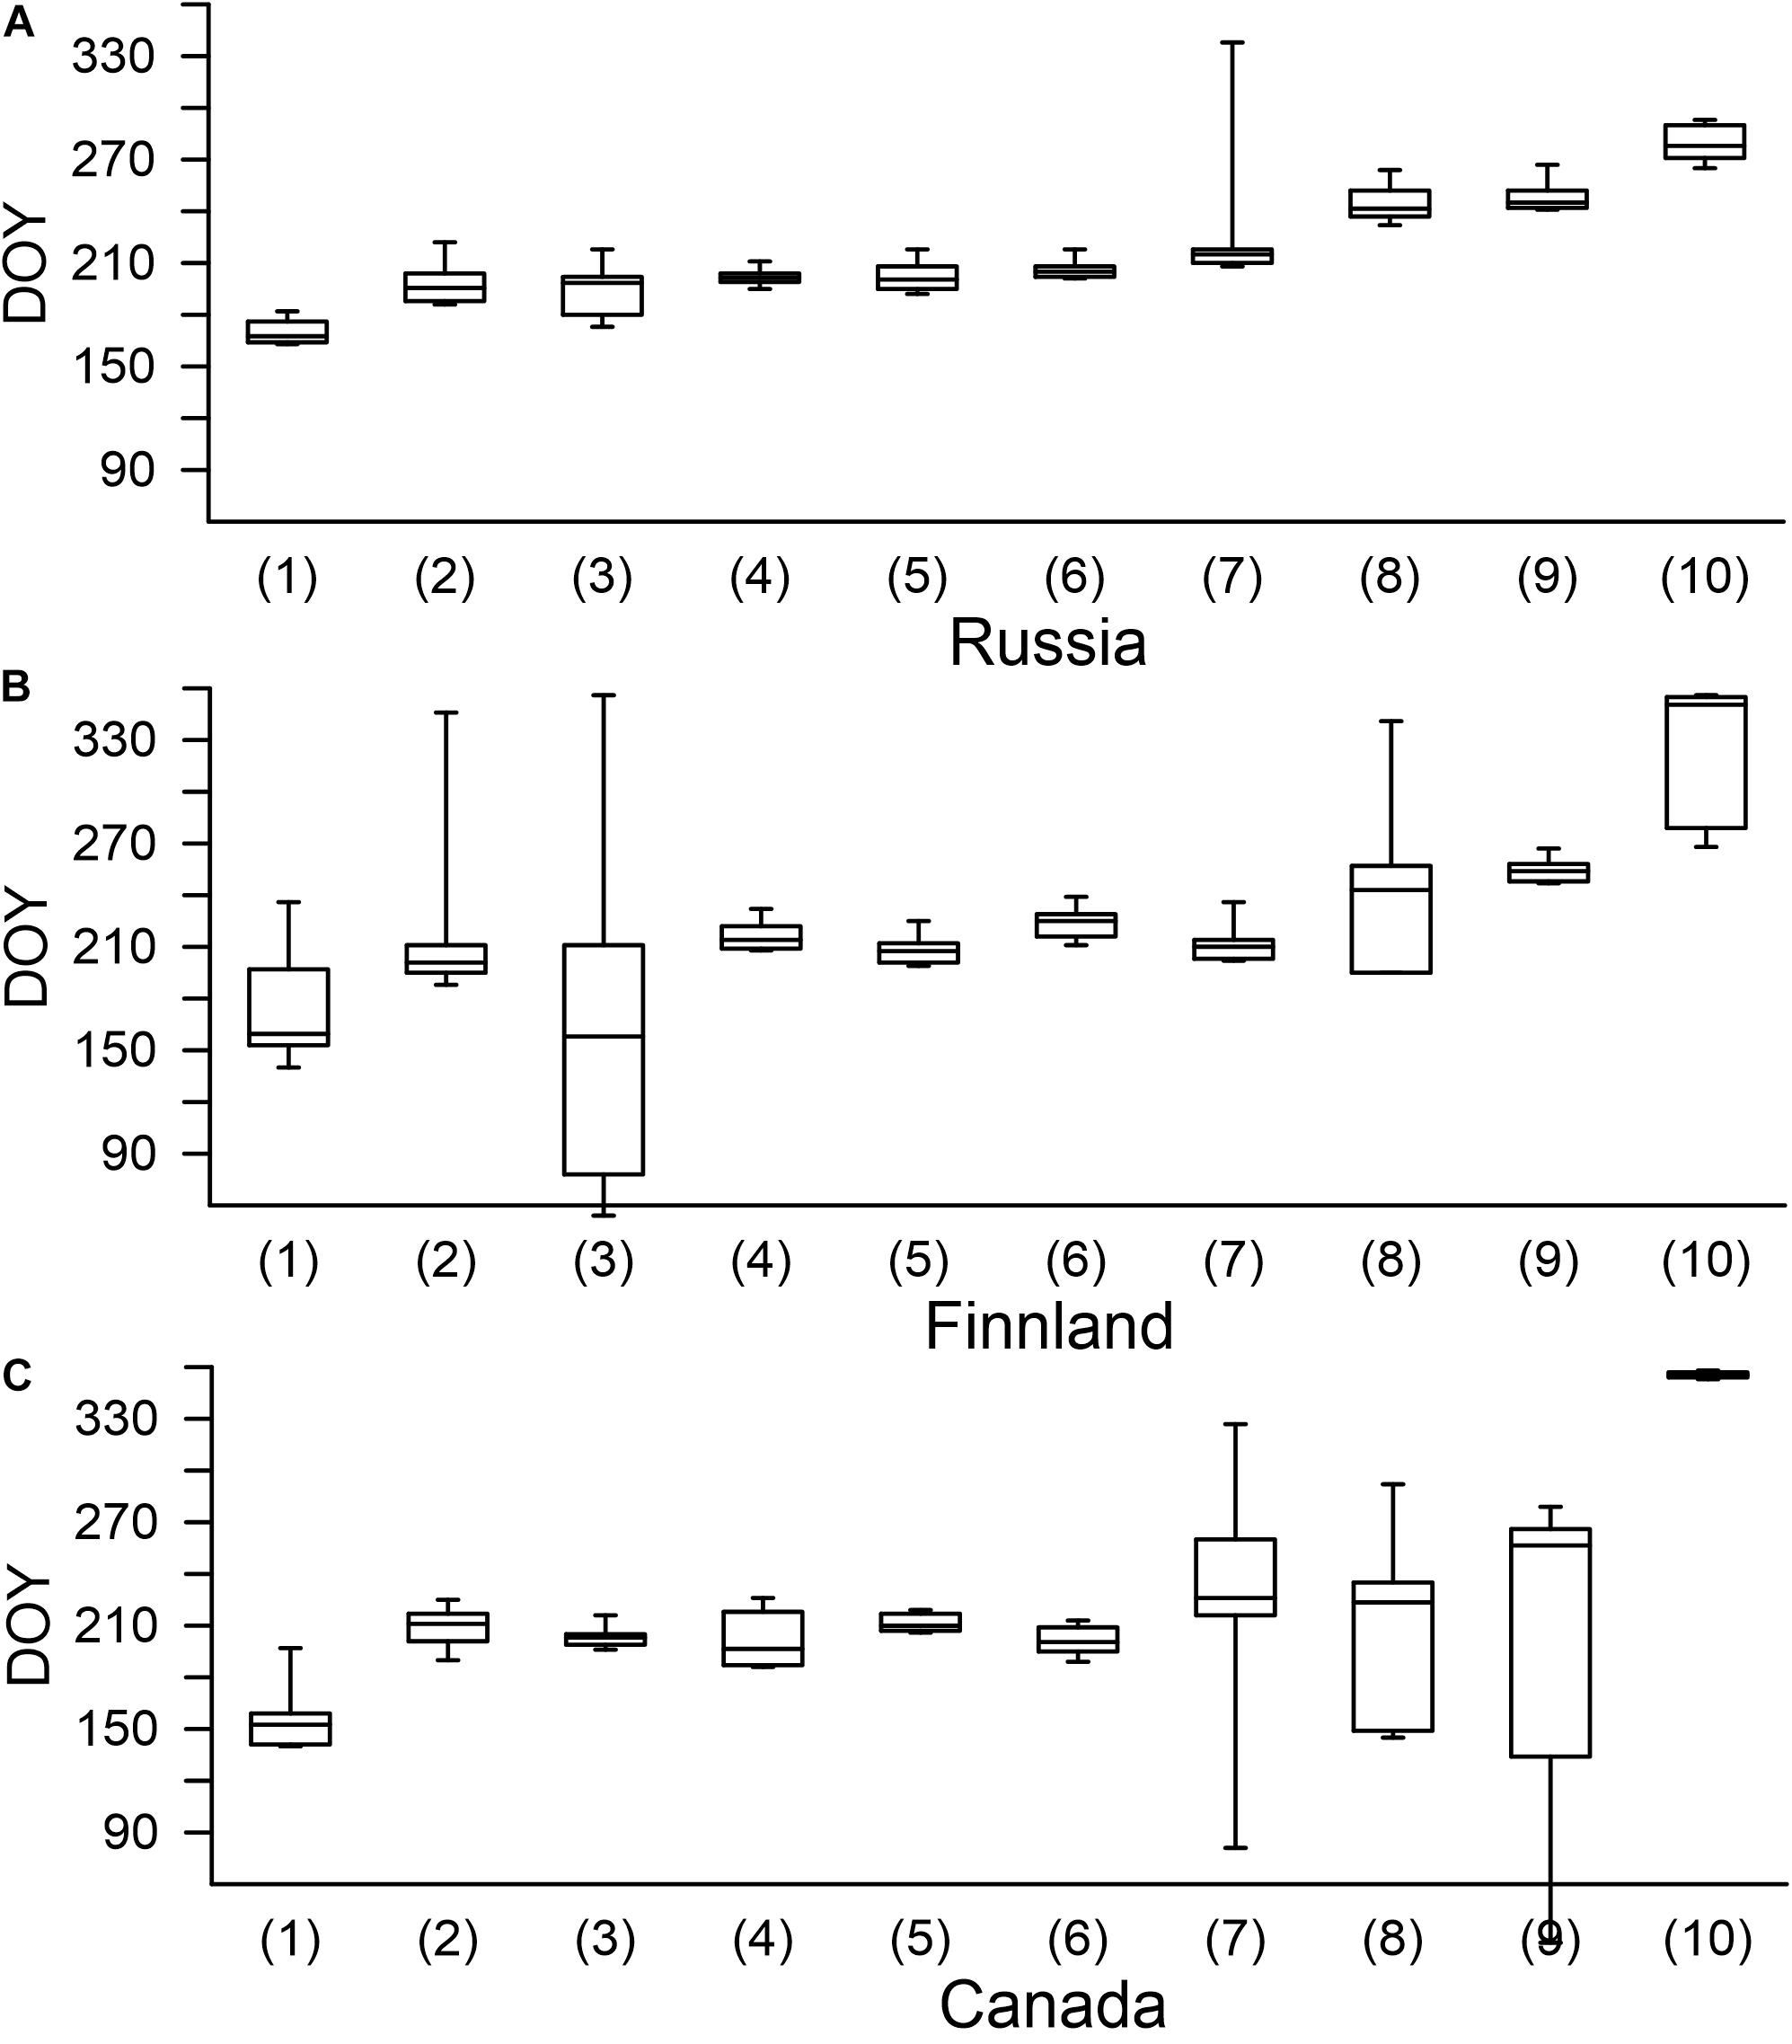
Figure 5. Maximum search volume (RSV) date of 10 examined terms for (A) Russia, (B) Finland, and (C) Canada. Whiskers indicate 10 and 90 percentiles. (1) Honeysuckle, (2) cloudberry, (3) raspberry, (4) currant, (5) (European) blueberry, (6) gooseberry, (7) (bog) bilberry, (8) sea buckthorn, (9) lingonberry, and (10) cranberry is presented in order of increasing RSV date in Russia.
Regional Differences (Russia, Finland, and Canada)
The annual patterns of 10-year mean RSV were generally similar in summer (Figure 6), and seasonal peaks (maximum RSV dates) overlapped among the three regions (Figure 5). The range of 10-year variation in the seasonal peak was extensive for some species, such as honeysuckle, raspberry, sea buckthorn in Finland; and honeysuckle, sea buckthorn, and lingonberry in Canada. These resulted in an unclear seasonal pattern of 10-year mean (Figure 6). For cloudberry, raspberry, and sea buckthorn, topics irrelevant to plants (i.e., lacquer, raspberry pi, and buckthorn oil, Supplementary Table 3) made for a scattering background.
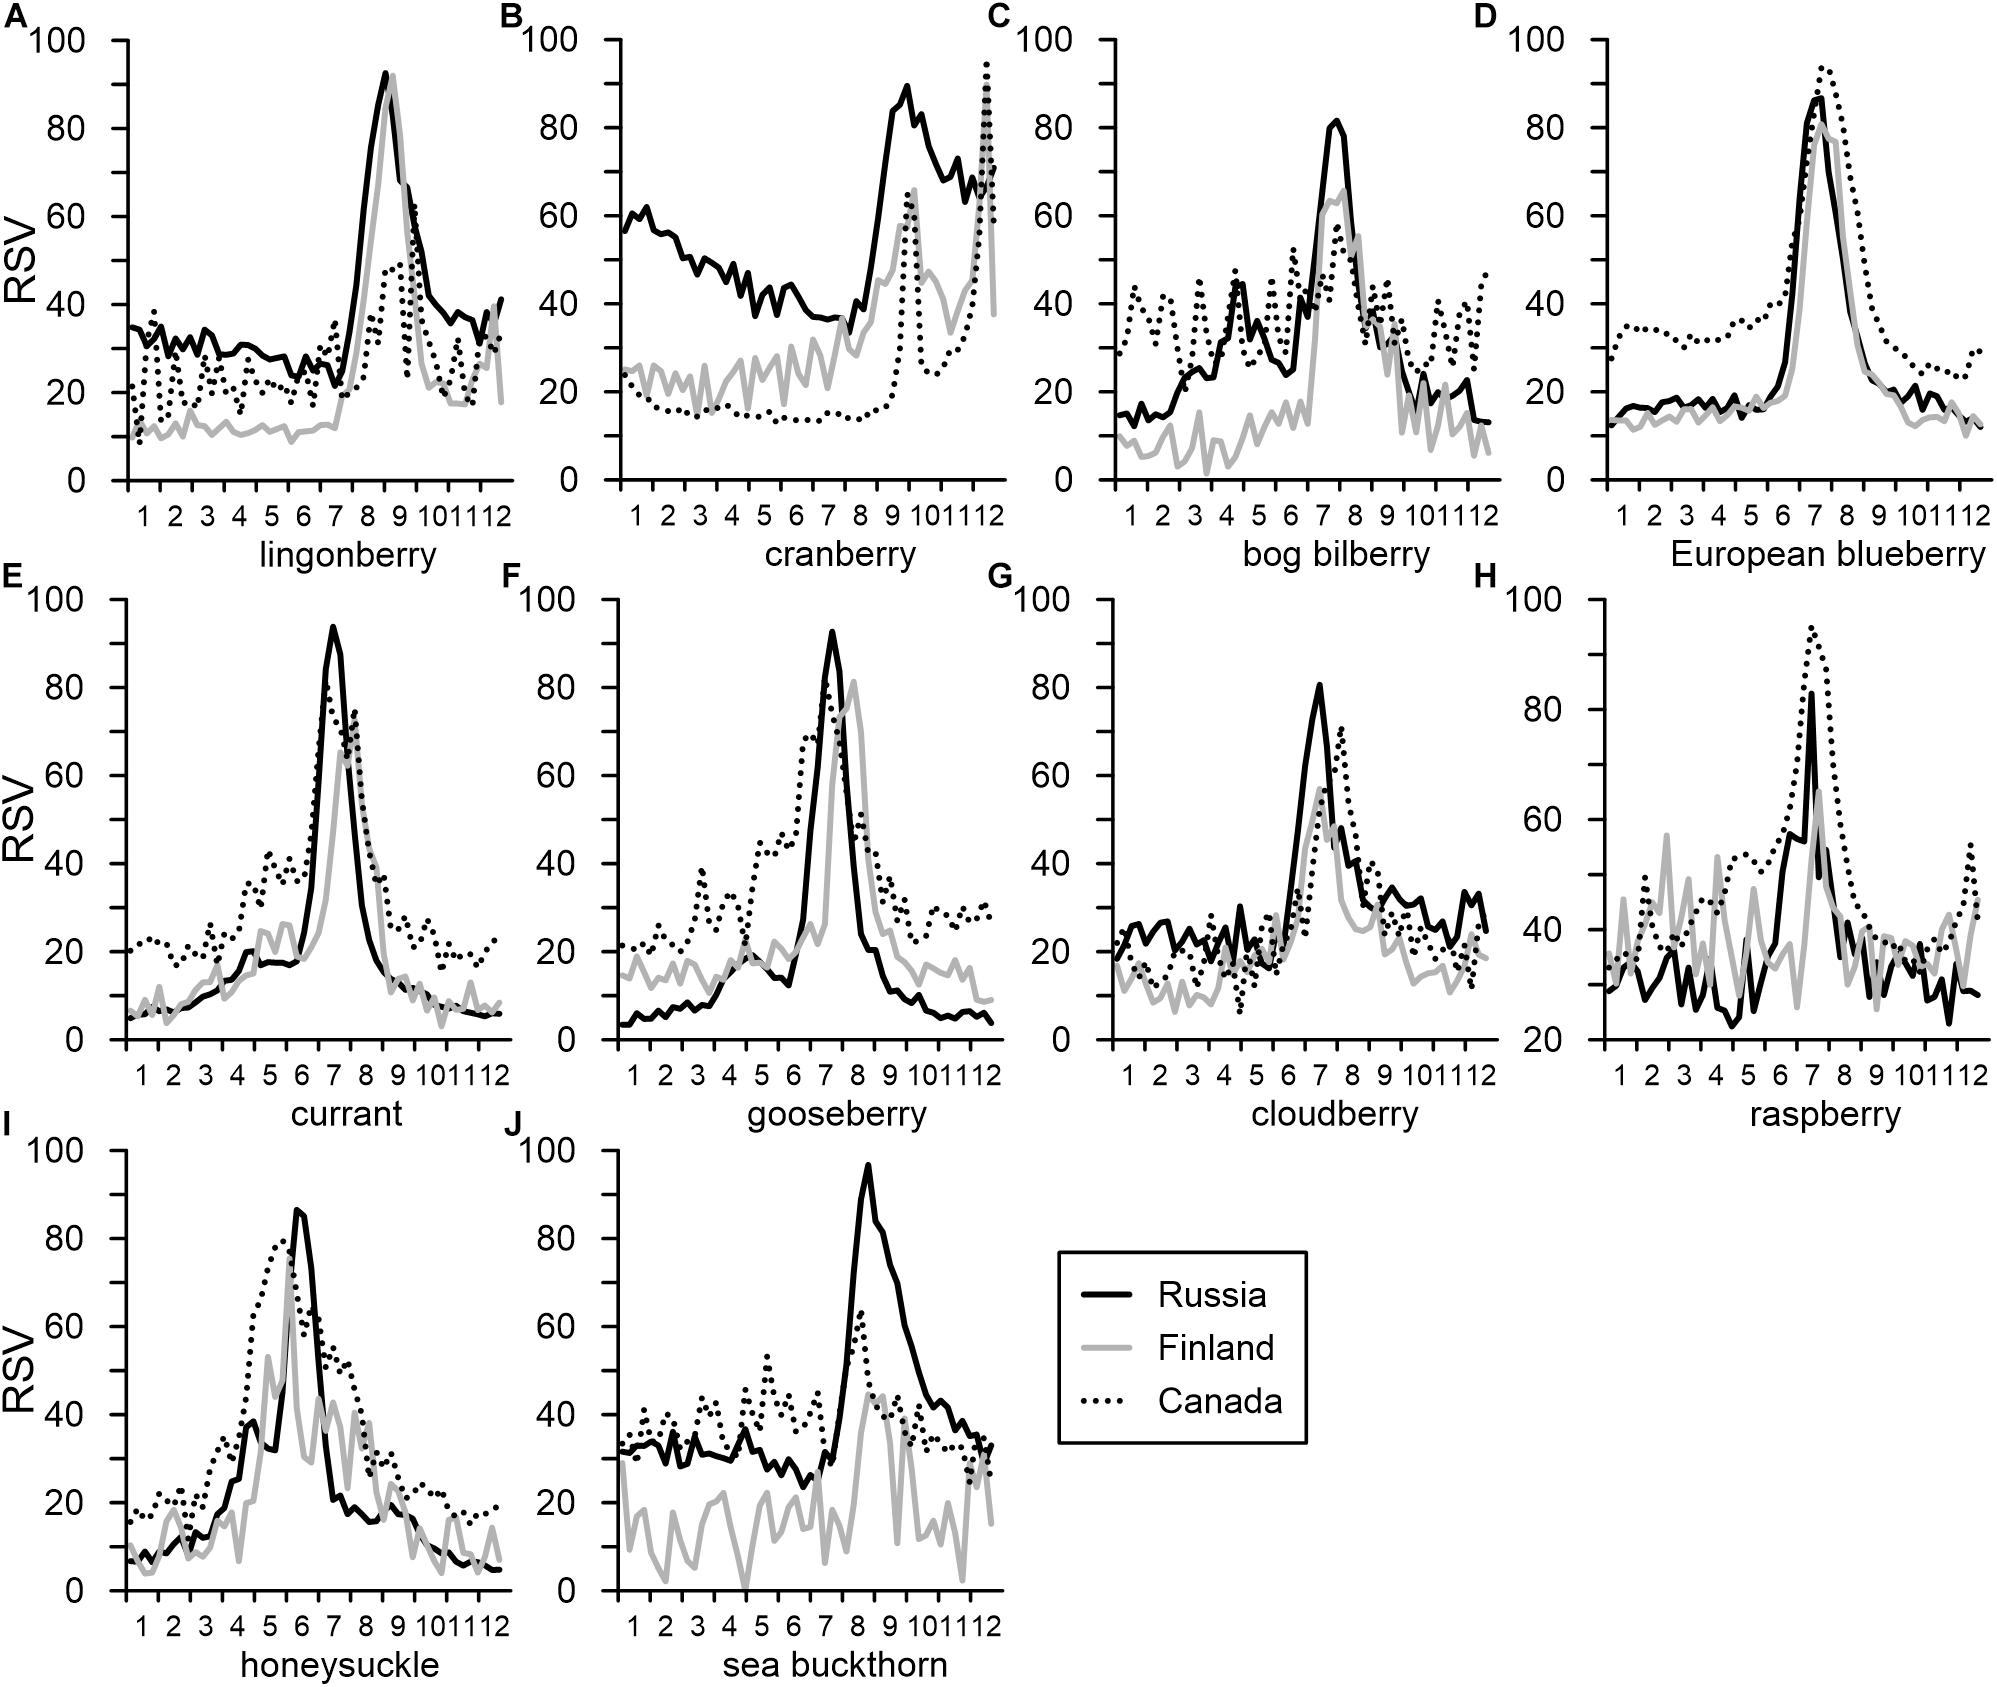
Figure 6. Weekly relative search volume (RSV) 10-year mean of (A) lingonberry, (B) cranberry, (C) bog bilberry, (D) European blueberry, (E) currant, (F) gooseberry, (G) cloudberry, (H) raspberry, (I) honeysuckle, and (J) sea buckthorn for Russia, Finland, and Canada. In the case of Canada, (C) bilberry and (D) blueberry were examined.
In the case of cranberry in Canada, two distinct seasonal peaks—the largest in the third week of December and the second in the first or second week of October (Figure 6)—corresponded to Christmas and Thanksgiving, respectively. There was a seasonal peak in December in Finland, but a gradual second peak may have overlapped the harvest season, as in Russia. Related topics in each month supported contrasting search tendencies in Russia and Canada (Supplementary Table 4). While “Mors (berry drink in Russian)” was regularly a top topic throughout the year in Russia, there was a seasonal change in popular topics in Canada; that is, “Juice” during March to September, and “Recipe” or “Sauce” (probably relating to cooking) in the other months (Supplementary Table 4).
Discussion
Seasonal Human Interest in Berries Detected by GT
A seasonal pattern of human interest in the topic of berry species was detected from web search data via annual (i.e., weekly resolution) GT analysis. Among the tested 10 species, a remarkable rise in RSV during the berry harvest season (ripening season) was detectable for several species. Another noteworthy pattern was found when cultural customs were seen to affect RSV (i.e., cranberry during the Christmas period in Canada). Most species in the study area exhibited a seasonal peak in RSV, with a steep increase, and differences in species and countries appeared in period when RSV decreased and in winter. There was interest in some berries after the harvest season but no interest in other species, reflecting the different uses of each berry (they may be a seasonal delicacy or useful over winter). Interest in the seasonality of plants generally tended to be more common in residents of high latitudes (Proulx et al., 2014; Mittermeier et al., 2019), which may support the clear seasonality projected in the berry searches in our study area. Our results present evidence of seasonality in human interest, through the internet search volume, with fundamental socio-cultural aspects superimposed on this. Consequently, searches for terms directly mentioning the use of a plant (e.g., food product, berry harvest) can reflect the seasonality of the berries.
The motivations and context of the searches for “berries” were diverse. The topics popularly related to berries depended on species and region; some commonly indicated products (either purchased or homemade) and cultivation (either household or commercial). The multiple contexts of a search for “berries” meant that simple interpretation of the results, as validating a single piece of evidence, was far from straightforward. This contrasted with previous studies of the pollen release season, which showed that web searches for major allergenic pollen species (Bousquet et al., 2018) and the general term “pollen” (Hall et al., 2020)—which are mainly driven by concerns of health risk—coincided with seasonal changes in pollen concentrations. Such a keyword with relatively clear associations with specific phenomena enables temporal and spatial variation in RSV to be validated with biological observation (Proulx et al., 2014). However, time series or statistics data usable for a validation source for the seasonal pattern of human interest in berry species were the indirect explanatory factor: for example, supply in the agricultural markets and retail stores, routine observation at botanical gardens or institutes (e.g., Roslin et al., 2021), and climate conditions affecting berry growth (e.g., Krebs et al., 2009; Nestby et al., 2019; Tahvanaian et al., 2019) in the target area. Event dates that cue people to make an internet search for berries (e.g., festivals featuring specific berries and announcement of wild berry harvesting periods from local government in Russia) are considered a regionally specific condition. Collections of field survey information from people’s behavior, such as local customs and knowledge of where and when berries are available (e.g., Everett, 2007; Ksenofontov et al., 2018), can be sources of validation.
We carried out a national-scale analysis for the selected three countries. Previous studies have revealed the reliability of spatial analysis at the sub-national scale, such as by state (the United States; Proulx et al., 2014), by province (France; Bousquet et al., 2019), and in the US Designated Market Area (Hall et al., 2020). Thus, the value of GT data as geographical data has been suggested (Proulx et al., 2014). In Russia and Finland, however, typical seasonal patterns in RSV found in the national level analysis were not sufficiently detected at a sub-national scale, except for relatively highly populated districts (e.g., Moscow). A less-populated district was even unable to provide a continuous time series, probably because of low search volume beneath a threshold. The search population in a limited area, and period with a bias in individual attribution (e.g., place of residence, age, and occupation), and the motivation for and context of searches, introduced uncertainty into the RSV (Proulx et al., 2014; Toivonen et al., 2019). The rate of a user’s share of other search engines also affects population bias (Dergiades et al., 2018). In addition, spatial heterogeneity inside the target area can result in unclear trends. For instance, Sakha republic (the largest subdivision of Russia, covering 3 million km2 over the southern forest region to the coast of the Arctic Ocean) has 30% of its population concentrated in the capital city in the forest area. Diversity in climate and ecoregion inside the examined area can be reflected in people’s behavior and lead to mixed results. Successful spatial analysis of previous studies in the United States and Europe may partly have resulted from a sufficiently large population and geographical uniformity at the sub-national scale at a certain level.
Although this study focused on the shape of the seasonal cycle and its maximum, the interannual variation in RSV throughout the study period (Figure 3) provided decadal-scale changes in human interest. Multiple backgrounds, including food demand, cultivation, and picking activity (as both livelihoods and recreation), can affect public concern about specific plants, particularly edible/usable ones such as berry plants. Learning how these search motivations varied at a decadal scale is an essential perspective in understanding human perception and response to the seasonality of berry plants. Previous studies, however, raised questions about uncertainty embedded in the long-term trend in GT data due to changing search populations since 2004 (Ficetola, 2013; Nghiem et al., 2016; Bokelmann and Lessmann, 2019; Supplementary Text). In contrast to previous studies in various fields such as tourism (Bokelmann and Lessmann, 2019), conservation, and environmental issues (Ficetola, 2013; Nghiem et al., 2016), our 10-year RSV time series did not present a downward trend, and we suspect this was not affected by changes in absolute search volume, irrespective of correction (Supplementary Text and Supplementary Figure 3). The internet prevalence rate in the Russian Federation has almost doubled in the last decade: in 2011 and 2019 the percentage of subscribers to internet access via fixed broadband was12.2 and 22.2%, and access via mobiles was 47.8 and 96.4%, respectively, (Federal State Statistics Service, 2020). We may attribute the positive trend in some berries (Figure 3), therefore, to increased fruit consumption in the Russian Federation, reflecting health and food choices, despite declining disposable income (USDA, 2020).
Application to Phenology Study
As mentioned in 3.2, some berry species exhibited a remarkable peak in RSV during the berry harvest season, although others were strongly affected by abiological factors. These peaks generally corresponded to the period of ripening, although the nation-scale analysis did mean there was some uncertainty (Figure 5). It was expected, for example, that interannual variation in the seasonal peak of human interest could be evaluated with the weekly time resolution of GT analysis, as conducted in this study. To apply GT data to phenology studies, some of the remaining (and critical) limiting factors are considered below.
It will be possible to overcome uncertainty from multiple meanings irrelevant to the research objective, and which affects the results—such as the growing (ripening) berry season—if (1) appropriate terms and topics are assigned and (2) the period being analyzed is set in a way that eliminates searches irrelevant to plant dynamics (e.g., avoiding the dormant season). These two recommendations will need to be based on knowledge of phenological events such as the typical length of the growing season and specific, regional social/cultural events. Against the problem of spatial resolution of GT analysis (including less-populated regions), integrating various data sources will reveal the spatial and temporal dynamics of phenological phenomena. Photographs and videos provide, sometimes without the intention of users, the in situ reality of species habitats (ElQadi et al., 2017), phenology (Silva et al., 2018), and ecosystem services such as recreational and aesthetic landscapes (Richards and Friess, 2015; Vaz et al., 2019). Posted texts in social media also provide location-specific events about vegetation phenology (Silva et al., 2018). GT data time series fill a deficiency in temporal continuity and regional representativeness of these spot data, and can be applied to mathematical modeling as an alternative to traditional ecological data (Capinha, 2019).
Use of these social sensing data in satellite remote sensing analysis is an expected application of the technology. Recently developed satellite observations with spatially high-resolution sensors (e.g., Sentinel-2) produce precise mapping of phenological timing, including autumn coloring of (mainly) crown leaves. However, detecting floor vegetation dynamics remains to be addressed, even in a boreal ecosystem with a relatively sparse canopy structure. As berry plants on the forest floor experience climate change just as the overstory species do (Selås et al., 2015), the harvest season of forest berries can be affected by canopy-forming plants, which are directly detected by remote sensing observation. Linking the characteristics of overstory and floor vegetation enables the extraction of floor vegetation information from remote sensing observation. To achieve this aim, information based on social sensing data is essential, as well as on the relationship between floor vegetation and overstory canopy structure (Miller et al., 1997; Barbier et al., 2008; Majasalmi and Rautiainen, 2020), and spectral characteristics of several berries on the forest floor (Rautiainen et al., 2011; Forsström et al., 2019).
Conclusion
We explored the possibility of using internet search data to detect the human interest in berry species in high-latitude countries, and especially in Russia. There is a typical and culture-specific pattern of seasonal variation in search volume on berries across Russia, Finland, and Canada. Although it is important to recognize the limitations inherent in GT data—such as validity in decadal-scale trends, the bias of the search population, and multiple meanings of a search term—the seasonal search peak corresponds to the common berry harvest season across these countries. If the characteristics of the search population (e.g., residence area, age structure, and occupation) and basic geographical and ecological information about the target area are available in advance, it will be possible to interpret the seasonal patterns. Combining this information with data from other social sensing data and satellite remote sensing observation with high spatial resolution is expected to improve the spatial evaluation of berry plant dynamics, especially in sparsely populated areas.
Data Availability Statement
The raw data supporting the conclusions of this article will be made available by the authors, without undue reservation.
Author Contributions
AK, NS, and ST contributed to the conception and design of the study. AK, TG, and AM organized the database. AK and NS wrote the first draft of the manuscript. All authors contributed to manuscript revision, read, and approved the submitted version.
Funding
This work was supported by the Grants-in-Aid for Scientific Research from Japan Society for the Promotion of Science (20K06145) and the e-Asia Climate Call from Russian Foundation for Basic Research (21-55-70104).
Conflict of Interest
The authors declare that the research was conducted in the absence of any commercial or financial relationships that could be construed as a potential conflict of interest.
Publisher’s Note
All claims expressed in this article are solely those of the authors and do not necessarily represent those of their affiliated organizations, or those of the publisher, the editors and the reviewers. Any product that may be evaluated in this article, or claim that may be made by its manufacturer, is not guaranteed or endorsed by the publisher.
Supplementary Material
The Supplementary Material for this article can be found online at: https://www.frontiersin.org/articles/10.3389/ffgc.2021.688835/full#supplementary-material
Supplementary Figure 1 | Trend-deducted relative search volume from 2011 to 2020 of (A) lingonberry, (B) cranberry, (C) bog bilberry, (D) European blueberry, (E) currant, (F) gooseberry, (G) cloudberry, (H) raspberry, (I) honeysuckle, and (J) sea buckthorn across Russia.
Supplementary Figure 2 | Monthly relative search volume (RSV) for 10 years from 2011 to 2020 of four benchmarks as computer (blue), software (cyan), life (green), and love (red).
Supplementary Figure 3 | Monthly relative search volume (RSV) corrected with four benchmarks for 10 years from 2011 to 2020 of (A) lingonberry, (B) cranberry, (C) bog bilberry, (D) European blueberry, (E) currant, (F) gooseberry, (G) cloudberry, (H) raspberry, (I) honeysuckle, and (J) sea buckthorn across Russia. Black lines indicate RSV without correction (same to Figure 3) and blue (computer), cyan (software), green (life), and red (love) are RSVs with benchmark correction.
Supplementary Table 1 | Related queries for given keyword with the limited topic “Plants” (search topics option) (score > 20).
Supplementary Table 2 | Related queries for given keyword (Russian keywords) (search term option) (score > 20).
Supplementary Table 3 | Related topics for given keyword with the limited topic “Plants” (search topics option) (score > 20).
Supplementary Table 4 | Monthly based related topics for given keyword with the limited topic “Plants” (search topics option). Numbers of the corresponding months are noted in parentheses.
Footnotes
References
Anderson, D., Ford, J. D., and Way, R. G. (2018). The impacts of climate and social changes on cloudberry (Bakeapple) picking: a case study from southeastern labrador. Hum. Ecol. 46, 849–863. doi: 10.1007/s10745-018-0038-3
Bal, L. M., Meda, V., Naik, A. N., and Satya, S. (2011). Sea buckthorn berries: a potential source of valuable nutrients for nutraceuticals and cosmoceuticals. Food Res. Int. 44, 1718–1727. doi: 10.1016/j.foodres.2011.03.002
Barbier, S., Gosselin, F., and Balandier, P. (2008). Influence of tree species on understory vegetation diversity and mechanisms involved — a critical review for temperate and boreal forests. For. Ecol. Manage. 254, 1–15. doi: 10.1016/j.foreco.2007.09.038
Barney, D. L. (1997). Currants, gooseberries, and jostaberries. J. Small Fruit Vitic. 4, 107–142. doi: 10.1300/J065v04n01_04
Barve, V. (2014). Discovering and developing primary biodiversity data from social networking sites: a novel approach. Ecol. Inform. 24, 194–199. doi: 10.1016/j.ecoinf.2014.08.008
Bokelmann, B., and Lessmann, S. (2019). Spurious patterns in google trends data – an analysis of the effects on tourism demand forecasting in Germany. Tour. Manage. 75, 1–12. doi: 10.1016/j.tourman.2019.04.015
Boulanger-Lapointe, N., Järvinen, A., Partanen, R., and Herrmann, T. M. (2017). Climate and herbivore in Fl uence on vaccinium myrtillus over the last 40 years in Northwest Lapland, Finland. Ecosphere 8:e01654. doi: 10.1002/ecs2.1654
Bousquet, J., Agache, I., Berger, U., Bergmann, K. C., Besancenot, J. P., Bousquet, P. J., et al. (2018). Differences in reporting the ragweed pollen season using google trends across 15 countries. Int. Arch. Allergy Immunol. 176, 181–188. doi: 10.1159/000488391
Bousquet, J., Onorato, G. L., Oliver, G., Basagana, X., Annesi-Maesano, I., Arnavielhe, S., et al. (2019). Google trends and pollen concentrations in allergy and airway diseases in France. Allergy 74, 1910–1919. doi: 10.1111/all.13804
Brodeur, J., Abram, P. K., Heimpel, G. E., and Messing, R. H. (2018). Trends in biological control: public interest, international networking and research direction. BioControl 63, 11–26. doi: 10.1007/s10526-017-9850-8
Capinha, C. (2019). Predicting the timing of ecological phenomena using dates of species occurrence records: a methodological approach and test case with mushrooms. Int. J. Biometeorol. 63, 1015–1024. doi: 10.1007/s00484-019-01714-0
Cleveland, R. B., Cleveland, W. S., McRae, J. E., and Terpenning, I. (1990). STL: a seasonal-trend decomposition procedure based on loess. J. Off. Stat. 6, 3–73.
Dergiades, T., Mavragani, E., and Pan, B. (2018). Google trends and tourists’ arrivals: emerging biases and proposed corrections. Tour. Manage. 66, 108–120. doi: 10.1016/j.tourman.2017.10.014
ElQadi, M. M., Dorin, A., Dyer, A., Burd, M., Bukovac, A., and Shrestha, M. (2017). Ecological informatics mapping species distributions with social media geo-tagged images: case studies of bees and flowering plants in Australia. Ecol. Inform. 39, 23–31. doi: 10.1016/j.ecoinf.2017.02.006
Everett, H. (2007). A welcoming wilderness: the role of wild berries in the construction of newfoundland and labrador as a tourist destination. Ethnologies 29, 49–80. doi: 10.7202/018745ar
Federal State Statistics Service (2020). Regions of Russia. Socio-Economic Indicators 2020 (РЕГИОНЫ РОССИИ. СОЦИАЛЬНО-ЭКОНОМИЧЕСКИЕ ПОКАЗАТЕЛИ 2020). Moscow: Federal State Statistics Service.
Ficetola, G. F. (2013). Is interest toward the environment really declining? The complexity of analysing trends using internet search data. Biodivers. Conserv. 22, 2983–2988. doi: 10.1007/s10531-013-0552-y
Forsström, P., Peltoniemi, J., and Rautiainen, M. (2019). Seasonal dynamics of lingonberry and blueberry spectra. Silva Fenn. 53, 1–19. doi: 10.14214/sf.10150
Gauthier, S., Bernier, P., Kuuluvainen, T., Shvidenko, A. Z., and Schepaschenko, D. G. (2015). Boreal forest health and global change. Science 349, 819–822. doi: 10.1126/science.aaa9092
Hall, J., Lo, F., Saha, S., Vaidyanathan, A., and Hess, J. (2020). Internet searches offer insight into early season pollen patterns in observation free zones. Sci. Rep. 10:11334. doi: 10.1038/s41598-020-68095-y
Herman-Mercer, N. M., Loehman, R. A., Toohey, R. C., and Paniyak, C. (2020). Climate- and disturbance-driven changes in subsistence berries in Coastal Alaska: indigenous knowledge to inform ecological inference. Hum. Ecol. 48, 85–99. doi: 10.1007/s10745-020-00138-4
Hjalmarsson, I., and Ortiz, R. (2001). “Lingonberry: botany and horiculture,” in Horicultural Reviews, Vol. 27, ed. J. Janick (Hoboken, NJ: Wiley), 79–123.
Holmberg, M., Aalto, T., Akujärvi, A., Arslan, A. N., Bergström, I., Böttcher, K., et al. (2019). Ecosystem services related to carbon cycling – modeling present and future impacts in boreal forests. Front. Plant Sci. 10:343. doi: 10.3389/fpls.2019.00343
Hummer, K. E., Sabitov, A., Cherbukin, P., and Vorsa, N. (2006). Vaccinium from Primorsky, Khabarovsk, Amursky and the Sakhalin Territories, Russia. Acta Hortic. 715, 91–96.
Hupp, J., Brubaker, M., Wilkinson, K., and Williamson, J. (2015). How are your berries? Perspectives of Alaska’s environmental managers on trends in wild berry abundance. Int. J. Circumpolar Health 74:28704. doi: 10.3402/ijch.v74.28704
Jun, S. P., Sun, H., and Choi, A. (2018). Technological forecasting & social change ten years of research change using google trends: from the perspective of big data utilizations and applications. Technol. Forecast. Soc. 130, 69–87. doi: 10.1016/j.techfore.2017.11.009
Kangas, K., and Markkanen, P. (2001). Factors affecting participation in wild berry picking by rural and urban dwellers. Silva Fenn. 35, 487–495. doi: 10.14214/sf.582
Kirilenko, A. P., Molodtsova, T., and Stepchenkova, S. O. (2015). People as sensors: mass media and local temperature influence climate change discussion on twitter. Global Environ. Chang. 30, 92–100. doi: 10.1016/j.gloenvcha.2014.11.003
Klosterman, S., Melaas, E., Wang, J. A., Martinez, A., Frederick, S., O’Keefe, J., et al. (2018). Fine-scale perspectives on landscape phenology from unmanned aerial vehicle (UAV) photography. Agric. For. Meteorol. 248, 397–407. doi: 10.1016/j.agrformet.2017.10.015
Kolosova, V., Belichenko, O., Rodionova, A., Melnikov, D., and Sõukand, R. (2020). Foraging in boreal forest: wild food plants of the republic of Karelia, NW Russia. Foods 9:1015. doi: 10.3390/foods908101510.3390/foods9081015
Krebs, C. J., Boonstra, R., Cowcill, K., and Kenny, A. J. (2009). Climatic determinants of berry crops in the boreal forest of the southwestern Yukon. Botany 87, 401–408. doi: 10.1139/B09-013
Ksenofontov, S., Backhaus, N., and Schaepman-strub, G. (2018). ‘There are new species’: indigenous knowledge of biodiversity change in Arctic Yakutia. Polar Geogr. 42, 34–57. doi: 10.1080/1088937X.2018.1547326
Kuznetsova, L. B., Isaev, A. P., Timofeev, P. A., Zakharova, V. I., Egorova, A. A., et al. (2016). Medical Plants of Yakutia [Лекарственные Растения Якутии 2020)]. Yakutsk: Bichik. (in Russian).
Li, J., Percival, D., Hoyle, J., White, J., Head, K., and Pruski, K. (2016). Phenology and yield of native fruits cloudberry / bakeapple (Rubus Chamaemorus L.) and lingonberry / partridgeberry (Vaccinium Vitis-Idaea L.) grown in Southern Labrador, Canada. Can. J. Plant Sci. 96, 329–338. doi: 10.1139/cjps-2015-0131
Lopez, B. E., Magliocca, N. R., and Crooks, A. T. (2019). For socio-environmental systems research. Land 8:107. doi: 10.3390/land8070107
Majasalmi, T., and Rautiainen, M. (2020). The impact of tree canopy structure on understory variation in a boreal forest. For. Ecol. Manage. 466:118100. doi: 10.1016/j.foreco.2020.118100
Massicotte, P., and Eddelbuettel, D. (2020). gtrendsR: Perform and Display Google Trends Queries. R Package Version 1.4.8. Available online at: https://CRAN.R-project.org/package=gtrendsR (accessed March 6, 2021).
Mccallum, M. L., and Bury, G. W. (2013). Google search patterns suggest declining interest in the environment. Biodivers. Conserv. 22, 1355–1367. doi: 10.1007/s10531-013-0476-6
Miller, J. R., White, H. P., Chen, J. M., Peddle, D. R., Mcdermid, G., Fournier, R. A., et al. (1997). Seasonal change in understory reflectance of boreal forests and influence on canopy vegetation indices. J. Geophys. Res. 102, 29475–29482. doi: 10.1029/97JD02558
Mittermeier, J. C., Roll, U., Matthews, T. J., and Grenyer, R. (2019). A season for all things: phenological imprints in wikipedia usage and their relevance to conservation. PLoS Biol. 17:e3000146. doi: 10.1371/journal.pbio.3000146
Nagai, S., Akitsu, T., Saitoh, T. M., Busey, R. C., Fukuzawa, K., Honda, Y., et al. (2018). 8 million phenological and sky images from 29 ecosystems from the Arctic to the tropics: the phenological eyes network. Ecol. Res. 33, 1091–1092. doi: 10.1007/s11284-018-1633-x
Nestby, R., Hykkerud, A. L., and Martinussen, I. (2019). Review of botanical characterization, growth preferences, climatic adaptation and human health effects of ericaceae and empetraceae wild dwarf shrub berries in boreal, alpine and arctic areas. J. Berry Res. 9, 515–547. doi: 10.3233/JBR-190390
Nghiem, T. P. L., Papworth, S. K., Lim, F. K. S., and Carrasco, L. R. (2016). Analysis of the capacity of google trends to measure interest in conservation topics and the role of online news. PLoS One 11:e0152802. doi: 10.1371/journal.pone.0152802
Olisova, O. Y., Snarskaya, E. S., Gladko, V. V., and Burova, E. P. (2018). Russian traditional medicine in dermatology. Clin. Dermatol. 36, 325–337. doi: 10.1016/j.clindermatol.2018.03.007
Platton, S., and Henfrey, T. (2009). The cultural keystone concept: insights from ecological anthropology. Hum. Ecol. 37, 491–500. doi: 10.1007/s10745-009-9237-2
Proulx, R., Massicotte, P., and Pépino, M. (2014). Googling trends in conservation biology. Conserv. Biol. 28, 44–51. doi: 10.1111/cobi.12131
Raudone, L., Vilkickyte, G., Pitkauskaite, L., Raudonis, R., Vainoriene, R., and Motiekaityte, V. (2019). Antioxidant activities of Vaccinium Vitis-Idaea L. leaves within cultivars and their phenolic compounds. Molecules 24:844. doi: 10.3390/molecules24050844
Rautiainen, M., Mõttus, M., Heiskanen, J., Akujärvi, A., Majasalmi, T., and Stenberg, P. (2011). Remote sensing of environment seasonal reflectance dynamics of common understory types in a Northern European boreal forest. Remote Sens. Environ. 115, 3020–3028. doi: 10.1016/j.rse.2011.06.005
Richards, D. R., and Friess, D. A. (2015). A rapid indicator of cultural ecosystem service usage at a fine spatial scale: content analysis of social media photographs. Ecol. Indic. 53, 187–195. doi: 10.1016/j.ecolind.2015.01.034
Roslin, T., Meyke, E., Abduraimov, O., Makhmudov, A., and Rudenko, M. (2021). Phenological shifts of abiotic events, producers and consumers across a continent. Nat. Clim. Chang. 11, 241–248. doi: 10.5281/zenodo.3774386
Rusanov, A. V. (2019). Dacha dwellers and gardeners: garden plots and second homes in Europe and Russia. Popul. Econ. 3, 107–124. doi: 10.3897/popecon.3.e34783
Selås, V., Sønsteby, A., Heide, O. M., and Opstad, N. (2015). Climatic and seasonal control of annual growth rhythm and flower formation in Vaccinium Myrtillus (Ericaceae), and the impact on annual variation in berry production. Plant Ecol. Evol. 148, 350–360. doi: 10.5091/plecevo.2015.1110
Shikov, A. N., Tsitsilin, A. N., Pozharitskaya, O. N., Makarov, V. G., and Heinrich, M. (2017). Traditional and current food use of wild plants listed in the Russian pharmacopoeia. Front. Pharmacol. 8:841. doi: 10.3389/fphar.2017.00841
Silva, S. J., Barbieri, L. K., and Thomer, A. K. (2018). Observing vegetation phenology through social media. PLoS One 13:e0197325. doi: 10.1371/journal.pone.0197325
Sorrenti, S. (2017). Non-Wood Forest Products in International Statistical Systems. Non-Wood Forest Product Series No. 22. Rome: Food and Agriculture Organization of the United Nations.
Spark, T., Mizera, T., Wójtowicz, W., and Tryjanowski, P. (2012). Synchrony in the phenology of a culturally iconic spring flower. Int. J. Biometeorol. 56, 407–409. doi: 10.1007/s00484-011-0435-4
Stammler, F., and Sidorova, L. (2015). Dachas on permafrost: the creation of nature among Arctic Russian city-dwellers. Polar Rec. 51, 576–586. doi: 10.1017/S0032247414000710
Stephens-Davidowitz, S., and Varian, H. (2015). A Hands-on Guide to Google Data. Available online at: https://docplayer.net/24038552-A-hands-on-guide-to-google-data.html (accessed March 1, 2021)
Strakhov, V., and Pisarenko, A. (1996). Development and utilization of Russian forest resources. Silva Fenn. 30, 361–371.
Stryamets, N., Elbakidze, M., Ceuterick, M., Angelstam, P., and Axelsson, R. (2015). From economic survival to recreation: contemporary uses of wild food and medicine in Rural Sweden, Ukraine and NW Russia. J. Ethnobiol. Ethnomed. 11:53. doi: 10.1186/s13002-015-0036-0
Szymkowiak, J., and Kuczyński, L. (2015). Avoiding predators in a fluctuating environment: responses of the wood warbler to pulsed resources. Behav. Ecol. 26, 601–608. doi: 10.1093/beheco/aru237
Tahvanaian, V., Miina, J., and Kurttila, M. (2019). Climatic and economic factors a ecting the annual supply of wild edible mushrooms and berries in Finland. Forests 10:386. doi: 10.3390/f10050385
Takada, K. (2012). Japanese interest in ‘Hotaru’ (Fireflies) and ‘Kabuto-Mushi’ (Japanese Rhinoceros Beetles) corresponds with seasonality in visible abundance. Insects 3, 424–431. doi: 10.3390/insects3020424
Toivonen, T., Heikinheimo, V., Fink, C., Hausmann, A., Hiippala, T., Järv, O., et al. (2019). Social media data for conservation science: a methodological overview. Biol. Conserv. 233, 298–315. doi: 10.1016/j.biocon.2019.01.023
Turtiainen, M., and Nuutinen, T. (2012). Evaluation of information on wild berry and mushroom markets in European countries. Small Scale For. 11, 131–145. doi: 10.1007/s11842-011-9173-z
Vaz, A. S., Gonçalves, J. F., Pereira, P., Santarém, F., Vicente, J. R., and Honrado, J. P. (2019). Remote sensing of environment earth observation and social media: evaluating the spatiotemporal contribution of non-native trees to cultural ecosystem services. Remote Sens. Environ. 230:111193. doi: 10.1016/j.rse.2019.05.012
Keywords: Google Trends, public interest, harvest season, phenology, wild berry, social sensing
Citation: Kotani A, Shin N, Tei S, Makarov A and Gavrilyeva T (2021) Seasonality in Human Interest in Berry Plants Detection by Google Trends. Front. For. Glob. Change 4:688835. doi: 10.3389/ffgc.2021.688835
Received: 31 March 2021; Accepted: 09 August 2021;
Published: 01 September 2021.
Edited by:
Yingying Xie, Northwestern University, United StatesCopyright © 2021 Kotani, Shin, Tei, Makarov and Gavrilyeva. This is an open-access article distributed under the terms of the Creative Commons Attribution License (CC BY). The use, distribution or reproduction in other forums is permitted, provided the original author(s) and the copyright owner(s) are credited and that the original publication in this journal is cited, in accordance with accepted academic practice. No use, distribution or reproduction is permitted which does not comply with these terms.
*Correspondence: Ayumi Kotani, a290YW5pQGFnci5uYWdveWEtdS5hYy5qcA==