
94% of researchers rate our articles as excellent or good
Learn more about the work of our research integrity team to safeguard the quality of each article we publish.
Find out more
ORIGINAL RESEARCH article
Front. For. Glob. Change, 20 May 2021
Sec. Pests, Pathogens and Invasions
Volume 4 - 2021 | https://doi.org/10.3389/ffgc.2021.671510
This article is part of the Research TopicForest Resilience Against Pest and Pathogen PandemicsView all 4 articles
 Diana L. Six1*†
 Amy Trowbridge2
 Michael Howe2
 Dana Perkins3
 Erika Berglund1
 Peter Brown4
 Jeffrey A. Hicke5Ganesh Balasubramanian6
Climate change-driven Dendroctonus ponderosae outbreaks in semi-naïve Pinus albicaulis may result in rapid natural selection for trees with genotypes and phenotypes associated with survival. In this study, we investigated whether survivors were genetically and chemically different from a living cohort of trees that escaped predation due to smaller size and estimated genetic diversity. We also examined how growth rate and climate sensitivity varied between beetle-killed and surviving trees. Dendroctonus ponderosae predominantly kills large diameter trees; therefore, we predicted that large surviving trees would have distinctive genetic profiles and, due to bottlenecking and drift, survivors would have lower genetic diversity than the abundant smaller mature trees that escaped predation. We found survivors were indeed genetically divergent from the smaller trees but, contrary to expectations, the smaller trees had lower diversity. This suggests that while beetles may select for trees with particular genotypes, other factors are also driving population genetic sub-structuring. Individual tree terpene profiles were diverse and varied by population but showed no clear relationship to survivorship. Two groups of trees with divergent sensitivities to climate were observed in each population, but neither was a clear indicator of survivorship or susceptibility to beetle attack. Growth rate was the best predictor of survivorship with survivors growing significantly slower than beetle-killed trees over their lifetimes although growth rates converged in years just prior to increased beetle activity. Overall, our results suggest that P. albicaulis forests show considerable divergence among populations and within-population genetic sub-structuring, and that they may contain complex mosaics of adaptive potentials to a variety of stressors including D. ponderosae. To protect the ability of this tree to adapt to increasing pressure from beetles, blister rust, and climate change, a top priority should be the maintenance of standing genetic diversity and adaptive shifts in allele frequencies.
A recent outbreak of Dendroctonus ponderosae (mountain pine beetle) in Pinus albicaulis (whitebark pine) has killed trees across large areas. Pinus albicaulis is a semi-naïve host for D. ponderosae (Raffa et al., 2013). It grows in the subalpine zone where cold typically protects it from predation by the beetle. Exceptions occur when warm droughts allow beetles to move upslope and kill trees until normal colder conditions return (Perkins and Swetnam, 1996). However, chronic warming due to climate change has allowed the beetle to persist in many subalpine areas of western North America supporting outbreaks and widespread mortality of mature P. albicaulis (Buotte et al., 2016, 2017; Six et al., 2018). Outbreaks are expected to select for increased resistance in tree hosts over time and selection pressure may be especially strong in a naïve non-coevolved host that lacks a co-evolutionary history with the beetle. In such forests, most trees can be expected to have low levels of defense resulting in high levels of mortality of susceptible genotypes leaving behind rare individuals that exhibit some degree of resistance.
As has been observed in other naïve hosts experiencing outbreaks of D. ponderosae (Clark et al., 2010; Cudmore et al., 2010; Raffa et al., 2013; Burke et al., 2017), P. albicaulis appears to have more reduced defenses than populations of Pinus that have experienced regular pressure from the beetle (Raffa et al., 2017). This has led to fears that the tree may experience severe declines or even local extinction in areas where the beetle is now resident. However, survival of some mature P. albicaulis in forests hard-hit in recent D. ponderosae outbreaks, and the discovery that these trees may be genetically distinct from those that are chosen for attack, indicates adaptation may be occurring in response to increased selection pressure by the beetle (Six et al., 2018). Little research has investigated the possibility of rapid in situ adaptation in conifers due to climate change-driven insect outbreaks. Most bioclimatic models assume that all individuals of a tree species respond similarly and typically incorporate only a few broad ecological parameters (Rice and Emery, 2003; Aitken et al., 2008). These models seldom include phenotypic plasticity, genetic diversity, local adaptation, or the potential for near-term evolution, factors that could lead to substantially different outcomes (Davis and Shaw, 2001; Harte et al., 2004; Savolainen et al., 2007; Aitken et al., 2008). Clearly, there is a need for genetic and phenotypic data to inform our understanding of the potential for evolution to support in situ persistence of tree species to improve model outcomes and to inform conservation approaches.
The ability of P. albicaulis to adapt (here defined as an increase in allele frequencies associated with favorable changes in phenotypes) to increased bark beetle pressure, white pine blister rust (a disease caused by an invasive pathogen, Cronartium ribicola), and changes in climate, will rely to a great degree, on the genetic diversity already existing within affected populations or accessible through gene flow (Kremer et al., 2012, 2014). Many forest trees, including conifers, have high levels of genetic diversity that result in a variety of tree responses to environmental conditions both within and among populations (Savolainen et al., 2007; Kremer et al., 2012; McDowell et al., 2020). This variability forms the basis for subsequent evolution at local scales and may support considerable in situ adaptation in response to climate change (Petit and Hampe, 2006). For P. albicaulis to persist in the face of increasing pressure by D. ponderosae and changing environmental conditions, shifts not only in allele frequencies supporting resistant phenotypes, but also the maintenance of standing genetic diversity, will be crucial.
Conifers are often viewed as slow to evolve because they are long-lived and wind-pollinated. However, many have shown a considerable capacity for rapid local adaptation even with extensive gene flow (Petit and Hampe, 2006). In fact, populations of trees that experience high mortality rates via highly selective agents such as insects and drought may be the fastest to evolve in response to new climatic conditions (Kuparinen et al., 2010). Climate change can lead to increased rates of adaptation of trees both directly and indirectly. Direct effects include decreased or enhanced growth or increased mortality rates in response to changes in temperature and precipitation (Kremer et al., 2014). These, in turn, can initiate a cascade of indirect effects including altered levels of biotic disturbance. This can currently be seen globally where warming temperatures are leading to greater survival and reproductive rates of many forest insects, and tree hosts stressed by drought or heat are becoming more vulnerable to insect herbivory (Jactel et al., 2019; Kolb et al., 2019).
Aggressive tree-killing bark beetle population dynamics are intimately linked to climatic conditions affecting insect demographics and tree physical and chemical defenses (Raffa et al., 2016). Warming can lead to higher beetle population growth rates (Creeden et al., 2014) and highly selective host tree choice by bark beetles can result in differential mortality among trees of the same species due to selection for specific size classes and a suite of other traits, independent of stress (Stephenson et al., 2019). Aggressive bark beetles choose individual trees for colonization using a combination of visual and chemical cues that results in either the initiation of a pheromone-mediated mass attack or rejection (Raffa et al., 2016). The type and quantity of secondary defense chemicals produced by a tree, especially terpenoids, help beetles locate trees, both at a distance, and upon contact (Raffa and Smalley, 1995; Keeling and Bohlmann, 2006; Tittiger and Blomquist, 2017). Additionally, bark beetles exploit several monoterpenes to produce the aggregation pheromones they use to initiate and sustain the mass attacks that allow them to overcome tree defenses (Seybold et al., 2000). The production of secondary defensive chemicals is strongly influenced by tree genotype (Keeling and Bohlmann, 2006; Bullington et al., 2018), which leads to variation in the chemical profiles expressed by individual trees, influencing their relative attractiveness to beetles. Furthermore, trees experiencing drought stress can exhibit decreases in constitutive and induced defenses (Arango-Velez et al., 2011) suggesting that shifts in tree chemistry in response to water deficit may influence the ability of beetles to successfully attack trees. However, how this may translate to effects on beetle choice of individual trees is unclear. In piñon pine, Trowbridge et al. (2019) found that increased emission rates of terpenoids during warm periods were offset by decreases in production resulting in no net change in emission rates overall. This may generally be the case, but more work is needed to understand how variability in precipitation, whether it involves drought or above average rainfall, influences attraction or repulsion of beetles to particular trees.
Another trait under genetic control that may influence beetle host choice is growth rate (Millar et al., 2012; George et al., 2015). Tree growth rate reflects an individual tree’s response to environmental conditions including temperature and water availability (Rehfeldt et al., 2014; Kolb et al., 2019 and references therein). Slower growth rates have been correlated to increased likelihood of beetle attack in a number of conifers (Millar et al., 2012; Knapp et al., 2013; George et al., 2015; Keen et al., 2020). However, several studies have found greater beetle-caused mortality in faster-growing conifers (de la Mata et al., 2017; Cooper et al., 2018) including P. albicaulis (Kichas et al., 2020) or no difference (Cooper et al., 2018). Millar et al. (2012) observed that P. albicaulis that survived D. ponderosae in eastern California had greater growth during the 20th century than those killed by beetles; however, the trees that were killed had grown better than survivors during the 19th century. The variable influence of growth rate observed in these studies may be due to genetic differences within and among tree species, which in turn, influence their responses to drought (Cooper et al., 2018), and the density of their sapwood (Britez et al., 2014; Rosner et al., 2014; George et al., 2015). Fast-growing trees tend to produce lower density wood with larger xylem elements (Wang and Aitken, 2011) that are less able to sustain capillary action and more prone to cavitation when water availability is reduced (LoGullo et al., 1995; Linton et al., 1998; Sperry et al., 2006). In contrast, trees that slow their growth in response to lower severity long-term drought, or that are genetically predisposed to slower growth, may require less water to maintain evapotranspiration streams and may be more tolerant to drought (Moran et al., 2017). Particular suites of genetic-based traits may also be correlated. For example, trees with different growth strategies (fast or slow) may invest in different defense characteristics, that together, influence host selection by beetles (Kane and Kolb, 2010; Sampedro, 2014; Kichas et al., 2020). Alternately, decoupling chemical, morphological and physiological traits related to defense may reduce the potential for directional selection and act to maintain a diverse defense syndrome (Mason et al., 2018).
For P. albicaulis, the severity of white pine blister rust infections can also influence likelihood of beetle attack. The probability of attack increases with increasing infection severity except when infection severity is very high, in which case, trees are avoided (Six and Adams, 2007; Dooley and Six, 2015).
Once D. ponderosae outbreaks are initiated, mass attacks mediated by aggregation pheromone release have been thought to override selectivity for individual trees with particular resistance traits (Logan et al., 1998; Wallin and Raffa, 2004). However, this may not entirely be the case. After outbreaks collapse, typically some mature trees of the preferred host tree species and diameter class remain (Erbilgin et al., 2017; Six et al., 2018). That these trees are not attacked, even when beetle numbers are high and suitable host trees have become scarce, suggests beetles avoid or do not recognize trees with particular phenotypes/genotypes. Evidence supporting this idea has been found in both P. albicaulis and P. contorta where survivors had distinct genetic profiles (Six et al., 2018) and in P. contorta where survivors had different chemical phenotypes (Erbilgin et al., 2017). Such genetic and trait-based survivorship should not be surprising as it has undoubtedly been the basis for natural selection between insects and trees for as long as both have coexisted. However, the process may be especially important to understand during these times of rapid anthropogenic change in both climate and forest structural and functional conditions.
In this study, we used genetic and chemical profiles along with growth rates and climate data to investigate whether recent D. ponderosae outbreaks resulted in potentially adaptive shifts in affected P. albicaulis forests. We also assessed genetic diversity at each site. While strong selection events can aid and speed forest adaptation (Kuparinen et al., 2010; Alberto et al., 2013; Kremer et al., 2014), they can also reduce overall genetic diversity through reductions in effective population size and drift (Yeaman and Jarvis, 2006). Such reductions can reduce the overall ability of a population or species to adapt to future change even if the event that led to lower diversity improves fitness in the short-term (Yeaman and Jarvis, 2006).
We specifically tested the following hypotheses: Mature P. albicaulis that survived the outbreak are genetically distinct and possess lower genetic diversity than smaller trees that escaped beetle predation (used as a proxy for the population without beetle predation), possess characteristic chemical profiles, exhibit different growth rates from beetle-killed trees, and are less sensitive to drought and temperature. We also predicted that drought was related to outbreak initiation.
Three broad, relatively flat locations were selected as study sites to reduce microsite variability in aspect, slope, and soil moisture, factors that influence tree vigor, production of defenses, and tree growth (Supplementary Figure 1). Two sites, Vipond Park and Poverty Flat, experienced high rates of mortality during the recent west-wide outbreaks of D. ponderosae in whitebark pine (2000–2012) (Perkins et al., 2015, DLS, personal observation) while Lacy Creek had very low levels of beetle activity over the same period.
Vipond Park is a high elevation plateau located on the Beaverhead National Forest, Montana, USA (centroid location 45.6974°N, 112.9106°W, 2,501 m elevation). The site is a mix of grasslands and open forest stands positioned at the transition zone where species shift from mid-elevation P. contorta to high elevation P. albicaulis, with the latter species dominant (∼90%). The site is relatively xeric with a diverse herbaceous cover of perennial forbs and grasses. The area experienced an outbreak of D. ponderosae from 2007 to 2013 (with beetles becoming active at least as early as 2005, DLS, personal observation) when approximately 95 and 70% of mature P. albicaulis and P. contorta, respectively, were killed. The outbreak ceased abruptly, coinciding with early cold fall temperatures in 2012 and a massive reduction in host trees of suitable size. No trees were observed to have been killed by D. ponderosae in years prior to the recent outbreak although a few large diameter stumps occurred throughout the site.
Poverty Flat is a high elevation plateau and located on Bureau of Land Management-administered land just south of Challis, ID, United States (centroid location 44.3189N, 114.3584W, elevation 2,880 m) approximately 240 km west of Vipond Park. It is also a xeric site with a perennial herbaceous and grass cover. The forest consists of open, nearly pure stands of P. albicaulis. Mortality was lower than at Vipond Park and estimated at about 52% of mature whitebark pine trees. Unlike Vipond Park, forests at Poverty Flat contained numerous trees killed during a west-wide cluster of D. ponderosae outbreaks that occurred between 1909 and 1940 (Ciesla and Furniss, 1975; Perkins and Swetnam, 1996). The recent beetle outbreak occurred at the site from 2003 to 2012 (Perkins et al., 2015).
Lacy Creek is located in the Beaverhead National Forest, Montana, United States, approximately 27 km southwest of Vipond Park (centroid location 45.5876°N, 113.2435°W, elevation 2,508 m). The site is relatively mesic in comparison with the Vipond Park and Poverty Flat sites. The site has a slight northeast aspect and the groundcover is dominated by Vaccinium scoparium (grouse whortleberry), Xerophyllum tenax (bear grass), and Luzula sp. (woodrush). The forest consists of about 67% P. albicaulis and 33% P. contorta. Only a few trees observed were killed by D. ponderosae (<0.5%) in the 2000s (DLS, personal observation) although standing and fallen trees killed during a previous outbreak in the 1940s were commonplace.
Transects were established at Vipond Park in early August 2016–2017, at Poverty Flat in late July 2017–2018, and at Lacy Creek in early August 2018. Belt transects approximately 5 m wide were initiated using random compass bearings extending into forested areas until the targeted number of trees was reached. Number and length of transects varied by location due to the patchy nature of stands at each site except Lacy Creek where forests were continuous. At Lacy Creek, new transects were initiated when we encountered slopes or stands dominated by lodgepole pine. When P. albicaulis trees occurred in clumps [likely due to seed caching by Nucifraga columbiana (Clark’s nutcracker), a bird that is the main dispersal agent of the tree (Hutchins and Lanner, 1982; Lorenz et al., 2011; Schaming, 2016)], we measured or sampled only a single stem per clump to avoid sampling multiple trees that may have originated from a single cone/parent.
Dendroctonus ponderosae is constrained to colonizing only larger diameter trees to have sufficient resources to complete development. Therefore, prior to sampling, we established transects to determine the diameter distribution of beetle-killed P. albicaulis at each site by measuring their diameter at breast height (DBH, 1.4 m above the ground). This distribution provided site -specific information on the cut-off diameter below which trees were not attacked. This distribution was then used to choose ‘survivor’ trees, ones that had similar diameters to beetle-killed trees but showed no signs of being attacked during the outbreak. We then chose ‘general population’ trees (hereafter generals) that were mature trees that fell several centimeters below the diameter distribution of beetle–killed trees and escaped predation presumably because they were too small. We could not sample DNA or terpenoids from beetle-killed trees so generals were used as proxies to estimate the genetic and phenotypic diversity that was present in each tree population without beetle predation with the assumption that they were representative of the population as whole prior to the beetle outbreak. We hypothesized generals would contain a similar proportion of individuals with survivor genotypes and phenotypes as was observed in the sampled population overall. For example, in a population where 5% of large trees survived, generals were predicted to contain roughly 5% trees with survivor genotypes/phenotypes and 95% with susceptible genotypes/phenotypes.
In transects used for sampling, beetle-killed trees were measured for diameter at 1.4 m (DBH) and then cored to the pith on two opposing sides at the same height above the ground using an 5.2 mm diameter increment corer. Basal area (the cross-sectional area of trees per unit area of land and a measure of tree density) was taken of surrounding dead and live trees at each sampled tree using a 10-basal area factor prism. Survivor and general population trees were measured for DBH and similarly cored after which a 2.5 cm diameter arch punch and rubber mallet were used to remove a disk of bark and phloem from opposing sides of each tree. The thickness of the phloem was measured on each disk to the nearest half mm. Phloem thickness was measured because it, along with symbiotic fungi, forms the diet of most bark beetles and is thought to play a role in the selection of a tree for colonization. The phloem was removed from the bark, sealed in a vial, and placed on ice for later chemical analyses. A clump of current-year needles was removed from the tip of a branch of each tree for DNA extraction and placed into a small plastic bag containing silica gel desiccant for later genetic analyses. We then rated each tree for white pine blister rust infection severity using the method developed by Six and Newcomb (2005). This method partitions the tree into sections and assigns each a rating based on visible symptoms. The ratings are then summed for a total rating for each tree. Possible total tree ratings range from 0 to 18 with zero indicating no visible infection and 18 complete infection.
All samples from the same tree received the same tracking code. Sample sizes varied by category (survivor, beetle-killed, general) and site and can be found in Table 1.
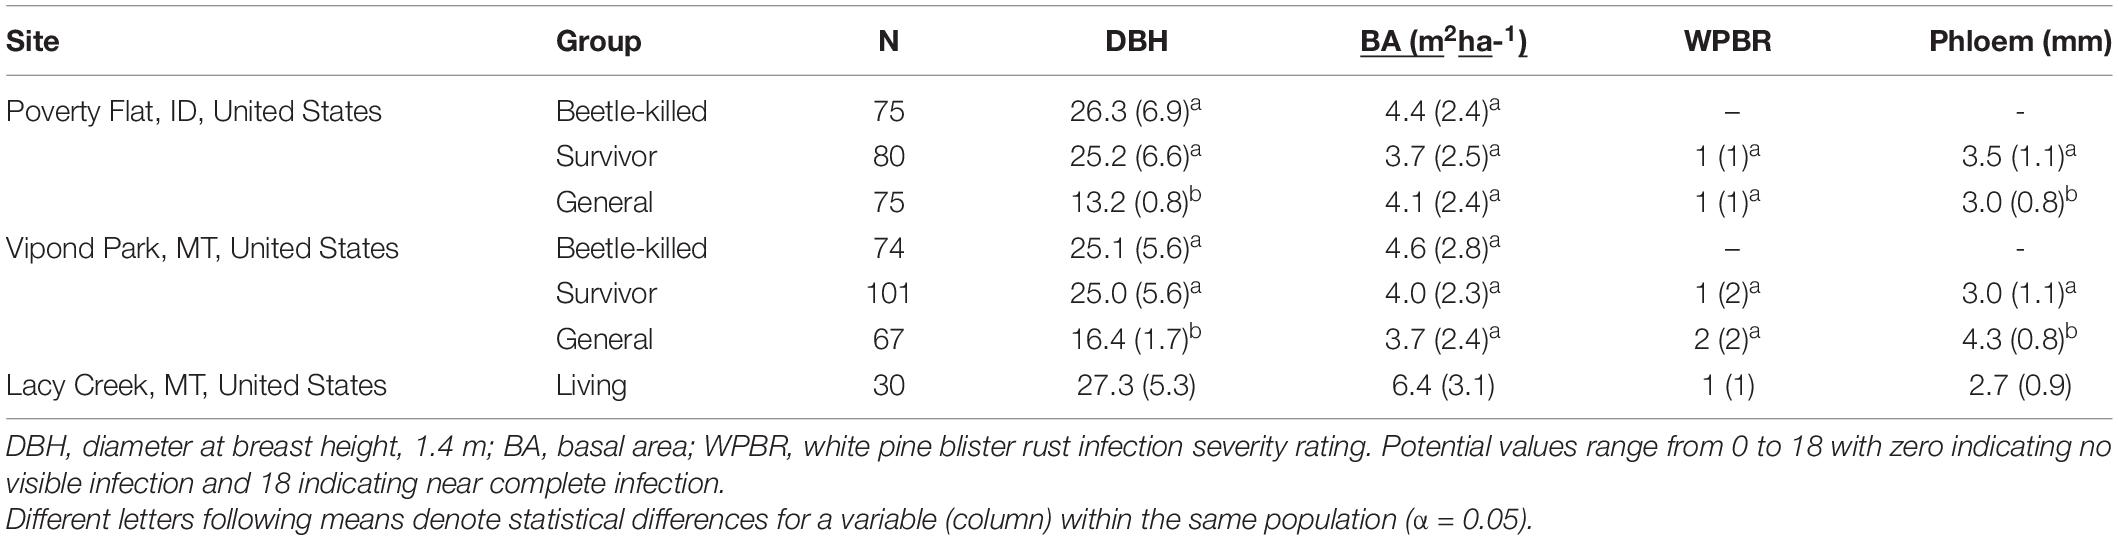
Table 1. Summary statistics [mean (SD)] and comparisons for categories of Pinus albicaulis at the three sites sampled in this study.
Needles were fully dried in silica gel and then 3–5 needles from each sample were ground to a fine powder in liquid nitrogen. DNA was extracted from the powder using a Qiagen DNeasy plant extraction kit following the producer’s protocol. We used inter-simple sequence repeats (ISSRs) to develop genetic profiles of individual trees. ISSRs are regions within microsatellites that target highly variable regions and are able to detect high levels of polymorphism (Parasharami and Thengane, 2012). ISSRs are highly reproducible and useful for comparing diversity among individuals and within and among populations when the genetic basis of a trait, such as resistance, is not known. Three ISSR primers were used: 17899A (GTG TGT GTG TGT CA), UBC 818 (CAC ACA CAC ACA CAC AG), and UBC 809 (AGA GAG AGA GAG AGA GG) (Parasharami and Thengane, 2012). For PCR amplification we used a 25 μl reaction mixture combining 12.5 μl Promega Master Mix (Promega, Madison, WI, United States), 2.5 μl RNA-free water, 8 μl 0.5 M primer and 2 μl DNA template. Reactions were run with one of the three primers with 1 cycle denaturation at 95°C for 5 min, followed by 42 cycles of denaturation at 95°C for 1.3 min, annealing at 47°C for 2 min, and extension at 72°C for 1 min (Parasharami and Thengane, 2012).
PCR products were visualized in a 1% agarose gel using 1X Tris borate buffer (TBE) with the addition of 2 μl ethidium bromide per 100 ml gel mixture. A 100 bp ladder (Promega, Valencia, CA, United States) was added to one lane of each gel to provide a reference for scoring bands. Each sample lane received 5 μl amplified PCR product with bromophenol blue as a running dye. The gel was run with 1X TBE as a running buffer at 70 mA until the dye moved 1/4 length of the gel. Gel images were captured using a UV table and a digital camera. Only clear bands were scored and ambiguous gels were run a second time and compared. A subset of 30% of the samples were rerun to check for consistency in band resolution. Bands were scored manually.
Phloem samples were moved from ice and stored at –80°C immediately upon return from the field and then shipped on dry ice to the Montana State University Spectrophotometry Lab for analysis. Small blocks of phloem were pulverized and placed into n-hexane (1 ml/mg) for 1 h for extraction. Gas chromatography (GC)-mass spectrometry (MS) analysis of extracts was performed on an Agilent 7890A GC coupled with Agilent 5975C inert XL EI MSD with a triple axis detector. Sample organization and injection was performed by an Agilent 7693 auto sampler. The separation was performed using Phenomenex Zebron ZB-5MS non-polar column (30 m × 0.25 mm ID) 0.25 μm. The GC conditions were as follows: the oven temperature was set at 60°C and held for 2 min, then the temperature was ramped to 120°C at the rate of 20°C/min and from 120 to 155°C at the rate of 6°C/min. In the final step, the temperature was ramped to 300°C at 14.5°C per min and held at that temperature for 10 min. Helium was used as the carrier gas at a flow rate of 1.5 mL/min. One μL samples were injected at 325°C with a split ratio of 10:1. Samples separated by GC were interfaced to MS at 230°C. The MS source was set at 230°C and quad temperature at 150°C. The acquisition range was set between 30 to 550 amu at a scan rate of 5.2 scans/s.
Individual compounds were identified by comparing retention times of known pure standards and mass spectra using the NIST library (2014) and Agilent Masshunter 8.0 software. Concentrations for each compound were calculated using 6-point calibration curves with known amounts of pure standards (Restek Corp.).
Increment cores were dried and then mounted and sanded according to standard procedures (Speer, 2010). Crossdating was then done visually followed by measuring of ring widths to 0.001 mm precision on a Velmex measuring stage using J2X software (Voortech Consulting, NH). Two people measured the rings of each core and when discrepancies arose worked together to determine the source and to make corrections. Crossdating and measuring accuracies were checked using the program COFECHA (Holmes et al., 1986). Ring widths were converted to annual basal area increment (BAI). BAI maintains absolute variation between series both spatially and temporally, in contrast to the usual dendrochronological procedure of detrending ring-width series with best-fit curve standardization, which retains only relative variations between trees or stands (Biondi and Qeadan, 2008). BAI was normalized by basal area for individual trees (BAI/BA) to account for tree size differences associated with microsite variations and allowed us to more precisely examine relative climate and disturbance growth responses (e.g., McDowell et al., 2010). Cores that were missing sections, or did not reach near or to the pith, were excluded from BAI/BA chronologies for each site.
Two-sample t-tests were used to compare tree diameters, basal area, white pine blister rust infection severity ratings, and phloem thickness among categories (beetle-killed, survivor, general) within sites using Statistix 10 (Analytical Software, Tallahassee, FL, United States).
A combined binary matrix (band present = 1, band absent = 0) for bands resolved using the three ISSR primers was analyzed using POPGENE v. 1.32 (Yeh et al., 1997) to calculate percent band polymorphism, Nei’s gene diversity index (h), and genetic diversity within (HS) and between categories (HT).
Genetic variation among categories and sites was examined using analysis of molecular variation (AMOVA) and PHiPT analysis in GenAlEx 6.5 (Peakall and Smouse, 2006). STRUCTURE 2.3.4 (Pritchard et al., 2000) was used to analyze population genetic structuring. STRUCTURE is a Bayesian model-based approach that presumes Hardy–Weinburg equilibrium and linkage disequilibrium and assigns individuals to clusters according to their probability of assignment. STRUCTURE analysis was performed using the entire dataset as well as each population individually with a burnin period of 20,000 iterations followed by 100,000 Monte Carlo Markov chains under the assumption of an admixture model with K values ranging from 1 to 10 and with 20 runs per K value. STRUCTURE outputs were entered into Structure Harvester v0.6.94 (Earl and vonHoldt, 2012) to detect the K with the greatest likelihood and least standard deviation for each analysis.
Chemical data analyses were conducted in R (4.02) using the R Studio (1.3.1073) packages vegan (multivariate analyses; Oksanen et al., 2019), factoextra (visualizing PCA; Kassambara and Mundt, 2020), FactoMineR (visualizing PCA; Le et al., 2008), and ComplexHeatmap (visualizing heatmaps; Gu, 2016). Proportional composition of terpenoid compounds were logit transformed [log(proportion/1-proportion)]. Differences in terpenoid composition among sites and categories (i.e., among survivors and generals) were analyzed using permutational multivariate analyses of variance (PERMANOVA) (Anderson, 2014; Oksanen et al., 2019) using Manhattan distance. Patterns of terpenoid composition among sites and trees were examined through community analyses of compounds using principal components analysis (PCA). Screeplots and factor loadings are provided in Supplementary Figure 1. We also applied hierarchical clustering using Ward’s minimum variance to detect general differences among and within sites and categories. Heatmap values were z-standardized ([observation-mean]/standard deviation) for each grouping independently for ease of visualization.
For individual chemical comparisons at sites that experienced outbreaks, two-sample t-tests were run using Statistix 10 comparing concentrations of terpenoids from survivors and generals at Vipond Park and Poverty Flat.
Pearson product correlation analyses were performed comparing concentrations of each terpenoid and total terpenoid concentration to tree DBH, relative tree age (using number of rings present in cores taken at 1.4 m as a proxy for true tree age), and mean BAI/BA for the last 5 years of tree growth using Statistix 10. BAI/BA for the last 5 years were chosen for use because these were the most likely to reflect the potential influence of environmental conditions on growth and terpenoid concentrations in the samples (Ferrenberg et al., 2014).
BAI/BA chronologies were developed by tree category and site. We also developed separate chronologies for beetle-killed and survivor trees grouped as younger (<100 years old at 1.4 m) and older (>100 years old at 1.4 m) to examine differences in growth rates as influenced by age. Resulting line graphs suggested that younger and older trees exhibited different growth rates and that these rates changed over time. Therefore, we conducted paired t-tests using Statistix 10 comparing mean annual growth by year of younger and older beetle-killed and survivor trees as well as generals for different time periods (see section “Results”).
Climate data were retrieved from the West Wide Drought Tracker site (Abatzoglou et al., 2017) using site-specific centroid coordinates. Trees at least 100 years old at 1.4 m were selected for inclusion in correlation analyses. Pearson product correlations were run with Statistix 10 using BAI/BA chronologies for each site with the following climate variables for January–December 1950–2005: mean monthly Palmer Drought Severity Index [PDSI, a measure of regional soil moisture availability based on water supply and demand (Abatzoglou et al., 2017)], mean monthly temperature, and mean precipitation. This time period was chosen to encompass several decades leading up to the outbreak but avoided within- and post-outbreak periods to remove the potentially confounding effect of growth release that can occur when competition in a stand is relieved through the loss of many dominant trees (Campbell et al., 2007). We also ran Pearson product correlations with climate data lagged 1 year to see if current or previous year climate had the greatest effect on growth.
Correlation analyses using means for all trees within a category at a site may fail to detect subsets of trees that respond differently to climate. Therefore, Pearson product correlations were run with each tree with each of the climate variables for the 1950–2005 period and BAI/BA. Once correlation coefficients for these comparisons were tabulated, two groups of trees became apparent: one we refer to as ‘climate sensitive’ with correlation coefficients of >0.2 or <–0.2 for PDSI for at least eight of the 12 months used in analyses (Supplementary Appendices 2–4). The second ‘non-sensitive’ group exhibited no-to-few correlations with PDSI although some were responsive to other variables (Supplementary Appendices 2–4). We considered them responsive to these other variables if 50% or more trees within a category had correlation coefficients of >0.2 or <–0.2.
Mean diameter of beetle-killed trees and survivors were similar within and among sites (Table 1). However, the diameter distribution of survivors at Vipond park was skewed more toward trees with larger diameter than the distribution of beetle-killed trees (P = 0.023) while the opposite was the case at Poverty Flat (P = 0.013). As expected per the sampling design, general trees were significantly smaller than beetle-killed and survivor trees at Vipond Park and Poverty Flat. BA did not differ among categories within sites or for trees at Vipond Park and Poverty Flat, but was greater at Lacy Creek. White pine blister rust infection severity was overall very low at all three sites. There was no difference in infection severity between survivor and general trees within sites. Most trees exhibited no signs of infection and we excluded infection as a potential confounding factor influencing tree choice (Table 1). Phloem thickness also did not appear to influence beetle choice. Phloem was significantly thicker in generals than survivors at Vipond Park while the opposite was true at Poverty Flat. Phloem was thinnest in trees at Lacy Creek (Table 1).
Twenty-three, 19, and 18 bands were resolved for the primers 17899A, UBC809, and UBC818, respectively. Percent band polymorphism was 100% for all sites combined, but ranged from 53.3 to 81.7% by category (Table 2). The highest band polymorphism and genetic diversity occurred in Poverty Flat survivors and trees at Lacy Creek. For both Poverty Flat and Vipond Park, band polymorphism and genetic diversity were higher in survivor than in general trees (Table 2). AMOVA indicated 79% of genetic variation occurred within groups while 21% was among groups (PhiPT = 0.205, df4,187, P = 0.001). Genetic distance did not correspond well with geographic distance. The greatest genetic distance occurred between Poverty Flat survivors and Lacy Creek trees (from sites geographically distant) followed by Poverty Flat survivors and Poverty Flat generals (trees co-existing at the same site) (Table 3). The least genetic distance was between Vipond Park generals and Vipond Park survivors (Table 3).
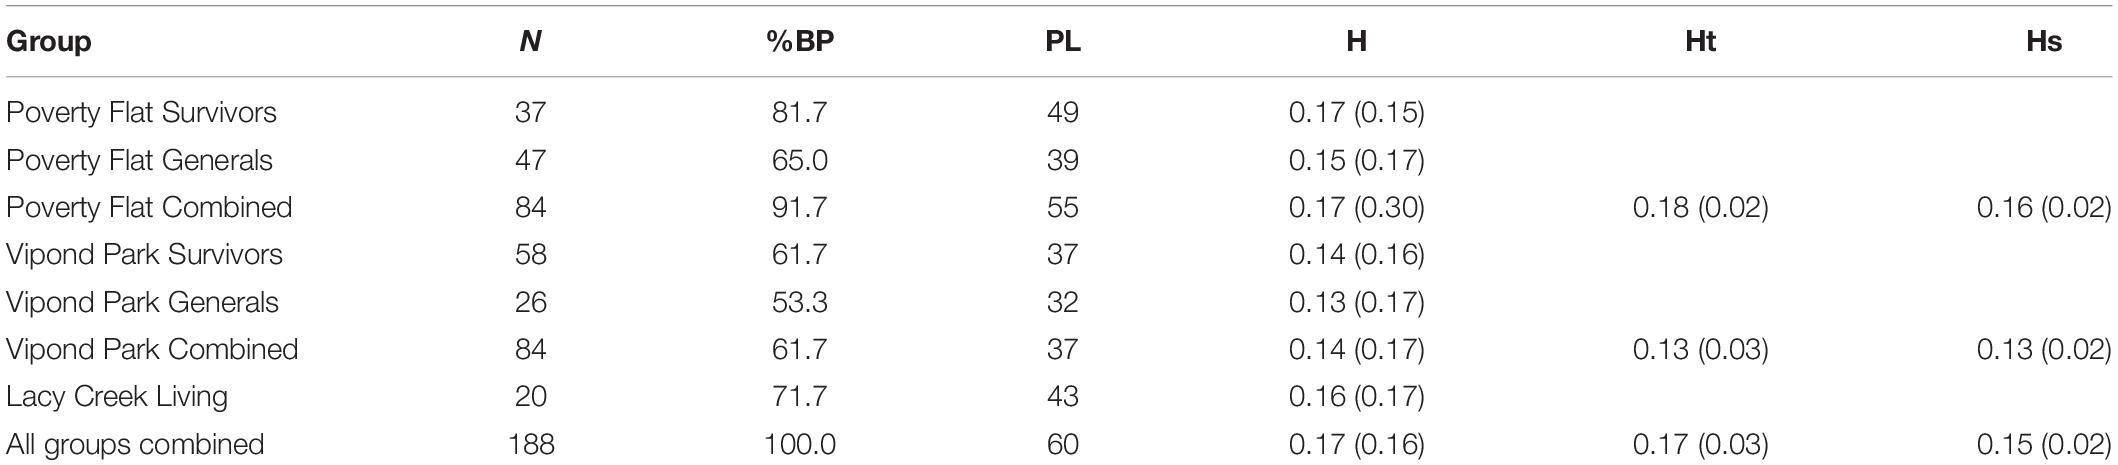
Table 2. Mean (SD) percent band polymorphism (BP), number of polymorphic loci (PL), Nei’s genetic diversity (h), and diversity within (HS) and between (HT) categories of Pinus albicaulis.
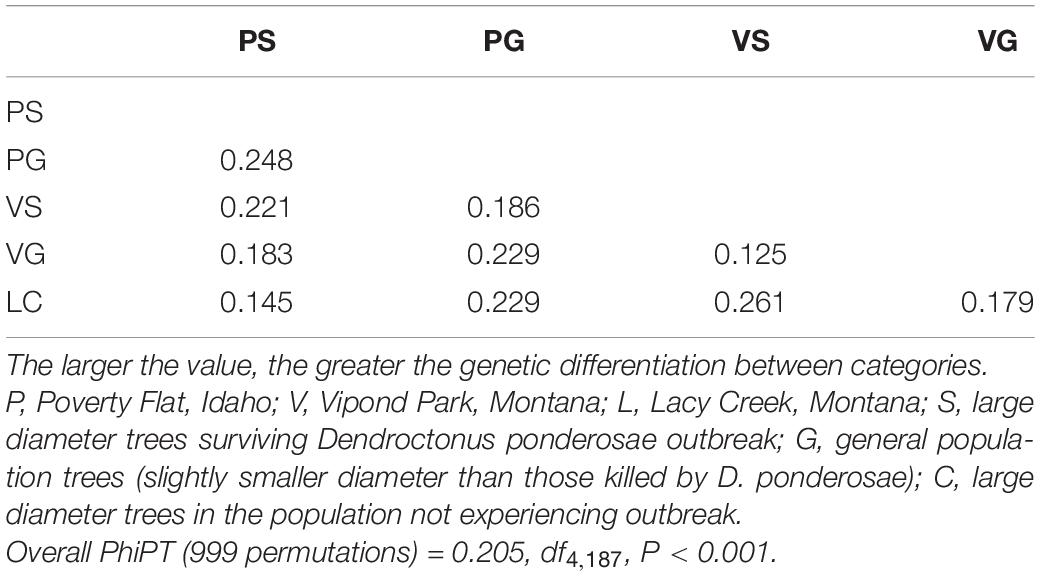
Table 3. Pairwise population PhiPT analysis for Pinus albicaulis.
Analysis using STRUCTURE followed by Structure Harvester with the full dataset (all sites and categories) suggested the highest likelihood and lowest standard deviation occurred for K = 2 (Figure 1A) although these values did not differ much from those generated for K = 2–7. Therefore, we ran analyses individually for all three sites (Figures 1C–E). In each of these, the greatest likelihood and lowest standard deviation occurred clearly for K = 2. We then re-ran the analysis using the full dataset with K set to 6 (Figure 1B). In the final combined (Figure 1B) and site specific analyses for Poverty Flat (Figure 1C) and Vipond Park (Figure 1D) partitions reflected our assignment of trees to survivor or general categories although with considerable admixure in Vipond Park survivors and generals (Figure 1D).
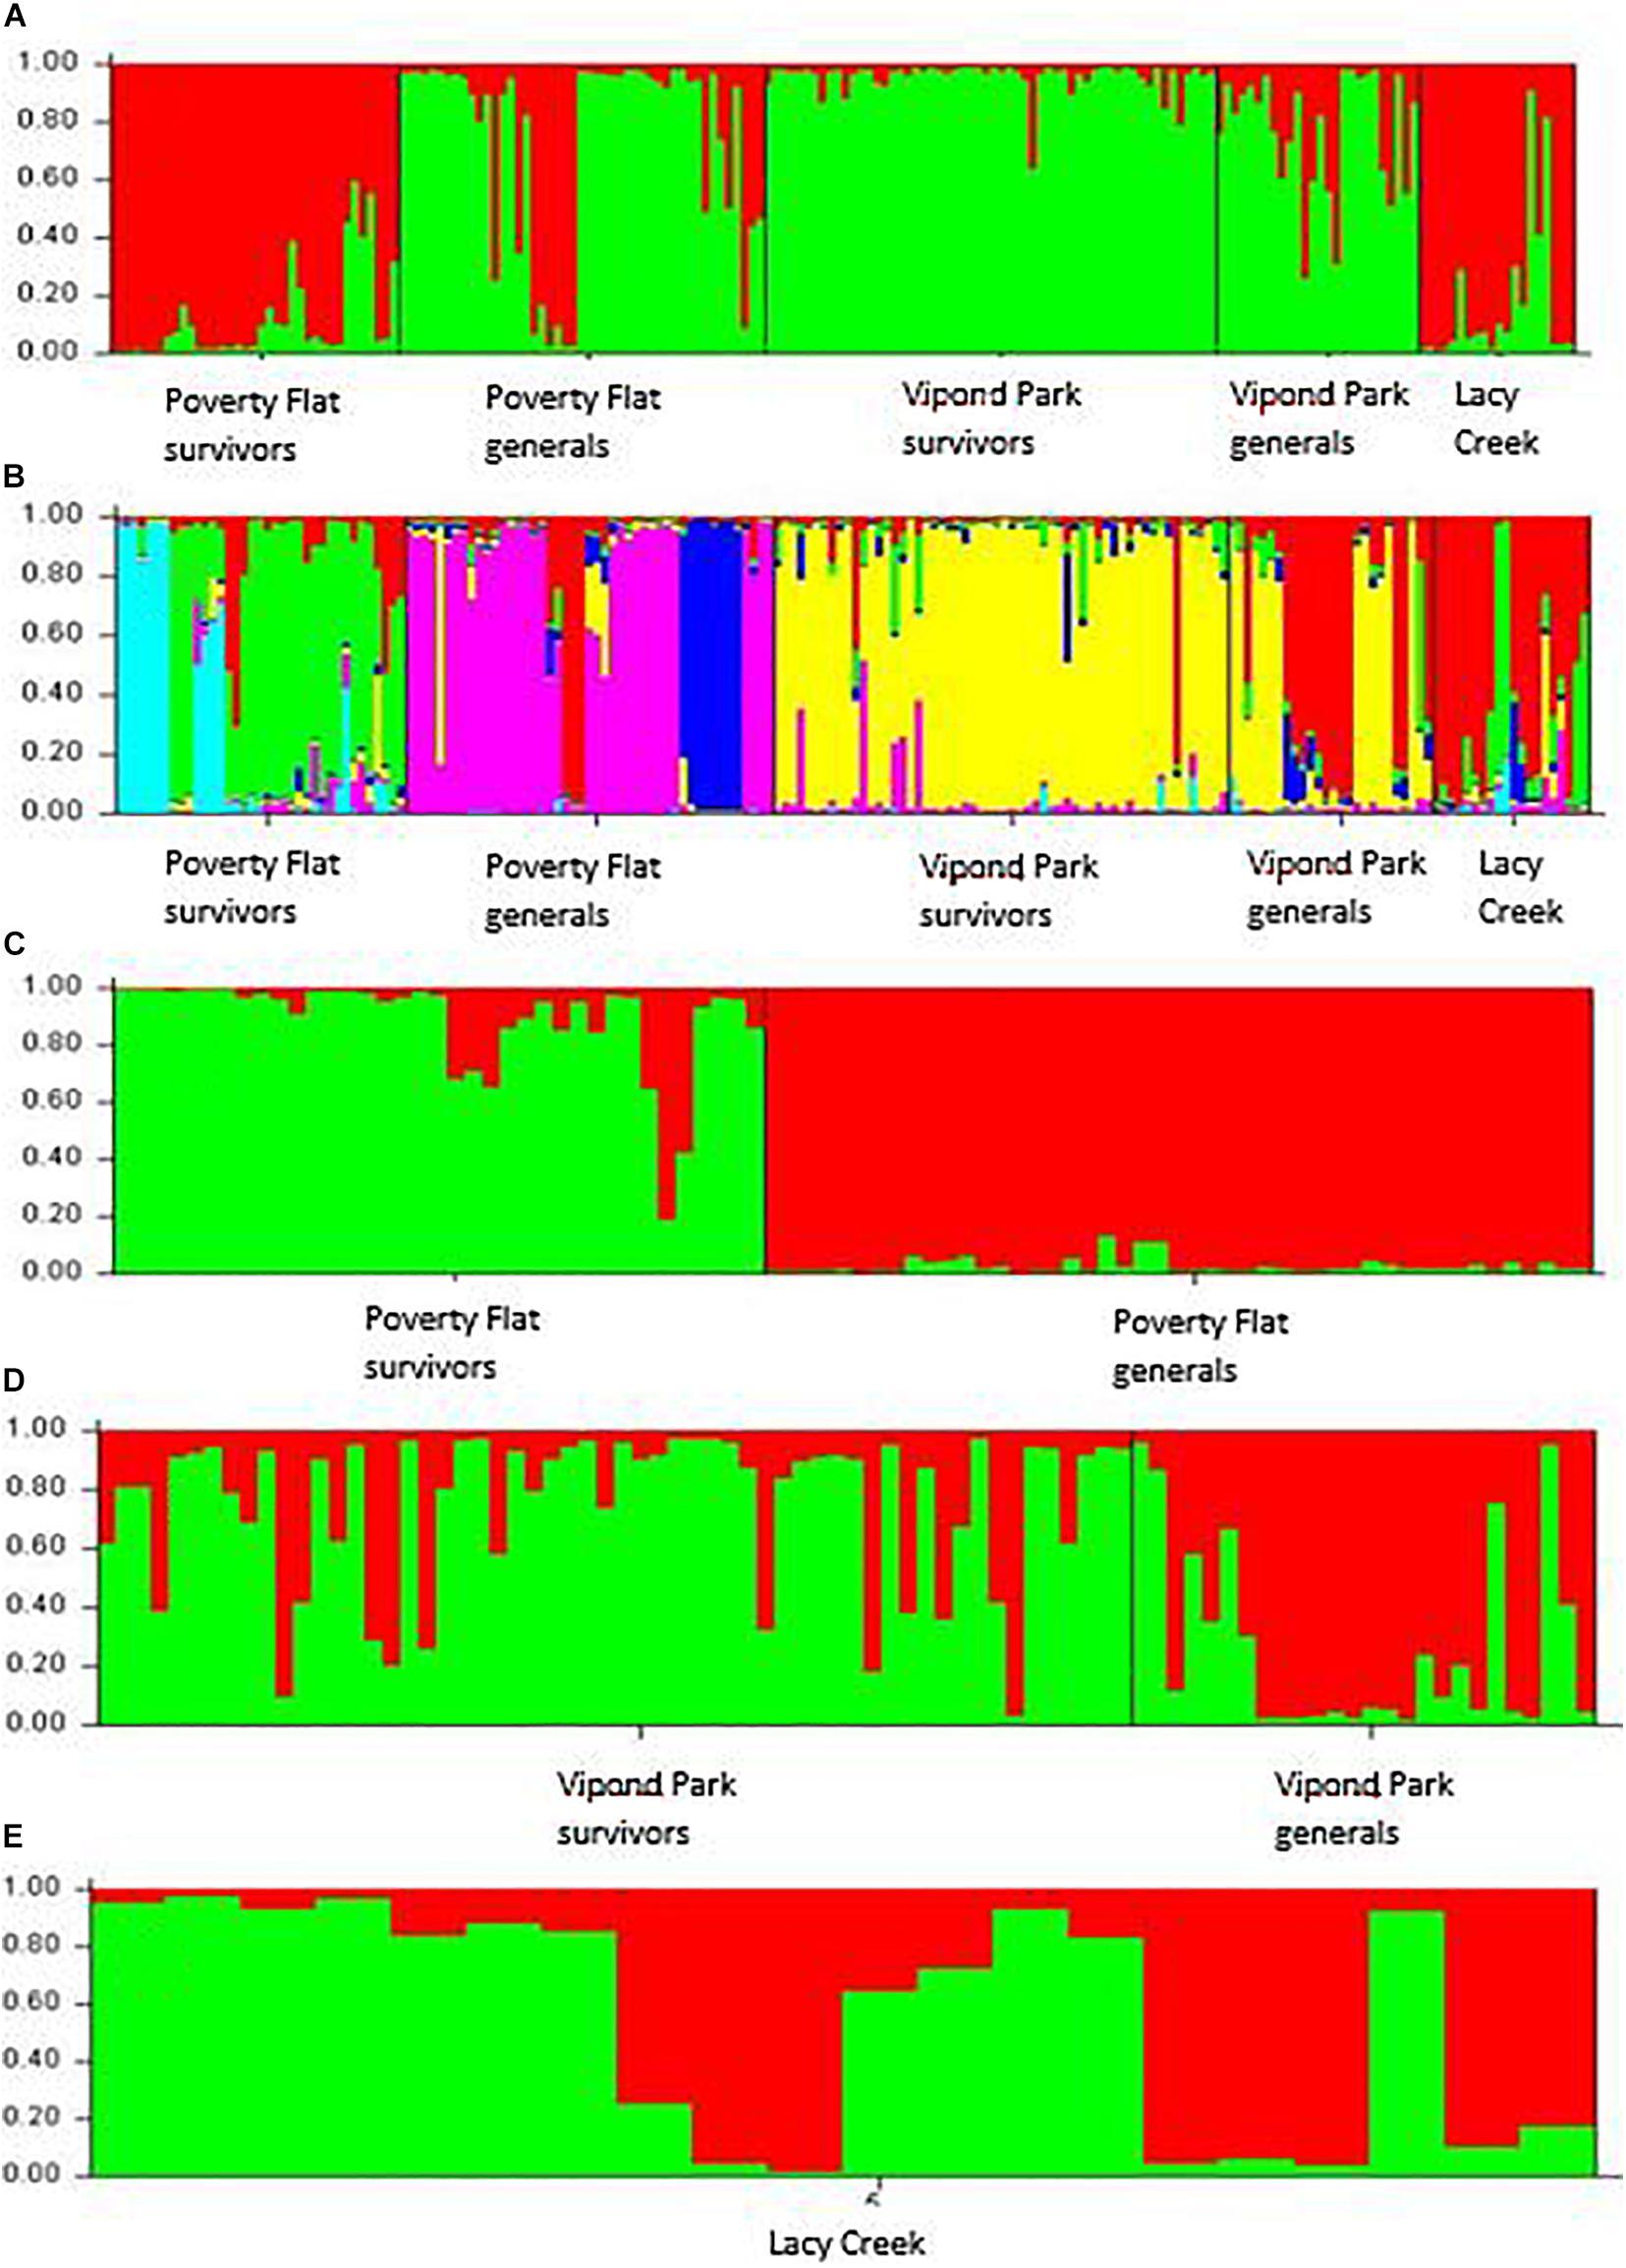
Figure 1. STRUCTURE analysis of inter-simple sequence repeat data for Pinus albicaulis survivors and generals at Poverty Flat, ID, Vipond Park, MT (populations experiencing a Dendroctonus ponderosae outbreak) and living trees at Lacy Creek, MT (no outbreak) (specifics provided in text). (A) All sites and categories combined assuming K = 2 based on initial STRUCTURE analysis prior to analysis by site. (B) All sites and categories combined assuming K = 6 based on outcomes of individual site analyses. (C,D) Analysis by site supported K = 2 at each: (C) Poverty Flat, (D) Vipond Park, and (E) Lacy Creek.
There was considerable variation in the concentrations of terpenoids as well as total amounts produced among sites and among and within categories (Table 4). Overall, trees at Poverty Flat and Lacy Creek produced the highest total concentrations while trees at Vipond Park produced substantially lower concentrations of most, but not all, terpenoids. Specifically, survivors at Poverty Flat produced the highest concentrations of total terpenoids while survivors at Vipond Park produced the lowest total concentrations for trees in any category or population.
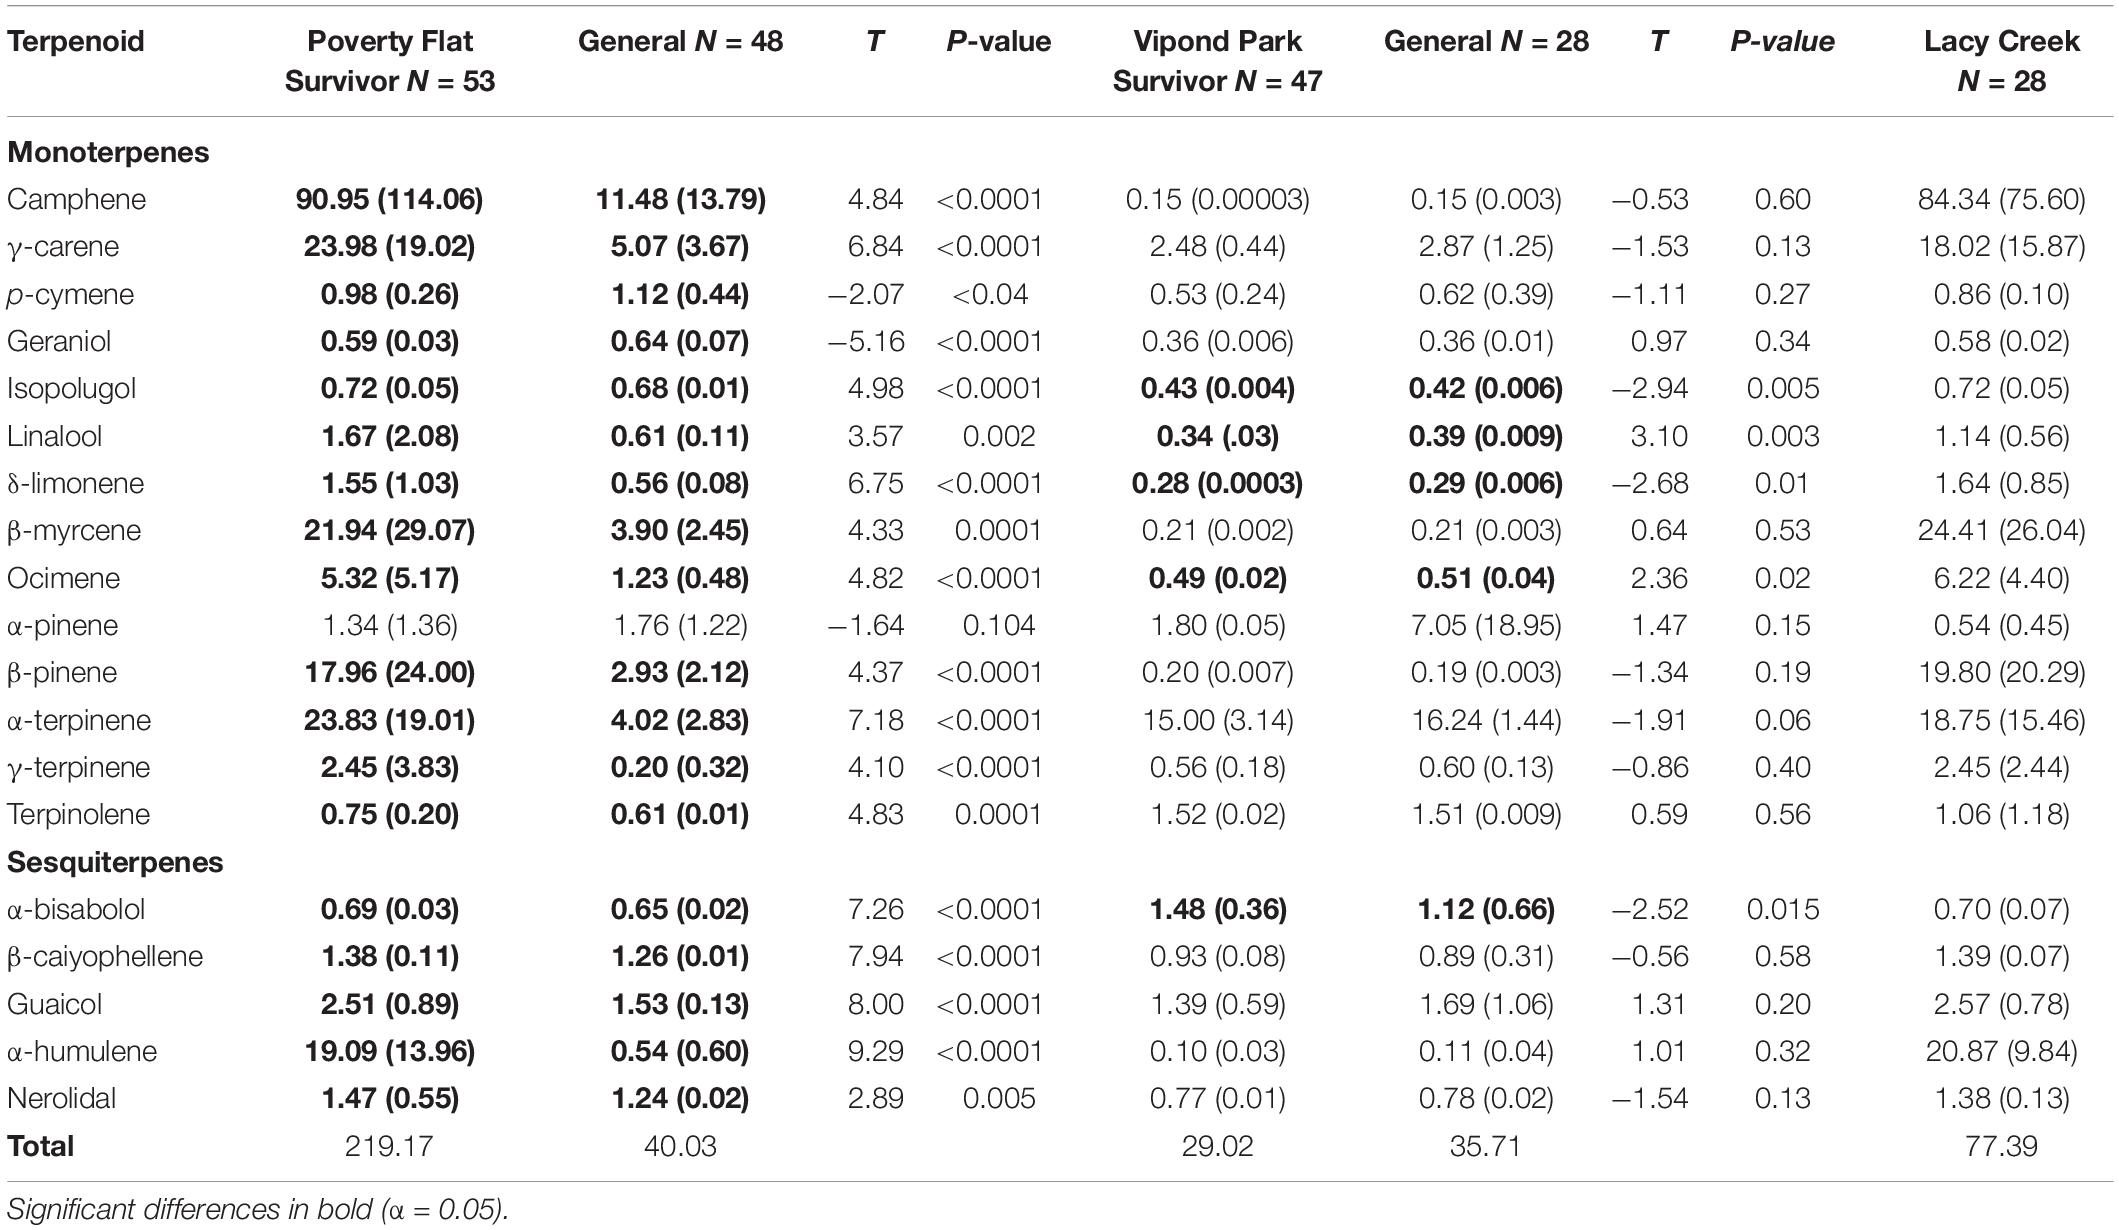
Table 4. Comparisons of mean (SD) of terpenoid concentrations (mg/g) of survivor and general Pinus albicaulis at two sites affected by a recent Dendroctonus ponderosae outbreak and statistics for trees at a third site unaffected by the outbreak.
Within sites, various terpenoids were significantly different between survivor and general trees. At Poverty Flat, all compounds (with the exception of α-pinene) differed between survivors and generals, and these differences were often substantial (Table 4). Notably, concentrations were typically higher in survivors than in generals with the exception of p-cymene and geraniol (Table 4). Interestingly, trees at Poverty Flat and Lacy Creek exhibited the highest concentrations of camphene while α-terpinene was produced in the highest concentrations within trees at Vipond Park (Table 4). At Vipond Park, only six terpenoids differed in concentration between survivors and generals where α-bisabolol, isopolugol, linalool, δ-limonene and ocimene were higher in survivors while α-terpinene was lower. Although these differences were significant, it is prudent to note that differences were quite small (Table 4).
Consistent with the variation in concentrations, terpenoid compositional profiles also varied both among and within sites (Figure 2; full PERMANOVA results are presented in Supplementary Table 1). Overall, among site differences were greater than differences between survivors and generals (Figure 2A) as site explained 52% of the observed variability, category explained 6%, and their interaction explained 8% (Figure 2; PERMANOVA; all P < 0.001). Site separation of Lacy Creek and Poverty Flat from Vipond Park was primarily driven by a gradient of α-pinene, γ-terpinene, b-myrcene, b-pinene, and camphene (Figure 2A). At Vipond Park, we failed to observe notable separation among generals, and younger and older survivors (Figure 2C; PERMANOVA; P = 0.12). However, at Poverty Flat, there was broad separation between generals, and younger and older survivors (Figure 2D; PERMANOVA; P < 0.001). Separation among generals and survivors at Poverty Flat was primarily driven by a gradient of camphene, α-humulene, and ψ-terpinene, to ocimene, p-cymene, δ-limonene, and α-pinene.
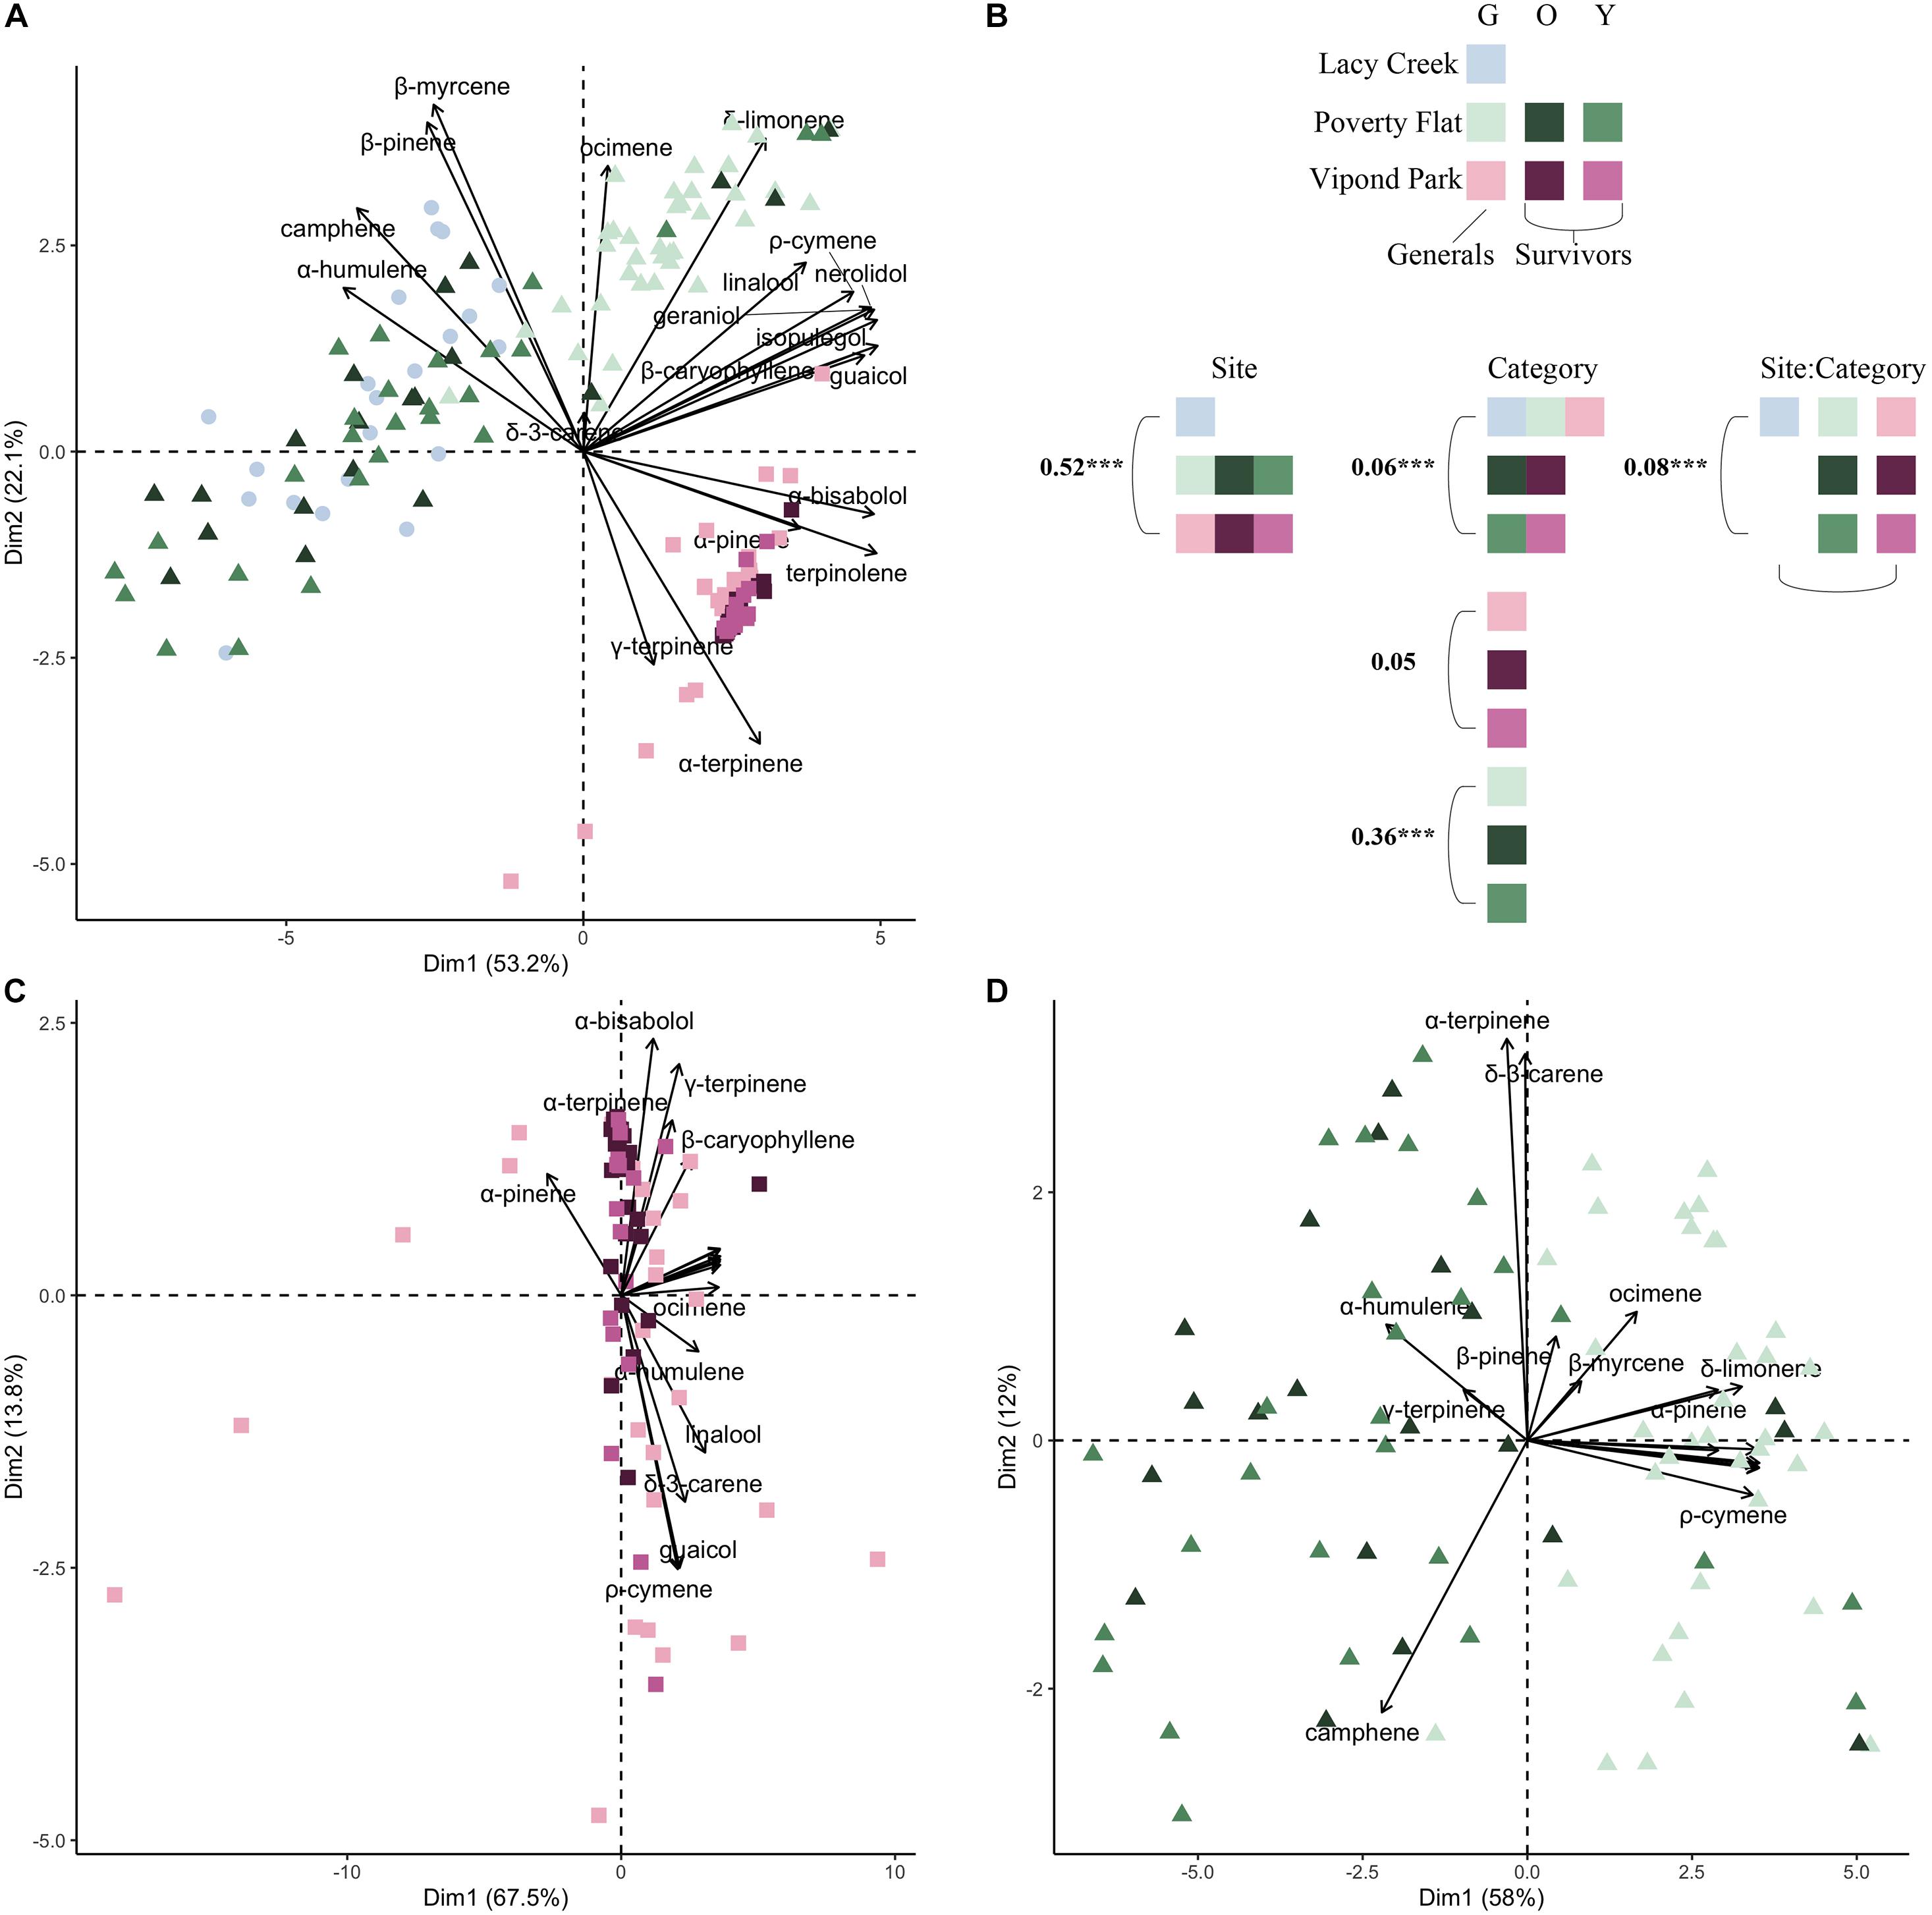
Figure 2. Principal components analysis (PCA) of major compounds for generals and survivors for (A) all three sites, (C) Vipond Park, and (D) Poverty Flat. Each point is an individual tree. Community composition corresponds to the logit-transformed proportional composition. (B) Color used in PCAs denotes site and color intensity corresponds to generals (lightest tint), older survivors (darkest tint), and younger survivors (medium tint). First two axes are reported, and the percent variation explained is reported for each axis. Biplot vectors show direction and strength of significant correlations with major compounds. Simplified PERMANOVA results are presented where numbers correspond to the amount of variance explained (R2 for each PERMANOVA term) and stars denote significance at the α = 0.05 level. Full PERMANOVA tables are supplied in Supplementary Table 1.
In the HCA (Figure 3A) with all sites combined, trees at Vipond Park clustered independently from those at Poverty Flat and Lacy Creek. Trees at the latter two sites formed two clusters with one containing mostly Poverty Flat trees and one containing mostly Lacy Creek trees with some intermixing. Vipond Park trees were characterized by high α-terpinene while trees at Poverty Flat trees exhibited high levels of camphene and α-humulene. The cluster containing mostly Lacy Creek trees resembled Poverty Flat trees in having high levels of camphene, but Vipond Park trees in having in low levels of α-humulene.
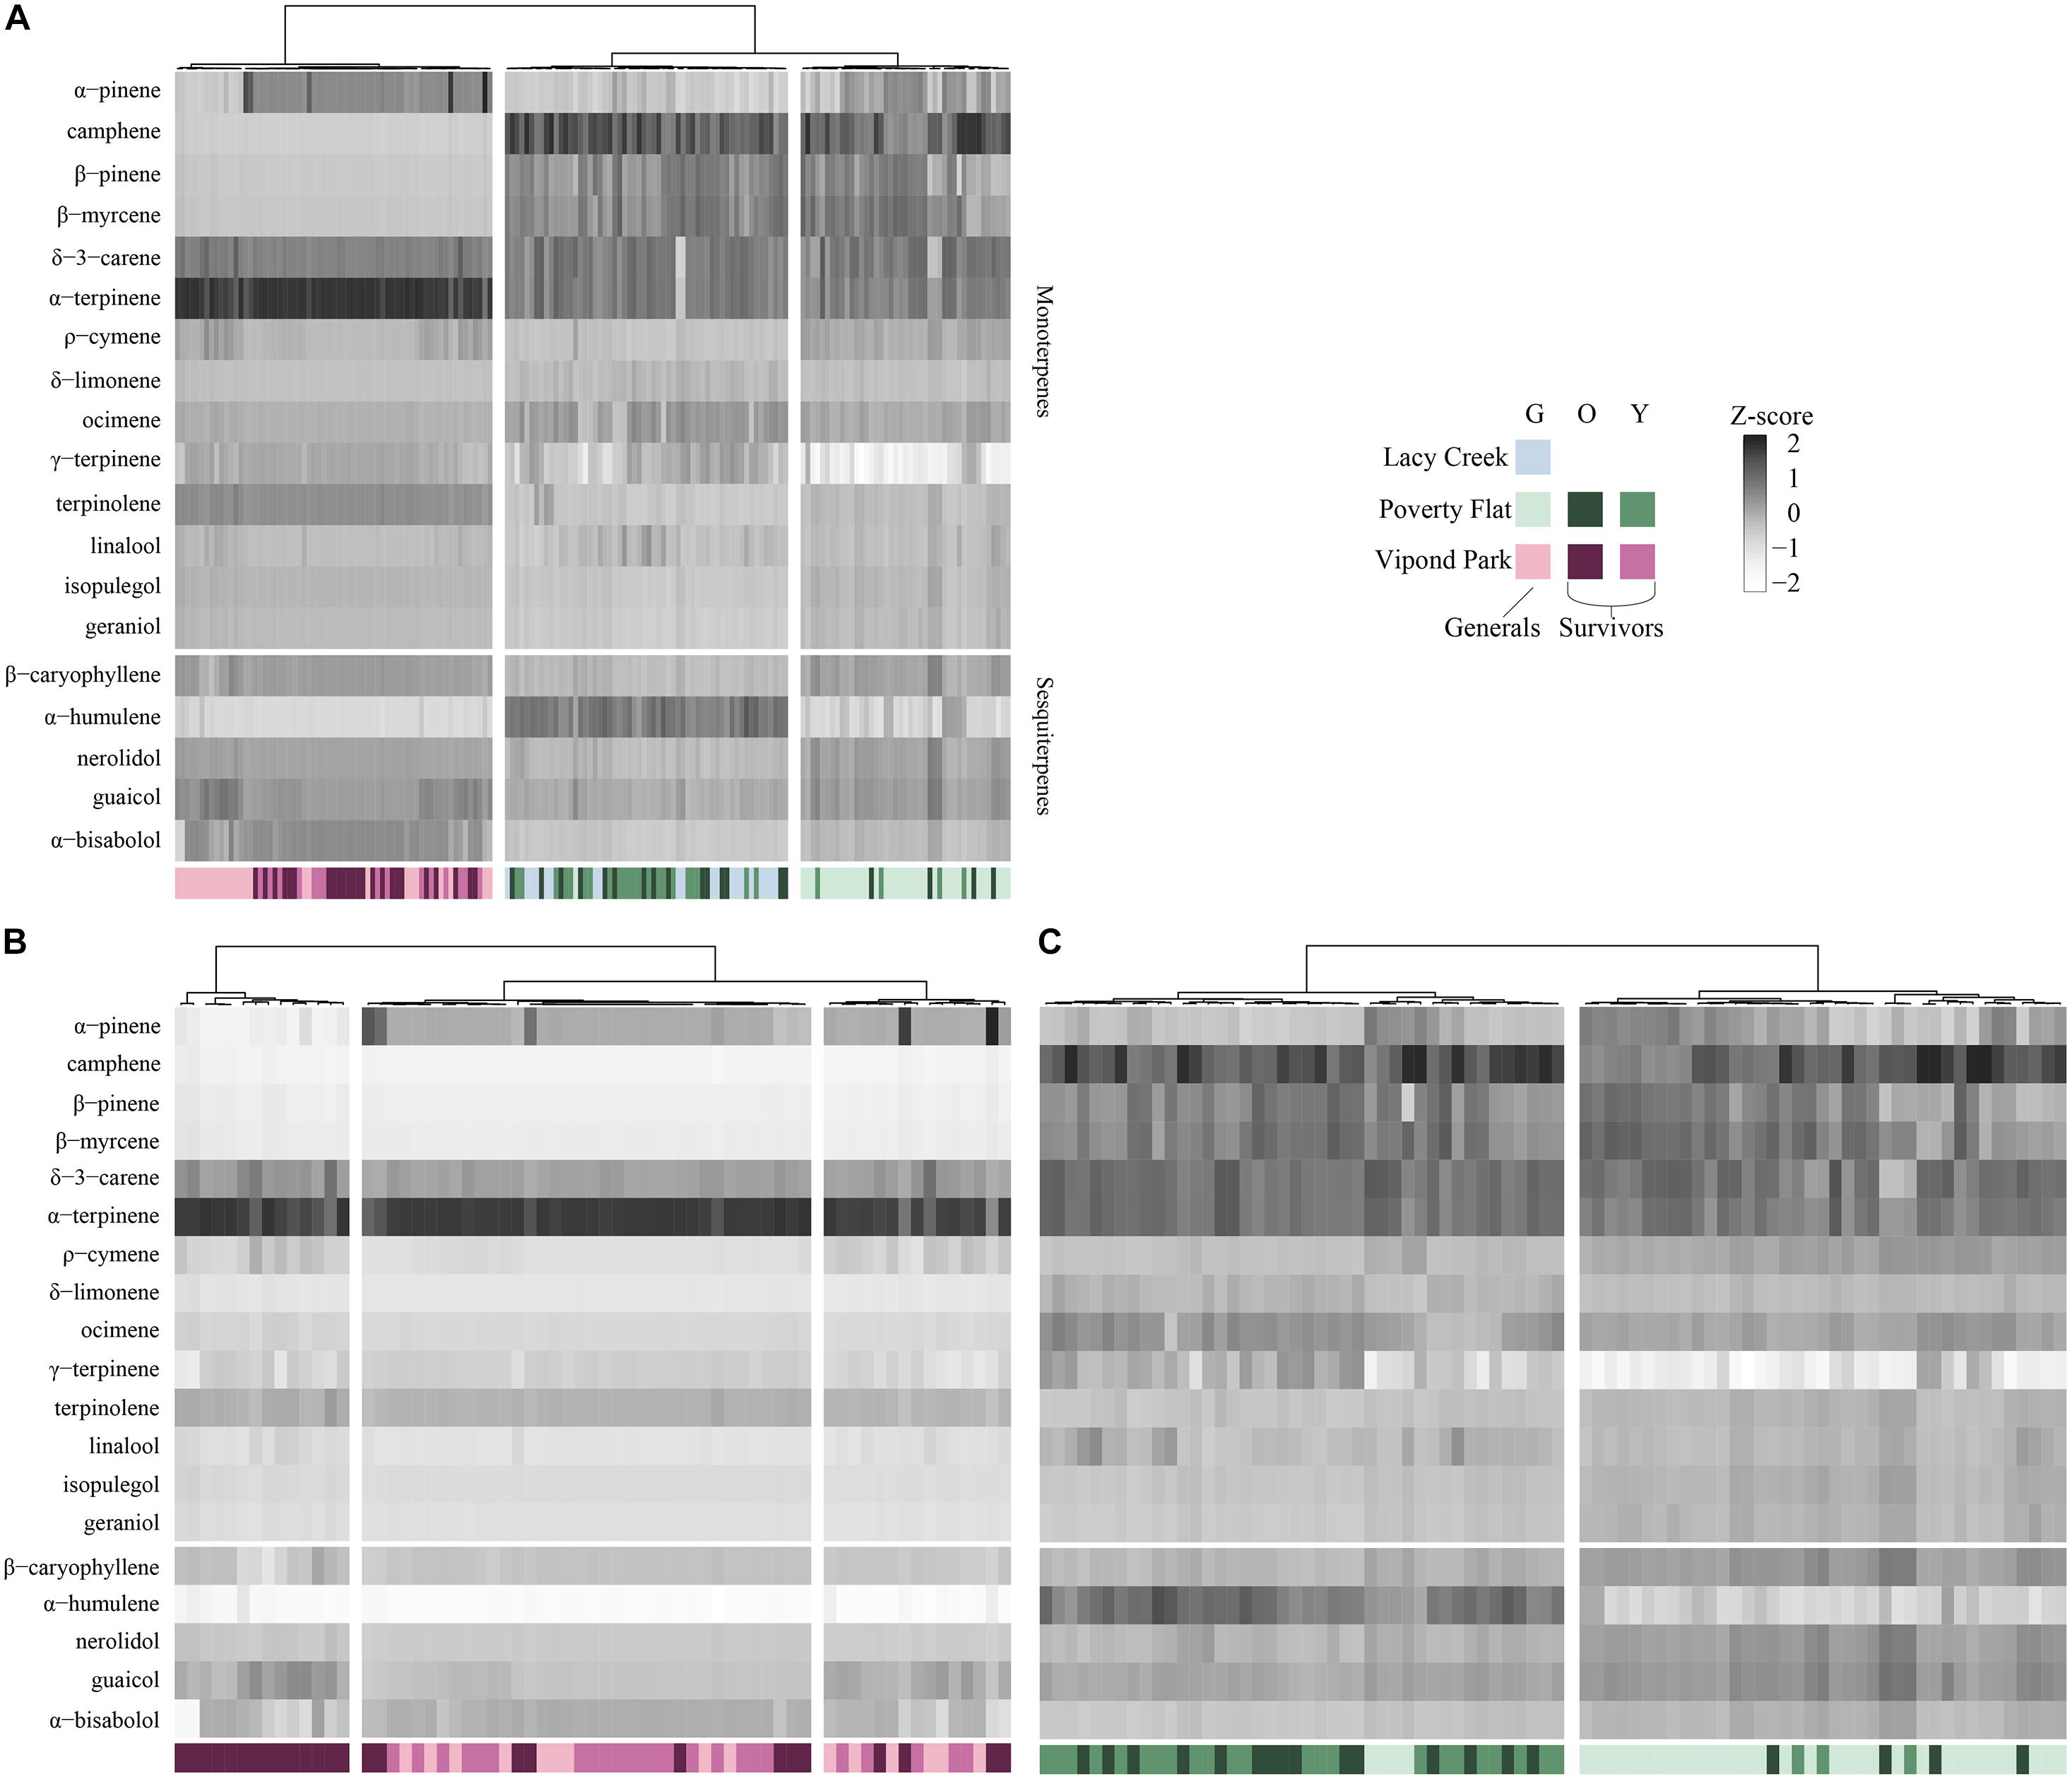
Figure 3. Hierarchal clustering (HCA) of major compounds for generals and survivors for (A) all three sites; (B) Vipond Park; and (C) Poverty Flat. Community composition corresponds to the logit-transformed proportional composition. Grayscale intensity denotes relative concentration of each compound (z-standardized). Color denotes site and color intensity corresponds to generals (lightest tint), older survivors (darkest tint), and younger survivors (medium tint). The number of column splits was determined by k-means clustering. Each vertical bar represents a tree.
In the HCA for Poverty Flat alone (Figure 3B), three clusters resolved. One cluster contained only older survivors that were very low in α-pinene. The other two clusters were a mix of younger survivors, generals and a few older survivors. In all three, camphene, b-pinene, b-myrcene, and α-humulene were very low in concentration and α-terpinene was very high. In the HCA for Poverty Flat alone (Figure 3C), two clusters resolved. One contained most of the older and younger survivors and a couple of generals while the other was composed of primarily generals with a few survivors scattered throughout. Trees in the cluster containing mainly survivors exhibited higher concentrations of α-humulene while those in the cluster containing mainly generals exhibited lower levels.
Correlations comparing individual and total terpenoid concentrations with DBH, relative tree age, and BAI/BA found few relationships except for younger survivors at Vipond Park that showed mostly weak negative relationships between growth and about half of the compounds. The weakest correlations were seen in generals at all sites and Lacy Creek trees (Supplementary Appendix 1).
Trees at different sites and in different categories showed considerable variation in growth over time (Tables 5–7 and Figure 4). In comparisons of tree growth over the length of their lifespans, trees at Poverty Flat that were eventually killed by D. ponderosae grew faster than survivors until around 1930, after which growth of trees in the two categories became more similar (Figure 4). However, t-tests revealed that older beetle-killed trees grew faster than older survivors when comparing them over the entire period (1765–2009) as well as during early (1765–1924) and late (1925–2009) periods (Table 6 and Figure 4). Younger beetle-killed trees also grew faster than younger survivors and older survivors grew slower than younger survivors (Table 6). Looking at recent growth at Poverty Flat, older survivors grew slower than older beetle-killed trees in the 5, 10, and 20 years prior to the outbreak while younger survivors grew faster than younger beetle-killed trees in the 10 and 20 years periods before the outbreak, but similar to one another in the 5 years pre-outbreak (Table 7). Generals grew faster than younger beetle-killed trees but similar to younger survivors when considering the entire period from 1906 to 2009 and, in the years leading up to the outbreak, became the fastest growing category overall (Figure 4).
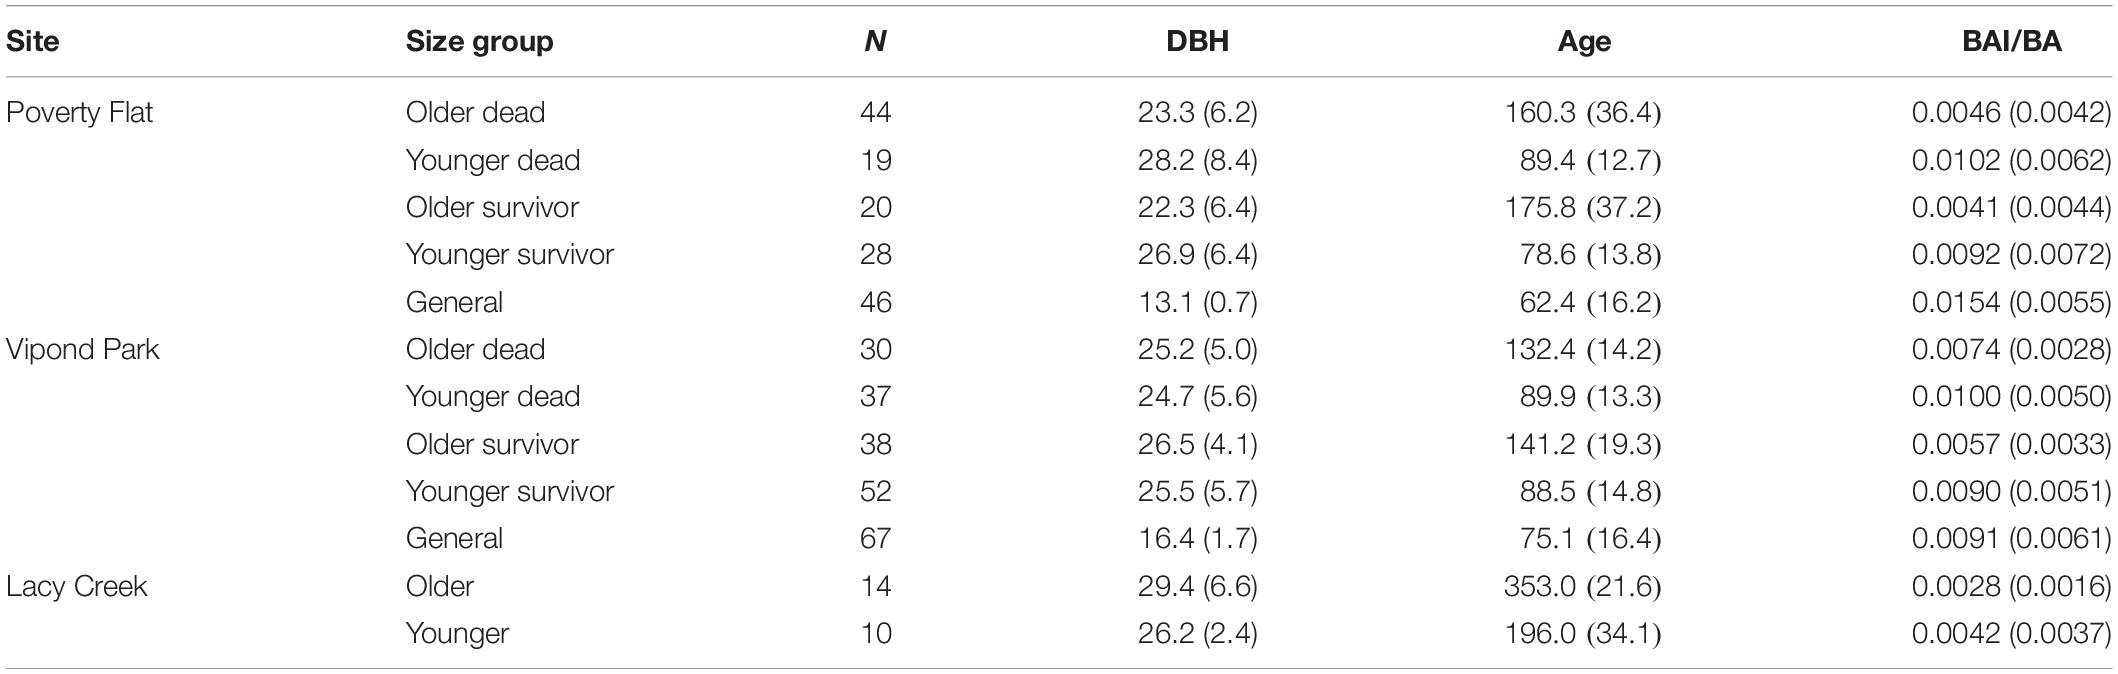
Table 5. Mean (SD) diameter at breast height in cm (DBH, 1.4 m), relative age (number of rings at 1.4 m), and BAI/BA (basal area increment/basal area) for Pinus albicaulis by site and category.
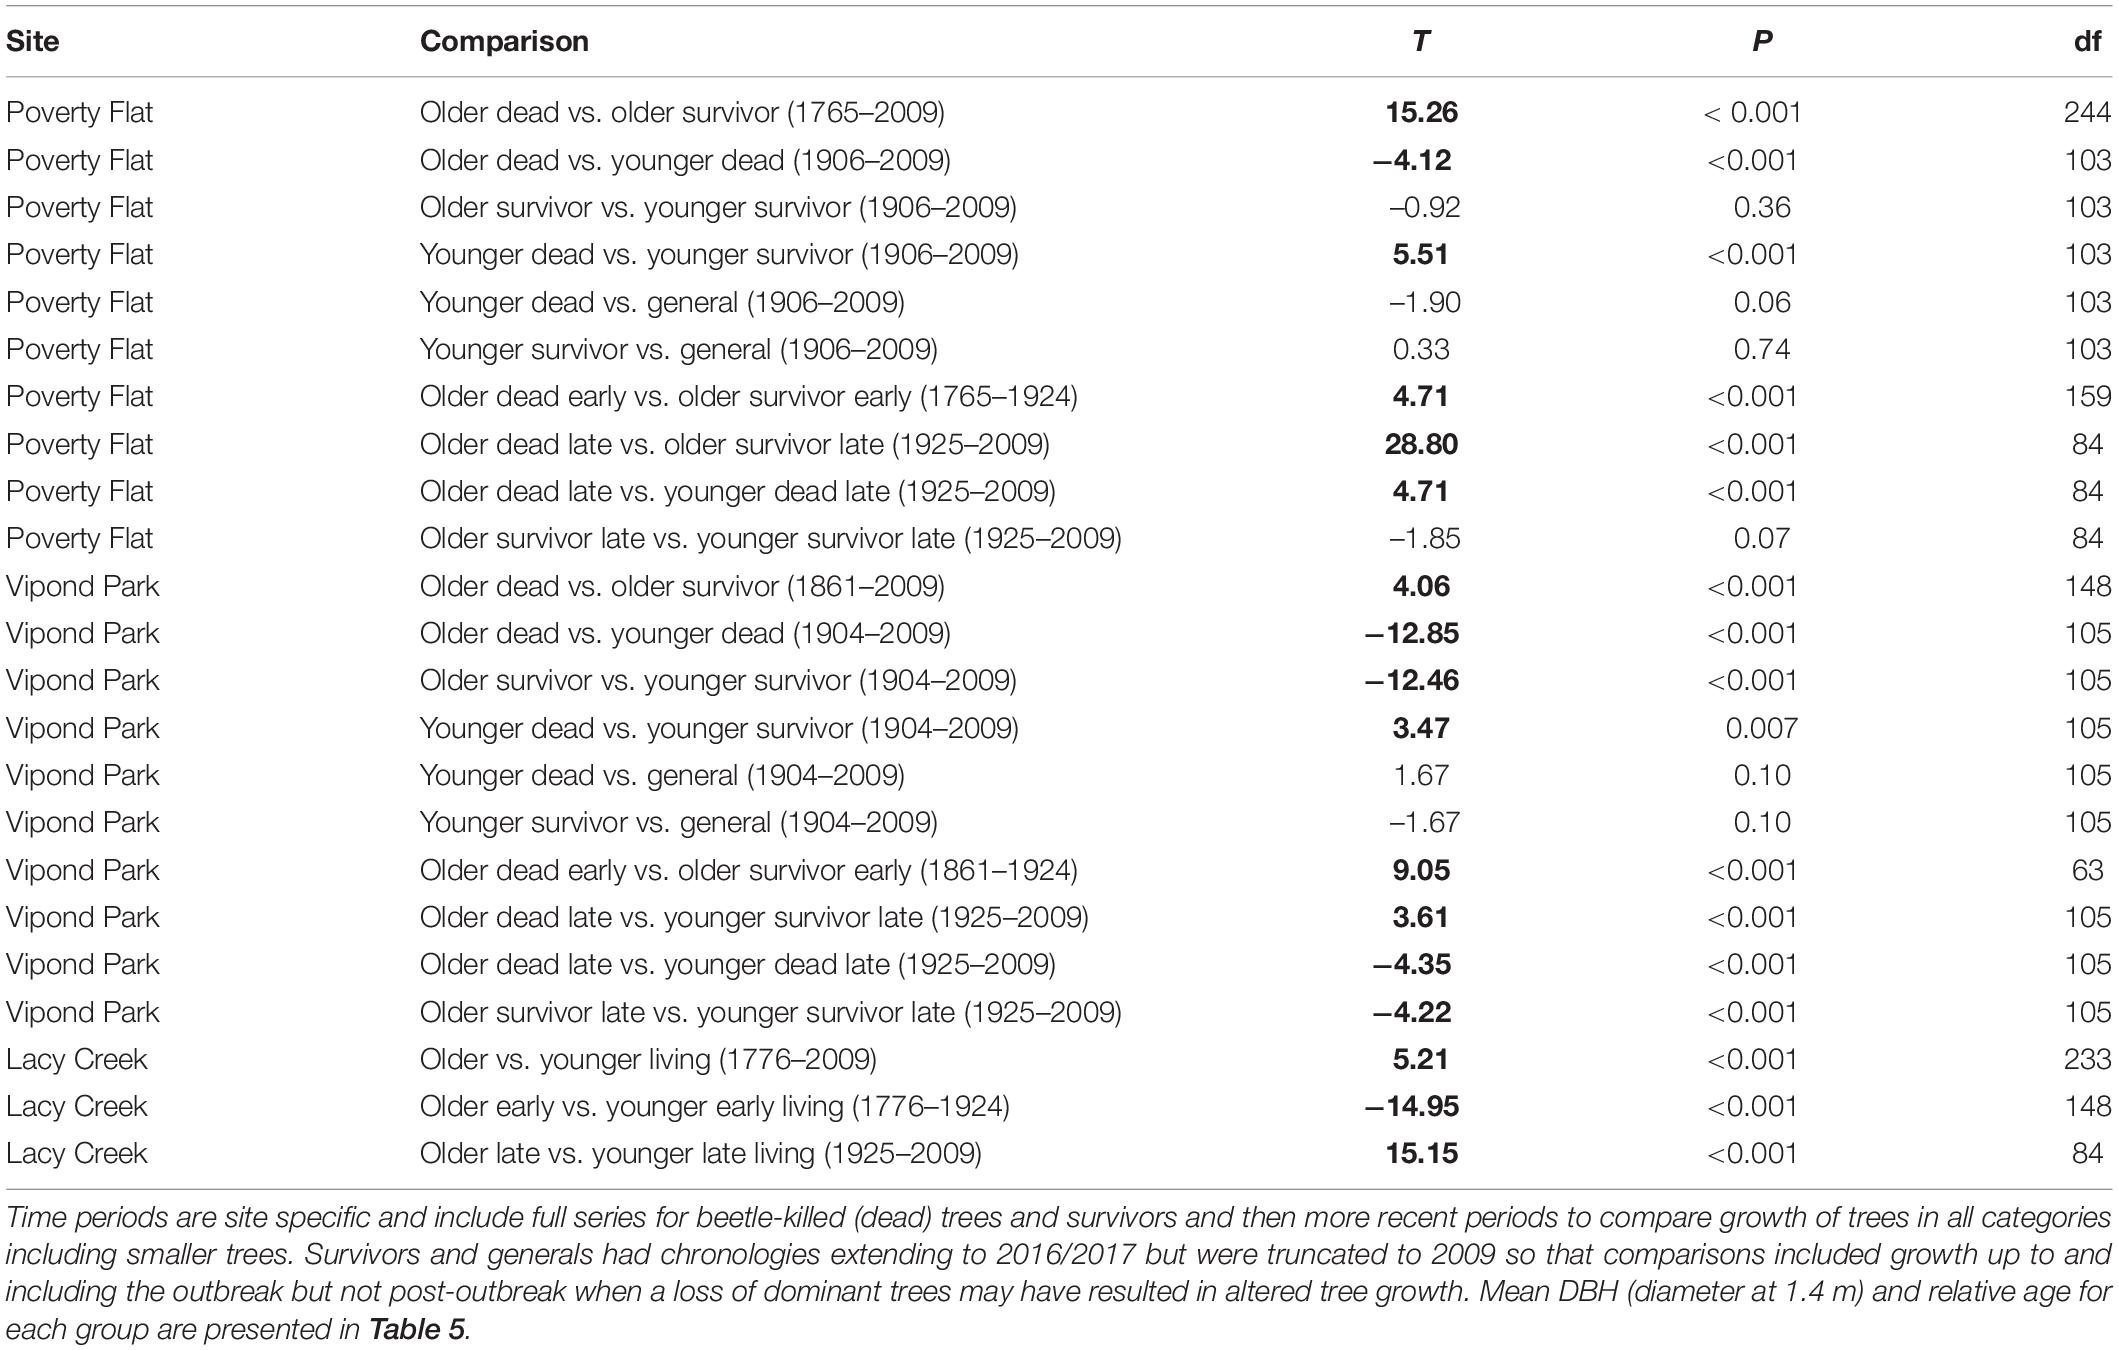
Table 6. Results of paired t-tests conducted using basal area increment (BAI)/basal area (BA) to detect changes in growth that occurred over time in different categories of Pinus albicaulis.
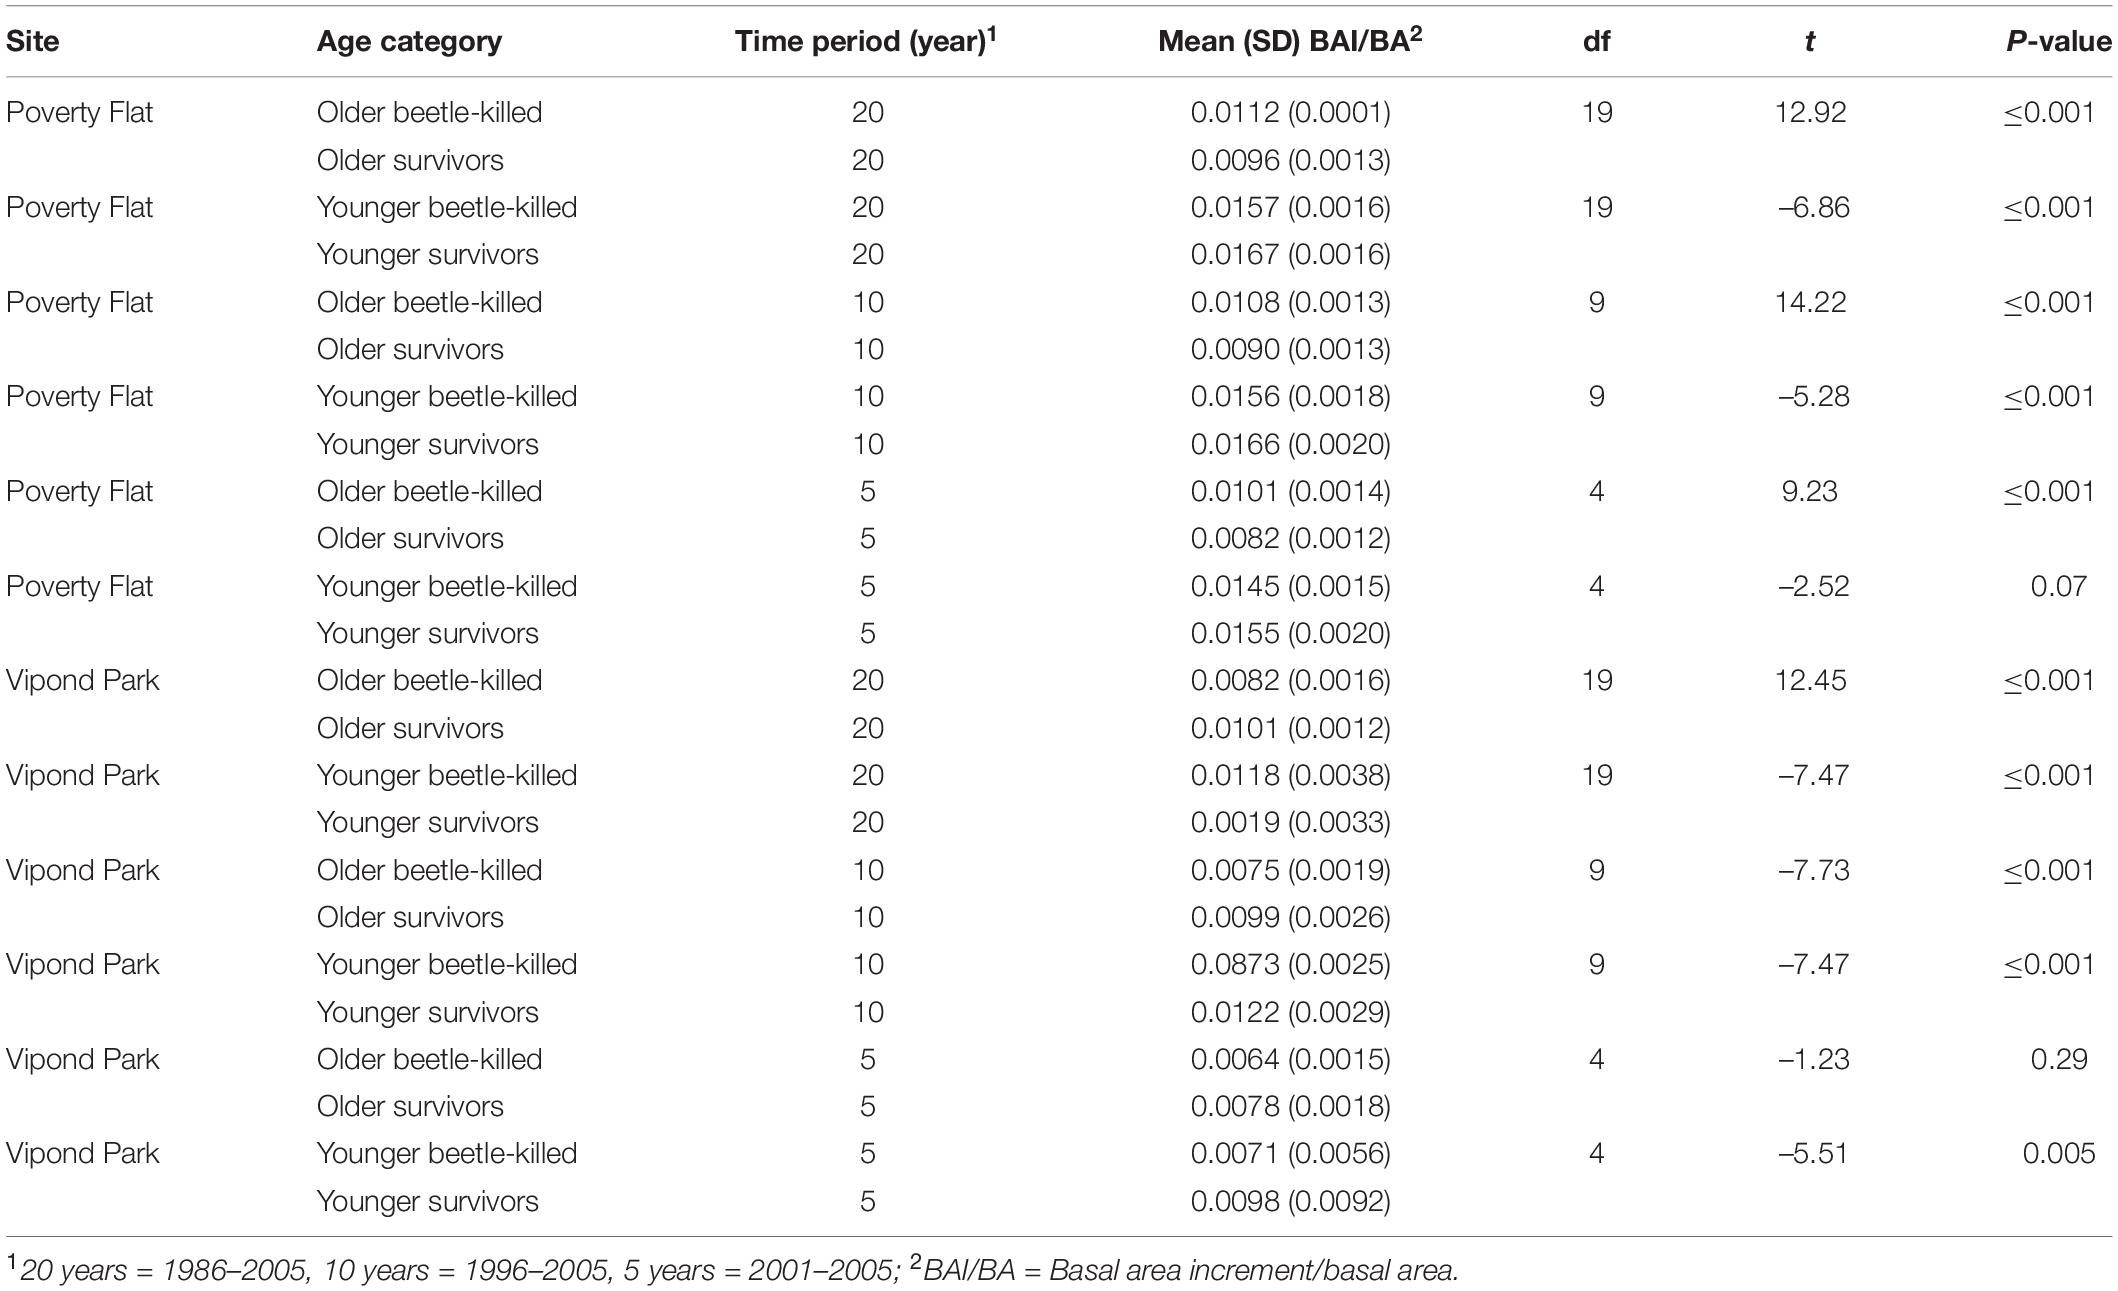
Table 7. T-test comparisons of mean annual BAI/BA for older and younger (see text) beetle-killed vs. survivor Pinus albicaulis at Poverty Flat, ID, and Vipond Park, MT, over 20, 10, and 5 years prior to Dendroctonus ponderosae outbreak.
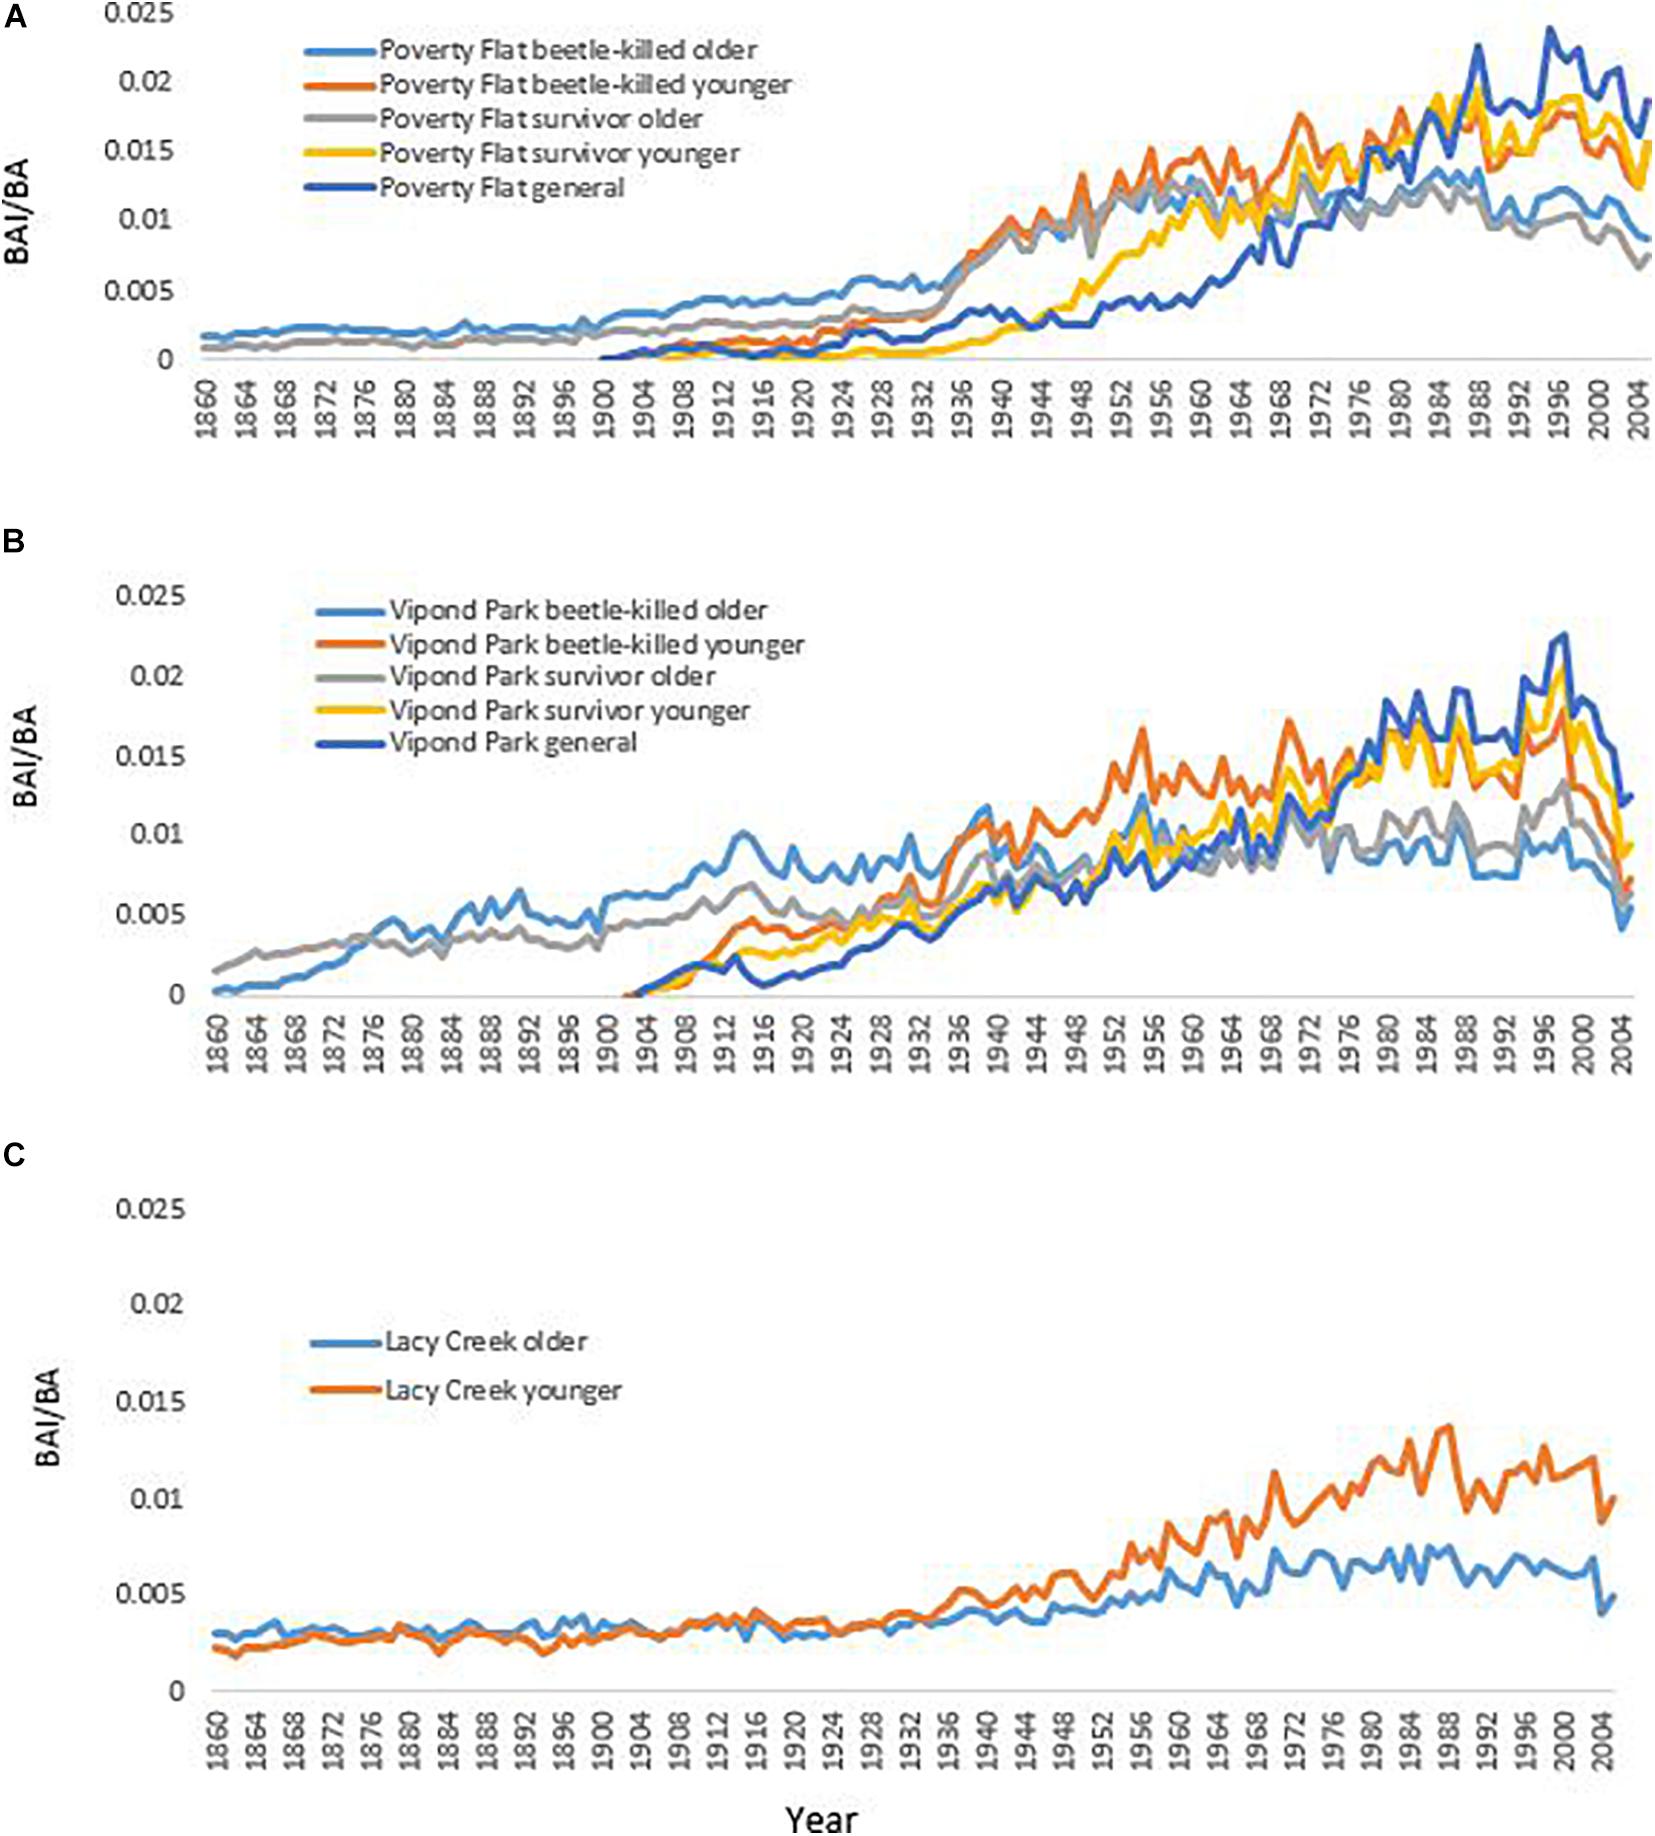
Figure 4. Growth of different categories of Pinus albicaulis as measured by basal area increment (BAI)/basal area (BA) at (A) Poverty Flat, ID, (B) Vipond Park, MT, and (C) Lacy Creek, MT. (Mean diameter and relative age of trees in each category presented in Supplementary Appendix 2).
At Vipond Park, older beetle-killed trees again grew faster than older survivors when considering the entire period (1861–2009) and during the early (1861–1924) and late (1925–2009) periods. Considering recent years only, older survivors grew slower than beetle-killed trees over the 20 years prior to the outbreak but faster when considering the 10 years prior and similarly for the 5 years prior (Table 7). Older beetle-killed and older survivors grew slower than their younger counterparts considering growth over the period from 1904 to 2009 (Table 6). However, considering only recent years, younger survivors grew faster than younger beetle-killed trees 5, 10, and 20 years prior to the outbreak (Table 7). As with Poverty Flat, generals were the fastest growing category of trees at the time of the outbreak (Figure 4).
At Lacy Creek, older trees grew faster than younger trees when comparing them over the entire period (1776–2009) but when split into early and later periods, older trees grew faster in the early period while younger trees grew faster in the late period (Table 6 and Figure 4).
Differences in growth among categories and especially within categories by older or younger groupings were also apparent when considering DBH, relative age, and BAI/BA (Table 5). Older trees within a category had mean DBHs consistently smaller than those of younger trees while having considerably greater mean relative age and slower growth. Likewise, for trees at Poverty Flat and Vipond Park, mean BAI/BA for older trees were approximately half that of younger trees in the same category and generals at the same site. Both older and younger trees at Lacy Creek grew slower than their counterparts in the other two populations (Table 5).
Correlation analyses comparing mean annual BAI/BA to climate variables for each site and category are presented in Table 8. Two analyses were conducted, one using BAI/BA with same year climate data and one with BAI/BA and previous year (lagged) climate data. This allowed us to investigate whether climate in the same or previous year had the greatest effect on growth. We tabulated all correlation coefficients > 0.2 or <–0.2 for each of the climate variables (Table 8). All correlations with PDSI were positive. At Poverty Flat, beetle-killed trees were weakly positively correlated with PDSI in almost every month while survivors showed weak positive correlations with PDSI only September through December. Generals at Poverty Flat were insensitive and, for all categories, lag did not noticeably strengthen or weaken correlations. At Vipond Park, trees in all categories, including generals, showed weak to moderately positive correlations with PDSI and these correlations were strengthened slightly in the lagged analysis for all categories. At Lacy Creek, BAI/BA was weakly positively correlated with PDSI for fewer months than at the other sites and the lag resulted in weaker correlations overall.
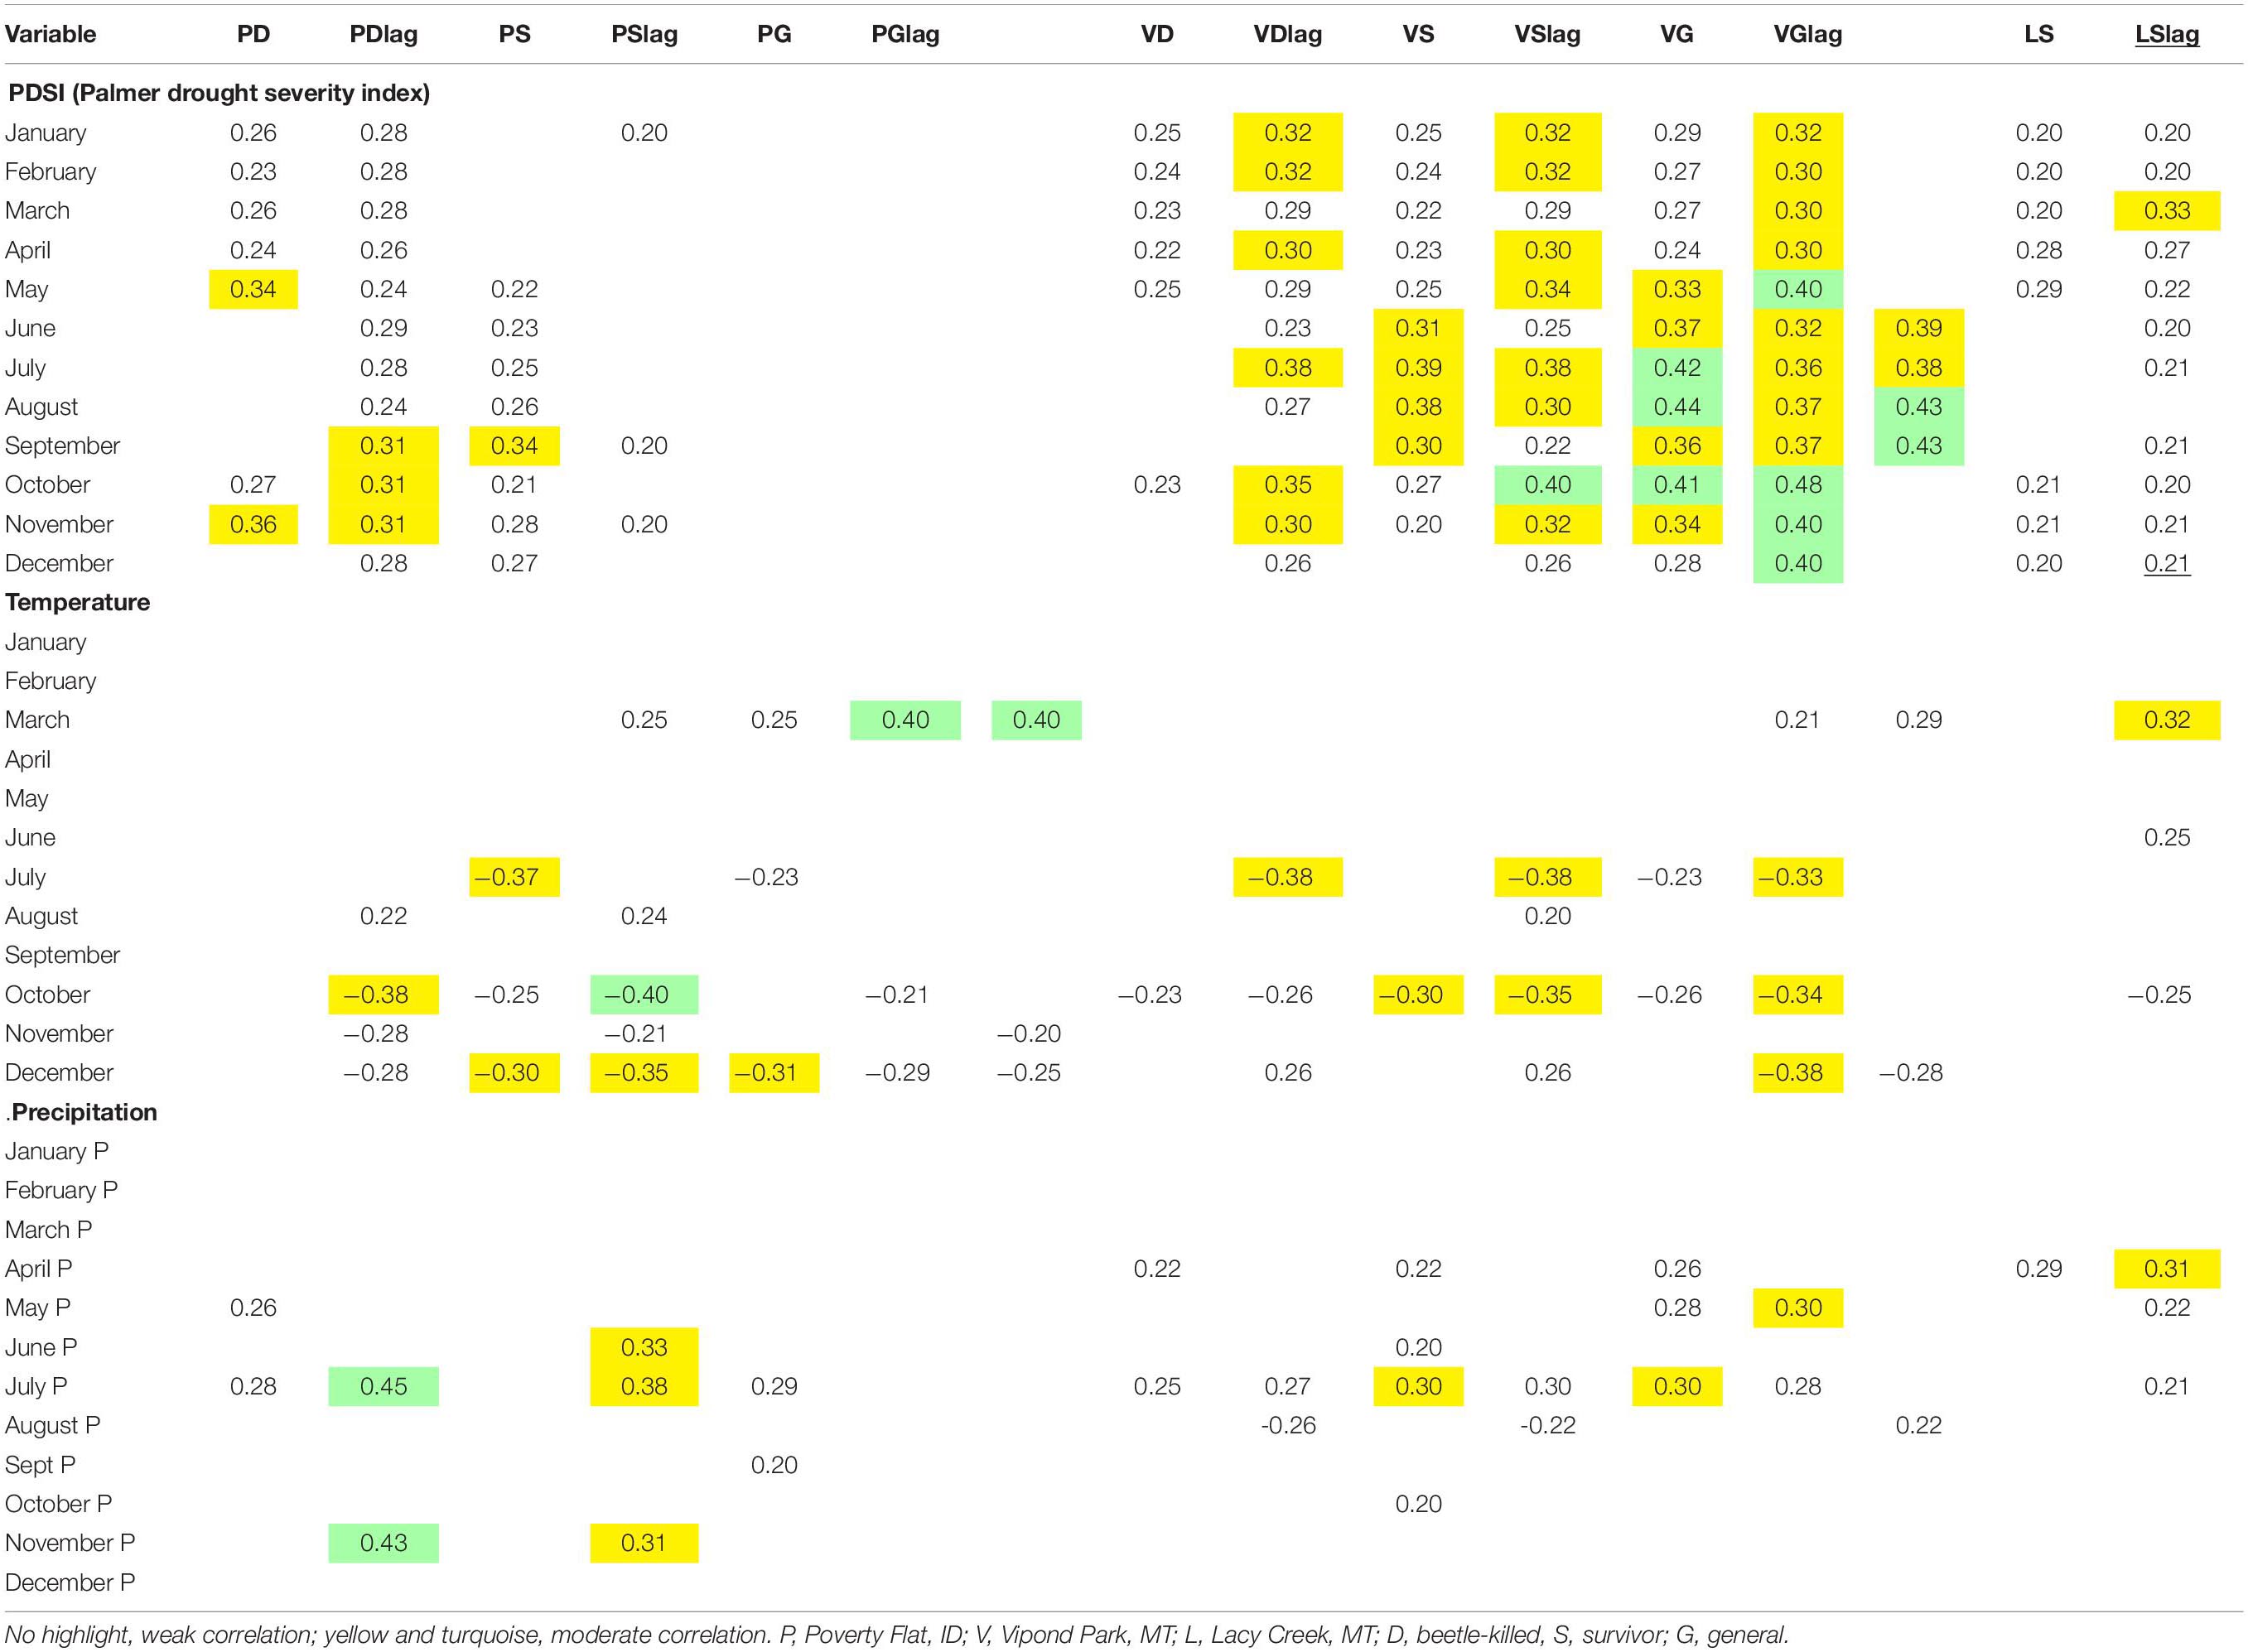
Table 8. Pearson product correlations of climate variables for same year and lagged 1 year (lag) with mean basal area increment (BAI)/basal area (BA) for Pinus albicaulis from 1950 to 2005 at three sites.
February temperature was weakly positively correlated with growth for Poverty Flat survivors and generals, Vipond Park generals, and Lacy Creek trees (Table 8). July temperatures were negatively correlated with growth of Poverty Flat beetle-killed trees and survivors in the lagged analysis and for all three tree categories at Vipond Park in same year analyses. December temperatures were negatively correlated with growth of trees in all categories at Poverty Flat and positive for beetle-killed and survivors but negative for generals at Vipond Park. July precipitation was positively correlated with growth in same year analyses with beetle-killed trees and generals at Poverty Flat and beetle-killed trees, survivors, and generals at Vipond Park. In lagged analysis, positive correlations with July precipitation were found for beetle-killed trees and survivors at Poverty Flat, and trees in all categories at Vipond Park and Lacy Creek. The lag increased the strength of correlation only for beetle-killed trees at Poverty Flat (Table 8).
Individual tree correlation analyses of BAI/BA with climate variables detected the presence of two groups of trees that we classified as either sensitive (> 8 months correlations with PDSI) or non-sensitive (<8 months correlations with PDSI) (Supplementary Appendices 2–4). In all cases, correlations of BAI/BA with PDSI for sensitive trees were positive. At Poverty Flat 33% of beetle-killed trees were classified sensitive while 67% were non-sensitive. At Poverty Flat, 18% of survivors were sensitive while 82% were non-sensitive, and 100% of Poverty Flat generals were insensitive. Non-sensitive survivors at Poverty Flat were responsive to March temperature while non-sensitive generals were responsive to December temperatures. Most correlations with March temperature were positive while all correlations with December temperature were negative (Supplementary Appendix 2).
Beetle-killed trees at Vipond Park were 27% sensitive and 73% non-sensitive, while survivors were 45% sensitive and 55% non-sensitive. Generals were 57% sensitive and 43% non-sensitive. Sensitive beetle-killed trees, survivors, and generals, were all responsive to December temperature while non-sensitive beetle-killed trees and survivors were responsive to March temperature (Supplementary Appendix 3). Again, most correlations of growth with March temperature were positive and most correlations with December temperature were negative. At Lacy Creek, 33% of the trees were sensitive and 67% non-sensitive and non-sensitive trees were not responsive to any climate variable (Supplementary Appendix 4).
Drought, as indicated by negative PDSI values, occurred at various times over the 1950–2005 period and varied considerably in extent and severity among sites (Supplementary Figures 3–5). All three sites experienced drought from 1999 to 2004, yet only Poverty Flat and Vipond Park experienced outbreaks.
We investigated the possibility that D. ponderosae outbreaks in semi-naïve P. albicaulis resulted in rapid adaptive selection for trees with genotypes and phenotypes associated with survival. At the two study sites that experienced a recent outbreak of D. ponderosae, Poverty Flat and Vipond Park, we found evidence of genetic differences between survivors and generals (Figure 1). However, in contrast to our predictions that survivors would possess lower genetic diversity we found that they actually had higher genetic diversity within sites than did generals (Table 2). We also found substantial genetic differentiation among sites, even between trees at Poverty Flat and Lacy Creek, sites that were located only 27 km apart (Table 2 and Supplementary Figure 1). The patterns of genetic differences we observed did not fully conform to our predictions. We predicted that overall survivors and generals would be genetically different but that a small proportion of survivor genotypes (similar to the proportion of surviving trees in the population post outbreak) would resolve with generals at each site. However, at Poverty Flat, while generals were distinct from survivors they were also quite homogenous and with no individuals similar to survivors. At Vipond Park, generals for the most part fit the expected pattern, but survivors exhibited much greater variability than expected. The non-conformity of results with predictions could also be supported by a lack of concordance of our ISSR markers and the traits that result in survivorship or susceptibility to the beetle. ISSRs are powerful for detecting within individual variability and assessing within and among population variation but are considered neutral and not linked to particular tree traits.
Differences in genetic diversity between survivors and generals also indicate drivers independent of D. ponderosae are at play in structuring these populations. Due to massive mortality of older trees during the outbreak, survivors should have experienced a reduction in genetic diversity relative to generals due to bottlenecking and genetic drift. However, at both Poverty Flat and Vipond Park, genetic diversity was lower in generals than in survivors (Table 2). The reason for this may lie in selection events that occurred prior to the beetle outbreaks. By choosing smaller trees as general population proxies, we sampled trees that likely established under different environmental conditions than survivors. The establishment phase is the first, and often one of the most highly selective filters determining the survival of a cohort of trees (Petrie et al., 2016). Selection at the time of germination and in the first years of growth, especially in response to temperature and precipitation, can result in different aged cohorts that vary substantially in genetic diversity and structure (Petrie et al., 2016). Most likely, the genetic patterns we observed among and within categories in this study and those described in Six et al. (2018) reflect a combination of strong selection on trees during the establishment phase and then periodically over their lifespan as they were challenged by various abiotic and biotic disturbances including D. ponderosae in larger trees in recent years.
The results of our genetic and phenotypic analyses illustrate the complexity that can exist within conifer species both within and among populations. Long-lived species are influenced by many different selective agents that exert pressure of varying strength and regularity at various life stages. Adaptation occurs over long periods although episodic selection events likely play important roles with differential effects on different generations of trees coexisting at a site. The complex interplay of balancing and episodic selection that occurs over a tree’s lifespan, and over generations in a population, plays a key role in shaping genetic diversity and the array of phenotypic responses that allow for persistence through time (Petit and Hampe, 2006). Additionally, the high fecundity of trees and strong selection on recruits over time can result in among-cohort structuring that may enhance local adaptation while allowing for the maintenance of standing genetic variation (Le Corre and Kremer, 2003).
Given that genetic diversity is adaptation’s toolkit, the lower genetic diversity observed in generals (Table 2), the trees that form the bulk of the remaining forest at Poverty Flat and Vipond Park, may be cause for concern. The more abundant generals make up most of the reproductive trees at these sites. As long as the old survivors persist, they can contribute to genetic diversity and potentially contribute to heritable resistance to the beetle, but if they are lost, overall genetic diversity may be reduced. Other cohorts occurring at these sites may also influence diversity and adaptation. We did not look at younger cohorts in this study, including those that established during the last 1–3 decades when warming has been greatest. While some studies in P. albicaulis have found evidence of considerable differentiation among populations and for local adaptation to climate (Liu et al., 2016; Warwell and Shaw, 2017), none have investigated sub-structuring within populations. Sampling from only one cohort or only from tissues or seeds from older dominant trees may severely under- or over-estimate the genetic diversity or adaptive trajectory of a population as a whole and may miss signatures of adaptation in younger cohorts.
Our analyses of terpenoids also revealed considerable complexity within and among populations of P. albicaulis. In our t-test comparisons of terpenoid concentrations, we detected significant differences between categories at Poverty Flat for all terpenoids except α-pinene, with most compounds produced in considerably higher concentrations in survivors than in generals (Table 4). Lacy Creek trees (no outbreak) showed similar patterns in terpenoid concentrations to survivors at Poverty Flat. Some compounds such as camphene, γ-carene, aα-humulene, β-myrcene, β-pinene, and α-terpinene, that were much higher in concentration (often 5X or more) in Poverty Flat survivors and Lacy Creek trees, might at first appear to be indicative of survivorship when considering only these comparisons. However, taking into account the full profile of each tree with HCA and PCA, we found a much more complex story. When considering the chemical profiles among sites, the trees broadly separate into three distinct chemical clusters: Vipond survivors and generals, Poverty Flat survivors and Lacy Creek, and Poverty Flat generals (Figure 3A). Within Vipond Park, three separate clusters emerge. One cluster is completely composed of older survivors while the other two are a mix of older survivors, younger survivors and generals, a pattern that only partly fits our hypothesis that only a few survivors should cluster with generals (Figure 3B). The most obvious clustering between survivors and generals was observed at the Poverty Flat site primarily driven by α-humulene, p-cymene, and limonene (Figure 3C). Here, most survivors cluster together and a few resolve with the generals, supporting our hypothesis that generals should contain a low proportion of survivors.
So, how do we interpret the distribution of these clusters within and among categories and among sites in the context of survivorship? We know that host location by D. ponderosae occurs initially at a distance and involves the use of olfactory and visual cues. While concentrations may determine toxicity once a beetle is in the tree, composition dictates behavior prior to entry (Raffa et al., 2005). An important consideration here is that most herbivores use ratios and combinations of host compounds in host location rather than single compounds (Bruce et al., 2005). Dendroctonus ponderosae colonizes many species of Pinus (Wood, 1982) each of which exhibit variability in chemical profiles among species, as well as within and among populations of each species. As such, beetles are likely to be attracted or repelled by a variety of profiles and ratios or they would be restricted to using only a limited number of trees even when many more are suitable as hosts. Thus, the absence of a single defining ‘survivor’ terpenoid profile should not be surprising. Rather, our results suggest that multiple complex profiles may result in either host choice or rejection. However, given the high variability we observed, it may also be that constitutive terpenoids are relatively unimportant in host choice by D. ponderosae in P. albicaulis. We found no clear indication that any particular compound, profile, or set of profiles, were clearly representative of survivors when looking at all sites, although a few stood out within a single population of trees. Differences in size, relative age, and growth rate of the trees also did not affect individual or total terpenoid concentrations (Supplementary Appendix 1), and so, these variables likely did not create confounding effects within the HCA. Bentz et al. (2015) sampled whitebark pine trees prior to attack and found no difference in any compound in trees that were lethally or unsuccessfully attacked except for myrcene, which was higher in trees that were successfully attacked. While they did not investigate terpenoids in trees that were not attacked (such as our survivors), their results provide additional evidence that terpenoids may not be of major importance in tree choice in P. albicaulis. However, they included only ten trees and, as in our study, did not differentiate among enantiomers, which are the optical isomers of these compounds, each of which can have very different effects on beetle choice and behavior. In our study, we sampled trees several years after the outbreak and the terpenoid profiles of our trees may not reflect those produced under the climatic conditions in the period leading up to and spanning the outbreak. However, since terpenoid production is genetically based, variability in overall proportions produced may not be greatly influenced over time. Terpenoids are also not the only secondary chemicals produced by these trees and it may be that the total tree profile provides an integrated cue of suitability.
The resolution of many chemically variant clusters within both generals and survivors may be a natural reflection of the variability within a population or, it may be, at least in part, a consequence of P. albicaulis being a naïve host. For a host without strong past co-evolutionary pressure from D. ponderosae we might not expect strongly divergent chemical syndromes associated with survival such as have been observed in P. contorta, a tree with a long co-evolutionary history of repeated, severe outbreaks (Erbilgin et al., 2017; Raffa et al., 2017). It may also be that beetles use other chemical groups more for host location and assessment. Divergent chemical syndromes can be expected in the presence of strong directional selection but might be non-existent or difficult to detect where selection has been weak and sporadic as is thought to be the case with D. ponderosae and P. albicaulis prior to the current massive outbreak.
The phenotypic trait most clearly related to survivorship was growth. At both Poverty Flat and Vipond Park, trees killed by beetles grew faster over their lifespans than did survivors although growth rates converged in the 60 s and 70 s and then diverged again in the period just prior to the outbreak, when survivors again grew more slowly than beetle-killed trees at Poverty Flat and either more rapidly or similar to beetle-killed trees at Vipond Park (Tables 5–7 and Figure 4). These differences paralleled the findings of Kichas et al. (2020) who observed that P. albicaulis survivors grew faster in earlier years but that growth slowed prior to the outbreak relative to beetle-killed trees. There were also important differences in growth between older and younger trees in each category at each site. Younger beetle-killed trees grew faster than younger survivors and younger survivors grew more rapidly than older survivors (Table 5). The latter case is particularly striking as this difference in growth rate resulted in older survivors with mean diameters substantially smaller than younger survivors and mean BAI/BAs approximately half that of younger survivors (Table 5). Older and younger trees at Lacy Creek, where beetles did not develop an outbreak despite most stands in the surrounding area being affected, grew slower than their counterparts at the other sites (Table 5). These differences suggest strong genetic sub-structuring in these populations related to growth.
But how do D. ponderosae distinguish between trees with different growth rates? The answer may lie in a link between growth rate and allocations to defense or some other tree physiological trait. Moreira et al. (2016) found resin responses in the juvenile stages of 17 pine species clustered into two divergent defensive syndromes. Slow-growing species produced greater constitutive defenses (resin production) while fast-growing species produced greater induced defenses. Pinus albicaulis is a slow-growing tree that expresses lower induced defenses to D. ponderosae attack than do co-evolved P. contorta and P. albicaulis (Raffa et al., 2017) suggesting it may invest more in constitutive defense. Consistent with our findings, Kichas et al. (2020) also observed that beetle-killed P. albicaulis at two sites in northern Montana grew faster than did surviving co-occurring trees. They also found that the slower-growing survivors had greater resin duct area in their xylem (measured as percent area of annual rings). This suggests a greater investment in resin production by survivors and that beetles are able to detect this difference. Given that survivor trees are not attacked, and physical repulsion by resin is not a factor influencing the lack of colonization, this suggests that the overall larger amount of resin contained in these larger resin ducts of survivors may provide a proportional volatile chemical signal used by beetles in host choice or that allocation to production of greater resin duct area results in a related metabolic cue. It may also be that trees that produce larger resin ducts also produce different types, amounts, or ratios of secondary chemical compounds that result in the rejection of these trees by beetles but that the chemicals involved are in groups other than the terpenoids we included.
It is not known whether larger resin duct area results in greater constitutive defense. If it does then there should be greater resin flow in slow growing P. albicaulis. However, resin flow in P. albicaulis is usually very low and sometimes non-existent. During this study, we measured resin flow over a 24-h period in July 2017 for 40 survivors and 40 generals at Vipond Park and only four trees produced measurable, but low, amounts of resin with two falling into each category (data not shown). Additionally, larger resin ducts in other conifers have not been found to result in greater resin flow (Hodges et al., 1981; Hood and Sala, 2015). Slow-growing survivors may invest more in producing greater resin duct area and resin within their xylem, but the effect on beetles may be more qualitative than quantitative, especially if they also invest differently in the secondary chemicals they produce. An investigation into the secondary chemistry of P. albicaulis with differing resin duct areas may help identify the means by which beetles can exert ‘choice at a distance’ given survivors are not attacked and beetles do not encounter resin physically.
Interestingly, climate sensitivity was not predictive of tree survivorship. At Poverty Flat and Vipond Park, beetle-killed trees and survivors both contained large proportions of sensitive and non-sensitive trees (Supplementary Appendices 2, 3). Our results agree with those of Cooper et al. (2018) who found no relationship of climate variables to survivorship in P. contorta and of Kichas et al. (2020) who found no relationship of these variables to survivorship or resin duct area in P. albicaulis.
In correlations comparing BAI/BAs for individual trees and climate variables, again we found no clear difference in climate sensitivity between survivors, beetle-killed trees, and generals (Table 8). However, we did find differences between sensitive and non-sensitive trees, particularly a positive correlation to PDSI indicating a negative growth response of sensitive trees to drier conditions (Supplementary Appendices 2–4). In contrast, non-sensitive trees did not respond positively to PDSI, but rather, were more likely to positively respond to March temperatures or negatively to December temperatures (CO). Warmer March temperatures may allow for earlier growth in these trees while the negative relationship to December temperature may relate to negative effects of warmer temperatures on snowpack retention. Kichas et al. (2020) observed reduced growth during wetter winters for P. albicaulis at a site in northern Montana and Perkins and Swetnam (1996) noted positive responses to winter and spring precipitation on growth of P. albicaulis and suggested that feedbacks among climate variables likely produce nonlinear effects influencing snowpack and consequently growth (Perkins and Swetnam, 1996). The sensitive-insensitive dichotomy that we observed in tree responses to climate variables at all three sites further suggests that genetic sub-structuring within P. albicaulis populations increases the diversity of tree responses to climatic conditions, potentially increasing resilience of the forest as a whole to fluctuating conditions over time.
There appeared to be a relationship of drought to outbreak development at Poverty Flat and Vipond Park (Supplementary Figures 2, 3) but no relationship at Lacy Creek (Supplementary Figure 3). In fact, Lacy Creek trees did not reduce growth rates during the most recent drought and actually exhibited dips in growth during wet periods in the 60s and 90s. This highlights the importance of tree responses, and likely genetics, along with climate in outbreak development.
Whitebark pine is in decline across much of its range due to the effects of the non-native disease white pine blister rust, D. ponderosae outbreaks, and climate change (Keane et al., 2012). This is a ‘wicked problem’ in that successful conservation of this tree will require approaches that deal with all three threats. However, as different as these threats are from one another, they share one commonality, and that is that the ability of the species to persist will depend on its potential for adaption to these stressors that, in turn, depends on genetic diversity.
Standing genetic diversity is in large part how long-lived organisms such as trees persist in the face of shifting climatic and other stressors over time (Petit and Hampe, 2006). We found evidence of substantial population sub-structuring in P. albicaulis that may indicate a strong adaptive potential. Different cohorts and categories of trees within each population exhibited divergent genetic (Figure 1) and phenotypic profiles (Figures 2, 3) as well as differential responses to climate (Table 8). Older trees possessed greater genetic diversity (Table 2) but younger (general) trees grew better under more recent conditions (Figure 4) suggesting they may be better adapted to warmer conditions. Although generals had lower genetic diversity, gene flow among other cohorts including large survivors should act to maintain genetic diversity and to produce new genetic combinations on which selection can act. However, the rapid growth rates exhibited by generals may also be a cause for concern given that D. ponderosae appears to prefer faster growing trees. This may influence overall stand survival and genetic diversity as these trees reach sizes susceptible to beetle attack. Overall, our results suggest P. albicaulis forests contain a complex mosaic of adaptive potentials to a variety of stressors but that the ability of populations to persist will likely vary across the geographic range of the tree depending in the genetic diversity within and among populations (Jorgenson and Hamrick, 1997; Liu et al., 2016).
To protect the ability of this tree to adapt to current and future conditions, the maintenance of genetic diversity should be a top priority, and practices that can reduce diversity or that may introduce maladaptive genes or swamp local adaptation should be avoided. Reliance on natural regeneration is best because it involves locally adapted seed sources drawn from the full array of diversity present in the stand and seedlings that establish will have done so under a local climatic selection filter. Where silvicultural practices are applied, they should be implemented with caution. In cases where planting is required, care should be used in sourcing seed, as even locations close to one another may not be appropriate for collections. For example, trees at Lacy Creek and Vipond Park, located only 27 km apart, showed differences in genetic and terpenoid profiles, growth rates, and sensitivity to climate. Even when using seed from the site where seedlings will be planted, care must be taken to collect from multiple cohorts, as one cohort may not reflect the full genetic diversity of the site as shown by differences between survivors and generals at our sites. To maximize effectiveness and minimize inadvertent harm, it will be crucial in all conservation efforts to consider the strength of local adaptation and genetic structuring within and among populations as well as the sources and degree of gene flow and the multitude of stressors with which the tree must contend (McKay et al., 2005).
Our results also indicate that thinning prescriptions aimed at increasing tree growth in whitebark pine should be applied with considerable caution. Greater tree ring width/faster growth has been widely used as a proxy for tree vigor and as an indicator of greater resistance to bark beetles (Bhuyan et al., 2017). This view has led to thinning projects in whitebark pine aimed at increasing growth and vigor (Retzlaff et al., 2018) and resistance to D. ponderosae. However, while the relationship between growth and resistance to beetles has been shown to be positive in some pines and variable in others (Millar et al., 2012; Knapp et al., 2013; Keen et al., 2020), the opposite appears to be true for some populations of P. contorta (Cooper et al., 2018) and for P. albicaulis. In our study, as well as in that of Kichas et al. (2020), faster overall growth was the strongest predictor of mortality due to D. ponderosae indicating that such treatments will not have their intended effect in P. albicaulis and may even be detrimental. Furthermore, naturally low resin production, even by survivor and open-grown P. albicaulis, indicates thinning will have little-to-no effect on enhancing constitutive defenses against the insect.
Anthropogenic change is creating or enhancing a number of stressors on forests. To aid forests in adapting to these stressors, we need to move beyond traditional spacing and age-class prescriptions and take into account the genetic variability within and among populations and the impact our actions may have on adaptive potential and forest trajectories. Because so little is known about the genetic diversity in most forest trees, and because it is key to effective conservation, studies of genetic diversity and structuring in forest trees should be a top priority in forest adaptation and conservation efforts.
The raw data supporting the conclusions of this article will be made available by the authors, without undue reservation.
DS conceived of the study, participated in all aspects of collections and analysis, and wrote the manuscript. DP did most sample collections in Idaho and participated in project conception and writing. EB did much of the sample processing for genetic and tree ring analysis, and oversaw data management. DS conducted genetic analyses and along with PB conducted the statistical analyses of tree growth and climate with help from JH. GB conducted the chemical analyses while DS, AT, and MH conducted the statistical analysis and interpretations of the data. All the authors contributed to the final version of the manuscript.
Funding was provided via USGS Northwest Climate Science Center Award 180521 and Bureau of Land Management Cooperative Agreement L17AC00320 to DS.
The authors declare that the research was conducted in the absence of any commercial or financial relationships that could be construed as a potential conflict of interest.
We thank Morgan Wilson, Claire Vergobbi, David Riley, and Rebekah Tueller for their help in field collections and sample processing. We also thank Melody Hollar and Jerrod Sellars for their help in measuring tree ring widths and data management.
The Supplementary Material for this article can be found online at: https://www.frontiersin.org/articles/10.3389/ffgc.2021.671510/full#supplementary-material
Abatzoglou, J. T., McEvoy, D. J., and Redmond, K. T. (2017). The west wide drought tracker: drought monitoring at fine spatial scales. Bull. Am. Meteorol. Soc. 98, 1815–1820. doi: 10.1175/bams-d-16-0193.1
Aitken, S., Yeaman, S., Holliday, J. A., Wang, T. L., and Curtis-McClane, S. (2008). Adaptation, migration, or extirpation: climate change outcomes for tree populations. Evol. Appl. 1, 95–111. doi: 10.1111/j.1752-4571.2007.00013.x
Alberto, F. J., Aitken, S. N., Alia, R., Gonzalez-Matinez, S. C., Hannien, H., Kremer, A., et al. (2013). Potential for evolutionary response to climate change-evidence from tree populations. Glob. Change Biol. 19, 1645–1661. doi: 10.1111/gcb.12181
Anderson, M. J. (2014). Permutational Multivariate Analysis of Variance (PERMANOVA) in Wiley StatsRef: Statistics Reference Online. John Wiley & Sons, Ltd. Available online at: https://doi.org/10.1002/9781118445112.stat07841 (accessed January 15, 2021).
Arango-Velez, A., Meents, M., El Kayal, W., Adams, E., Galindo, L., and Cooke, J. (2011). Influence of water deficit on the induction and constitutive responses of pines to infection by mountain pine beetle fungal associates. BMC Proc. 5:O29. doi: 10.1186/1753-6561-5-S7-O29
Bentz, B. J., Boone, C., and Raffa, K. F. (2015). Tree responses and mountain pine beetle attack preferences, reproduction and emergence timing in mixed whitebark and lodgepole pine stands. Agric. For. Entomol. 17, 421–432. doi: 10.1111/afe.12124
Bhuyan, U., Zang, C., and Menzel, A. (2017). Different responses of mutlti-species tree ring growth to various drought indices across Europe. Dendrochronologia 44, 1–8. doi: 10.1016/j.dendro.2017.02.002
Biondi, F., and Qeadan, F. (2008). A theory-driven approach to tree-ring standardization: defining the biological trend from expected basal area increment. Tree Ring Res. 64, 81–96. doi: 10.3959/2008-6.1
Britez, M. R. D., Sergent, A.-S., Meier, A. M., Breda, N., and Rozeburg, P. (2014). Wood density proxies of adaptive traits linked with resistance to drought in Douglas-fir (Pseudotsugae menziesii (Mirb.) Franco). Trees 28, 1289–1304. doi: 10.1007/s00468-014-1003-4
Bruce, T. J. A., Wadhams, L. J., and Woodcock, C. M. (2005). Insect host location: a volatile situation. Trends Plant Sci. 10, 1360–1385.
Bullington, L. S., Lekberg, Y., Sniezko, R., and Larkin, B. (2018). The influence of genetics, defensive chemistry, and the fungal microbiome on disease outcome in whitebark pine trees. Mol. Plant Pathol. 19, 1847–1858. doi: 10.1111/mpp.12663
Buotte, P. C., Hicke, J. A., Preisler, H. K., Abatzoglou, J. T., Raffa, K. F., and Logan, J. A. (2016). Climate influences on whitebark pine mortality from mountain pine beetle in the Greater Yellowstone Ecosystem. Ecol. Appl. 26, 2505–2522.
Buotte, P. C., Hicke, J. A., Preisler, H. K., Abatzoglou, J. T., Raffa, K. F., and Logan, J. A. (2017). Recent and future climate suitability for whitebark pine mortality from mountain pine beetles varies across the western US. For. Ecol. Manag. 399, 132–142. doi: 10.1016/j.foreco.2017.05.032
Burke, J. L., Bohlmann, J., and Carroll, A. L. (2017). Consequences of distributional asymmetry in a warming environment: invasion of novel forests by the mountain pine beetle. Ecosphere 8:e01778.
Campbell, E. M., Alfaro, R. I., and Hawkes, B. (2007). Spatial distribution of mountain pine beetle outbreaks in relation to climate and stand characteristics: a dendroecological analysis. J. Integr. Plant Biol. 49, 168–178. doi: 10.1111/j.1744-7909.2007.00423.x
Clark, E. L., Carroll, A. L., and Huber, D. W. P. (2010). Differences in the constitutive terpene profile of lodgepole pine across a geographical range in British Columbia, and correlation with historical attack by mountain pine beetle. Can. Entomol. 142, 557–573. doi: 10.4039/n10-022
Cooper, L. A., Reed, C. C., and Ballantyne, A. P. (2018). Mountain pine beetle attack faster growing lodgepole pine at low elevations in western Montana, USA. For. Ecol. Manag. 427, 200–207. doi: 10.1016/j.foreco.2018.05.048
Creeden, E. P., Hicke, J. A., and Buotte, P. C. (2014). Climate, weather and recent mountain pine beetle outbreaks in the western United States. For. Ecol. Manag. 312, 239–251. doi: 10.1016/j.foreco.2013.09.051
Cudmore, T. J., Bjorklund, N. B., Carroll, A. L., and Lindgren, B. S. (2010). Climate change and range expansion of an aggressive bark beetle: evidence of higher beetle reproduction in naïve host tree populations. J. Appl. Ecol. 47, 1036–1043. doi: 10.1111/j.1365-2664.2010.01848.x
Davis, M. B., and Shaw, R. G. (2001). Range shifts and adaptive responses to quarternary climate change. Science 292, 673–679. doi: 10.1126/science.292.5517.673
de la Mata, R., Hood, S. M., and Sala, A. (2017). Insect outbreak shifts the direction of selection from fast to slow growth rates in the long-lived conifer Pinus ponderosa. Proc. Natl. Acad. Sci. U.S.A. 114, 7391–7396. doi: 10.1073/pnas.1700032114
Dooley, E. M., and Six, D. L. (2015). Severe white pine blister rust infection in whitebark pine alters mountain pine beetle (Coleoptera: Curculionidae) attack density, emergence rate and body size. Environ. Entomol. 44, 1384–1394. doi: 10.1093/ee/nvv107
Earl, D. A., and vonHoldt, B. M. (2012). STRUCTURE HARVESTER: a website and program for visualizing STRUCTURE output and implementing the Evanno method. Conserv. Genet. Resour. 4, 359–361. doi: 10.1007/s12686-011-9548-7
Erbilgin, N., Cale, J. A., Hussain, A., Ishangulyyeva, G., Klutsch, J. G., Najar, A., et al. (2017). Weathering the storm: how lodgepole pine trees survive mountain pine beetle outbreaks. Oecologia 184, 469–478. doi: 10.1007/s00442-017-3865-9
Ferrenberg, S., Kane, J. M., and Mitton, J. B. (2014). Resin duct characteristics associated with tree resistance to bark beetles across lodgepole and limber pines. Oecologia 174, 1283–1292. doi: 10.1007/s00442-013-2841-2
George, J.-P., Schueler, S., Kranaitsch-Ackerl, S., Mayer, K., Klumpp, R. T., and Grabner, M. (2015). Inter- and intra-specific variation in drought sensitivity in Abies spec. and its relation to wood density and growth rates. Agric. For. Meteorol. 214, 430–433. doi: 10.1016/j.agrformet.2015.08.268
Gu, Z. (2016). Complex heatmaps reveal patterns and correlations in multidimensional genomic data. Bioinformatics 32, 2847–2849. doi: 10.1093/bioinformatics/btw313
Harte, J., Ostling, A., Green, J. L., and Kinzig, A. (2004). Biodiversity conservation: climate change and extinction risk. Nature 430:34.
Hodges, J. D., Elam, W., and Bluhm, D. R. (1981). Influence of Resin Duct Size and Number on Oleoresin Flow in Southern Pines. Research Note SO-266. New Orleans, LA: USDA Forest Service, Southern Foredst Research Station, 3.
Holmes, R. L., Adams, R. K., and Fritts, H. C. (1986). Tree-Ring Chronologies of Western North America: California, Eastern Oregon, and Northern Great Basin. Quality Control of Cross-Dating and Measuring: A Users Manual for Program COFECHA. Chronology Series 6. Tucson, ARI: Laboratory of Tree-Ring Reseach, University of Arizona.
Hood, S., and Sala, A. (2015). Ponderosa pine resin defense and growth: metrics matter. Tree Physiol. 35, 1223–1235.
Hutchins, H. E., and Lanner, R. M. (1982). The central role of Clark’s nutcracker in dispersal and establishment of whitebark pine. Oecologia 55, 192–201. doi: 10.1007/bf00384487
Jactel, H., Koricheva, J., and Castegneyrol, B. (2019). Response of forest insect pests to climate change: not so simple. Curr. Opin. Insect Sci. 35, 103–108. doi: 10.1016/j.cois.2019.07.010
Jorgenson, S. M., and Hamrick, J. L. (1997). Biogeography and population genetics of whitebark pine, Pinus albicaulis. Can. J. For. Res. 27, 1574–1585. doi: 10.1139/x97-118
Kane, J. M., and Kolb, T. E. (2010). Importance of resin ducts in reducing ponderosa pine mortality from bark beetle attack. Oecologia 164, 601–609. doi: 10.1007/s00442-010-1683-4
Kassambara, A., and Mundt, F. (2020). factoextra: Extract and Visualize the Results of Multivariate Data Analyses. R Package Version 1.0.7. Available online at: https://CRAN.R-project.org/package=factoextra (accessed January 15, 2021).
Keane, R. E., Tomback, D. F., Aubry, C. A., Bower, A. D., Campbell, E. M., Cripps, C. L., et al. (2012). A Range-Wide Restoration Strategy for Whitebark Pine (Pinus albicaulis). Gen. Tech. Rep. RMRS-GTR-279. Fort Collins, CO: U.S. Department of Agriculture, Forest Service, Rocky Mountain Research Station, 108.
Keeling, C. I., and Bohlmann, J. (2006). Genes, enzymes and chemicals of terpenoid diversity in the constitutive and induced defence of conifers against insects and pathogens. New Phytol. 170, 657–675. doi: 10.1111/j.1469-8137.2006.01716.x
Keen, R. M., Voelker, S. L., Bentz, B. J., Simon Wang, S. Y., and Farrell, R. (2020). Stronger influence of growth rate than severity of drought stress on mortality of large ponderosa pine during the 2012-2015 CA drought. Oecologia 194, 359–370. doi: 10.1007/s00442-020-04771-0
Kichas, N. E., Hood, S. M., Pederson, G. T., Everett, R. G., and McWethy, D. B. (2020). Whitebark pine (Pinus albicaulis) growth and defense in response to mountain pine beetle outbreaks. For. Ecol. Manag. 457:117736. doi: 10.1016/j.foreco.2019.117736
Knapp, P. A., Soule, P. T., and Maxell, J. T. (2013). Mountain pine beetle selectivity in old-growth ponderosa pine forests, Montana, USA. Ecol. Evol. 3, 1141–1148. doi: 10.1002/ece3.522
Kolb, T., Keefover-Ring, K., Burr, S. J., Hofstetter, R., Gaylord, M., and Raffa, K. F. (2019). Drought-mediated changes in tree physiological processes weaken tree defenses to bark beetle attack. J. Chem. Ecol. 45, 888–900. doi: 10.1007/s10886-019-01105-0
Kremer, A., Ponce, O., Robledo-Arnuncio, J. J., Guillaume, F., Bohrer, G., Nathan, R., et al. (2012). Long-distance gene flow and adaptation of forest trees to rapid climate change. Ecol. Lett. 15, 378–392. doi: 10.1111/j.1461-0248.2012.01746.x
Kremer, A., Potts, B. M., and Delzon, S. (2014). Genetic divergence in forest trees: understanding the consequences of climate change. Funct. Ecol. 28, 22–36. doi: 10.1111/1365-2435.12169
Kuparinen, A., Savolainen, O., and Schurr, F. M. (2010). Increased mortality can promote evolutionary adaptation of forest trees to climate change. For. Ecol. Manag. 259, 1003–1008. doi: 10.1016/j.foreco.2009.12.006
Le, S., Josse, J., and Husson, F. (2008). FactoMineR: an R package for multivariate analysis. J. Stat. Softw. 25, 1–18. doi: 10.18637/jss.v025.i01
Le Corre, V., and Kremer, A. (2003). Genetic variability at neutral markers, quantitative trait loci, and trait in a local subdivided population under selection. Genetics 164, 1205–1219. doi: 10.1093/genetics/164.3.1205
Linton, M. J., Sperry, J. S., and Williams, D. G. (1998). Limits to water transport in Juniperus osteosperma and Pinus edulis L: implications for drought tolerance and regulation of transpiration. Funct. Ecol. 12, 906–911. doi: 10.1046/j.1365-2435.1998.00275.x
Liu, J.-J., Sniezko, R., Murray, M., Wang, N., Chen, H., Zamany, A., et al. (2016). Genetic diversity and population structure of whitebark pine (Pinus albicaulis Engelm.) in western North America. PLoS One 11:e0167986. doi: 10.1371/journal.pone.0167986
Logan, J. A., White, P., and Bentz, B. J. (1998). Model analysis of spatial patterns in mountain pine beetle outbreaks. Theor. Popul. Biol. 53, 236–255. doi: 10.1006/tpbi.1997.1350
LoGullo, M. A., Salleo, S., Piaceri, E. C., and Rosso, R. (1995). Relations between vulnerability to xylem embolism and xylem conduit dimensions in young trees of Quercus cerris. Plant Cell Environ. 18, 661–669. doi: 10.1111/j.1365-3040.1995.tb00567.x
Lorenz, T. J., Sullivan, K. A., Bakian, A. V., and Aubry, C. A. (2011). Cache-site selection in Clark’s nutcracker (Nucifraga columbiana). Auk 128, 237–247. doi: 10.1525/auk.2011.10101
Mason, C. J., Keefover-Ring, K., Villari, C., Klutsch, J. G., Cook, S., Bonello, P., et al. (2018). Anatomical defences against bark beetles relate to degree of historical exposure between species and are allocated independently of chemical defences within trees. Plant Cell Environ. 42, 633–646. doi: 10.1111/pce.13449
McDowell, N. G., Allen, C. D., Anderson-Teixeira, K., Aukema, B. H., Bond-Lamberty, B., Chini, L., et al. (2020). Pervasive shifts in forest dynamics in a changing world. Science 368:eaaz9463. doi: 10.1126/science.aaz9463
McDowell, N. G., Allen, C. D., and Marshall, L. (2010). Growth, carbon-isotope discrimination, and drought-associated mortality across a Pinus ponderosa elevational transect. Glob. Change Biol. 16, 399–415. doi: 10.1111/j.1365-2486.2009.01994.x
McKay, J. K., Christian, C. E., Harrison, S., and Rice, K. J. (2005). How local is local? A review of practical and conceptual issues in the genetics of restoration. Restor. Ecol. 13, 432–440. doi: 10.1111/j.1526-100x.2005.00058.x
Millar, C. A., Westfall, R. D., Delaney, D. L., Bokach, M. J., Flint, A. L., and Flint, L. E. (2012). Forest mortality in high elevation whitebark pine (Pinus albicaulis) forests of eastern California, USA; influence of environmental context, bark beetles, climatic water deficit, and warming. Can. J. For. Res. 42, 749–765. doi: 10.1139/x2012-031
Moran, E., Lauder, J., Musser, C., Stathos, A., and Shu, M. (2017). The genetics of drought tolerance in conifers. New Phytol. 216, 1034–1048. doi: 10.1111/nph.14774
Moreira, X., Sampedro, L., Zas, R., and Pearse, T. S. (2016). Defensive traits in young pine trees cluster into two divergent syndromes related to early growth rate. PLoS One 11:e0152537. doi: 10.1371/journal.pone.0152537
Oksanen, J., Guillaume, F., Friendly, M., Kindt, R., Legendre, P., McGlinn, D., et al. (2019). vegan: Community Ecology Package. R Package Version 2.5-6. Available online at: https://CRAN.R-project.org/package=vegan (accessed January 15, 2021).
Parasharami, V. A., and Thengane, S. R. (2012). Inter population genetic diversity analysis using ISSR markers in Pinus roxburghii (Sarg.) from Indian provenances. Int. J. Biodivers. Conserv. 4, 219–227.
Peakall, R., and Smouse, P. E. (2006). GenAlEx 6.6: genetic analysis in excel. Population genetic software for teaching and research – an update. Bioinformatics 28, 2537–2539. doi: 10.1093/bioinformatics/bts460
Perkins, D. L., Jorgensen, C. L., and Rinella, M. J. (2015). Verbenone decreases whitebark pine mortality throughout a mountain pine beetle outbreak. For. Sci. 61, 747–752. doi: 10.5849/forsci.14-052
Perkins, D. L., and Swetnam, T. L. (1996). A dendrochronological assessment of whitebark pine in the Sawtooth-Salmon River region, Idaho. Can. J. For. Res. 26, 2123–2133. doi: 10.1139/x26-241
Petit, R. J., and Hampe, A. (2006). Some evolutionary consequences of being a tree. Annu. Rev. Ecol. Evol. Syst. 37, 187–214. doi: 10.1146/annurev.ecolsys.37.091305.110215
Petrie, M. D., Wildeman, A. M., Bradford, J. B., Hubbard, R. M., and Lauenroth, W. K. (2016). A review of precipitation and temperature control on seedling emergence and establishment for ponderosa and lodgepole pine forest regeneration. For. Ecol. Manag. 361, 329–338.
Pritchard, J. K., Stephens, M., and Donnelly, P. (2000). Inference of population genetics structure using multilocus genotype data. Genetics 155, 945–957. doi: 10.1093/genetics/155.2.945
Raffa, K. F., Andersson, M. N., and Schlyter, F. (2016). Host selection by bark beetles: playing the odds in a high-stakes game. Adv. Insect Physiol. 50, 1–74. doi: 10.1016/bs.aiip.2016.02.001
Raffa, K. F., Aukema, B. H., Erbilgin, N., Klepzig, K. D., and Wallin, K. F. (2005). “Interactions among conifer terpenoids and bark beetles across multiple levels of scale; an attempt to understand links between population patterns and physiological processes,” in Recent Advances in Phytochemistry, ed. J. T. Romeo (London: Elsevier), 79–118. doi: 10.1016/s0079-9920(05)80005-x
Raffa, K. F., Mason, C. J., Bonello, P., Cook, S., Erbilgin, N., Keefover-Ring, K., et al. (2017). Defence syndromes in lodgepole –whitebark pine ecosystems relate to degree of historical exposure to mountain pine beetle. Plant Cell Environ. 40, 1791–1806. doi: 10.1111/pce.12985
Raffa, K. F., Powell, E. N., and Townsend, P. A. (2013). Temperature-driven range expansion of an irruptive insect heightened by weakly coevolved plant defenses. Proc. Natl. Acad. Sci. U.S.A. 110, 2193–2198. doi: 10.1073/pnas.1216666110
Raffa, K. F., and Smalley, E. B. (1995). Interactions of pre-attack and induced monoterpene concentrations in host conifer defense against bark beetle fungal complexes. Oecologia 102, 285–295. doi: 10.1007/bf00329795
Rehfeldt, G. E., Leites, L. P., St Clair, B., Jaquish, B. C., Sáenz-Romero, C., López-Upton, J., et al. (2014). Comparative genetic responses to climate in the varieties of Pinus ponderosa and Pseudotsuga menziesii: clines in growth potential. For. Ecol. Manag. 324, 138–146. doi: 10.1016/j.foreco.2014.02.041
Retzlaff, M., Keane, R. E., Affleck, D. L., and Hood, S. M. (2018). Growth response of whitebark pine (Pinus albicaulis Engelm) regeneration to thinning and prescribed burn treatments. Forests 9:311. doi: 10.3390/f9060311
Rice, K. J., and Emery, N. C. (2003). Managing microevolution: restoration in the face of global change. Front. Ecol. Environ. 1:469–478. doi: 10.1890/1540-92952003001[0469:MMRITF]2.0.CO;2
Rosner, S., Svetlik, J., Andreassen, K., Borja, I., Dalsgaard, L., Evans, R., et al. (2014). Wood density as a screening trait for drought sensitivity in Norway spruce. Can. J. For. Res. 44, 154–161. doi: 10.1139/cjfr-2013-0209
Sampedro, L. (2014). Physiological trade-offs in the complexity of pine tree defensive chemistry. Tree Physiol. 34, 915–918. doi: 10.1093/treephys/tpu082
Savolainen, O., Pyhajarvi, T., and Knurr, T. (2007). Gene flow and local adaptation in trees. Annu. Rev. Ecol. Evol. Syst. 38, 595–619. doi: 10.1146/annurev.ecolsys.38.091206.095646
Schaming, T. (2016). Clark’s nutcracker breeding season space use and foraging behavior. PLoS One 11:e0149116. doi: 10.1371/journal.pone.0149116
Seybold, S., Bohlann, J., and Raffa, K. F. (2000). Biosynthesis of coniferophagous bark beetle pheromones and conifer isoprenoids: evolutionary perspective and synthesis. Can. Entomol. 132, 697–753. doi: 10.4039/ent132697-6
Six, D. L., and Adams, J. (2007). White pine blister rust severity and selection of individual whitebark pine by the mountain pine beetle (Coleoptera: Curculionidae, Scolytinae). J. Entomol. Sci. 42, 345–353. doi: 10.18474/0749-8004-42.3.345
Six, D. L., and Newcomb, M. (2005). A rapid method for rating white pine blister rust incidence, severity, and distribution within individual trees in whitebark pine. Northwest Sci. 79, 189–195.
Six, D. L., Vergobbi, C., and Cutter, M. (2018). Are survivors different? Genetic-based selection of trees by mountain pine beetle during a climate change-driven outbreak in a high-elevation pine forest. Front. Plant Sci. 9:993. doi: 10.3389/fpls.2018.00993
Sperry, J. S., Hacke, U. G., and Pittermann, J. (2006). Size and function in conifer tracheids and angiosperm vessels. Am. J. Bot. 93, 1490–1500. doi: 10.3732/ajb.93.10.1490
Stephenson, N. L., Das, A. J., Ampersee, N. J., Bulaon, B. M., and Yee, J. L. (2019). Which trees die during drought? The key role of insect host-tree selection. J. Ecol. 107, 2383–2401. doi: 10.1111/1365-2745.13176
Tittiger, C., and Blomquist, G. J. (2017). Pheromone biosynthesis in bark beetles. Curr. Opin. Insect Sci. 24, 68–74. doi: 10.1016/j.cois.2017.09.005
Trowbridge, A. M., Stoy, P. C., Adams, H. D., Law, D. J., Breshears, D. D., Helmig, D., et al. (2019). Drought supersedes warming in determining volatile and tissue defenses of pinon pine (Pinus edulis). Environ. Res. Lett. 14:065006. doi: 10.1088/1748-9326/ab1493
Wallin, K., and Raffa, K. F. (2004). Feedback between individual host selection behavior and population dynamics in an eruptive herbivore. Ecol. Monogr. 74, 101–116. doi: 10.1890/02-4004
Wang, T., and Aitken, S. N. (2011). Variation in xylem anatomy of selected populations of lodgepole pine. Can. J. For. Res. 31, 2049–2057. doi: 10.1139/x01-142
Warwell, M. V., and Shaw, R. G. (2017). Genetic variability affecting fitness of a threatened tree species, Pinus albicaulis (Pinaceae). Am. J. Bot. 104, 1205–1218. doi: 10.3732/ajb.1700139
Wood, S. L. (1982). The bark and ambrosia beetles of North and Central America (Coleoptera: Scolytidae), a taxonomic monograph. Gt. Basin Nat. Mem. 6:11356.
Yeaman, S., and Jarvis, A. (2006). Regional heterogeneity and gene flow maintain variance in a quantitative trait within populations of lodgepole pine. Proc. R. Soc. B 273, 1587–1593. doi: 10.1098/rspb.2006.3498
Keywords: Dendroctonus ponderosae (mountain pine beetle), genetic diversity, climate change, adaptation, dendrochronology, Pinus albicaulis
Citation: Six DL, Trowbridge A, Howe M, Perkins D, Berglund E, Brown P, Hicke JA and Balasubramanian G (2021) Growth, Chemistry, and Genetic Profiles of Whitebark Pine Forests Affected by Climate-Driven Mountain Pine Beetle Outbreaks. Front. For. Glob. Change 4:671510. doi: 10.3389/ffgc.2021.671510
Received: 23 February 2021; Accepted: 27 April 2021;
Published: 20 May 2021.
Edited by:
Altaf Hussain, University of Alberta, CanadaReviewed by:
Inka Lusebrink, University of Göttingen, GermanyCopyright © 2021 Six, Trowbridge, Howe, Perkins, Berglund, Brown, Hicke and Balasubramanian. This is an open-access article distributed under the terms of the Creative Commons Attribution License (CC BY). The use, distribution or reproduction in other forums is permitted, provided the original author(s) and the copyright owner(s) are credited and that the original publication in this journal is cited, in accordance with accepted academic practice. No use, distribution or reproduction is permitted which does not comply with these terms.
*Correspondence: Diana L. Six, ZGlhbmEuc2l4QHVtb250YW5hLmVkdQ==
†Senior author
Disclaimer: All claims expressed in this article are solely those of the authors and do not necessarily represent those of their affiliated organizations, or those of the publisher, the editors and the reviewers. Any product that may be evaluated in this article or claim that may be made by its manufacturer is not guaranteed or endorsed by the publisher.
Research integrity at Frontiers
Learn more about the work of our research integrity team to safeguard the quality of each article we publish.