
95% of researchers rate our articles as excellent or good
Learn more about the work of our research integrity team to safeguard the quality of each article we publish.
Find out more
ORIGINAL RESEARCH article
Front. For. Glob. Change , 14 May 2021
Sec. Pests, Pathogens and Invasions
Volume 4 - 2021 | https://doi.org/10.3389/ffgc.2021.668895
 Robin-Tobias Jauss1*
 Susanne Walden2
 Anna Maria Fiore-Donno2
 Stefan Schaffer3,4Ronny Wolf3
 Kai Feng2,5,6
 Michael Bonkowski2
 Martin Schlegel1,4
Oomycetes (Stramenopiles, protists) are among the most severe plant pathogens, comprising species with a high economic and ecologic impact on forest ecosystems. Their diversity and community structures are well studied in terrestrial habitats, but tree canopies as huge and diverse habitats have been widely neglected. A recent study highlighted distinct oomycete communities in the canopy stratum compared to the ground region of three temperate deciduous trees (Quercus robur, Tilia cordata, Fraxinus excelsior). While the communities from the two strata were distinct when taking oomycete abundances into account, they were rather similar when only OTU presence/absence was considered. It remains, however, unknown if this homogeneity in the OTU presence also leads to a functional homogenisation among microhabitats within the two strata ground and canopy. In this study, we supplemented functional traits to oomycete communities in the tree microhabitats, which were determined over a time period of 2 years with a metabarcoding approach. Our results showed that even though most oomycetes occurred in all microhabitats, a strong discrepancy between the strata and correspondingly the distribution of oomycete lifestyles could be observed. This pattern was constant over several seasons. Obligate biotrophic species, exclusively feeding on living host tissue, dominated the canopy region, implying tree canopies to be a hitherto neglected reservoir for parasitic protists. OTUs assigned to the genus Hyaloperonospora—parasites highly specialised on hosts that were not sampled—could be determined in high abundances in the canopy and the surrounding air, challenging the strict host dependencies ruled for some oomycetes. Our findings further contribute to the understanding of oomycete ecosystem functioning in forest ecosystems.
Some of the most devastating plant pathogens with worldwide economic and ecologic relevance belong to the Oomycota, protists in the Stramenopiles within the SAR superkingdom (Adl et al., 2019). They comprise several distinct orders, i.a. the Pythiales, Peronosporales, and Saprolegniales (Marano et al., 2014) and occupy ecologically important positions as saprotrophs and severe pathogens. The infamous oomycete Phytophthora infestans causes one of the most destructive plant diseases, the potato late blight, and initiated the great Irish famine in the late 1840’s with a million deaths and massive emigration (Mizubuti and Fry, 2006). The ecological and economic impact of oomycetes has led to an increased research interest on their community structure (Riit et al., 2016; Singer et al., 2016; Jauss et al., 2020a, b; Fiore-Donno and Bonkowski, 2021; Marčiulynienė et al., 2021), and, correspondingly, their pathogenicity and infection strategies (Rizzo and Garbelotto, 2003; Rizzo et al., 2005; Thines and Kamoun, 2010).
Three lifestyles are described for oomycetes: Saprotrophic species are free-living and feed on dead and decaying matter (Lewis, 1973). They occupy key roles in the trophic upgrading of terrestrial, marine and freshwater habitats (Marano et al., 2016). Saprotrophy is believed to be the ancestral state of oomycete nutrition (Martin et al., 2016; Spanu and Panstruga, 2017), while the majority of currently described oomycetes are plant pathogens (Thines and Kamoun, 2010). The pathogenic lifestyles include hemibiotrophy and obligate biotrophy. Hemibiotrophy is a common strategy for many Phytophthora species and is characterised by an initial biotrophic phase later turning into a necrotrophic phase after the death of the host (Fawke et al., 2015; Pandaranayaka et al., 2019). Obligate biotrophs comprise species exclusively feeding on living host tissue (Spanu and Kämper, 2010), a common strategy for downy mildews. Even though obligate biotrophic species usually do not actively kill their host, they still damage the host by inducing chlorosis, inflorescence or the killing of seedlings, and thus cause severe economic losses (Parkunan et al., 2013; Krsteska et al., 2014; Kamoun et al., 2015).
Oomycete communities are well studied in terrestrial habitats, however, most studies focus on soil and the rhizosphere (Arcate et al., 2006; Esmaeili Taheri et al., 2017; Sapp et al., 2019; Fiore-Donno and Bonkowski, 2021). Recently, Jauss et al. (2020b) characterised oomycete diversity and community composition in tree canopies, which are huge ecosystems containing heterogeneous microhabitats and a large proportion of undescribed diversity (Nadkarni, 2001). Albeit the same oomycetes were present on the ground and in the canopy, communities inhabiting canopy habitats were significantly distinct from those from soil and leaf litter in their abundances. The authors concluded that oomycete diversity in forest ecosystems is shaped by deterministic microhabitat filtering, while a study by Jauss et al. (2020a) could determine air dispersal and convective transport to be the stochastic supplier and distributor of oomycetes among all microhabitats and the ground and canopy strata. However, the former study only analysed one time point, while the latter study that included air samples could show a strong temporal variability in community composition. Accordingly, several studies have shown that seasonal variability can influence protistan communities, to some extent (Nolte et al., 2010; Fiore-Donno et al., 2019; Fournier et al., 2020; Walden et al., 2021). For cercozoan communities, Walden et al. (2021) could show annually reoccurring succession patterns in the phyllosphere. This implied not only spatially, but also seasonally structured cercozoan communities in tree canopies, although this was not reflected on a functional scale. Whether seasonal variation is also reflected in the functional diversity of oomycetes in forest ecosystems remains elusive.
Accordingly, we supplemented functional traits and investigated the seasonal stability of oomycete community composition in forest floors and tree canopies over a period of 2 years. Our study tackles two hypotheses: (1) Oomycete communities vary not only in their spatial distribution, but also in their seasonal composition, and (2) the deterministic processes leading to differences in community composition between canopy and ground habitats also shape the functional diversity and functional distribution among microhabitats.
Microhabitat samples were collected in two seasons over a period of 2 years, i.e., autumn (October) 2017 and 2018 and spring (May) 2018 and 2019 in cooperation with the Leipzig Canopy Crane (LCC) Facility in a temperate deciduous floodplain forest in Leipzig, Germany (51.3657 N, 12.3094 E). Samples were obtained and processed as described in Jauss et al. (2020b). Briefly, samples were obtained in two strata: ground and canopy. Seven microbial microhabitat compartments related to tree surface were sampled in the canopy at 20–30 m height: Fresh leaves, dead wood, bark, arboreal soil, and three cryptogam epiphytes (lichen and two moss genera, Hypnum and Orthotrichum). In addition, two ground samples (soil and leaf litter) were sampled. All microhabitat samples were collected with four replicates from all cardinal directions from three tree species (Quercus robur, Tilia cordata, Fraxinus excelsior) with three individuals per tree species in the same forest stand. DNA extraction was performed with the DNeasy PowerSoil kit (QIAGEN, Hilden, Germany) according to the manufacturer’s instruction. This procedure was performed on four sampling dates: October 2017 (Jauss et al., 2020b), May 2018, October 2018, and May 2019 (this study). On all four sampling dates, the same trees and microhabitats were sampled. Oomycete-specific PCRs and sequencing were performed as described in Jauss et al. (2020b). Briefly, tagged oomycete-specific primers designed by Fiore-Donno and Bonkowski (2021) were used to amplify the ITS1 region in a semi-nested approach. The thermal program for both PCRs started with a denaturation step at 95°C for 2 min, followed by 24 cycles at 95°C for 30 s, 58°C for 30 s, 72°C for 30 s; and a final extension step at 72°C for 5 min. The following final concentrations were used: DreamTaq polymerase (Thermo Fisher Scientific, Dreieich, Germany) 0.01 units, Thermo Fisher Scientific DreamTaq Green Buffer, dNTPs 0.2 mM and primers 1 μM with 1 μl of DNA template. Sequencing was performed on an Illumina MiSeq Sequencer (Illumina Inc., San Diego, CA, United States) with a V2 reagent kit of 500 cycles (ca. 250 bp); the primer tag combinations are provided in Supplementary Table 1.
Sequence processing and bioinformatics analyses were performed using the pipeline described in Jauss et al. (2020b). Briefly, raw reads were merged using VSEARCH v2.10.3 (Rognes et al., 2016) and demultiplexed with cutadapt v1.18 (Martin, 2011). Primer and tag sequences were trimmed and concatenated sequencing runs were then clustered into operational taxonomic units (OTUs) using Swarm v2.2.2 (Mahé et al., 2015). Chimeras were de novo detected using VSEARCH. OTUs were removed from the final OTU table if one of the following criteria was fulfilled: flagged as chimeric, had a quality value of less than 0.0002, were shorter than 150 bp, or were represented by less than 0.005% of all reads (i.e., 368 reads). OTUs were first taxonomically assigned by using BLAST + v2.9.0 (Camacho et al., 2009) with default parameters against the non-redundant NCBI Nucleotide database (as of June 2019) and removed if the best hit in terms of bitscore was a non-oomycete sequence. Finer taxonomic assignment was performed with VSEARCH on a custom oomycete ITS1 database (Jauss et al., 2020b). The annotation was refined by assigning the species name of the best VSEARCH hit to the corresponding OTU if the pairwise identity was over 95%. OTUs with lower pairwise identity were assigned to higher taxonomic levels. Functional annotation was performed on genus level with a custom python script, based on the oomycete functional database published by Fiore-Donno and Bonkowski (2021). Samples with low sequencing depth were removed by loading the final OTU table into QIIME 2 v2018.11 (Bolyen et al., 2019) and retaining at least five samples per microhabitat and 15 samples per tree species per sampling date, i.e., samples with at least 1172 reads were retained. Additionally, the oomycete OTU abundance matrix of air samples from Jauss et al. (2020a) was used for a comparison between tree related microhabitats and the surrounding air from spring 2019. These air samples were obtained from the same trees sampled in this study, drawing the air surrounding the canopy and ground region with a bioaerosol sampler. DNA was then extracted from the air samples and amplified with the same oomycete-specific primers. The final OTU abundance table allows a direct comparison of oomycetes present in air samples from Jauss et al. (2020a) and the oomycetes dwelling the canopy and ground habitats in this study.
All statistical analyses were conducted in R v3.5.3 (R Core Team, 2019). Alpha diversity indices were calculated for each sample using the diversity function in the vegan package (Oksanen et al., 2019). Non-metric multidimensional scaling was performed on the Bray-Curtis dissimilarity matrix of the log transformed relative abundances (functions vegdist and metaMDS in the vegan package, respectively), the same matrix was used for a permutational multivariate analysis of variance (permANOVA) with the adonis function. Partitioning and visualisation of relative abundances between concatenated canopy microhabitats, soil and leaf litter was performed with the ggtern package (Hamilton and Ferry, 2018). Determination of significantly differentially abundant OTUs was performed with the DESeq2 package (Love et al., 2014), which measures the differential abundance as the logarithmic fold change (log2FoldChange) based on negative binomial distribution count models. All figures were plotted with the ggplot2 package (Wickham, 2016).
We obtained 375 OTUs from 4,262,960 sequences. A total of 77 OTUs (= 20.5% of all OTUs) showed a sequence similarity of less than 70% to any known reference sequence. Plotting the sequence similarity against reference sequences revealed similar patterns to those previously described by Jauss et al. (2020b), i.e., many OTUs showed a similarity of 97–100% to known reference sequences, while additional peaks at ∼75 and 85% may indicate hitherto undescribed oomycete lineages (Supplementary Figure 1).
Peronosporales and Pythiales dominated all microhabitats at all sampling events. In particular, OTUs assigned to the genus Hyaloperonospora showed a high relative abundance within the Peronosporales in canopy habitats (Supplementary Figure 2). Distribution of functional groups was relatively constant for all four sampling events (Figure 1). Based on OTU presence/absence, the pattern was nearly identical for all microhabitats (Figures 1A–D). Approximately 20% of all OTUs occupied a hemibiotrophic lifestyle, 30% were determined to be obligate biotrophic, and only few OTUs belonged to saprotrophic species. The lifestyle of the remaining 50% of OTUs could not be determined, mainly due to low sequence similarities to reference sequences. However, when taking abundances of OTUs into account, the pattern clearly shifted. OTUs assigned to obligate biotrophic species dominated canopy habitats, while ground habitats were more dominated by hemibiotrophic species (Figures 1E–H and Supplementary Table 2).
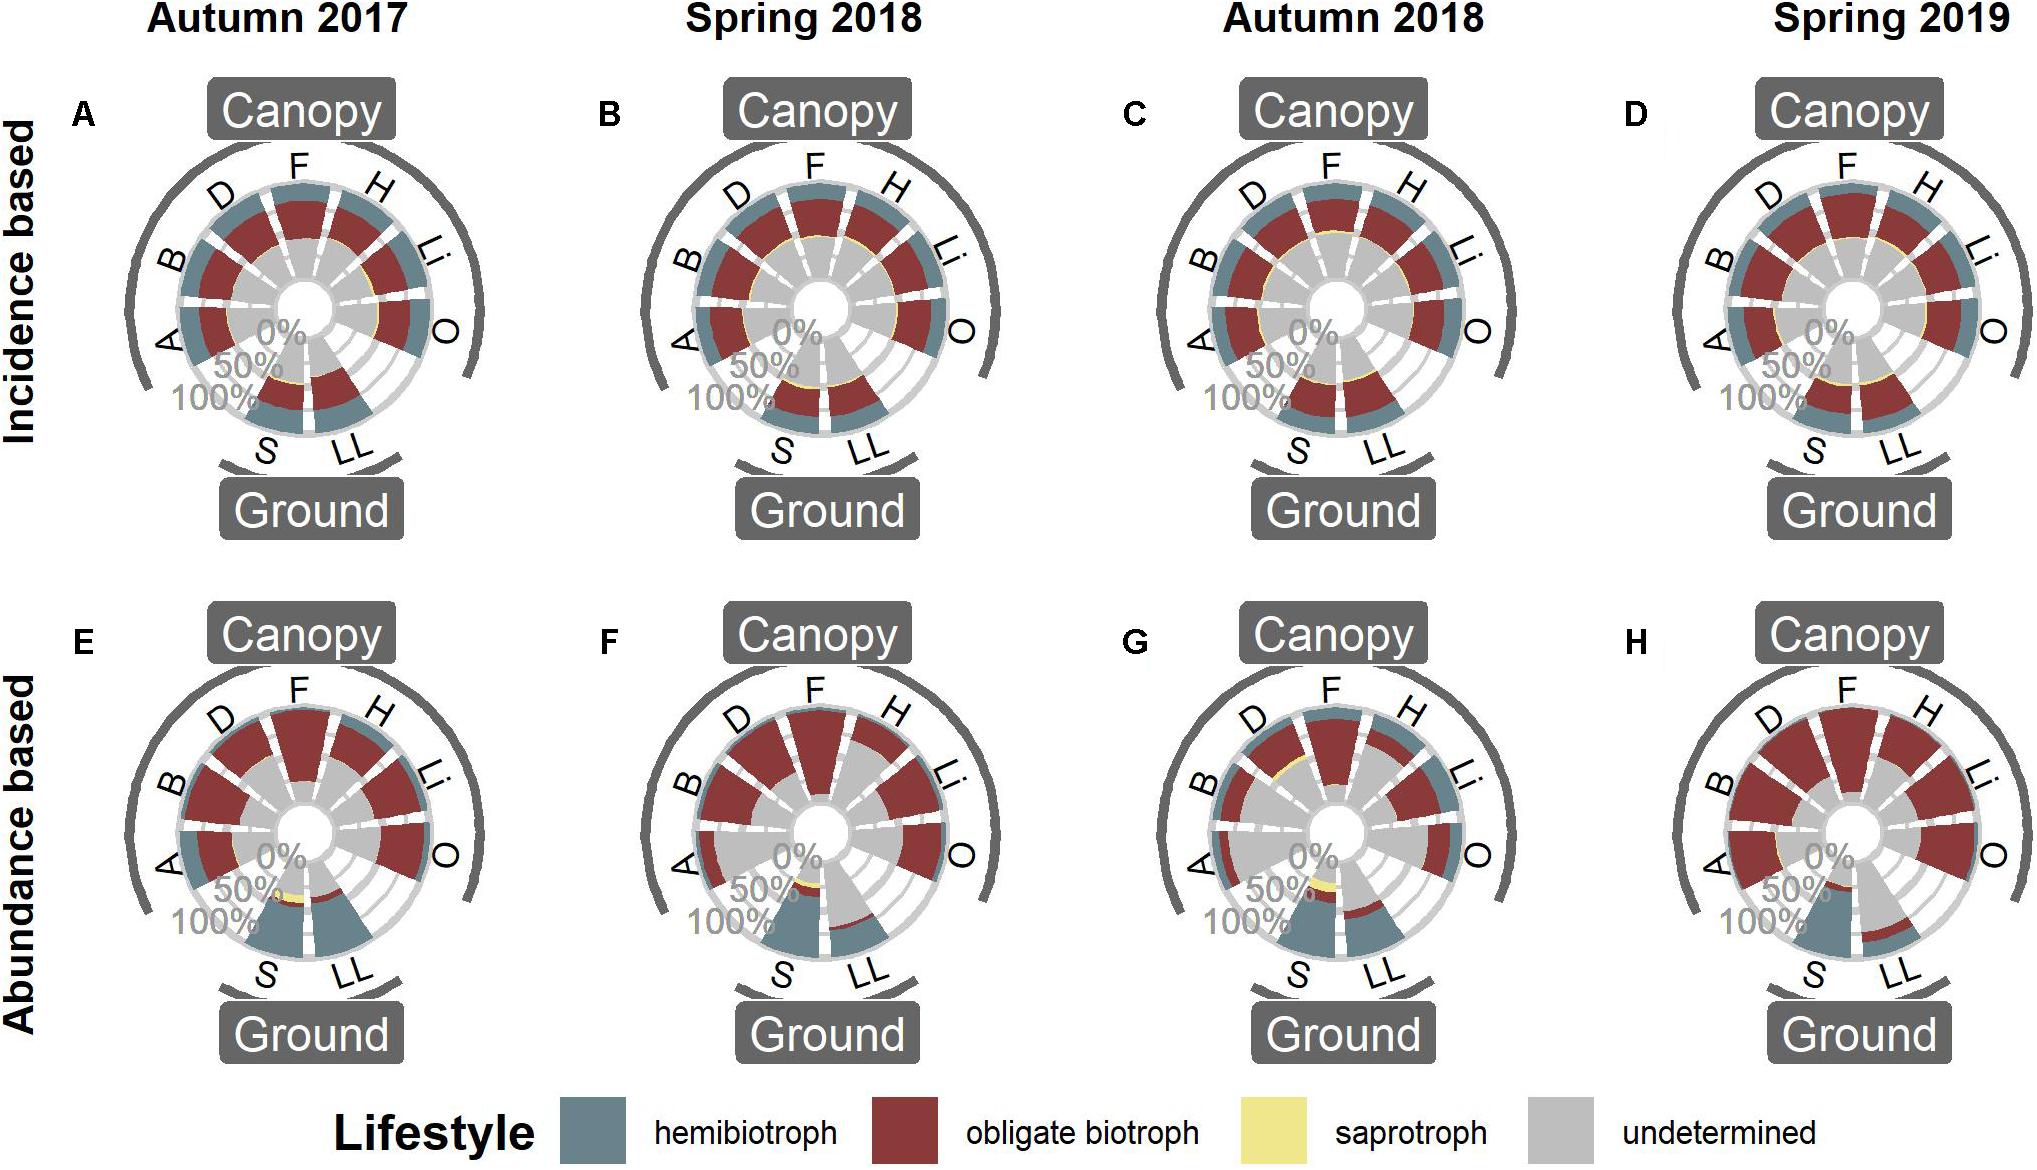
Figure 1. Functional annotation of oomycete OTUs in canopy and ground habitats. (A–D) Distribution of functional groups based on OTU presence/absence, i.e., the proportion of OTUs per Lifestyle. (E–H) Distribution of functional groups when taking abundances into account. A, Arboreal Soil; B, Bark; D, Deadwood; F, Fresh Leaves; H, Hypnum; Li, Lichen; O, Orthotrichum; S, Soil; LL, Leaf Litter.
Comparing the data from Spring 2019 (Figures 1D,H) with air samples previously published by Jauss et al. (2020a) (Figure 2) revealed that the air surrounding canopy and ground habitats was dominated by obligate biotrophic OTUs, irrespective of incidence or abundance.
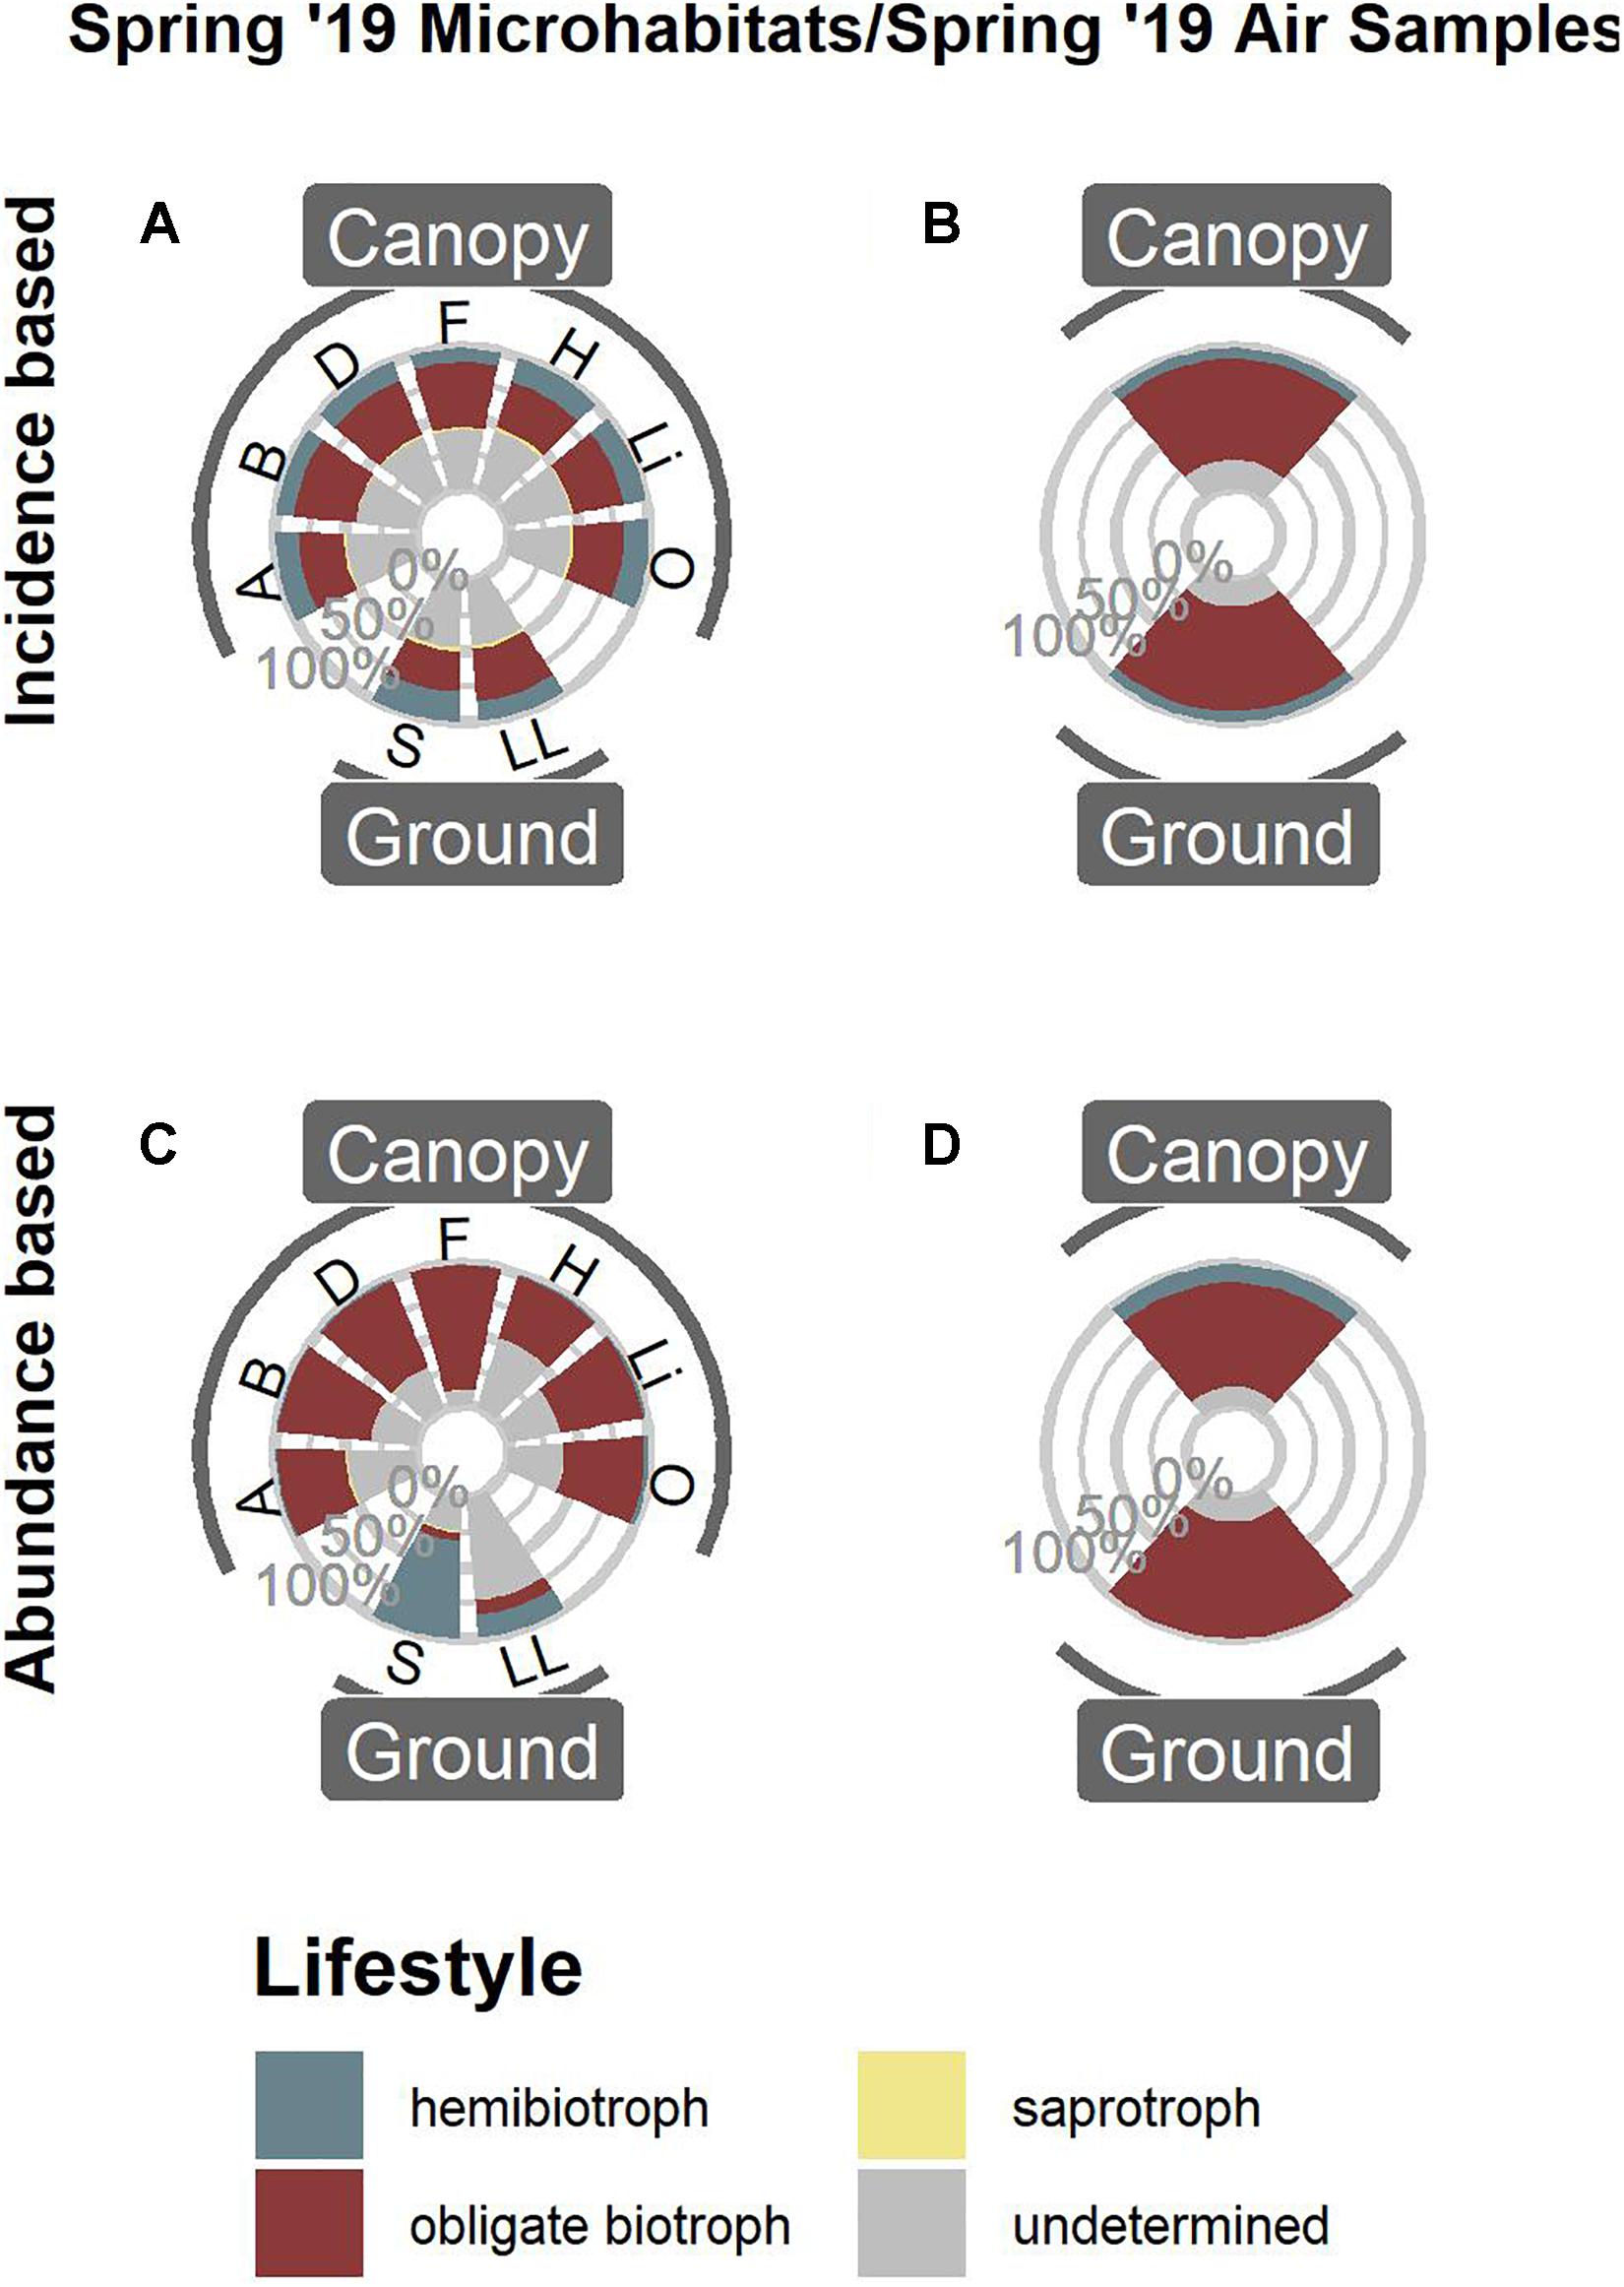
Figure 2. Functional annotation of oomycete OTUs from Spring 2019. Microhabitat samples based on OTU presence/absence (A) and OTU abundances (C) compared to air samples based on OTU presence/absence (B) and OTU abundances (D). For microhabitat abbreviations, see Figure 1.
To further determine the distribution of functional groups together with the taxonomic annotation, the relative abundances of each OTU were partitioned for concatenated canopy habitats, soil, and leaf litter samples (Figure 3). Again, OTUs assigned to obligate biotrophic species dominated canopy samples, while hemibiotrophic species were more evenly distributed or more abundant in leaf litter and soil habitats. Albuginales were almost exclusively present in canopy samples, Peronosporales dominated canopy and leaf litter samples, while Pythiales showed a rather even distribution.
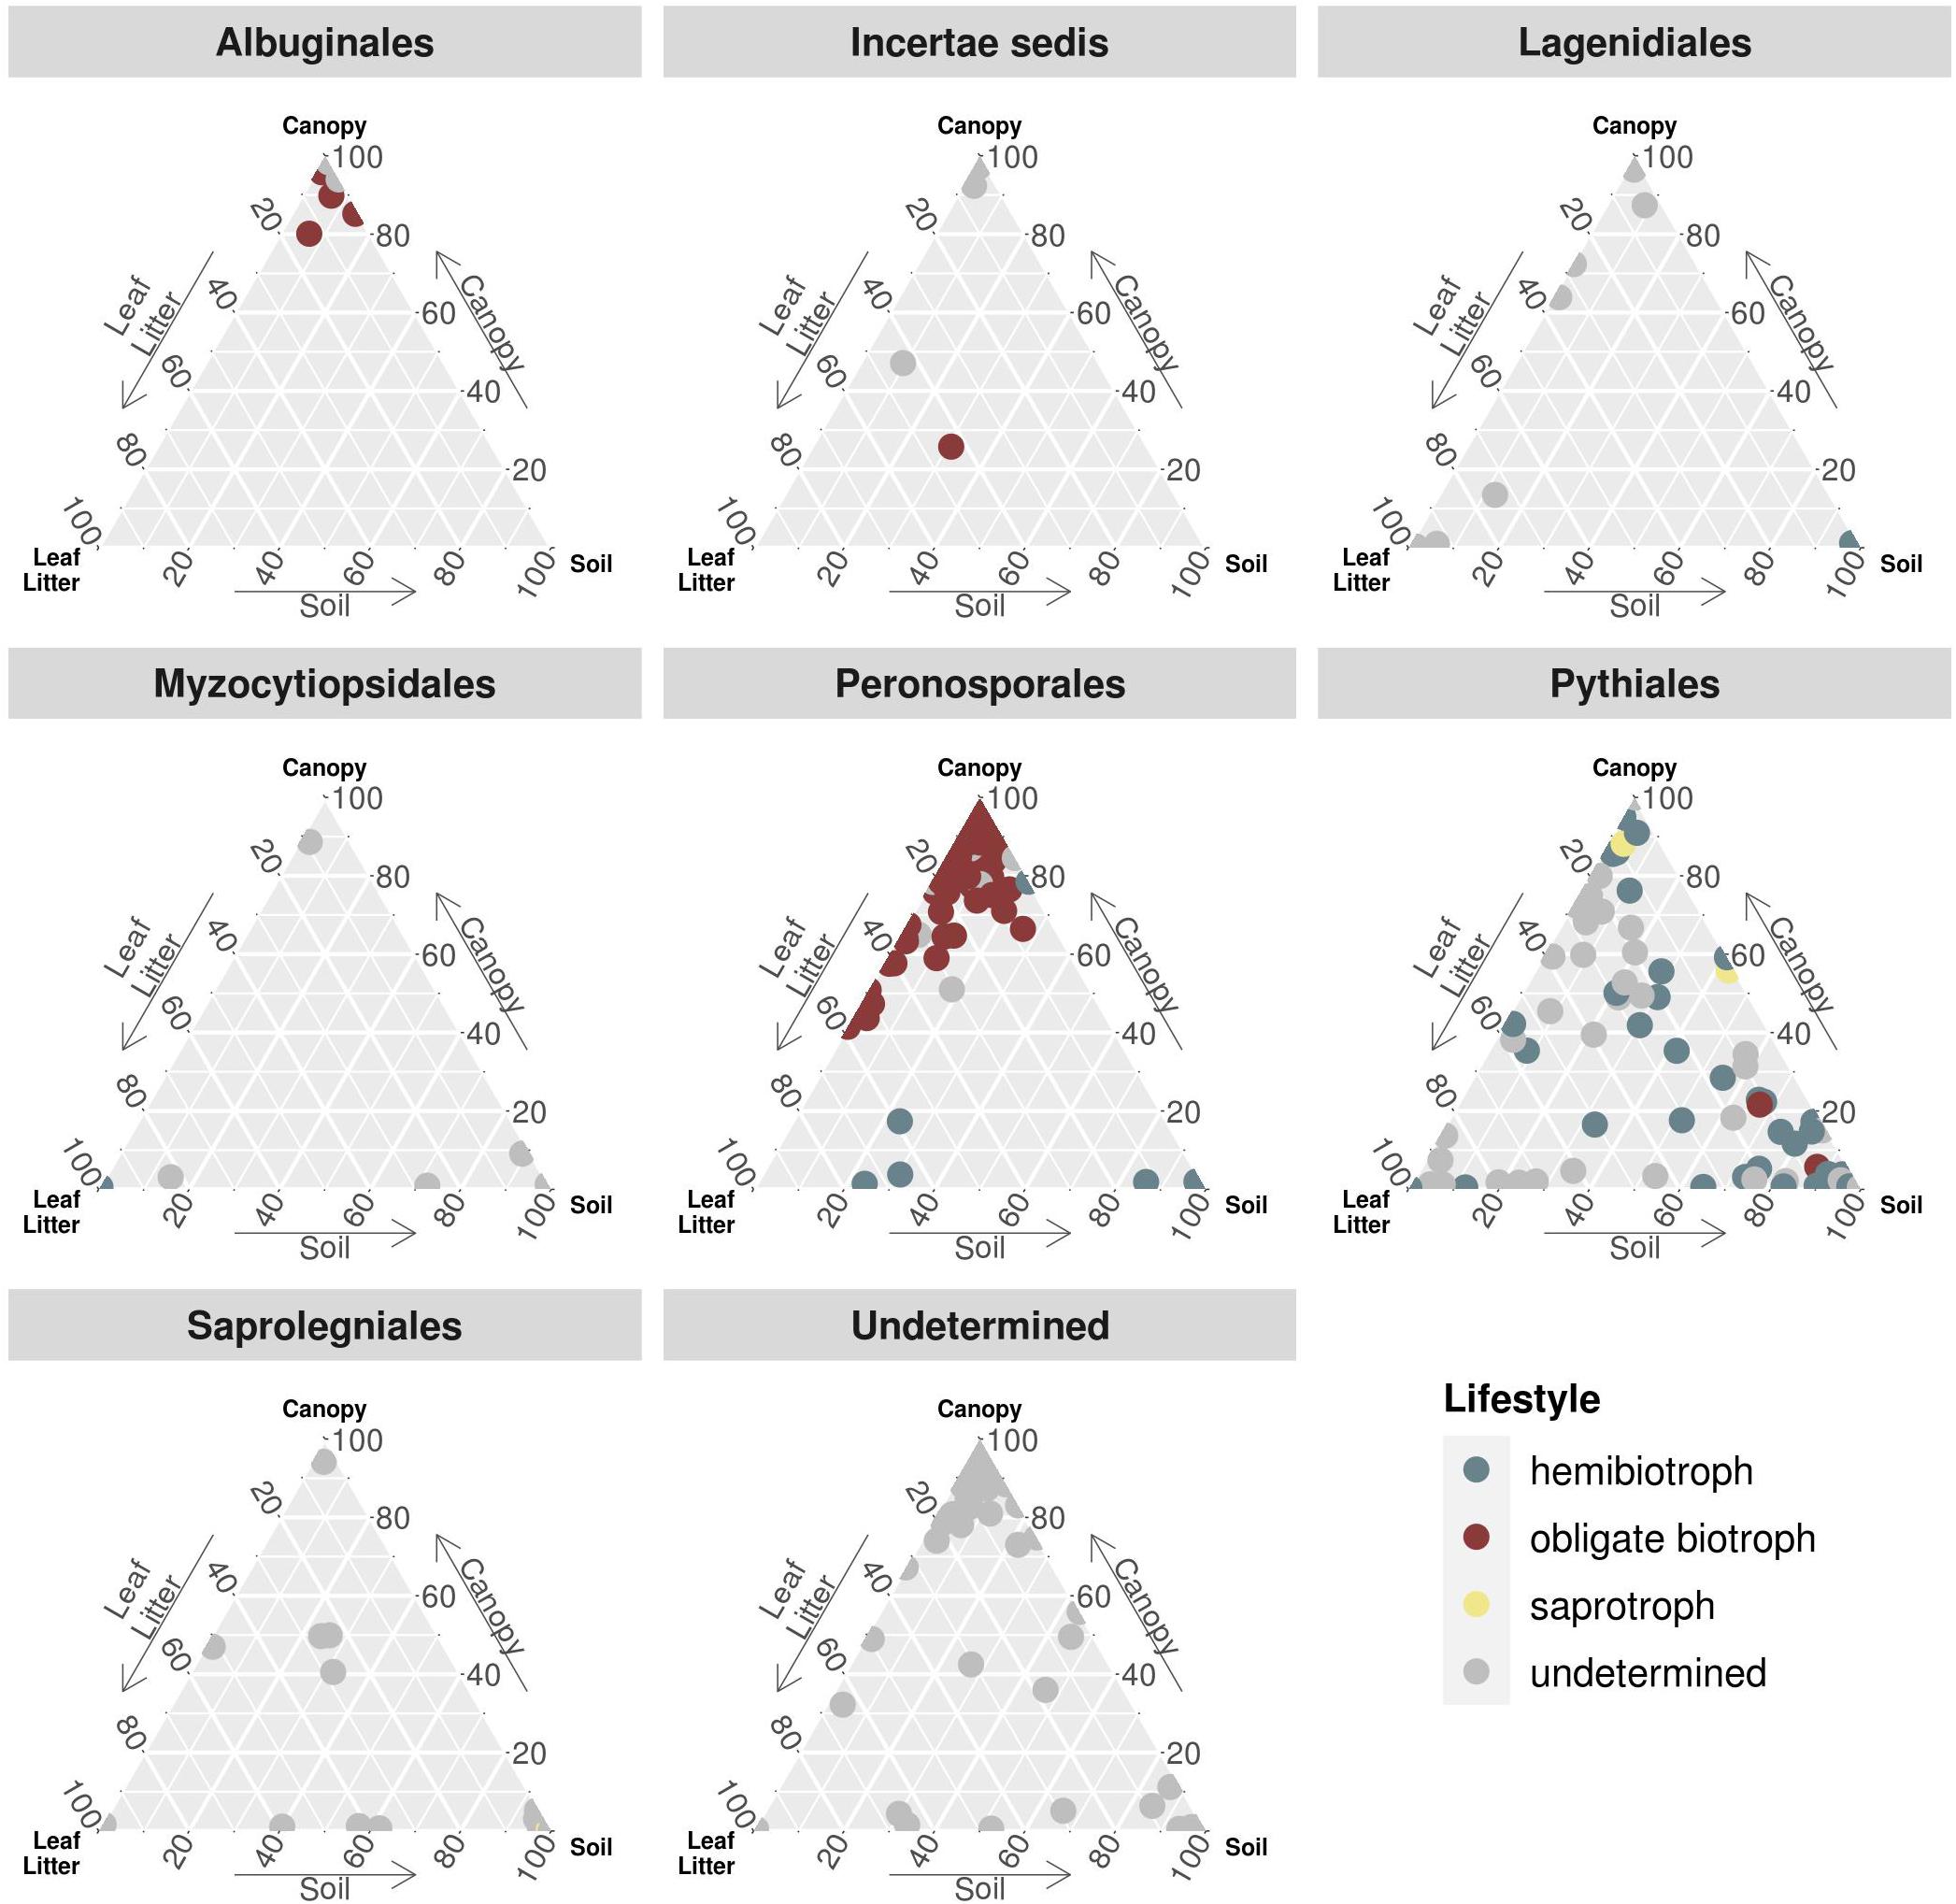
Figure 3. Ternary plot partitioning the relative abundances of OTUs between canopy, soil and leaf litter. Each dot represents one OTU, sorted by taxonomic order and coloured by lifestyle. Incertae sedis comprises families and genera not associated with any order, e.g., Lagenaceae or Paralagenidium. The order Undetermined represents OTUs with sequence similarities of less than 70% to any reference sequence.
The relative abundances of the latter two orders were further partitioned into the four sampling events (Supplementary Figure 3). Abundances of Pythiales were rather homogenous and consistent throughout the seasons, while Peronosporales abundances were more shifted to the canopy region in spring samples. In Autumn 2017, OTUs assigned to the Peronosporales were almost exclusively present in canopy and leaf litter samples, while the distribution in Autumn 2018 was more homogenous.
To determine which OTU abundances were significantly different between the two strata ground and canopy as well as the two sampling seasons spring and autumn, a differential abundance analysis was carried out (Figure 4 and Supplementary Figure 4). Within the Peronosporales, this revealed the genera Peronospora and Hyaloperonospora (obligate biotrophic genera) to be the dominant taxa in canopy samples, while Phytophthora (hemibiotrophic) species were significantly differentially abundant in ground samples (Figure 4). For the seasonal effect, more Peronospora species were differentially abundant in spring samples compared to autumn samples (Supplementary Figure 4). Within the Pythiales, the genera Pythium (hemibiotrophic) and Globisporangium (obligate biotrophic) were significantly differentially abundant in ground samples. Most Pythiales, however, could not be determined due to the low sequence similarity to reference sequences.
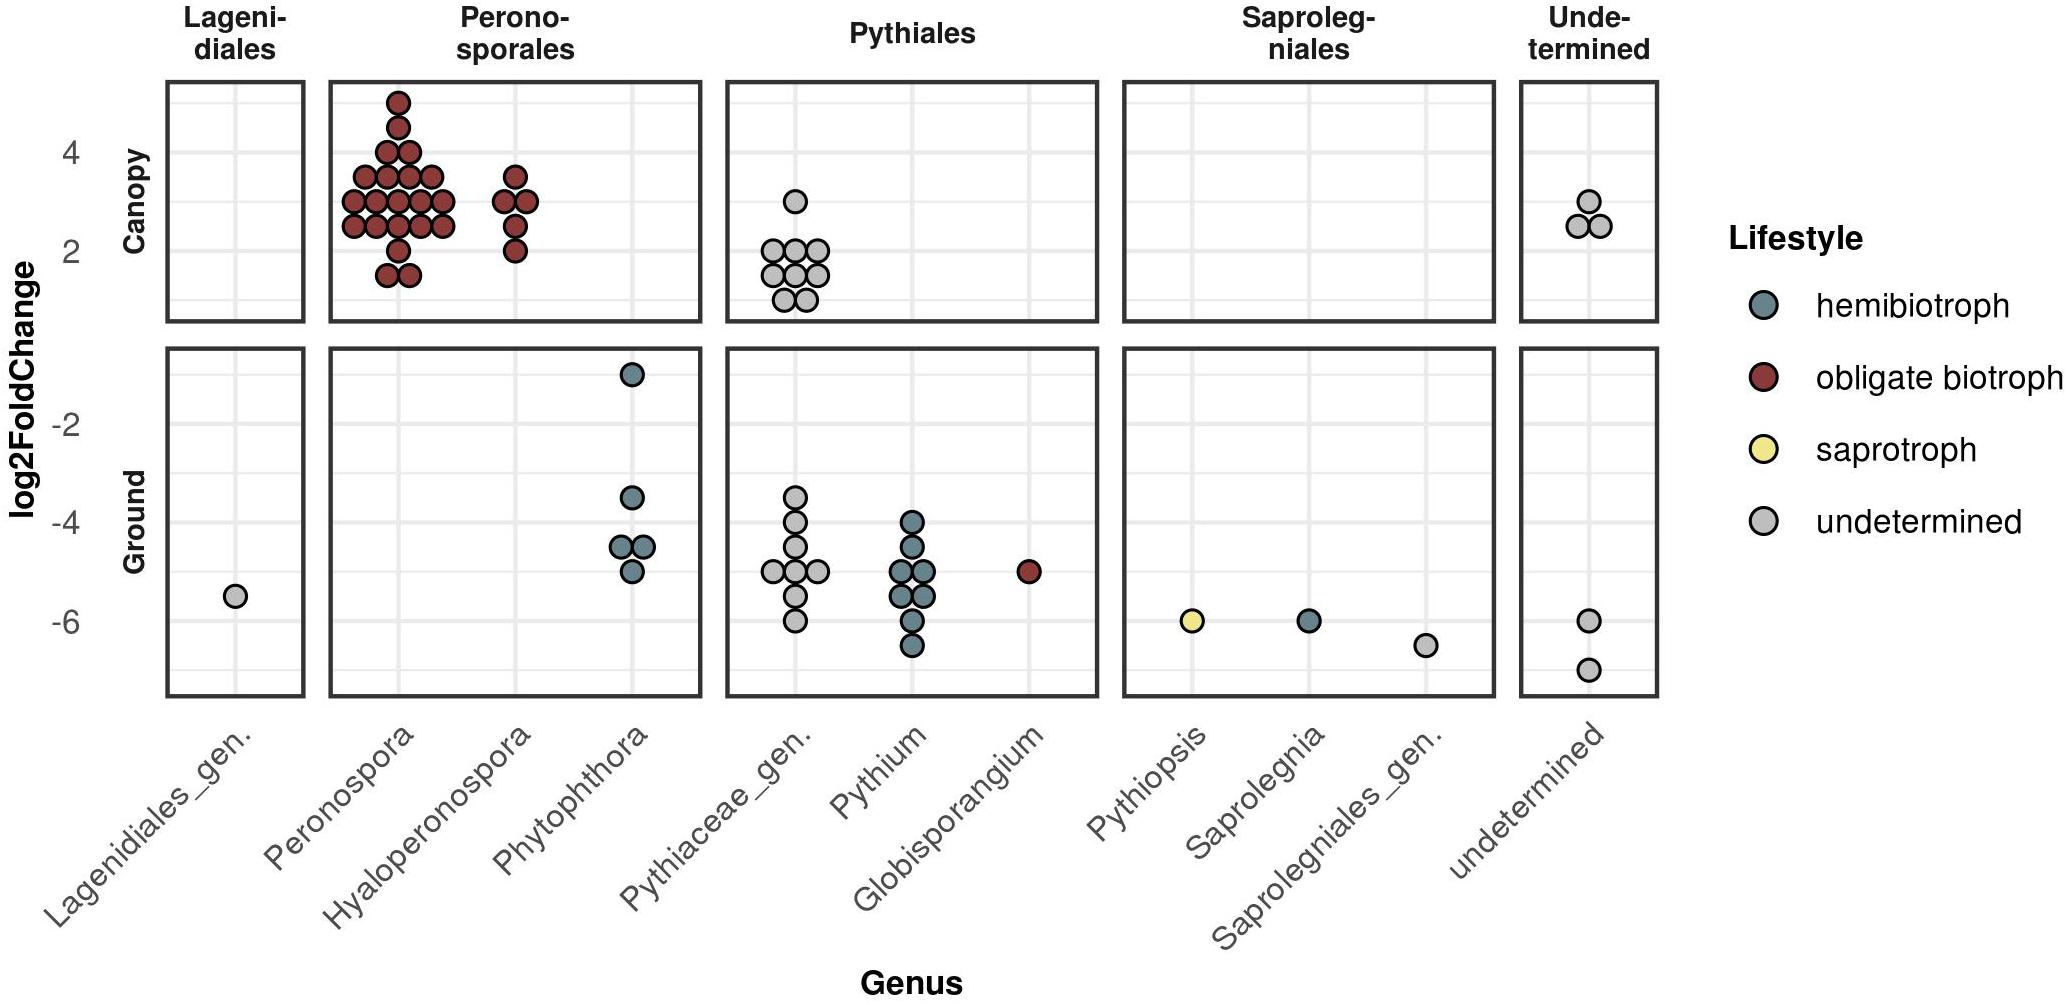
Figure 4. Differential abundance analysis between the two strata canopy (top panels) and ground (bottom panels) sorted by taxonomic order. Each dot represents one significantly differentially abundant OTU grouped by genus. Y-axis (log2FoldChange) gives the measurement of the differential abundance.
Despite OTU richness being quite variable among microhabitats, Shannon diversity as well as evenness were high and did not differ between the samplings (Supplementary Figure 5). Beta diversity analyses revealed similar patterns for all seasons as well: the NMDS plot (Figure 5) showed a large overlap of canopy inhabiting communities, which in turn did not overlap with leaf litter and soil communities. This indicated distinct communities inhabiting canopy and ground habitats, respectively, a pattern recurring in all samplings.
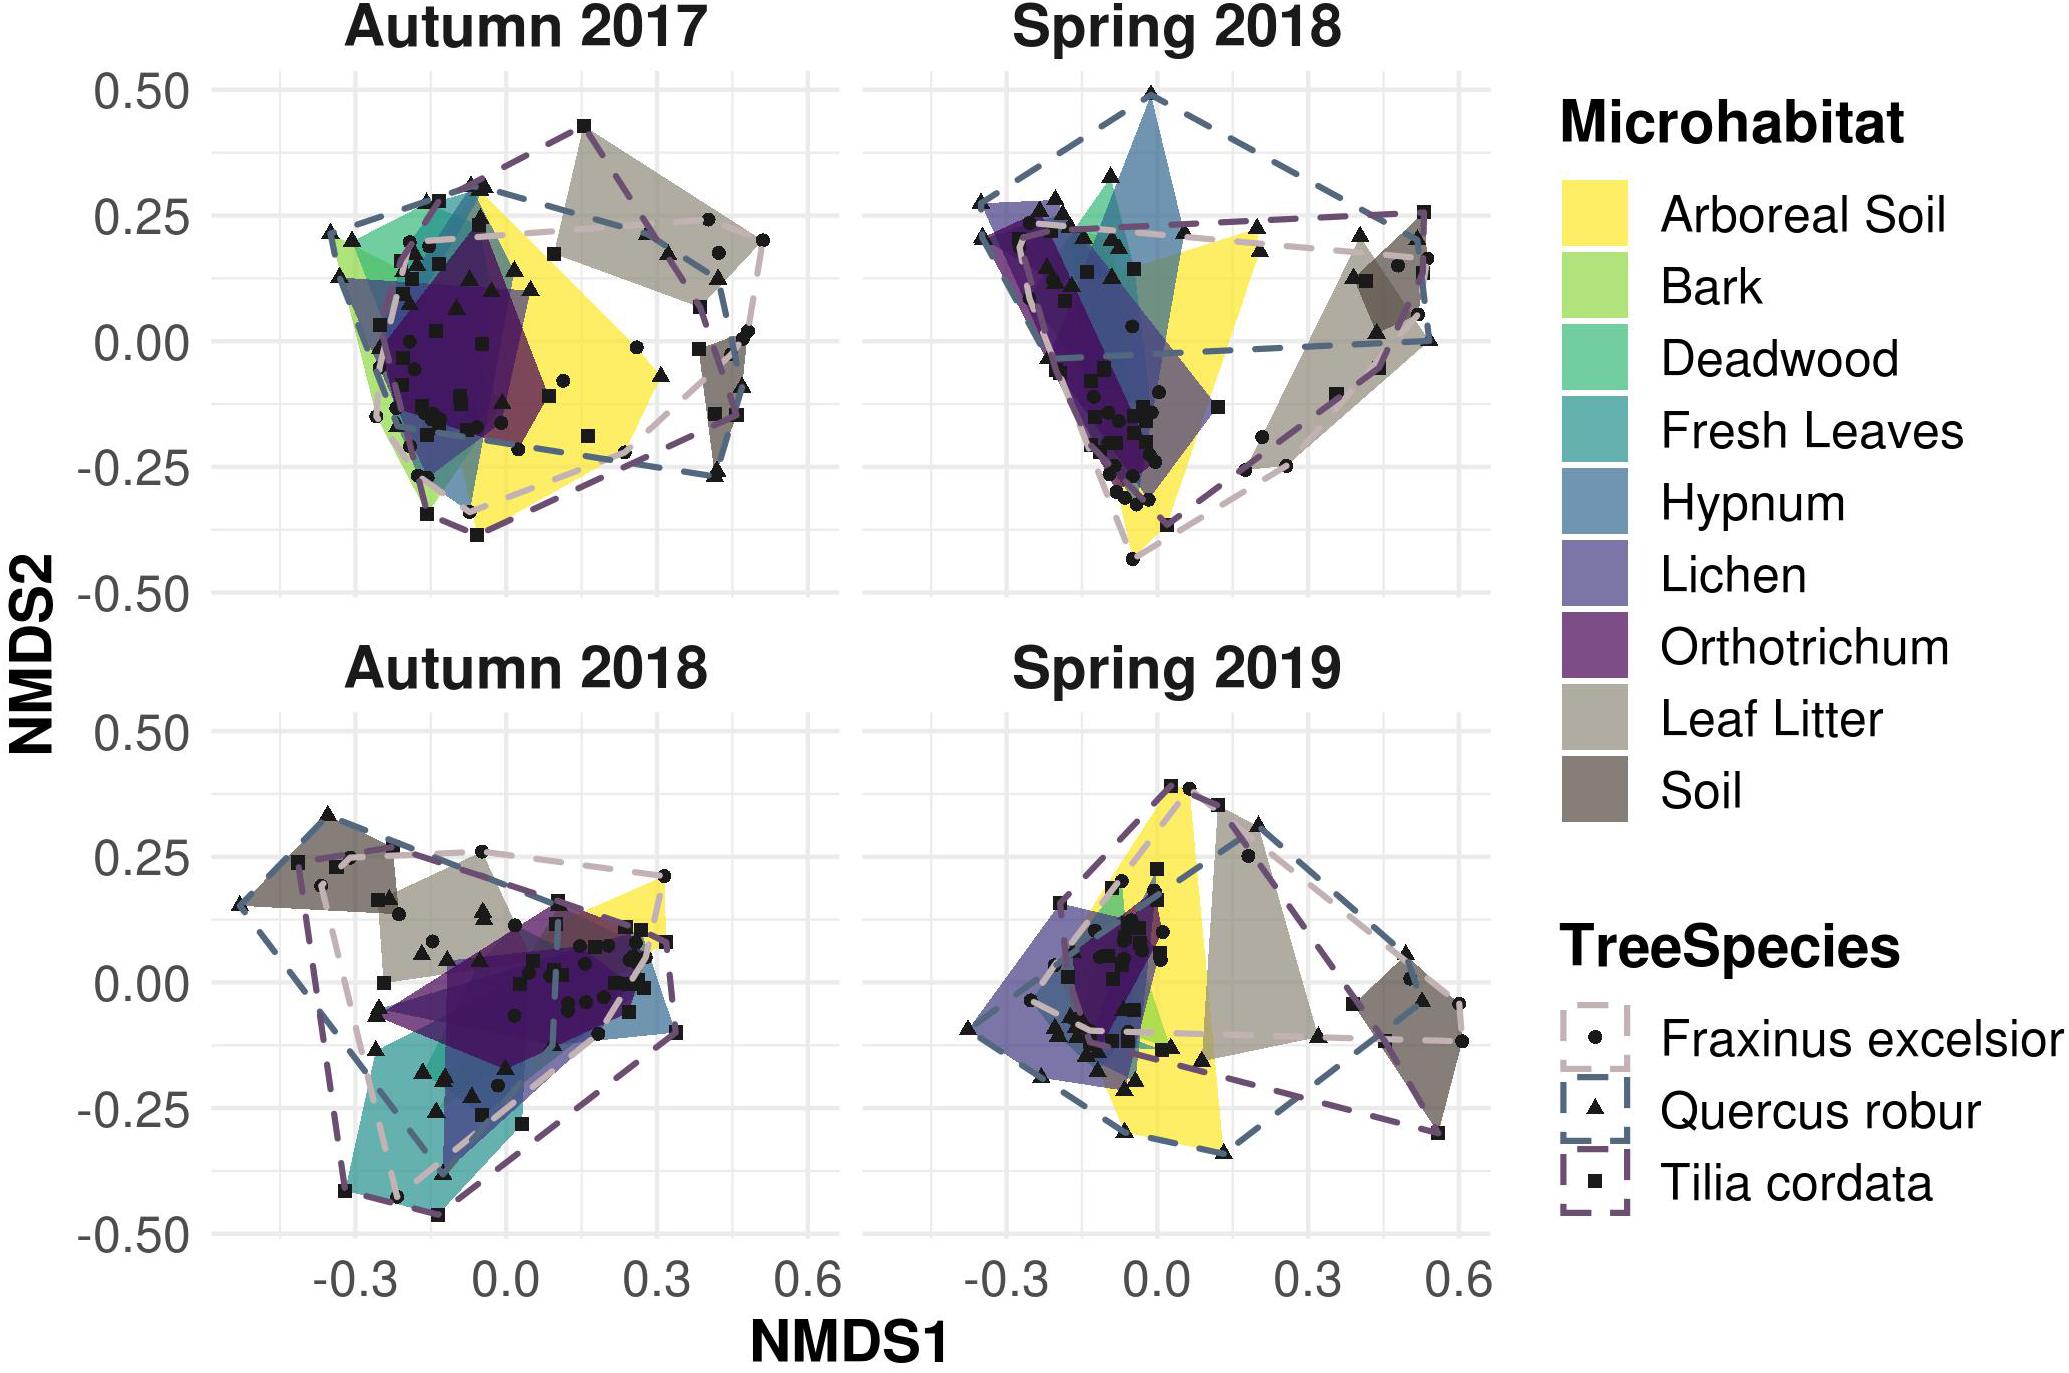
Figure 5. Non-metric multidimensional scaling (NMDS) ordination of Bray-Curtis dissimilarity matrices for canopy and ground microhabitats. Canopy microhabitat communities show a large overlap along all sampling events. Ground habitat communities are strongly separated, indicating unique exclusive communities compared to the canopy region, irrespective of the sampling season.
Variation in community composition was twice as high among microhabitats (R2 = 0.20) than between canopy and ground (R2 = 0.11) or sampling dates (R2 = 0.10). Tree species (R2 = 0.05) and season (R2 = 0.04) explained only a minor fraction of beta diversity (permANOVA, Table 1).
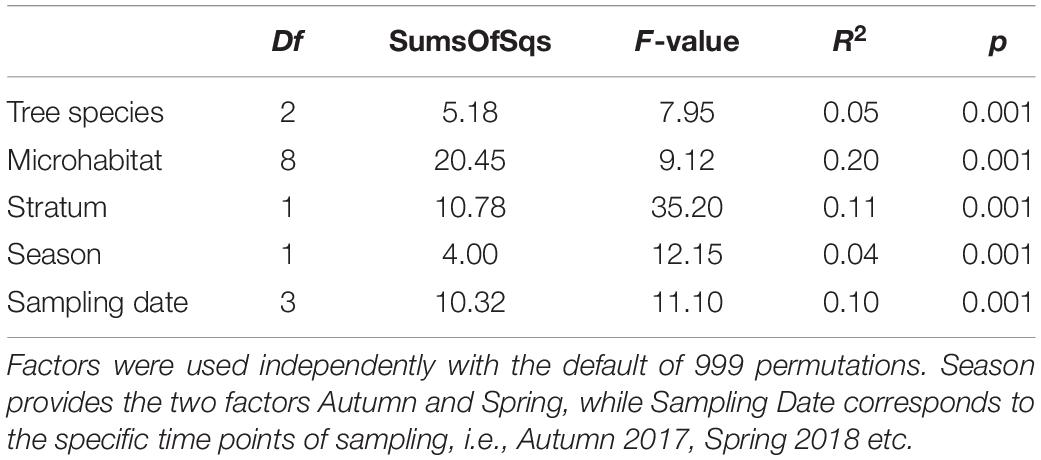
Table 1. Results of permutational multivariate analysis of variance (permANOVA) from the adonis function.
The most striking pattern of oomycete community composition is the distribution of obligate biotrophic and hemibiotrophic species, with the former dominating canopy habitats and the latter predominantly found in ground habitats (Figure 1). In a previous study, Jauss et al. (2020b) proposed increasing functional diversity instead of increasing species richness with increasing habitat diversity, as most OTUs were shared between all habitats irrespective of specific strata or tree species. Here we supplemented functional traits of the detected OTUs, which revealed that the observed diversity is driven by the lifestyle of the oomycetes. Species occupying a hemibiotrophic lifestyle dominated the two ground habitats soil and leaf litter. Hemibiotrophy is characterised by an initial biotrophic phase, which turns into a necrotrophic phase (Fawke et al., 2015; Pandaranayaka et al., 2019). Oomycetes dwelling the ground habitats are thus capable of feeding on the dead organic matter in the soil, leaf litter and deadwood samples. Deadwood on the forest floor has already been shown to harbour hemibiotrophic oomycetes (Kwaśna et al., 2017a, b). In the canopy, however, deadwood harboured only a limited amount of hemibiotrophic species, as they were dominated by obligate biotrophic species, like the other canopy habitats. The reason for this might be the high number of obligate biotrophs in the other surrounding canopy habitats as well as in the air (Figure 2). These samples might be overwhelmed by the passive influx of biotrophic species, which are capable of surviving in the other, living, habitats. This would be an interplay between stochastic and deterministic processes for community assembly.
Recent molecular studies analysing oomycete diversity determined patterns similar to those reflected in our study, i.e., soil habitats are dominated by hemibiotrophic species, mostly members of the Pythiales (Sapkota and Nicolaisen, 2015; Riit et al., 2016; Fiore-Donno and Bonkowski, 2021). Species of the genus Pythium were significantly differentially abundant in the sampled ground habitats. Habitats in the canopy, however, were dominated by the obligate biotrophic genera Peronospora and Hyaloperonospora (Figure 4 and Supplementary Figure 2). Tree canopies have only recently been subject to studies on microbial diversity (Jauss et al., 2020a, b; Herrmann et al., 2021; Walden et al., 2021), indicating that tree canopies have been a so far neglected reservoir for parasitic microorganisms. Species of the genus Hyaloperonospora are known to be highly host-specific, infecting plant species of Brassicaceae and closely related families (Lee et al., 2017 and references therein). However, none of our sampled trees and microhabitats belong to the family Brassicaceae or the order Brassicales. Yet, we observed a high number of reads and OTUs assigned to the genus Hyaloperonospora in the microhabitat samples in the canopy as well as in the air samples in both strata, while their number in ground microhabitats was significantly depleted (Figure 4). This indicates a non-random distribution of Hyaloperonospora species, as the air as a distribution mechanism should lead to a more or less equal distribution in canopy and ground habitats. Due to their high host specificity, these species should not have survived in these habitats, which, however, might also be owned to the comparatively poor description of oomycete tree pathogens. Their dominance in canopy samples implies a capability of survival on hosts they are not specialised on. Thus, we tentatively propose an even less strict host dependency for the genus Hyaloperonospora than previously suggested (Yerkes and Shaw, 1959; McMeekin, 1960; Dickinson and Greenhalgh, 1977).
The significant differential abundance in the canopy of several undetermined OTUs that can only be assigned to the family Pythiaceae (Figure 4) indicates hitherto undescribed lineages, specialised on the survival in the canopy. Members of the Pythiaceae can occupy all lifestyles, from saprotrophy over hemibiotrophy to obligate biotrophy (Fawke et al., 2015; Marano et al., 2016; Fiore-Donno and Bonkowski, 2021). If the OTUs in the canopy would show an obligate biotrophic lifestyle, it would be in line with observations of the other lineages in the canopy (Figure 1). Yet, these OTUs had a sequence similarity of only ca 80–85% to any reference sequence, thus we only tentatively draw conclusions about their lifestyle.
A common pattern in microbial community ecology studies is a high seasonal variability (Nolte et al., 2010; Fiore-Donno et al., 2019; Fournier et al., 2020; Walden et al., 2021). Oomycete community compositions were in fact slightly, yet significantly distinct for every sampling and correspondingly for every season (Table 1). This pattern is in line with hypotheses proposed by Jauss et al. (2020a), that seasonal variation in air samples drives the community composition in forest ecosystems. The environment, however, then selects the species most adapted to the microhabitat, leading to overall similar community patterns and microhabitat differences for every season (Figure 5). The seasonal changes in microhabitat properties (e.g., temperature, moisture or habitat structure) thus affect all habitats and communities equally. The season itself explained less variance in community composition than the sampling dates (i.e., Autumn 2017 vs. Autumn 2018 etc.; Table 1), suggesting that annual changes do not lead to similar community structures within microhabitats in each season as an annual cycle per se, but rather indicate a high temporal variability while preserving spatial diversity. Fournier et al. (2020) observed similar patterns, concluding deterministic niche-based processes in microbial forest soil community assembly. Implications are that ecosystem functioning of oomycete communities is not mainly affected by seasonal fluctuations, but rather by microhabitat identity and, correspondingly, responses of lifestyle to microhabitat filtering (Fiore-Donno and Bonkowski, 2021).
Both our hypotheses were confirmed in this study: Oomycetes show not only a spatial, but also, to a lesser extent, a temporal variation in their communities. Within the temporal variation, however, the spatial variation is preserved, leading to overall similar community patterns for every sampling date. Further, these deterministic processes also shape their functional diversity in forest ecosystems. Our results indicate that tree canopies not only offer numerous distinct habitats to microorganisms, but also serve as a reservoir for parasitic species. Spatial diversity and correspondingly functional diversity drive the oomycete community to a greater extent than temporal diversity. Thus, our findings contribute to future studies on oomycete ecosystem functioning.
The datasets presented in this study can be found in online repositories. The names of the repository/repositories and accession number(s) can be found below: https://www.ebi.ac.uk/ena, ERS4399744, ERS5649966, ERS5649967. Code and detailed bioinformatic/statistical pipelines used in this study are available at: https://github.com/RJauss/ParasitesParadise.
MB and MS conceived the study. RW and SS designed the sampling and DNA extraction. AMF-D contributed the primers and functional annotation of oomycetes. SW and R-TJ conducted the sampling, DNA extraction and PCRs. KF assisted DNA extraction and PCRs. R-TJ performed the bioinformatic and statistical analyses and drafted the manuscript. All authors contributed to and approved the final version.
This work was supported by the Priority Program SPP 1991: Taxon-omics—New Approaches for Discovering and Naming Biodiversity of the German Research Foundation (DFG) with funding to MB (1907/19-1) and MS (Schl 229/20-1). We acknowledge support from the Leipzig University Library for open access publishing.
The authors declare that the research was conducted in the absence of any commercial or financial relationships that could be construed as a potential conflict of interest.
We would like to thank Rolf Engelmann for his assistance with the field work by operating the canopy crane, as well as the Leipzig Canopy Crane Platform of the German Centre for Integrative Biodiversity Research (iDiv) for providing the site access and allowing us to sample the trees from their field trial.
The Supplementary Material for this article can be found online at: https://www.frontiersin.org/articles/10.3389/ffgc.2021.668895/full#supplementary-material
Supplementary Figure 1 | Sequence similarity of reads (top) and OTUs (bottom) per sampling event to published reference sequences. 20.5% of all OTUs, corresponding to 3% of all reads, had a similarity of less than 70% to any known reference sequence (not shown).
Supplementary Figure 2 | Taxonomic assignment of OTUs per sampling and microhabitat. Black line separates canopy and ground habitats. Distribution of taxonomic groups was similar for every sampling, i.e., Pythiales and Peronosporales dominating all samples. Grey squares indicate the relative abundance of OTUs assigned to the genus Hyaloperonospora within the Peronosporales.
Supplementary Figure 3 | Ternary plot partitioning the relative abundances of Peronosporales and Pythiales per sampling event. Each dot represents one OTU.
Supplementary Figure 4 | Differential abundance analysis between the two seasons spring (top panels) and autumn (bottom panels) sorted by taxonomic order. Each dot represents one significantly differentially abundant OTU grouped by genus. Y-axis (log2FoldChange) gives the measurement of the differential abundance.
Supplementary Figure 5 | Boxplot of alpha diversity indices for microhabitat communities per sampling. Outliers are given by dots. Observed patterns show no strong variability over the four sampling events.
Supplementary Table 1 | Primer tags used in this study. Given are the sample ID, forward and (reverse complemented) reverse tag and the ENA sequencing run ID.
Supplementary Table 2 | Poisson regression of the abundances of hemibiotrophic and obligate biotrophic OTUs on the microhabitats. Positive estimates give positive correlations in the corresponding habitat, negative estimates give negative correlations. Hemibiotrophic OTUs are positively associated with the ground habitats, obligate biotrophic OTUs with canopy habitats, i.e., depleted in ground habitats.
Adl, S. M., Bass, D., Lane, C. E., Lukeš, J., Schoch, C. L., Smirnov, A., et al. (2019). Revisions to the Classification, Nomenclature, and Diversity of Eukaryotes. J. Eukaryot. Microbiol. 66, 4–119. doi: 10.1111/jeu.12691
Arcate, J. M., Karp, M. A., and Nelson, E. B. (2006). Diversity of Peronosporomycete (oomycete) communities associated with the rhizosphere of different plant species. Microb. Ecol. 51, 36–50. doi: 10.1007/s00248-005-0187-y
Bolyen, E., Rideout, J. R., Dillon, M. R., Bokulich, N. A., Abnet, C. C., Al-Ghalith, G. A., et al. (2019). Reproducible, interactive, scalable and extensible microbiome data science using QIIME 2. Nat. Biotechnol. 37, 852–857. doi: 10.1038/s41587-019-0209-9
Camacho, C., Coulouris, G., Avagyan, V., Ma, N., Papadopoulos, J., Bealer, K., et al. (2009). BLAST+: architecture and applications. BMC Bioinformatics 10:421. doi: 10.1186/1471-2105-10-421
Dickinson, C. H., and Greenhalgh, J. R. (1977). Host range and taxonomy of Peronospora on crucifers. Trans. Brit. Mycol. Soc. 69, 111–116. doi: 10.1016/s0007-1536(77)80121-6
Esmaeili Taheri, A., Chatterton, S., Gossen, B. D., and McLaren, D. L. (2017). Metagenomic analysis of oomycete communities from the rhizosphere of field pea on the Canadian prairies. Can. J. Microbiol. 63, 758–768. doi: 10.1139/cjm-2017-0099
Fawke, S., Doumane, M., and Schornack, S. (2015). Oomycete Interactions with Plants: infection Strategies and Resistance Principles. Microbiol. Mol. Biol. Rev. 79, 263–280. doi: 10.1128/mmbr.00010-15
Fiore-Donno, A. M., and Bonkowski, M. (2021). Different community compositions between obligate and facultative oomycete plant parasites in a landscape-scale metabarcoding survey. Biol. Fertil. Soils 57, 245–256. doi: 10.1007/s00374-020-01519-z
Fiore-Donno, A. M., Richter-Heitmann, T., Degrune, F., Dumack, K., Regan, K. M., Marhan, S., et al. (2019). Functional traits and spatio-temporal structure of a major group of soil protists (rhizaria: Cercozoa) in a temperate grassland. Front. Microbiol. 10:1332. doi: 10.3389/fmicb.2019.01332
Fournier, B., Samaritani, E., Frey, B., Seppey, C. V. W., Lara, E., Heger, T. J., et al. (2020). Higher spatial than seasonal variation in floodplain soil eukaryotic microbial communities. Soil Biol. Biochem. 147:107842. doi: 10.1016/j.soilbio.2020.107842
Hamilton, N. E., and Ferry, M. (2018). Ggtern: ternary diagrams using ggplot2. J. Stat. Softw. 87, 1–17. doi: 10.18637/jss.v087.c03
Herrmann, M., Geesink, P., Richter, R., and Küsel, K. (2021). Canopy Position Has a Stronger Effect than Tree Species Identity on Phyllosphere Bacterial Diversity in a Floodplain Hardwood Forest. Microb. Ecol. 81, 157–168. doi: 10.1007/s00248-020-01565-y
Jauss, R.-T., Nowack, A., Walden, S., Wolf, R., Schaffer, S., Schellbach, B., et al. (2020a). To the canopy and beyond: air samples reveal wind dispersal as a driver of ubiquitous protistan pathogen assembly in tree canopies. BioRxiv [Preprint]. doi: 10.1101/2020.11.30.405688
Jauss, R.-T., Walden, S., Fiore-Donno, A. M., Dumack, K., Schaffer, S., Wolf, R., et al. (2020b). From forest soil to the canopy: increased habitat diversity does not increase species richness of Cercozoa and Oomycota in tree canopies. Front. Microbiol. 11:3364. doi: 10.3389/FMICB.2020.592189
Kamoun, S., Furzer, O., Jones, J. D. G., Judelson, H. S., Ali, G. S., Dalio, R. J. D., et al. (2015). The Top 10 oomycete pathogens in molecular plant pathology. Mol. Plant Pathol. 16, 413–434. doi: 10.1111/mpp.12190
Krsteska, V., Dimeska, V., Stojkov, S., and Stojanoski, P. (2014). Peronospora Tabacina A. The causing agent of blue mold disease on Tobacco. Bulg. J. Agric. Sci. 21, 126–133. http://eprints.uklo.edu.mk/312/
Kwaśna, H., Mazur, A., Kuźmiński, R., Jaszczak, R., Turski, M., Behnke-Borowczyk, J., et al. (2017a). Abundance and diversity of wood-decay fungi in managed and unmanaged stands in a Scots pine forest in western Poland. For. Ecol. Manag. 400, 438–446. doi: 10.1016/j.foreco.2017.04.023
Kwaśna, H., Mazur, A., Łabędzki, A., Kuźmiński, R., and Łakomy, P. (2017b). Communities of fungi in decomposed wood of oak and pine. For. Res. Papers 77, 261–275. doi: 10.1515/frp-2016-0028
Lee, J. S., Lee, H. B., Shin, H. D., and Choi, Y. J. (2017). Diversity, phylogeny, and host-specialization of Hyaloperonospora species in Korea. Mycobiology 45, 139–149. doi: 10.5941/MYCO.2017.45.3.139
Lewis, D. H. (1973). Concepts in fungal nutrition and the origin of biotrophy. Biol. Rev. 48, 261–277. doi: 10.1111/j.1469-185x.1973.tb00982.x
Love, M. I., Huber, W., and Anders, S. (2014). Moderated estimation of fold change and dispersion for RNA-seq data with DESeq2. Genome Biol. 15, 550. doi: 10.1186/s13059-014-0550-8
Mahé, F., Rognes, T., Quince, C., de Vargas, C., and Dunthorn, M. (2015). Swarmv2: highly-scalable and high-resolution amplicon clustering. PeerJ 3:e1420. doi: 10.7717/peerj.1420
Marano, A. V., Jesus, A. L., de Souza, J. I., Jerônimo, G. H., Gonçalves, D. R., Boro, M. C., et al. (2016). Ecological roles of saprotrophic Peronosporales (Oomycetes. Fungal Ecol. 19, 77–88. doi: 10.1016/j.funeco.2015.06.003
Marano, A. V., Jesus, A. L., Pires-Zottarelli, C. L. A., James, T. Y., Gleason, F. H., and de Souza, J. I. (2014). “Phylogenetic relationships of Pythiales and Peronosporales (Oomycetes, Straminipila) within the “peronosporalean galaxy”,” in freshwater Fungi And Fungal-Like Organisms, eds K. Jones, E. B. G. Hyde, and K. D. Pang (Berlin: WALTER DE GRUYTER GMBH), 177–199. doi: 10.1515/9783110333480.177
Marčiulynienė, D., Marčiulynas, A., Lynikienė, J., Vaičiukynė, M., Gedminas, A., and Menkis, A. (2021). DNA-Metabarcoding of Belowground Fungal Communities in Bare-Root Forest Nurseries: focus on Different Tree Species. Microorganisms 9:150. doi: 10.3390/microorganisms9010150
Martin, F., Kohler, A., Murat, C., Veneault-Fourrey, C., and Hibbett, D. S. (2016). Unearthing the roots of ectomycorrhizal symbioses. Nat. Rev. Microbiol. 14, 760–773. doi: 10.1038/nrmicro.2016.149
Martin, M. (2011). Cutadapt removes adapter sequences from high-throughput sequencing reads. EMBnet J. 17:10. doi: 10.14806/ej.17.1.200
McMeekin, D. (1960). The role of the oospores of Peronospora parasitica in downy mildew of crucifera. Phytopathology 50, 93–97. https://www.cabdirect.org/cabdirect/abstract/19601101892
Mizubuti, E. S., and Fry, W. E. (2006). “Potato late blight. In The Epidemiology of Plant Diseases,” in The Epidemiology of Plant DiseasesDordrecht, eds B. M. Cooke, D. G. Jones, and B. Kaye (Berlin: Springer), 445–471. doi: 10.1007/1-4020-4581-6_17
Nadkarni, N. M. (2001). “Enhancement of forest canopy research, education, and conservation in the new millennium,” in Tropical Forest Canopies: Ecology and Management, eds K. E. Linsenmair, A. J. Davis, B. Fiala, and M. R. Speight (Berlin: Springer), 361–367. doi: 10.1007/978-94-017-3606-0_29
Nolte, V., Pandey, R. V., Jost, S., Medinger, R., Ottenwälder, B., Boenigk, J., et al. (2010). Contrasting seasonal niche separation between rare and abundant taxa conceals the extent of protist diversity. Mol. Ecol. 19, 2908–2915. doi: 10.1111/j.1365-294X.2010.04669.x
Oksanen, J., Blanchet, F. G., Friendly, M., Kindt, R., Legendre, P., McGlinn, D., et al. (2019). vegan: Community Ecology Package. URL: https://cran.r-project.org/package=vegan
Pandaranayaka, E. P. J., Frenkel, O., Elad, Y., Prusky, D., and Harel, A. (2019). Network analysis exposes core functions in major lifestyles of fungal and oomycete plant pathogens. BMC Genomics 20, 1–15. doi: 10.1186/s12864-019-6409-3
Parkunan, V., Gitaitis, R. D., Dutta, B., Langston, D. B., and Ji, P. (2013). An Epidemic of Downy Mildew caused by Peronospora destructor on Vidalia Sweet Onions in Georgia in 2012. Plant Health Prog. 14:54. doi: 10.1094/php-2013-0328-01-br
Riit, T., Tedersoo, L., Drenkhan, R., Runno-Paurson, E., Kokko, H., and Anslan, S. (2016). Oomycete-specific ITS primers for identification and metabarcoding. MycoKeys 14, 17–30. doi: 10.3897/mycokeys.14.9244
Rizzo, D. M., and Garbelotto, M. (2003). Sudden Oak Death: endangering California and Oregon Forest Ecosystems. Front. Ecol. Environ. 1:197. doi: 10.2307/3868064
Rizzo, D. M., Garbelotto, M., and Hansen, E. M. (2005). Phytophthora ramorum: integrative Research and Management of an Emerging Pathogen in California and Oregon Forests. Annu. Rev. Phytopathol. 43, 309–335. doi: 10.1146/annurev.phyto.42.040803.140418
Rognes, T., Flouri, T., Nichols, B., Quince, C., and Mahé, F. (2016). VSEARCH: a versatile open source tool for metagenomics. PeerJ 4:e2584. doi: 10.7717/peerj.2584
Sapkota, R., and Nicolaisen, M. (2015). An improved high throughput sequencing method for studying oomycete communities. J. Microbiol. Methods 110, 33–39. doi: 10.1016/j.mimet.2015.01.013
Sapp, M., Tyborski, N., Linstädter, A., López Sánchez, A., Mansfeldt, T., Waldhoff, G., et al. (2019). Site-specific distribution of oak rhizosphere-associated oomycetes revealed by cytochrome c oxidase subunit II metabarcoding. Ecol. Evol. 9, 10567–10581. doi: 10.1002/ece3.5577
Singer, D., Lara, E., Steciow, M. M., Seppey, C. V. W., Paredes, N., Pillonel, A., et al. (2016). High-throughput sequencing reveals diverse oomycete communities in oligotrophic peat bog micro-habitat. Fungal Ecol. 23, 42–47. doi: 10.1016/j.funeco.2016.05.009
Spanu, P., and Kämper, J. (2010). Genomics of biotrophy in fungi and oomycetes-emerging patterns. Curr. Opin. Plant Biol. 13, 409–414. doi: 10.1016/j.pbi.2010.03.004
Spanu, P., and Panstruga, R. (2017). Editorial: biotrophic plant-microbe interactions. Front. Plant Sci. 8:192. doi: 10.3389/fpls.2017.00192
Thines, M., and Kamoun, S. (2010). Oomycete-plant coevolution: recent advances and future prospects. Curr. Opin. Plant Biol. 13, 427–433. doi: 10.1016/j.pbi.2010.04.001
Walden, S., Jauss, R.-T., Feng, K., Fiore-Donno, A. M., Schaffer, S., Wolf, R., et al. (2021). ∗On the phenology of protists: recurrent patterns reveal seasonal variation of protistan (Rhizaria: Cercozoa, Endomyxa) communities in tree canopies. BioRxiv [preprint]. doi: 10.1101/2021.02.15.431229
Keywords: protists, oomycetes, canopies, metabarcoding, parasites, forest ecosystems
Citation: Jauss R-T, Walden S, Fiore-Donno AM, Schaffer S, Wolf R, Feng K, Bonkowski M and Schlegel M (2021) A Parasite’s Paradise: Biotrophic Species Prevail Oomycete Community Composition in Tree Canopies. Front. For. Glob. Change 4:668895. doi: 10.3389/ffgc.2021.668895
Received: 17 February 2021; Accepted: 21 April 2021;
Published: 14 May 2021.
Edited by:
Nicolas Feau, University of British Columbia, CanadaReviewed by:
Treena Burgess, Murdoch University, AustraliaCopyright © 2021 Jauss, Walden, Fiore-Donno, Schaffer, Wolf, Feng, Bonkowski and Schlegel. This is an open-access article distributed under the terms of the Creative Commons Attribution License (CC BY). The use, distribution or reproduction in other forums is permitted, provided the original author(s) and the copyright owner(s) are credited and that the original publication in this journal is cited, in accordance with accepted academic practice. No use, distribution or reproduction is permitted which does not comply with these terms.
*Correspondence: Robin-Tobias Jauss, amF1c3NAdW5pLWxlaXB6aWcuZGU=
Disclaimer: All claims expressed in this article are solely those of the authors and do not necessarily represent those of their affiliated organizations, or those of the publisher, the editors and the reviewers. Any product that may be evaluated in this article or claim that may be made by its manufacturer is not guaranteed or endorsed by the publisher.
Research integrity at Frontiers
Learn more about the work of our research integrity team to safeguard the quality of each article we publish.