 Félicien Meunier1,2*†
 Geertje M. F. van der Heijden3†
 Stefan A. Schnitzer4,5†
 Hannes P. T. De Deurwaerder6†
 Hans Verbeeck1†
- 1CAVElab – Computational and Applied Vegetation Ecology, Ghent University, Ghent, Belgium
- 2Department of Earth and Environment, Boston University, Boston, MA, United States
- 3School of Geography, University of Nottingham, Nottingham, United Kingdom
- 4Smithsonian Tropical Research Institute, Panama City, Panama
- 5Department of Biological Sciences, Marquette University, Milwaukee, WI, United States
- 6Department of Ecology and Evolutionary Biology, Princeton University, Princeton, NJ, United States
Lianas are structural parasites of trees that cause a reduction in tree growth and an increase in tree mortality. Thereby, lianas negatively impact forest carbon storage as evidenced by liana removal experiments. In this proof-of-concept study, we calibrated the Ecosystem Demography model (ED2) using 3 years of observations of net aboveground biomass (AGB) changes in control and removal plots of a liana removal experiment on Gigante Peninsula, Panama. After calibration, the model could accurately reproduce the observations of net biomass changes, the discrepancies between treatments, as well as the observed components of those changes (mortality, productivity, and growth). Simulations revealed that the long-term total (i.e., above- and belowground) carbon storage was enhanced in liana removal plots (+1.2 kgC m–2 after 3 years, +1.8 kgC m–2 after 10 years, as compared to the control plots). This difference was driven by a sharp increase in biomass of early successional trees and the slow decomposition of liana woody tissues in the removal plots. Moreover, liana removal significantly reduced the simulated heterotrophic respiration (−24%), which resulted in an average increase in net ecosystem productivity (NEP) from 0.009 to 0.075 kgC m–2 yr–1 for 10 years after liana removal. Based on the ED2 model outputs, lianas reduced gross and net primary productivity of trees by 40% and 53%, respectively, mainly through competition for light. Finally, model simulations suggested a profound impact of the liana removal on the soil carbon dynamics: the simulated metabolic litter carbon pool was systematically larger in control plots (+51% on average) as a result of higher mortality rates and faster leaf and root turnover rates. By overcoming the challenge of including lianas and depicting their effect on forest ecosystems, the calibrated version of the liana plant functional type (PFT) as incorporated in ED2 can predict the impact of liana removal at large-scale and its potential effect on long-term ecosystem carbon storage.
Introduction
Lianas (woody vines) are an important yet overlooked component of tropical forests (Schnitzer, 2018). As structural parasites, they climb tree stems to reach the forest canopy (Stevens, 1987) and in doing so, avoid massive carbon investment in self-supporting tissues (Ewers et al., 2015). Lianas compete with their hosts for resources with an intensity that has been shown to be stronger than the regular tree-tree competition (Tobin et al., 2012). Although lianas contribute relatively little to forest-level biomass (van der Heijden et al., 2013), they profoundly impact forest dynamics and ecology: liana-infested forests are characterized by slower tree growth (Schnitzer et al., 2014), reduced tree survival (Ingwell et al., 2010) and fecundity (Martínez-Izquierdo et al., 2016), and an overall decline of primary productivity and carbon sequestration (van der Heijden et al., 2015).
In the past few decades, lianas have gained scientific interest as (i) lianas are increasing in abundance and biomass in the Neotropics (Phillips, 2002; Schnitzer and Bongers, 2011), and (ii) liana density is negatively correlated with forest carbon stocks (Durán and Gianoli, 2013). Understanding liana ecology requires observational and experimental assessments of their impact in tropical forests (Schnitzer and Bongers, 2002). Observational studies measure growth-form differences of observable traits (e.g., leaf nutrient content) or the effects of liana abundance on dynamic variables (e.g., tree growth) in undisturbed forests, while experimental studies aim to compare the biogeochemical cycles of control and manipulated plots. Experimental studies include CO2 enrichment (Norby and Zak, 2011), nutrient addition (Schnitzer et al., 2020), and liana removal experiments.
Liana removal experiments are a powerful tool to assess the role that lianas play in the biogeochemical cycles of tropical forests (Estrada-Villegas and Schnitzer, 2018). They allow for a comprehensive comparison of forest demography and functioning in liana-free and unmanipulated control plots. Liana removal studies can also help link growth-form specific traits with mechanistic changes of forest-level variables (e.g., tree growth rate, recruitment or reproduction). However, liana removal studies present a suite of logistical challenges: they are time and labor demanding, costly to maintain, and as any experiment, limited in the number and types of possible observations. For instance, as measuring belowground carbon stocks and dynamics is challenging (Freschet et al., 2020), below-ground assessment of liana impacts is currently almost systematically overlooked in liana removal experiments.
Dynamic mechanistic modeling of liana-tree interactions has been recently identified as one of the four essential challenges for global change science relating to lianas (Marshall et al., 2020). Process-based vegetation models may mediate the logistical challenges of conducting liana removal experiments in-situ by extending their findings to exhaustively describe forest biogeochemical cycles, including these occurring belowground (Fisher et al., 2018). They can specifically help to predict the forest recovery response after a liana infestation or a liana removal experiment and the underlying response mechanisms (Marshall et al., 2020). Vegetation models can also serve as platforms to integrate trait measurements and/or observed impacts of an experimental design (Dietze and Latimer, 2011). Finally, they have the potential for upscaling in time and space with virtually no additional cost (Snell et al., 2014). Yet, to realistically simulate tropical forest dynamics, vegetation models need to mechanistically account for processes specific to the lianescent growth form (Verbeeck and Kearsley, 2015) and require extensive quality datasets for calibration and validation (Schnitzer et al., 2016).
Despite their importance, lianas have only recently been incorporated in vegetation models, specifically by the introduction of a liana plant functional type (PFT) into the Ecosystem Demography model, version 2 (ED2; di Porcia e Brugnera et al., 2019). Dynamic model simulations confirmed the negative impact of lianas on the ecosystem carbon sequestration capacity, especially in young and secondary forests (di Porcia e Brugnera et al., 2019). The liana PFT in ED2 was recently updated to include a mechanistic representation of water competition and to include the most up-to-date observations of liana traits (Meunier et al., 2020). Yet, so far, the vegetation model simulations have not pursued a virtual impact assessment of liana removal on tree competition and forest-level carbon dynamics.
This study presents the proof of concept that ED2 and its liana PFT can be calibrated against the field data of a removal experiment in order to (i) provide new insights into the mechanisms governing liana and tree competition, and (ii) extend the findings of such a liana removal experiment. More generally, this is an illustration of how experimental data and vegetation models can work synergistically to deliver more comprehensive results than those provided by either approach alone.
Materials and Methods
Liana Removal Experimental Data
We tried to replicate and extend the results of an ongoing liana removal experiment on Gigante Peninsula in Panama (van der Heijden et al., 2015). Gigante Peninsula is located on a mainland peninsula within the Barro Colorado Nature Monument (BCNM) and supports a mix of early and late secondary seasonally moist lowland forest. The nearby weather station of Barro Colorado Island (BCI) fluxtower recorded an average temperature of 26°C and an average annual rainfall of 2,640 mm between 2004 and 2016 (Detto et al., 2018), with a pronounced dry season of 4 months (total rainfall between late-December and mid-April is about 175 mm on average). Sixteen 80 m × 80 m plots were established in 2008 within the then approximately 60 years old forest area of Gigante Peninsula. In 2011, all lianas and trees (≥1 cm) within the central areas (60 m × 60 m) of these plots were inventoried. In March 2011, all lianas were cut in half of the plots and left on site for decomposition. These manipulated plots were kept liana-free by cutting resprouting lianas at regular time intervals (i.e., monthly for the first 2 months and bimonthly for the next 6 months).
The change in diameter at breast height (DBH) of all trees (≥10 cm) was then monitored twice yearly, at the beginning of the dry and the wet season, using dendrometer bands and electronic calipers. The resulting tree diameters were converted into aboveground biomass (AGB) using the pantropical allometric equation of Chave et al. (2005) for tropical moist forest, wood density estimates, and a local DBH-height relationship (van der Heijden et al., 2015). Wood density estimates were assigned to every tree record, using first locally measured wood samples, then the Global Wood Density Database (Zanne et al., 2009), and finally a site-based average wood density value (van der Heijden et al., 2015) when local and global data were unavailable. The changes in diameter of lianas ≥ 5 cm were also tracked in the control plots and similarly converted into biomass through a liana-specific allometric equation (Schnitzer et al., 2006; van der Heijden et al., 2015). The measurements of tree and liana DBH increments and the successive inventories provided estimates of biomass change due to growth, recruitment, stem productivity (as the sum of growth and recruitment), and mortality in all control and removal plots. In addition, for 3 years (between 2011 and 2014 starting in the second month after liana cutting, to exclude the initial pulse of dead liana leaves after removal), 80 litterfall traps were deployed in the 16 forest plots. Their analysis provided estimates of the canopy productivity. Total aboveground productivity was then computed by summing up the canopy productivity and the stem productivity. A complete description of all methods and experimental results are available in the original publication (van der Heijden et al., 2015).
Vegetation Model
The Ecosystem Demography Model
The Ecosystem Demography model is a cohort-based terrestrial biosphere model that accounts for inter- and intra-growth-form diversity as well as the horizontal and vertical heterogeneity of the simulated ecosystem (Medvigy et al., 2009). In ED2, plants are grouped in cohorts that are defined by their size (DBH) and the plant functional type (PFT) to which they belong (Moorcroft et al., 2001). PFTs represent a set of physiological, morphological, and life-history traits that mechanistically define how different plant types utilize resources (Fisher et al., 2010). Each cohort grows in a forest patch, which represents the forest areas that share a similar forest disturbance history. These two hierarchical levels (cohorts and patches) are spatially implicit: neither the horizontal position of trees nor the spatial arrangement of patches are determined by the model. Instead, ED2 computes the plant density of all cohorts and the relative area of every single patch (i.e., the probability of finding a forest portion sharing the same disturbance history), as well as their dynamics (i.e., temporal changes in plant density of every cohort due to the simulated demographic processes, and in relative area of every patch due to new disturbance events and ageing).
Among other biophysical processes, ED2 simulates soil hydrology (Walko et al., 2000), plant hydraulics (Xu et al., 2016), leaf-level photosynthesis (Farquhar et al., 1980), land-atmosphere radiative transfers (Sellers, 1985; Liou, 2002), and soil carbon decomposition (Bolker et al., 1998). At the cohort level, the ED2 model uses DBH-dependent allometric equations to partition the carbon available from net assimilation into the different plant pools (leaf, stem woody biomass, sapwood, and fine and coarse roots). Cohort carbon balance is determined by the difference between the cohort gross productivity on one hand, and the respiration (leaf and fine-roots, storage turnover, growth and maintenance respiration) and turnover of tissue on the other hand (Longo et al., 2019a). A negative cohort carbon balance can lead to starvation and hence increased mortality, which adds to the background constant ageing (PFT-dependent) and treefall (PFT-independent) mortality rates. Tissue turnover and mortality, in turn, increase soil carbon stocks. Following a simplified version of the CENTURY model (Bolker et al., 1998), ED2 considers three soil carbon pools, defined by their characteristic lifetime: fast (metabolic litter and microbial hereafter referred to as FSC), intermediate (structural debris or StructSC), and slow (humified and passive soil carbon or SSC). Through mortality and turnover, lignified and non-lignified plant tissues, respectively, feed the fast and intermediate soil carbon pools (Figure 1, left). For more details, we refer to the complete model description (Longo et al., 2019a) and to Supplementary Appendix A for the soil carbon decomposition submodel.
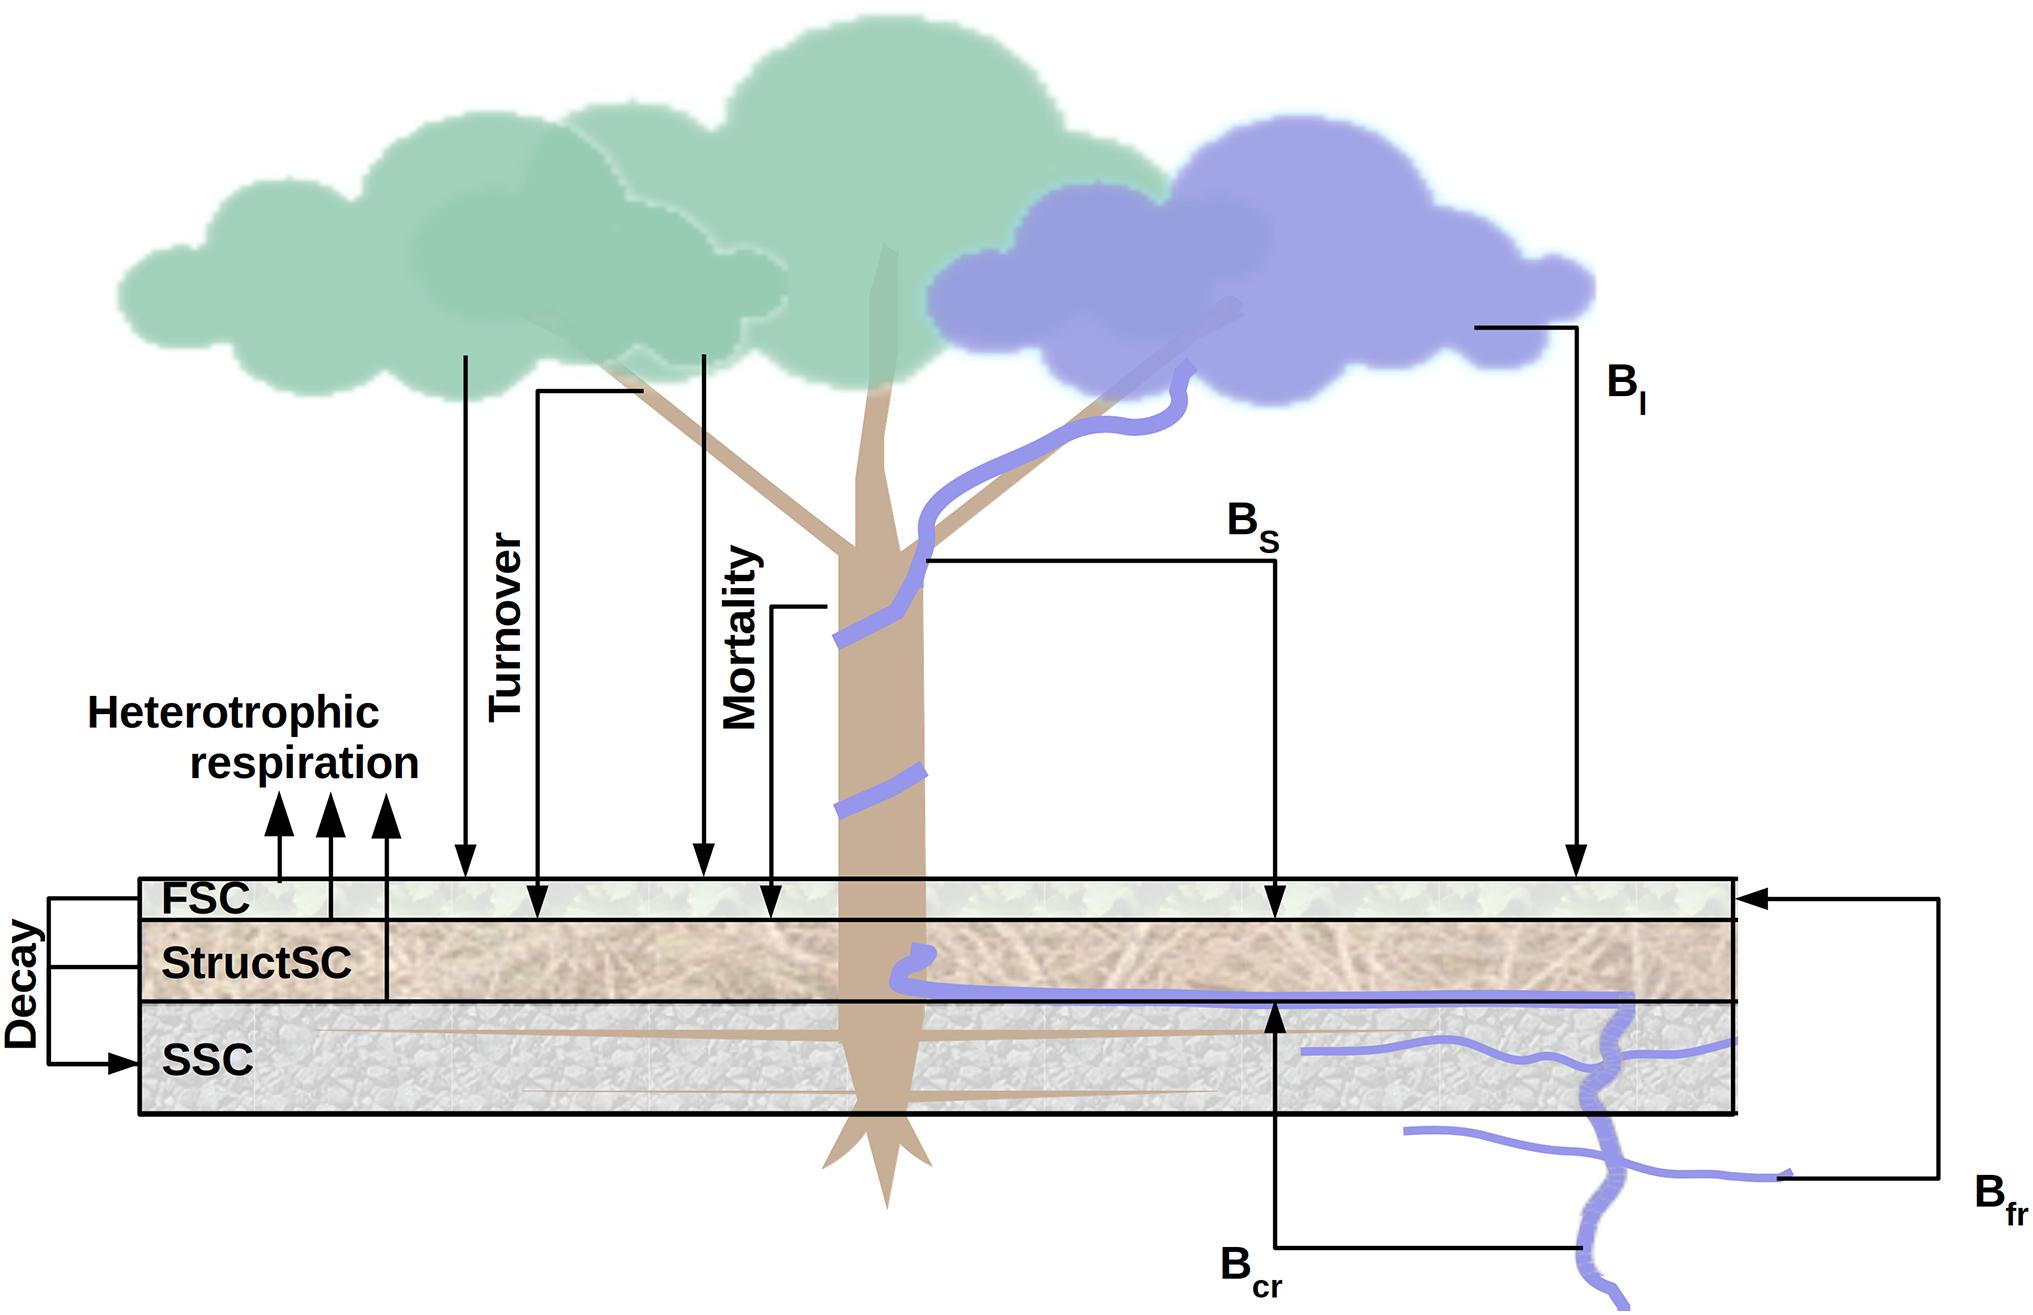
Figure 1. Schematic overview of the carbon fluxes driving the soil carbon pools (left) and of the virtual liana removal experiment (right). In ED2, three soil carbon pools are simulated: the fast (FSC), the structural (StructSC) and the slow (SSC) carbon pools. The former two can decompose into the latter one and all three are partly responsible for heterotrophic respiration. Plant tissue turnover and mortality are direct inputs of the fast and structural soil carbon pools. To simulate the removal experiment, liana leaf (Bl) and fine root (Bfr) biomass was sent to the fast soil carbon pool while stem (Bs) and coarse root (Bcr) biomass was transferred into the structural soil carbon pool.
The Liana Plant Functional Type
Recently, a new PFT was introduced in ED2 to mechanistically account for lianas (di Porcia e Brugnera et al., 2019). It was further developed by Meunier et al. (2020) to (i) include most recent model developments related to root water uptake and plant hydraulics, (ii) enable liana-included simulations starting from prescribed initial conditions (inventory), and (iii) parameterize it according to the latest literature. In short, lianas are the only PFT in the model that cannot grow freely in height, but need the structural support from neighbors (i.e., trees within the same patch). Liana cohorts can only outgrow the tallest free-standing plant cohort by a small height threshold (0.5 m) as they lack self-supporting tissues to grow beyond this height limit. In addition, the model simulates: (i) the liana propensity for vegetative reproduction by allocating more of the available carbon, once their maintenance and respiration costs are met, to reproduction as compared to trees; (ii) the enhanced survival of lianas to treefall and their ability to resprout from such disturbances events; and (iii) the liana-specific carbon allocation strategies. Details of implementation are available in the aforementioned publications.
Initial Conditions
Model simulations were initialized using the tree and liana inventories of 2011 that occurred immediately before liana removal. Trees were classified into the ED2 default tropical tree PFTs (i.e., early, mid, and late-successional tropical trees) using available species wood density estimates and the model default mid-range values (0.62 and 0.81 g cm–3) as class-separators (Longo et al., 2019a). Doing so, 101 and 62 of the 171 identified species were, respectively, classified as early- and mid-successional tree species (Supplementary Figure B1). The choice of the ED2 default class breaks resulted in a majority of early- (56.3%) and mid-successional (40%) tree individuals. The tree classification led to no differences of tree density per size class and PFT between treatments (control vs. removal), see Supplementary Figure B2. All lianas were allocated to a unique PFT (Supplementary Figure B3). All runs were initiated with eight 60 m × 60 m patches (either eight control or eight removal plots).
Soil carbon storage was initialized using the SoilGrids database (Hengl et al., 2017). Total soil carbon stocks from SoilGrids were split into the three soil pools required by ED2 using equilibrium fractions simulated by model spin up runs. In the removal simulations, liana leaf and fine root biomass were transferred to the fast soil carbon pool, whilst woody stem and coarse root biomass were transferred to the structural soil carbon pool (Figure 1, right).
Inventoried lianas were not included in the removal plots and the liana PFT was turned off in the removal runs, preventing their re-growth and the need for active virtual cutting after the initial removal. Following Meunier et al. (2020), liana initial height was determined by their size and the height distribution of the surrounding trees so that all lianas with a stem diameter > 3 cm reached the top of the forest canopy [based on Kurzel et al. (2006)].
Model Calibration
Parameter optimization was achieved within the Predictive Ecosystem Analyzer (PEcAn), an ecological workflow management software (LeBauer et al., 2013), using the Bayesian emulator framework developed by Fer et al. (2018). The emulator (or surrogate) approach is a statistical tool used to replace computationally expensive models such as ED2. Emulators are constructed by interpolating a response curve between the knots (i.e., points in the parameter/cost function space where the model has been previously run and its goodness of fit evaluated).
Ecosystem demography model predictions were calibrated against the final (2014) observation of net AGB changes reported by van der Heijden et al. (2015), using the residual sum of squares as the cost function. We made the decision to fit against the 2014 observation to avoid reproducing the earlier and potentially transitional effects of the process of liana removal itself. We calibrated the model using one type of data only, i.e., the net AGB changes and we were therefore able to validate the model predictions against the observed components of the AGB changes and the measurements of aboveground productivity.
To fit the observed net AGB changes, we optimized two types of PFT-specific parameters: the maximum rate of carboxylation (Vcmax) and the clumping factor (Ω). The former is a strong regulator of plant cohort primary productivity, while the latter mediates the amount of light that is transmitted through the canopy in the radiative transfer model of ED2. Ω can vary between 0 and 1. These values represent the two extreme situations of a perfectly clumped (Ω = 0, infinite LAI over a tiny area and effectively zero LAI) and perfectly evenly spread canopy (Ω = 1). Ω is an ED2 parameter that contributes a lot to the model uncertainty while being poorly constrained (Viskari et al., 2019). Vcmax is a parameter that is often targeted for calibration in vegetation models, including ED2, given its broad impact on the ecosystem functioning [see for instance Camino et al. (2019); Fer et al. (2018); and Rezende et al. (2013)]. We chose these two parameter types for this model calibration given (i) their nature and their contribution to model predictive uncertainty and (ii) the difficulty to constrain them with observational data when dealing with interspecific competition in ED2 (Meunier et al., 2020). Parameter priors were either uninformative (Ω), expert-informed (tree Vcmax) or defined by the meta-analysis of PEcAn (liana Vcmax), see Table 1. Lianas and trees were both assumed to share the same PFT-specific parameters in removal and control patches. All remaining plant and soil parameters were kept as standard in ED2 (Longo et al., 2019a).
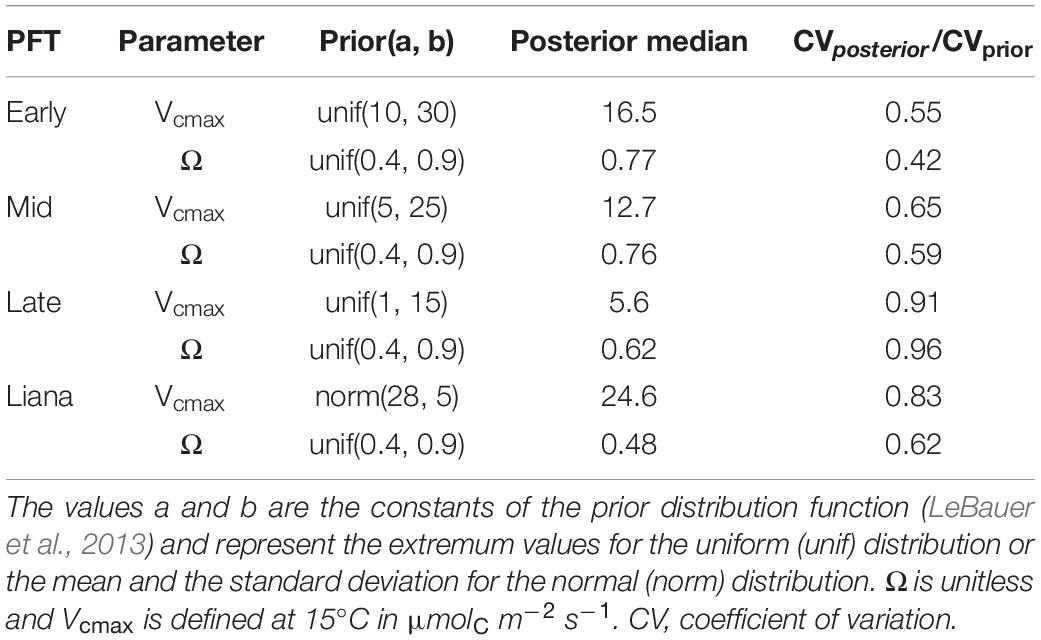
Table 1. Liana and tree prior distributions used in the model calibration alongside with posterior medians.
Emulator calibration was run in three rounds, each with 100,000 iterations of three Markov chain Monte Carlo chains, using a total of 750 knots for a total of eight calibrated parameters (two per PFT). Calibrations were run for three simulation years between March 2011 and 2014 (the duration of the experiment).
Model Setup and Analyses
Model ensemble simulations (N = 100) were run with parameter values randomly sampled from the parameter posterior distributions determined by the emulator approach. The control and removal plots were simulated for 10 years starting in March 2011. Differences in biomass, productivity or flux estimates between the removal and control simulations were considered significant when the confidence intervals of the difference of the ensembles did not include zero (cf. van der Heijden et al., 2015). In addition to the discrepancies of carbon accumulation and productivities, we also compared additional model outputs between treatments, such as leaf water potential, seed biomass production or light interception.
The meteorological drivers of Powell et al. (2017) for the closeby BCI were used in all the simulations of this study. These drivers were specifically adjusted from the local fluxtower to the ED2 format, and include shortwave (direct and diffuse) and longwave downward irradiances, the zonal and meridional wind speeds, air temperature, pressure and specific humidity, as well as the precipitation rate.
To identify the environmental drivers of the liana-tree competition and the overall ecosystem growth, we evaluated the impact of the interannual variability of the meteorological forcing drivers on the model outputs. More specifically, we repeated the 10-years long virtual liana removal experiment described above using a single year of meteorological drivers which was then recycled for 10 years. We then compared the outputs of the 10 runs forced with a single year of drivers with the regular run (i.e., forced with 10 different years of drivers). In these runs, we used the most likely set of parameters, as determined by the emulator approach.
The version of ED2 used in this study is the one developed by Meunier et al. (2020), which is available on Github at https://github.com/femeunier/ED2 (tag Liana_v.1). All functions, scripts, and inputs developed for this study were also uploaded on Github: https://github.com/femeunier/LianaRemoval.
Results
Model Calibration
Targeted model parameters were successfully constrained by the model calibration: the coefficients of variation (CV) of the posterior distributions were all smaller than the CV of the prior distributions (Table 1). In the run with the lowest cost function, the net aboveground productivity and biomass changes during the third year of experiment reached on average 0.037 and 0.264 kgC m–2 yr–1 in the control and removal plots respectively, which were similar to the observations from the liana removal experiment (0.037 and 0.261 kgC m–2 yr–1). These results were obtained with lower maximum carboxylation rates and clumping factors closer to 1 for trees than for lianas (Table 1, see also Supplementary Figure C1). The higher Vcmax of lianas indicates higher primary leaf-level productivity for lianas while the smaller Ω (closer to 0) made their canopies more packed (horizontally clumped).
While not directly targeted by the calibration, the net biomass change and productivity components were also accurately estimated by the calibrated model runs (Figure 2). As observed empirically, simulated leaf productivity was significantly higher (p-value < 2e-16) in control patches than in removal patches (simulated: 0.42 vs. 0.33 kgC m–2 yr–1, observed: 0.46 vs. 0.39 kgC m–2 yr–1). By contrast, forest-level stem productivity significantly increased (p-value < 2e-16) in silico when lianas were removed, consistent with the experimental data (simulated: 0.29 vs. 0.42 kgC m–2 yr–1; observed: 0.19 vs. 0.28 kgC m–2 yr–1). These two contrasting significant findings cancelled each other out when aggregated to the total aboveground productivity in both the simulations and the observations (simulated: 0.71 vs. 0.75 kgC m–2 yr–1 in control and removal patches respectively, observed: 0.65 vs. 0.67 kgC m–2 yr–1).
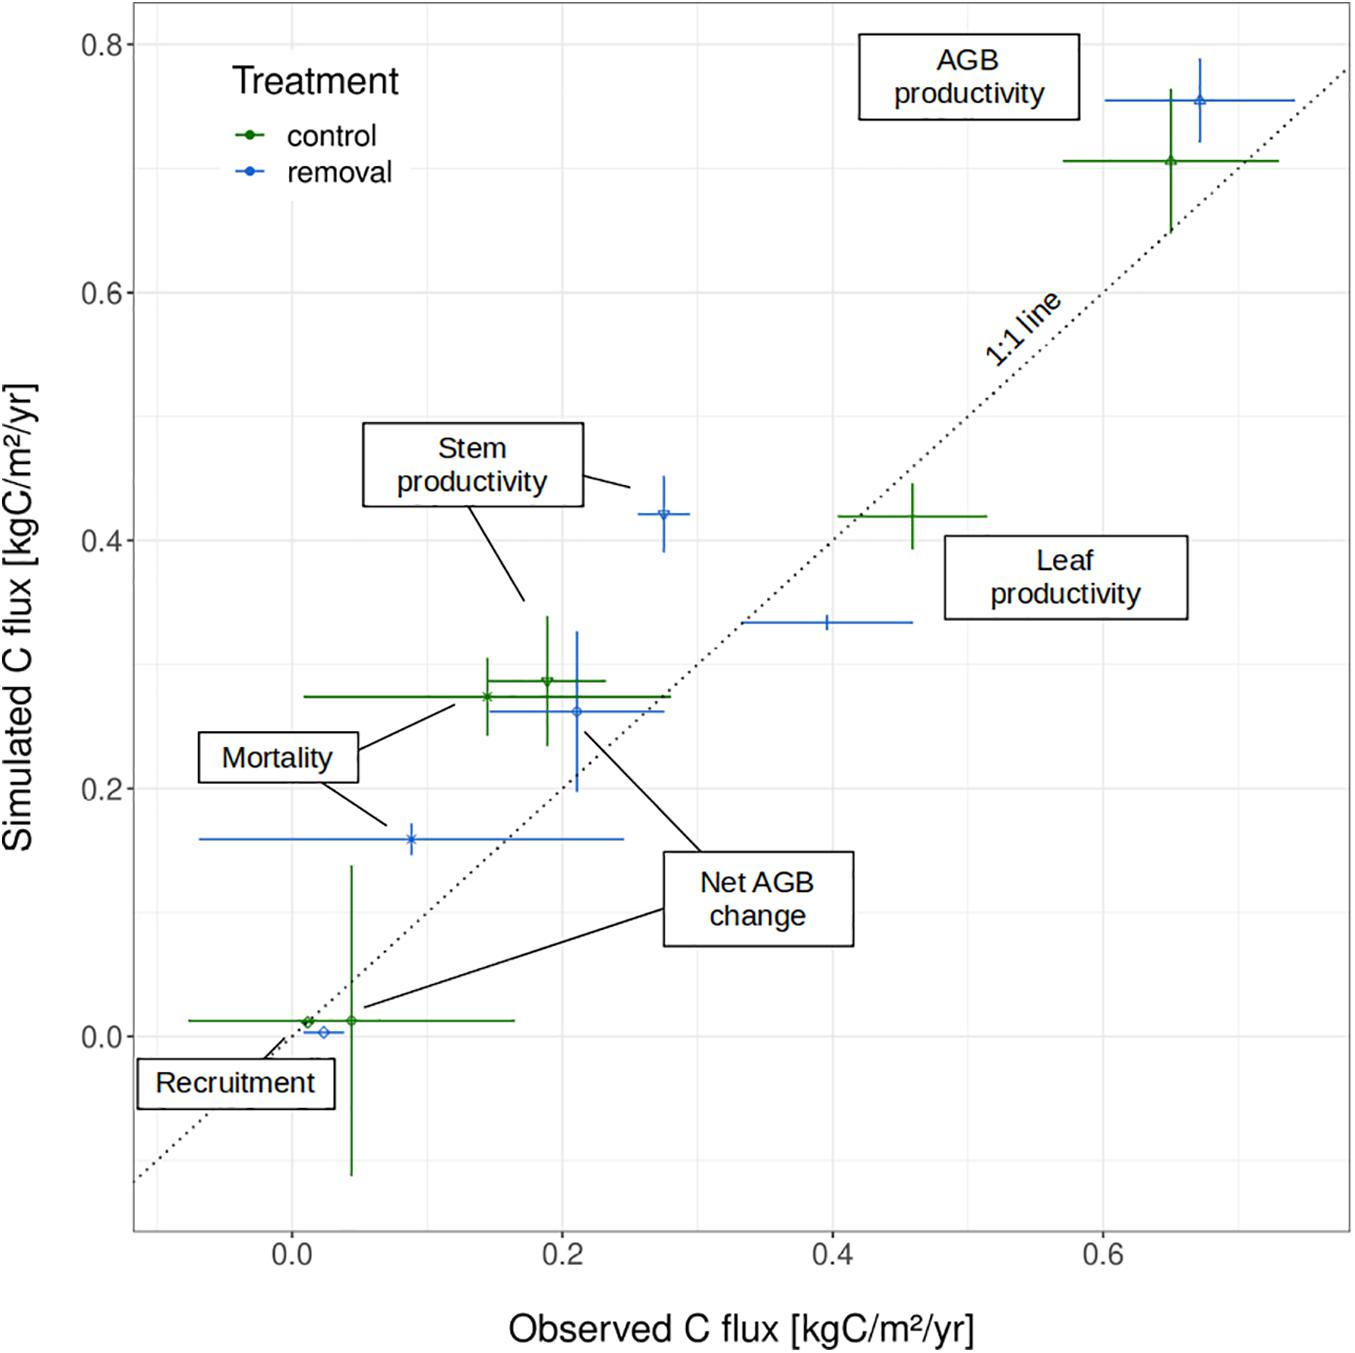
Figure 2. Result of the model calibration: observed vs. simulated carbon fluxes as overaged over the 3 years of experiment (both observed and simulated) and the 100 posterior ensemble runs (simulated only). Liana and tree parameters were optimized to fit the net aboveground biomass (AGB) change during the last year only. The error bars represent the 95% confidence interval of the individual carbon fluxes/productivity components.
Calibrated model runs also reproduced the direction of the liana removal impact for tree mortality (i.e., higher rates in control plots). Yet, the model overestimated mortality rates (0.27 vs. 0.16 kgC m–2 yr–1 in control plots; 0.14 vs. 0.09 kgC m–2 yr–1 in removal plots) and because of the very stochastic nature of mortality, the model could not reproduce its high interannual variability in either treatment. Simulated biomass recruitment in removal plots was underestimated (0.0032 vs. 0.023 kgC m–2 yr–1). Yet, in both simulations and observations, recruitment contributed little to net biomass change: it represented between 6 and 8% of the stem productivity in the observational data and between 1 and 6% in the model outputs.
Because carbon accumulation was higher in removal plots, the difference in aboveground carbon stocks between control and removal patches reduced over time: the initial difference at the onset of the experiment (+1.04 kgC m–2 in control plot) decreased to +0.41 kgC m–2 (simulations) or +0.52 kgC m–2 (observations) after 3 years (Figure 3).
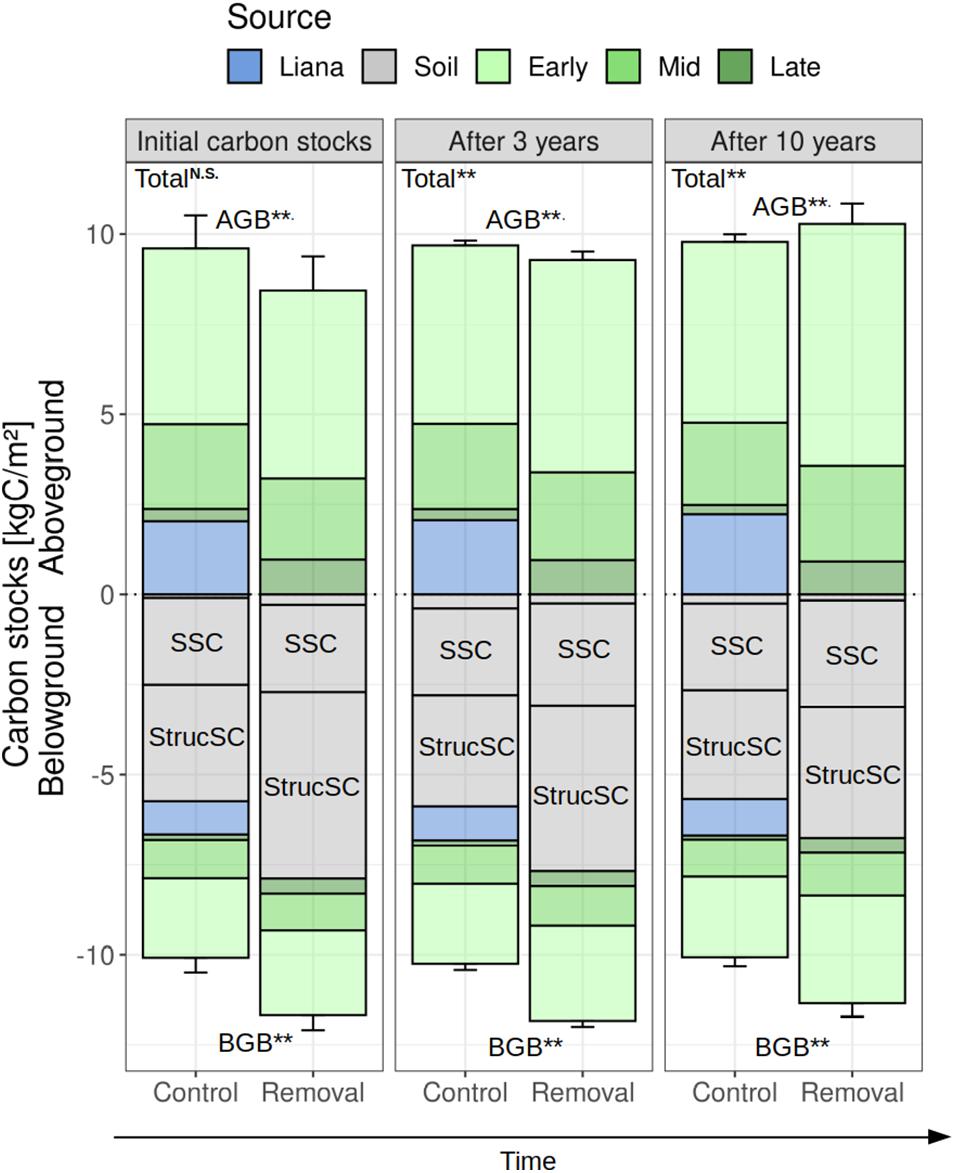
Figure 3. Carbon stock changes over time in control and removal plots. Carbon stocks were splitted into their aboveground (>0) and belowground (<0) components as well as according to their source (PFT and/or soil). Soil carbon is divided into its three pools (SSC, slow soil carbon; StrucSC, structural soil carbon and the unannotated soil pool is the FSC or fast soil carbon pool). Bar plots and error bars denote median and 95% confidence intervals of the 100 members ensemble posterior runs (3 or 10 years of simulation) or the inter-patch variability (initial conditions). For the significance, we tested the difference between simulated control and removal plots for the aboveground (AGB), belowground (BGB), and total biomass at the 95% confidence level: **P ≤ 0.05; N.S. not significant (P > 0.10).
Causes and Consequences of the Liana-Tree Competition
In total, 0.19 kgC m–2 and 1.9 kgC m–2 of liana material were added to the fast and structural soil carbon pools due to removal (Figure 3). These transfers resulted in an initial larger belowground carbon stock in removal than in control plots (+1.6 kgC m–2). Yet, in terms of initial total carbon storage, both treatments were indistinguishable from each other (19.7 ± 0.9 kgC m–2 in control plots vs. 20.1 ± 0.9 kgC m–2 in liana removal plots, see Figure 3). After 5 years of simulation, AGB in the liana removal plots reached that of the control plots (Figure 4), driven by a sharper increase of early successional tree biomass in liana-free patches (+1.1 kgC m–2 in the liana removal plots, and only +0.1 kgC m–2 in the control plots).
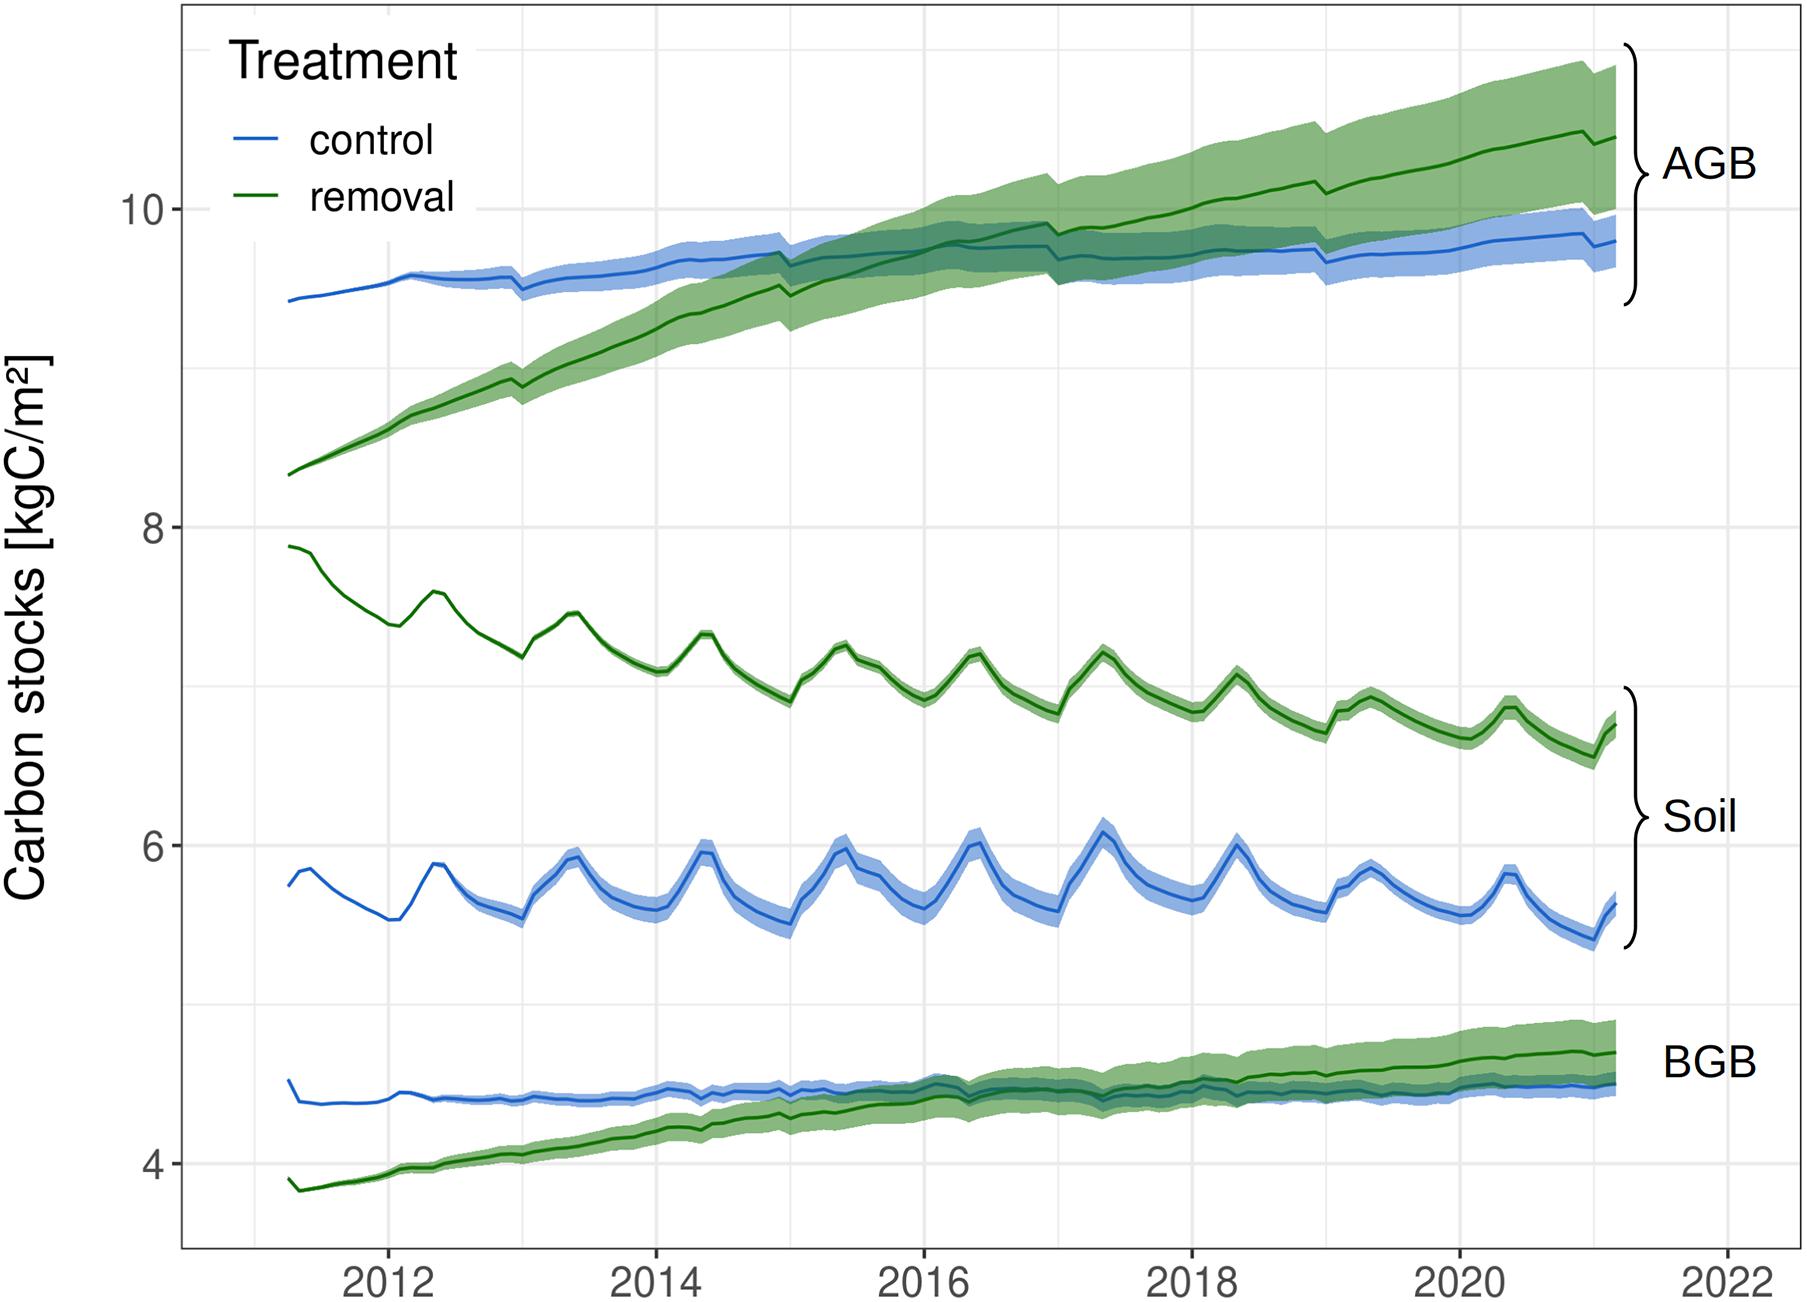
Figure 4. Time Series of all carbon pools: total of all four PFT aboveground (AGB), and belowground (BGB) carbon biomass as well as total soil carbon stocks. Light envelopes represent the 95% confidence intervals of the 100 ensemble posterior runs.
After 10 years of simulation, belowground carbon stocks were still larger in the liana removal plots. This was due in part because of faster increase in tree belowground biomass, but mostly because of the slow decomposition rates of the structural debris from the cut lianas (Figure 3). The decay of liana woody tissues led to a steep increase in simulated dissolved organic matter (Figure 5). The fast structural soil carbon pool rapidly became larger when lianas were simulated, after an initial transition due to the virtual removal (Figure 5). The increase in carbon of the FSC pool in control plots was driven by the faster leaf and fine root turnover of lianas and the increased mortality of trees in control plots. Slower soil carbon pools (StructSC and SSC) were relatively stable over time in control patches while the fast soil carbon pool rapidly reached a seasonal equilibrium in both treatments. All together, the soil carbon pools of both treatments slowly converged but the total soil carbon storage remained significantly lower in control plots during the 10 years of experiment (−1.74 kgC m–2 after 3 years, −1.39 kgC m–2 after 5, and −1.02 kgC m–2 after 10 years). The higher soil carbon stocks combined with a sharp increase of the aboveground carbon accumulation in the liana-free plots led to significantly larger total carbon stocks in the liana removal plots after 3 (+1.2 kgC m–2) and 10 (+1.8 kgC m–2) years of simulation (Figures 3, 4).
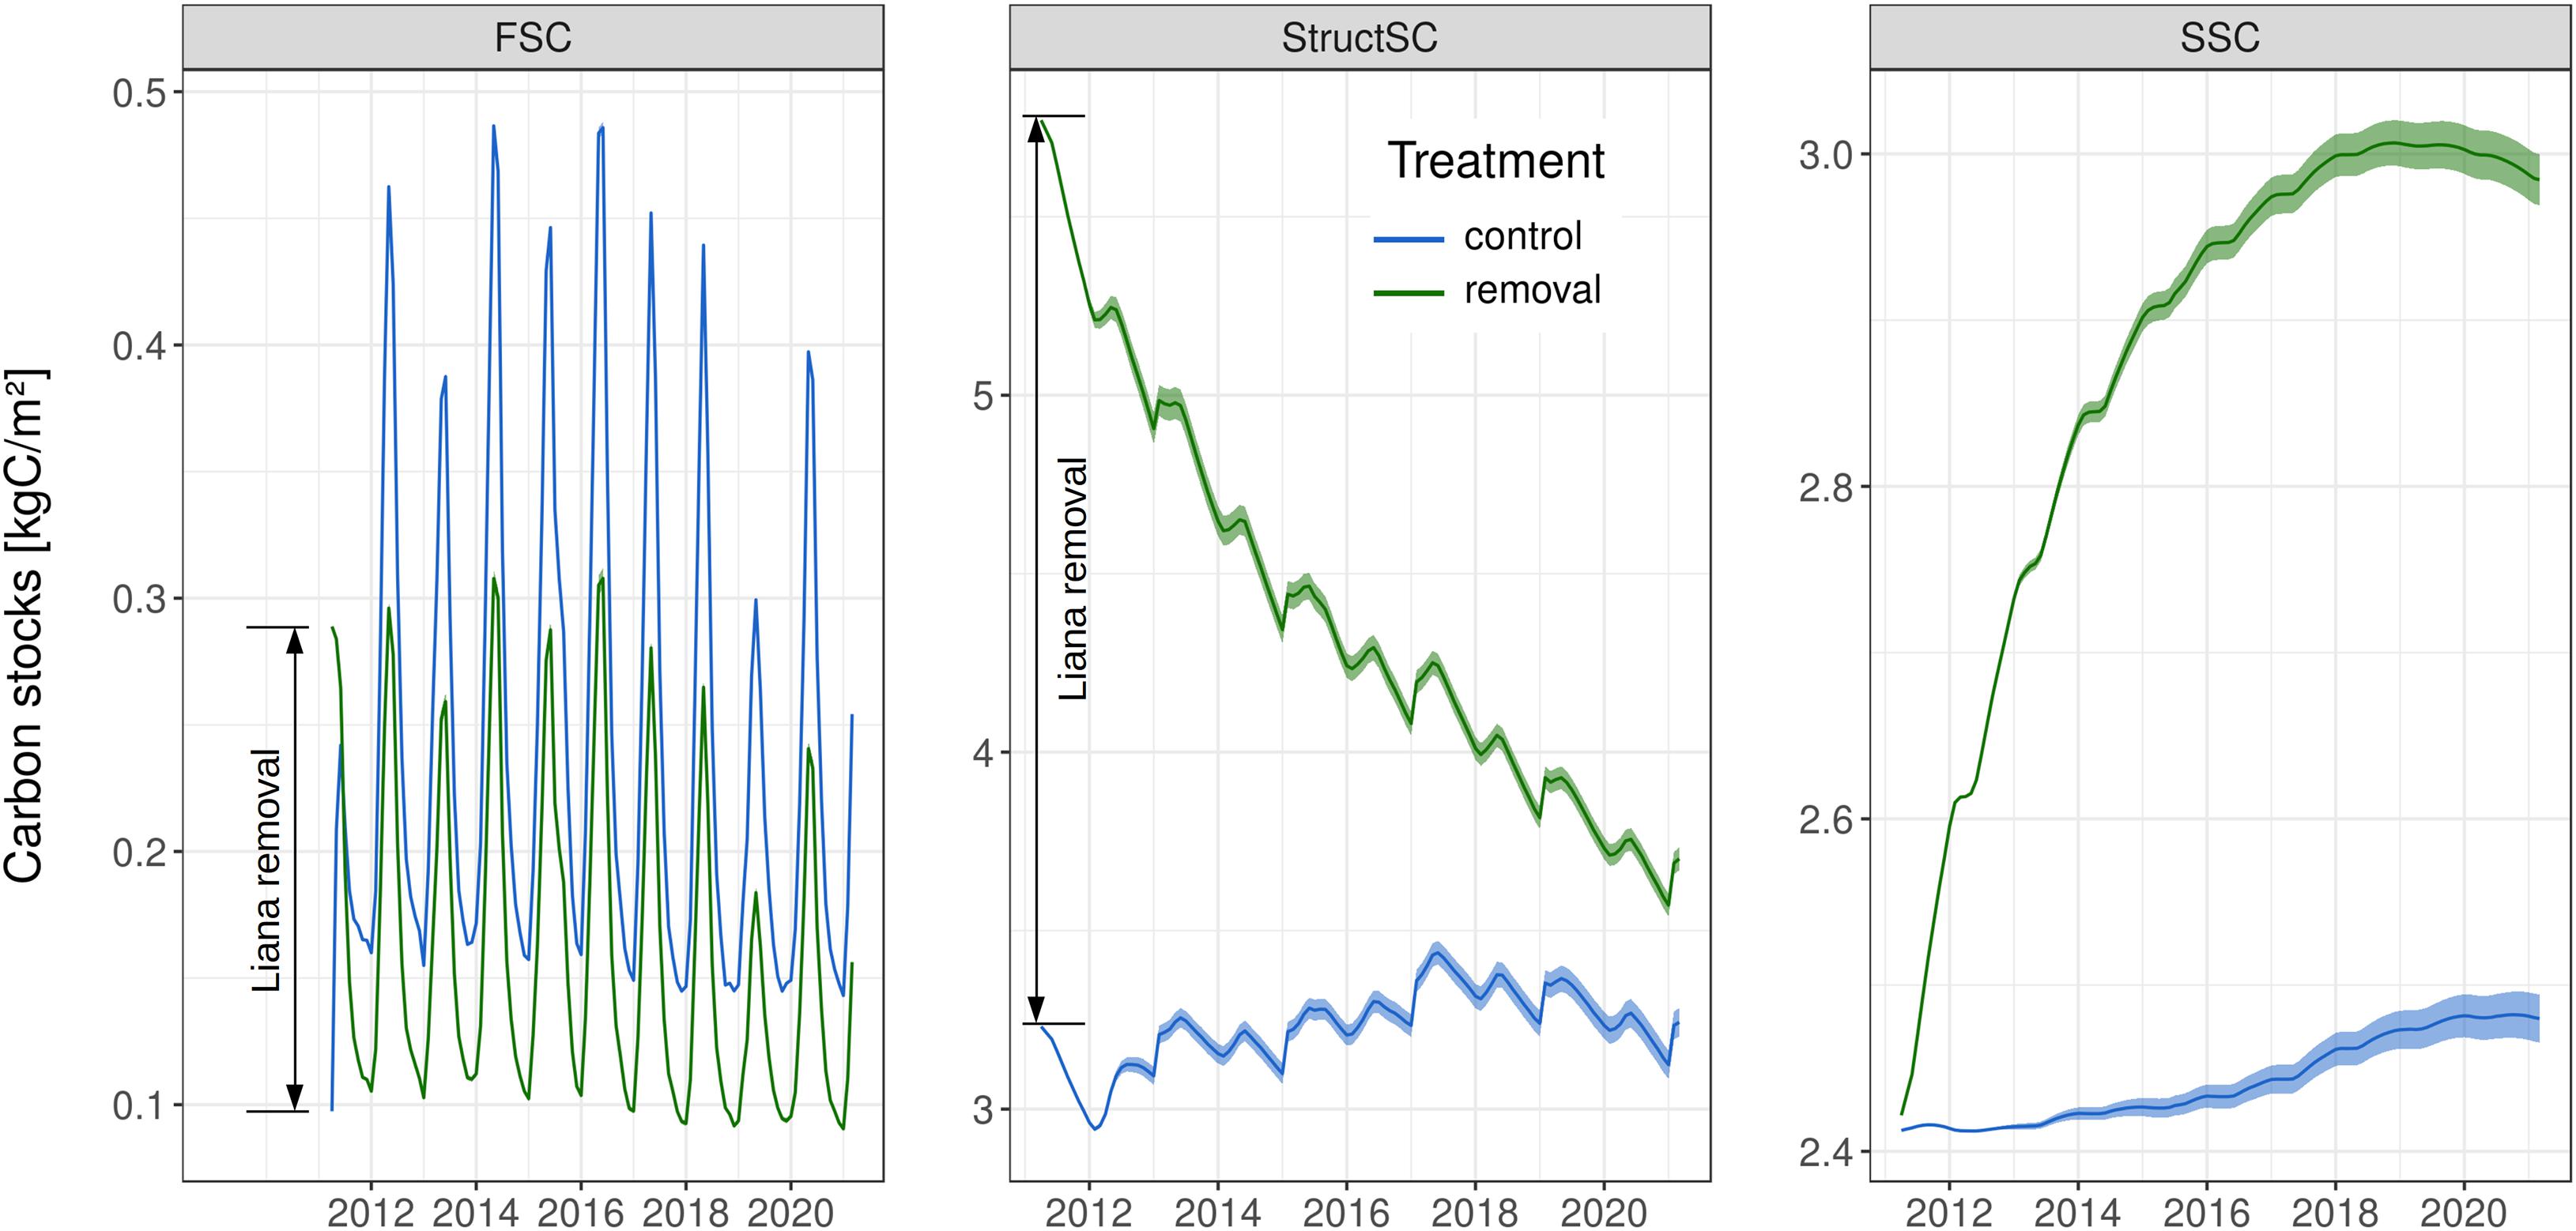
Figure 5. Time series of the three soil carbon pools. Initial differences in the fast (FSC) and the structural (StructSC) soil carbon pools are due to the addition of liana living and woody tissues to these two respective pools during removal. The slow decomposition of liana woody tissues leads to a strong increase of the slow soil carbon (SSC) pool in removal plots. The shaded envelopes encompass the 95% confidence interval of the 100 ensemble members’ posterior runs.
Overall, the carbon cycle of forest patches was profoundly impacted by the liana removal. Heterotrophic respiration was higher in control patches than in liana removal patches (1.75 vs. 1.37 kgC m–2 yr–1, Figure 6). This significantly affected the net ecosystem productivity (NEP), which increased by almost one order of magnitude when lianas were removed over the 10 years of the simulation (+0.066 kgC m–2 yr–1, on average). The liana removal effect on the NEP varies over the years and ranged between +0.04 and +0.16 kgC m–2 yr–1, depending on the incoming PAR radiation that significantly impacted GPP (Figure 7, R2 of the linear model are 0.54 and 0.64 for the control and removal plots respectively). Because of the reduction in total leaf area, forest-level gross (GPP) and net (NPP) primary productivity remained on average smaller in liana removal plots over the 10 years of the virtual experiment (−0.56 kgC m–2 yr–1 and −0.34 kgC m–2 yr–1, respectively). However, this was the result of the large contribution of lianas to gross (39%) and net (48%) primary productivity. GPP and NPP of trees themselves increased by 40 and 53% in liana removal plots.
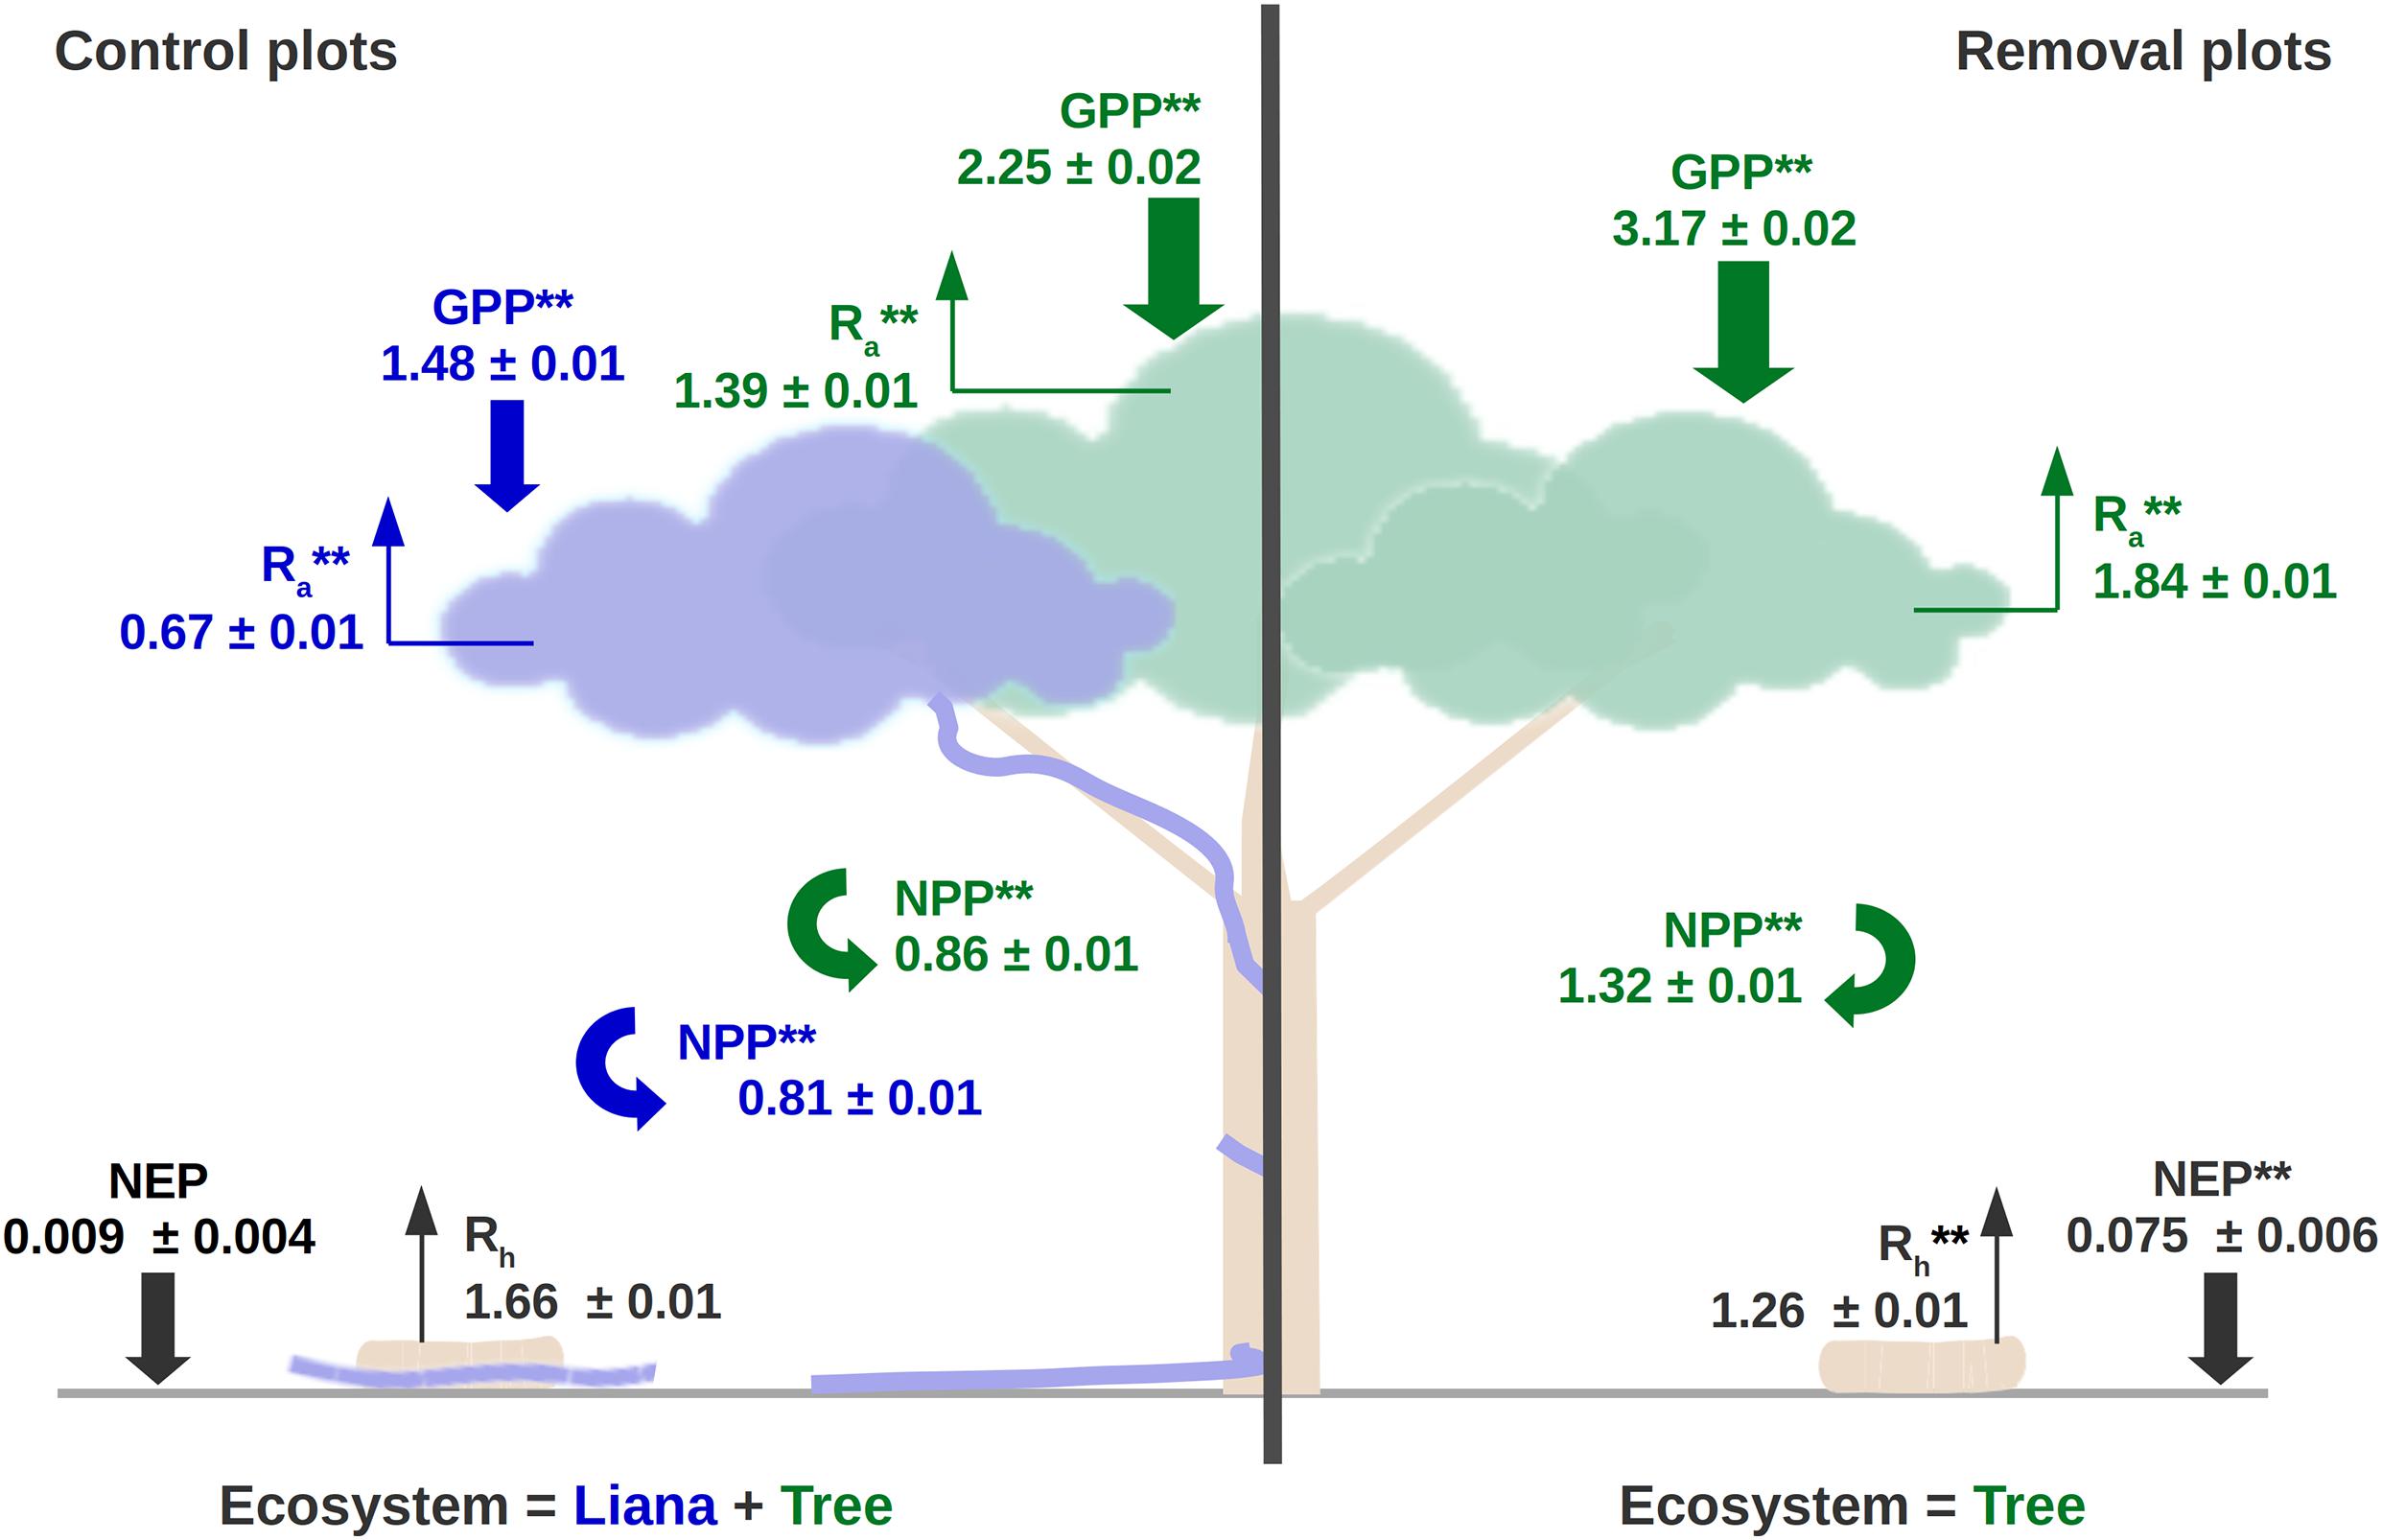
Figure 6. Average carbon cycle of the control (left) and liana-removal (right) plots over the 10 years of simulation of the liana-removal experiment and the 100 posterior ensemble runs. Plant fluxes (GPP, NPP, and Ra) were divided into liana (blue) and self-supporting tree (green) components. We tested the impact of treatment (control vs. removal) on both the ecosystem (black, right hand-side) and the PFT variables (colors, left hand-side) at the 95% confidence level: **P ≤ 0.05; N.S. not significant (P > 0.10). Fluxes are summarized by their mean ± one standard deviation deviation and all have units of kgC m–2 yr–1. GPP, gross primary productivity; NPP, net primary productivity; Ra, autotrophic respiration; Rh, heterotrophic respiration; NEP, net ecosystem productivity.
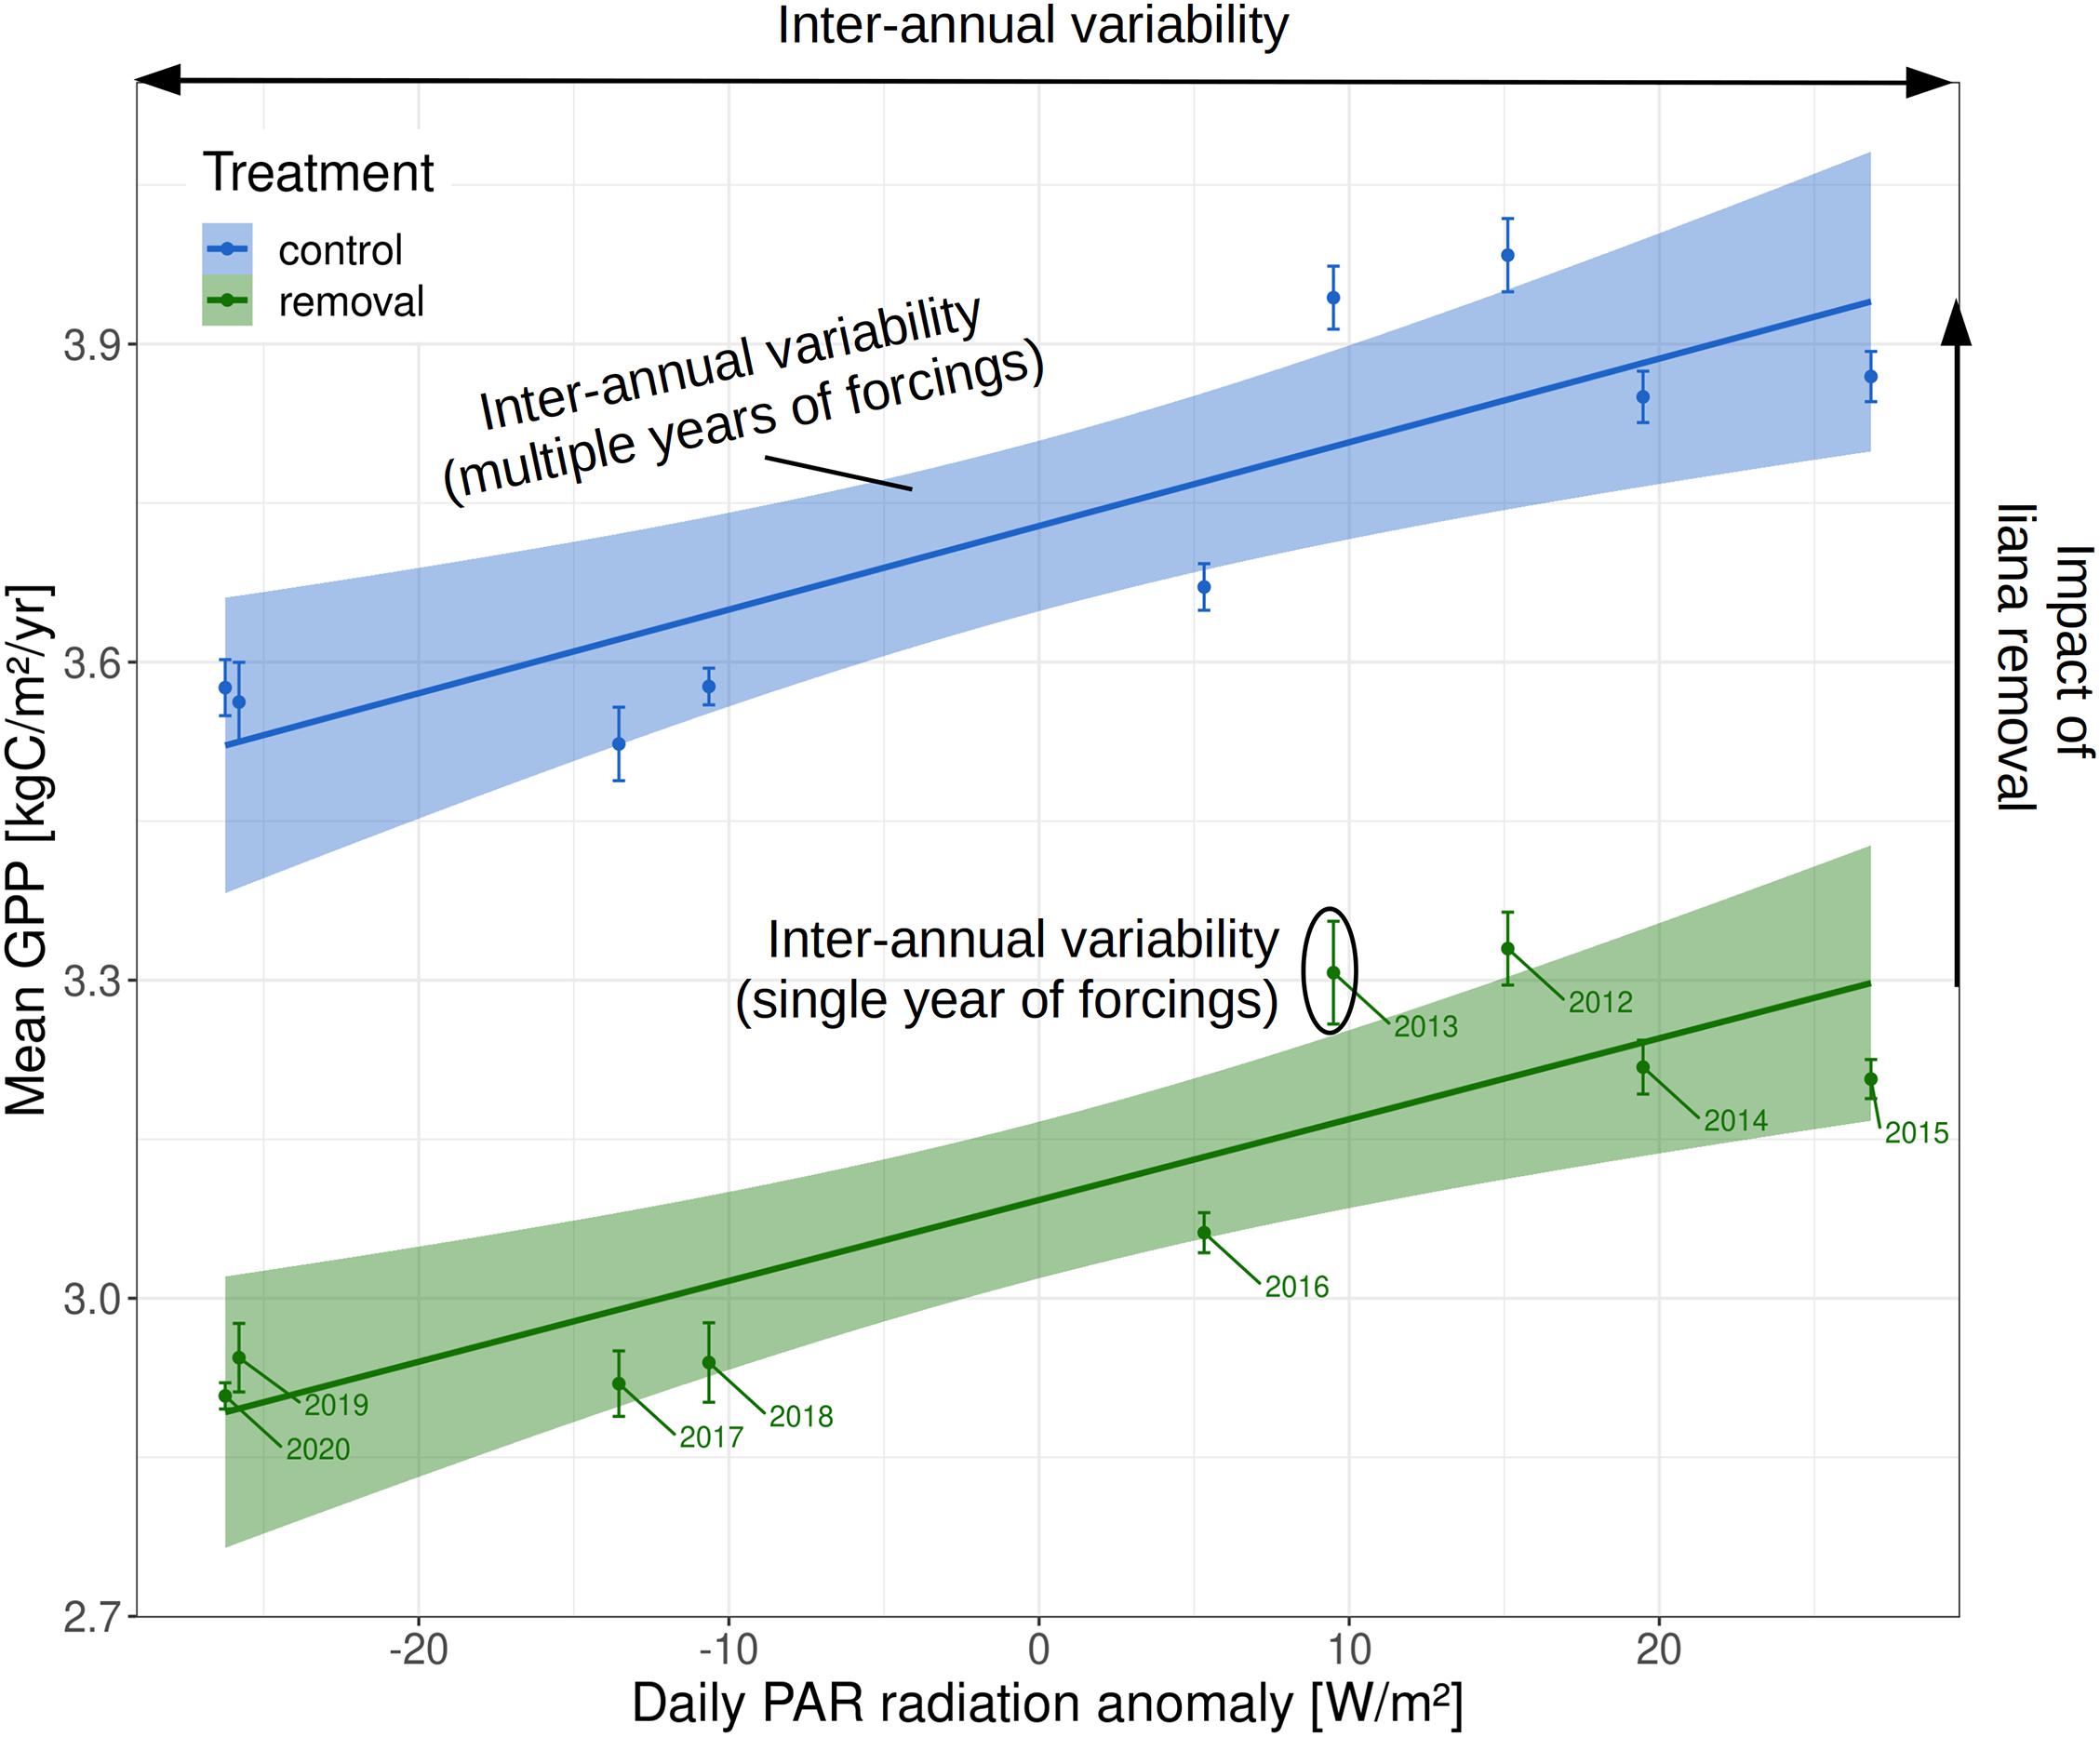
Figure 7. Impact of the inter-annual variability of incoming PAR radiation on the ecosystem productivity in liana removal and control plots. In the plot, it is also possible to compare the magnitude of the model outputs with multiple years of meteorological drivers (linear fits and corresponding ranges) or a single year of meteorological forcing (vertical error bars).
Liana removal triggered a strong increase in tree light interception. Controlling for the leaf area, the net PAR radiation intercepted by tree leaves increased by 42% in patches where lianas had been removed, leading to a strong increase in GPP for all tree PFTs (Table 2). This rise in photosynthesis was accompanied by a proportional increase in transpiration. Liana contribution to transpiration (40%) was not compensated by the increase in transpiration of all tree PFTs combined, so that overall ecosystem evapotranspiration decreased by 0.40 mm d–1 in removal plots (Table 2).
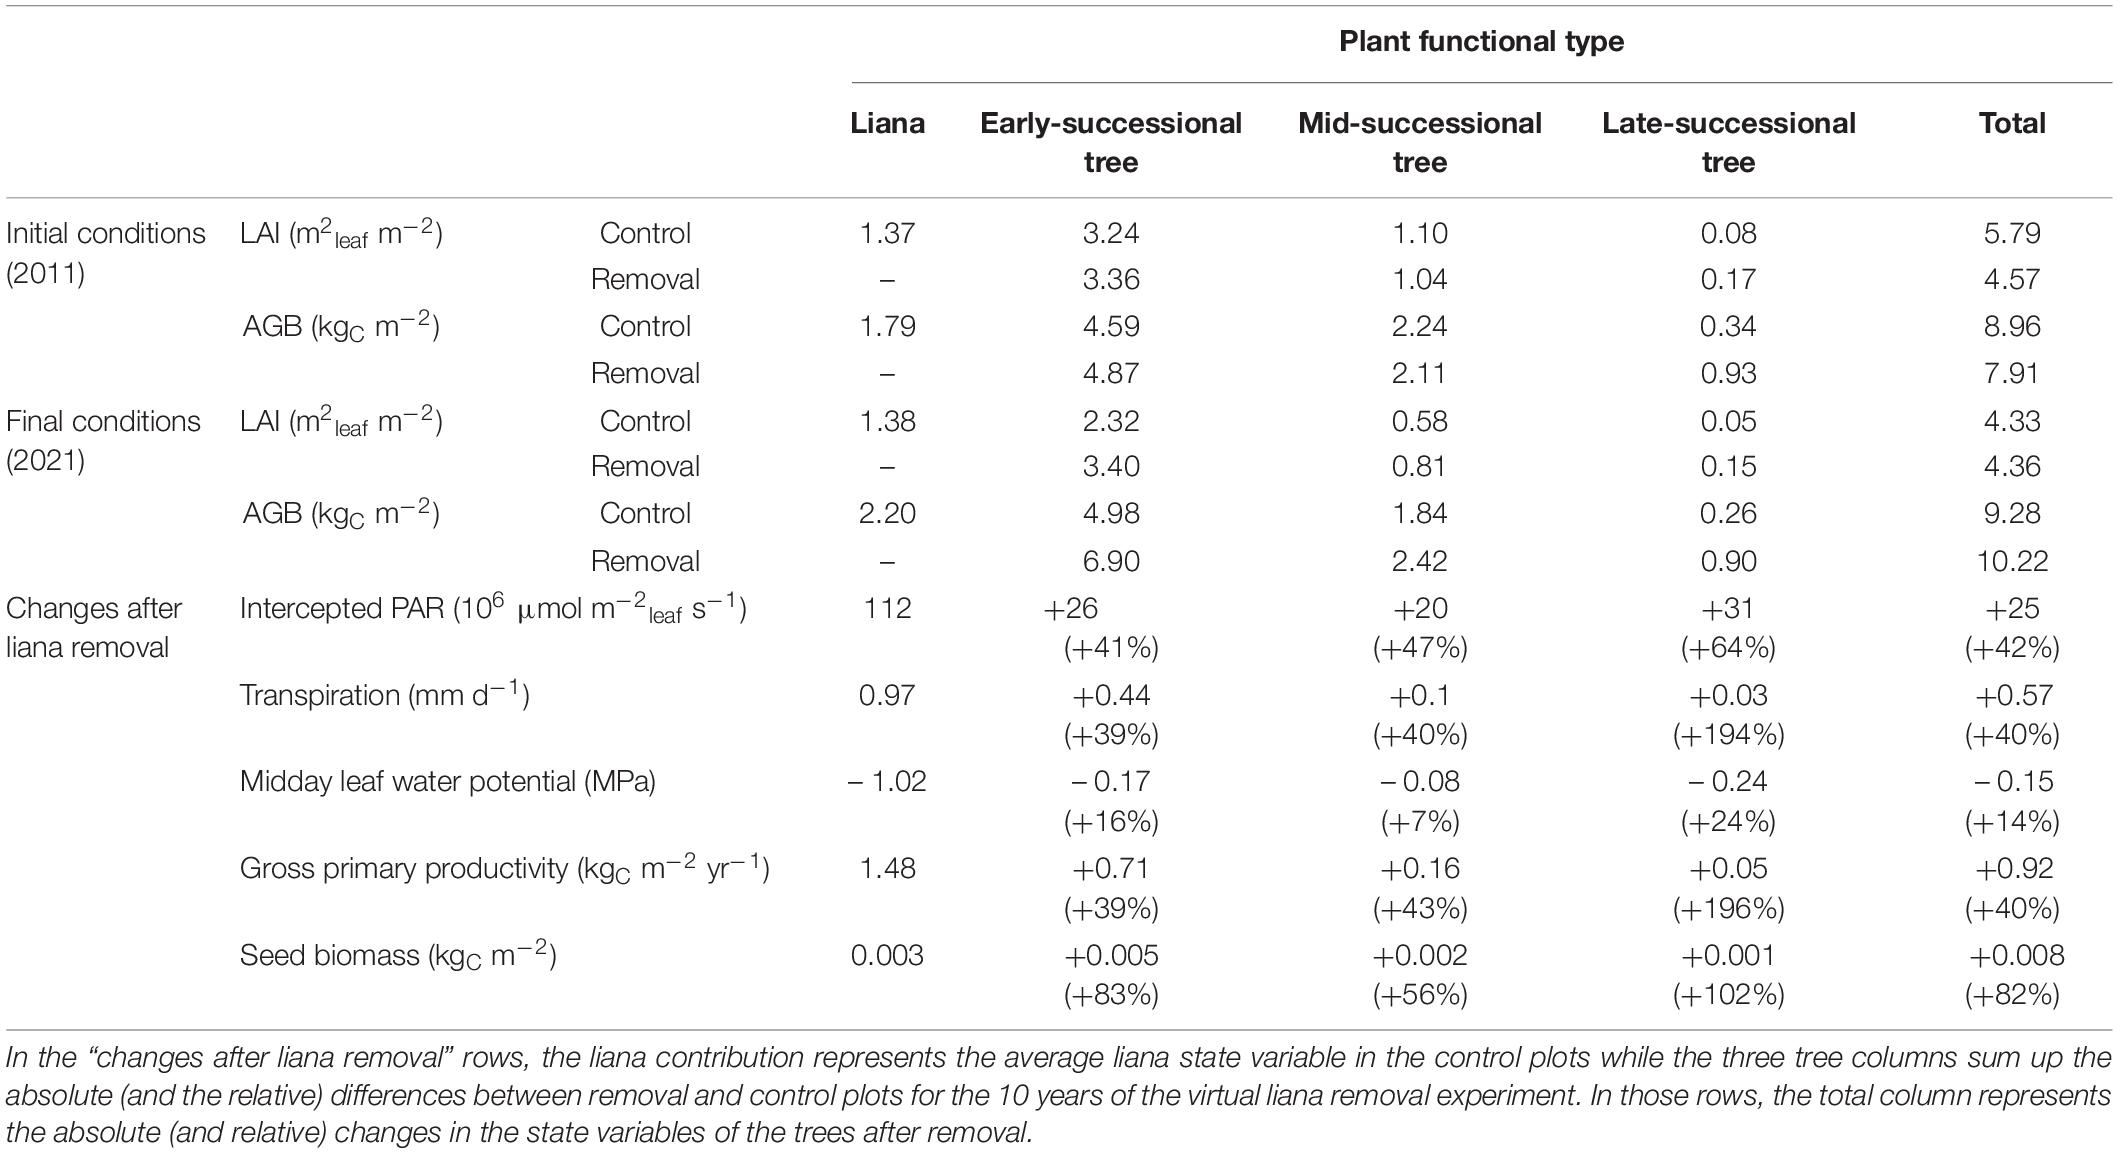
Table 2. Summary of the initial and final ecosystem states together with the changes due to liana removal in the manipulated plots, grouped by PFT.
The contribution of lianas to the ecosystem LAI increased slightly during the simulation: they initially represented 24% of the total LAI and ended up contributing to 32% after 10 years (Table 2). The ecosystem LAI of both treatments converged rapidly: while the liana removal made the control plot total leaf area higher (+1.22 m2 m–2), the difference disappeared over time (after 3 years: +0.24 ± 0.21 m2 m–2; after 10 years: −0.03 ± 0.11 m2 m–2).
Discussion
In this study, we demonstrate that the ED2 model, once calibrated, could reproduce different aspects of the liana-tree competition, as well as the plot-level impact of liana removal. The calibrated version of the model could not only replicate the observations of net biomass change that were used for calibration but also their components and the leaf and wood productivities. The fact that the optimized parameter distributions are realistic (Supplementary Figure C1) increases the confidence in the model predictions. This work extends the successful use of ED2 in a variety of eco-climatic regions, ranging from boreal (Ise and Moorcroft, 2010) to tropical (Longo et al., 2019b) ecosystems, by simulating experimental conditions, such as the liana removal experiment described in van der Heijden et al. (2015).
Ecosystem-Level Effect of Liana Removal
Our model simulations showed that due to the removal of liana leaves, the photosynthetically active radiation that reached the ground increased on average by 15% in the liana-free plots during the first 2 years of the simulation. The sharp initial increase in understory light availability upon removal quickly decreased and after 4 years, both treatments were indistinguishable. These numerical results are very similar to the findings of Rodríguez-Ronderos et al. (2016) who measured a light attenuation of around 20% in control plots of the same experimental site that was replicated here. Yet, 4 years after the initial cutting, there were no more differences of light reaching the ground between liana-rich and liana-free plots (Rodríguez-Ronderos et al., 2016), which indicates that trees had fully compensated for the loss of liana leaves as in the model simulations. The rapid convergence of total leaf area in both treatments, as simulated by the model, was also observed in 17 natural treefall gaps that served for another liana removal experiment (Schnitzer and Carson, 2010) and through 30 forest stands in a landscape liana removal experiment (Estrada-Villegas et al., 2020), both in Panama. The strong impact of lianas on light availability was also confirmed by measurements in an Amazonian dry forest in which light canopy transmission doubled after removal and remained significantly larger in liana-cut plots for 2 years (Gerwing, 2001). The release of the light competition intensity upon removal is compatible with larger canopy openness, enhanced light penetration, and hence faster growth rates of tree seedling observed once lianas were cut in dry forests of Bolivia and Brazil (Pérez-Salicrup, 2001; César et al., 2016).
Using the large-scale liana removal facility simulated in this study, Reid et al. (2015) found that liana removal significantly increased short-term (<4 months) surface (10 cm depth) water availability and generated persistent (multi-years) wetter deep soil (40 cm depth) layers. In the simulations of the vegetation model, liana removal similarly increased the top- and subsoil water content, but only by 0.2 and 1.2%, respectively. These increases are smaller than those reported by Reid et al. (2015). However, not all experimental studies could detect an effect of lianas on soil moisture. For instance, Pérez-Salicrup (2001) showed that liana abundance did not affect soil water content on either the topsoil layer or at 1 m depth in a lowland forest in Bolivia. The lack of clear patterns in the water content discrepancies between treatments can be easily explained. In the model like in reality, trees begin to exploit immediately after liana removal the water resources that were otherwise used by lianas, which makes the detection of differences in soil moisture very challenging (Tobin et al., 2012; Alvarez-Cansino et al., 2015).
Despite their hardly visible impact on soil water content, lianas do alter the water balance of the forest, especially during seasonal drought (Toledo-Aceves, 2015). The increase of individual tree transpiration simulated by ED2 upon removal was also observed in 53 canopy trees by Alvarez-Cansino et al. (2015), and four canopy trees by Tobin et al. (2012). Liana removal has also been associated with a positive impact on tree leaf water potential (Pérez-Salicrup and Barker, 2000). In our simulations, tree leaf water potentials actually decreased when lianas were removed (Table 2) but it did not affect their drought water stress. This was due to an increase of the evaporative demand once lianas were cut combined with a satisfactory water supply, which allowed trees to significantly increase their evapotranspiration. Yet, as illustrated by another study in which liana removal had no effect on leaf water potentials (Barker and Pérez-Salicrup, 2000), the change of tree water status after liana cutting heavily depends on the intensity and the nature of the interspecific water competition.
Liana removal experiments have also evidenced a strong detrimental effect of lianas on tree reproduction (Estrada-Villegas and Schnitzer, 2018). In total, five liana removal experiments have demonstrated that lianas can reduce tree reproduction at both the population and the community levels that persisted for several years after the start of the experiment (Stevens, 1987; Kainer et al., 2006, 2014; César et al., 2017; García León et al., 2018). Our simulations revealed that the tree seed biomass pool increased by 82% over the 10 years of simulation (Table 2), with the rate of increase relatively constant over time. Those results corroborate the experimental findings of Kainer et al. (2014) who reported a fruit production increase of 77% in the liana removal treatment plots, up to 10 years after removal.
Empirical vs. Process-Based Models
After simulating 10 years of forest dynamics, our model forecasted a net increase in AGB that was 1.7 kgC m–2 larger in patches where lianas were cut compared to control patches with lianas (i.e., 1.9 vs. 0.2 kgC m–2). This is slightly lower than the 2.1 kgC m–2 difference predicted by van der Heijden et al. (2015) based on an empirical model of the same system. The difference between the data-driven model of van der Heijden et al. (2015) and the process-based model used in this study originates from a faster deceleration of the net biomass increase simulated by the vegetation model. In ED2, the annual increase of total AGB in the liana removal plots rapidly dropped from 4% during the first 2 years to around 1.5% over the last 5 years. In the empirical model of van der Heijden et al. (2015), such annual net biomass change remained larger than 2% for 10 years.
The data-driven modeling approach of van der Heijden et al. (2015) is relatively simple compared to the ED2 model, which is a bigger, heavier to calibrate, and more complex machinery that yet offers multiple advantages. In ED2, it is possible to account for potential liana-induced shifts in forest composition, the increase in liana abundance over time (Table 2), and short- and long-term changes in meteorological drivers (Figure 7). Process-based model simulations like ED2 also allow for the examination of the mechanisms controlling the contrasting functioning of liana-rich and liana-free forests. Finally, process-based models offer the opportunity to extrapolate the observed AGB changes to unobserved carbon pools even if the conclusions necessarily rely on the model assumptions (di Porcia e Brugnera et al., 2019). For instance, the model showed that belowground plant biomass grew faster in liana removal plots (+0.7 kgC m–2) compared to unmanipulated control plots (+0.05 kgC m–2), while soil carbon remained larger 10 years after liana removal (+1.02 kgC m–2) due to the slow decomposition of liana cut stems, which could not be estimated in the original study.
The model filled the unobserved gaps in the carbon cycle of forest plots in the presence and absence of lianas. Simulations demonstrated that lianas severely reduce both the carbon sink potential and the carbon storage capacity of tropical forests. This finding was due to a strong competition for light between liana and tree leaves (Table 2), and a more rapid turnover of carbon fixed in plant material to the atmosphere when lianas were present, as observed by van der Heijden et al. (2015). The higher investment in leaves in control plots (and the resulting lower allocation to woody tissues) generated higher autotrophic and heterotrophic respiration rates, which led to an 88% reduction of NEP compared to its potential value in liana removal plots. Tree productivity was reduced in liana-rich plots due to light competition, and liana removal resulted in a sharp increase in tree light interception (Table 2).
Study Limitations and Perspectives
The most important limitation of this study is the relatively short time period of the empirical study (3 years), which reduces our ability to model inter-annual variability. Longer-term monitoring of liana-removal experiments should allow a more thorough constraining of the model parameters and hence a significant reduction of the predictive uncertainties that currently increase with the extrapolation duration (Figure 4). Our model runs were limited to 10 years mainly because of this data availability issue, and hence did not simulate the full forest succession. In the model, the early-successional trees benefited the most from the liana removal (Table 2) as they share the most similar ecological niches (fast acquisitive, low wood density, high mortality rates). Extending the virtual removal simulations would further alter the carbon storage discrepancies between liana-removal and control plots in the long term but this necessitates longer-term observations of manipulated forests to calibrate or validate the model outputs.
At the start of the simulation, early successional trees were the most abundant PFT, as determined by the species classification based on the observed wood densities of the inventoried species and the default class separators of ED2 (see Supplementary Figure B1). A succession dominated by early-successional tree species is typically what ED2 simulates for a relatively young forest (0–75 years), see di Porcia e Brugnera et al. (2019), as this PFT is more broadly defined in ED2 than pioneering (sensu stricto) trees only. Yet, mid- and late-successional trees typically begin to emerge and dominate after a century in ED2 simulations (Longo et al., 2019a), and therefore their late emergence in the succession was not captured here. In this study, we did not quantify the impact of the specific choice of the class separators on the tree-liana quantification. Yet, it is an important variable as it determines the relative contribution of the different tree PFTs to the forest biomass and leaf area. Further analyses should focus on the variance decomposition of model outputs in order to estimate the relative contribution of model parameters, initial conditions, and processes to the overall model uncertainty.
Due to the lack of long-term experimental data, we also chose to calibrate the model only against the last year of net biomass change observation, where the difference between treatments was greatest. This led to an overestimation of the simulated carbon accumulation rate (stem productivity and hence aboveground productivity) in all (but especially in the removal) plots compared to observations in the first 2 years after removal.
Another limitation is that the empirical study was conducted at a single site. Extrapolation of the numerical findings generated here to all tropical forests globally should therefore be performed with caution, until additional data with more diverse origins have been collected and assimilated in the model. Here, the analysis of liana removal experiments in forests with different succession stages, and hence different light, growth and carbon storage responsiveness, seems particularly important. For instance, in the case of an old-growth forest that already reached an equilibrium phase in which lianas and early successional trees are far less abundant, we would expect a more limited impact of liana removal (di Porcia e Brugnera et al., 2019).
Model predictions are also limited by the structure of the model. For instance, plant carbon pools are determined by constant allocation repartition coefficients in ED2, rather than dynamic, resource-driven allocation schemes (Longo et al., 2019a). Simulated belowground woody biomass represents a PFT-specific fraction of the total woody biomass (fixed by default to 30% for all PFTs) just like living tissues are controlled by a user-defined, PFT-specific ratio between below- and AGB (by default, this ratio is fixed to 1). In the model, liana residues exhibit similar decomposition rates as tree residues despite likely different C:N ratios [see Tang et al. (2012)] as the model does not simulate the Nitrogen cycle and hence does not differentiate the soil carbon pools according to their origin (i.e., PFT). We also used the pantropical equation of Chave et al. (2005) coupled to a site-specific height allometry and estimates of woody density from e.g., the Global Wood Density Database (Zanne et al., 2009) to estimate above-ground biomass, which could affect the carbon stocks if species composition differed between the 16 experimental plots. To some extent, the model structure reflects the current state of knowledge on the forest demography and functioning as well as the liana ecology. For instance, it was shown that the ratio of below- to above-biomass production in the tropics is close to the default model parameter value (0.28 vs. 0.30), see Vicca et al. (2012). Yet, model structure and parameters could be updated, should new or site-specific empirical datasets bring contradictory evidence. In the absence of tissue composition, soil carbon and root biomass data, the results related to the impact of lianas on belowground carbon storage and sequestration remain speculative and as such mostly reflect model hypotheses.
This modeling framework provokes multiple additional hypotheses to be tested in future experimental analyses. First, model runs predicted larger amounts of soil organic matter as a result of liana removal, which persisted at least until 10 years after liana removal. This model prediction could still be validated in the field, since the liana-removal experiment on Gigante is ongoing (e.g., García León et al., 2018; Schnitzer and van der Heijden, 2019; van der Heijden et al., 2019). Second, larger litter pools were expected in control plots from the simulations, especially during the dry season (Figure 5, FSC pool). Establishing long term litterfall traps should enable a straightforward model validation of these seasonal and treatment effects. Third, the difference in simulated plant belowground biomass between treatments could also be evaluated through digging, sampling, and weighting root biomass in both treatments (Castellanos et al., 1991; Smith-Martin et al., 2020). More generally, the fine-root dynamics in the liana removal experiment and their seasonal fluctuations (Cordeiro et al., 2020) should be investigated in more detail in future experimental studies. Such experiments should allow disentangling two contrasting situations: there are either more (fine) roots in liana removal plots because of the faster tree growth (as simulated in ED2) or there are more (fine) roots in control plots because of the stronger ongoing competition for below ground resources (Cabal et al., 2020). These examples of model-enabled, field-testable hypotheses are a good illustration of an efficient model-data fusion approach: model simulations calibrated on field datasets generated research questions whose evaluation could help refine modeled plant and soil processes.
Such a validated model may allow prediction of the impact of liana infestation at large scale, or identification of the change of forest recovery potential due to lianas in secondary forests. In the future, especially when data from more sites is available, this model could also help to disentangle true liana feedback from driver-controlled thresholds, and parasitoid from bandage effects (Marshall et al., 2020).
Conclusion
Process-based models and experimental datasets are complementary tools that, combined, can extend the outcome of either approach used alone. Removal experiments remarkably demonstrated that lianas reduce carbon accumulation and storage in tropical forests (e.g., Schnitzer et al., 2014; van der Heijden et al., 2015, 2019; Estrada-Villegas et al., 2020). Yet, empirical studies do not permit the monitoring of every single carbon stock or flux for practical and financial reasons. Contrastingly, vegetation models can track the specific role of lianas in all forest biogeochemical cycles that they simulate including belowground components, but the accuracy of their prediction relies heavily on the model structure and the quality of the calibration datasets. In this proof-of-concept study, we illustrate how the process-based vegetation model ED2 and its liana plant functional type, calibrated with empirical field data from a liana removal experiment, can bring new insights into the mechanisms of liana-tree competition. A realistic parameter set reproduced the main field observations, i.e., faster aboveground carbon accumulation in removal plots, larger mortality and turnover rates in the control plots. The model further predicted larger net belowground biomass changes in removal plots due to a sharp increase in root biomass of mainly early successional trees, a slow decomposition of liana woody debris and a strong increase in soil organic content. Carbon stocks of removal plots were significantly larger both aboveground and belowground after 10 years of virtual experiment. These and many other testable predictions should now be further validated with longer-term empirical data and could lead to additional novel model developments.
Data Availability Statement
The raw data supporting the conclusions of this article will be made available by the authors, without undue reservation.
Author Contributions
FM, GMFvdH, and HV designed the study. FM implemented the workflow, ran the simulations, and analyzed the results with inputs and support from all co-authors. GMFvdH and SS processed the raw data of the liana removal experiment. All authors contributed to the manuscript writing.
Funding
This research was funded by the European Research Council Starting Grant 637643 (TREECLIMBERS). The computational resources and services used in this work were provided by the VSC (Flemish Supercomputer Center), funded by the Research Foundation – Flanders (FWO) and the Flemish Government – department EWI. During the preparation of this manuscript, FM was first funded by the BAEF and the WBI as a research fellow and then by the FWO (grant number: 1214720N) as a junior postdoc and is thankful to these organizations for their financial support. HDD was also a BAEF research fellow during the preparation of this manuscript and is grateful to this organization for its support. Financial support for the Gigante Peninsula liana removal study was provided by NSF-DEB 1019436, DEB 1822473, and DEB 2001799.
Conflict of Interest
The authors declare that the research was conducted in the absence of any commercial or financial relationships that could be construed as a potential conflict of interest.
The reviewer FB declared a past co-authorship with one of the author SS to the handling editor.
Acknowledgments
We are grateful to the whole PEcAn group and the ED2 team for helpful discussions and support related to the functioning of PEcAn and ED2, in particular to Istem Fer for her great assistance in using the PDA for model calibration.
Supplementary Material
The Supplementary Material for this article can be found online at: https://www.frontiersin.org/articles/10.3389/ffgc.2021.663291/full#supplementary-material
Supplementary Appendix A | Soil carbon pools in ED2.
Supplementary Appendix B | Initial forest composition.
Supplementary Figure B1 | Wood density distribution of the tree individuals (A) and tree species (B) used to classify the initial tree census into the model PFTs. The vertical dashed lines mark the class separators between the early-, mid-, and late-successional PFTs.
Supplementary Figure B2 | Initial tree size distribution of the control (left) and removal (right) plots. Tree records were classified into the ED2 plant functional types according to their wood density. The error bars represent the inter-patch variability (one standard error) of the total tree density in each size class.
Supplementary Figure B3 | Initial liana size distribution of the liana control plots. The error bars represent the inter-patch variability (one standard error) of the total liana density in each size class. Lianas above 3 cm in size were initially located in the canopy.
Supplementary Appendix C | Supplementary results.
Supplementary Figure C1 | Posterior distributions of the calibrated model parameters. clumping_ factor is unitless and Vcmax is defined at 15°C in μmolC m–2 s–1. A larger clumping factor indicates a larger light interception per unit of leaf area.
References
Alvarez-Cansino, L., Schnitzer, S. A., Reid, J. P., and Powers, J. S. (2015). Liana competition with tropical trees varies seasonally but not with tree species identity. Ecology 96, 39–45. doi: 10.1890/14-1002.1
Barker, M. G., and Pérez-Salicrup, D. (2000). Comparative water relations of mature mahogany (Swietenia macrophylla) trees with and without lianas in a subhumid, seasonally dry forest in Bolivia. Tree Physiol. 20, 1167–1174. doi: 10.1093/treephys/20.17.1167
Bolker, B. M., Pacala, S. W., and Parton, W. J. (1998). Linear analysis of soil decomposition: insights from the century model. Ecol. Appl. 8, 425–439. doi: 10.1890/1051-0761(1998)008[0425:laosdi]2.0.co;2
Cabal, C., Martínez-García, R., Aguilar, A., de, C., Valladares, F., and Pacala, S. W. (2020). The exploitative segregation of plant roots. Science 370, 1197–1199. doi: 10.1126/science.aba9877
Camino, C., Gonzalez-Dugo, V., Hernandez, P., and Zarco-Tejada, P. J. (2019). Radiative transfer Vcmax estimation from hyperspectral imagery and SIF retrievals to assess photosynthetic performance in rainfed and irrigated plant phenotyping trials. Remote Sens. Environ. 231:111186.
Castellanos, J., Maass, M., and Kummerow, J. (1991). Root biomass of a dry deciduous tropical forest in Mexico. Plant Soil 131, 225–228. doi: 10.1007/bf00009452
César, R. G., Holl, K. D., Girão, V. J., Mello, F. N. A., Vidal, E., Alves, M. C., et al. (2016). Evaluating climber cutting as a strategy to restore degraded tropical forests. Biol. Conserv. 201, 309–313. doi: 10.1016/j.biocon.2016.07.031
César, R. G., Rother, D. C., and Brancalion, P. H. S. (2017). Early response of tree seed arrival after liana cutting in a disturbed tropical forest. Tropical Conserv. Sci. 10, 1–7.
Chave, J., Andalo, C., Brown, S., Cairns, M. A., Chambers, J. Q., Eamus, D., et al. (2005). Tree allometry and improved estimation of carbon stocks and balance in tropical forests. Oecologia 145, 87–99. doi: 10.1007/s00442-005-0100-x
Cordeiro, A. L., Norby, R. J., Andersen, K. M., Valverde-Barrantes, O., Fuchslueger, L., Oblitas, E., et al. (2020). Fine-root dynamics vary with soil depth and precipitation in a low-nutrient tropical forest in the Central Amazonia. Plant-Environ. Interact. 1, 3–16. doi: 10.1002/pei3.10010
Detto, M., Wright, S. J., Calderón, O., and Muller-Landau, H. C. (2018). Resource acquisition and reproductive strategies of tropical forest in response to the El Niño–Southern Oscillation. Nat. Commun. 9, 1–8.
di Porcia e Brugnera, M., Meunier, F., Longo, M., Moorthy, S. M. K., Deurwaerder, H. D., Schnitzer, S. A., et al. (2019). Modeling the impact of liana infestation on the demography and carbon cycle of tropical forests. Global Change Biol. 25, 3767–3780. doi: 10.1111/gcb.14769
Dietze, M. C., and Latimer, A. M. (2011). Forest Simulators. In Sourcebook in Theoretical Ecology. Berkeley, CA: University of California Press, 307–316.
Durán, S. M., and Gianoli, E. (2013). Carbon stocks in tropical forests decrease with liana density. Biol. Lett. 9, 1–4.
Estrada-Villegas, S., Hall, J. S., van Breugel, M., and Schnitzer, S. A. (2020). Lianas reduce biomass accumulation in early successional tropical forests. Ecology 101:e02989.
Estrada-Villegas, S., and Schnitzer, S. A. (2018). A comprehensive synthesis of liana removal experiments in tropical forests. Biotropica 50, 729–739. doi: 10.1111/btp.12571
Ewers, F. W., Rosell, J. A., and Olson, M. E. (2015). “Lianas as Structural Parasites,” in Functional and Ecological Xylem Anatomy, ed. U. Hacke (Cham: Springer International Publishing), 163–188. doi: 10.1007/978-3-319-15783-2_6
Farquhar, G. D., von Caemmerer, S., and Berry, J. A. (1980). A biochemical model of photosynthetic CO2 assimilation in leaves of C3 species. Planta 149, 78–90. doi: 10.1007/bf00386231
Fer, I., Kelly, R., Moorcroft, P. R., Richardson, A. D., Cowdery, E. M., and Dietze, M. C. (2018). Linking big models to big data: efficient ecosystem model calibration through Bayesian model emulation. Biogeosciences 15, 5801–5830. doi: 10.5194/bg-15-5801-2018
Fisher, R., McDowell, N., Purves, D., Moorcroft, P., Sitch, S., Cox, P., et al. (2010). Assessing uncertainties in a second-generation dynamic vegetation model caused by ecological scale limitations. New Phytol. 187, 666–681. doi: 10.1111/j.1469-8137.2010.03340.x
Fisher, R. A., Koven, C. D., Anderegg, W. R. L., Christoffersen, B. O., Dietze, M. C., Farrior, C. E., et al. (2018). Vegetation demographics in earth system models: A review of progress and priorities. Global Change Biol. 24, 35–54. doi: 10.1111/gcb.13910
Freschet, G. T., Roumet, C., Comas, L. H., Weemstra, M., Bengough, A. G., Rewald, B., et al. (2020). Root traits as drivers of plant and ecosystem functioning: current understanding, pitfalls and future research needs. New Phytol. 2021:63.
García León, M. M., Martínez Izquierdo, L., Mello, F. N. A., Powers, J. S., and Schnitzer, S. A. (2018). Lianas reduce community-level canopy tree reproduction in a Panamanian forest. J. Ecol. 106, 737–745. doi: 10.1111/1365-2745.12807
Gerwing, J. J. (2001). Testing liana cutting and controlled burning as silvicultural treatments for a logged forest in the eastern Amazon. J. Appl. Ecol. 38, 1264–1276. doi: 10.1046/j.0021-8901.2001.00677.x
Hengl, T., de Jesus, J. M., Heuvelink, G. B. M., Gonzalez, M. R., Kilibarda, M., Blagotić, A., et al. (2017). SoilGrids250m: Global gridded soil information based on machine learning. PLoS One 12:e0169748. doi: 10.1371/journal.pone.0169748
Ingwell, L. L., Joseph Wright, S., Becklund, K. K., Hubbell, S. P., and Schnitzer, S. A. (2010). The impact of lianas on 10 years of tree growth and mortality on barro colorado Island, Panama. J. Ecol. 98, 879–887.
Ise, T., and Moorcroft, P. R. (2010). Simulating boreal forest dynamics from perspectives of ecophysiology, resource availability, and climate change. Ecol. Res. 25, 501–511. doi: 10.1007/s11284-009-0680-8
Kainer, K. A., Wadt, L. H. O., Gomes-Silva, D. A. P., and Capanu, M. (2006). Liana loads and their association with Bertholletia excelsa fruit and nut production, diameter growth and crown attributes. J. Tropical Ecol. 22, 147–154. doi: 10.1017/s0266467405002981
Kainer, K. A., Wadt, L. H. O., and Staudhammer, C. L. (2014). Testing a silvicultural recommendation: Brazil nut responses 10 years after liana cutting. J. Appl. Ecol. 51, 655–663. doi: 10.1111/1365-2664.12231
Kurzel, B. P., Schnitzer, S. A., and Carson, W. P. (2006). Predicting liana crown location from stem diameter in three Panamanian lowland forests. Biotropica 38, 262–266. doi: 10.1111/j.1744-7429.2006.00135.x
LeBauer, D. S., Wang, D., Richter, K. T., Davidson, C. C., and Dietze, M. C. (2013). Facilitating feedbacks between field measurements and ecosystem models. Ecol. Monogr. 83, 133–154. doi: 10.1890/12-0137.1
Longo, M., Knox, R. G., Medvigy, D. M., Levine, N. M., Dietze, M. C., Kim, Y., et al. (2019a). The biophysics, ecology, and biogeochemistry of functionally diverse, vertically- and horizontally-heterogeneous ecosystems: the Ecosystem Demography Model, version 2.2 — Part 1: Model description. Geosci. Model Dev. 12, 4309–4346. doi: 10.5194/gmd-12-4309-2019
Longo, M., Knox, R. G., Levine, N. M., Swann, A. L. S., Medvigy, D. M., Dietze, M. C., et al. (2019b). The biophysics, ecology, and biogeochemistry of functionally diverse, vertically- and horizontally-heterogeneous ecosystems: the Ecosystem Demography Model, version 2.2 &ndash Part 2: Model evaluation. Geosci. Model Dev. 12, 4347–4374.
Marshall, A. R., Platts, P. J., Chazdon, R. L., Seki, H., Campbell, M. J., Phillips, O. L., et al. (2020). Conceptualising the global forest response to liana proliferation. Front. Forests Global Change 3:35. doi: 10.3389/ffgc.2020.00035
Martínez-Izquierdo, L., García, M. M., Powers, J. S., and Schnitzer, S. A. (2016). Lianas suppress seedling growth and survival of 14 tree species in a Panamanian tropical forest. Ecology 97, 215–224. doi: 10.1890/14-2261.1
Medvigy, D., Wofsy, S. C., Munger, J. W., Hollinger, D. Y., and Moorcroft, P. R. (2009). Mechanistic scaling of ecosystem function and dynamics in space and time: ecosystem demography model version 2. J. Geophys. Res. Biogeosci. 114:G01002. doi: 10.1029/2008JG000812
Meunier, F., Verbeeck, H., Cowdery, B., Schnitzer, S. A., Smith-Martin, C. M., Powers, J., et al. (2020). Unraveling the relative role of light and water competition between lianas and trees in tropical forests. J. Ecol. 109, 519–540. doi: 10.1111/1365-2745.13540
Moorcroft, P. R., Hurtt, G. C., and Pacala, S. W. (2001). A method for scaling vegetation dynamics: the ecosystem demography model (ED). Ecol. Monogr. 71, 557–586. doi: 10.1890/0012-9615(2001)071[0557:amfsvd]2.0.co;2
Norby, R. J., and Zak, D. R. (2011). Ecological lessons from free-air CO2 Enrichment (FACE) Experiments. Ann. Rev. Ecol. Evol. Syst. 42, 181–203. doi: 10.1146/annurev-ecolsys-102209-144647
Pérez-Salicrup, D. R. (2001). Effect of liana cutting on tree regeneration in a liana forest in Amazonian Bolivia. Ecology 82, 389–396. doi: 10.1890/0012-9658(2001)082[0389:eolcot]2.0.co;2
Pérez-Salicrup, D. R., and Barker, M. G. (2000). Effect of liana cutting on water potential and growth of adult Senna multijuga (Caesalpinioideae) trees in a Bolivian tropical forest. Oecologia 124, 469–475. doi: 10.1007/pl00008872
Phillips, O. L. (2002). Increasing dominance of large lianas in Amazonian forests. Nature 418, 770–774. doi: 10.1038/nature00926
Powell, T., Kueppers, L., and Paton, S. (2017). Seven years (2008-2014) of meteorological observations plus a synthetic El Nino drought for BCI Panama.
Reid, J. P., Schnitzer, S. A., and Powers, J. S. (2015). Short and long-term soil moisture effects of liana removal in a seasonally moist tropical forest. PLoS One 10:e0141891. doi: 10.1371/journal.pone.0141891
Rezende, L. C., Arenque, B., von Randow, C., Moura, M. S., Aidar, S. D., Buckeridge, M. S., et al. (2013). Calibration of the maximum carboxylation velocity (vcmax) for the Caatinga for use in dynamic global vegetation models (DGVMs). San Francisco, CA: AGU Fall Meeting, 0366.
Rodríguez-Ronderos, M. E., Bohrer, G., Sanchez-Azofeifa, A., Powers, J. S., and Schnitzer, S. A. (2016). Contribution of lianas to plant area index and canopy structure in a Panamanian forest. Ecology 97, 3271–3277. doi: 10.1002/ecy.1597
Schnitzer, S. A. (2018). Testing ecological theory with lianas. New Phytol. 220, 366–380. doi: 10.1111/nph.15431
Schnitzer, S. A., and Bongers, F. (2002). The ecology of lianas and their role in forests. Trends Ecol. Evol. 17, 223–230. doi: 10.1016/s0169-5347(02)02491-6
Schnitzer, S. A., and Bongers, F. (2011). Increasing liana abundance and biomass in tropical forests: emerging patterns and putative mechanisms. Ecol. Lett. 14, 397–406. doi: 10.1111/j.1461-0248.2011.01590.x
Schnitzer, S. A., and Carson, W. P. (2010). Lianas suppress tree regeneration and diversity in treefall gaps. Ecol. Lett. 13, 849–857.
Schnitzer, S. A., Dewalt, S. J., and Chave, J. (2006). Censusing and measuring lianas: a quantitative comparison of the common methods. Biotropica 38, 581–591. doi: 10.1111/j.1744-7429.2006.00187.x
Schnitzer, S. A., Estrada-Villegas, S., and Wright, S. J. (2020). The response of lianas to 20 yr of nutrient addition in a Panamanian forest. Ecology 101:e03190.
Schnitzer, S. A., and van der Heijden, G. M. F. (2019). Lianas have a seasonal growth advantage over co-occurring trees. Ecology 100:e02655. doi: 10.1002/ecy.2655
Schnitzer, S. A., van der Heijden, G. M. F., Mascaro, J., and Carson, W. P. (2014). Lianas in gaps reduce carbon accumulation in a tropical forest. Ecology 95, 3008–3017. doi: 10.1890/13-1718.1
Schnitzer, S. A., van der Heijden, G. M. F., and Powers, J. S. (2016). Reply to Verbeeck and Kearsley: Addressing the challenges of including lianas in global vegetation models. PNAS 113, E5–E6.
Sellers, P. J. (1985). Canopy reflectance, photosynthesis and transpiration. Int. J. Remote Sens. 6, 1335–1372. doi: 10.1080/01431168508948283
Smith-Martin, C. M., Xu, X., Medvigy, D., Schnitzer, S. A., and Powers, J. S. (2020). Allometric scaling laws linking biomass and rooting depth vary across ontogeny and functional groups in tropical dry forest lianas and trees. New Phytol. 226, 714–726. doi: 10.1111/nph.1627/nph.16275
Snell, R. S., Huth, A., Nabel, J. E. M. S., Bocedi, G., Travis, J. M. J., Gravel, D., et al. (2014). Using dynamic vegetation models to simulate plant range shifts. Ecography 37, 1184–1197. doi: 10.1111/ecog.00580
Stevens, G. C. (1987). Lianas as structural parasites: The bursera simaruba example. Ecology 68, 77–81. doi: 10.2307/1938806
Tang, Y., Kitching, R. L., and Cao, M. (2012). Lianas as structural parasites: A re-evaluation. Chinese Sci. Bull. 57, 307–312. doi: 10.1007/s11434-011-4690-x
Tobin, M. F., Wright, A. J., Mangan, S. A., and Schnitzer, S. A. (2012). Lianas have a greater competitive effect than trees of similar biomass on tropical canopy trees. Ecosphere 3, 1–11.
Toledo-Aceves, T. (2015). “Above-and belowground competition between lianas and trees,” in The Ecology of Lianas, eds S. Schnitzer, F. Bongers, R. Burnham, and F. Putz (Hoboken, NJ: Wiley-Blackwell), 149–163.
van der Heijden, G., Powers, J. S., and Schnitzer, S. A. (2015). Lianas reduce forest-level carbon accumulation and storage. PNAS 112, 13267–13271. doi: 10.1073/pnas.1504869112
van der Heijden, G., Powers, J. S., and Schnitzer, S. A. (2019). Effect of lianas on forest-level tree carbon accumulation does not differ between seasons: results from a liana removal experiment in Panama. J. Ecol. 107, 1890–1900. doi: 10.1111/1365-2745.13155
van der Heijden, G. M., Schnitzer, S. A., Powers, J. S., and Phillips, O. L. (2013). Liana impacts on carbon cycling, storage and sequestration in tropical forests. Biotropica 45, 682–692. doi: 10.1111/btp.12060
Verbeeck, H., and Kearsley, E. (2015). The importance of including lianas in global vegetation models. PNAS 113:E4.
Vicca, S., Luyssaert, S., Peñuelas, J., Campioli, M., Chapin, F. S., Ciais, P., et al. (2012). Fertile forests produce biomass more efficiently. Ecol. Lett. 15, 520–526. doi: 10.1111/j.1461-0248.2012.01775.x
Viskari, T., Shiklomanov, A., Dietze, M. C., and Serbin, S. P. (2019). The influence of canopy radiation parameter uncertainty on model projections of terrestrial carbon and energy cycling. PLoS One 14:e0216512.
Walko, R. L., Band, L. E., Baron, J., Kittel, T. G. F., Lammers, R., Lee, T. J., et al. (2000). Coupled atmosphere–biophysics–hydrology models for environmental modeling. J. Appl. Meteorol. 39, 931–944. doi: 10.1175/1520-0450(2000)039<0931:cabhmf>2.0.co;2
Xu, X., Medvigy, D., Powers, J. S., Becknell, J. M., and Guan, K. (2016). Diversity in plant hydraulic traits explains seasonal and inter-annual variations of vegetation dynamics in seasonally dry tropical forests. New Phytol. 212, 80–95.
Keywords: tropical lianas, liana removal experiment, vegetation modeling, carbon stocks and fluxes, ecosystem demography model 2
Citation: Meunier F, van der Heijden GMF, Schnitzer SA, De Deurwaerder HPT and Verbeeck H (2021) Lianas Significantly Reduce Aboveground and Belowground Carbon Storage: A Virtual Removal Experiment. Front. For. Glob. Change 4:663291. doi: 10.3389/ffgc.2021.663291
Received: 02 February 2021; Accepted: 31 May 2021;
Published: 22 June 2021.
Edited by:
Jürgen Homeier, University of Göttingen, GermanyReviewed by:
Frans Bongers, Wageningen University and Research, NetherlandsEmilio Vilanova, University of California, Berkeley, United States
Florian Hofhansl, International Institute for Applied Systems Analysis (IIASA), Austria
Copyright © 2021 Meunier, van der Heijden, Schnitzer, De Deurwaerder and Verbeeck. This is an open-access article distributed under the terms of the Creative Commons Attribution License (CC BY). The use, distribution or reproduction in other forums is permitted, provided the original author(s) and the copyright owner(s) are credited and that the original publication in this journal is cited, in accordance with accepted academic practice. No use, distribution or reproduction is permitted which does not comply with these terms.
*Correspondence: Félicien Meunier, ZmVsaWNpZW4ubWV1bmllckBnbWFpbC5jb20=
†ORCID: Félicien Meunier, orcid.org/0000-0003-2486-309X; Geertje M. F. van der Heijden, orcid.org/0000-0002-2110-5173; Stefan A. Schnitzer, orcid.org/0000-0002-2715-9455; Hannes P. T. De Deurwaerder, orcid.org/0000-0002-9287-2062; Hans Verbeeck, orcid.org/0000-0003-1490-0168