 Thomas Buchholz
 John S. Gunn
 Benktesh Sharma2
95% of researchers rate our articles as excellent or good
Learn more about the work of our research integrity team to safeguard the quality of each article we publish.
Find out more
ORIGINAL RESEARCH article
Front. For. Glob. Change , 10 May 2021
Sec. Forests and the Atmosphere
Volume 4 - 2021 | https://doi.org/10.3389/ffgc.2021.642569
Increasing demand for woody biomass-derived electricity in the UK and elsewhere has resulted in a rapidly expanding wood pellet manufacturing industry in the southern US. Since this demand is driven by climate concerns and an objective to lower greenhouse gas (GHG) emissions from the electricity sector, it is crucial to understand the full carbon consequences of wood pellet sourcing, processing, and utilization. We performed a comparative carbon life cycle assessment (LCA) for pellets sourced from three mills in the southern US destined for electricity generation in the UK. The baseline assumptions included GHG emissions of the UK’s 2018 and 2025 target electricity grid mix and feedstock supplied primarily from non-industrial private forest (NIPF) pine plantations augmented with a fraction of sawmill residues. Based on regional expert input, we concluded that forest management practices on the NIPF pine plantations would include timely thinning harvest treatments in the presence of pellet demand. The LCA analysis included landscape carbon stock changes based on USDA Forest Service Forest Vegetation Simulator using current USDA Forest Service Forest Inventory and Analysis data as the starting condition of supply areas in Arkansas, Louisiana and Mississippi. We found that GHG emission parity (i.e., the time when accumulated carbon GHG emissions for the bioenergy scenario equal the baseline scenario) is more than 40 years for pellets produced at each individual pellet mill and for all three pellet mills combined when compared to either the UK’s 2018 electricity grid mix or the UK’s targeted electricity grid mix in 2025. The urgency to mitigate climate change with near-term actions as well as increasing uncertainty with longer-term simulations dictated a focus on the next four decades in the analysis. Even at 50% sawmill residues, GHG emission parity was not reached during the 40 years modeled. Results are most likely conservative since we assume a high share of sawmill residues (ranging from 20 to 50%) and did not include limited hardwood feedstocks as reported in the supply chain which are generally associated with delayed GHG emission parity because of lower growth rates.
Since 2013 the wood pellet manufacturing industry in the southern US has expanded at a rapid pace. In 2018 alone, the US exported over 6 million Megagrams (Mg) of wood pellets, more than tripling from 1.90 million Mg in 2012 (FAOSTAT, 2020). The largest market for US wood pellets is the UK (approximately 80%; USDA, 2020). Increased pellet demand in the UK is driven by policies aimed at addressing climate change and promoting renewable energy (UK Department for BEIS, 2019). These policies incentivize burning wood pellets for electricity production by providing subsidies to offset high generation costs. EU countries such as Italy, Denmark, and Germany are also top consumers of wood pellets (FAOSTAT, 2020), driven by similar government initiatives and incentives. Global wood pellet market size is expected to double from 2019 to 2025 (KSI, 2020). UK and EU policies and the resulting subsidies driving this growth are premised on the assumption that burning woody biomass, including wood pellets, is “carbon neutral.” This assumption is based on a carbon accounting methodology whereby the carbon emitted from burning the wood pellets i.e., the stack greenhouse gas (GHG) emissions, is counted as zero. Only CO2 GHG emissions from harvesting, processing, and transport are considered while changes to the carbon stored in the forest, are ignored, regardless of from where or how the pellets are sourced. In the UN/IPCC accounting framework (Garg and Weitz, 2019), the carbon stock changes in forests are tracked within the country of origin and in theory the accounting of biomass energy GHG emissions should be addressed in this way. However, the potential loss or forgone growth potential of forest carbon stocks in the US is not accounted for by the UK/EU or by the utility burning the wood pellets.
Biomass burning facilities can therefore receive subsidies aimed at reducing carbon GHG emissions without a full and accurate consideration of the facility’s life cycle carbon impacts; potentially further contributing to climate change (Zanchi et al., 2012; Vanhala et al., 2013; Brack, 2017; Sterman et al., 2018; Kalt et al., 2019). Drax Power, a UK based utility and a primary consumer of US wood pellets has converted four of its large coal units to burn wood pellets with the backing of significant climate-policy derived subsidies–€789.2 million in 2018 alone (Drax Group PLC, 2019a)1. Although Drax still receives a majority of its US-based wood pellets from third parties, such as Enviva Pellets (Drax, 2017), it has begun manufacturing its own wood pellets in the US.
Assessing climate-benefits of bioenergy systems is complex and results can range from highly climate beneficial to climate detrimental in the short- or long-term (Buchholz et al., 2016; Bentsen, 2017; Giuntoli et al., 2020). For a consequential or comparative carbon life cycle assessment (C LCA; Eve et al., 2014) of bioenergy systems, it is essential to assess the impact on landscape forest carbon fluxes. In the case of the Drax pellet mills, this requires integrating the anticipated change of carbon stocks in the forest under a bioenergy demand scenario compared to a baseline scenario without demand. Only when the combined effects of both avoided electricity-generation GHG emissions and landscape carbon fluxes including processing GHG emissions are accounted for, can a GHG emission parity point be established (i.e., when accumulated carbon GHG emissions for the bioenergy scenario equal the baseline scenario; Mitchell et al., 2012). However, the impact of the Drax pellet mills on the surrounding forest carbon stocks has been little understood. Previous studies with regional relevance that include landscape carbon stocks either focused on generic plantation assumptions (Dwivedi et al., 2016, 2019; Hanssen et al., 2017; Jonker et al., 2018), did not use existing landscape conditions (Hanssen et al., 2017), or were driven by economic assumptions and models rather than on-the-ground knowledge regarding short-term forest owner choices (Galik and Abt, 2015; Wang et al., 2015; Duden et al., 2017). Others focused on historic forest stock changes with increasing pellet production, therefore forgoing clear attribution of cause and effect (Dale et al., 2017). Therefore, the goal of this study was to provide a comparative C LCA for bioenergy feedstocks derived from new pellet mills in the southern US and consumed at electricity facilities in the UK compared to a feasible forest management and energy scenario without bioenergy demand. The study uses data that represent current forest conditions and models that project management implications over time.
Through a subsidiary known as Drax Biomass, one of UK’s largest electric stations, Drax Power, owns and operates three pellet mills across Mississippi and Louisiana (Figure 1). The plants have an annual nameplate capacity of 450,000 (LaSalle) to 525,000 (Amite, Morehouse) Mg of wood pellets (Drax Biomass LLC, 2019). Morehouse and Amite were greenfield plants built by Drax. LaSalle was acquired from German Pellets in 2017. While current feedstock volume for all three mills is reported to be less than approximately 20% sawmill residuals and 80% tree length logs, we assume that LaSalle is expected to derive up to 50% of its feedstock from sawmill residues in the near future; partly supplied by a co-located sawmill (Biomass Magazine, 2019). To generate a robust carbon LCA, it is important to integrate an understanding of the landscape forest carbon dynamics in the presence and absence of these pellet mills.
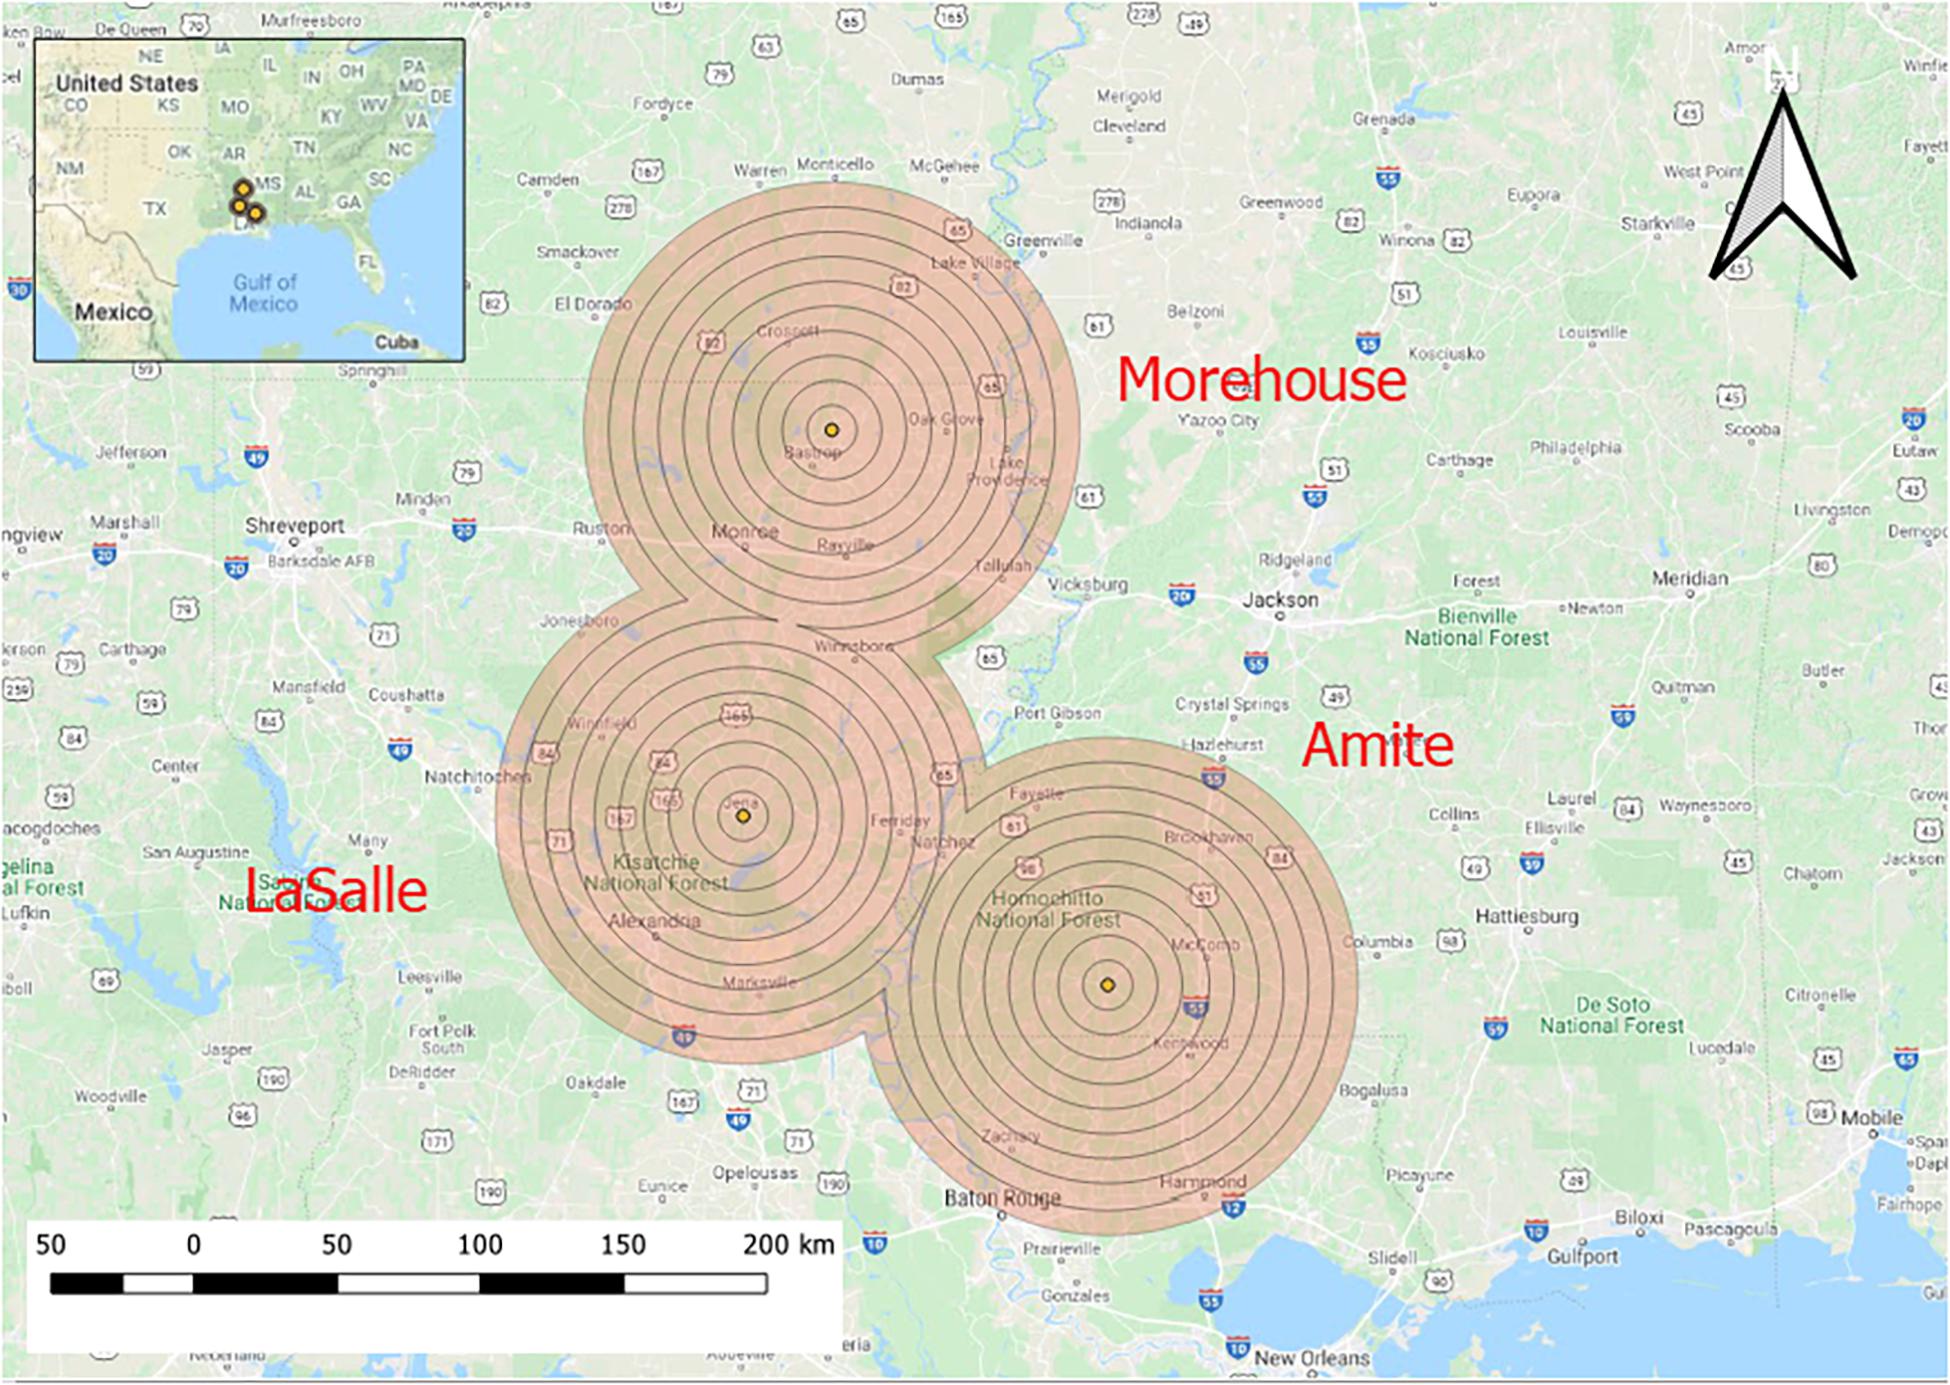
Figure 1. Drax pellet plant locations in Louisiana and Mississippi with an 80 km supply radius.
Defining appropriate baseline and alternative scenarios is essential for a consequential LCA to support decision-making (Figure 2). Our analysis comprised carbon stocks and flows (i) in the forest (including forgone sequestration), (ii) during product processing and transport for all products and post-use for both short-lived and durable wood products, as well as (iii) avoided electricity generation emissions from fossil fuels for electricity generation. The type of woody feedstock and forest management practices are strong drivers of bioenergy-associated GHG emissions (Walker et al., 2013; Gunn and Buchholz, 2018). We screened industry documents (SBP, 2019a,b,c) for pellet mill specific feedstock categories. These documents provide large brackets (20% steps) for primary (forest-sourced), secondary (industry-sourced such as from sawmills), and tertiary (post-consumer sourced) feedstocks. Hence, as with other recent studies (e.g., Hanssen et al., 2017), we consulted regional experts to verify this to develop plausible “baseline” and “bioenergy” scenarios to form the forest carbon stock basis of our comparative analyses. We identified loggers, foresters, trade and private timberland owner representatives, state foresters, US Forest Service employees, and university extension staff with expertise in biomass harvesting in the relevant Drax wood supply areas in Louisiana (all three mills), Mississippi (Amite), and Arkansas (Morehouse). Identified regional experts were contacted via email followed by a phone call (n = 7). More details on the regional expert selection process and the conclusions are provided in Supplemental Information (SI1). GHG emissions associated with planting and maintenance (fertilizer, herbicides) were outside of the LCA boundary since differences between scenarios were assumed to be marginal.
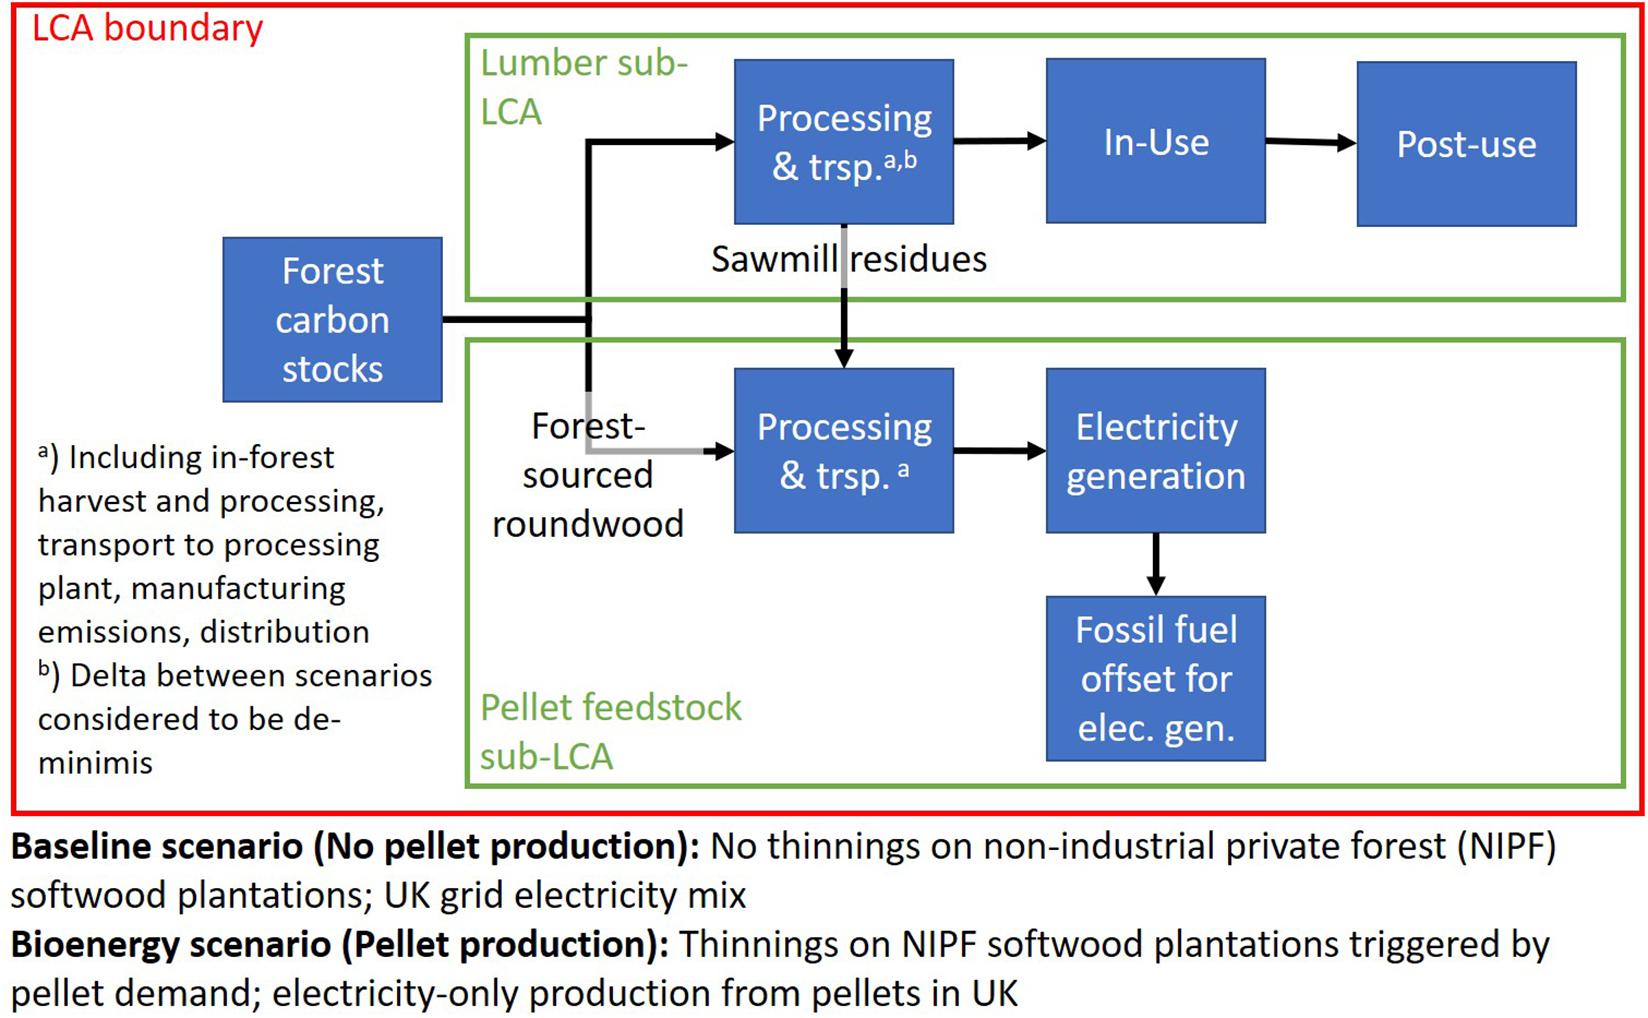
Figure 2. C LCA accounting elements (blue) and boundaries (red, green) as deployed in this study. A full C LCA was run for both the baseline and bioenergy scenarios, including both sub-LCAs (lumber and pellet feedstock). C in durable wood products (as shown in the Lumber sub-LCA) was tracked for the baseline scenario as well because both scenarios impact wood harvested for lumber due to differences in forest management.
NIPF land constituted around 50% of the landscape around each pellet mill (see also Table 3). Based on the regional expert results, we concluded that the mills in the study area derive most of their feedstock as forest-sourced roundwood (stem section of a tree with merchantable dimensions, i.e., excluding tops) meeting pulp dimension requirements from pine plantations owned by NIPF landowners. This finding is further supported by a recent survey of pellet mill procurement staff in the study region (Kittler et al., 2020) which found that between 70% and up to 99% of primary (forest-sourced) feedstocks were typically derived from NIPF even for large-scale pellet mills. NIPF pine plantations were originally established to provide timber and pulp at an optimal production cycle with one mid-term thinning and one final clearcut harvest. Thinning activities would be predominantly financed through sales of small-diameter boles destined for the pulp market. While this model worked in previous decades, the well-documented oversupply of the current and (at least) medium term pulp market does not provide sufficient demand and therefore funds for these thinnings (Dezember, 2018; SBP, 2019a,b,c). In consequence, survey results suggest that thinnings are largely forgone on NIPF pine plantations in the absence of a market for pellet feedstock (“baseline scenario”). Survey results further validate statements elsewhere (SBP, 2019a,b,c; Kittler et al., 2020) that NIPF are a primary supply base for Drax plants since larger industrial timberland owners frequently have long-term supply agreements with pulp mills (Supplementary Information SI1). Respondents suggested that these contractual relationships between pulp mills and large industrial landowners place non-industrial forests at a competitive disadvantage for accessing those market outlets for pulpwood produced in thinnings and final harvests (Kittler et al., 2020). Feedstock demand from pellet mills enables NIPF pine plantation owners to thin plantations at intervals appropriate to maximize productivity in terms of timber production (“bioenergy scenario”). In the absence of the pellet mills, established NIPF pine plantations would tend not to be thinned until the final clearcut harvest. This survey outcome and scenario selection is supported by other recent studies with regional relevance (Howes et al., 2016; Hanssen et al., 2017). For instance, Howes et al. (2016) analyzed the likelihood of over 40 feedstock scenarios in North America and considered only three as likely including a scenario where additional thinnings and a reduction in rotation length would be triggered in existing pine plantations in the southeastern US. Both the baseline and bioenergy scenarios assumed no change in the durable wood products supply chain besides changes in volume due to a change in forest management (Figure 2).
Non-sawlog biomass from both thinnings and the final harvest can also serve as pellet feedstock. This feedstock includes roundwood sections that would not meet sawlog standards (e.g., diameter, wood quality, length) and can overlap with typical pulpwood specifications. Feedstock from thinnings and final harvests can also include tops and branches. However, the responses from the survey suggests strongly that tops and branches (“harvest residue”) are rarely chipped and extracted from the region’s forests. This assumption is further supported by findings in other studies (e.g., Howes et al., 2016; Giuntoli et al., 2020; Kittler et al., 2020). The dominant regional practice is to return harvest residues back to the forest as driving mats on skid trails, to prevent soil erosion along streams, and to provide wildlife habitat (B. Kittler, pers. com.). Therefore, we excluded harvest residues as a feedstock source for pellets in the analyses below.
Our study only considers existing plantations and we assume there would be no new conversion of natural forest to loblolly pine (Pinus taeda) plantation. This assumption is based on our findings that USDA Forest Service Forest Inventory and Assessment (FIA) inventory data and the model results described below show that wood supply in existing plantations is sufficient to support all three mills without requiring additional land conversion to plantation forests (Table 1). However, existing NIPF plantations likely would be re-established at the end of the typical rotation period. NIPF timberland is partly managed for smaller diameter sawtimber and pole production (i.e., a regeneration clearcut harvest is applied starting at year 20; see Supplementary Information 1).
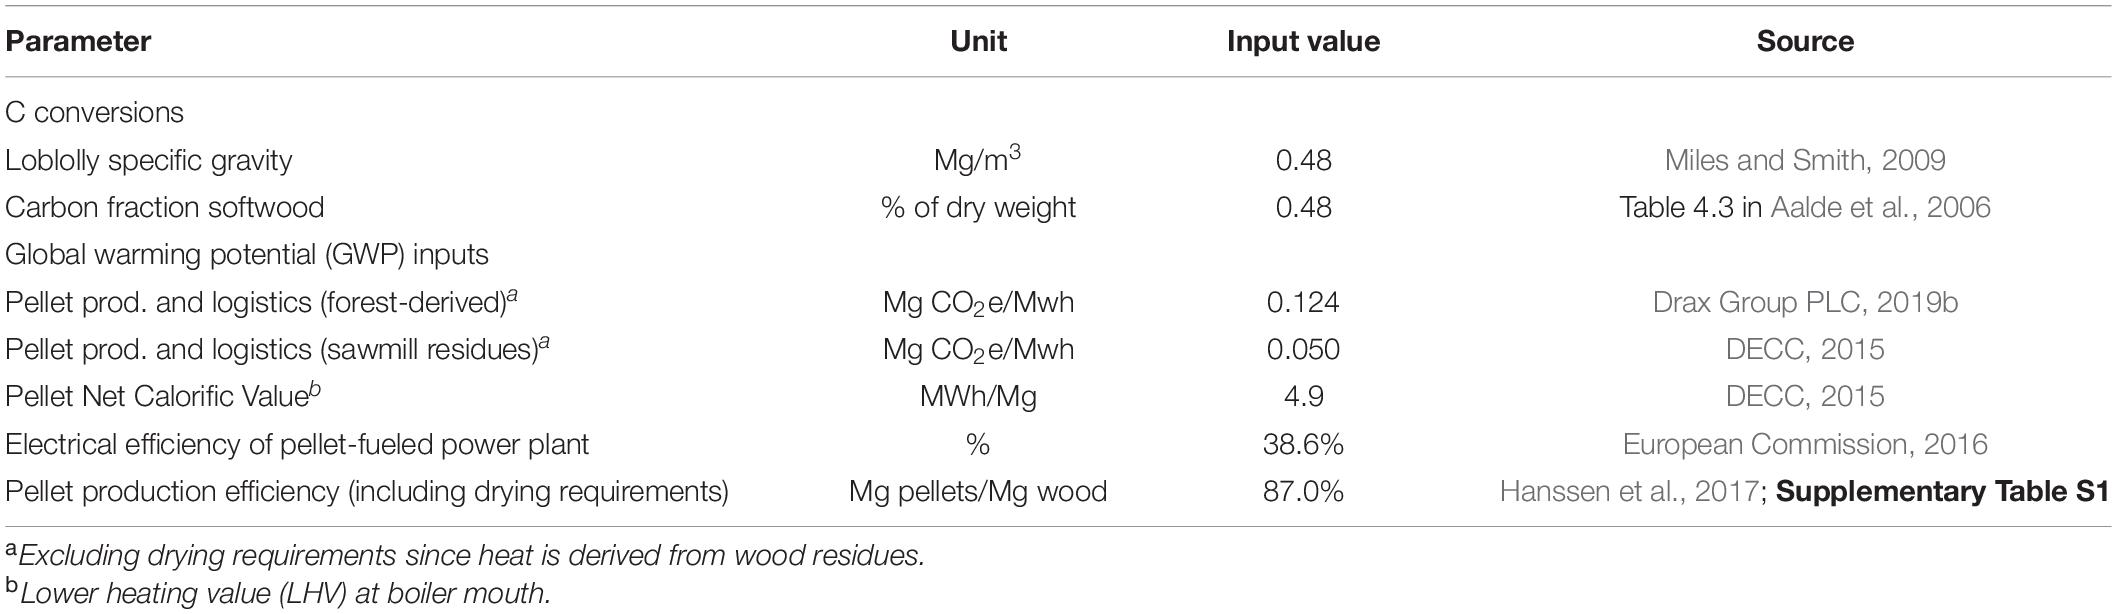
Table 1. Key carbon LCA parameter for pellets produced at Drax mills in the southern US and consumed at Drax electricity plants in the UK.
Pine plantation management guidelines in this region are not optimized for maximum sawlog output, but instead are optimized for maximal financial return. This management structure rewards short-term net cash flows through discounting, rather than maximizing net cashflow over an entire rotation period. As a result, this structure incentivizes mid-rotation thinnings, which provide both early cash flow from selling pulpwood or pellet feedstock, as well as a limited amount of small diameter sawlogs where removed trees already meet sawlog dimensions.
Typically, Loblolly pine is planted at a density of 988–1,853 trees per ha and a single thinning is applied around year 12–15 (maximum range of 11–18 years) lowering basal area to 16–18 m2/ha. To reflect smaller log dimensions accepted as pellet feedstock compared to default pulpwood dimensions in the region, we modeled removal and processing of min. 3.6 m logs with a top diameter of 3.8 cm.
We assumed an 80 km radius supply distance for each Drax pellet mill (SBP, 2019a,b,c). The USDA Forest Service maintains national-level continuous forest inventory dataset through the Forest Inventory and Analysis Program (FIA). Each plot represents roughly 2,400 ha and is re-measured every ∼5 years. These plots are useful in representing the current condition of the forest landscape within a specified geography. To get a snapshot of current conditions, we downloaded FIA data for Arkansas, Louisiana and Mississippi from the FIA DataMart (FIA, 2018). We selected FIA plots (n = 1,174) representing over 2.8 million ha in softwood plantations on non-industrial private forests inventoried between 2007 and 2018.
We conducted growth and harvest simulations using the USDA Forest Service Forest Vegetation Simulator Southern Variant (FVS-SN; USFS, 2020). FVS is an individual tree-based forest growth model that uses tree lists to model the response of stands to silvicultural prescriptions for a desired period. FVS is a widely used tool in forest management decision-making throughout the US (e.g., Nunery and Keeton, 2010; Bryant et al., 2019; Chen et al., 2019; Gunn et al., 2020) and is an accepted modeling tool in the primary carbon offset methodologies (e.g., California Air Resources Board and American Carbon Registry). The FVS Fire and Fuels Extension allows above- and below-ground forest carbon stocks (both dead and alive) to be tracked separately over time. Plot-level FIA data are used within FVS to represent conditions of forest stands within the study landscape. The following in-forest carbon pools were tracked through FVS: aboveground total live, belowground live, belowground dead, standing dead, forest floor, forest shrub and herb. FVS further provides standardized outputs for harvest volumes specified by wood product requirements for sawlogs and pulpwood (species, dimensional aspects, quality). In a last step, FVS associates wood product specific conversion efficiencies in sawmills and region-specific wood products (lumber, composite panels, etc.) based on lookup tables (Smith et al., 2006) and tracks carbon stocks associated with wood products as they cascade through in-use to post-use pools such as landfills.
We ran FVS simulations for 40 years starting in 2019. We chose this near-term time horizon to avoid uncertainties that compound with long-term projections including climate change impacts since the FVS Southern Variant does not yet include a climate change component, though relevant research exists (e.g., Thomas et al., 2018). Although FVS is capable of modeling for long time periods, empirical tests have shown 30–50 years as a preferable analytical time frame (e.g., Yaussy, 2000). In addition, the time frame is most relevant to pellet market policy drivers that recognize the urgency to reduce GHG emissions in the near term (IPCC, 2018). We modeled two forest management scenarios: The baseline scenario (“No thinning scenario”) simulated management practices in the absence of pellet mills where thinnings would be forgone in the absence of markets for the generated biomass. The “bioenergy scenario” assumed that the thinnings were implemented since the pellet feedstock market generates enough revenue to implement the thinnings. Planting density and rotation length were kept the same for both scenarios. Final harvest was modeled when the stand age reached 25 years (or if stand age exceeded 25 years of age at the beginning of the simulation period).
We assumed a clearcut for a final harvest followed by uniform planting at a density of 1,730 loblolly pine trees per ha2. Thinning operations assumed “thinning from below”3 across the entire diameter at breast height (DBH) range (i.e., from > 0 cm DBH) to a residual basal area of 16 m2/ha (resulting in a removal of around one third to one half of all trees). Thinning occurred at the beginning of the cycle at year 15 in the ‘bioenergy scenario’ but not in the baseline scenario. Planting occurred at the end of the cycle at year 25 for both scenarios. See Supplementary Information 2 for more details on forest inventory data as well as growth and yield modeling parameter.
We focused only on NIPF pine plantations as the forest-derived feedstock plus a fraction derived from sawmill residues4 (conservatively modeled to be 20% for Amite and Morehouse; 50% for LaSalle which is co-located with a new sawmill; see section “Forest Inventory Data and Biomass Potential” and SBP, 2019b). Therefore, the results translate to a mill-specific carbon footprint for a given unit of produced pellets. We further used both the 2018 UK grid mix and a 2025 UK grid emission profile for electricity generation as baseline for electricity production (Table 2).
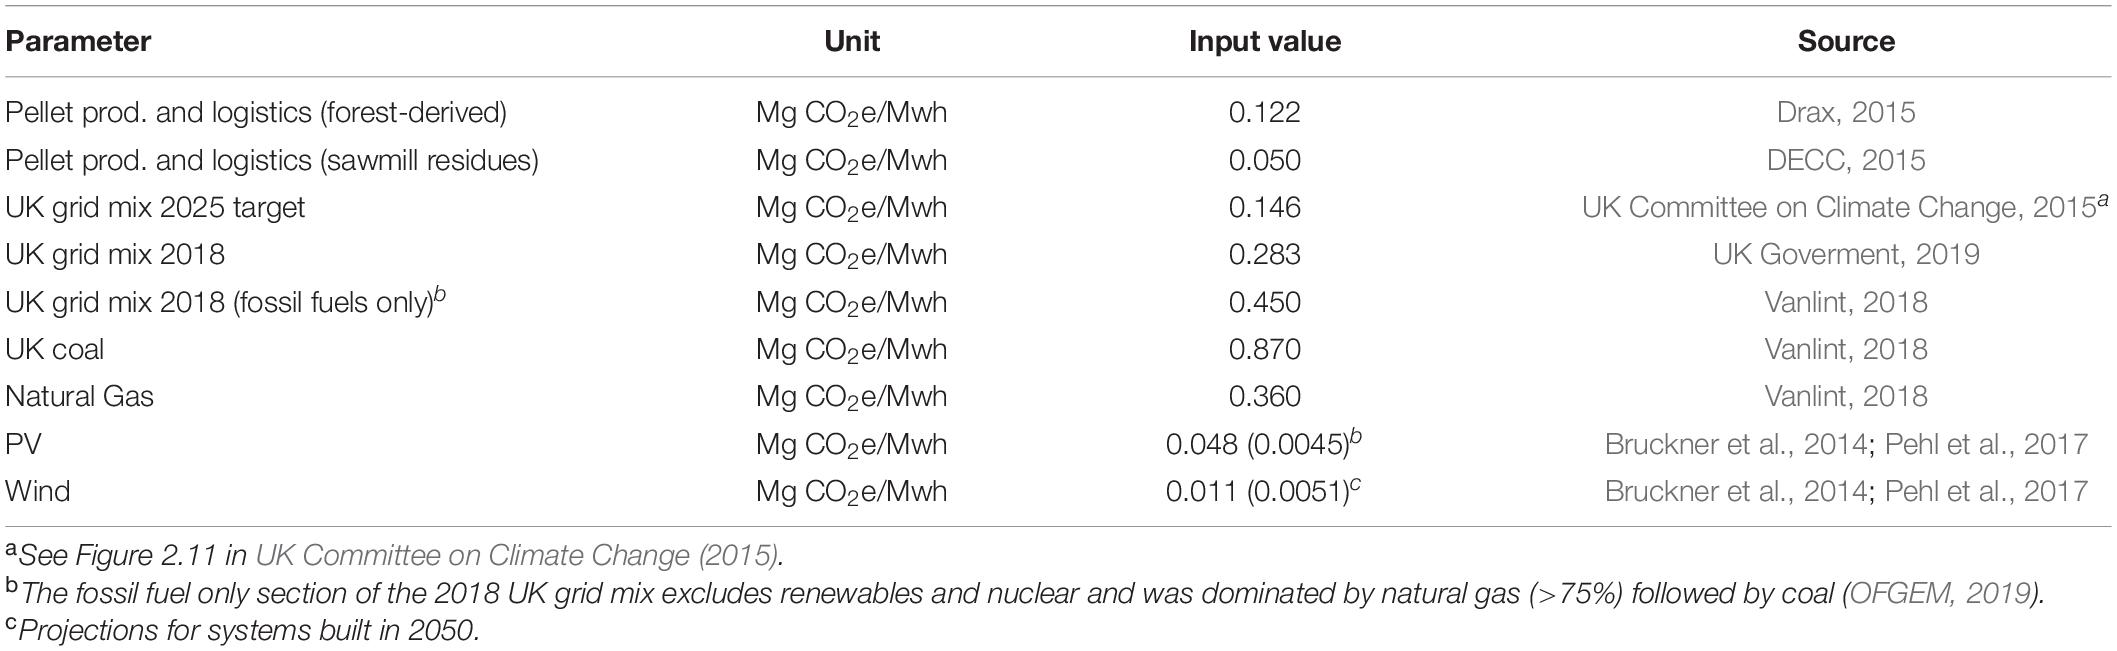
Table 2. Selected electricity (grid) emission profiles with relevance to the UK.
The carbon footprint of electricity generation should be evaluated using state-of-the-art or near-future generation systems. Such systems include combined heat and power options, wind and solar potentially coupled with electricity storage systems, or a dynamic electricity grid mix representing an increasing share of low-carbon electricity (Macintosh et al., 2015). For this reason, we employed both the current UK grid mix (2018) and a forward-looking baseline emission profile (0.146 Mg CO2e/MWh) based on the official UK electricity grid emission target for 2025 (UK Committee on Climate Change, 2015). The 2025 target is a reduction of around 50% from the 2018 UK electricity grid emission profile of 0.283 Mg CO2e/MWh (UK Goverment, 2019).
The total accumulated carbon balance covered in this LCA included forest carbon stocks (in baseline and bioenergy scenarios), wood product stocks (carbon stored in region-specific long-lived forest products), as well as avoided electricity generation GHG emissions from fossil fuels for electricity generation (see Figure 2).
Besides including forgone in-forest carbon sequestration under an increased harvest scenario, FVS can provide a full carbon LCA including in-use and post-use wood product (WP) carbon pools based on regional forest product data from Smith et al. (2006). However, our analyses required a customized WP carbon LCA since an alternative use of pulp-grade biomass as bioenergy feedstock is not considered in Smith et al. (2006). We also used Smith et al. (2006) for forest industry products data and disposition of carbon in industrial roundwood data relevant for the southeast and substituted forest-derived pulp-grade WP pool residence times with the assumption of immediate (i.e., burned for electricity generation within 1 year) carbon release following harvest.
Attributing emissions is challenging in the context of forest-based bioenergy systems since harvest activities in one time period can impact carbon stocks and fluxes several decades into the future through e.g., a consequential change in growth patterns, harvested wood products and associated half-lives etc. Formula 1 provided the basis to track GHG emissions in 5-year time periods for the entire 40-year timeframe analyzed while Formula 2 was used to calculate (avoided) baseline emissions.
Where:
Enetp1–n: Accumulated net emissions bioenergy scenario over baseline scenario for time period 1 to n (Mg CO2e)
EF: Accumulated net forest carbon emissions for time period 1 to n (Mg CO2e)
EWP: Accumulated net wood products emissions for time period 1 to n (Mg CO2e)
EP&T: Accumulated net emissions associated with pellet production and transport for time period 1 to n (Mg CO2e)
EAE: Accumulated net emissions from avoided baseline electricity generation for time period 1 to n (Mg CO2e)
Where:
EAE: Accumulated net emissions from avoided baseline electricity generation for time period 1 to n (Mg CO2e)
VP: Pellet volume utilized for electricity generation for time period 1 to n (Mg)
CVP: Calorific value pellets (MWh/Mg)
Cef: Electrical efficiency of pellet-fueled power plant (%)
EfBSL: Baseline emissions profile to generate electricity (Mg CO2e/MWh)
NIPF pine plantations totaled over 2.8 million ha for all three wood supply areas combined and constituted around 50% of the landscape around each pellet mill (Table 3). The 80 km radius wood supply areas only marginally overlapped.
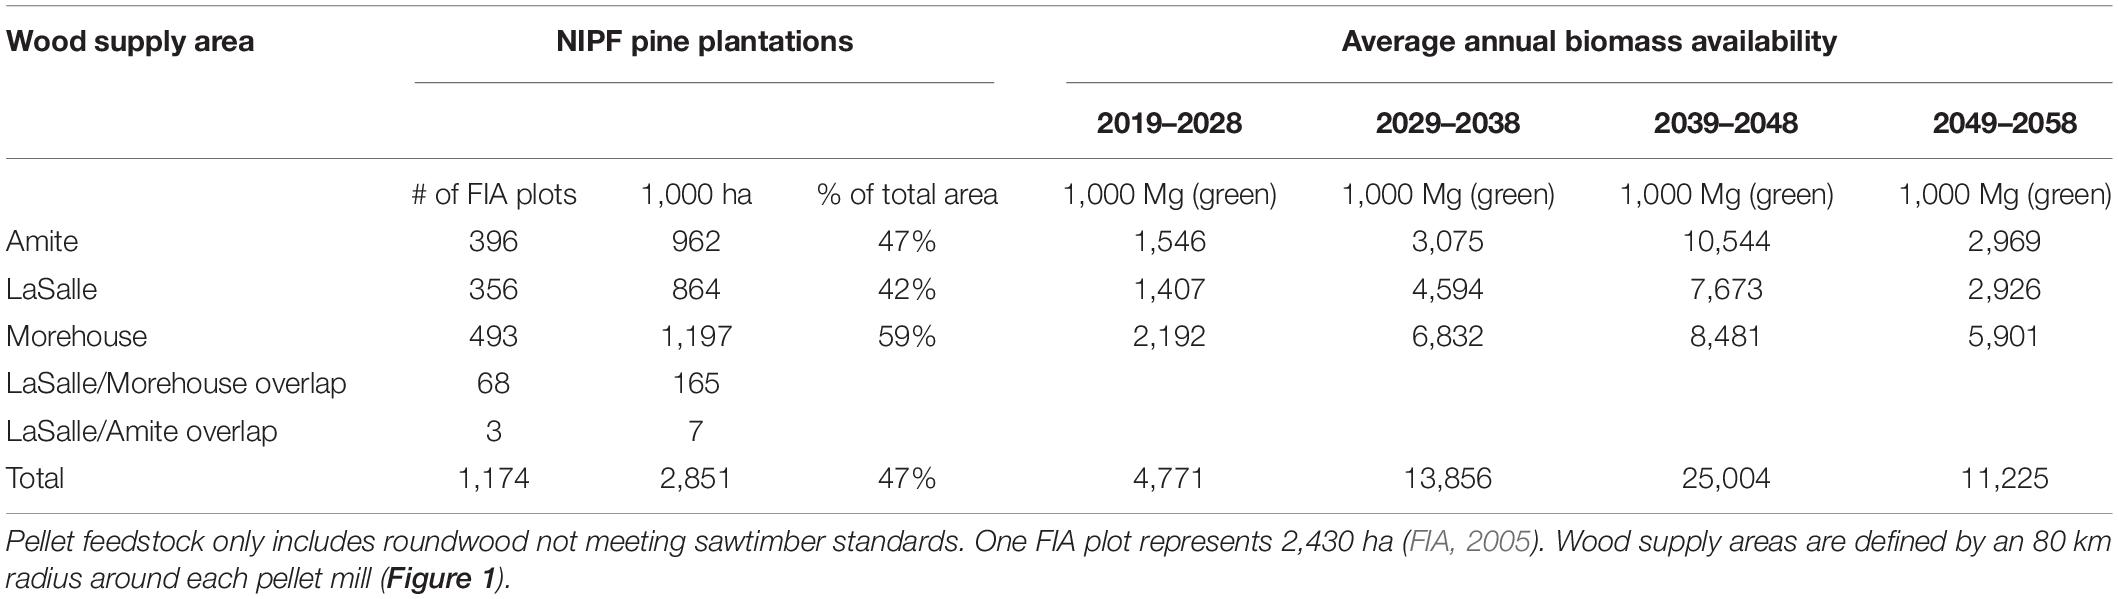
Table 3. Potential pellet feedstock supply (and FIA plot coverage) for NIPF pine plantations by wood supply area.
Our modeled wood supply projections for the bioenergy scenario (see also section “Materials and Methods”) exceeded total pellet mill demand for each area for any given 10-year period5. These projections assume starting with current inventory levels on NIPF pine plantations managed on a 25-year rotation.
Based on the FIA data input, FVS default values and pine plantation management descriptions detailed above, our analysis suggests that NIPF pine plantations produced on average 38 Mg (green; 50% moisture content on a wet basis) and 162 Mg (green) of non-lumber pellet feedstock per ha per thinning and final harvest, respectively. The three Drax pellet plants combined require around 2.45 million Mg (green) of forest-sourced feedstock annually–excluding the industrial residues they are currently receiving6. This annual volume can be provided by thinning around 64,000 ha of NIPF softwood plantations or from around 15,000 ha final harvests7.
Forest carbon stocks fluctuated over the 40 years due to irregular age-class distributions but showed a consistent reduction in both forest and wood products carbon stocks under a bioenergy (thinnings) scenario vs. the baseline (no thinnings) scenario (Figure 3). Following an initial decline from increased harvest (thinning) activity in the bioenergy scenario, forest carbon stocks for all three wood supply areas combined eventually stabilized. All were still below the baseline (no thinning scenario) within the 40-year model period. Results are dominated by changes in forest carbon stocks. Carbon stored in wood products is less significant (in total and in comparison between scenarios). Figure 3 shows an initial drop in forest stocks (baseline vs. bioenergy scenario) over the first 10 years after the thinnings. The delta in forest carbon stocks between the two scenarios continues to be noticeable throughout the analyzed timeframe. Both scenarios show a long-term trend to increase forest carbon stocks over time. However, the bioenergy scenario continues to maintain lower forest carbon stocks than the baseline scenario because of the initial decrease in growing stock through thinning and a continued higher harvest rate under the bioenergy scenario. SI3 provides detailed annual numerical data by mill.
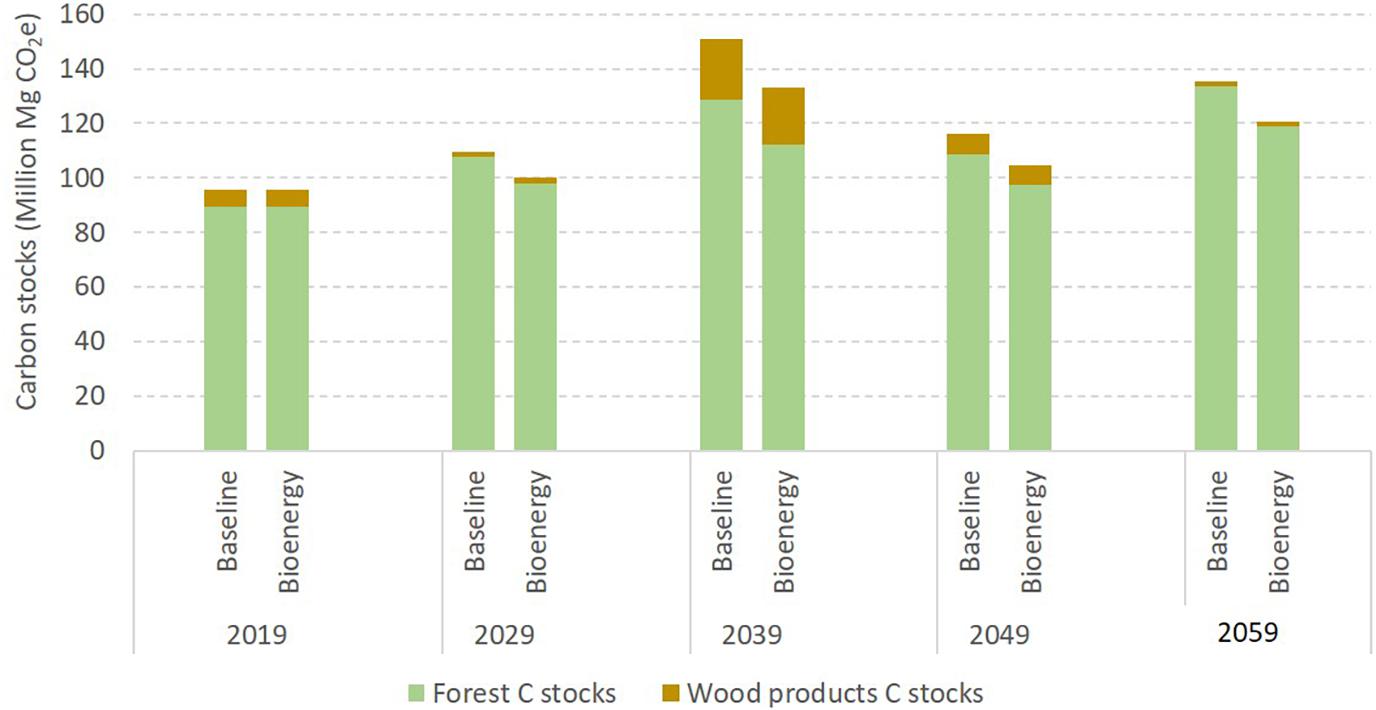
Figure 3. Forest carbon stocks on NIPF pine plantations in the accumulated feedstock supply areas of the three Drax pellet mills under a baseline (no thinnings) and bioenergy scenario. Results are dominated by changes in forest carbon stocks. Forest and wood product carbon stocks for pellet mill specific supply areas follow a similar pattern (see Supplementary Figures 1–3).
The observation of higher forest carbon stocks over time under a lower harvest level scenario is well documented for forest carbon stock dynamics in general (Ryan et al., 2010, p. 7; Noormets et al., 2015). While individual trees typically show an increased growth rate following a thinning (directing net primary productivity to higher-value sawlogs), net primary productivity and therefore carbon sequestration for the entire stand decreases.
Interestingly, wood product carbon stocks slightly decrease (2–8% in decadal steps) under a bioenergy/thinning scenario. In this context, it is important to recall that thinnings are designed to provide maximum net present value, and hence, early cash flow. Sawlogs are harvested alongside pellet feedstock during these thinnings (see section “Forest Management Baseline and Bioenergy Scenario Development” “Plantation Management”). While thinnings provide additional sawlogs at that earlier stage, the total volume of sawlogs under the bioenergy scenario (derived from both thinnings and final harvest) is less than the sawlog volume under the baseline scenario. While more higher value sawlogs are harvested under the baseline scenario (no thinnings), the associated future cashflow is highly discounted, and hence, this scenario is less attractive for a timberland owner from a net present value perspective.
Forest and wood product carbon stocks for pellet mill specific woodsheds follow a similar pattern as shown in Figure 3. Total accumulated carbon balances (i.e., the changes from the baseline to the bioenergy scenario) were dominated by forest carbon stock change (Figure 4).
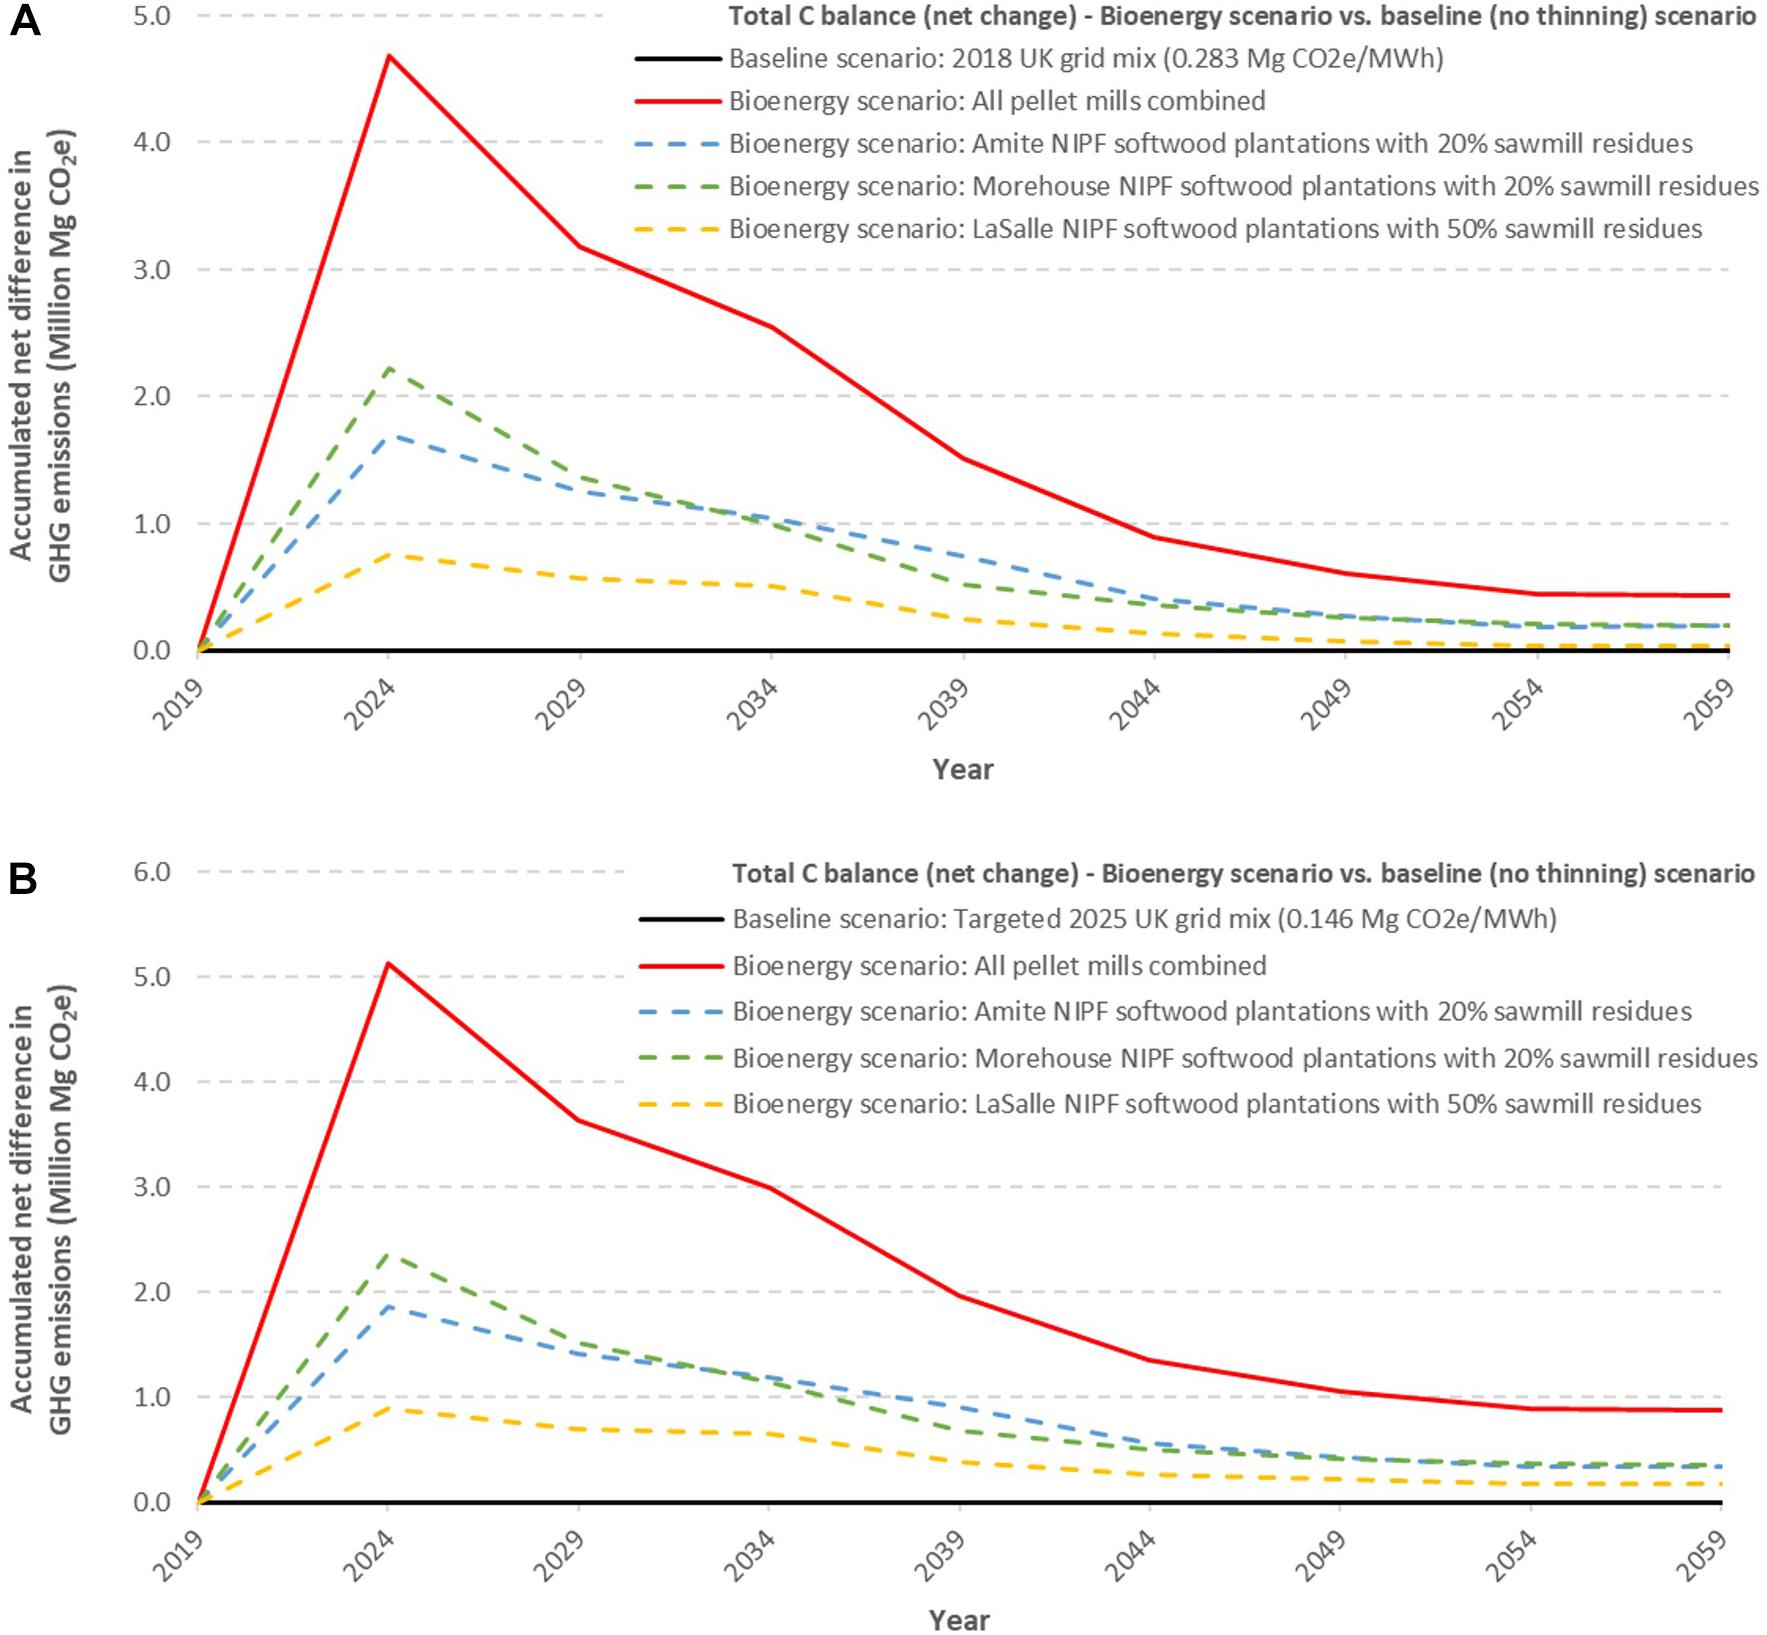
Figure 4. (A) Forest carbon stocks on NIPF pine plantations in the accumulated feedstock supply areas of the three Drax pellet mills under a baseline (no thinnings) and bioenergy scenario. Results are dominated by changes in forest carbon stocks. Forest and wood product carbon stocks for pellet mill specific supply areas follow a similar pattern (see Supplementary Figures 1–3). (B) Net difference in GHG emissions of bioenergy vs. baseline scenario combinations. This graph plots the net difference between bioenergy scenarios and the no thinning baseline scenario. While the baseline is associated with net GHG emissions, its GHG emissions are shown as net zero on this graph for ease of display by focusing on the delta between the scenarios. The GHG emission parity time is defined by the point in time when the total accumulated carbon balance over any given time period of the bioenergy scenario first equals the total accumulated carbon balance of the baseline (no-thinning) scenario (i.e., colored lines intersect black line). Since no intersection occurs, GHG emission parity time is not reached for any of the pellet mills.
The GHG emission parity time for all three wood supply areas combined and individually was not reached within the 40-year model period when using a 2018 and 2025 target UK grid mix emission profile as a baseline. Based on the forest carbon stock loss from thinning in comparison to the baseline without thinning, the bioenergy scenario is unlikely to reach GHG emission parity until beyond 2,060 for both electricity GHG emission baselines.
In Figure 4, we plot the net difference between bioenergy scenarios and the no thinning baseline scenario. The net GHG emission trajectories (including forest and wood products carbon stock as well as pellet production and transportation GHG emissions) are compared to a no thinning baseline scenario (in black) that assumes (a) the 2018 UK grid emission profile, and (b) a targeted 2025 UK grid emission profile. While the baseline is associated with net GHG emissions, its GHG emissions are shown as net zero on this graph for ease of display by focusing on the delta between the scenarios. The GHG emission parity time is defined by the point in time when the total accumulated carbon balance of the bioenergy scenario first equals the total accumulated carbon balance of the no-thinning scenario (i.e., the lines intersect). None of the bioenergy trajectories dropped below either the 2018 (Figure 4A) and 2025 target UK grid mix of the baseline (Figure 4B) since the GHG emission parity time is > 40 years for each mill and all mills combined.
A high initial GHG emission profile per MWh electricity produced in the first years occurs because increased harvest (thinning) activities reduce forest carbon stocks below the baseline scenario (Figure 3). Only the LaSalle pellet mill, when modeled at 50% sawmill residues to reflect the expected future feedstock mix, gets close to GHG emission parity by year 40 when compared to the 2018 UK electricity grid mix (Figures 4A, 5).
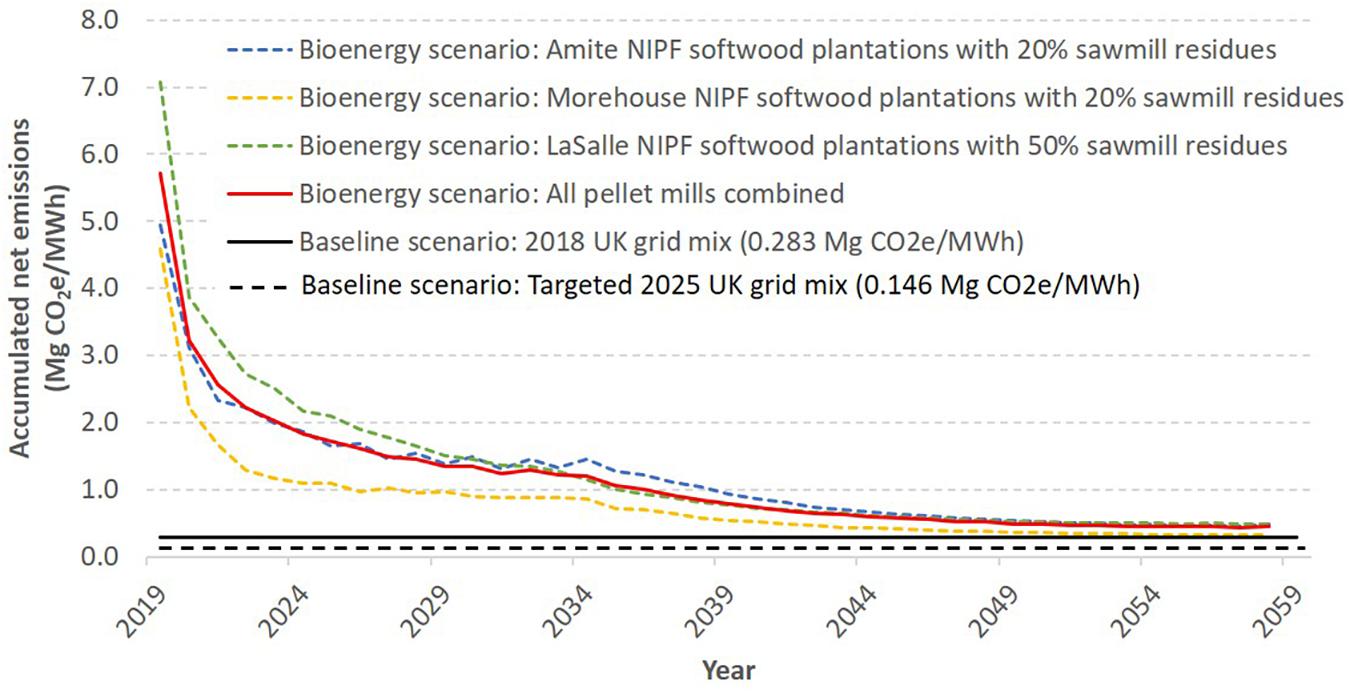
Figure 5. Accumulated net GHG emissions per MWh of electricity produced in the UK with pellets from Drax’s mills in the southeastern U.S compared to a baseline scenario using the 2018 grid mix (black solid line) and the targeted 2025 UK grid emission profile (black dashed line).
An identical picture is provided in Figure 5 using accumulated net GHG emissions per MWh electricity generated over any given time period as a metric. Over time, GHG emissions per MWh from pellet-generated electricity decrease but do not reach GHG emissions from the 2018 or targeted 2025 UK grid mix over the 40-year time period analyzed—i.e., GHG emission parity is not reached within 40 years under either baseline scenario. An initial steep drop in accumulated net GHG emissions per MWh over the first 5 years occurs because the initial increase in harvest activities decreases forest carbon stocks below the baseline scenario. This steep drop is followed by a gradual recovery as forest carbon stocks stabilize at a lower level than the baseline scenario, and the recovery is accompanied by a yearly increase in the cumulative MWh of electricity produced from wood pellets. Biomass electricity GHG emissions reach approximately 0.468 Mg CO2e/MWh by the end of the 40-year timeline.
As part of a sensitivity analysis, we analyzed the effect of overestimating bioenergy GHG emissions. Even if our calculations overestimated GHG emissions associated with the bioenergy scenario by 10%, parity would not be reached within the timeframe analyzed for any mill. Using a higher share of renewable electricity sources such as wind or PV solar with a much lower emission profile than the targeted UK 2025 electricity grid’s mix (see Table 2) would further extend the GHG emission parity time beyond the modeled time horizon. Using natural gas as a baseline, the GHG emission parity time for pellets from all mills combined would still be beyond the 40-year timeframe analyzed, but is reduced to 31 years for a more favorable scenario such as LaSalle-sourced pellets due to this pellet mill’s high proportion of sawmill residues as feedstock.
Besides baseline electricity emission profiles, results are dominated by changes in forest carbon stocks ranging from 0.202 Mg CO2e/MWh to 6.955 Mg CO2e/MWh and average 0.987 Mg CO2e/MWh over time and by pellet mill (Figure 5). Accordingly, uncertainties or future technical innovations reducing variables such as cutting pellet processing and transport GHG emissions by half or increasing electrical efficiency at the power plant by 5% still do not yield GHG emission parity times within the 40-year timeframe for pellets from the LaSalle mill which exhibited the lowest GHG emissions profile due to its high share of sawmill residues. Considering a 40-year time horizon, GHG emission parity time shows little sensitivity toward some key input parameters (Table 4).
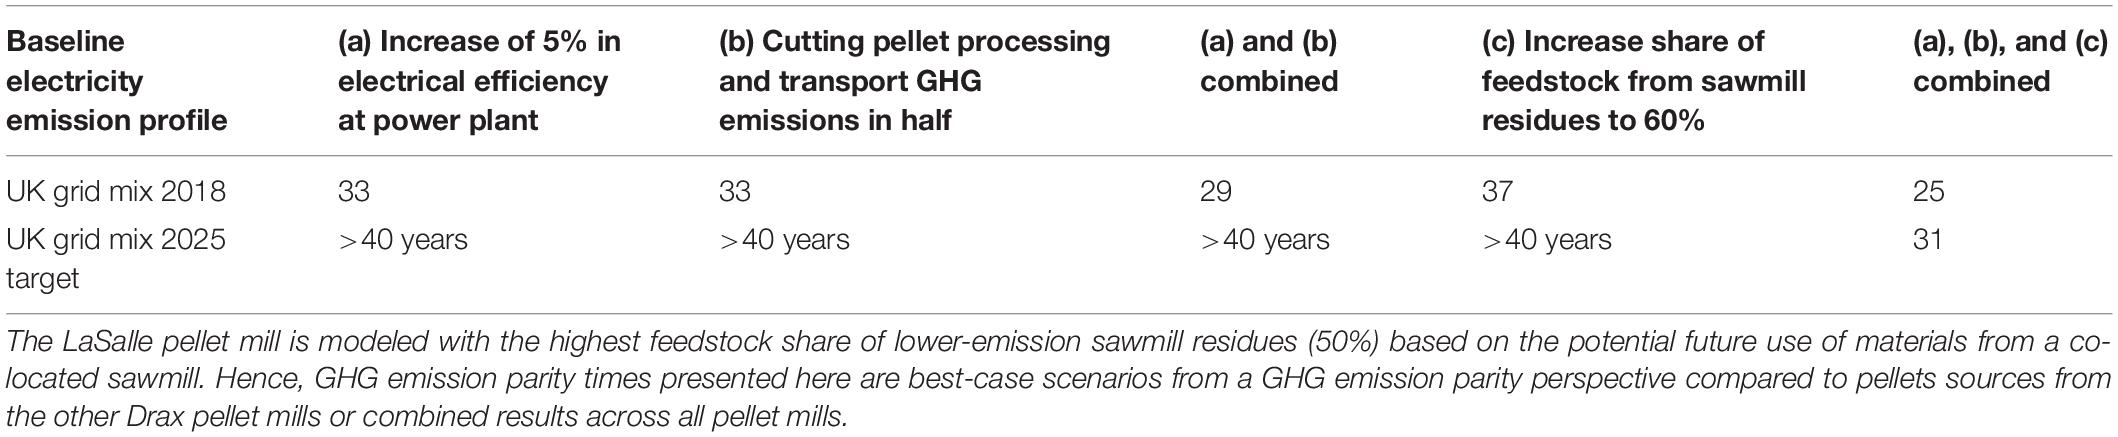
Table 4. GHG emission parity time (in years): sensitivity analysis for LaSalle sourced pellets.
From a biomass supply perspective, we consider GHG emission parity times shown in Figures 3B, 4 as conservative. Longer GHG emission parity times are likely for two main reasons: (i) we considered a high share of sawmill residues in the current feedstock mix (data suggests that current consumption of sawmill residues is less than the 20% used in this analysis) and (ii) we did not include a potential share of hardwoods in the feedstock origin which tends to prolong GHG emission parity times, though the proportion of hardwoods used as feedstocks could be significant (Buchholz and Gunn, 2015).
While there are always more scenarios to explore, we tried to focus the analyses on a likely and reasonable forest management scenario for NIPF pine plantations. This case study was selected based extensive evidence of its dominant biomass supply role through regional expert input (Supplementary Information 1) that was further supported by findings from Howes et al. (2016). Our case study is identical to one of only three reasonable scenarios out of 40 scenarios evaluated by Howes et al. (2016). Therefore, this is an important case study based on current forest inventory levels and actual pellet facilities vs. a purely hypothetical framework.
In a comparative analysis such as this, climate change that increases drought and wildfire risk in the southeastern US (Liu et al., 2013; US EPA, 2017) would likely act similarly on both the baseline and thinning scenarios during the near-term model timeframe. However, drought impacts potentially could be less severe in the thinning scenario (Shephard et al., 2021). While we were interested in the relative differences between scenarios, incorporating direct climate impacts is less important than if we were looking at independent projections of management impacts on life cycle carbon stock changes.
In our analysis, electricity generation from wood pellets does not provide short- to medium-term climate benefits if pellet markets trigger harvest activities that would not have occurred in the absence of pellet demand. Our survey results from local forest experts provide insights into forest management decision making under a widespread current regional oversupply of softwood pulp and timber (Dezember, 2018; SBP, 2019a,b,c). The C LCA result is further in line with C LCA outcomes for forest-based biomass electricity systems located in the southeastern US (Colnes et al., 2012; Sterman et al., 2018) and other regions (Walker et al., 2013; Nabuurs et al., 2016). Region-specific studies suggesting short-term climate benefits of plantation-sourced pellets for electricity generation frequently employ basic and generic plantation growth models that fail to incorporate existing forest carbon stocks based on current conditions and irregular age class distribution and do not account for tree-level growth responses to the impact of additional harvests prompted by the pellet market (e.g., Dwivedi et al., 2016, 2019; Hanssen et al., 2017; Jonker et al., 2018). Studies employing economic forecasting models (e.g., Southern Regional Timber Supply Model, Forest and Agriculture Sector Optimization Model with Greenhouse Gases, Latta et al., 2013) simulate responses of market actors to a change in biomass prices (through increased planting activities on previously non-forest lands) and frequently conclude near-term climate benefits for pellet-based electricity generation (Galik and Abt, 2015; Wang et al., 2015; Duden et al., 2017). With specific reference to the southeastern US, Giuntoli et al. (2020) provides evidence that such market-driven forest management assumptions resulting in climate benefits from forest-based bioenergy systems “are too optimistic, at times outright unrealistic.” The fact that current wood supply in the analyzed region exceeds demand (Dezember, 2018) further challenges economic modeling approaches that suggest a growing pellet industry could trigger new tree plantings (Baker et al., 2019) at least in the short term which is increasingly seen as key to impact climate trends. We argue that our C LCA results are more robust since they are based on validated ecology-focused growth models in the first place and economic decision making is based on documented and short-term decision making by real actors in the southern US.
What further affects results for all above mentioned studies is the comparison to coal-generated electricity or current (high carbon) grid electricity mixes as a baseline. Evidence points toward other alternative energy sources with a much lower carbon footprint than coal competing with bioenergy systems for new installations (York, 2012; Macintosh et al., 2015). Our assessment evaluated both the current UK grid electricity mix and a feasible aspirational mix.
Besides the two limitations mentioned in section “Forest Management Baseline and Bioenergy Scenario Development” (share of sawmill residue in feedstock mix; only pine considered), other caveats should be considered in this study that could affect results. First, we simulated only one generalized forest management scenario for NIPF pine plantations based on literature and survey results (see Supplementary Information 1). However, NIPF owners would likely vary somewhat from the exact prescription used in the models. Since the median stand age of all FIA plots considered in this analysis was 25 years, this indicates that a considerable fraction of plantations is currently being managed using rotations exceeding 25 years. If this is the case, we would expect possibly an extension of GHG emission parity times since longer rotations would mean a higher average carbon stock across the landscape.
Data strongly suggests that the pellet mills in the study area derive most of their forest-sourced feedstock from NIPF (see section “Forest Management Baseline and Bioenergy Scenario Development” “Pellet Mill Feedstocks”). Limited industry-derived information suggests that a sizable share of forest-sourced pellet feedstock is derived from industrial timberlands rather than NIPF (e.g., SBP, 2019b). If this is currently the case, we would expect a marginal decrease in GHG emission parity times due to increased growth rates in plantations that are managed more intensively. In contrast, future shifts away from NIPF toward industrial timberland feedstock sourcing (e.g., triggered through a change in pulp market conditions) would not affect results presented here since current activities (initialization of thinning activities) are the driving force behind the presented results (see e.g., initial forest carbon stock decrease in Figure 3) rather than a continuous additional harvest.
There is some concern about potential methane GHG emissions from wood chip piles generated while the organic material begins decomposing under compost conditions (Röder et al., 2015). However, we did not consider methane GHG emissions from wood chip piles prior to pellet processing because empirical data are lacking. Of the few field-based studies on the topic, Ferrero et al. (2011) did not find any methane GHG emissions during actual measurements on pine wood chip piles in Germany over 150 days. In another Finnish study using measurements from (non-wood) compost piles, Wihersaari (2005) derives a methane emission rate of 24 g/m3/day for wood chip piles. Assuming a 60-day storage period before conversion to pellets, this assumption would result in an additional 0.095 Mg CO2e/MWh for pellet electricity8; adding 20% to total bioenergy GHG emissions of 0.468 CO2e/MWh over a 40-year time horizon (see Figure 5). These contradicting results among a paucity of studies prevents us from considering this factor in this analysis.
The alternative fate for sawmill residues in this analysis (if not used for pellet production) was considered to be immediate carbon release (i.e., within 1 year) following harvest. While a large fraction of sawmill residues is frequently used to satisfy on-site process-heat demand (e.g., drying of wood), the remaining fraction of sawmill residues typically has little to no market value for short-lived products such as animal bedding or landscaping products. Even when used for these products, GHG emissions could be considered immediate. Sawmill residues used in pellet production do not fulfill quality thresholds for longer-lived products (e.g., particle boards). For some sawmills, the total output is either too small to justify a processing line for longer lived products or is too remote to ship residues of appropriate quality to processing facilities at a competitive price.
To improve climate benefits of bioenergy systems, scientific consensus converges when the feedstock consists of secondary industrial residues (e.g., sawmill residues) or carbon bound in forest biomass that would be released immediately in the absence of its energetic use (e.g., burned in piles at the harvest site). Further effective options to improve results from a climate perspective include increasing use-efficiencies (heat only or combined heat and power applications) or deriving feedstock from newly established biomass plantations (González-García et al., 2013) rather than increased harvest rates (such as additional thinnings or shortened rotations). In contrast, long-distance supply chains involving intercontinental shipping have a smaller impact on bioenergy GHG emission profiles. However, bioenergy supply chain emissions still far exceed other (renewable) electricity generation alternatives, such as wind and solar (Table 2).
GHG emission discounting is another important but yet-underutilized policy tool to deal with temporal differences in GHG emission reductions between analyzed scenarios (Timmons et al., 2016; Sproul et al., 2019; Bachmann, 2020). Considering the urgency to reduce near-term GHG emissions to avert catastrophic climate change, near-term GHG emission reductions can be given preference (i.e., discounted). This is identical in context to financial cash flow discounting discussed in section “Forest Management Baseline and Bioenergy Scenario Development” “Plantation Management.”
One final caveat is that softwood stands, particularly loblolly pine, are susceptible to the southern pine beetle (Dendroctonus frontalis). Louisiana, Mississippi and Arkansas are all considered a high-risk zone for southern pine beetle (SPB) outbreaks (Nowak et al., 2015). Susceptibility is largely driven by hydrological stress caused primarily by high tree densities and weather. Thinning, prescribed burning, and reduction in planting densities are recommended strategies to reduce the risk of large-scale (carbon) loss from SPB infestations (USDA FS, 2005; Birt, 2011; Nowak et al., 2015). While these strategies will result in a near-term carbon stock reduction, potential future avoided carbon stock losses from SBP outbreaks have to be discounted by the site-specific outbreak risk. There is potential for biomass energy derived from restoration thinning activities to have a better carbon LCA profile, but that will depend on the likelihood and severity of SPB outbreaks which are difficult to predict on a site-specific basis (Liang et al., 2018).
The raw data supporting the conclusions of this article will be made available by the authors, without undue reservation.
JG and TB developed the concept, methodology and analysis of this study and wrote the manuscript. BS retrieved and processed FIA data and ran the FVS models. All authors contributed to the article and approved the submitted version.
The authors declare that this study received partial funding from the Southern Environmental Law Center and the National Wildlife Federation. The funder had the following involvement with the study: commenting on an earlier version of this manuscript. Additional support to JG was provided by the New Hampshire Agricultural Experiment Station.
The authors declare that the research was conducted in the absence of any commercial or financial relationships that could be construed as a potential conflict of interest.
We acknowledge input from Brian Kittler for biomass supply assumptions.
The Supplementary Material for this article can be found online at: https://www.frontiersin.org/articles/10.3389/ffgc.2021.642569/full#supplementary-material
Aalde, H., Gonzalez, P., Gytarsky, M., Krug, T., Kurz, W. A., Ogle, S., et al. (2006). “Chapter 4 - Forest land,” in 2006 IPCC Guidelines for National Greenhouse Gas Inventories, ed. IPCC (Kyoto: International Panel on Climate Change (IPCC)).
Bachmann, T. M. (2020). Considering environmental costs of greenhouse gas emissions for setting a CO2 tax: a review. Sci. Total Environ. 720:137524. doi: 10.1016/j.scitotenv.2020.137524
Baker, J. S., Wade, C. M., Sohngen, B. L., Ohrel, S., and Fawcett, A. A. (2019). Potential complementarity between forest carbon sequestration incentives and biomass energy expansion. Energy Policy 126, 391–401. doi: 10.1016/j.enpol.2018.10.009
Bentsen, N. S. (2017). Carbon debt and payback time – lost in the forest? Renew. Sustain. Energy Rev. 73, 1211–1217. doi: 10.1016/j.rser.2017.02.004
Biomass Magazine (2019). Sawmill Begins Operations, Will Provide Feedstock to Pellet Plant [WWW Document]. Sawmill Begins Operations, Will Provide Feedstock to Pellet Plant. Available online at: http://biomassmagazine.com/articles/16206/sawmill-begins-operations-will-provide-feedstock-to-pellet-plant (accessed August 31, 2020).
Birt, A. (2011). Population Dynamics of Southern Pine Beetle in Forest Landscapes. College Station, TX: Texas A&M University.
Brack, D. (2017). Woody Biomass for Power and Heat – Impacts on the Global Climate. London: Chatham House, the Royal Institute of International Affairs.
Bruckner, T., Bashmakov, I. A., and Mulugetta, Y. (2014). “Chapter 7 – energy systems, in: climate change 2014: mitigation of climate change,” in Contribution of Working Group III to the Fifth Assessment Report of the Intergovernmental Panel on Climate Change, ed. IPCC (Cambridge: Cambridge University Press), 88.
Bryant, T., Waring, K., Sánchez Meador, A., and Bradford, J. B. (2019). A framework for quantifying resilience to forest disturbance. Front. For. Glob. Change 2:56. doi: 10.3389/ffgc.2019.00056
Buchholz, T., and Gunn, J. (2015). Carbon Emission Estimates for Drax biomass powerplants in the UK sourcing from Enviva Pellet Mills in U.S. Southeastern Hardwoods using the BEAC model. Pleasanton, CA: Spatial Informatics Group LLC (SIG).
Buchholz, T., Hurteau, M. D., Gunn, J., and Saah, D. (2016). A global meta-analysis of forest bioenergy greenhouse gas emission accounting studies. GCB Bioenergy 8, 281–289. doi: 10.1111/gcbb.12245
Chen, C., Wei, X., Weiskittel, A., and Hayes, D. J. (2019). Above-ground carbon stock in merchantable trees not reduced between cycles of spruce budworm outbreaks due to changing species composition in spruce-fir forests of Maine, USA. Forest Ecol. Manag. 453:117590. doi: 10.1016/j.foreco.2019.117590
Colnes, A., Doshi, K., Emick, H., Evans, A., Perschel, R. T., Robards, T. A., et al. (2012). Biomass Supply and Carbon Accounting for Southeastern Forests. Montpelier, VT: Biomass Energy Resource Center.
Dale, V. H., Parish, E., Kline, K. L., and Tobin, E. (2017). How is wood-based pellet production affecting forest conditions in the southeastern United States? Forest Ecol. Manag. 396, 143–149. doi: 10.1016/j.foreco.2017.03.022
DECC (2015). BEAC (Biomass Emissions And Counterfactual) Model Version BEAC2015. London: Department of Energy & Climate Change (DECC).
Dezember, R. (2018). Thousands of southerners planted trees for retirement. it didn’t work. Wall Street J. Available online at: https://www.wsj.com/articles/thousands-of-southerners-planted-trees-for-retirement-it-didnt-work-1539095250 (accessed October 9, 2018).
Drax (2017). Keeping the Options Open [WWW Document]. Keeping the Options Open. Available online at: https://www.drax.com/sustainability/keeping-options-open/ (accessed April 19, 2021).
Drax Biomass LLC (2019). Where we Operate [WWW Document]. Where We Operate. Available online at: https://www.draxbiomass.com/#where-we-operate (accessed April 4, 2019).
Drax Group PLC. (2019b). Enabling a Zero Carbon, Lower Cost Energy Future. Strategic Report from the Drax Group plc Annual Report and Accounts 2019 [WWW Document]. Drax. Available online at: https://www.drax.com/annual-report/enabling-a-zero-carbon-lower-cost-energy-future/ (accessed July 29, 2020).
Duden, A. S., Verweij, P. A., Junginger, H. M., Abt, R. C., Henderson, J. D., Dale, V. H., et al. (2017). Modeling the impacts of wood pellet demand on forest dynamics in southeastern United States. Biofuels Bioprod. Bioref. 11, 1007–1029. doi: 10.1002/bbb.1803
Dwivedi, P., Khanna, M., and Fuller, M. (2019). Is wood pellet-based electricity less carbon-intensive than coal-based electricity? It depends on perspectives, baselines, feedstocks, and forest management practices. Environ. Res. Lett. 14:024006. doi: 10.1088/1748-9326/aaf937
Dwivedi, P., Khanna, M., Sharma, A., and Susaeta, A. (2016). Efficacy of carbon and bioenergy markets in mitigating carbon emissions on reforested lands: a case study from Southern United States. Forest Policy Econ. 67, 1–9. doi: 10.1016/j.forpol.2016.03.002
European Commission (2016). State Aid SA.38760 (2016/C) (ex 2015/N) – United Kingdom Investment Contract for Biomass Conversion of the first unit of the Drax power plant. Brussels: European Commission (EC).
Eve, M., Flugge, M., and Pape, D. (2014). “Chapter 2: considerations when estimating agriculture and forestry ghg emissions and removals,” in Quantifying Greenhouse Gas Fluxes in Agriculture and Forestry: Methods for Entity - Scale Inventory, Technical Bulletin Number 1939, ed. US EPA (Washington DC: Office of the Chief Economist, U.S. Department of Agriculture), 606.
FAOSTAT (2020). Wood Pellets [WWW Document]. Wood Pellets. Available online at: http://www.fao.org/faostat/en/#search/wood%20pellets (accessed February 18, 2020).
Ferrero, F., Malow, M., and Noll, M. (2011). Temperature and gas evolution during large scale outside storage of wood chips. Eur. J. Wood Prod. 69, 587–595. doi: 10.1007/s00107-010-0512-0
FIA. (2005). Forest Inventory and Analysis Sampling and Plot Design, FIA Fact Sheet Series. Washington DC: USDA Forest Service.
FIA. (2018). FIA DataMart [WWW Document]. FIA DataMart. Available online at: https://apps.fs.usda.gov/fia/datamart/datamart.html (accessed April 4, 2019).
Francescato, V., and Zuccoli Bergomi, L. (2008). Wood Fuels Production Handbook. Legnaro: Italian Agriforestry Energy Association (AEIL) and European Biomass Association (AEBIOM).
Galik, C. S., and Abt, R. C. (2015). Sustainability guidelines and forest market response: an assessment of European Union pellet demand in the southeastern United States. GCB Bioenergy 8, 658–669. doi: 10.1111/gcbb.12273
Garg, A., and Weitz, M. M. (2019). “Chapter 2: Stationary Combustion,” in 2019 Refinement to the 2006 IPCC Guidelines for National Greenhouse Gas Inventories Energy, ed. IPCC (Kyoto: International Panel on Climate Change (IPCC)), 2. doi: 10.21513/0207-2564-2019-2-05-13
Giuntoli, J., Searle, S., Jonsson, R., Agostini, A., Robert, N., Amaducci, S., et al. (2020). Carbon accounting of bioenergy and forest management nexus. A reality-check of modeling assumptions and expectations. Renew. Sustain. Energy Rev. 134:110368. doi: 10.1016/j.rser.2020.110368
González-García, S., Mola-Yudego, B., and Murphy, R. J. (2013). Life cycle assessment of potential energy uses for short rotation willow biomass in Sweden. Int. J. Life Cycle Assess. 18, 783–795. doi: 10.1007/s11367-012-0536-2
Gunn, J. S., and Buchholz, T. (2018). Forest sector greenhouse gas emissions sensitivity to changes in forest management in maine (USA). Forestry (Lond) 91, 526–538. doi: 10.1093/forestry/cpy013
Gunn, J. S., Ducey, M. J., Buchholz, T., and Belair, E. P. (2020). Forest carbon resilience of eastern spruce budworm (Choristoneura fumiferana) salvage harvesting in the Northeastern United States. Front. For. Glob. Change 3:14. doi: 10.3389/ffgc.2020.00014
Hanssen, S. V., Duden, A. S., Junginger, M., Dale, V. H., Hilst, F., and van der. (2017). Wood pellets, what else? Greenhouse gas parity times of European electricity from wood pellets produced in the south-eastern United States using different softwood feedstocks. GCB Bioenergy 9, 1406–1422. doi: 10.1111/gcbb.12426
Howes, P., O’Brien, S., Rushton, K., Jenkins, J. C., Smithers, R., Abt, R. C., et al. (2016). Use of North American Woody Biomass in UK Electricity Generation: Assessment of High Carbon Biomass Fuel Sourcing Scenarios (No. ED 60674-Issue Number 5). Didcot: Ricardo-AEA Ltd.
IPCC (2018). Summary for Policymakers of IPCC Special Report on Global Warming of 1.5oC approved by governments (IPCC Press Release). Geneva: International Panel on Climate Change (IPCC).
Jonker, J. G. G., van der Hilst, F., Markewitz, D., Faaij, A. P. C., and Junginger, H. M. (2018). Carbon balance and economic performance of pine plantations for bioenergy production in the Southeastern United States. Biomass Bioenergy 117, 44–55. doi: 10.1016/j.biombioe.2018.06.017
Kalt, G., Mayer, A., Theurl, M. C., Lauk, C., Erb, K.-H., and Haberl, H. (2019). Natural climate solutions versus bioenergy: can carbon benefits of natural succession compete with bioenergy from short rotation coppice? GCB Bioenergy 11, 1283–1297. doi: 10.1111/gcbb.12626
Kittler, B., Stupak, I., and Smith, C. T. (2020). Assessing the wood sourcing practices of the U.S. industrial wood pellet industry supplying European energy demand. Energy Sustain. Soc. 10:23. doi: 10.1186/s13705-020-00255-4
KSI. (2020). Global Wood Pellet Market – Forecasts from 2020 to 2025 (No. 5174308). Noida: Knowledge Sourcing Intelligence LLP.
Latta, G. S., Baker, J. S., Beach, R. H., Rose, S. K., and McCarl, B. A. (2013). A multi-sector intertemporal optimization approach to assess the GHG implications of U.S. forest and agricultural biomass electricity expansion. J. Forest Econ. 19, 361–383. doi: 10.1016/j.jfe.2013.05.003
Liang, S., Hurteau, M. D., and Westerling, A. L. (2018). Large-scale restoration increases carbon stability under projected climate and wildfire regimes. Front. Ecol. Environ. 16:207–212. doi: 10.1002/fee.1791
Liu, Y. L., Goodrick, S. A., and Stanturf, J. (2013). Future U.S. wildfire potential trends projected using a dynamically downscaled climate change scenario. Forest Ecol. Manag. 294, 120–135. doi: 10.1016/j.foreco.2012.06.049
Macintosh, A., Keith, H., and Lindenmayer, D. (2015). Rethinking forest carbon assessments to account for policy institutions. Nat. Clim. Change 5, 946–949. doi: 10.1038/nclimate2695
Miles, P. D., and Smith, W. B. (2009). Specific Gravity and Other Properties of Wood and Bark for 156 Tree Species Found in North America (No. NRS-38). Boise, ID: USDA Forest Service. doi: 10.2737/NRS-RN-38
Mitchell, S. R., Harmon, M. E., and O’Connell, K. E. B. (2012). Carbon debt and carbon sequestration parity in forest bioenergy production. GCB Bioenergy 4, 818–827. doi: 10.1111/j.1757-1707.2012.01173.x
Mythe, G., Shindell, D., Breon, F., Collins, W., Fuglestvedt, J., Huang, J., et al. (2013). Anthropogenic and Natural Radiative Forcing, in: Climate Change 2013: The Physical Science Basis. Contribution of Working Group I to the Fifth Assessment Report of the Intergovernmental Panel on Climate Change. Cambridge: Cambridge University Press, 659–740.
Nabuurs, G.-J., Arets, E. J. M. M., and Schelhaas, M.-J. (2016). European forests show no carbon debt, only a long parity effect. Forest Policy Econ. 75, 120–125. doi: 10.1016/j.forpol.2016.10.009
Noormets, A., Epron, D., Domec, J. C., McNulty, S. G., Fox, T., Sun, G., et al. (2015). Effects of forest management on productivity and carbon sequestration: a review and hypothesis. Forest Ecol. Manag. 355, 124–140. doi: 10.1016/j.foreco.2015.05.019
Nowak, J. T., Meeker, J. R., Coyle, D. R., Steiner, C. A., and Brownie, C. (2015). Southern pine beetle infestations in relation to forest stand conditions, previous thinning, and prescribed burning: evaluation of the southern pine beetle prevention program. J. Forestry 113, 454–462. doi: 10.5849/jof.15-002
Nunery, J. S., and Keeton, W. S. (2010). Forest carbon storage in the northeastern United States: net effects of harvesting frequency, post-harvest retention, and wood products. Forest Ecol. Manag. 259, 1363–1375. doi: 10.1016/j.foreco.2009.12.029
OFGEM (2019). Electricity Generation Mix by Quarter and Fuel Source (GB) [WWW Document]. Electricity Generation Mix by Quarter And Fuel Source (GB). Available online at: https://www.ofgem.gov.uk/data-portal/electricity-generation-mix-quarter-and-fuel-source-gb (accessed April 17, 2019).
Pehl, M., Arvesen, A., Humpenöder, F., Popp, A., Hertwich, E. G., and Luderer, G. (2017). Understanding future emissions from low-carbon power systems by integration of life-cycle assessment and integrated energy modelling. Nat. Energy 2, 939–945. doi: 10.1038/s41560-017-0032-9
Röder, M., Whittaker, C., and Thornley, P. (2015). “How certain are greenhouse gas reductions from bioenergy? Life cycle assessment and uncertainty analysis of wood pellet-to-electricity supply chains from forest residues,” in Proceedings of the Biomass and Bioenergy The 22nd European Biomass Conference and Exhibition, Vol. 79, Hamburg, 50–63. doi: 10.1016/j.biombioe.2015.03.030
Ryan, M. G., Harmon, M. E., Birdsey, R. A., Giardina, C. P., Heath, L. S., Houghton, R. A., et al. (2010). A synthesis of the science on forests and carbon for U.S. forests. Ecol. Soc. Am. 13, 1–16.
SBP. (2019a). Supply Base Report: Amite BioEnergy, LLC. Fourth Surveillance Audit. London: Sustainable Biomass Program.
SBP. (2019b). Supply Base Report: LaSalle BioEnergy, LLC. Decond Surveillance Audit. Scope Change Audit. London: Sustainable Biomass Program.
SBP. (2019c). Supply Base Report: Morehouse BioEnergy, LLC. Fourth Surveillance Audit. London: Sustainable Biomass Program.
Shephard, N. T., Joshi, O., Susaeta, A., and Will, R. E. (2021). A stand level application of efficiency analysis to understand efficacy of fertilization and thinning with drought in a loblolly pine plantation. Forest Ecol. Manag. 482:118855. doi: 10.1016/j.foreco.2020.118855
Smith, J. E., Heath, L. S., Skog, K. E., and Birdsey, R. A. (2006). Methods for Calculating Forest Ecosystem and Harvested Carbon with Standard Estimates for Forest Types of the United States. Newtown Square, PA: USDA Forest Service. doi: 10.2737/NE-GTR-343
Sproul, E., Barlow, J., and Quinn, J. C. (2019). Time value of greenhouse gas emissions in life cycle assessment and techno-economic analysis. Environ. Sci. Technol. 53, 6073–6080. doi: 10.1021/acs.est.9b00514
Sterman, J. D., Siegel, L., and Rooney-Varga, J. N. (2018). Does replacing coal with wood lower CO 2 emissions? Dynamic lifecycle analysis of wood bioenergy. Environ. Res. Lett. 13:015007. doi: 10.1088/1748-9326/aaa512
Thomas, R. Q., Jersild, A. L., Brooks, E. B., Thomas, V. A., and Wynne, R. H. (2018). A mid-century ecological forecast with partitioned uncertainty predicts increases in loblolly pine forest productivity. Ecol. Appl. 28, 1503–1519. doi: 10.1002/eap.1761
Timmons, D. S., Buchholz, T., and Veeneman, C. H. (2016). Forest biomass energy: assessing atmospheric carbon impacts by discounting future carbon flows. GCB Bioenergy 8, 631–643. doi: 10.1111/gcbb.12276
UK Committee on Climate Change (2015). The Fifth Carbon Budget – The Next Step Towards a Low-Carbon Economy. London: Committee on Climate Change (CCC).
UK Department for BEIS (2019). Contracts for Difference Scheme for Renewable Electricity Generation. London: Department for Business, Energy & Industrial Strategy.
US EPA (2017). Climate Impacts in the Southeast [WWW Document]. Available online at: https://19january2017snapshot.epa.gov/climate-impacts/climate-impacts-southeast_.html (accessed March 25, 2021).
USDA (2020). FAS – Global Agricultural Trade System (GATS) [WWW Document]. Available online at: https://apps.fas.usda.gov/Gats/default.aspx (accessed February 4, 2020).
USDA FS (2005). Southern Pine Beetle Prevention and Restoration Program [WWW Document]. Southern Pine Beetle Prevention and Restoration Program. Available online at: http://southernforesthealth.net/insects/southern-pine-beetle/southern-pine-beetle-prevention-and-restoration-program (accessed April 4, 2019).
USFS (2020). Forest Vegetation Simulator (FVS) [WWW Document]. Available online at: https://www.fs.fed.us (accessed January 15, 2020).
Vanhala, P., Repo, A., and Liski, J. (2013). Forest bioenergy at the cost of carbon sequestration? Curr. Opin. Environ. Sustain. 5, 41–46. doi: 10.1016/j.cosust.2012.10.015
Vanlint, K. (2018). 2017 UK Greenhouse Gas Emissions, Provisional Figures. London: UK Department for Business, Energy & Industrial Strategy.
Walker, T., Cardellichio, P., Gunn, J. S., Saah, D. S., and Hagan, J. M. (2013). Carbon accounting for woody biomass from massachusetts (USA) managed forests: a framework for determining the temporal impacts of wood biomass energy on atmospheric greenhouse gas levels. J. Sustain. Forestry 32, 130–158. doi: 10.1080/10549811.2011.652019
Wang, W., Dwivedi, P., Abt, R., and Khanna, M. (2015). Carbon savings with transatlantic trade in pellets: accounting for market-driven effects. Environ. Res. Lett. 10:114019. doi: 10.1088/1748-9326/10/11/114019
Wihersaari, M. (2005). Evaluation of greenhouse gas emission risks from storage of wood residue. Biomass Bioenergy 28, 444–453. doi: 10.1016/j.biombioe.2004.11.011
Yaussy, D. A. (2000). Comparison of an empirical forest growth and yield simulator and a forest gap simulator using actual 30-year growth from two even-aged forests in Kentucky. Forest Ecol. Manag. 126, 385–398. doi: 10.1016/S0378-1127(99)00111-5
York, R. (2012). Do alternative energy sources displace fossil fuels? Nat. Clim. Change 2, 441–443. doi: 10.1038/nclimate1451
Keywords: forests, carbon life cycle assessment, pellets, bioenergy, greenhouse gas emissions, climate change
Citation: Buchholz T, Gunn JS and Sharma B (2021) When Biomass Electricity Demand Prompts Thinnings in Southern US Pine Plantations: A Forest Sector Greenhouse Gas Emissions Case Study. Front. For. Glob. Change 4:642569. doi: 10.3389/ffgc.2021.642569
Received: 16 December 2020; Accepted: 08 April 2021;
Published: 10 May 2021.
Edited by:
Jaana Bäck, University of Helsinki, FinlandReviewed by:
Leonardo Montagnani, Free University of Bozen-Bolzano, ItalyCopyright © 2021 Buchholz, Gunn and Sharma. This is an open-access article distributed under the terms of the Creative Commons Attribution License (CC BY). The use, distribution or reproduction in other forums is permitted, provided the original author(s) and the copyright owner(s) are credited and that the original publication in this journal is cited, in accordance with accepted academic practice. No use, distribution or reproduction is permitted which does not comply with these terms.
*Correspondence: Thomas Buchholz, dGJ1Y2hob2xAdXZtLmVkdQ==
Disclaimer: All claims expressed in this article are solely those of the authors and do not necessarily represent those of their affiliated organizations, or those of the publisher, the editors and the reviewers. Any product that may be evaluated in this article or claim that may be made by its manufacturer is not guaranteed or endorsed by the publisher.
Research integrity at Frontiers
Learn more about the work of our research integrity team to safeguard the quality of each article we publish.