 Frederick Gyasi Damptey
 Enrique G. de la Riva
 Klaus Birkhofer
94% of researchers rate our articles as excellent or good
Learn more about the work of our research integrity team to safeguard the quality of each article we publish.
Find out more
ORIGINAL RESEARCH article
Front. For. Glob. Change, 12 May 2021
Sec. Forest Management
Volume 4 - 2021 | https://doi.org/10.3389/ffgc.2021.630959
This article is part of the Research TopicTree Restoration and Food Security: Trade-Offs and Co-BenefitsView all 4 articles
Active restoration of degraded areas with multi-purpose tree species has been proposed as a measure to counter the losses from deforestation and mitigate consequences for local human communities. In a restoration project at a former mining site in Ghana, ecosystem services (ES) proxies in an actively restored forest were compared to a local agroforestry system and a natural forest. The results provide information about trade-offs and synergies between proxies of multiple ES(s). ES proxies were assessed according to the following categories: (a) food-tree ES: biomass of food and fodder trees, (b) other trees ES: biomass of fuelwood, medicine or mulch trees, (c) ES-providing arthropods: the number of detritivorous and predaceous arthropods, (d) carbon storage, and (e) tree diversity. Eight replicated plots with sizes of 20 m × 20 m were established in each forest type, and the following ES proxies were quantified: tree diversity was estimated as taxonomic richness of all trees with a diameter at breast height ≥ 10 cm in each plot. Tree species were then classified into ES categories (food, fodder, fuelwood, medicine, or mulch). Ground-dwelling arthropods were sampled for 10 weeks with five pitfall traps in each plot and categorized as decomposers and predators. Tree above-ground biomass was estimated based on the measured tree diameter, height, and specific wood density using an improved allometric equation. The above-ground biomass was later converted into carbon storage by assuming 50% of the above-ground biomass of each tree. ES proxies based on tree biomass were highest in the natural forest. Fodder, medicine, fuelwood, and mulch ES proxies were significantly higher in the restored forest than the agroforestry system. Decomposer arthropods were most dominant in the natural forest, followed by the restored forest and the agroforestry system. Predacious arthropods were more dominant in the restored forest than in the other forest types. Carbon storage was highest in the natural forest, followed by the agroforestry system and the restored forest. The actively restored forest took an intermediate position between the agroforestry system and the natural forest regarding values for all nine ES proxies. Out of the 14 possible relationships between food or fodder and other ES proxies, five were significantly positive (synergies) with no observed trade-offs (significant negative relationships). High fodder production in the restored and natural forests went along with higher values of other biomass ES proxies and numbers of beneficial arthropods, while higher food biomass also correlated positively with numbers of decomposing arthropods. Our results document that active restoration of degraded sites provides a valuable framework to promote ES provision to local communities compared to agroforestry system, but at the cost of lower food and fuelwood biomass and carbon storage compared to natural forests.
Deforestation and forest degradation in the tropics persistently continues due to unsustainable agriculture practices, mining, logging, construction of infrastructure, and urban expansion (Seymour and Harris, 2019). In 2019, about 11.9 million hectares of tree cover was lost in the tropics (Weisse and Goldman, 2020). Between 2010 and 2015, Ghana lost about 0.6% of its protected forest reserves because of factors such as illegal logging, encroachment for farming, and wildfire (Acheampong et al., 2019). Globally, deforestation is known as a major driver for the substantial loss of biodiversity and a decline in the provision of ecosystem services (ES) (Ciccarese et al., 2012) that affects numerous people worldwide [United Nations Convention to Combat Desertification [UNCCD], 2014]. The productivity of food systems that local communities depend on for their livelihoods is severely affected by ongoing deforestation (Nunoo et al., 2015).
One approach to revert losses from deforestation and mitigate consequences for local communities is active restoration, for example, with multi-purpose tree species that are capable of providing several ES (Reubens et al., 2011; Gamfeldt et al., 2013; Zemp et al., 2019). Deforestation often affects climatic variability leading to either prolonged drought or flooding which both impact food production (Chirwa and Adeyemi, 2019). Active restoration involves the direct planting of seeds or seedlings to aid the recovery of deforested and degraded lands to reach a pre-defined restoration aim (Morrison and Lindell, 2011; Crouzeilles et al., 2017). The success of restoration activities often is measured by improvement of soil fertility, carbon sequestration and the recovery of biodiversity in general (Chazdon, 2008). The benefits provided by restored ecosystems to local communities should be an additional focus of restoration programs (Erbaugh et al., 2020). Active forest restoration may contribute to the provision of ES (Bullock et al., 2011; Benayas and Bullock, 2012; Shimamoto et al., 2018; Damptey et al., 2020), defined as functions and products that benefit society (Millennium Ecosystem Assessment [MEA], 2005). The introduction of a new tree species or the loss of a certain species from a particular area may alter levels of various ES (Brockerhoff et al., 2017). Active restoration directly affects the establishment of tree species but further indirectly alters the composition of biotic communities in restored areas by its effects on functionally important organisms such as predators (e.g., spiders) of forest pests (e.g., silk and carpenter moths) or decomposers (e.g., woodlice) which contribute to nutrient cycles (Fragoso and Varanda, 2011; Nicholls and Altieri, 2013; Kremen et al., 2018; Donkersley, 2019; Luong et al., 2019).
Ecosystem services include provisioning (e.g., food, fodder, energy), regulating (e.g., climate and pest regulation, carbon sequestration), and other indirect supporting services that are required for the production of the provisioning and regulating services (e.g., soil formation, nutrient cycling, primary production) [Millennium Ecosystem Assessment [MEA], 2005]. These services are associated to several groups of so called service-providing organisms performing related ecosystem functions (Luck et al., 2003). For instance, predators regulate crop pests as natural enemies, and detritivorous insects decompose dead organic matter contributing to nutrient cycling and thereby to improved agriculture production and carbon sequestration (Birkhofer et al., 2015). In addition to these services, ecosystems also produce some disservices (hereafter Ecosystem Disservice- EDS; Lyytimäki and Sipilä, 2009), as for example pest infestations may lead to trade-offs with ES. Insects, as very abundant invertebrates in tropical forests, produce a range of services and disservices with the potential for trade-offs and synergies (Dangles and Casas, 2019).
Today, restoration and conservation activities often focus on simultaneously enhancing more than one ES and avoiding trade-offs, thereby creating synergies to meet the diverse needs of society (Birkhofer et al., 2018, 2019; Shimamoto et al., 2018; Zeng et al., 2019). Ecosystem multifunctionality (EM) describes the ability of an ecosystem to supply multiple ecosystem functions simultaneously to satisfy different societal needs and preferences (Mander et al., 2007; Hölting et al., 2019). Manning et al. (2018) emphasized the importance of high biodiversity for the provision of ES because different species contribute to different ecosystem functions. The EM approach hence integrates measures of the relative supply of multiple ecosystem functions and services to evaluate multiple restoration targets based on a high number of individual indicators (Strobl et al., 2019). The multifunctional nature of ecosystems and the proposed multifunctionality approach cause the need to consider synergies and trade-offs between ES and functions (Raudsepp-Hearne et al., 2010; Gamfeldt et al., 2013; Peña et al., 2018). Berry et al. (2020), for example, discussed synergistic relationships between carbon storage and biodiversity, whereby the provision on one allowed for greater levels of the other. Damptey et al. (2020) also highlighted that higher tree biodiversity in actively restored forests goes along with improved soil conditions, providing support for the assumption that higher biodiversity enhances EM. However, trade-offs, on the other hand, occur when the increase in one ES leads to a decrease in another ES (Bennett et al., 2009; Birkhofer et al., 2015; Lafond et al., 2017). Trade-offs has previously been observed between esthetic or cultural values of forests and timber production (Peña et al., 2018; Turkelboom et al., 2018) or between food provision and net primary productivity (Li et al., 2020).
In this study, we analyzed the levels and relationships between proxies of multiple ES in three different forest types (actively restored forest, agroforestry system, and natural forest in Ghana). The restored forest is a previous gravel mine site that was replanted with both native and exotic trees species after soil amendments (Damptey et al., 2020). ES proxies were assessed in the following categories: (a) food-related tree ES (biomass of food and fodder trees), (b) other trees ES (biomass of fuelwood, medicine or mulch trees), (c) ES providing arthropods (number of decomposers and predators), (d) carbon storage, and (e) tree diversity. The resulting data was then used to analyze the performance of multiple ES proxies in the three alternative forest types and to identify trade-offs and synergies between food-related ES (a) and other ES proxies (b–e). Major objectives of this study are to assess how active forest restoration 20 years after the initiation of restoration practices (i) determined levels of individual ES proxies compared to alternative forest types and if (ii) synergies or trade-offs between food-related and other ES proxies are evident across forest types. We hypothesize that active forest restoration enhances levels of food and fodder ES compared to the natural forest and to a lesser extent compared to the agroforestry system. However, high provision of food and fodder-related ES proxies is hypothesized to come at the cost of other ES proxies, like carbon storage or tree diversity.
The three forest areas are Terchire restoration area (actively “restored forest”), Bosomkese forest reserve (“agroforestry system”) and Asukese forest reserve (“natural forest”). All forests are located in the Semi-Deciduous Forest Zone (SDFZ) of Ghana with a mean annual precipitation ranging between 900 and 1,500 mm and mean daily temperature of 25°C (Figure 1). The restored forest area was gravel mined on the surface for road construction until 1998 and in 1999 the area was subjected to active restoration by planting both indigenous and fast-growing exotic nitrogen-fixing tree seedlings at a planting distance of 2 m × 2 m and a density of 1,111 seedlings per hectare. The restored forest covers 15.4 ha (longitude 7°14.075′ W, and latitude 2°10.842′ N). The agroforestry system used to be a degraded forest reserve which was subjected to enrichment planting of trees inter-planted with both annual and perennial food crops (e.g., plantains, maize, cassava) to supply food and energy to local communities (longitude 2°14.782′ W, and latitude 7°6.338′ N). The natural forest is a protected forest reserve with strong restrictions (limited access to people and resource use) against anthropogenic activity (longitude 2°31.107′ W, and latitude 7°8.469′ N) (Damptey et al., 2020).
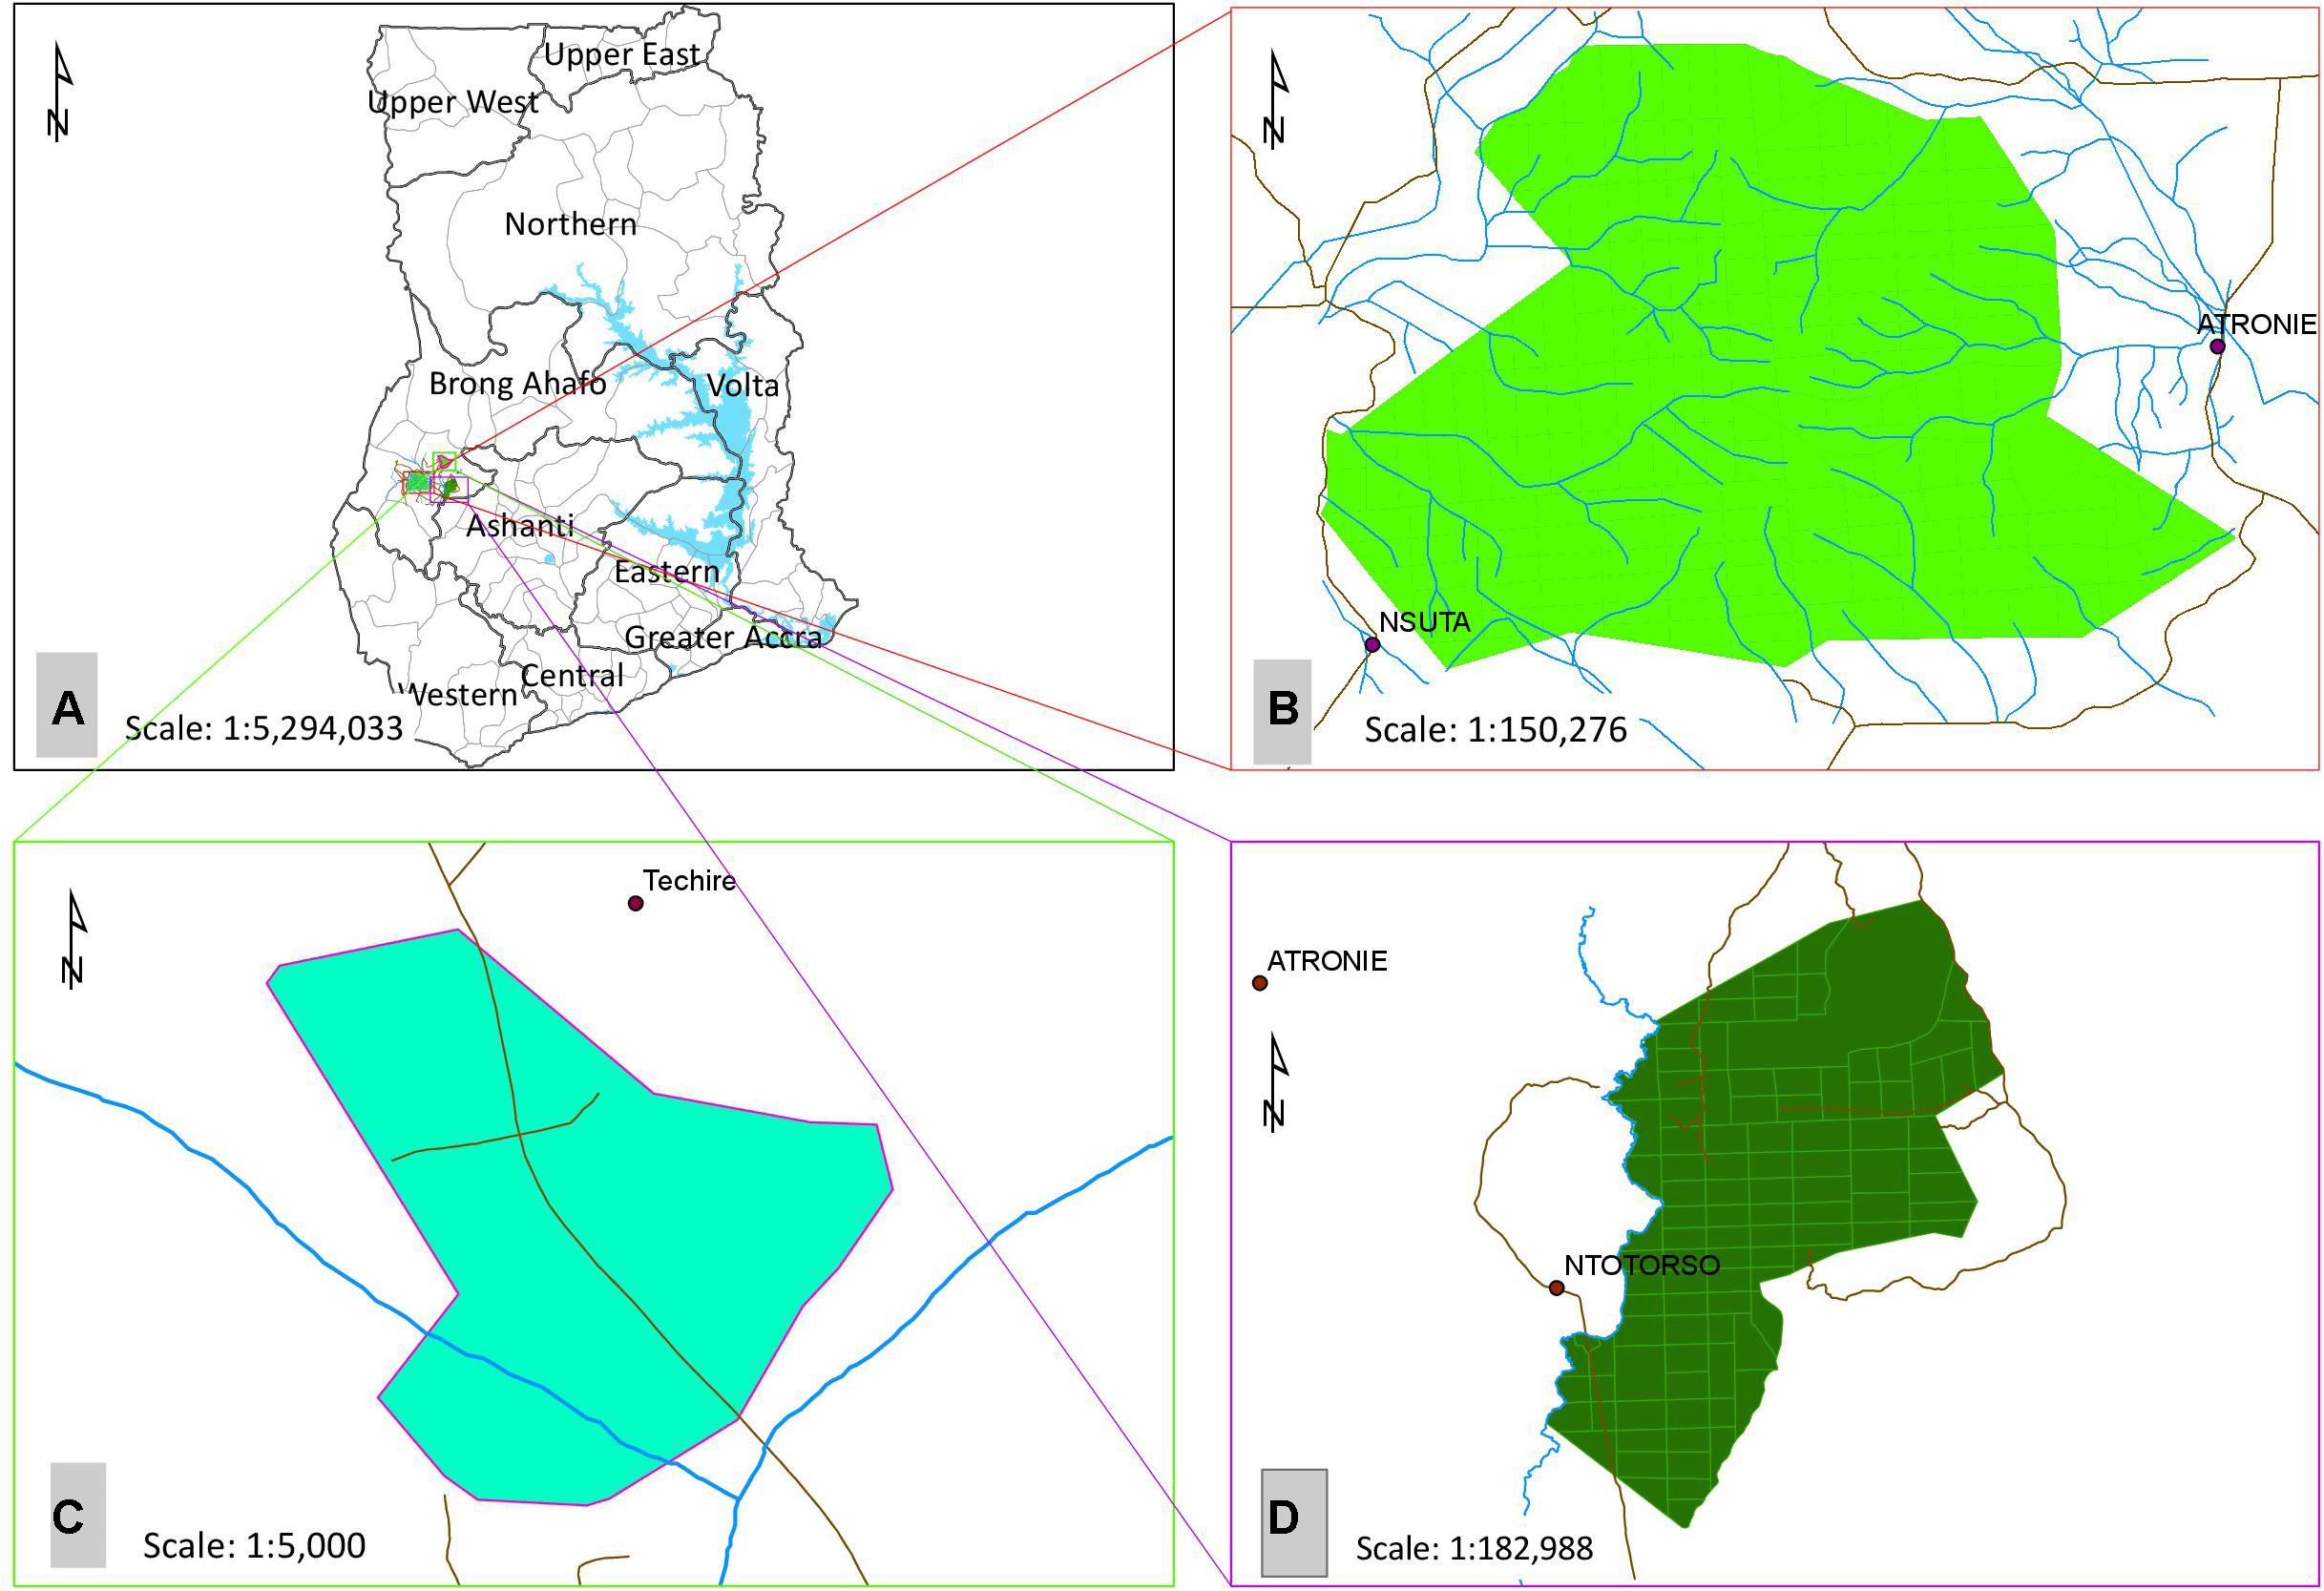
Figure 1. (A) Map of Ghana showing the (B) Natural forest (Asukese forest reserve), (C) Restored forest (Terchire restoration area) and, (D) Agroforestry system (Bosomkese forest reserve).
Eight plots (20 m × 20 m) were demarcated (systematically) and sampled in each of the three forest types. We counted, recorded, and identified all trees with a diameter ≥ 10 cm at breast height (dbh) to species level with the assistance of a local botanist and an experienced forest guard (member of the Ghana Forest Services Division) and a field manual (Hawthorne and Gyakari, 2006). The ecological significance of tree species was calculated based on the Importance Value Index (IVI = Relative density + Relative frequency + Relative abundance) measured as the sum of the relative density (, frequency (, and abundance ( of individuals per species (Curtis and McIntosh, 1950). Tree species were then classified into providers of tree-related ES (food, fodder, fuelwood, medicine or mulch trees) based on an existing database (Useful Tropical Plants Database1; Fern et al., 2014; Table 1). The biomass of each classified tree species was estimated based on the measured dbh (D), tree height (H), and specific wood density (p) based on an improved allometric equation for the tropical trees [In (AGB) = α+βIn(p×D2×H)+ε; (Chave et al., 2014)]. The specific wood density for each tree was obtained from several database or sources (Supplementary Appendix 2). Tree carbon stock was estimated by assuming 50% of the above-ground biomass of each tree (Lewis et al., 2013). The local richness of tree species at each plot was made comparable by rarefying species richness to the observed minimum of 11 trees with a diameter ≥ 10 cm at one study plot.
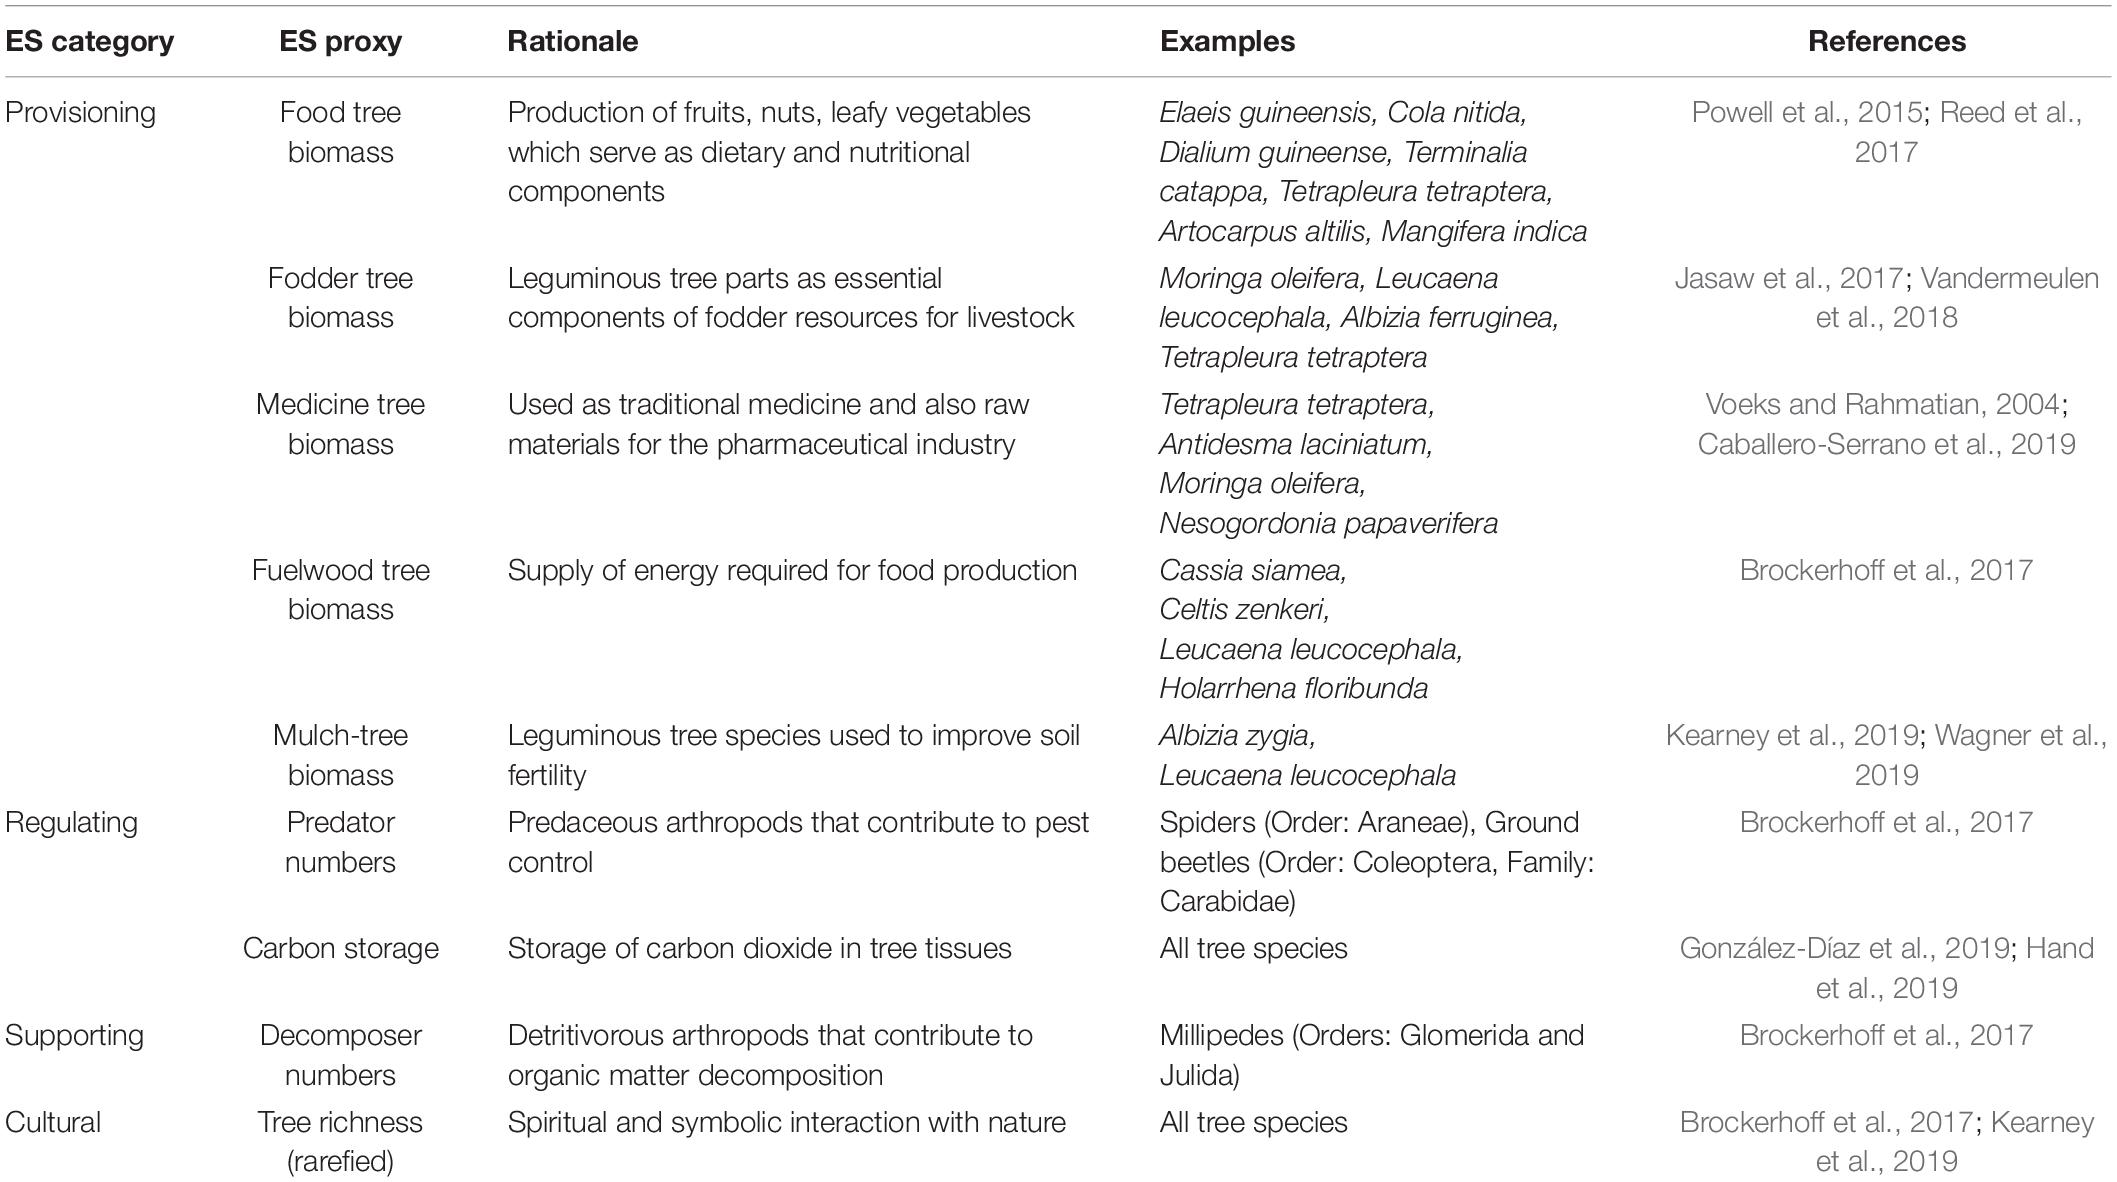
Table 1. Ecosystem Service (ES) proxies quantified in this study in major ES categories with rationale for their use in this study, examples and literature references supporting their classification.
Ground-dwelling arthropods were continuously sampled for 10 weeks (June to August 2019), with five pitfall traps in each plot being emptied weekly. Pitfall traps were filled with 50:50 propylene glycol mixed with water and a few drops of odor-free detergent to reduce the surface tension (Schmidt et al., 2006; Pais and Varanda, 2010). Traps were then sheltered by small rain covers to minimize dilution by rain (Underwood and Quinn, 2010). Traps were left unused for 1 week prior to trapping to reduce any digging-in bias due to attraction of arthropods by cutting of roots (Greenslade, 1973). Pitfall trap samples were stored in 70% ethanol and later sorted into taxonomic groups according to available literature (order, suborder, or family), followed by classification into major feeding guilds (decomposers or predators).
To statistically compare the resemblance between plots within and between forest types, we created a resemblance matrix showing all pairwise similarities between plots based on Gower similarities calculated from all nine ES proxies (Table 1; values of ES proxies were log (x+1) transformed prior to analyses). Gower similarities internally standardize all ES proxies individually to values ranging from 0 to 1 and this approach then allows for the construction of resemblance matrices based on variables that are measured on different scales (e.g., biomass of medicine tree and abundance of predators). The resulting resemblance matrix was then analyzed with permutational analysis of variance (PERMANOVA) as the appropriate statistical method for distance-based analyses (Anderson et al., 2008). PERMANOVA is a common method to analyze resemblance matrices that can be based on uni- or multivariate data. PERMANOVA has the advantage over alternative parametric methods that it does not make assumptions about normality of the dependent data (as p-values are derived from permutations). We used PERMANOVA with identical model and design settings for all uni- and multivariate data to provide a standard analytical framework for all analyses. Multivariate data was further tested for homogeneity of dispersion using the PERMDISP routine as described in Anderson (2006). As a visual representation of the multivariate relationship between sample plots and also ES proxies, we show a non-metric multidimensional scaling ordination (NMDS) based on the GOWER resemblance matrix with vectors for all nine ES proxies superimposed based on Pearson correlation coefficients with site score in the NMDS.
To then statistically compare levels of individual ES proxies related to tree biomass (food, fodder, medicine, mulch, and fuelwood tree biomass), ES providing arthropods (decomposer and predator numbers), carbon storage and tree diversity between actively restored forest and other forest type plots, we constructed resemblance matrices for each log (x+1) transformed variable using Euclidean distances. All uni- and multivariate PERMANOVA analyses were performed with a one-factorial design (forest type: restored forest, agroforestry system, and natural forest) and 9,999 unrestricted permutation of the raw data (Anderson et al., 2008). In case of a significant PERMANOVA result, levels of the factor forest type were compared with pairwise PERMANOVA for post hoc testing. Correlations among food-related ES (food and fodder-tree biomass) and all other ES proxies were tested with Pearson correlations using the “ggubr” package (Kassambara, 2020). Test statistics for PERMANOVA models include F-values with degrees of freedom for the main factor and the residuals, pairwise post hoc PERMANOVA is given with t-values and correlation results are presented with Pearson correlation coefficients. Statistical analyses and visualizations were carried out with the Plymouth Routines in Multivariate Ecological Research (PRIMER vs. 7, with the PERMANOVA add-on; Clarke and Gorley, 2015) or Sigma Plot Version 12.0 (Systat Software, 2010).
The restored forest had 43 species (Supplementary Appendix 1) with the most important species according to IVI being Senna siamea (IVI = 33.9), Leucaena leucocephala (IVI = 33.4), Terminalia superba (IVI = 24.3), and Morinda lucida (IVI = 13.4). The agroforestry system was characterized by major contributions of Terminalia superba (IVI = 52.8), Ceiba pentandra (IVI = 46.6), Cedrela odorata (IVI = 34.5), and Triplochiton scleroxylon (IVI = 22.1). The natural forest was also characterized by Celtis mildbraedii (IVI = 34.5), Triplochiton scleroxylon (IVI = 21.1), and Nesogordonia papaverifera (IVI = 17.5).
Based on a joint multivariate analysis of all ES proxies (Table 1), the three forest types differed significantly from each other (Figure 2; F2,21 = 5.64; p = 0.001). Three clusters of points confirmed the differences in ES proxies, with the agroforestry system points separated from the restored forest or the natural forest. Dissimilarities were most pronounced between the natural forest and the agroforestry system (average pairwise Gower dissimilarity = 33.6%; t = 2.7; p = 0.014), followed by dissimilarities between the natural and the restored forest (30.8%; t = 2.2; p = 0.004) or the restored forest and the agroforestry system (30.1%; t = 2.1; p = 0.001) respectively. Predator and decomposer arthropods, food, and fuelwood biomass, showed a higher affinity to the restored forest. Tree richness and fodder biomass were more dominant in the natural forest, and a higher dominance of mulch biomass was recorded for the agroforestry system. The multivariate dispersion of ES proxy values was not significantly different between forest types (F2,21 = 0.34; p = 0.736).
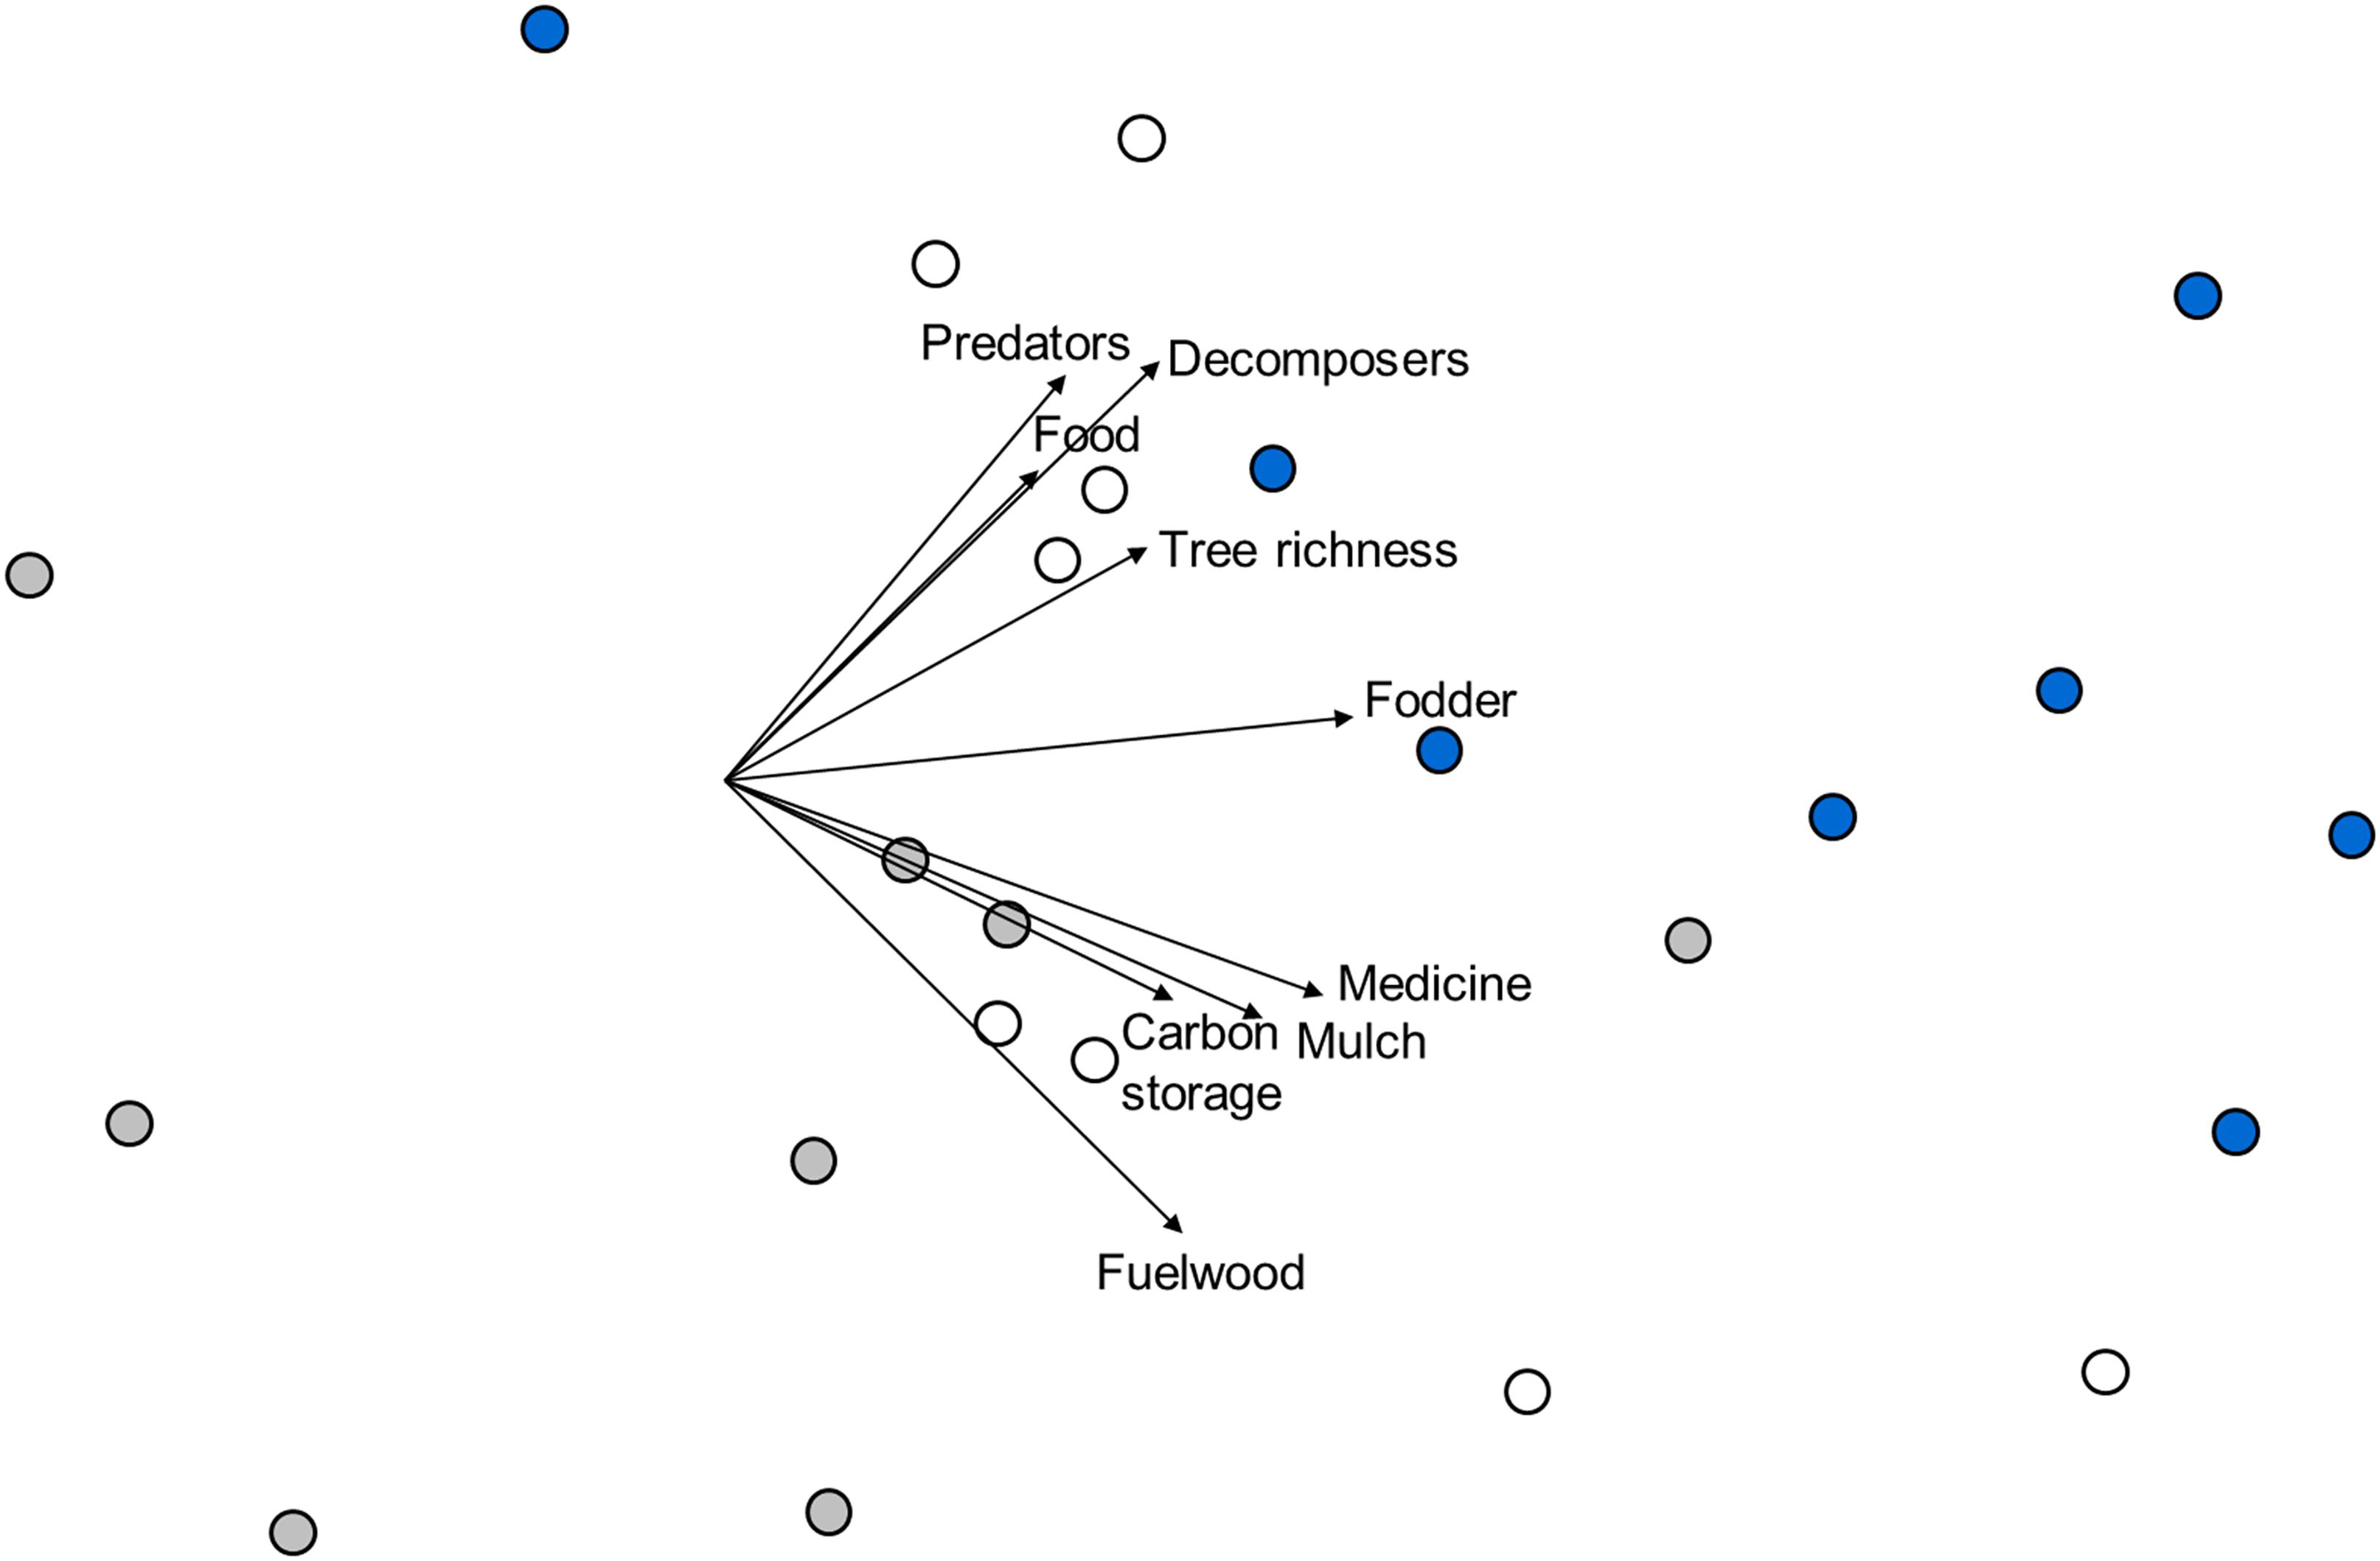
Figure 2. Non-metric multidimensional scaling ordination based on Gower similarities between plots of different forest types and values for all ES proxies (see Table 1). The 2-d stress value is 0.15. Symbol colors represent forest types: ∙, agroforestry system (Bosomkese forest reserve); ∙, natural forest (Asukese forest reserve) and ∘, actively restored forest (Terchire restoration area: N = 8 per forest type). Vectors are superimposed for all nine ES proxies with vector length scaled according to Pearson correlation coefficients with site scores along both NMDS axes.
Forest types differed significantly in food tree biomass (F2,21 = 4.13; p = 0.031). The food tree biomass in the natural forest was significantly higher than in the restored forest (t = 2.6; p = 0.022), with no significant differences between the agroforestry system compared to the natural or the restored forest (Figure 3A). Forest types differed significantly in fodder tree biomass (F2,21 = 5.31; p = 0.013) with significantly lower biomass in the agroforestry system compared to the natural forest (t = 2.68; p = 0.020) and the restored forest (t = 2.67; p = 0.020) (Figure 3B). Characteristic food and fodder tree species in the restored forest were Mangifera indica, Annona muricata, Terminalia catappa, Chrysophyllum perpulchrum, and Elaeis guineensis. Tetrapleura tetraptera, Chrysophyllum albidum, and Cola gigantean were characteristic for the natural forest plots, while the agroforestry system plots were characterized by Cola gigantean and Dialium guineense.
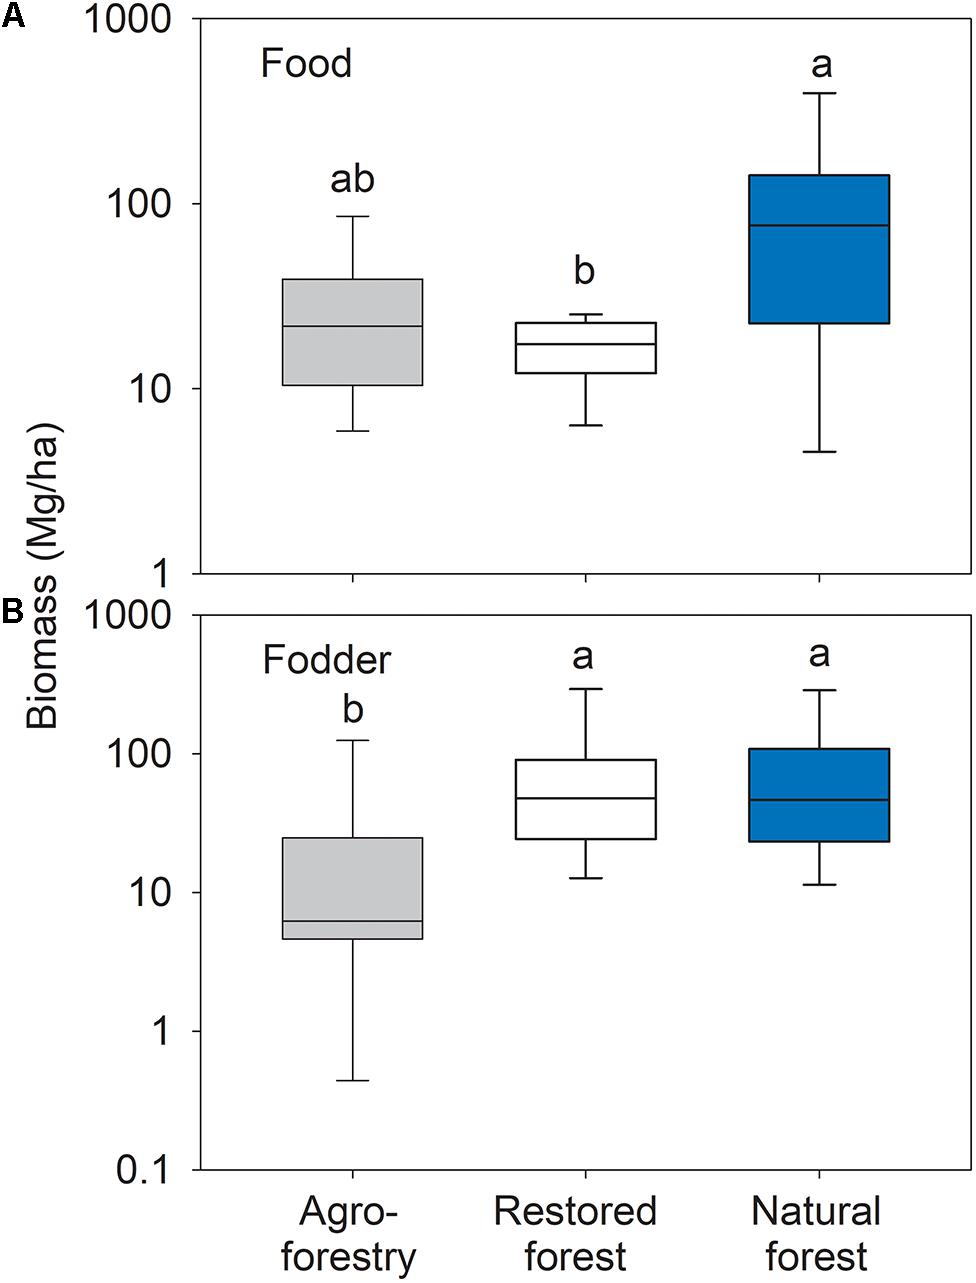
Figure 3. Box plots of (A) food tree and (B) fodder tree biomass in the agroforestry system (Bosomkese forest reserve), actively restored (Terchire restoration area) and natural forest (Asukese forest reserve; N = 8 per forest type). The line represents the median value, the box limits are the 25th and 75th percentiles, error bars show 10th and 90th percentiles on a log scale. Different letters indicate significant differences between the forest types according to pairwise PERMANOVA.
Forest types did not differ significantly in other tree related ES like fuelwood tree biomass (F2,21 = 0.20; p = 0.820), medicinal tree biomass (F2,21 = 1.81; p = 0.195), and mulch tree biomass (F2,21 = 2.85; p = 0.079).
Forest types differed significantly in the number of predatory arthropods (F2,21 = 12.66; P < 0.001). The agroforestry system plots had significantly fewer predators compared to the natural forest (t = 4.04; p = 0.003) and the restored forest (t = 4.54; p = 0.001) (Figure 4A). The observed differences in the number of predatory arthropods were mainly driven by a higher number of individuals in the beetle families Staphylinidae and Histeridae, spider families Lycosidae, Corinnidae, Ctenidae, and in the order Opiliones in the restored forest compared to the agroforestry system. Individuals from the beetle families Carabidae and Dytiscidae, and the spider families Cyrtaucheniidae and Barychelidae were more abundant in agroforestry system compared to the restored forest.
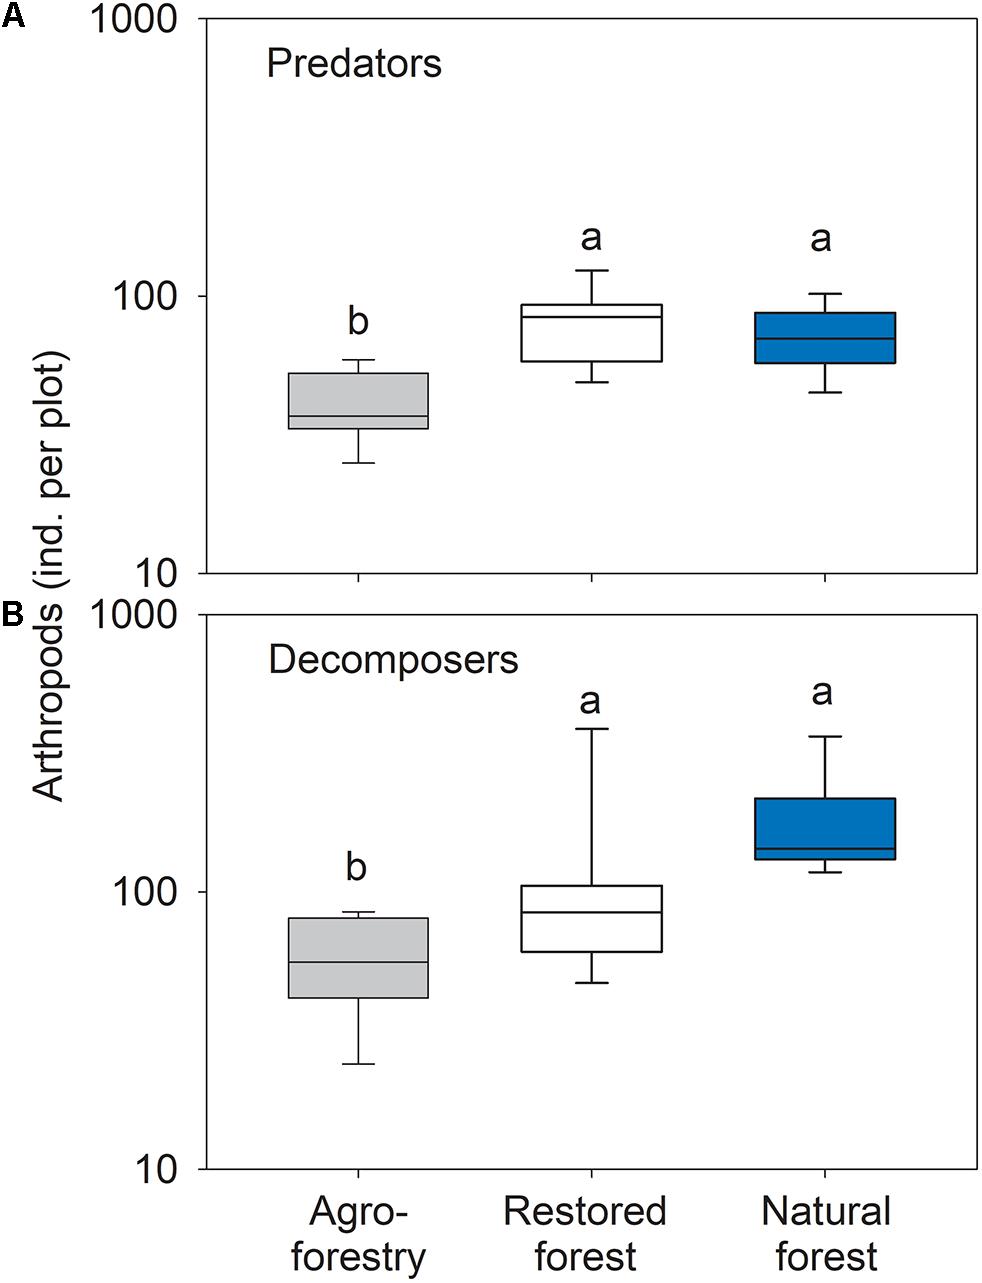
Figure 4. Box plots of arthropod (A) predator and (B) decomposer numbers in the agroforestry system (Bosomkese forest reserve), actively restored (Terchire restoration area) or natural forest (Asukese forest reserve; N = 8 per forest type). The line represents the median value, the box limits are the 25th and 75th percentiles, error bars show 10th and 90th percentiles on a log scale. Different letters indicate significant differences between the forest types according to pairwise PERMANOVA.
The number of decomposer arthropods differed significantly between forest types (F2,21 = 10.57; p = 0.001). Decomposer numbers were significantly higher in the natural forest (t = 5.64; p = 0.001) and the restored forest (t = 2.07; p = 0.042) compared to the agroforestry system plots (Figure 4B). The differences between restored forest and the agroforestry system were characterized by higher numbers of individuals in the beetle family Tenebrionidae and the millipede orders Glomerida, Julida, and Polydesmida in the restored forest plots. The natural forest plots had higher numbers of individuals in the millipede order Glomerida and the beetle family Tenebrionidae as well as more cockroaches (order Blattodea).
Carbon storage differed significantly between forest types (F2,21 = 5.84; p = 0.011) with significantly lower values in the restored forest compared to the agroforestry system (t = 2.26; p = 0.004) and the natural forest (t = 3.12; p = 0.011) (Figure 5A). Forest types differed significantly in rarefied tree species richness (F2,21 = 6.53; p = 0.007) with the restored forest (t = 3.28; p = 0.001) and the agroforestry system (t = 3.22; p = 0.007) having lower taxonomic richness than the natural forest plots (Figure 5B). The following tree species exclusively occurred in the natural forest plots: Celtis aldolfi-frider, Celtis zenkeri, Chrysophyllum albidum, Corynanthe pachyceras, Dichapetalum madagascariense, Pterygota macrocarpa, Ricinodendron heudelotii, and Sterculia Oblongata.
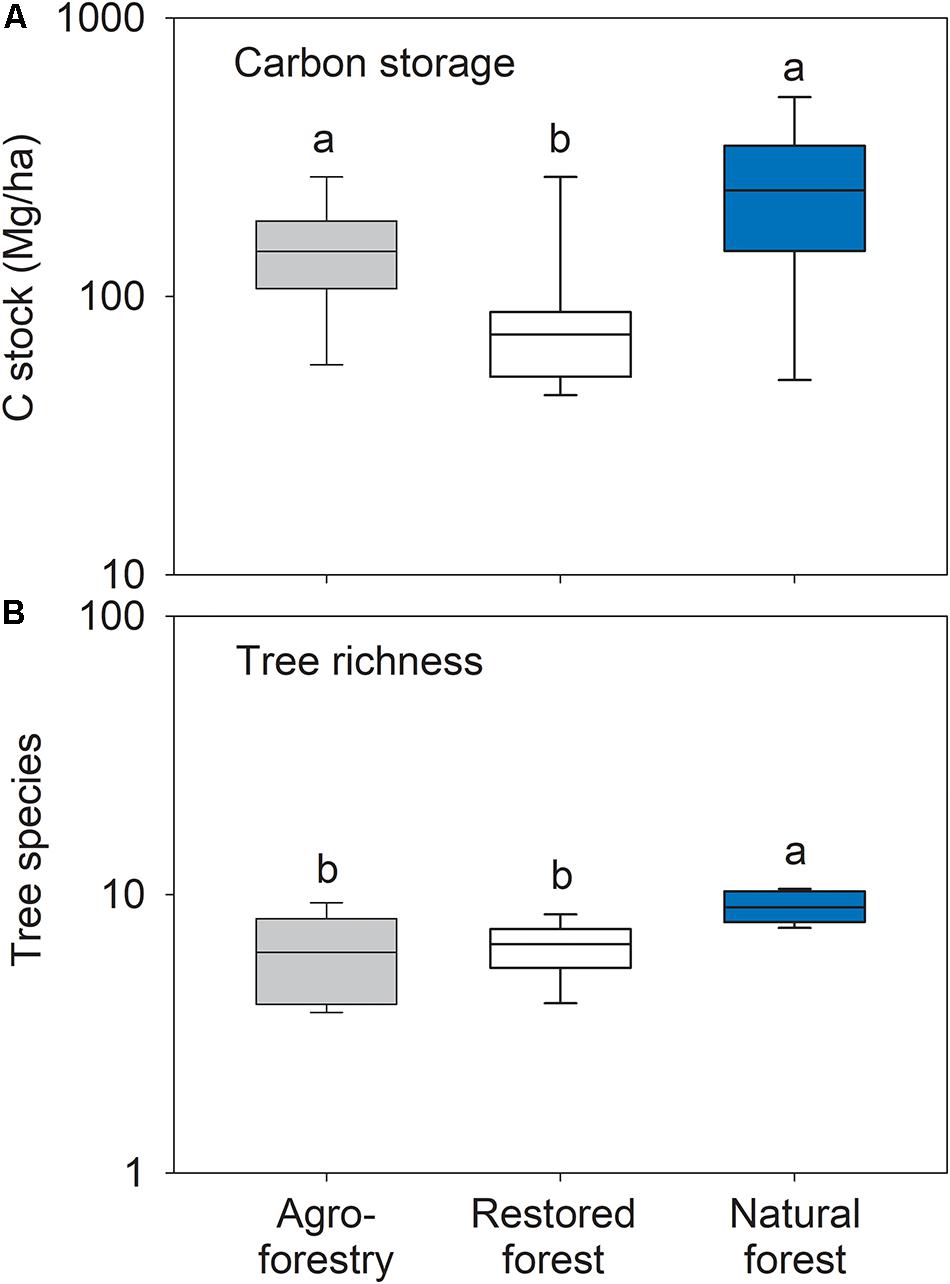
Figure 5. Box plots of (A) carbon storage and (B) tree species richness in the agroforestry system (Bosomkese forest reserve), actively restored (Terchire restoration area) or natural forest (Asukese forest reserve; N = 8 per forest type). The line represents the median value, the box limits are the 25th and 75th percentiles, error bars show 10th and 90th percentiles on a log scale. Different letters indicate significant differences between the forest types according to pairwise PERMANOVA.
The natural forest had the highest relative values for all eight out of nine ES proxies, with carbon storage being the only exception and no apparent trade-offs between pairs of ES proxies (Figure 6).
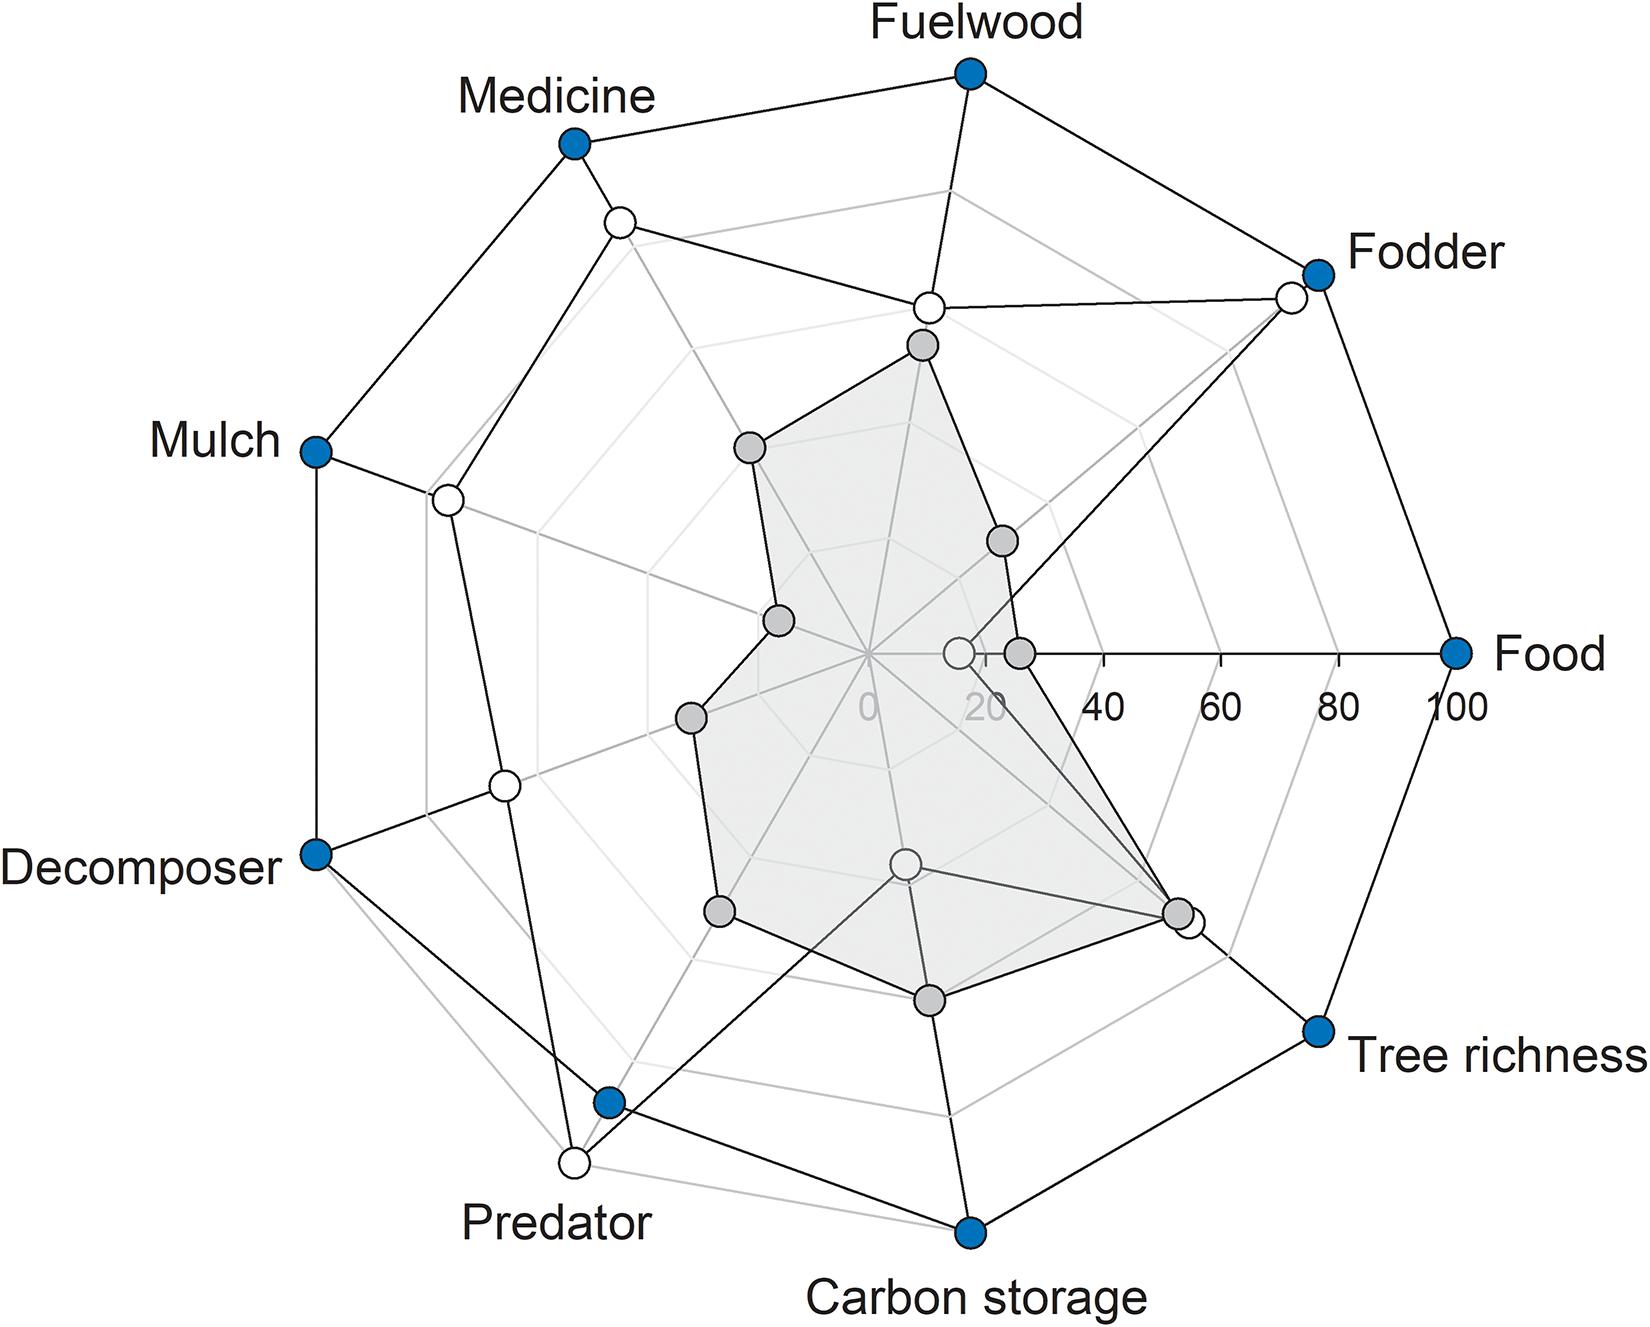
Figure 6. Rader plot showing the relationship between ecosystem service proxies in forest types: ∙, agroforestry system (Bosomkese forest reserve); ∙, natural forest (Asukese forest reserve); and ∘, actively restored forest (Terchire Restoration area: N = 8 per forest type). The highest average for each ES proxy across the three forest types was set to 100% and values for the same ES proxy in the other two forests were scaled accordingly.
Out of 14 possible relationships between food or fodder tree biomass and the other seven ES proxies, five were significantly positive (synergies) with no significant negative relationships (trade-offs). Food tree biomass was significantly correlated to the number of decomposer arthropods (R = 0.43, p = 0.037; Figure 7A). Fodder tree biomass was significantly correlated to medicine (R = 0.78, p = 0.001; Figure 7B) and mulch tree biomass (R = 0.62, p = 0.001; Figure 7C), and the number of decomposer (R = 0.57, p = 0.003; Figure 7D) and predatory (R = 0.54, p = 0.006) arthropods (Figure 7E).
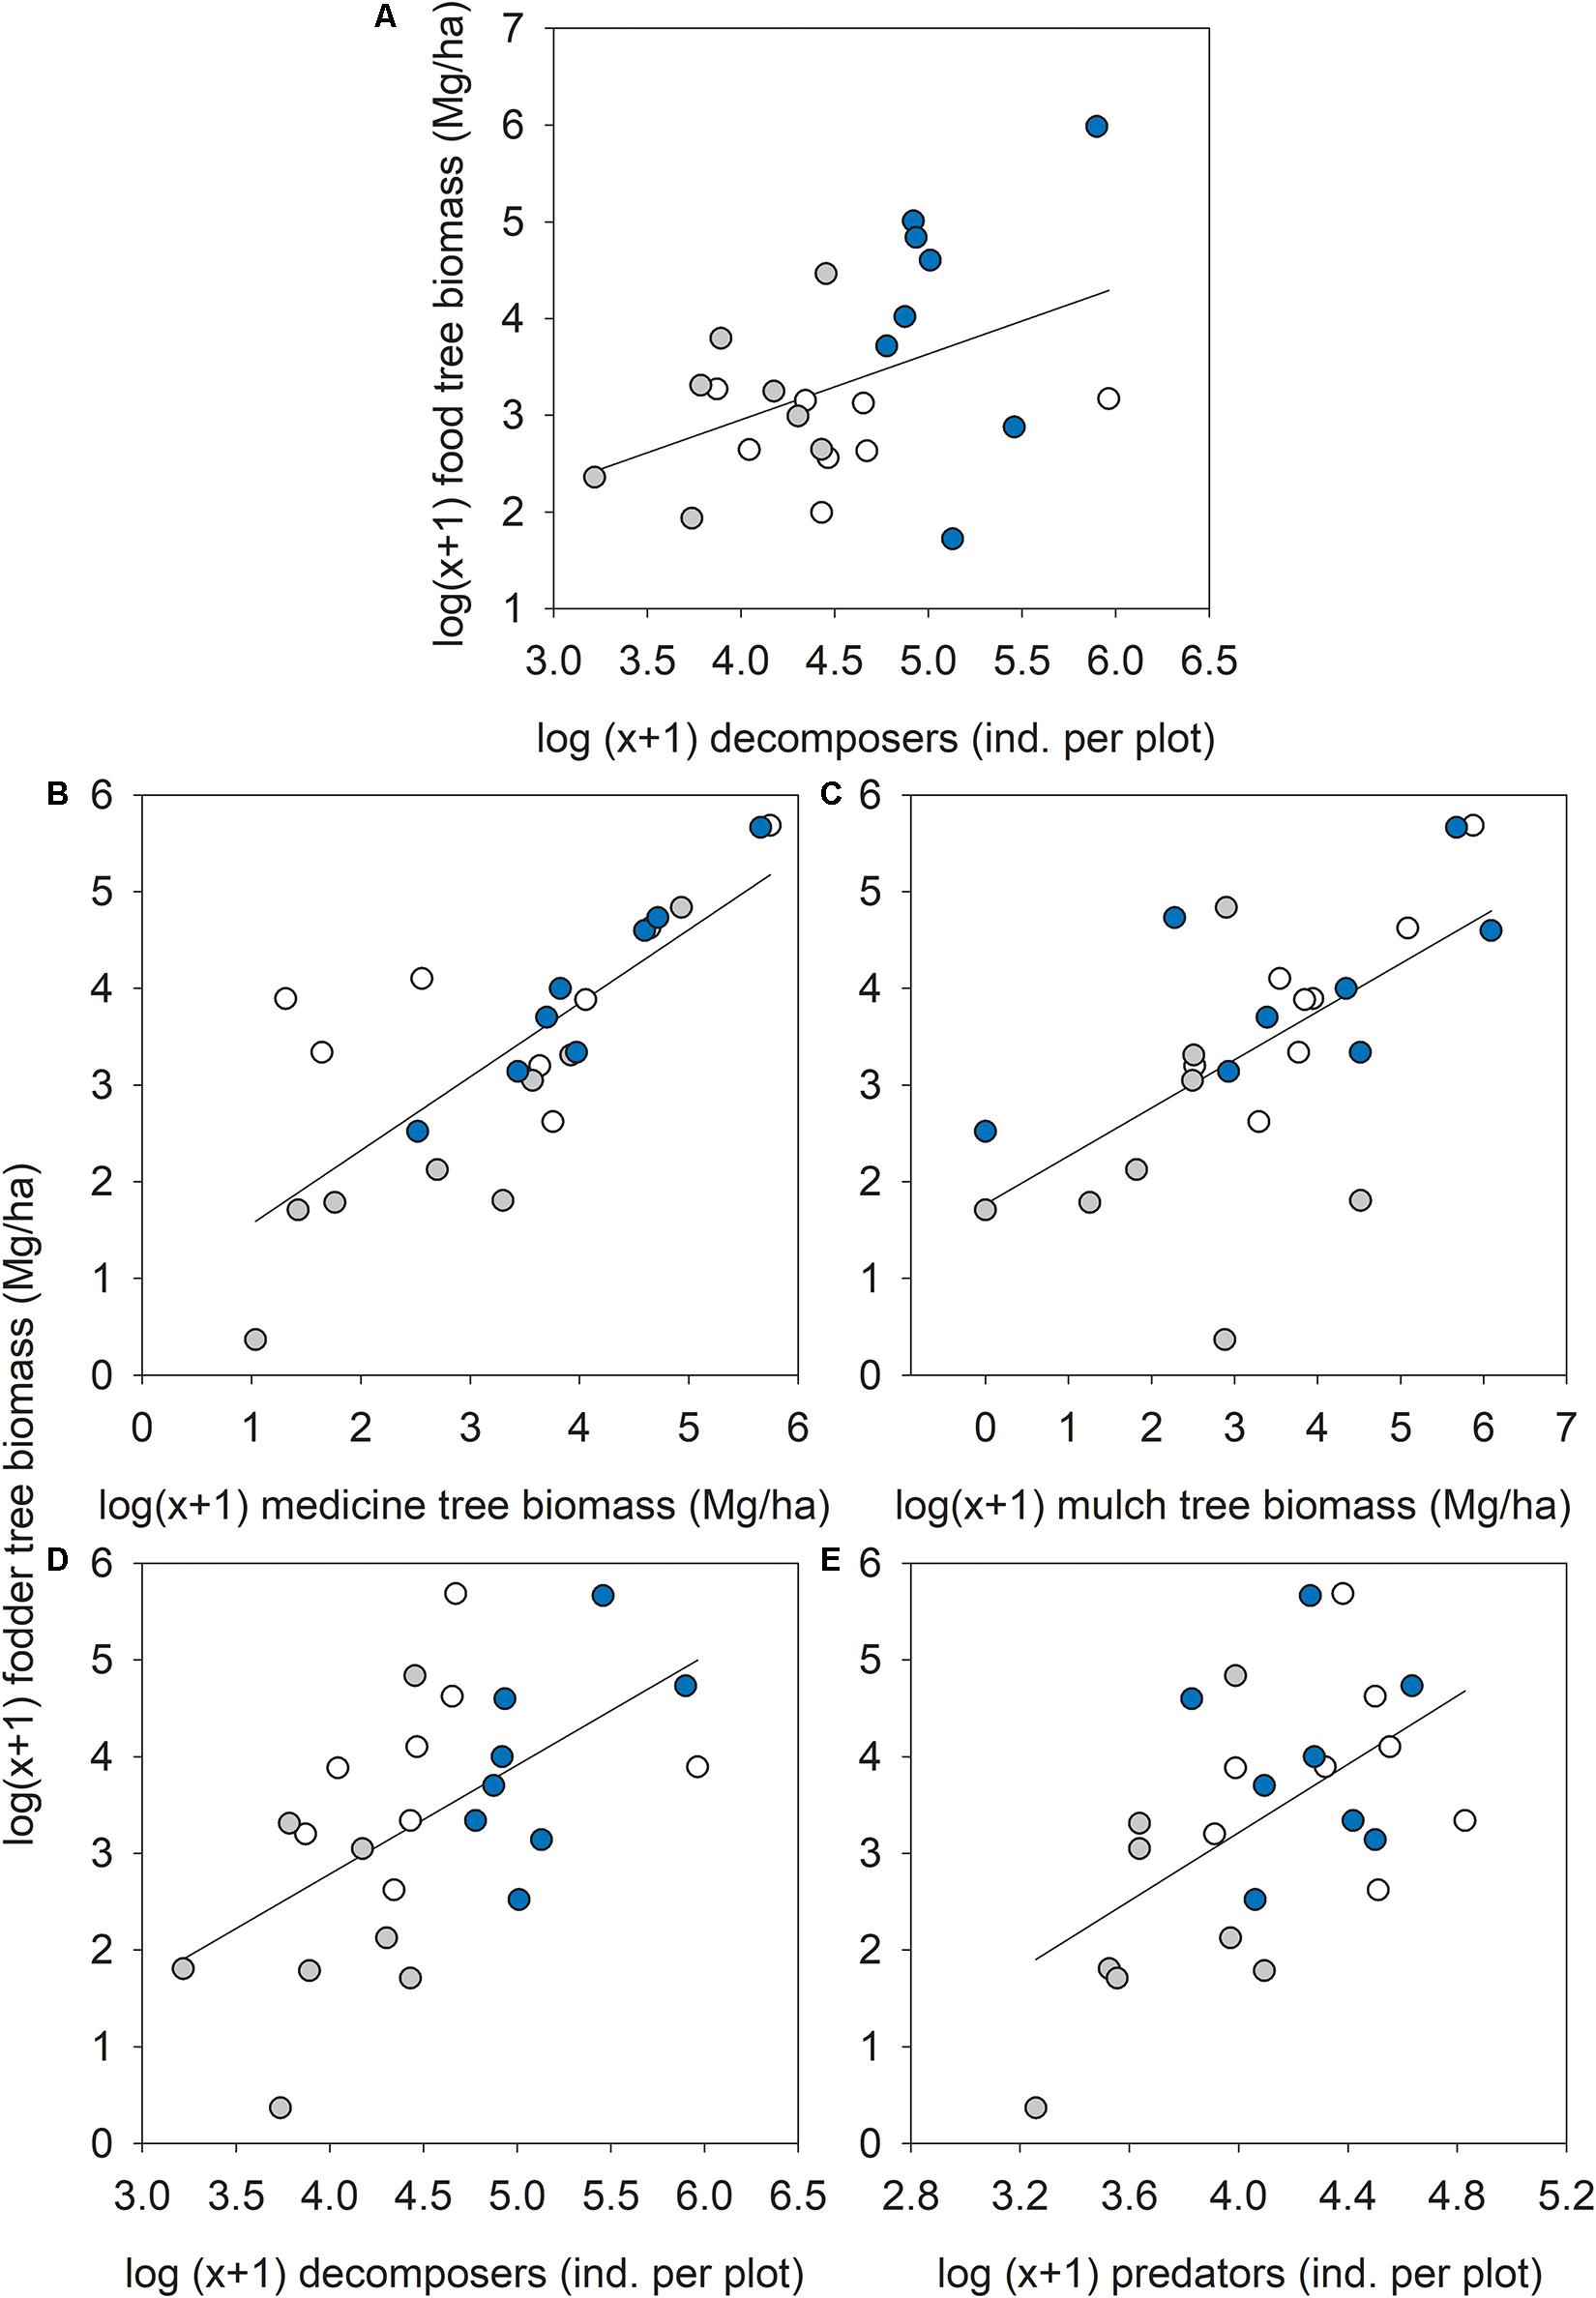
Figure 7. Relationship between (A) food tree biomass and decomposer arthropod numbers, or fodder tree biomass and (B) medicine tree biomass, (C) mulch tree biomass, (D) decomposer, and (E) predatory arthropod numbers across forest types: ∙, agroforestry system (Bosomkese Forest Reserve); ∙, natural forest (Asukese Forest Reserve); and ∘, actively restored forest (Terchire Restoration area; N = 8 per forest type).
Ecosystems with diverse tree communities are often superior in the provision of multiple ES compared to less diverse forests (Bullock et al., 2011; Gamfeldt et al., 2013; Brockerhoff et al., 2017). Trees contribute to provisioning (food, fodder, and fuelwood), regulating (pest regulation and carbon storage), supporting (habitat for organisms), and cultural (esthetic, symbolic, and religious) ES and determine the dynamics and functioning of forests (Blicharska and Mikusiński, 2014; Brockerhoff et al., 2017; Mori et al., 2017; Reed et al., 2017). Active restoration promoted selected ES (fodder tree biomass and predator numbers) compared to agroforestry in our study. However, levels of ES proxies in the natural forest were at least comparable or higher to the highest levels in agroforestry and actively restored forest plots for all ES proxies that differed significantly between forest types. Considering the ES proxies quantified in this study, optimal levels are only provided by the natural forest, followed by the actively restored forest which holds an intermediate position between natural and agroforestry plots showing the lowest benefits. Across forest types, several positive relationships between food and fodder tree biomass and other ES proxies became evident from multivariate analyses and highlight the potential to restore forests with the target to simultaneously promote multiple ES.
Forest types offer different levels of ES due to specific properties of individual tree species (Gamfeldt et al., 2013; Fu et al., 2015; Bordt and Saner, 2019). Forest management (both agroforestry and active restoration) resulted in lower tree species richness compared to natural forest plots in our study, which may constrain the provision of biodiversity-based ecosystem functions due to negative effects on service-providing organisms (Hättenschwiler et al., 2005; Gessner et al., 2010; Conti and Díaz, 2013; Faucon et al., 2017; Albrich et al., 2018). Decomposer abundance indeed resembled the observed pattern for tree species richness between forest types, but estimated levels of carbon storage did not differ significantly between agroforestry and natural forest plots. Active restoration, on the other hand, resulted in relatively high fodder tree biomass and a large number of predatory organisms. The high number of predatory organisms in actively restored forest plots and natural forests may be a response of these beneficial arthropods to more diverse vegetation often coupled with higher prey availability (structure-mediated and resource-mediated effects, Diehl et al., 2012). Natural forest plots indeed had the highest tree species richness and potentially offered diverse habitat structure supporting predatory organisms (see also Bianchi et al., 2006; Staab and Schuldt, 2020). Actively restored forest plots on the other hand did not have significantly richer tree communities compared to agroforestry plots. A previous study, however, showed that actively restored forest plots had a more complex topsoil and soil surface structure than agroforestry plots (Damptey et al., 2020) thereby potentially also supporting higher predator numbers.
Agroforestry programs in the tropics often aim for an increasing timber or food production (Waldron et al., 2017; Santoro et al., 2020). The observed significantly higher food tree biomass in agroforestry plots compared to actively restored forest plots is therefore not surprising. This benefit, however, comes at the cost of significantly lower numbers of beneficial arthropods. Previous studies highlighted the important role of soil invertebrates as key drivers of soil functioning and ES provision (Lavelle et al., 2006; Birkhofer et al., 2011; Soliveres et al., 2016) making them valuable indicators of overall soil quality (Fu et al., 2015). Hence, the low decomposer numbers in agroforestry plots should be perceived as a warning sign for the limited value of these agroforestry approaches in the study region (see also Damptey et al., 2020). However, in contrast to our hypothesis, agroforestry plots still produced a higher food tree biomass compared to actively restored forest plots. Restoration approaches need to be optimized toward higher levels of food tree growth if food supply is relevant for the region.
Human societies demand different ES which are often competing with each other, and thus, trade-offs are more common than synergistic relationships in changing ecosystems (Fu et al., 2015). In our comparison of active restoration to other forest types, we observed several synergies between food or fodder tree biomass and other ES proxies, but no trade-offs which is in contrast to our hypothesis. Food tree biomass increased with the number of decomposer arthropods, whereas fodder tree biomass correlated with medicine and mulch tree biomass and decomposer or predatory arthropod numbers. High decomposer activity accelerates litter decomposition and remobilizes nutrients essential for the growth of plants (Kitz et al., 2015; Eisenhauer et al., 2018; Maldonado et al., 2019). Decomposers have been found to contribute to reduced soil compaction and increased soil aeration which is essential for crop production (Manning et al., 2016). These active contributions of decomposing arthropods to primary production explain their positive correlation to food and fodder tree biomass. Fodder tree biomass also correlated positively with predatory organism numbers, which may result from the presence of different ecological niches for predatory organism or the presence of preferred tree species in plots with higher fodder tree biomass. Diverse forests often also harbor greater predator (natural enemies) abundance which may simultaneously result in improved control of pests (Staab and Schuldt, 2020).
The fact that the majority of tree species recorded had multiple purposes to some extend partly explains the positive relationships between different tree-related ES proxies. For instance, Moringa oleifera serves well as food, fodder, and plant-derived medicine species, Tetrapleura tetraptera is also used as medicine, for food and fodder, Leucaena leucocephala serves as fodder for livestock, mulch for crop cultivation and fuelwood for household cooking while Senna siamea is known for its medicinal, fodder, and fuelwood uses in the study regions.
Our comparison of ES proxies between actively restored forest, agroforestry and natural forest plots highlighted the high value of natural forests for the provision of ES in the study region. However, creating a forest composition resembling the natural forest plots through post-mining restoration approaches may not be a realistic goal. Alternative restoration practices are therefore needed to optimize the provision of ES and active restoration seems to provide a viable option, as levels of fodder tree biomass, predator and decomposer numbers were relatively high. However, future active restoration approaches should be optimized toward higher levels of food tree biomass that are at least comparable to levels in agroforestry plots and would support local human communities. The monitoring of ES proxies in actively restored forests should further continue as the trajectory of these plots over time is unknown.
The datasets analysed for this study are available at: https://doi.org/10.6084/m9.figshare.14402120.
FD, ER, and KB designed the study. FD performed field and laboratory work. All authors contributed to the data analysis, interpretation, writing of the manuscript, and approved the submitted version.
The scholarship support from the Catholic Academic Exchange Service (KAAD) and the Graduate Student Research Award-2019 from the Society for Conservation Biology (SCB) to FD is greatly appreciated.
The authors declare that the research was conducted in the absence of any commercial or financial relationships that could be construed as a potential conflict of interest.
We are grateful to Newmont Gold Ghana Limited and Forest Service Division of Ghana for making the study sites available. We declare that no financial support was received from Newmont Gold Ghana Limited. We would like to thank the reviewers and the editor for their comments on a previous version and we appreciate the contributions of Daniel Kwame Debrah, Frederick Nyahe, and Pascal Agro Prince for helping with the fieldwork. Special thanks to Forest Aid Ghana for providing logistical support for this research.
The Supplementary Material for this article can be found online at: https://www.frontiersin.org/articles/10.3389/ffgc.2021.630959/full#supplementary-material
Acheampong, E. O., Macgregor, C. J., Sloan, S., and Sayer, J. (2019). Deforestation is driven by agricultural expansion in Ghana’s forest reserves. Scientific Afr. 5:e00146. doi: 10.1016/j.sciaf.2019.e00146
Albrich, K., Rammer, W., Thom, D., and Seidl, R. (2018). Trade−offs between temporal stability and level of forest ecosystem services provisioning under climate change. Ecol. Appl. 28, 1884–1896. doi: 10.1002/eap.1785
Anderson, M. J. (2006). Distance- based tests for homogeneity of multivariate dispersions. Biometrics 62, 245–253. doi: 10.1111/j.1541-0420.2005.00440.x
Anderson, M. J., Gorley, R. N., and Clarke, K. R. (2008). Permanova+ for Prime: Guide software and Statical methods. New York: Plymouth: Primer-e.
Benayas, J. M. R., and Bullock, J. M. (2012). Restoration of biodiversity and ecosystem services on agricultural land. Ecosystems 15, 883–899. doi: 10.1007/s10021-012-9552-0
Bennett, E. M., Peterson, G. D., and Gordon, L. J. (2009). Understanding relationships among multiple ecosystem services. Ecol. Lett. 12, 1394–1404. doi: 10.1111/j.1461-0248.2009.01387.x
Berry, Z. C., Jones, K. W., Aguilar, L. R. G., Congalton, R. G., Holwerda, F., Kolka, R., et al. (2020). Evaluating ecosystem service trade-offs along a land-use intensification gradient in central Veracruz, Mexico. Ecosyst. Serv. 45:101181. doi: 10.1016/j.ecoser.2020.101181
Bianchi, F. J., Booij, C. J. H., and Tscharntke, T. (2006). Sustainable pest regulation in agricultural landscapes: a review on landscape composition, biodiversity and natural pest control. Proc. Roy. Soc. B 273, 1715–1727. doi: 10.1098/rspb.2006.3530
Birkhofer, K., Addison, P., Addison, M. F., Arvidsson, F., Bazelet, C., Bengtsson, J., et al. (2019). Effects of ground cover management on biotic communities, ecosystem services and disservices in organic pome fruit orchards in South Africa. Front. Sustain. Food Syst. 3:107.
Birkhofer, K., Andersson, G. K., Bengtsson, J., Bommarco, R., Dänhardt, J., Ekbom, B., et al. (2018). Relationships between multiple biodiversity components and ecosystem services along a landscape complexity gradient. Biol. Conserv. 218, 247–253. doi: 10.1016/j.biocon.2017.12.027
Birkhofer, K., Diehl, E., Andersson, J., Ekroos, J., Früh-Müller, A., Machnikowski, F., et al. (2015). Ecosystem services—current challenges and opportunities for ecological research. Front. Ecol. Evolut. 2:87.
Birkhofer, K., Diekötter, T., Boch, S., Fischer, M., Müller, J., Socher, S., et al. (2011). Soil fauna feeding activity in temperate grassland soils increases with legume and grass species richness. Soil Biol. Biochem. 43, 2200–2207. doi: 10.1016/j.soilbio.2011.07.008
Blicharska, M., and Mikusiński, G. (2014). Incorporating social and cultural significance of large old trees in conservation policy. Conserv. Biol. 28, 1558–1567. doi: 10.1111/cobi.12341
Bordt, M., and Saner, M. (2019). Which ecosystems provide which services? A meta-analysis of nine selected ecosystem services assessments. One Ecosyst. 4:e31420.
Brockerhoff, E. G., Barbaro, L., Castagneyrol, B., Forrester, D. I., Gardiner, B., González-Olabarria, J. R., et al. (2017). Forest biodiversity, ecosystem functioning and the provision of ecosystem services. Biodiv. Conserv. 26, 3005–3035. doi: 10.1007/s10531-017-1453-2
Bullock, J. M., Aronson, J., Newton, A. C., Pywell, R. F., and Rey-Benayas, J. M. (2011). Restoration of ecosystem services and biodiversity: conflicts and opportunities. Trends Ecol. Evolut. 26, 541–549. doi: 10.1016/j.tree.2011.06.011
Caballero-Serrano, V., McLaren, B., Carrasco, J. C., Alday, J. G., Fiallos, L., Amigo, J., et al. (2019). Traditional ecological knowledge and medicinal plant diversity in Ecuadorian Amazon home gardens. Global. Ecol. Conserv. 17:e00524. doi: 10.1016/j.gecco.2019.e00524
Chave, J., Réjou−Méchain, M., Búrquez, A., Chidumayo, E., Colgan, M. S., Delitti, W. B., et al. (2014). Improved allometric models to estimate the aboveground biomass of tropical trees. Global Change Biol. 20, 3177–3190.
Chazdon, R. L. (2008). Beyond deforestation: restoring forests and ecosystem services on degraded lands. Science 320, 1458–1460. doi: 10.1126/science.1155365
Chirwa, P. W., and Adeyemi, O. (2019). “Deforestation in Africa: Implications on Food and Nutritional Security,” in Zero Hunger. Encyclopedia of the UN Sustainable Development Goals, eds W. Leal Filho, A. Azul, L. Brandli, P. Özuyar, and T. Wall (Cham: Springer), doi: 10.1007/978-3-319-69626-3_62-1
Ciccarese, L., Mattsson, A., and Pettenella, D. (2012). Ecosystem services from forest restoration: thinking ahead. New Forests 43, 543–560. doi: 10.1007/s11056-012-9350-8
Conti, G., and Díaz, S. (2013). Plant functional diversity and carbon storage–an empirical test in semi−arid forest ecosystems. J. Ecol. 101, 18–28. doi: 10.1111/1365-2745.12012
Crouzeilles, R., Ferreira, M. S., Chazdon, R. L., Lindenmayer, D. B., Sansevero, J. B., Monteiro, L., et al. (2017). Ecological restoration success is higher for natural regeneration than for active restoration in tropical forests. Sci. Adv. 3:e1701345. doi: 10.1126/sciadv.1701345
Curtis, J. T., and McIntosh, R. P. (1950). The interrelations of certain analytic and synthetic phytosociological characters. Ecology 31, 434–455. doi: 10.2307/1931497
Damptey, F. G., Birkhofer, K., Nsiah, P. K., and de la Riva, E. G. (2020). Soil Properties and Biomass Attributes in a Former Gravel Mine Area after Two Decades of Forest Restoration. Land 9:209. doi: 10.3390/land9060209
Dangles, O., and Casas, J. (2019). Ecosystem services provided by insects for achieving sustainable development goals. Ecosyst. Serv. 35, 109–115. doi: 10.1016/j.ecoser.2018.12.002
Diehl, E., Wolters, V., and Birkhofer, K. (2012). Arable weeds in organically managed wheat fields foster carabid beetles by resource-and structure-mediated effects. Arthrop. Plant Int. 6, 75–82. doi: 10.1007/s11829-011-9153-4
Donkersley, P. (2019). Trees for bees. Agricult. Ecosyst. Environ. 270, 79–83. doi: 10.1016/j.agee.2018.10.024
Eisenhauer, N., Vogel, A., Jensen, B., and Scheu, S. (2018). Decomposer diversity increases biomass production and shifts aboveground-belowground biomass allocation of common wheat. Scientific Rep. 8, 1–8.
Erbaugh, J. T., Pradhan, N., Adams, J., Oldekop, J. A., Agrawal, A., Brockington, D., et al. (2020). Global forest restoration and the importance of prioritizing local communities. Nat. Ecol. Evolut. 2020, 1–5.
Faucon, M. P., Houben, D., and Lambers, H. (2017). Plant functional traits: soil and ecosystem services. Trends Plant Sci. 22, 385–394. doi: 10.1016/j.tplants.2017.01.005
Fern, K., Fern, A., and Morris, R. (2014). Useful tropical plants database.Available online at: http://tropical.theferns.info/ ([accessed on 16 October 16, 2020)]
Fragoso, F. P., and Varanda, E. M. (2011). Flower-visiting insects of five tree species in a) restored area of semideciduous seasonal forest. Neotrop. Entomol. 40, 431–435.
Fu, B., Zhang, L., Xu, Z., Zhao, Y., Wei, Y., and Skinner, D. (2015). Ecosystem services in changing land use. J. Soils Sedim. 15, 833–843.
Gamfeldt, L., Snäll, T., Bagchi, R., Jonsson, M., Gustafsson, L., Kjellander, P., et al. (2013). Higher levels of multiple ecosystem services are found in forests with more tree species. Nat. Commun. 4, 1–8.
Gessner, M. O., Swan, C. M., Dang, C. K., McKie, B. G., Bardgett, R. D., Wall, D. H., et al. (2010). Diversity meets decomposition. Trends Ecol. Evolut. 25, 372–380. doi: 10.1016/j.tree.2010.01.010
González-Díaz, P., Ruiz-Benito, P., Gosalbez Ruiz, J., Chamorro, G., and Zavala, M. A. (2019). A Multifactorial Approach to Value Supporting Ecosystem Services in Spanish Forests and Its Implications in a Warming World. Sustainability 11:358. doi: 10.3390/su11020358
Greenslade, P. J. M. (1973). Sampling ants with pitfall traps: digging-in effects. Insectes Sociaux 20, 343–353. doi: 10.1007/bf02226087
Hand, K. L., Doick, K. J., and Moss, J. L. (2019). Ecosystem services delivery by large stature urban trees Research Report. Oxford: Oxford University.
Hättenschwiler, S., Tiunov, A. V., and Scheu, S. (2005). Biodiversity and litter decomposition in terrestrial ecosystems. Annual. Rev. Ecol. Evolut. Systemat. 36, 191–218. doi: 10.1146/annurev.ecolsys.36.112904.151932
Hawthorne, W., and Gyakari, N. (2006). Photoguide for the forest trees of Ghana: a tree-spotter’s field guide for identifying the largest trees. Oxford: Oxford University.
Hölting, L., Jacobs, S., Felipe-Lucia, M. R., Maes, J., Norström, A. V., Plieninger, T., et al. (2019). Measuring ecosystem multifunctionality across scales. Environ. Res. Lett. 14:124083. doi: 10.1088/1748-9326/ab5ccb
Jasaw, G. S., Saito, O., Gasparatos, A., Shoyama, K., Boafo, Y. A., and Takeuchi, K. (2017). Ecosystem services trade-offs from high fuelwood use for traditional shea butter processing in semi-arid Ghana. Ecosyst. Serv. 27, 127–138. doi: 10.1016/j.ecoser.2017.09.003
Kassambara, A. (2020). ggpubr: “ggplot2” Based Publication Ready Plots (Version 0.3. 0)[Computer software].
Kearney, S. P., Fonte, S. J., García, E., Siles, P., Chan, K. M. A., and Smukler, S. M. (2019). Evaluating ecosystem service trade-offs and synergies from slash-and-mulch agroforestry systems in El Salvador. Ecol. Indicat. 105, 264–278. doi: 10.1016/j.ecolind.2017.08.032
Kitz, F., Steinwandter, M., Traugott, M., and Seeber, J. (2015). Increased decomposer diversity accelerates and potentially stabilises litter decomposition. Soil Biol. Biochem. 83, 138–141. doi: 10.1016/j.soilbio.2015.01.026
Kremen, C., M’Gonigle, L. K., and Ponisio, L. C. (2018). Pollinator community assembly tracks changes in floral resources as restored hedgerows mature in agricultural landscapes. Front. Ecol. Evolut 6:170.
Lafond, V., Cordonnier, T., Mao, Z., and Courbaud, B. (2017). Trade-offs and synergies between ecosystem services in uneven-aged mountain forests: evidences using Pareto fronts. Eur. J. Forest Res. 136, 997–1012. doi: 10.1007/s10342-016-1022-3
Lavelle, P., Decaëns, T., Aubert, M., Barot, S., Blouin, M., Bureau, F., et al. (2006). Soil invertebrates and ecosystem services. Eur. J. Soil Biol. 42, S3–S15.
Lewis, S. L., Sonké, B., Sunderland, T., Begne, S. K., Lopez-Gonzalez, G., Van Der Heijden, G. M., et al. (2013). Above-ground biomass and structure of 260 African tropical forests. Philos. Trans. Roy. Soc. B 368:20120295.
Li, Z., Deng, X., Jin, G., Mohmmed, A., and Arowolo, A. O. (2020). Trade-offs between agricultural production and ecosystem services: A case study in Zhangye, Northwest China. Sci. Tot. Environ. 707:136032. doi: 10.1016/j.scitotenv.2019.136032
Luck, G. W., Daily, G. C., and Ehrlich, P. R. (2003). Population diversity and ecosystem services. Trends Ecol. Evolut. 18, 331–336.
Luong, J. C., Turner, P. L., Phillipson, C. N., and Seltmann, K. C. (2019). Local grassland restoration affects insect communities. Ecol. Entomol. 44, 471–479. doi: 10.1111/een.12721
Lyytimäki, J., and Sipilä, M. (2009). Hopping on one leg–The challenge of ecosystem disservices for urban green management. Urban Forest. Urban Green. 8, 309–315. doi: 10.1016/j.ufug.2009.09.003
Maldonado, M. B., Aranibar, J. N., Serrano, A. M., Chacoff, N. P., and Vázquez, D. P. (2019). Dung beetles and nutrient cycling in a dryland environment. Catena 179, 66–73. doi: 10.1016/j.catena.2019.03.035
Mander, Ü, Helming, K., and Wiggering, H. (2007). Multifunctional land use: meeting future demands for landscape goods and services. Multifunct. Land Use 2007, 1–13. doi: 10.1007/978-3-540-36763-5_1
Manning, P., Slade, E. M., Beynon, S. A., and Lewis, O. T. (2016). Functionally rich dung beetle assemblages are required to provide multiple ecosystem services. Agricult. Ecosyst. Environ. 218, 87–94. doi: 10.1016/j.agee.2015.11.007
Manning, P., van der Plas, F., Soliveres, S., Allan, E., Maestre, F. T., Mace, G., et al. (2018). Redefining ecosystem multifunctionality. Nat. Ecol. Evolut. 2, 427–436. doi: 10.1038/s41559-017-0461-7
Millennium Ecosystem Assessment [MEA] (2005). Ecosystems and human well-being (Vol. 5). Washington, DC: Island Press.
Mori, A. S., Lertzman, K. P., and Gustafsson, L. (2017). Biodiversity and ecosystem services in forest ecosystems: a research agenda for applied forest ecology. J. Appl. Ecol. 54, 12–27. doi: 10.1111/1365-2664.12669
Morrison, E. B., and Lindell, C. A. (2011). Active or passive forest restoration? Assessing restoration alternatives with avian foraging behaviour. Restor. Ecol. 19, 170–177. doi: 10.1111/j.1526-100x.2010.00725.x
Nicholls, C. I., and Altieri, M. A. (2013). Plant biodiversity enhances bees and other insect pollinators in agroecosystems. Rev. Agron. Sust. Devel. 33, 257–274. doi: 10.1007/s13593-012-0092-y
Nunoo, I., Darko, B. O., and Owusu, V. (2015). Restoring degraded forest landscape for food security: Evidence from cocoa agroforestry systems, Ghana. Viet. Nam. 122:2015.
Pais, M. P., and Varanda, E. M. (2010). Arthropod recolonization in the restoration of a semideciduous forest in southeastern Brazil. Neotr. Entomol. 39, 198–206. doi: 10.1590/s1519-566x2010000200009
Peña, L., Onaindia, M., Fernández, de Manuel, B., Ametzaga-Arregi, I., and Casado-Arzuaga, I. (2018). Analysing the synergies and trade-offs between ecosystem services to reorient land use planning in metropolitan Bilbao (Northern Spain). Sustainability 10:4376. doi: 10.3390/su10124376
Powell, B., Thilsted, S. H., Ickowitz, A., Termote, C., Sunderland, T., and Herforth, A. (2015). Improving diets with wild and cultivated biodiversity from across the landscape. Food Secur. 7, 535–554. doi: 10.1007/s12571-015-0466-5
Raudsepp-Hearne, C., Peterson, G. D., and Bennett, E. M. (2010). Ecosystem service bundles for analyzing trade-offs in diverse landscapes. Proc. Natl. Acad. Sci. U. S. A. 107, 5242–5247. doi: 10.1073/pnas.0907284107
Reed, J., van Vianen, J., Foli, S., Clendenning, J., Yang, K., MacDonald, M., et al. (2017). Trees for life: The ecosystem service contribution of trees to food production and livelihoods in the tropics. Forest Policy Econ. 84, 62–71. doi: 10.1016/j.forpol.2017.01.012
Reubens, B., Moeremans, C., Poesen, J., Nyssen, J., Tewoldeberhan, S., Franzel, S., et al. (2011). Tree species selection for land rehabilitation in Ethiopia: from fragmented knowledge to an integrated multi-criteria decision approach. Agrof. Syst. 82, 303–330. doi: 10.1007/s10457-011-9381-8
Santoro, A., Venturi, M., Bertani, R., and Agnoletti, M. (2020). A Review of the Role of Forests and Agroforestry Systems in the FAO Globally Important Agricultural Heritage Systems (GIAHS) Programme. Forests 11:860. doi: 10.3390/f11080860
Schmidt, M. H., Clough, Y., Schulz, W., Westphalen, A., and Tscharntke, T. (2006). Capture efficiency and preservation attributes of different fluids in pitfall traps. J. Arachnol. 34, 159–162. doi: 10.1636/t04-95.1
Seymour, F., and Harris, N. L. (2019). Reducing tropical deforestation. Science 365, 756–757. doi: 10.1126/science.aax8546
Shimamoto, C. Y., Padial, A. A., da Rosa, C. M., and Marques, M. C. (2018). Restoration of ecosystem services in tropical forests: A global meta-analysis. PLoS One 13:e0208523. doi: 10.1371/journal.pone.0208523
Soliveres, S., Van Der Plas, F., Manning, P., Prati, D., Gossner, M. M., Renner, S. C., et al. (2016). Biodiversity at multiple trophic levels is needed for ecosystem multifunctionality. Nature 536, 456–459.
Staab, M., and Schuldt, A. (2020). The influence of tree diversity on natural enemies—a review of the “enemies” hypothesis in forests. Curr. Fores. Rep. 2020, 1–17.
Strobl, K., Kollmann, J., and Teixeira, L. H. (2019). Integrated assessment of ecosystem recovery using a multifunctionality approach. Ecosphere 10:e02930.
Turkelboom, F., Leone, M., Jacobs, S., Kelemen, E., García-Llorente, M., Baró, F., et al. (2018). When we cannot have it all: Ecosystem services trade-offs in the context of spatial planning. Ecosyst. Serv. 29, 566–578. doi: 10.1016/j.ecoser.2017.10.011
United Nations Convention to Combat Desertification [UNCCD] (2014). Land degradation neutrality resilience at local, national and regional levels. Germany: United Nations Convention to Combat Desertification.
Underwood, E. C., and Quinn, J. F. (2010). Response of ants and spiders to prescribed fire in oak woodlands of California. J. Insect Conserv. 14, 359–366. doi: 10.1007/s10841-010-9265-7
Vandermeulen, S., Ramírez-Restrepo, C. A., Beckers, Y., Claessens, H., and Bindelle, J. (2018). Agroforestry for ruminants: a review of trees and shrubs as fodder in silvopastoral temperate and tropical production systems. Anim. Product. Sci. 58, 767–777. doi: 10.1071/an16434
Voeks, R. A., and Rahmatian, M. (2004). The providence of nature: Valuing ecosystem services. Int. J. Environ. Sci. Technol. 1, 151–163. doi: 10.1007/bf03325828
Wagner, S., Rigal, C., Liebig, T., Mremi, R., Hemp, A., Jones, M., et al. (2019). Ecosystem services and importance of common tree species in coffee-agroforestry systems: Local knowledge of small-scale farmers at Mt. Kilimanjaro, Tanzania. Forests 10:963. doi: 10.3390/f10110963
Waldron, A., Garrity, D., Malhi, Y., Girardin, C., Miller, D. C., and Seddon, N. (2017). Agroforestry can enhance food security while meeting other sustainable development goals. Trop. Conserv. Sci. 10:1940082917720667.
Weisse, M., and Goldman, E. D. (2020). The World Lost a Belgium-Sized Area of Primary Rainforests Last Year. World Resources Institute.26 Apr. 2019, Available online at: www.wri.org/blog/2019/04/world-lost-belgium-sized-area-primary-rainforests-last-year. ([accessed on on 09 October 09, 2020)]
Zemp, D. C., Ehbrecht, M., Seidel, D., Ammer, C., Craven, D., Erkelenz, J., et al. (2019). Mixed-species tree plantings enhance structural complexity in oil palm plantations. Agricult., Ecosyst. Environ. 283:106564. doi: 10.1016/j.agee.2019.06.003
Keywords: active restoration, biodiversity, deforestation, ecosystem services, forest, Ghana, mining
Citation: Damptey FG, de la Riva EG and Birkhofer K (2021) Trade-Offs and Synergies Between Food and Fodder Production and Other Ecosystem Services in an Actively Restored Forest, Natural Forest and an Agroforestry System in Ghana. Front. For. Glob. Change 4:630959. doi: 10.3389/ffgc.2021.630959
Received: 18 November 2020; Accepted: 15 April 2021;
Published: 12 May 2021.
Edited by:
Marion Pfeifer, Newcastle University, United KingdomReviewed by:
Matija Klopčič, University of Ljubljana, SloveniaCopyright © 2021 Damptey, de la Riva and Birkhofer. This is an open-access article distributed under the terms of the Creative Commons Attribution License (CC BY). The use, distribution or reproduction in other forums is permitted, provided the original author(s) and the copyright owner(s) are credited and that the original publication in this journal is cited, in accordance with accepted academic practice. No use, distribution or reproduction is permitted which does not comply with these terms.
*Correspondence: Frederick Gyasi Damptey, RnJlZGVyaWNrR3lhc2kuRGFtcHRleUBiLXR1LmRl
Disclaimer: All claims expressed in this article are solely those of the authors and do not necessarily represent those of their affiliated organizations, or those of the publisher, the editors and the reviewers. Any product that may be evaluated in this article or claim that may be made by its manufacturer is not guaranteed or endorsed by the publisher.
Research integrity at Frontiers
Learn more about the work of our research integrity team to safeguard the quality of each article we publish.