 Daniel P. Beverly
 Carmela R. Guadagno
 Brent E. Ewers
- 1Department of Botany, University of Wyoming, Laramie, WY, United States
- 2Water Resources/Environmental Science and Engineering, University of Wyoming, Laramie, WY, United States
- 3Program in Ecology, University of Wyoming, Laramie, WY, United States
Vegetation controls carbon and water fluxes because of the fundamental tradeoff between carbon dioxide uptake and water loss occurring when stomata are open. Quantifying the rates of this exchange typically requires either intensive gas exchange or destructive harvesting of tissues and mass spectrometry analyses. Recent developments in high-throughput methods have enhanced our capacity to empirically test plant–environmental interactions. The vast integration characterizing satellite remote sensing methods masks organ-level physiological mechanisms limiting the predictive capability of current process models. Hence, more ground truth studies are necessary to determine the amount of mechanistic information needed to improve our understanding of forest, crop, and land management. Imaging methodologies, such as thermal and chlorophyll a fluorescence, are currently used to collect information for relevant traits such as water use, growth, and stress response. We tested these techniques during progressive drought across species with different susceptibility in controlled greenhouse conditions. We chose two highly represented tree species in North America: the gymnosperm Pinus ponderosa and the angiosperm Populus tremuloides. To better explore the whole drought response parameter space, we also tested a crop (Brassica rapa) and desert shrub (Artemisia tridentata). Thermal and fluorescence images of the canopy were coupled with leaf-level measurements as we performed three tests to predict drought response using (1) leaf temperature, (2) chlorophyll a fluorescence, and (3) the combination of the two. At 5 days of drought, leaf temperature increased 7 and 10%, accounting for 63 and 73% of the variation in stomatal conductance for both tree species, respectively. The fluorescence signal from images decreased ∼12% and ∼83% in moderately and severely droughted leaves respectively, reaching zero at mortality. Leaf water status was then predicted using a Bayesian approach that incorporated measurements’ uncertainty and parsimony in the analysis of the parameters. Changes in canopy temperature provided confident predictions for the reductions of daily evapotranspiration at the onset of drought. Empirically combining thermal and fluorescence measurements improved predictions (R2 = 0.81) of midday leaf water potential compared to univariate models. Our results represent an important step toward quantifying plant water status during drought using first principles that do not require species-specific information.
Introduction
Drought is a primary contributor to the increasing levels of global plant mortality, which exacerbates the already uncertain water and food securities for the coming decades (Allen et al., 2010; Steinkamp and Hickler, 2015). The complexity of plant response to drought is characterized by a variety of symptoms (i.e., stomatal closure, osmotic adjustments, hydraulic failure, carbon starvation, regulation of invertase, and changes in allocation to less productive organs), which have been profusely analyzed in the last decades (Gorissen et al., 2004; Bréda et al., 2006; Schachtman and Goodger, 2008; Adams et al., 2009; Ruehr et al., 2009; McDowell and Sevanto, 2010; Ruan et al., 2010; Sala et al., 2010; Mcdowell, 2011; Hartmann et al., 2013; Urli et al., 2013; Sevanto et al., 2014; Salmon et al., 2015; Guadagno et al., 2017; Martínez-Vilalta and Garcia-Forner, 2017; Nolan et al., 2017). The onset of one or more of these symptoms clearly decreases productivity and increases the probability of mortality. However, predicting the plant water status in response to progressive soil water limitations remains uncertain and complicated by diverse plant water use resulting in a wide spectrum of drought resistance strategies (Hartmann et al., 2013; Salmon et al., 2015; Guadagno et al., 2017).
Efficient monitoring of vegetation water use and screening of vulnerable areas are essential, given the possibly deadly effects of water scarcity. The use of informative high-throughput (i.e., high number of measured plants in a short time, repeated time points, and multiple spatial locations) methods based on biophysical first principles allow for more useful predictions of plant responses to drought because they are based on mechanisms more likely to be applicable outside observations. Such approaches also span from organ to ecosystem scales and can provide informative predictions in less measured environments and for divergent plant responses to stress. Predicting community or ecosystem behavior under drought is often elusive due to the broad spectrum of strategies plants can adopt, and the potentially stochastic aspects of duration, severity, and frequency of the stress event, with confounding interactions of the soil and atmosphere (Grieu et al., 1988; Tardieu and Simonneau, 1998; Naithani et al., 2012; Will et al., 2013; Duursma et al., 2019; Zhou et al., 2019). The magnitude of plant response varies based on endogenous stress resistance, life history, developmental stage at the stress occurrence, pre-drought conditions, and synergistic or compound stress events (e.g., antecedent stress events) (Resco et al., 2009; Camarero et al., 2011; de Vries et al., 2012; Anderegg, 2015; Guo et al., 2020).
The presence of numerous remotely sensed imaging techniques from organ-level chambers to entire canopies and ecosystems, further complicates the achievement of a universal means of prediction (Tanner, 1963; Jones, 2004; Flexas et al., 2007; Cleary et al., 2015; Mahlein, 2016; van Dusschoten et al., 2016; Still et al., 2019). Although satellite-based imaging and remote sensing methods coarsely inform predictions of plant water status and stress response using spectral signatures, they often mask local, individual, and stand variation along with sudden changes due to limited return intervals (Milton, 1987; Carter, 1998; Gitelson et al., 2003; Halcro and Noble, 2018). Lately, the development of near remote sensing techniques with higher spatial resolution, has facilitated quantifying physiological and anatomical variations at leaf- and whole-plant-level in crops (Dhondt et al., 2013; Humplík et al., 2015; Ryan et al., 2016; Salon et al., 2017; Jud et al., 2018). Among others, chlorophyll a fluorescence (ChlF) and infrared thermometry (e.g., infrared radiometers and thermal images) are metrics of leaf water status broadly utilized for their non-invasive nature to measure photosynthetic capacity and leaf temperature (TL), which are mechanistically connected to transpiration, carbon uptake, and photochemistry (Van Kooten and Snel, 1990; Kalaji et al., 2016; Guadagno et al., 2017; Simon et al., 2018). These recent advancements have increased the demand for similar high-throughput and high-resolution methods for monitoring entire forests and ecosystems (Fahlgren et al., 2015; Gutiérrez et al., 2016; Dungey et al., 2018; Santini et al., 2019; Still et al., 2019).
We utilize high spatial resolution thermal and Pulse-Amplitude Modulated (PAM) ChlF imagery to identify plant responses to progressive soil water limitations, from mild to lethal, hereafter referred to as drought. These two imaging techniques directly correspond to changes in biomass accumulation upon water stress; TL is dynamic with water use while ChlF reflects changes in photochemistry. We test whether biophysically informative image-based parameters (i.e., TL and ChlF) are able to predict changes in plant water status following drought, recovery, and mortality (Figure 1A). We tested three image-based modeling approaches using (1) leaf temperature, (2) chlorophyll a fluorescence, and (3) the combination of both, and evaluated their ability to predict changes in plant water status associated with drought (Table 1). The near remotely sensed high-throughput images and the coinciding models are validated using infrared radiometry, leaf-level gas exchange, and spot ChlF measurements. Our approach is applied to a panel of extreme plant types from broad-leaf (Populus tremuloides) and needle-leaf (Pinus ponderosa) temperate trees to a crop (Brassica rapa) and a desert shrub (Artemisia tridentata) covering an extreme spectrum of drought response strategies (Figure 1B).
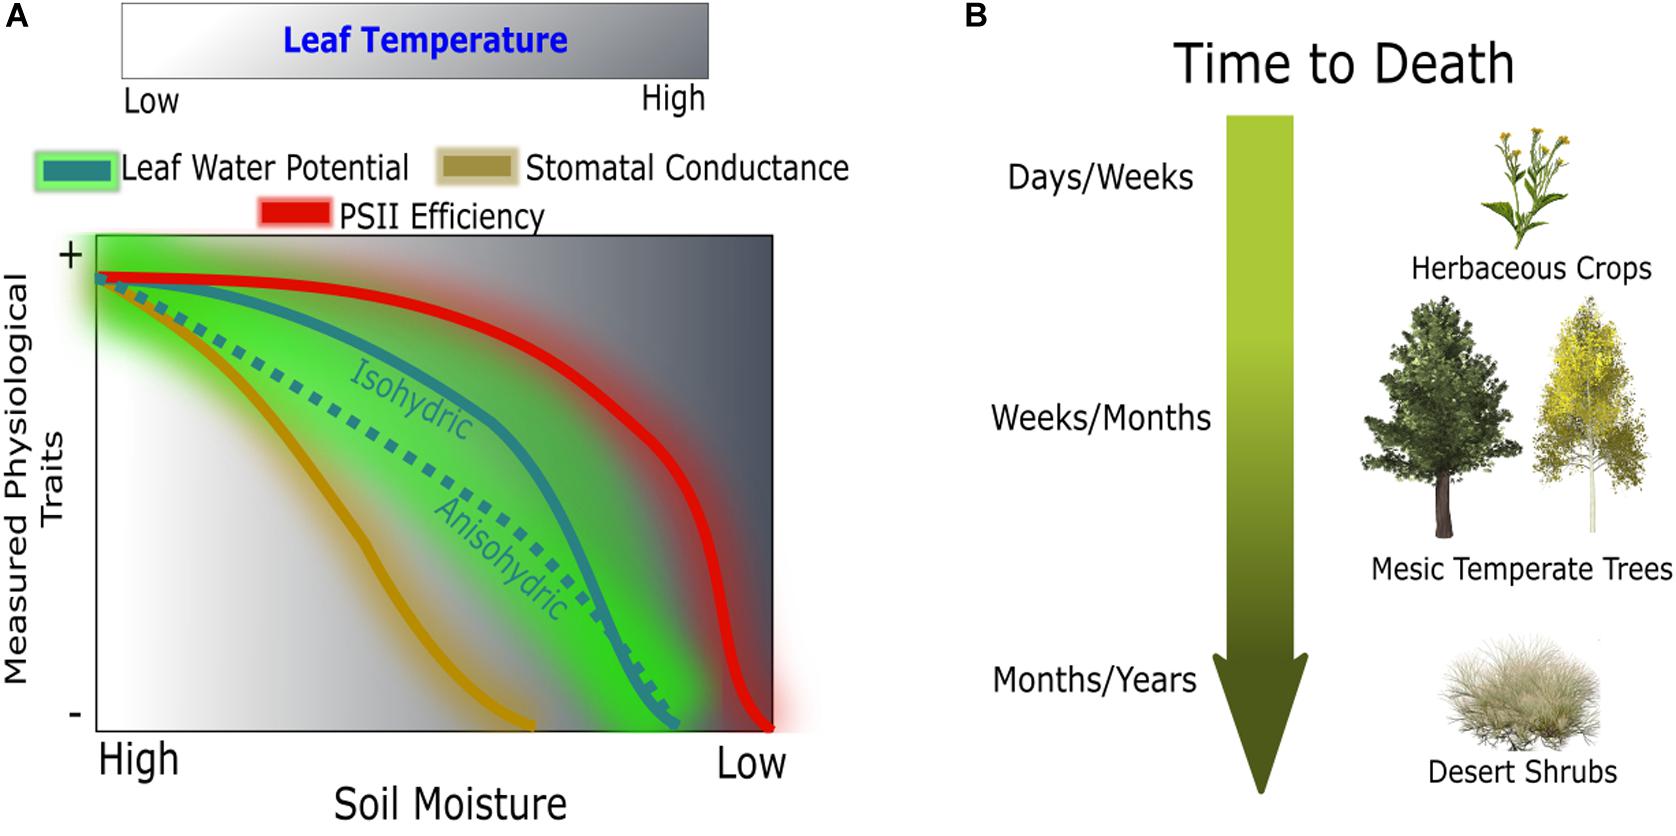
Figure 1. Conceptual hypothesis of physiological responses during drought (A) and susceptibility across a spectrum of drought tolerance species (B). Comparison between linear responses of gas exchange and threshold responses of leaf water potential and PSII efficiency across a normalized gradient of leaf temperature.
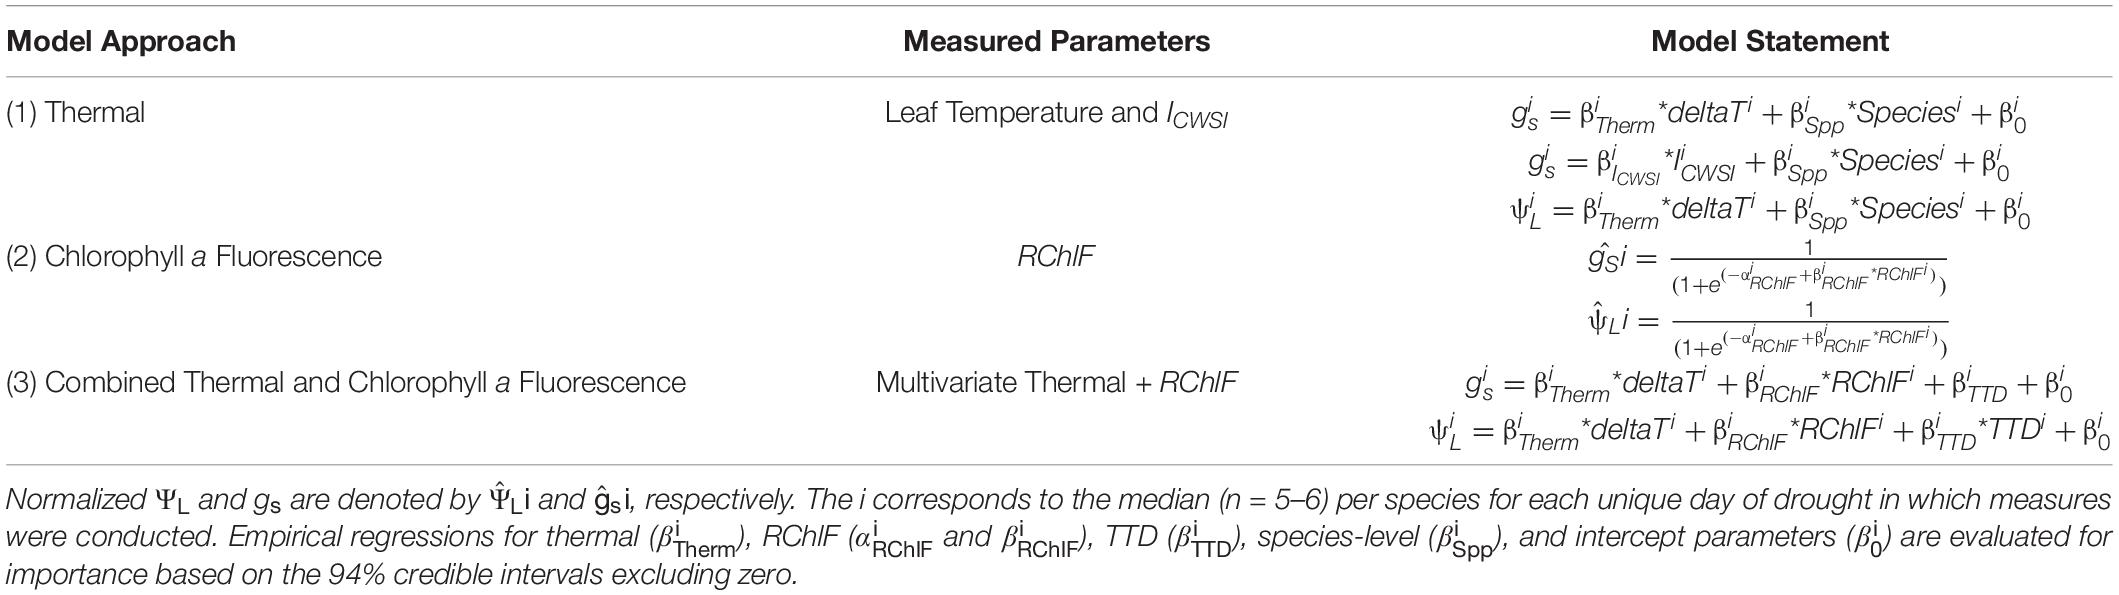
Table 1. Three image-based modeling approaches [i.e., thermal, relative chlorophyll a fluorescence (RChlF), and combined thermal and RChlF)] for predicting plant water status parameters [i.e., stomatal conductance (gs) and leaf water potential (ΨL)] with respect to species and drought induced time to death (TDD).
We probabilistically addressed the varying degrees of uncertainty (variety of species, drought scenarios, methods, and scales) of the three image-based modeling approaches (Table 1) using Bayesian statistical approaches (Link et al., 2002; Wang et al., 2009; Xu et al., 2015; Anderegg et al., 2016; Ryu et al., 2019). Hierarchical Bayesian approaches provide robust, testable predictions from the data in hand while allowing for probabilistic testing of false positives interacting with model complexity and probabilistic exploration of measurement error (Olejnik and Algina, 1983; Press, 2005; Lu et al., 2017). Both of these benefits are crucial when using different types of measurements to increase transparency in the analyses and inferences using explicit priors and credible intervals to better explain the variation in the data (Samanta et al., 2007; Ogle and Barber, 2008; Quaife and Cripps, 2016; King et al., 2019; Phillipson et al., 2020).
Materials and Methods
Greenhouse Experiment
Two drought experiments were developed [i.e., moderate (2019) and severe drought (2018)] to test the three image-based modeling approaches (i.e., thermal, ChlF, and the combination, Table 1) and their ability to predict plant water status. The moderate drought experiment in 2019 was conducted to refine physiological responses during mild and moderate drought that were less represented in the severe drought experiment. The combined results reflect a full progressive drought event on aspen (Populus tremuloides, POTR) and ponderosa pine (Pinus ponderosa, PIPO) seedlings.
Drought was applied to 3 years old seedlings for 45 days after 3 weeks of establishment in pots with well-watered conditions. The PIPO seedlings were 3 years of age and purchased from the University of Idaho Nursery. The POTR seedlings were 3 years old, purchased from the Montana Conservation Nursery. Soils for both species were collected from species-specific locations from Medicine Bow National Forest (41° 14′49.0″ N, 105° 26′53″ W at approximately 2650 m.a.s.l.) then sieved removing rocks and larger pieces of organic material.
To validate the applicability of our approach, we also quantified drought responses for a crop (R500 oilseed, Brassica rapa var. Yellow Sarson, BRR5) and a cold desert shrub (big sagebrush, Artemisia tridentata, ARTR). The BRR5 were grown from seeds (University of Wyoming 2012) in a soil mixture [Miracle-Gro soil moisture control Potting Mix (20% v/v), Marysville, OH, United States and Profile Porous Ceramic (PPC) Greens Grade (80% v/v) Buffalo Grove, IL, United States] amended with 4 ml of Osmocote 16-6-12 fertilizer (Scotts, Marysville, OH, United States) in well-watered (i.e., watered daily) conditions until 4 weeks of age; then seedlings and soil mixture were added to approximately 4.0 L of sand to reach the soil volumes in the same pot type used for the woody species. The ARTR (2 years of age) came from the New Mexico Forestry Division and were grown in the same soils from Medicine Bow National Forest. Both ARTR and BRR5 were excluded from the 2019 experiment to increase replication for more detailed measurements of the POTR and PIPO responses to drought (Table 2). In 2019, 3 years old seedlings for POTR and PIPO were purchased from the Montana Conservation Nursery and exposed to moderate drought defined by water withholding for 23 days. In 2019, soils were mixed with 50% propagation soil (Fafard Germination Mix, Sungro, Agawam, MA, United States) added to increase water-holding capacity. In both 2018 and 2019, the experiments were conducted in the greenhouse of the Williams Conservatory at the University of Wyoming where seedlings were grown in 4.8 L pots. For both drought experiments, all plants were acclimated to pot conditions for 3 weeks in well-water conditions (i.e., ∼25% VWC) using regular irrigation intervals. A schematic representation of the random block experimental designs is given in Figure 2. Volumetric soil content values between the two experiments covered the entire range of soil conditions from well-watered, to mild, moderate, severe drought, recovery, and eventually leading to mortality (Supplementary Figure S1).
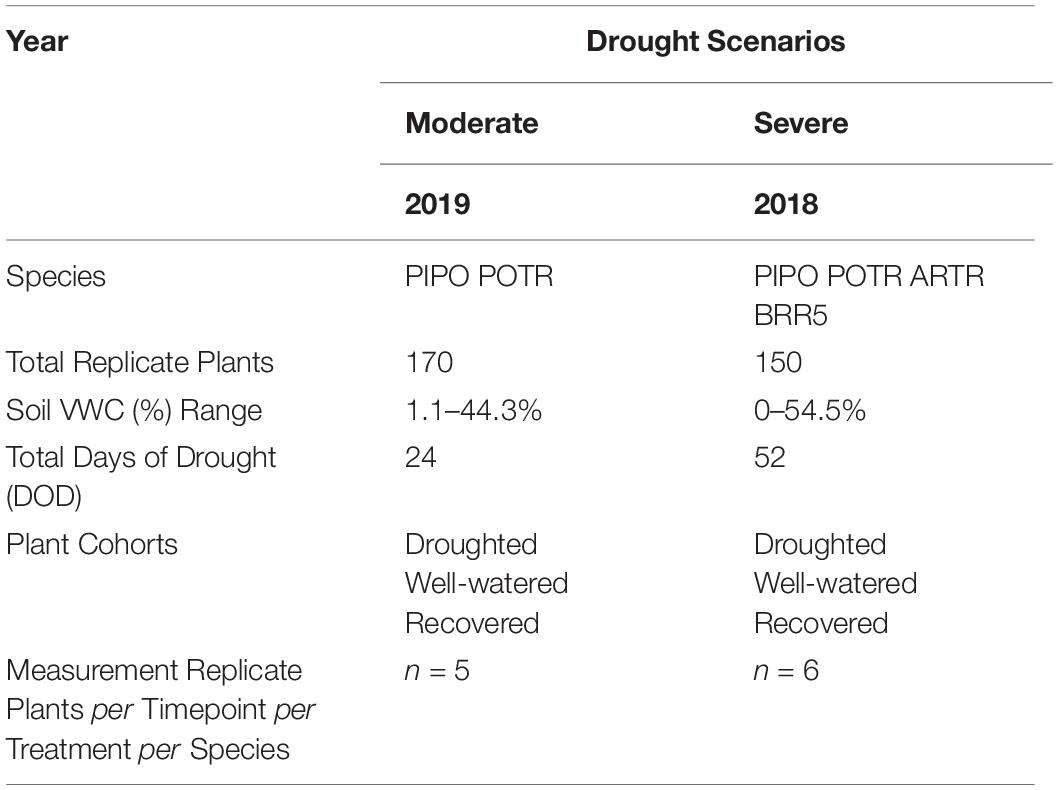
Table 2. Describing moderate (2019) and severe (2018) drought scenarios and the associated species, number of replicants, days of drought, cohorts, and time point replication.
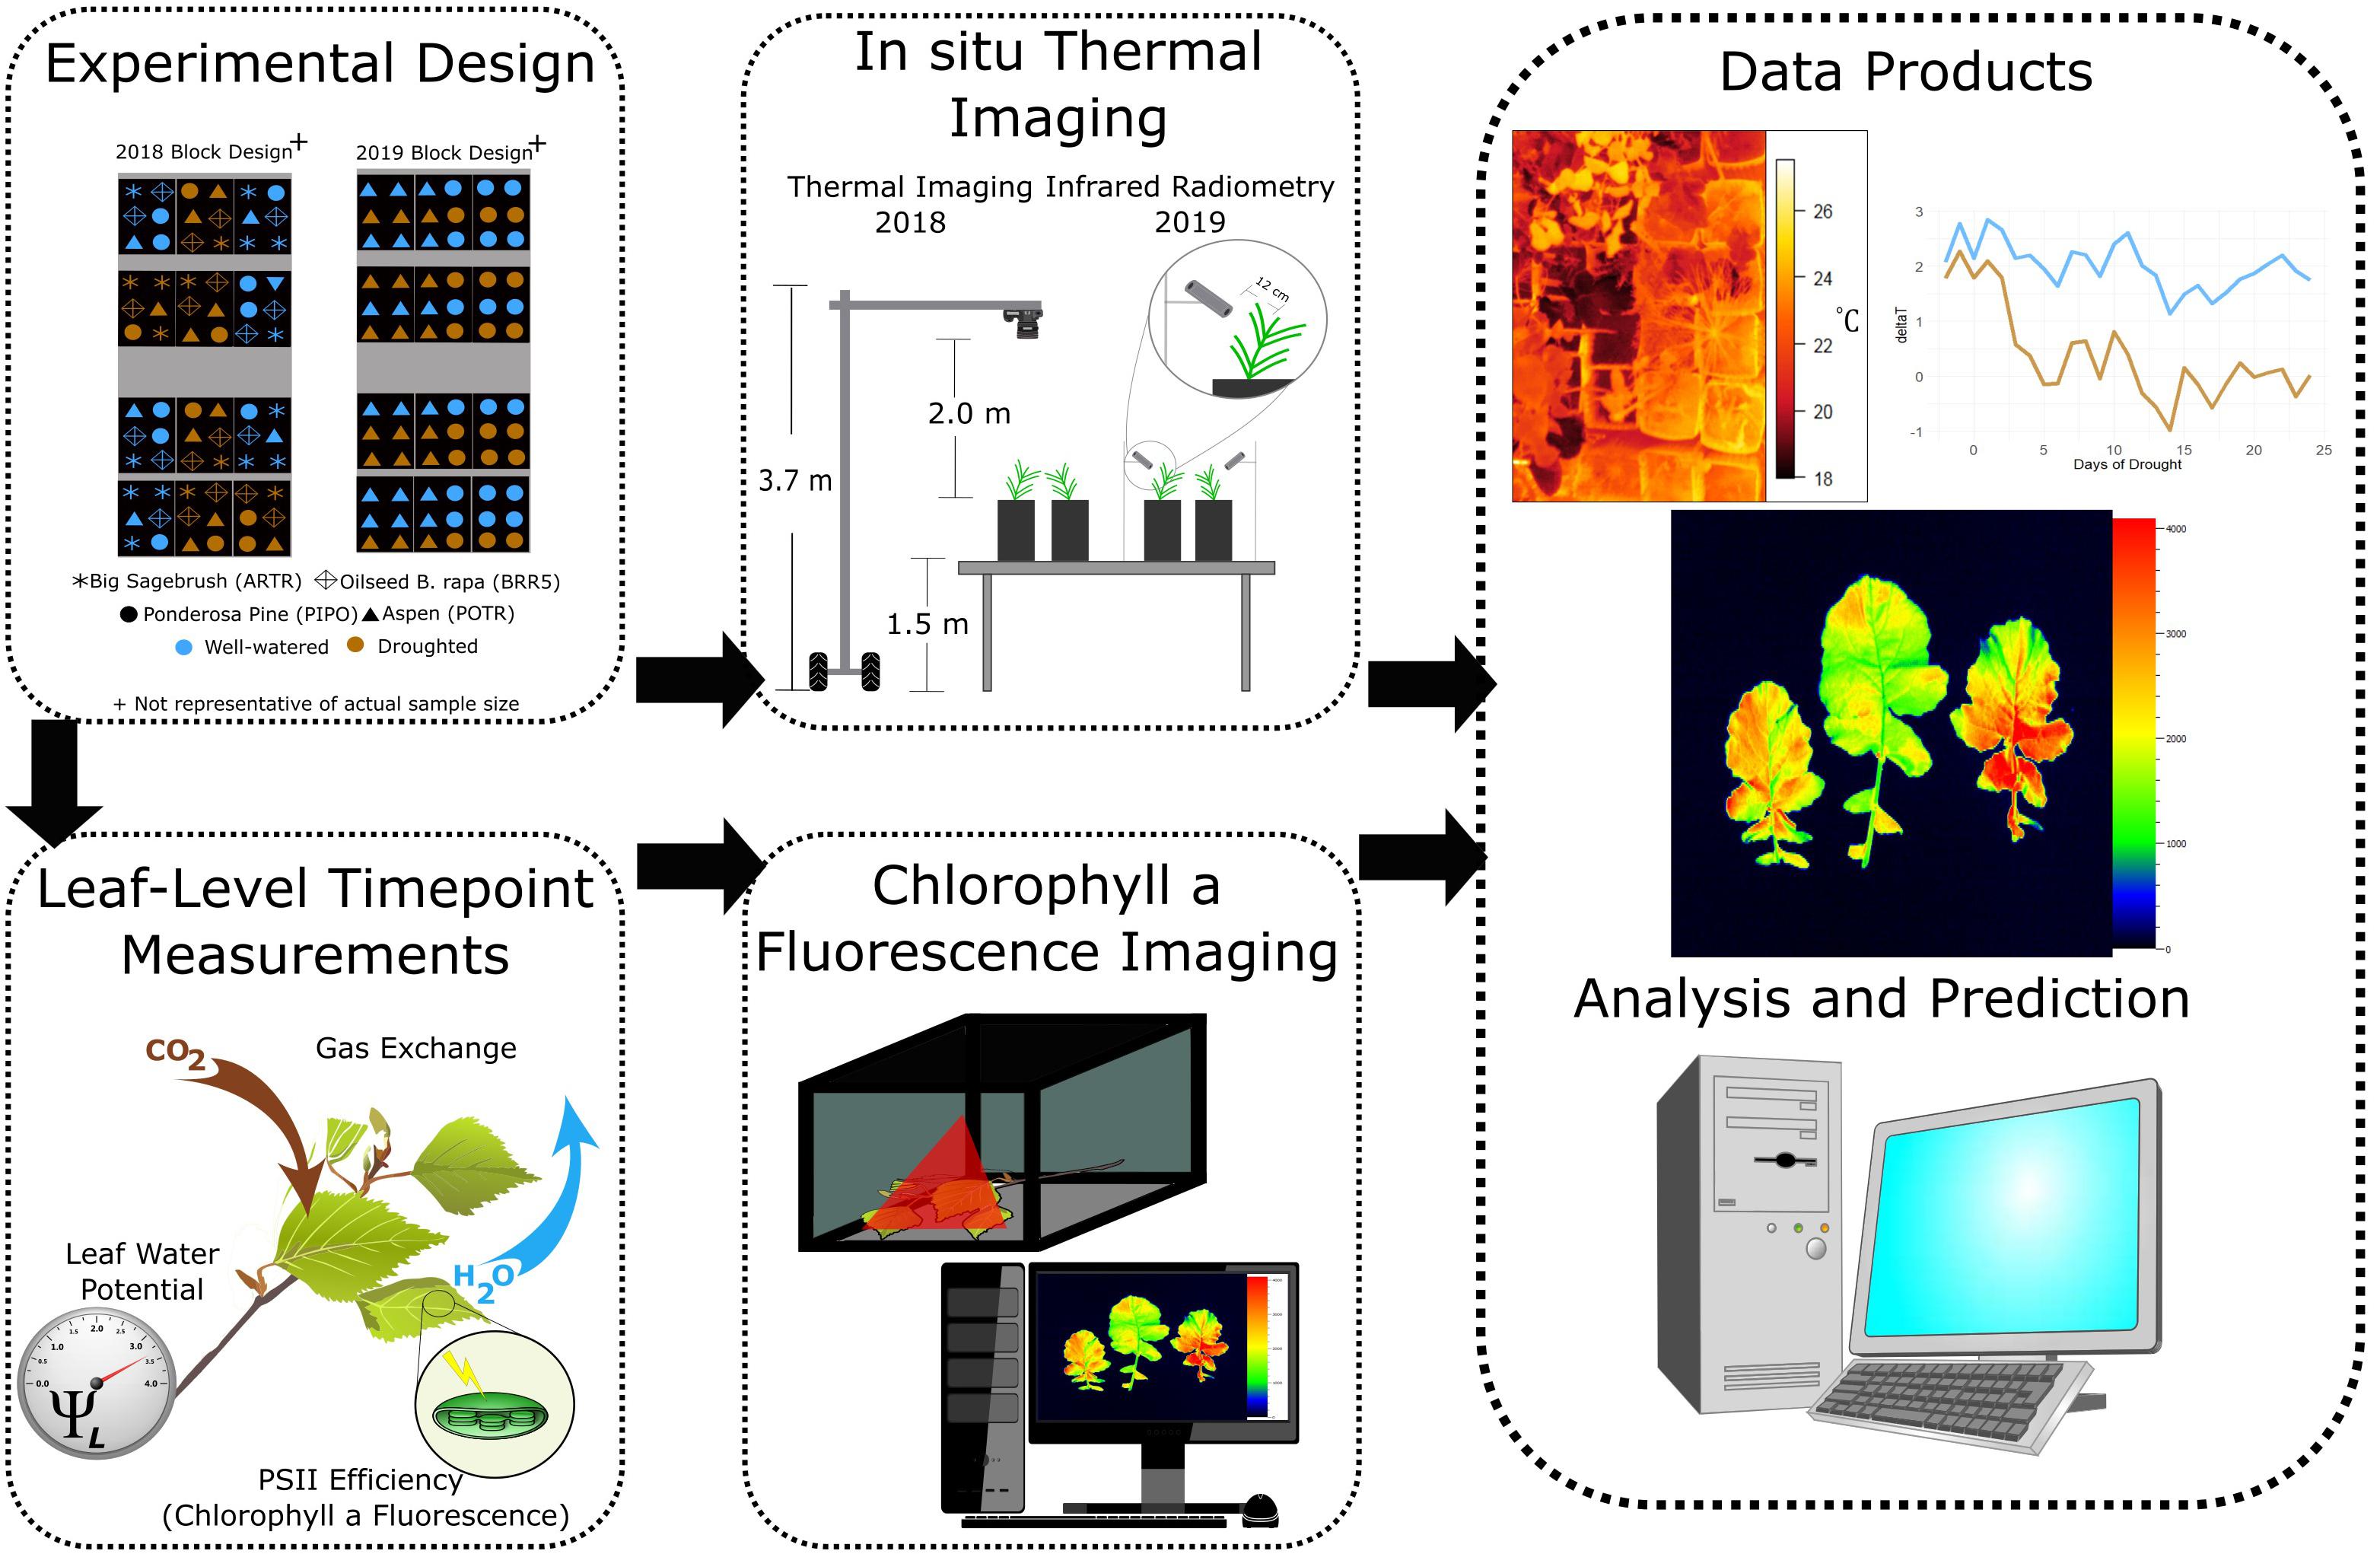
Figure 2. Experimental design illustrating the integration of thermal, leaf-level measurements (ground truthing), and chlorophyll fluorescence images for severe (2018) and moderate (2019) drought scenarios.
In 2018, plants were placed in random block design consisting of 150 plants (n = 15 of each species per treatment) in 19 blocks (Table 2). Random block design in 2019 consisted instead of 170 plants (n = 60 per species per treatment, additionally n = 5 recovered plants per species) (Table 2). In 2018, random droughted plants were selected for re-watering to observe recovery following severe drought. The well-watered, droughted, and recovered plants in 2019 were predetermined before the initiation of soil water limitation (Supplementary Figure S1). In 2018, the drought treatment was extreme (final predawn ΨL < −10 MPa), and all plants reached mortality while in 2019, we assessed response to moderate drought (final predawn ΨL > −4 MPa) and re-watering. For this reason, our results will be addressed from now on as moderate drought (2019, using PIPO and POTR) and severe drought (2018, using PIPO, POTR, ARTR, and BRR5). The combined results from both the moderate and severe drought experiments (i.e., Figures 3, 4, 8) cover the entire range of water limitations, from mild to severe and mortality providing a rigorous test for ground-truthed near remotely sensed data across different species and conditions.

Figure 3. Aspen (POTR, triangles) and ponderosa pine (PIPO, circles) measurements of stomatal conductance (gs, A), photosystem II efficiency (Fv′/Fm′, B), and leaf water potential (ΨL, C) from combined drought experiments, moderate to severe. Individual replicates (gold) and the prior data maximum likelihood estimates (MLE, red) for respective days of drought are presented. Data 50% (dark gray) and 94% (light gray) creditable intervals corresponding to days of drought at each time point (n = 6).
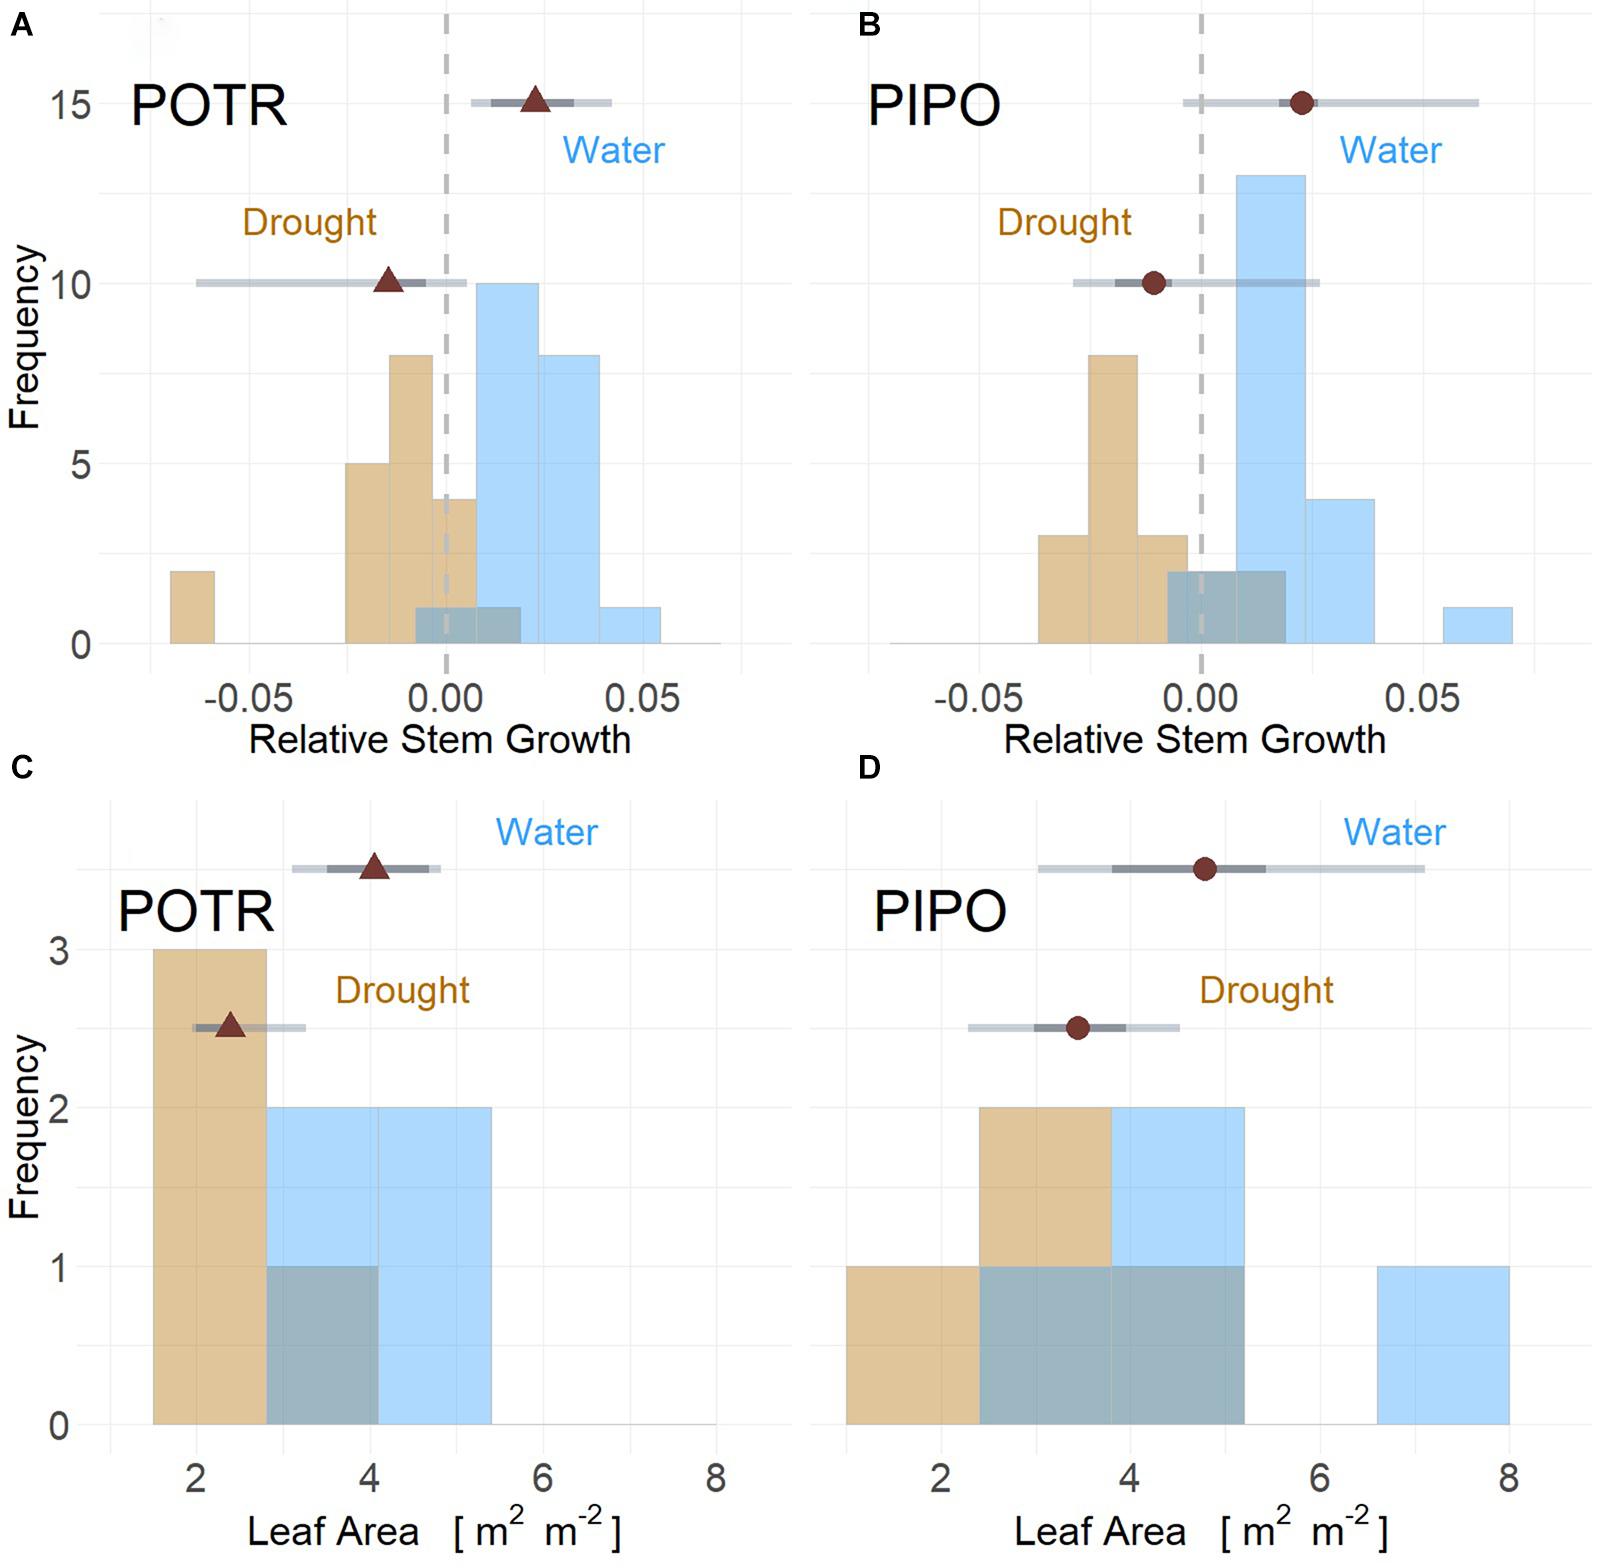
Figure 4. Stem growth and leaf area for POTR (triangle) (A,C) and PIPO (circle) (B,D) under drought (gold) and well-watered (blue) conditions. Stem growth rates from both moderate and severe drought scenarios resulted in limited growth and reductions when compared to well-watered individuals for both POTR (A) and PIPO (B). Leaf area for both droughted POTR (C) and PIPO (D) were less than well-watered treatments (C), albeit significant reductions only observed in aspens. Maximum likelihood estimates (MLE, red) with the 50% (dark gray) and 94% (light gray) represented by error bars.
Throughout both experiments, the greenhouse environment was continuously monitored for temperature and relative humidity, solar radiation, and soil moisture. In 2018, measurements were recorded at 15-min intervals on a CR3000 data logger (Campbell Scientific Inc., Logan, UT, United States). Long- and shortwave radiation for the greenhouse was monitored using a four-channel net radiometer (CNR4, Kipp and Zonen Delft, Netherlands) along with incoming photosynthetic photon flux densities (PPFD, LI190SB, LiCor Inc., Lincoln, NE, United States), measured at plant height in the middle of each bench. Seasonal light conditions in the greenhouse was similar between the 2 years, with an average (±standard deviation) PPFD of 157 ± 225.5 μmol m–2 s–1 and 135 ± 196.2 μmol m–2 s–1 for severe drought (2018) and moderate drought (2019), with comparable results in life history (i.e., growth) an biomass accumulation between the 2 years. Atmospheric temperature and relative humidity measurements of the room were taken at 2 m (HC2A, Rotronic, Hauppauge, NY, United States). Continuous soil moisture was monitored using 10 Echo-10 SM (Decagon Devices Inc., Pullman, WA, United States) soil moisture probes (one per treatment) and 30 soil gypsum blocks (three per treatment) estimating soil water potential (Supplementary Figure S1). Soil moisture sensors were calibrated to each of the four soil types (POTR, PIPO, BRR5, ARTR) using gravimetric water content (Campbell et al., 2007). Soil water potentials were calibrated with water retention curves constructed from psychrometric instruments (WP4-C, Decagon Devices Inc., Pullman, WA, United States) upon completion of the experiment on each soil type.
Leaf-Level Physiological Measurements
During both moderate (2019) and severe (2018) droughts, measurements included soil volumetric water content (VWC) (Hydrosense, Campbell Scientific Inc., Logan, UT, United States, and Echo5, Decagon Devices Inc., Pullman, WA, United States) and stem diameter for the tree species (POTR and PIPO) using calipers. In 2018, repeated measurements of all pots were conducted weekly while in 2019, all plants were screened every third day before physiological and imaging intensive time points.
Time point leaf-level measurements were conducted to capture gas exchange (LI-6400XT, LiCor Biosciences, Lincoln, NE, United States), leaf-water potential (ΨL) (PMS Instrument Company, Albany, OR, United States), and ChlF (LI-6400XT fluorimeter (6400-40), LiCor Biosciences, Lincoln, NE, United States) as dark acclimated PSII quantum yield (Fv/Fm) or light acclimated PSII efficiency (Fv′/Fm′) and fresh leaf biomass. Throughout the course of both experiments, measurements were taken every 3–7 days to cover the range of soil moisture conditions, for a total of eight to 10 time points (Table 2). Each time point consisted of measuring between 10 and 12 (five-six well-watered and five-six droughted) samples of each species randomly selected from across the blocks. Predawn measurements were taken 2 h prior to sunrise for both experiments while midday collections started at 1100 (11:00 MDT). Gas exchange parameters were set to 400 μmol mol–1 CO2 for both midday and predawn measurements. In 2018, predawn and midday TL was set to 20 and 25°C, respectively. Midday measurement PPFD was set to 500 μmol m–2 s–1. In 2019, conditions in the greenhouse were cooler than the previous year, thus, leaf temperatures were set to 18 and 20°C in the cuvette at predawn and midday time points, respectively. Additionally, midday light levels were increased to 1000 μmol m–2 s–1 for gas exchange measurements to better match the greenhouse conditions. Due to the differences in light levels, gs are either analyzed independently or normalized between zero and one (Figure 9C) to compare gas exchange measurements between moderate and severe drought scenarios. Saturation pulses for fluorescence measurements were set to approximately 4,200 photons μmol m–2 s–1. At both predawn and midday, leaves were excised for measurement of ΨL and fluorescence imaging. On the final day of drought (i.e., last time point) after the physiological measurements, all of the excised leaves were scanned using a flatbed scanner and analyzed for total leaf area. Scans were processed using ImageJ.
Image Collection
For the severe drought experiment (2018), all thermal and ChlF images were taken at each time point corresponding with other physiological measurements between 10:00 and 14:00 mountain standard time (MST) to avoid inconsistent lighting conditions associated with sunrise (∼0600 MST), sunset (∼2000 MST) and grow lights in the greenhouse (∼0500-0900 MST). Thermal images captured three blocks (i.e., 12 pots), from approximately 2 meters above the bench and 1.5 meters above the pots (Figure 2). Both well-watered and droughted plants were simultaneously captured in each image as blocks were randomly mixed for each treatment (Figure 2). While thermal measurements were taken in the greenhouse environment and for entire plants, ChlF imaging occurred on single leaves taken to the FluorCam directly after gas exchange and in situ ChlF measurements.
Thermal and RGB Measurements
During the severe drought experiment (2018), thermal and color (RGB) images were captured using a FLIR 420T camera (FLIR Systems Inc., Wilsonville, OR, United States) with a 35 mm lens. The senor had an accuracy of ±1% for measurements within the range of 5–120°C in ambient temperatures lower than 35°C. Thermal images were post-processed using FLIRTools, correcting for long-wave radiation attenuation effects using target distances, ambient vapor pressures, and ambient temperatures from meteorological data collected in the greenhouse (Page et al., 2018). Images were not corrected for greenhouse long-wave emissions, as corrections were less than the sensitivity of the instrument (Page et al., 2018). Corrections of leaf emissivity (ε) were standardized at 0.97 because previous studies have shown no difference in droughted and watered leaves (Buitrago et al., 2016). Regions of interest (ROI) were developed based on leaf size and leaf condition determined from the RGB image. A binary mask of leaf or not-leaf was stacked on thermal images isolating leaf temperatures. In 2019, the infrared radiometers were also corrected for leaf emissivity of 0.97 (Buitrago et al., 2016).
Ambient air temperature (Ta) measured on micrometeorological stations was used to correct thermal signatures for both camera and radiometers. In 2019, mean daytime TL was calculated from infrared radiometers. For both camera and radiometers, the empirical thermal index for crop water stress, ICSWI, was calculated using the greenhouse microclimate information (Equation 1).
Where TLDrought is daytime TL of droughted plants and TLWet is TL of actively transpiring leaf with no soil water limitations. While TLMax represents the maximal temperature observed on droughted leaves.
ChlF Image Collection and Analysis
The ChlF images were collected on excised leaves using a closed FluorCam (FC 800-C, Photon Systems Instruments, Drasov, Czechia). The youngest fully developed leaves were selected for each plant. Leaves were placed flat onto the imaging plate and screenshots recorded before (Fs) and immediately after (Fm′) the application of a saturating pulse. Saturating pulses were standardized at 4000 μmol m–2 s–1. For all captured images we developed a computing pipeline for pixel analysis. First, each image was separated into individual red, green, and blue color bands. Relative Chlorophyll Fluorescence (RChlF) was then estimated using the number counts of red (Rpix), green (Gpix) pixels, high and moderate actively fluorescing regions, compared to the sum of marginally fluorescing blue (Bpix) and actively fluorescing pixel regions throughout the entire image according to equation 2.
The RChlF measurements were compared to precise handheld PAM PSII efficiency (Fv′/Fm′) measurements from the IRGA fluorometer using a similar modeling approach (equation 3) to plant water status parameters (Table 1). Normalized PSII efficiency () measures, from zero to one, were used to compare across species and drought experiments.
Where and represent the logistic regression fitting parameters for RChlF. Same model was used for species specific responses.
Infrared Radiometer Data Collection
For the moderate drought experiment in 2019, micrometeorological conditions were monitored throughout the course of the drought with the addition of continuous measurement of TL using thermal radiometers (SI-111, Apogee Instruments Inc., Logan, UT, United States) 12 cm from top of both droughted and well-watered aspen and pine canopies. All measurements were measured every 5 s and averaged every minute on CR1000 data loggers (Campbell Scientific Inc., Logan, UT, United States).
Scaling Transpiration and Leaf Energy Balance
Timeseries measurements of TL from radiometers and thermal images were differenced from greenhouse Ta providing delta temperature (deltaT), which was used to develop relationships with ΨL, gs, and canopy resistance (rc). The energy balance of the leaf and canopy (Equation 4) was used to estimate daily evapotranspiration (ET) from both droughted and watered PIPO and POTR.
Where Rn is net incoming radiation, G is the soil and storage heat flux, H represents sensible heat flux, and λE represents the latent heat of vaporization of water and the evapotranspiration rate. Daily estimates of ET in millimeters per day per pot area (i.e., 156.25 cm2) were estimated using Penman-Monteith (PM) (Allen et al., 1998) (Equation 5).
Canopy resistance (rs) was empirically estimated using simple linear regressions of deltaT. Where Δ is the gradient of the water saturation vapor pressure curve (kPa K–1), ρ is the density of air (kg m–3) and specific heat of air is represented by Cp (J kg–1 K–1). The atmospheric dynamics are accounted for with both vapor pressure deficit (VPD) (kPa) and γ, the psychrometric constant (kPa K–1). Boundary layer resistance for water vapor transfer from the canopy to the atmosphere is represented by aerodynamic resistance (ra) (s m–1) and the resistance of water vapor diffusion through stomatal apertures is denoted by rs (s m–1). In the greenhouse, wind speeds were not directly measured and were assumed to be near zero (i.e., 0.01 m s–2). We assumed that stomatal resistance (rs) measured from the IRGA was linearly proportional to the entire canopy by multiplying per unit leaf area measurements from the IRGA by total leaf area for both POTR and PIPO to provide estimates of canopy resistance (Hatton and Wu, 1995; Leuning et al., 1995). Canopy decoupling within the greenhouse was assessed using canopy decoupling coefficients (Ω) (Jarvis and McNaughton, 1986).
Image-Based Modeling Approaches
To understand the consequences of soil water limitations on plant water status we modeled drought induced changes in gs and ΨL with respect to (1) thermal, (2) ChlF, and (3) the combination of both thermal and ChlF signatures throughout moderate and severe drought events (Table 1). Multivariate linear regressions were utilized for thermal modeling approach (approach 1 Table 1) for predicting plant water status parameters (i.e., and ), where i represented the daily median. The daily median and its uncertainty for each i were used rather than individual measurements because we treated the measurements as populations to account for the necessity that some measurements occurred on different plants. The Bayesian analysis described in the next section incorporate these uncertainties. Predictions of were tested using two different thermal-based fixed effect covariates, and deltaTi, to evaluate which proxy of TL best explained the drought responses. The lack of Twet measurements from the thermal camera limited calculations of to the infrared radiometers (results in Figure 6C). Predictions of were only conducted using only deltaTi. Species level fixed effect covariates (i.e.,Speciesi) were added to account species-specific differences in drought response in all three thermal regression models. Additionally, intercept regression parameters () were included to improve predictions using the thermal covariates. We applied our thermal approach to predict ET using thermal parameters (i.e., deltaT). Daily deltaT and leaf-level gas exchange were used to predict stomatal conductance responses to drought. Timeseries measurements of deltaT were correlated with gs and then incorporated into the PM using linear Bayesian regression models. The PM thermal-based modeling approaches were then validated against gas exchange measurements.
The ChlF imaging approach (approach 2 in Table 1) aimed to evaluate the capability of RChlF to predict changes of and during progressive drought. Bayesian logistic regression models were used to quantify the physiological responses (i.e., Fv′/Fm′, gs, ΨL) to soil moisture limitations. The logistic regressions parameters (i.e., and ) were empirically fit to best explain the threshold dynamics observed in the RChlF measurements. However, direct comparisons of RChlF across drought responses and species was not possible due to the immense range of gs and ΨL. Hence, we normalized gs and ΨL between 1 (i.e., maximal gs and ΨL) and zero (i.e., minimal gs and ΨL) which are denoted by and . This normalization allowed methodological inferences across species and drought scenarios (i.e., comparison of the moderate and severe droughts).
After evaluating the predictions of gs and ΨL throughout progressive drought separately, we evaluated the predictive relationships using a combined thermal and RChlF image-based modeling approach (approach 3 in Table 1). The combined approach utilized a multivariate linear regression models to predict non-normalized gs and ΨL with fixed effects of deltaTi, RChlFi, and the length of drought expressed as the time to death (TDDi). The intercept regression parameters () were included to improve predictions of plant water status. For all three modeling approaches, the importance of the thermal (i.e., and ), RChlF ( and ), species-level (i.e.,), the time to death (i.e.,), and intercept () parameters were assessed using maximum likelihood estimates (MLE; i.e., the single most likely point of the posterior distribution) and credible intervals of posterior probabilities (Beauducel and Herzberg, 2006). Informative model parameters (i.e., significant effects) were determined if parameter MLE and 94% CI were equal to zero (posterior prob < 94%, i.e., low probability of effect) or not being equal to zero (posterior prob > 94%, i.e., inferred to be a high probability effect).
Data and Statistical Analysis
As noted by McElreath (2020), parameters such as treatment or TL, are what we are most interested in as model outcomes, but we do not measure them directly, thus, quantifying uncertainty in parameters is crucial. Hence, we used Bayesian statistical methods to quantify multiple, hierarchical error sources and report potential treatment differences and model predictions probabilistically. Physiological responses to soil water limitations were tested using Bayesian approaches that do not require assumptions of time, and are thus an improvement over repeated measures analysis of variance (ANOVA) (Figure 3 and Supplementary Figure S2) (Dietze, 2017). Bayesian inferences are based on clearly stated priors (Supplementary Table S1) and avoid the frequentist statistical assumptions that entire experiments should be repeated multiple times (Kruschke, 2010, 2013; Ogle and Barber, 2020). Throughout our study, we report likelihood credible intervals that explicitly incorporate variability both directly observed in our experiments and uncertainty from measurements themselves (McElreath, 2020). Result Figures 3–10 and Supplementary Figures S2, S4–S7) report both the 50 and 94% credible intervals to transparently illustrate the variation and uncertainty surrounding the data and image-based model predictions. Additionally, the model fits based on the mean Bayesian correlation coefficients (R2) and the corresponding 94% credible intervals are reported as the lower (Q3) and upper (Q97) quantities (Gelman et al., 2019). Where appropriate, we refer to whether these credible intervals include zero or not as a method to show if the parameters are likely to be meaningful and worth including in inferences. Comparison of the models were completed using the widely applicable information criterion (WAIC) in the BRMS package (Bürkner, 2018), which quantifies and ranks models by their ability to predict data while penalizing for overfitting with additional parameters. Analyses were conducted using R versions 3.2.1, all Bayesian analysis was conducted using Bayesian Regression Model Systems in RStan (Stan Development Team, 2020). All data is available from the University of Wyoming data repository1 and the source files with corresponding packages, functions, and analyses are available on GitHub2.
Results
Physiological Response to Drought
To test our three image-based modeling approaches (thermal, RChlF, and the combination; Table 1) that predict plant water status, we first quantify the environmental variables that will be incorporated into the models. Soil VWC was monitored during both experiments of moderate (2019) and severe drought (2018) (Supplementary Figure S1). The severe drought experiment resulted in death of all (i.e., 12 of each species) POTR (VWC < 6%) and PIPO (VWC < 6.3%) following 45 days of water withholding and consequent 2 weeks of fully re-watering. The same year, BRR5 and ARTR died after 21 (minimal VWC < 7.2%) and 52 days (minimal VWC < 5.1%), respectively. During the moderate drought experiment, despite POTR and PIPO reaching extremely low soil moisture (VWC < 5%) after 23 days (Supplementary Figure S1), all plants recovered upon re-watering. Across the two experiments, death was defined as the absence of recovery after re-watering, with recovery assessed as re-sprouting or increase in the PSII efficiency (i.e., Fv′/Fm′) signal.
We next quantify the impacts of the drought on physiological variables that we will test throughout our three models. Merged physiological results from 2018 and 2019 are reported in Figure 3 to encompass the entire range of drought severity. Overall, declines in gs were the first sign of stress response across species, although the time of response varied. Values of soil VWC below 13.5% following 9 days of drought triggered rapid reductions of gs for both POTR (0.26 to 0.1 mol m–2 s–1) and PIPO (0.18 to 0.07 mol m–2 s–1) (Figure 3A). As expected, BRR5 showed high sensitivity to drought with rapid reductions of gs from 0.65 to 0.09 mol m–2 s–1 after only 8 days of water withholding (Supplementary Figure S2a). Maximal stomatal conductance in ARTR (0.13 mol m–2 s–1) substantially declined in response to drought with an 83.0% decline after 14.3% VWC, with subtle drops in gs below 12% VWC (Supplementary Figure S2a).
Once soil VWC reached 3–9% after 18–35 days of water withholding, the impacts of the drought on both PSII efficiency and ΨL were evident (Figures 3B,C and Supplementary Figures S2b,c). Substantial declines of PSII efficiency were observed in PIPO and POTR after 35 days of water withholding (Figure 3B). The BRR5 showed zero PSII efficiency in light after 18 days of drought, while ARTR declined at 28 days, although it did not reach zero until after 45 days of drought (Supplementary Figure S2b). Once plants reached zero PSII efficiency they never recovered upon re-watering, consistently for all species (Figure 3B and Supplementary Figure S2b). Minimum ΨL of −10.0 MPa was observed for POTR and −6.2 MPa for PIPO after 35 and 45 days of water withholding, respectively (Figure 3C). Predawn ΨL responded similarly to PSII efficiency with respect to both soil VWC and days of drought, declining at 18 and 24 days of drought for POTR and PIPO, respectively. Minimum predawn ΨL of −2.4 MPa was observed in BRR5 following 18 days while ARTR minimum predawn ΨL (−9.2 MPa) was observed at 52 days (Supplementary Figure S2c).
Limitations in relative stem diameter growth were observed in response to drought for POTR (Figure 4A) and PIPO (Figure 4B) seedlings throughout both experiments. In moderate drought, well-watered POTR grew 1.21 mm and PIPO grew 0.55 mm compared to droughted cohorts. However, highly probable differences (posterior prob > 94%) were observed only in POTR with respect to droughted plants (Figure 4A). In severe drought, stem diameter growth for both PIPO and POTR declines at least −0.02 mm (posterior prob > 94%) (Figures 4A,B). In the same severe conditions, droughted POTR (0.08 m2) (Figure 4C) and PIPO (0.10 m2) (Figure 4D) leaf area were lower than well-watered POTR (0.13 m2) and PIPO (0.15 m2); albeit, only POTR posterior probabilities were greater than 94% (Figures 4C,D).
Leaf Temperature
In order to build and test models of TL and related parameters that predict the physiological responses to drought, we quantified the relationship between ΨL, PSII efficiency, and gs. Physiological responses to drought were better correlated to deltaT and ICWSI in comparison to TL, measured from both camera and infrared radiometer. The consequences of drought for both PIPO and POTR were evident in the time series of deltaT within 5 days (Supplementary Figure S3). The reductions in deltaT from both thermal camera and infrared radiometers were able to predict the changes in plant water status based on midday ΨL (Figure 5A) for all species (mean R2 = 0.57, Q3 = 0.36,
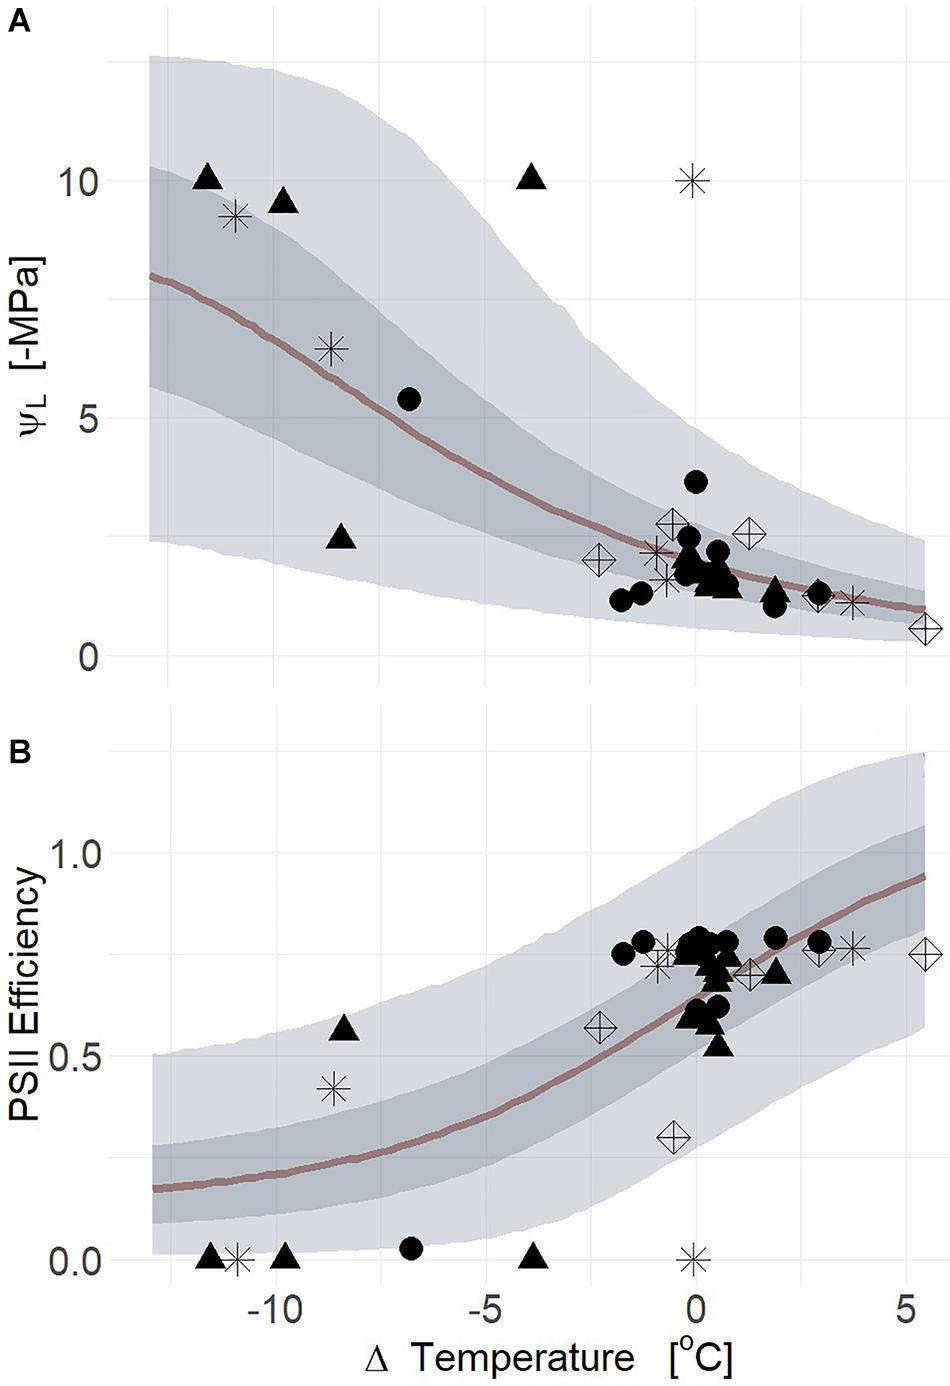
Figure 5. Leaf water potential (ΨL) response to changes in air temperature relative to leaf temperature (deltaT, air minus leaf temperature) from both thermal radiometers and cameras (A). Decreases of deltaT corresponding to greater tension on xylem for aspen (POTR, triangles), ponderosa pine (PIPO, circles), sagebrush (ARTR, star), and B. rapa (BRR5, diamonds) (R2 = 0.57). The decreases of deltaT was similarly associated with reductions of photosystem II efficiency (Fv′/Fm′) (B) across all species (R2 = 0.56). Maximum likelihood estimates (MLE, red) are presented and the 50% (dark gray) and 94% (light gray) creditable intervals.
Q97 = 0.65; βTherm ≠ 0; Supplementary Table S2). In moderate drought, the range of variation for both deltaT and midday ΨL was smaller than in severe drought which overall reduced our predictive power (Supplementary Figure S4a) (mean R2 = 0.30, Q3 = 0.06, Q97 = 0.49; βTherm = 0; Supplementary Table S2). In the severe drought experiment, the thermal camera captured more of the parameter space with respect to midday ΨL and deltaT resulting in higher correlation to plant water status (Supplementary Figure S4b) (mean R2 = 0.51, Q3 = 0.22, Q97 = 0.62; βTherm ≠ 0; Supplementary Table S2). Reductions of PSII efficiency correlated with declines of deltaT for both thermal camera and infrared radiometer (Figure 5B) (mean R2 = 0.56, Q3 = 0.41, Q97 = 0.65). During severe drought, the relationship between PSII efficiency and deltaT was uninformative due to the subtle changes of PSII efficiency during moderate drought (Supplementary Figure S4c) (mean R2 = 0.06, Q3 = 0.00, Q97 = 0.22). Thermal imaging results in severe drought correlated with the declines of PSII efficiency corresponding to deltaT for all species (Supplementary Figure S4d) (mean R2 = 0.53, Q3 = 0.29, Q97 = 0.66).
Thermal images collected from severe drought produced a strong relationship between gs and deltaT (mean R2 = 0.63, Q3 = 0.52, Q97 = 0.68; βTherm ≠ 0; Supplementary Table S2) (Figure 6A). However, species-specific covariates did not improve correlations likely due to low replicate numbers for species and treatment (Figure 6A). In severe drought, ICWSI derived from thermal images associated with individual time points were not informative due to inconsistent retrieval of both TWet and TDry measurements from the same individuals or same species. The dynamics of gs in response to progressive drought were highly correlated with deltaT measured from infrared radiometers for both PIPO and POTR (Figure 6B) (mean R2 = 0.69, Q3 = 0.21, Q97 = 0.87; βTherm ≠ 0; Supplementary Table S2), with no additional improvement using species-specific responses and their interactions (Supplementary Table S2). These covariates reduced the explanations of variation of the posterior estimates of gs, though marginally lowered the mean correlation coefficient (mean R2 = 0.67, Q3 = 0.44, Q97 = 0.91; βTherm = 0; Supplementary Table S2) (Figure 6B). The ICWSI values correlated with gs, but the relationship was less strong than for deltaT, for POTR and PIPO (mean R2 = 0.66, Q3 = 0.27, Q97 = 0.76; βTherm ≠ 0; Supplementary Table S2) (Figure 6C). Species-specific and interaction covariates provided minimal improvements in the mean correlation coefficients between ICWSI and gs (mean R2 = 0.65, Q3 = 0.34, Q97 = 0.78; βTherm ≠ 0; Supplementary Table S2) (Figure 6C).
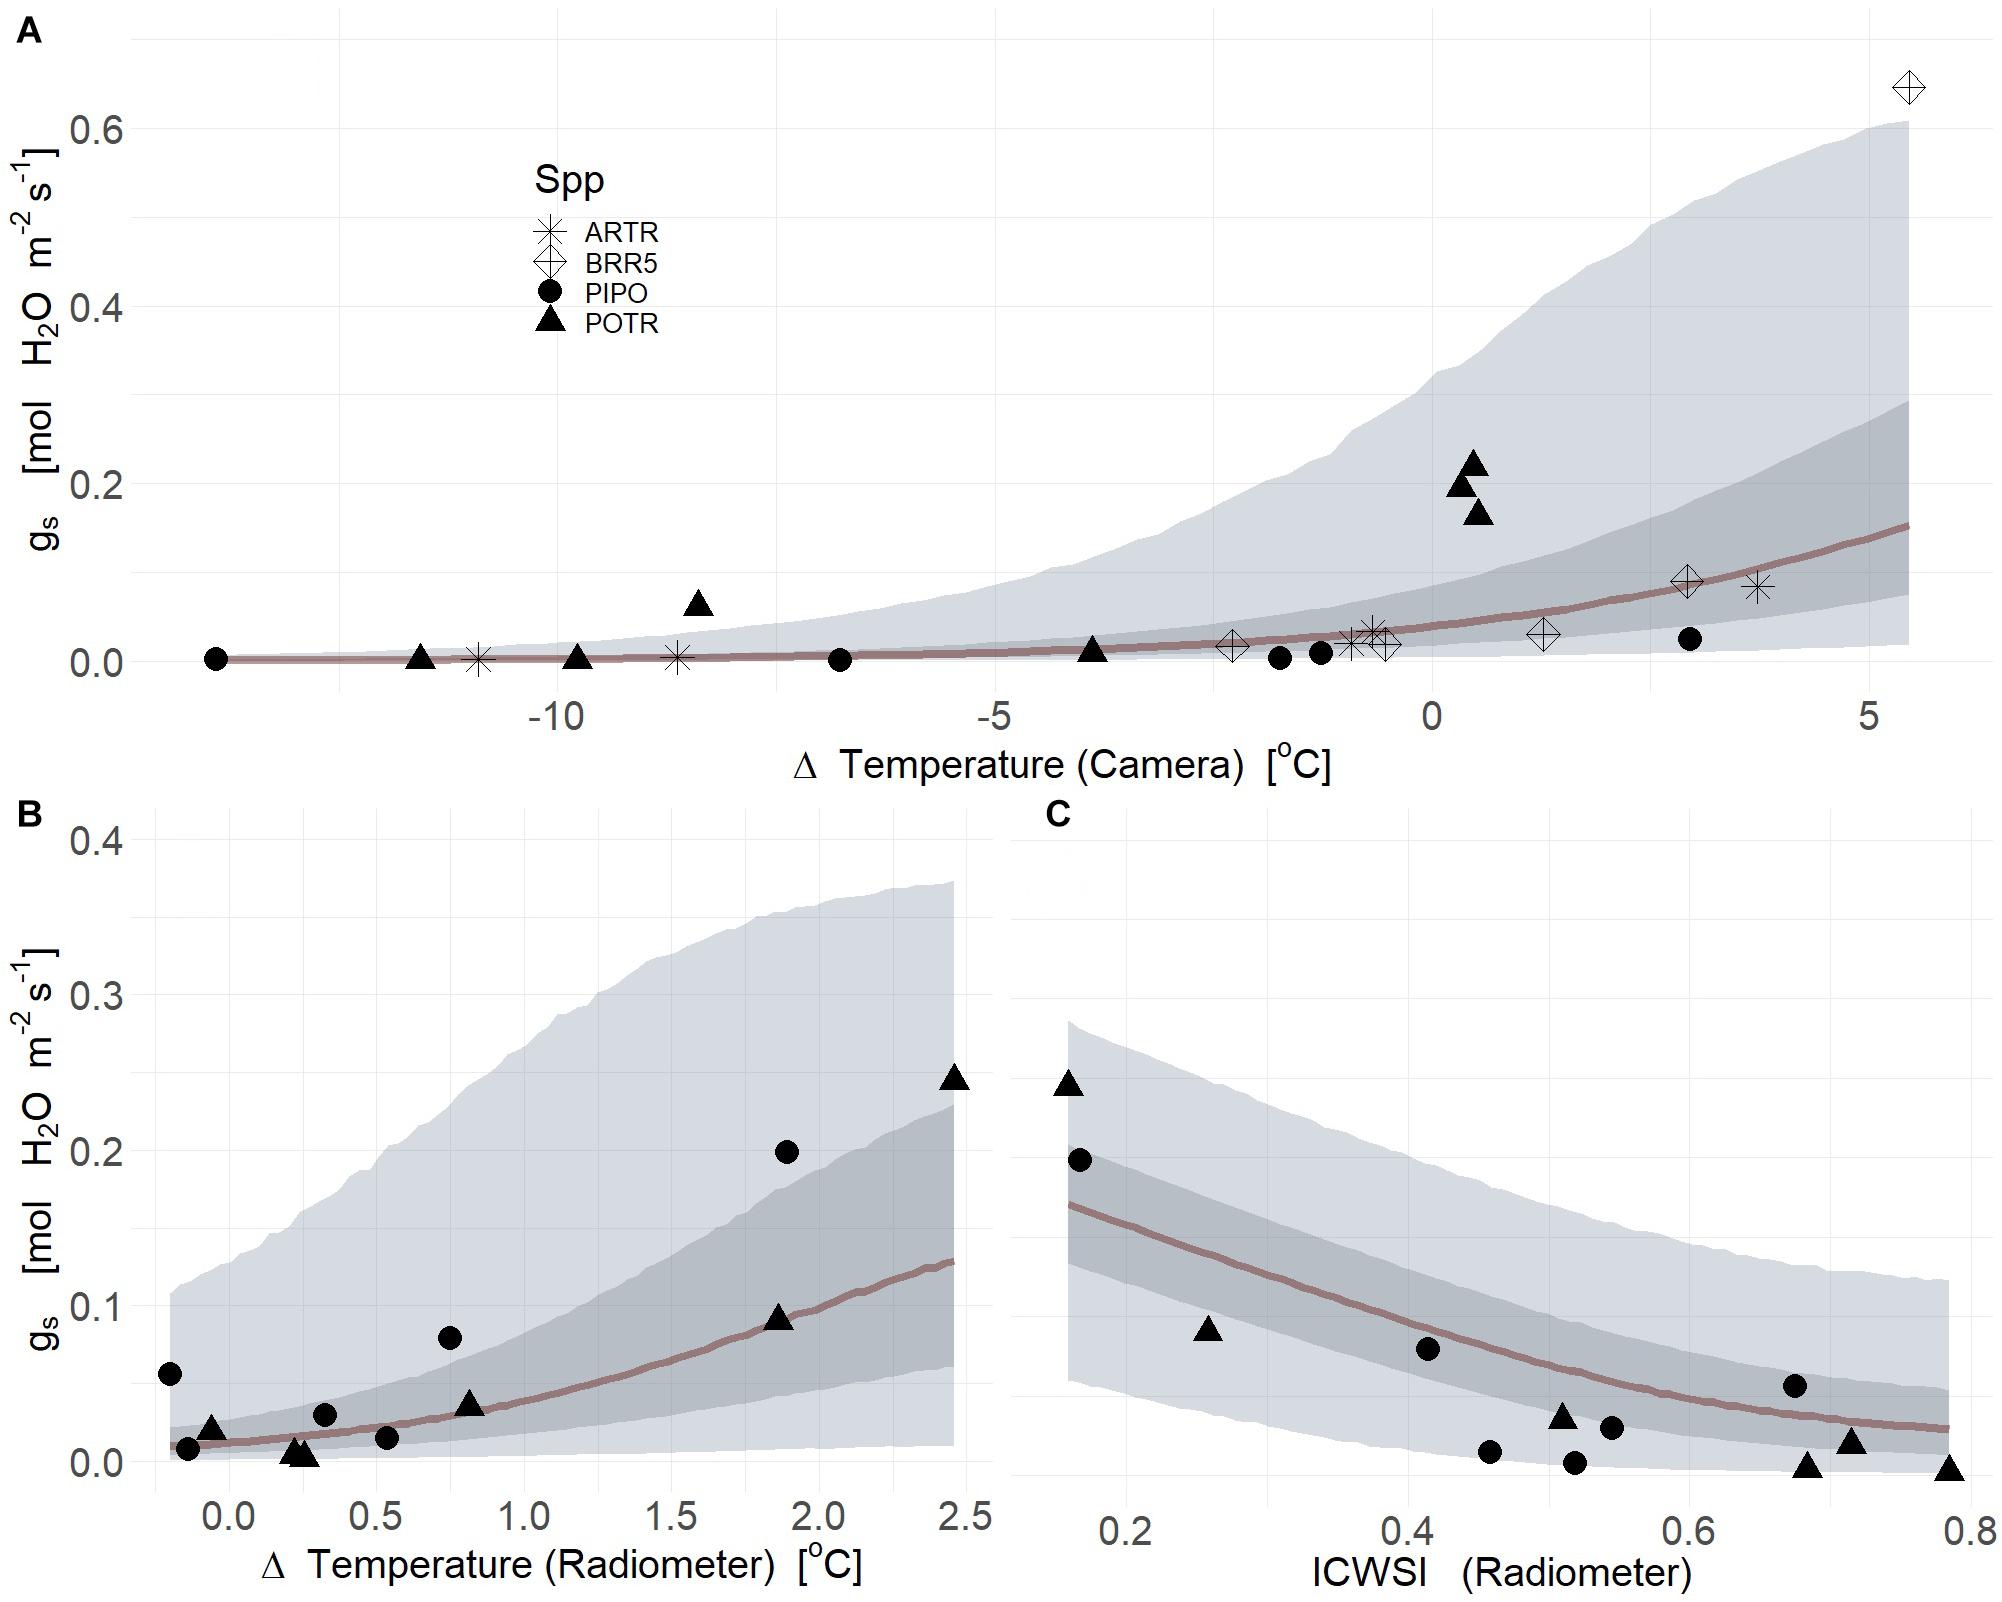
Figure 6. Thermal images (A) Infrared radiometers (B,C) measured deltaT (air minus leaf temperature) (A,B) and ICWSI (C) serve as powerful predictors of the reduction of stomatal conductance (gs) in response to soil water limitations for aspen (POTR, triangles), ponderosa pine (PIPO, circles), big sagebrush (ARTR, star), and oilseed Brassica rapa (BRR5, diamond). The maximum likelihood estimates (MLE, red) for the reduction of gs consequent to soil water limitations is presented and the 50% (dark gray) and 94% (light gray) creditable intervals for deltaT and ICWSI.
Applied Estimates of Whole Plant Transpiration and Leaf Energy Balance
Scaling Transpiration
Using our first image-based modeling approach (i.e., thermal), the time series of TL from the infrared radiometers observed in moderate drought (2019) was used to estimate at the whole canopy level using leaf area. Canopy ET estimated from leaf-level gas-exchange strongly correlated with deltaT measured and rs calculated from infrared radiometer measurements (mean R2 = 0.75, Q3 = 0.64, Q97 = 0.80; βTherm ≠ 0; Supplementary Table S3) (Figure 7A). Both PIPO and POTR rs exhibited no species effect (posterior prob < 94%) in response to deltaT, thus time series estimates of daily rs were established using the same regression fitted across both species (Figure 7A and Supplementary Table S3). Daily estimates of ET using PM showed substantial reductions of transpiration immediately following the onset of drought treatments between the POTR (Figure 7B) and PIPO (Figure 7C). The non-linear relationship of rs and deltaT results in considerable uncertainty that is propagated into the estimated daily ET (Figure 7).
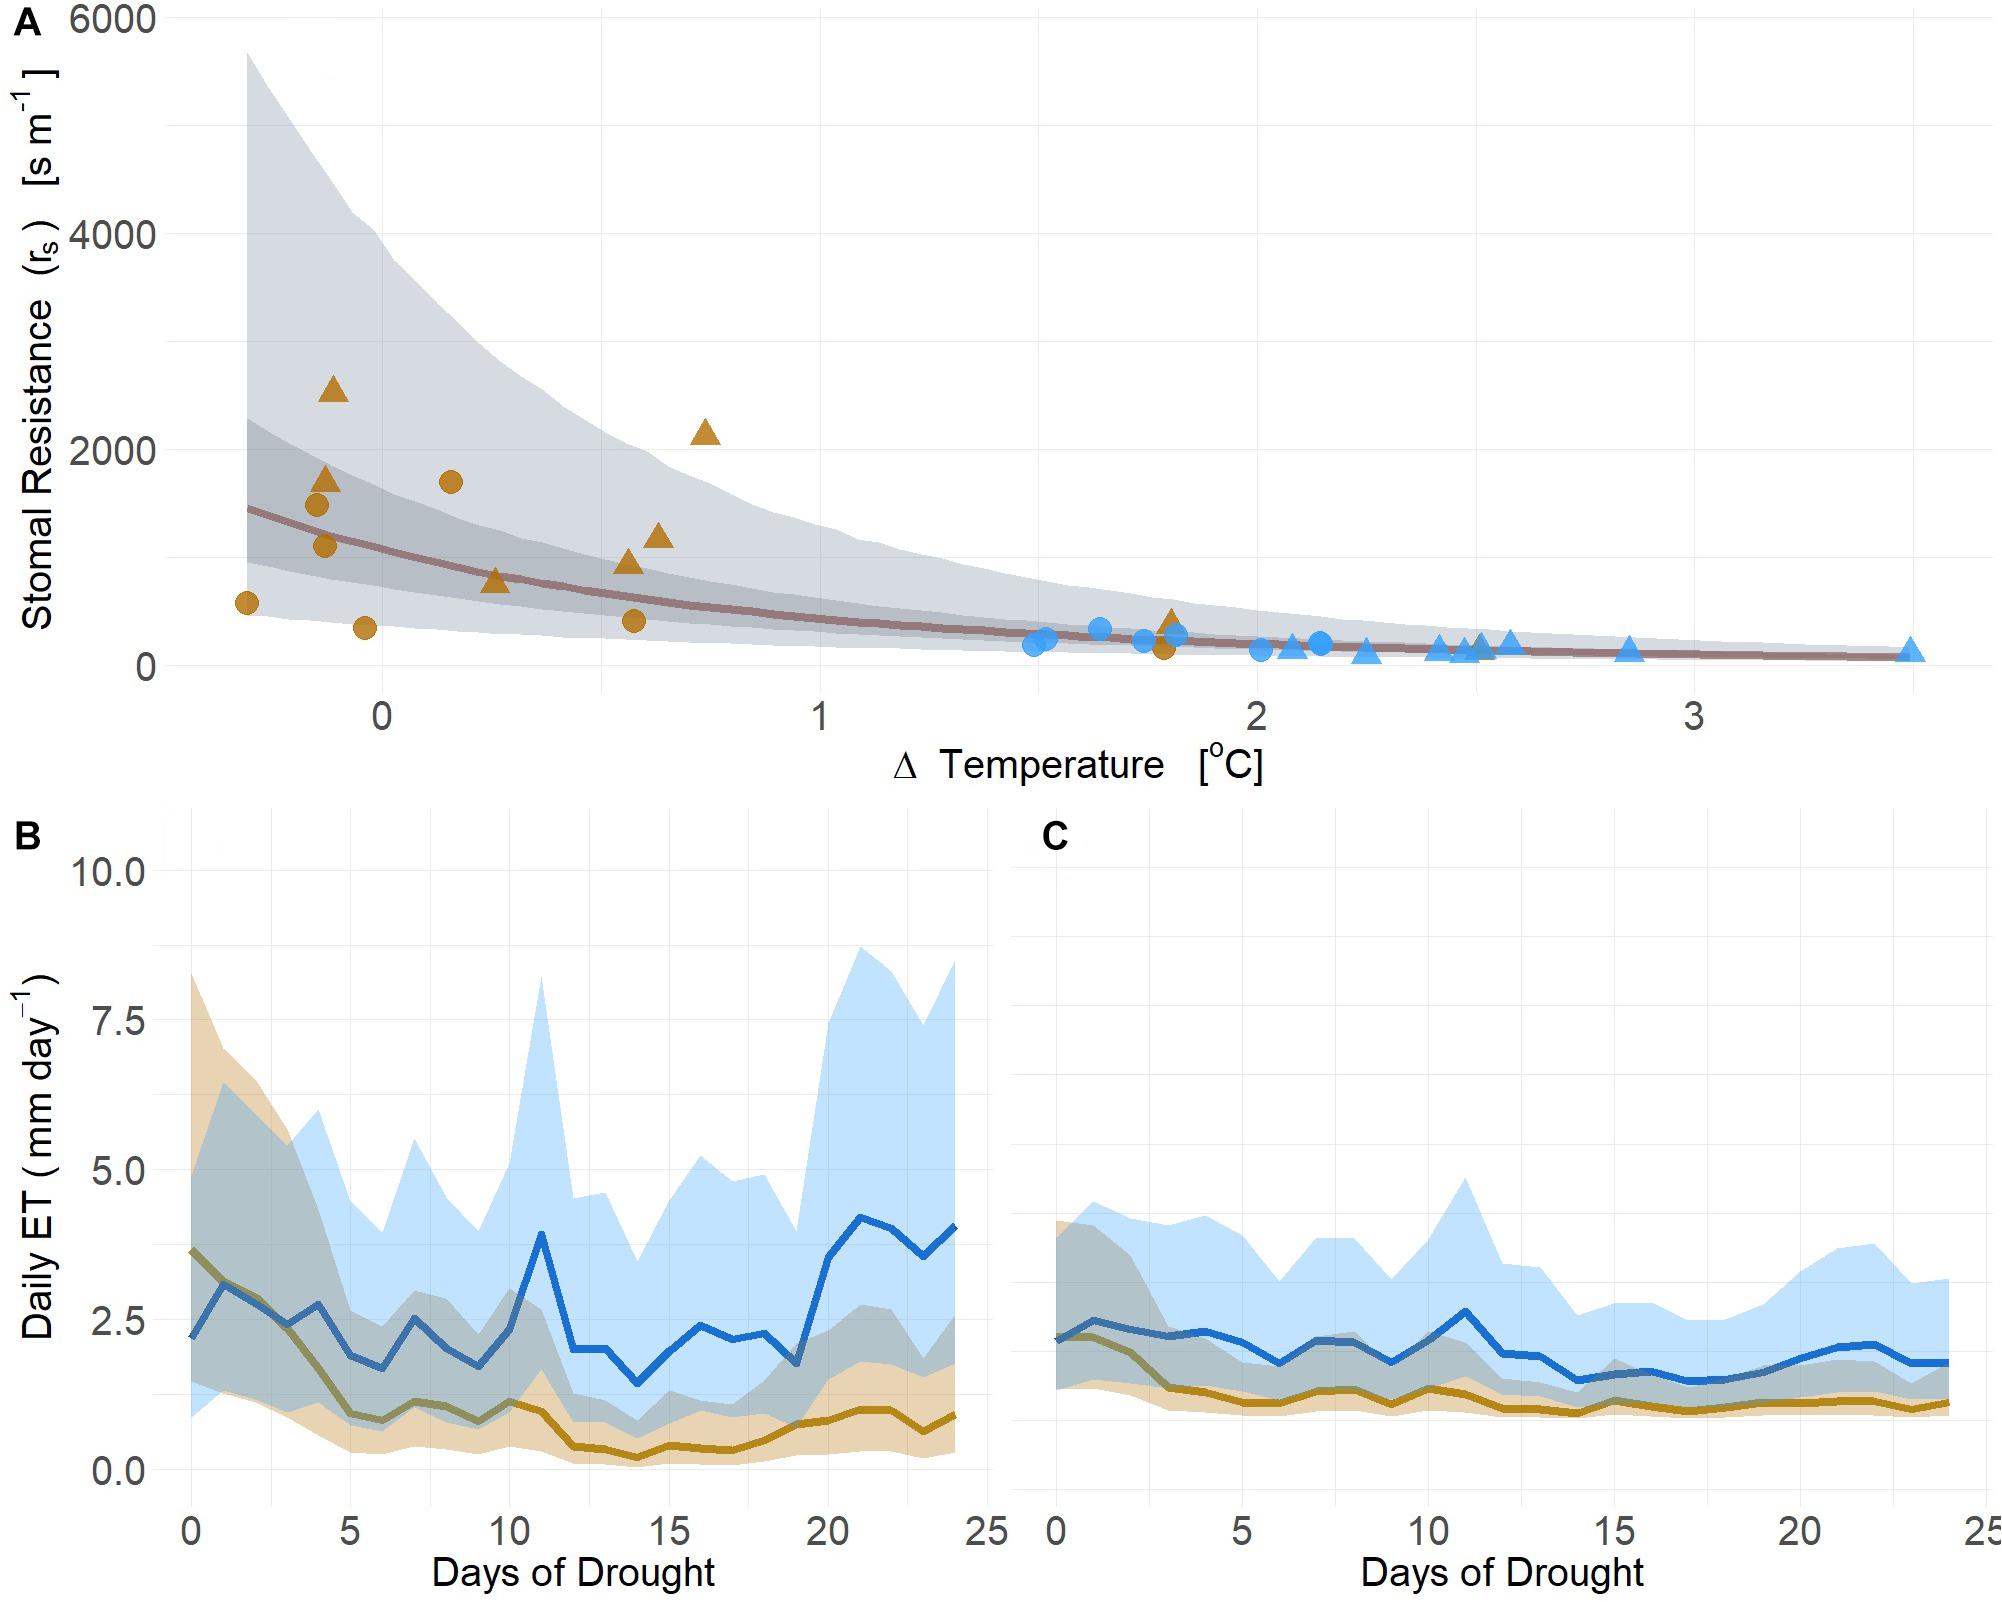
Figure 7. Changes in leaf temperature (deltaT, air minus leaf temperature) serve as a strong predictor of stomatal resistance (rs) (A) across soil moisture gradients from both well-watered (blue) and droughted (gold) POTR (triangle) and PIPO (circle). The rs responses to leaf temperature maximum likelihood estimate (MLE, red), 50% (dark gray), and 94% (light gray) creditable intervals. Integration of rs estimates into process-based models (i.e., Penman-Monteith) capture plant water status and daily ET estimates for POTR (B) and PIPO (C). The 94% creditable intervals of rs correspond to the uncertainty of daily ET estimates.
Leaf Energy Balance
Because leaf energy balance is a first principle biophysical connection between TL and plant water status, we tested the relationship between these variables. The uncertainty observed in time series estimates of whole plant ET from moderate drought corresponded to the variation of leaf energy balance for both POTR and PIPO. Leaf energy balance results were strongly correlated with measured transpiration rates (mean R2 = 0.65, Q3 = 0.49, Q97 = 0.73) (Figure 8A). However, the relationship deviates from the one to one line (slope = 2.31; intercept = −0.48) with transpiration underestimated at the highest flux rates (Figure 8A). The residual difference between measured and estimated transpiration (i.e., difference from the one to one line) was mostly explained by leaf-level measured gs (mean R2 = 0.86, Q3 = 0.81, Q97 = 0.88) (Figure 8B). Residuals were linearly correlated with increases of gs (βgs = 5.95, Q3 = 5.10, Q97 = 6.81) (Figure 8B).
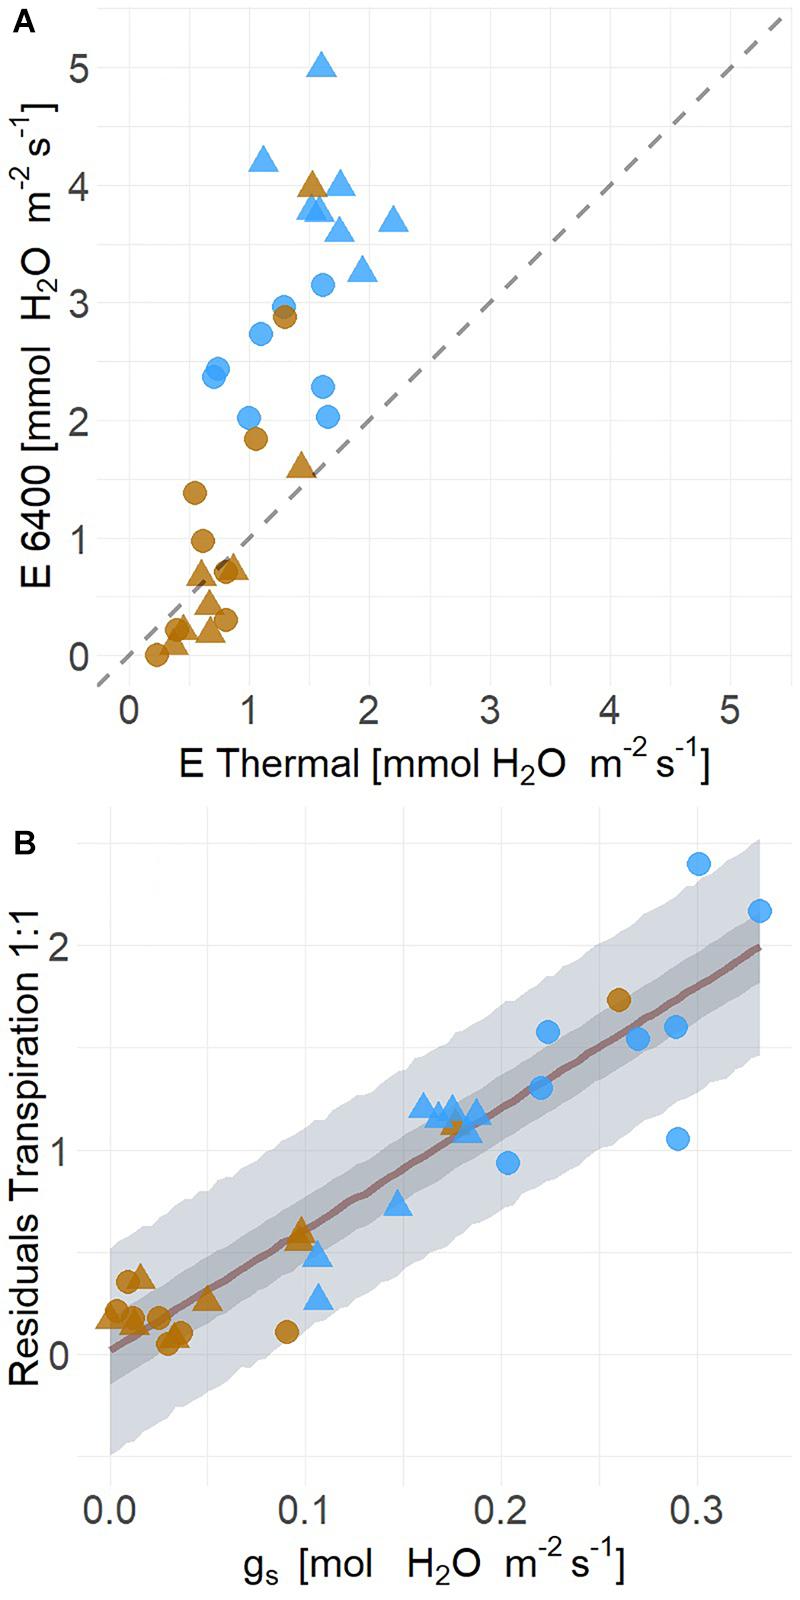
Figure 8. Transpiration (E) estimated from leaf level energy balance using infrared radiometer data are lower than gas exchange measurements (LiCor 6400XT) under high transpiration rates in well-watered (blue) than droughted conditions (A) for both POTR (triangle) and PIPO (circle). Across both species and treatments, (B) the residual distance from the measured and estimated transpiration rates (i.e., 1:1 line) are explained by leaf-level stomatal conductance (gs) (Mean R2 = 0.86). Maximum likelihood estimate is represented in red along with the 50% (dark gray) and 94% (light gray) creditable intervals.
Relative Chlorophyll a Fluorescence
In our second image-based modeling approach (i.e., RChlF), we quantified the relationship between RChlF and physiological status. Validation of normalized PSII efficiency and RChlF using logistic regressions tracked the progression of drought and detected thresholds of recovery (Figure 9A). The relationship was robust during severe drought conditions capturing the entire range from well-watered through drought mortality (mean R2 = 0.76, Q3 = 0.67, Q97 = 0.81; αRChlF ≠ 0, βRChlF ≠ 0; Supplementary Table S4), though explained very little of the variation during mild and moderate drought (Figure 9A) (mean R2 = 0.29, Q3 = 0.00, Q97 = 0.51; αRChlF ≠ 0, βRChlF ≠ 0; Supplementary Table S4). Species-specific responses improved explanations of the variation by better constraining parameter estimates for each species (mean R2 = 0.80, Q3 = 0.75, Q97 = 0.83; αRChlF = 0, βRChlF = 0; Supplementary Table S4) (Supplementary Figure S5). Across the entire range of drought from moderate to severe, RChlF calculated from fluorescence images was effective at predicting thresholds of relativized ΨL across all species (mean R2 = 0.72, Q3 = 0.61, Q97 = 0.76; αRChlF ≠ 0, βRChlF ≠ 0; Supplementary Table S4) (Figure 9B). The addition of species-specific variation increased predictions of ΨL to drought (mean R2 = 0.80, Q3 = 0.75, Q97 = 0.83; αRChlF = 0, βRChlF = 0; Supplementary Table S4) (Supplementary Figure S6). The RChlF imaging results had very limited correlation with normalized gs at all considered drought conditions (Figure 9C) (mean R2 = 0.29, Q3 = 0.07, Q97 = 0.46; αRChlF ≠ 0, βRChlF ≠ 0; Supplementary Table S4) but species-specific effects substantially improved the relationship (mean R2 = 0.58, Q3 = 0.44, Q97 = 0.63; αRChlF = 0, βRChlF = 0; Supplementary Table S4) (Supplementary Figure S7).
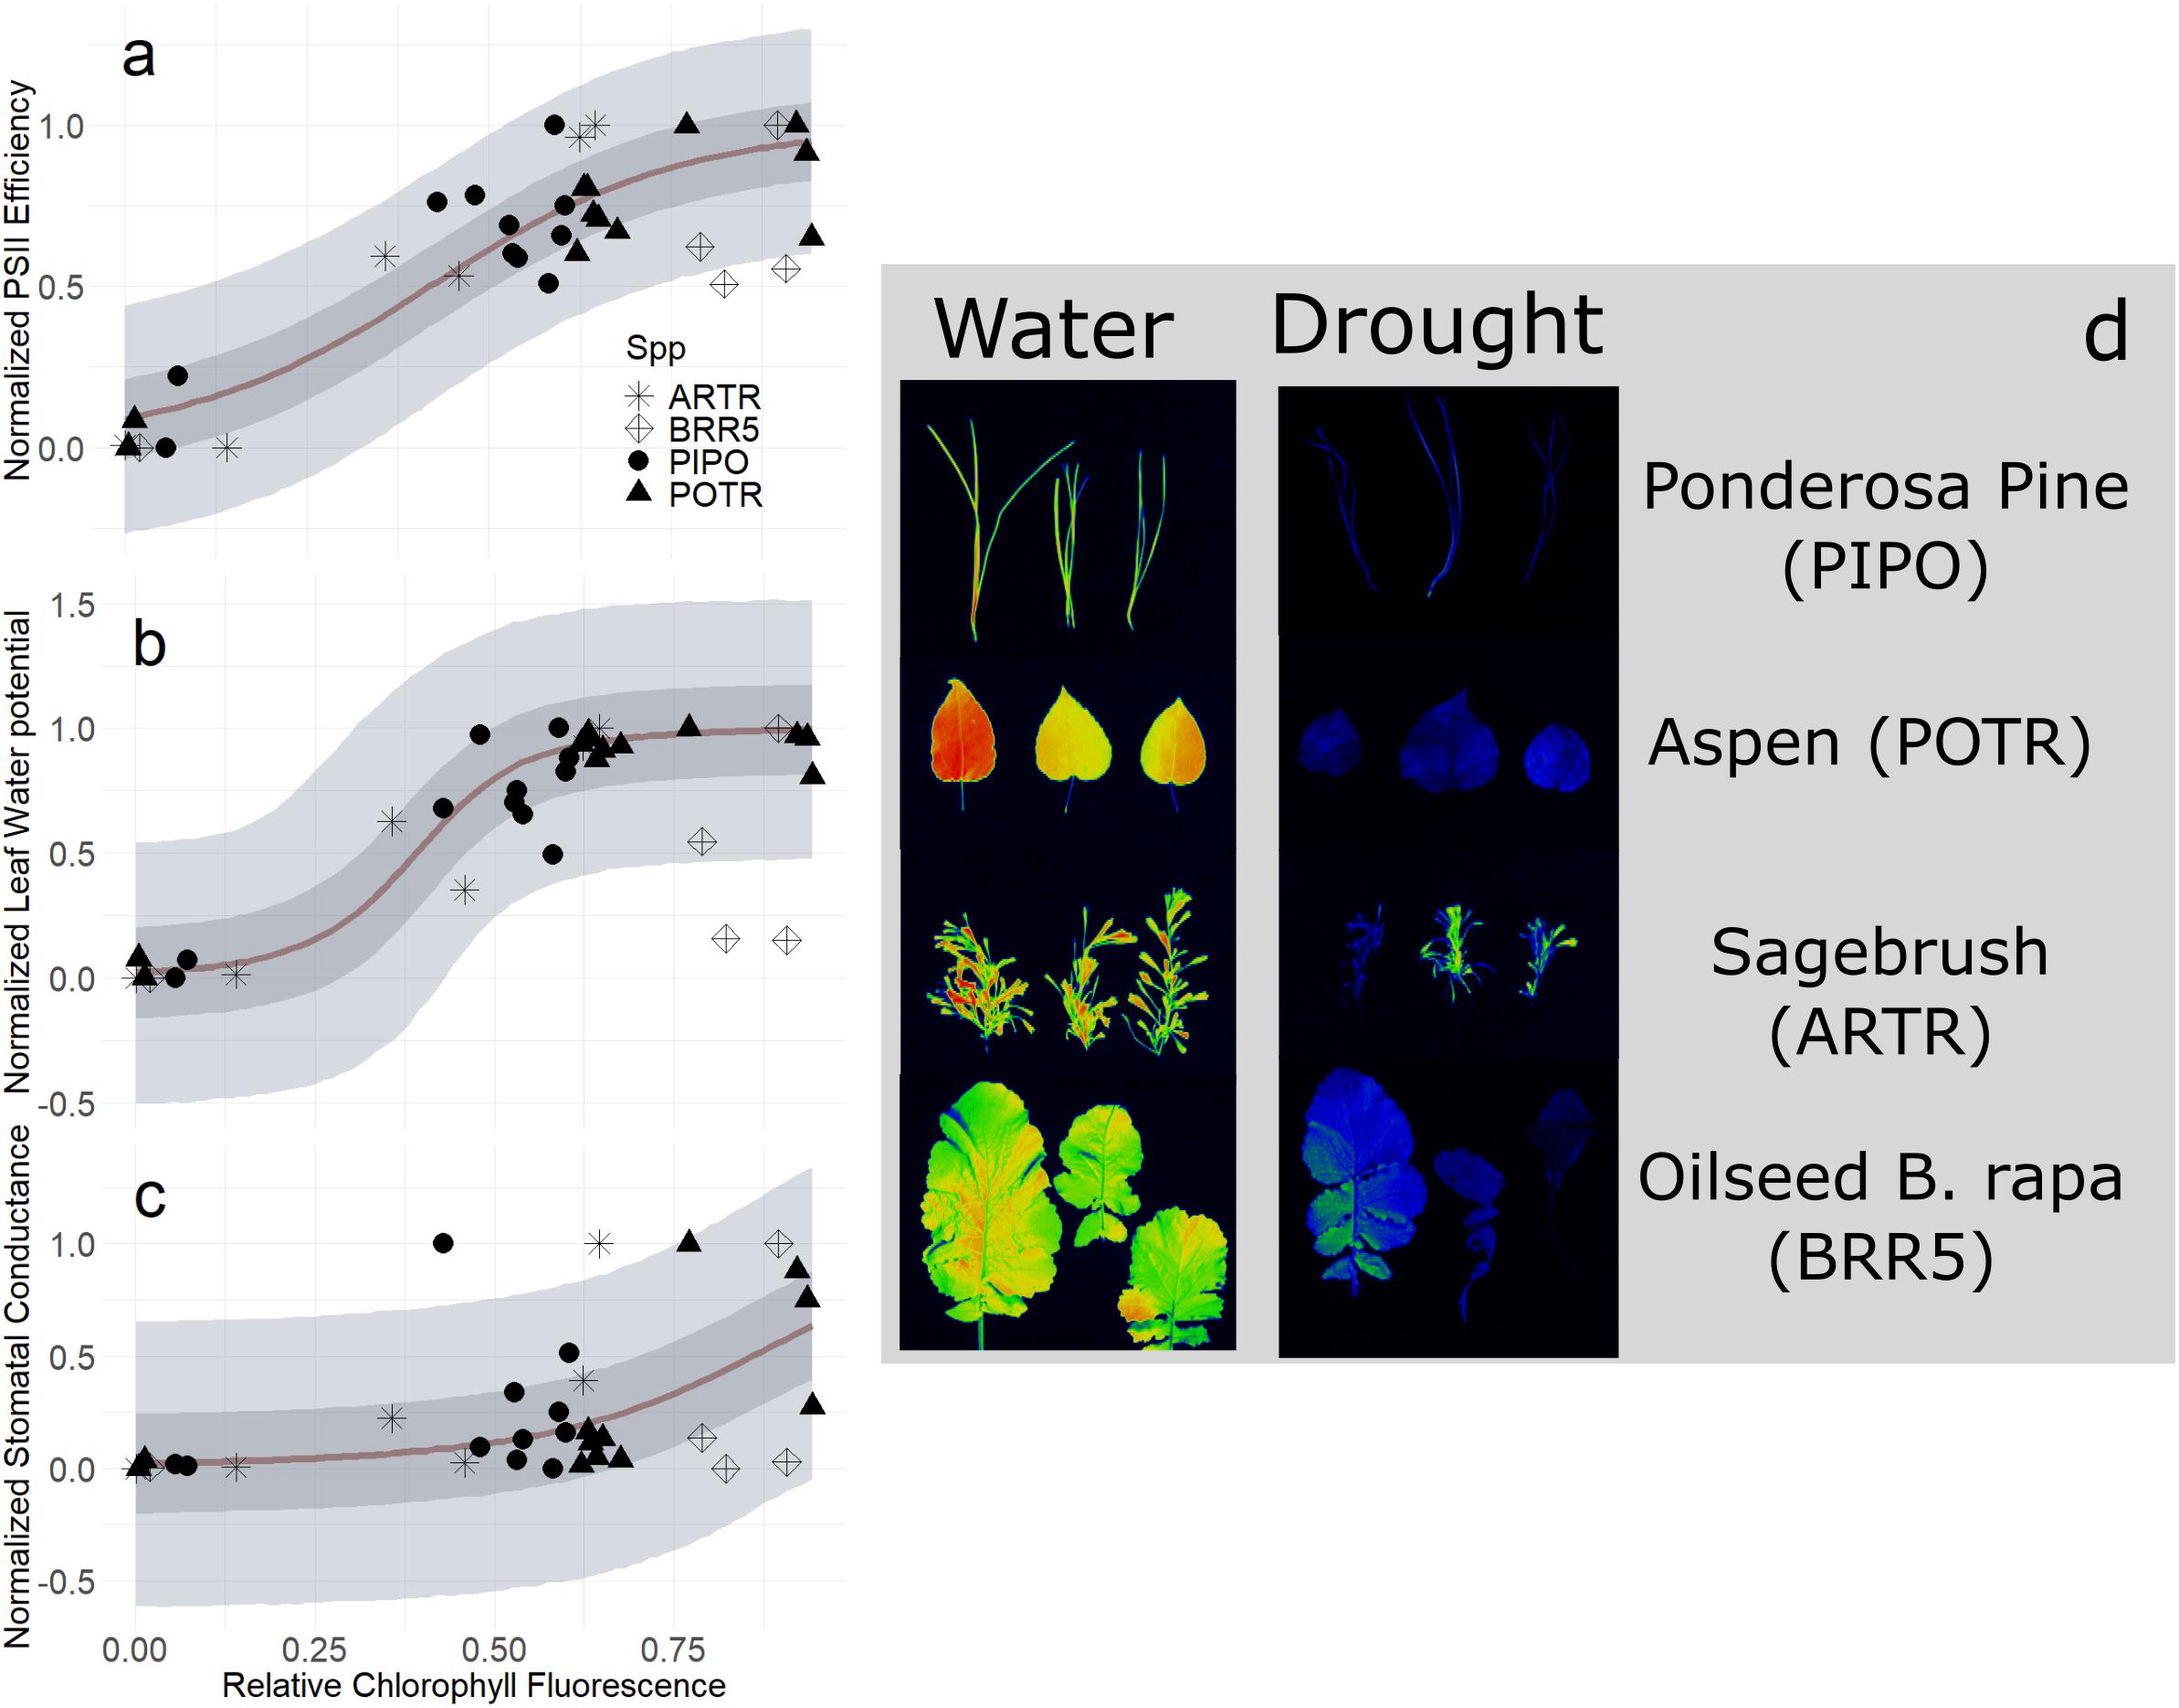
Figure 9. Relative chlorophyll fluorescence (RChlF) to normalized physiological responses of midday leaf water potential (PSI L, A), photosystem II efficiency (Fv′/Fm′, B), and stomatal conductance (gs, C) during the progression of both moderate and severe drought experiments. Maximum likelihood estimates (MLE, red) for trends with 50 and 94% creditable intervals for aspen (POTR, triangle), ponderosa pine (PIPO, circle), big sagebrush (ARTR, star), and oilseed Brassica rapa (BRR5, diamond). FluorCam images (D) for well-watered (left) and droughted (right) leaves used for estimating RChlF.
Combined Relative Chlorophyll a Fluorescence and Leaf Temperature
To test our third image-based modeling approach (i.e., the combination of thermal and RChlF), we evaluated whether a combined deltaT and RChlF model was better than either model individually. Empirical models that combined RChlF, deltaT, and their interaction improved predictions, compared to univariate approaches, of midday ΨL for all species during progression from well-watered to extreme drought, i.e., mortality (Figure 10) (mean R2 = 0.81, Q3 = 0.63, Q97 = 0.80; βTherm = 0, βRChlF ≠ 0; Supplementary Table S5). The maximum likelihood response for the relationship of predicted and observed midday ΨL was less than the one to one line (slope = 0.90), but not different considering the 94% credible intervals (i.e., green polygon) captures the one to one line (Figure 9). Our predictive power increases if we consider only the woody species, i.e., removing B. rapa (mean R2 = 0.89, Q3 = 0.79, Q97 = 0.95; βTherm = 0, βRChlF ≠ 0; Supplementary Table S5). However, removing the crop did not improve predictions of gs from coupled RChlF and deltaT (mean R2 = 0.48, Q3 = 0.23, Q97 = 0.73; βTherm = 0, βRChlF = 0; Supplementary Table S5). The increased complexity of the third model provided the most improved predictive power despite the reduced parsimony, as the combined model had a WAIC estimate of 11.2 and 18.2 (Supplementary Table S5) points lower than the univariate approaches using deltaT and RChlF, respectively.
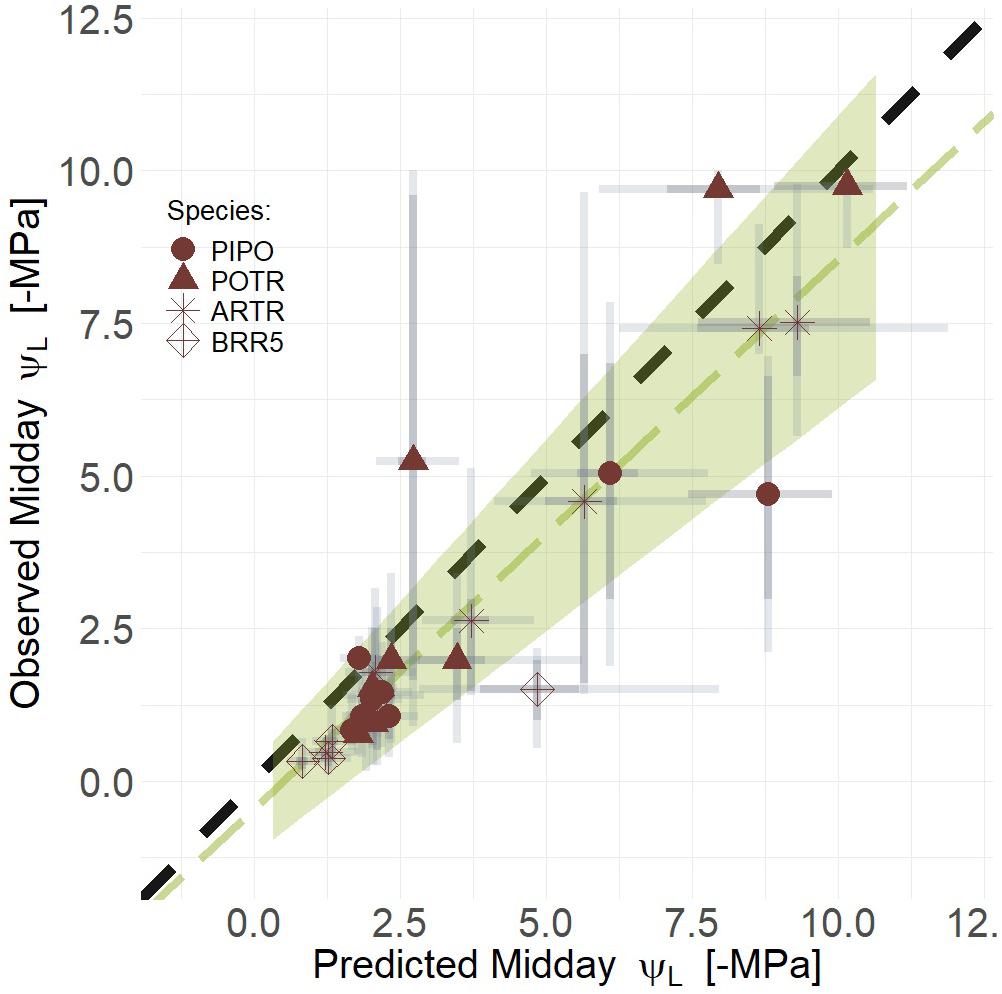
Figure 10. Linear regression of predicted and observed ΨL (Green line) and the corresponding 94% credible intervals of the linear regression (Green polygon). Coupling deltaT and RChlF improves predictive power as model midday leaf water potential (ΨL) with respect to observed midday ΨL during the progression of both moderate and severe drought. Maximum likelihood estimates (MLE, red) are presented for trends with 50% (dark gray) and 94% (light gray) creditable intervals for aspen (POTR, triangle), ponderosa pine (PIPO, circle), big sagebrush (ARTR, star), and oilseed Brassica rapa (BRR5, diamond). Error corresponds to model and measurement uncertainty.
Discussion
Testing models to predict plant water status from TL, RChlF, and their combination using a Bayesian approach provides a rigorous test of the effectiveness of these methods. This statistical method also highlights the uncertainty involved in using near remotely sensed data products and points to future work that may reduce this uncertainty. Both imaging techniques are high-throughput, robust, process-informed proxies of plant water status (Figures 5, 6, 10) and can be used to predict water use dynamics (Figures 7, 8). The combination of these methods and the use of a Bayesian statistical approach provide the most useful predictions of plant response to progressive drought (Figure 10) and leverage the information in both measurements while not over fitting. The Bayesian statistical approach used throughout our tests provides probabilistic predictions for the physiological responses of plant water status for the diverse species across a wide range of soil water limitations.
Ecophysiological applications of satellite remotely sensed methods have improved ecosystem-scale predictions of productivity, carbon exchange, water use, leaf area, canopy water content, and species distributions (Waring et al., 1982; Pierce et al., 1990; Running et al., 1995; Renzullo et al., 2008; Adam et al., 2010; Landsberg et al., 2017; Xue and Su, 2017; Moreno-Martínez et al., 2018; Chen et al., 2019). However, current process-based models are hindered by the lack of ground-truthing approaches to validate canopy and leaf-level responses to environmental changes (Liu and Zhou, 2004; Govender et al., 2009; Köhler and Huth, 2010). Moreover, greenhouse experiments provide the optimal environment for developing relationships between spectral signatures derived from imaging techniques and physiological responses to drought. We acknowledge that our approach is limited to near remote sensing applications that can be applied to estimates of ET and leaf energy balance, but has not been tested on larger scales.
With the image-based thermal model, we show that empirical ΨL estimates using TL provide confident estimates of plant water status under soil water limitations (Figure 5A and Supplementary Figure S4) informing process-based predictions of transpiration and drought response (Figure 7). Previous studies have shown predictable relationships between midday ΨL and deltaT in agricultural and orchard systems but they do not consider the entire span of water limitations from zero to mortality, which limits the predictive power of plant water status for non-agricultural systems prone to extreme drought events (Figure 5A) (Cohen et al., 2005; Sepulcre-Cantó et al., 2006; Alchanatis et al., 2010; Baluja et al., 2012; Bellvert et al., 2014). Here, the TL measured from both the infrared radiometers and thermal camera provides predictive insight on the regulation of temperature from the onset of drought to mortality (Figure 6). Although thermal camera and radiometers provided similar results, differences arise from the distinctive assumptions and features of each method (Liu et al., 2011; Prashar and Jones, 2016; Hong et al., 2019). The non-invasive infrared radiometers provided the more consistent TL measurements, due also to a greater frequency in data acquisition (i.e., every 10 min.) (Figure 6B). However, infrared radiometers integrate into a single signal with a limited field of view (0.027 m2 in this study) while the thermal images capture the temperature of multiple species and treatments (Figure 2). Both thermal measurements claim an accuracy of approximately 2°C though the error often increases with changing environmental conditions including distance and canopy structure (Rahkonen and Jokela, 2003; Faye et al., 2016).
Our analyses assume that all differences in TL and declines in transpiration result from drought, though it is acknowledged that differences may be associated with structural changes of the canopy from wilting, as well as shifts in emissivity (Gerhards et al., 2016). Variation of leaf angle has been observed to double TL estimates, especially in droughted leaves (Jones et al., 2009; Ren et al., 2014). Leaf water content alters spectral reflectance in many relevant bands (e.g., water absorption features 970, 1170, 1450, 1775, and 1930 nm) (Sims and Gamon, 2003; Murphy et al., 2019). However, temporal variation, let alone variation associated with plant stress, of emissivity remains poorly understood, resulting in another potential error source when estimating small fluctuations of TL linked to gs (Gerhards et al., 2016). Standardizing leaf emissivity (i.e., 0.97) for both thermal images and radiometers poses potential uncertainty as variations of emissivity can result in 3 °C changes in leaf temperature (Arp and Phinney, 1980; Bugbee et al., 1998; Chen, 2015; Buitrago et al., 2016) which is often greater than the range of temperature associated with changes in gs (Figures 6B,C) creating limitations for TL analysis and thermal methodological development. Additionally, sensors for remotely measuring temperatures typically have a precision of 2–3°C resulting in lower accuracy of absolute temperature (Rahkonen and Jokela, 2003; Aubrecht et al., 2016). In this study, deltaT gives more effective predictions for drought responses across species when compared to ICWSI as the variability of TL throughout tree canopies limits accurate estimates of transpiring and non-transpiring leaves (Jones, 1992; Kim et al., 2018). Ben-Gal et al. (2010) observed similar predictability of gs using deltaT over ICWSI in olive orchards suggesting that the index built on crops needs further validation prior to implementation to either natural and non-herbaceous crop systems.
In plants, changes in leaf water status lead to variation in the energy partitioning at the photosystem level with more excitation energy dissipated as heat via NPQ mechanisms to avoid oxidative stress limiting PSII efficiency (i.e., Fv′/Fm′) (Silva et al., 2010; Alonso et al., 2017). Imaging ChlF has been developed to monitor these energetic changes and it has been demonstrated to do so effectively across a wide range of species, genotypes, and environmental stresses (Van Kooten and Snel, 1990; Sayed, 2003; Flowers et al., 2007; Kalaji et al., 2014, 2016; Guadagno et al., 2017). The RChlF image-based pipeline decreased the image acquisition time from minutes to seconds and revealed thresholds for hydraulic and photochemical failure (Figures 9A,B) (Tschiersch et al., 2017). Changes in RChlF showed similar patterns to leaf-level PSII efficiency across all considered conditions, but they did not show a one to one relationship (Figure 9C). This difference is most probably due to the RChlF images, captured right after a saturating pulse and representing the maximal fluorescence in light conditions (Fm′) while the IRGA-based data represent the ratio Fv′/Fm′. The IRGA fluorimeter in vivo, and almost simultaneously, calculates this ratio accounting for Fo′, the value of minimal fluorescence in the dark upon a short far-red pulse following actinic illumination (Oxborough and Baker, 1997). Although the imaging protocol we use is meant to avoid long time of exposure of the cut leaves in the chamber, it allows us to record Fm′ shown to be a robust proxy of photochemical quenching in light (Murchie and Lawson, 2013). The low predictive power for gs is mostly due to the frequency in data acquisition (i.e., 3–7 days), and to the destructive harvesting of leaves, necessary when using a closed model of the FluorCam for fluorescence imaging (Figure 9C).
Spatial resolution from satellite imaging techniques continues to hinder the linkages of spectral and thermal signatures to leaf-level biophysical mechanisms. However, solar induced fluorescence (SIF) is increasingly used as an imaging technique to detect photosynthetic capacities and stress across canopies (Parazoo et al., 2020). Unfortunately, modern SIF approaches often miss fine temporal variation due to the long return intervals (e.g., 16 days on OCO-2), the RChlF imaging approach is capable of capturing the diel variation of plant water status (Magney et al., 2019). Although novel SIF data products from non-satellite platforms (i.e., drones and towers) have emerged to fill both spatial and temporal understanding, light limitations still limit confident inferences from leaf to the ecosystem (Chen et al., 2016; Magney et al., 2019). The use of RChlF methods are also not constrained by low-light conditions (Van Der Tol et al., 2014; Verrelst et al., 2015) and could help fill gaps left by SIF in estimating regional and global gas exchange (Magney et al., 2019). However, RChlF methods require extremely high-light pulses to saturate photosystems and would be challenging or impossible to implement on the ecosystem or global scales.
Our third model coupling RChlF and deltaT measurements provides more confidence in predicting plant water status across a spectrum of midday ΨL and species with extremely different drought strategies (Figure 10). The improved predictions of water status using the combined approach offset the limitations for each method by maximizing advantages from the linear and threshold aspect of the proxies. Estimates are more robust for the temperate trees (i.e., aspen and pine) and the desert shrubs that cover the entire ΨL parameter space due to greater xylem tensions of woody tissues when compared to the herbaceous forbs (Griffin-Nolan et al., 2019). Herbaceous crop midday ΨL values are consistently overestimated as B. rapa drought resistance is low, and it rapidly dies in drought with low midday ΨL (i.e., ΨL < -5 MPa) (Figure 9) (Kumar and Elston, 1992; Siddique et al., 2000; Guadagno et al., 2017). Recent process-based models have made better predictions for trees with anisohydric behavior when the full range of drought is considered (Mackay et al., 2015). On the contrary, our model fits the behavior of isohydric trees and shrubs and fails for the anisohydric crop (i.e., BRR5; B. rapa) (Figure 10). This might partly be explained by the thicker leaves characterized by a higher water content with respect to the other species at similar soil VWC, most likely influencing the spectral signatures in ways that challenge our model’s ability to capture the behavior of the crop species (Figure 10) (Falcioni et al., 2020). The limitations observed when predicting the reductions in gs during drought using deltaT and RChlF measurements independently persisted when coupling the two, resulting in little to no improvement on model fit. Irrespective of these few limitations, the value of Bayesian statistical approach is illustrated through the scalable probabilistic predictions and candid levels of uncertainty derived from simple empirical relationships as well as complex process-based model predictions.
Several caveats exist when scaling transpiration and plant water status to canopy and ecosystem scales though the fundamentals of leaf energy balance are well defined (Tague et al., 2009; Ferguson et al., 2010; Vinukollu et al., 2011; Coenders-Gerrits et al., 2014). Typical calculations used for estimating ET assume that ra is constrained by leaf size, canopy structure, and wind speed at the leaf surface (Schuepp, 1993; Poggi et al., 2004; Leigh et al., 2017). In our study, the reduction of daily ET was immediately detectable, though the greenhouse environment with minimal wind speeds and turbulence decoupling the canopy and atmosphere produced substantial uncertainty when making estimates of absolute transpiration rates (Figures 7B,C) (Kimball, 1973; Zhang and Lemeur, 1992; Boulard et al., 2004). In our leaf energy balance estimates of ET (Figure 8), the incoming radiation at the leaf surface was not measured for the entire canopy, rather estimated based on the mean leaf angle, which is likely to change with the progression from well-watered to drought conditions. Specifically, we assume that the gas exchange measurements (IRGA-based) and ET derived from leaf energy balance to be analogous, with constraints of rs estimated from deltaT and IRGA chamber presumably experiencing similar boundary layer conditions (Figure 7). However, within the IRGA chamber, flow rates across the leaf surface are manipulated to minimize the boundary layer resistance to isolate stomatal limitations (Atkinson et al., 1986). Moreover, the infrared radiometers and thermal cameras capture thermal gradients of water vapor defusing through both the stomatal apertures as well as the boundary layer (Jones, 2004). As observed with scaling of deltaT to daily ET, the decoupling of the canopy from the atmosphere is also evident [based on the decoupling coefficient (Ω) to the atmosphere of 0.99 (data not shown)] due to minimal wind speeds (i.e., <0.1 m s–1) reducing the thermal signals associated with stomatal conductance (Figures 7B,C, 8) (Jarvis and McNaughton, 1986; Qiu et al., 2013). The comparison of absolute ET estimates for experiments conducted in the greenhouse environment is impacted, besides boundary layer and gas exchange assumptions, by the possibility of pot root bounding, differences of soil structures and microbial compositions, rooting depth, and physical crowding (Berendse, 1981; Thomas and Strain, 1991; Pashanasi et al., 1992; Mariotti et al., 2015). However, controlled experiments, like ours, are key to clarify details and probable sources of error of drought response and to reliably inform remote sensing approaches used at the ecosystem scale with leaf-level mechanistic insight.
Using a Bayesian statistical approach produces probabilistic estimates and explicit uncertainty parameters, measurements, and models of plant water status directly informative to process-based predictions of transpiration and drought-induced mortality. Both the explicitly stated priors and credible intervals encompassing 94% of the observations maximize transparency that is informative across scales and species. These results, collected in a controlled stetting, provide a unique opportunity for coupling near remotely measured and ground-truthing findings, which scale to complex ecosystems and provide a more holistic understanding of how we can predict reductions of transpiration and drought-induced mortality.
Ecosystem scale remote sensing techniques can benefit from these types of greenhouse studies to better characterize the temporal variations (diel, weekly, or seasonal) of physiological mechanisms and natural plant rhythms that may not be captured in satellite images (Chaerle et al., 2007; Deng et al., 2019; Richardson, 2019). New sensors with improved spatial (i.e., smaller pixels) and spectral (i.e., numerous narrow-band filters) resolution are being continuously developed to answer the demand for near remote sensing methods (Petrie et al., 2019; Still et al., 2019). However, these technological advancements require updated calibration, ground-truthing methods, and statistical approaches that span across diverse ecosystems to improve predictions of carbon and water exchange. In the future, more rigorous ground-truthing campaigns and probabilistic approaches should be associated with remote sensing and imaging collections, especially for predicting carbon and water exchange across vast or heterogeneous ecosystems.
Data Availability Statement
The datasets presented in this study can be found in online repositories. The names of the repository/repositories and accession number(s) can be found below: https://datacorral.uwyo.edu/.
Author Contributions
DB and CG collected the data. DB performed the data analysis with input from CG and BE. DB wrote the manuscript. CG and BE edited the manuscript. All the authors contributed to the article and approved the submitted version.
Funding
WyCEHG (NSF EPS #1208909) and NSF IOS-1547796 to BE provided funding for this research.
Conflict of Interest
The authors declare that the research was conducted in the absence of any commercial or financial relationships that could be construed as a potential conflict of interest.
Acknowledgments
We thank Dr. Mario Bretfeld, Rachel Shrode, Keegan Ferris, Addie Schafer, Ethan Darling, and Hunter Peterson for their contributions with data collection. We are especially grateful to the University of Wyoming William Conservatory for access to their facilities. We thank Dr. David Williams, Dr. Shannon Albeke, Dr. Scott Miller, and Dr. Nori Ohara for critical reviews of this manuscript.
Supplementary Material
The Supplementary Material for this article can be found online at: https://www.frontiersin.org/articles/10.3389/ffgc.2020.589493/full#supplementary-material
Footnotes
References
Adam, E., Mutanga, O., and Rugege, D. (2010). Multispectral and hyperspectral remote sensing for identification and mapping of wetland vegetation: a review. Wetl. Ecol. Manag. 18, 281–296. doi: 10.1007/s11273-009-9169-z
Adams, H. D., Guardiola-Claramonte, M., Barron-Gafford, G. A., Villegas, J. C., Breshears, D. D., Zou, C. B., et al. (2009). Temperature sensitivity of drought-induced tree mortality portends increased regional die-off under global-change-type drought. Proc. Natl. Acad. Sci. U.S.A. 106, 7063–7066. doi: 10.1073/pnas.0901438106
Alchanatis, V., Cohen, A. Y., Cohen, A. S., Moller, A. M., Sprinstin, A. M., Meron, A. M., et al. (2010). Evaluation of different approaches for estimating and mapping crop water status in cotton with thermal imaging. Precis. Agric. 11, 27–41. doi: 10.1007/s11119-009-9111-7
Allen, C. D., Macalady, A. K., Chenchouni, H., Bachelet, D., McDowell, N., Vennetier, M., et al. (2010). A global overview of drought and heat-induced tree mortality reveals emerging climate change risks for forests. For. Ecol. Manage. 259, 660–684. doi: 10.1016/J.FORECO.2009.09.001
Allen, R. G., Pereira, L. S., and Raes, D. (1998). Crop Evapotranspiration-Guidelines for Computing Crop Water Requirements-FAO Irrigation and Drainage paper 56 Table of Contents. Rome: FAO
Alonso, L., Van Wittenberghe, S., Amorós-López, J., Vila-Francés, J., Gómez-Chova, L., and Moreno, J. (2017). Diurnal cycle relationships between passive fluorescence, PRI and NPQ of vegetation in a controlled stress experiment. Remote Sens. 9:770. doi: 10.3390/rs9080770
Anderegg, W. R. L. (2015). Spatial and temporal variation in plant hydraulic traits and their relevance for climate change impacts on vegetation. New Phytol. 205, 1008–1014. doi: 10.1111/nph.12907
Anderegg, W. R. L., Martinez-Vilalta, J., Cailleret, M., Camarero, J. J., Ewers, B. E., Galbraith, D., et al. (2016). When a tree dies in the forest: scaling climate-driven tree mortality to ecosystem water and carbon fluxes. Ecosystems 19, 1133–1147. doi: 10.1007/s10021-016-9982-1
Arp, G. K., and Phinney, D. E. (1980). Ecological variations in thermal infrared emissivity of vegetation. Environ. Exp. Bot. 20, 135–148. doi: 10.1016/0098-8472(80)90006-4
Atkinson, C. J., Winner, W. E., and Mooney, H. A. (1986). A field portable gas-exchange system for measuring carbon dioxide and water vapour exchange rates of leaves during fumigation with SO2. Plant. Cell Environ. 9, 711–719. doi: 10.1111/j.1365-3040.1986.tb02103.x
Aubrecht, D. M., Helliker, B. R., Goulden, M. L., Roberts, D. A., Still, C. J., and Richardson, A. D. (2016). Continuous, long-term, high-frequency thermal imaging of vegetation: uncertainties and recommended best practices. Agric. For. Meteorol. 228–229, 315–326. doi: 10.1016/j.agrformet.2016.07.017
Baluja, J., Diago, M. P., Balda, P., Zorer, R., Meggio, F., Morales, F., et al. (2012). Assessment of vineyard water status variability by thermal and multispectral imagery using an unmanned aerial vehicle (UAV). Irrig. Sci. 30, 511–522. doi: 10.1007/s00271-012-0382-9
Beauducel, A., and Herzberg, P. Y. (2006). On the performance of maximum likelihood versus means and variance adjusted weighted least squares estimation in CFA. Struct. Equ. Model. 13, 186–203. doi: 10.1207/s15328007sem1302_2
Bellvert, J., Zarco-Tejada, P. J., Girona, J., and Fereres, E. (2014). Mapping crop water stress index in a ‘Pinot-noir’ vineyard: comparing ground measurements with thermal remote sensing imagery from an unmanned aerial vehicle. Precis. Agric. 15, 361–376. doi: 10.1007/s11119-013-9334-5
Ben-Gal, A., Kool, D., Agam, N., van Halsema, G. E., Yermiyahu, U., Yafe, A., et al. (2010). Whole-tree water balance and indicators for short-term drought stress in non-bearing ‘Barnea’ olives. Agric. Water Manag. 98, 124–133. doi: 10.1016/j.agwat.2010.08.008
Berendse, F. (1981). Competition between plant populations with different rooting depths II. Pot experiments. Oecologia 48, 334–341. doi: 10.1007/BF00346491
Boulard, T., Fatnassi, H., Roy, J. C., Lagier, J., Fargues, J., Smits, N., et al. (2004). Effect of greenhouse ventilation on humidity of inside air and in leaf boundary-layer. Agric. For. Meteorol. 125, 225–239. doi: 10.1016/j.agrformet.2004.04.005
Bréda, N., Huc, R., Granier, A., and Dreyer, E. (2006). Temperate forest trees and stands under severe drought: a review of ecophysiological responses, adaptation processes and long-term consequences. Ann. For. Sci. 63, 625–644. doi: 10.1051/forest:2006042
Bugbee, B., Droter, M., Monje, O., and Tanner, B. (1998). Evaluation and modification of commercial infra-red transducers for leaf temperature measurement. Adv. Sp. Res. 22, 1425–1434. doi: 10.1016/S0273-1177(98)00213-0
Buitrago, M. F., Groen, T. A., Hecker, C. A., and Skidmore, A. K. (2016). Changes in thermal infrared spectra of plants caused by temperature and water stress. ISPRS J. Photogramm. Remote Sens. 111, 22–31. doi: 10.1016/J.ISPRSJPRS.2015.11.003
Bürkner, P. (2018). Advanced bayesian multilevel modeling with the R package brms. R J. 10, 395–411.
Camarero, J. J., Bigler, C., Linares, J. C., and Gil-Pelegrín, E. (2011). Synergistic effects of past historical logging and drought on the decline of Pyrenean silver fir forests. For. Ecol. Manage. 262, 759–769. doi: 10.1016/j.foreco.2011.05.009
Campbell, G. S., Smith, D. M., and Teare, B. L. (2007). “Application of a Dew Point Method to Obtain the Soil Water Characteristic,” in Experimental Unsaturated Soil Mechanics, T. Schanz (Berlin: Springer), 71–77. doi: 10.1007/3-540-69873-6_7.
Carter, G. A. (1998). Reflectance wavebands and indices for remote estimation of photosynthesis and stomatal conductance in pine canopies. Rem. Sens. Environ. 63, 61–72. doi: 10.1016/S0034-4257(97)00110-7
Chaerle, L., Leinonen, I., Jones, H. G., and Van Der Straeten, D. (2007). Monitoring and screening plant populations with combined thermal and chlorophyll fluorescence imaging. J. Exp. Bot. 58, 773–784. doi: 10.1093/jxb/erl257
Chen, C. (2015). Determining the leaf emissivity of three crops by infrared thermometry. Sensors 15, 11387–11401. doi: 10.3390/s150511387
Chen, J.-W., Kuang, S.-B., Long, G.-Q., Yang, S.-C., Meng, Z.-G., Li, L.-G., et al. (2016). Photosynthesis, light energy partitioning, and photoprotection in the shade-demanding species Panax notoginseng under high and low level of growth irradiance. Funct. Plant Biol. 43:479. doi: 10.1071/FP15283
Chen, Y., Guerschman, J. P., Cheng, Z., and Guo, L. (2019). Remote sensing for vegetation monitoring in carbon capture storage regions: a review. Appl. Energy 240, 312–326. doi: 10.1016/j.apenergy.2019.02.027
Cleary, M. B. B., Naithani, K. J. J., Ewers, B. E. E., and Pendall, E. (2015). Upscaling CO2 fluxes using leaf, soil and chamber measurements across successional growth stages in a sagebrush steppe ecosystem. J. Arid Environ. 121, 43–51. doi: 10.1016/J.JARIDENV.2015.05.013
Coenders-Gerrits, A. M. J., Van Der Ent, R. J., Bogaard, T. A., Wang-Erlandsson, L., Hrachowitz, M., and Savenije, H. H. G. (2014). Uncertainties in transpiration estimates. Nature 506, E1-E2. doi: 10.1038/nature12925
Cohen, Y., Alchanatis, V., Meron, M., Saranga, Y., and Tsipris, J. (2005). Estimation of leaf water potential by thermal imagery and spatial analysis. J. Exp. Bot. 56, 1843–1852. doi: 10.1093/jxb/eri174
de Vries, F. T., Liiri, M. E., Bjørnlund, L., Setälä, H. M., Christensen, S., and Bardgett, R. D. (2012). Legacy effects of drought on plant growth and the soil food web. Oecologia 170, 821–833. doi: 10.1007/s00442-012-2331-y
Deng, L., Lin, Y., Yan, L., Tesfamichael, S., Billen, R., Yao, Y., et al. (2019). Urban plant phenology monitoring: expanding the functions of widespread surveillance cameras to nature rhythm understanding. Remote Sens. Appl. Soc. Environ. 15:100232. doi: 10.1016/j.rsase.2019.05.001
Dhondt, S., Wuyts, N., and Inzé, D. (2013). Cell to whole-plant phenotyping: the best is yet to come. Trends Plant Sci. 18, 428–439. doi: 10.1016/j.tplants.2013.04.008
Dietze, M. C. (2017). Prediction in ecology: a first-principles framework. Ecol. Appl. 27, 2048–2060. doi: 10.1002/eap.1589
Dungey, H. S., Dash, J. P., Pont, D., Clinton, P. W., Watt, M. S., and Telfer, E. J. (2018). Phenotyping whole forests will help to track genetic performance. Trends Plant Sci. 23, 854–864. doi: 10.1016/j.tplants.2018.08.005
Duursma, R. A., Blackman, C. J., Lopéz, R., Martin-StPaul, N. K., Cochard, H., and Medlyn, B. E. (2019). On the minimum leaf conductance: its role in models of plant water use, and ecological and environmental controls. New Phytol. 221, 693–705. doi: 10.1111/nph.15395
Fahlgren, N., Feldman, M., Gehan, M. A., Wilson, M. S., Shyu, C., Bryant, D. W., et al. (2015). A versatile phenotyping system and analytics platform reveals diverse temporal responses to water availability in Setaria. Mol. Plant 8, 1520–1535. doi: 10.1016/j.molp.2015.06.005
Falcioni, R., Moriwaki, T., Pattaro, M., Herrig Furlanetto, R., Nanni, M. R., and Camargos Antunes, W. (2020). High resolution leaf spectral signature as a tool for foliar pigment estimation displaying potential for species differentiation. J. Plant Physiol. 249:153161. doi: 10.1016/j.jplph.2020.153161
Faye, E., Dangles, O., and Pincebourde, S. (2016). Distance makes the difference in thermography for ecological studies. J. Therm. Biol. 56, 1–9. doi: 10.1016/j.jtherbio.2015.11.011
Ferguson, C. R., Sheffield, J., Wood, E. F., and Gao, H. (2010). Quantifying uncertainty in a remote sensing-based estimate of evapotranspiration over continental USA. Int. J. Remote Sens. 31, 3821–3865. doi: 10.1080/01431161.2010.483490
Flexas, J., Díaz-Espejo, A., Berry, J. A., Cifre, J., Galmés, J., Kaldenhoff, R., et al. (2007). Analysis of leakage in IRGA’s leaf chambers of open gas exchange systems: quantification and its effects in photosynthesis parameterization. J. Exp. Bot. 58, 1533–1543. doi: 10.1093/jxb/erm027
Flowers, M. D., Fiscus, E. L., Burkey, K. O., Booker, F. L., and Dubois, J. J. B. (2007). Photosynthesis, chlorophyll fluorescence, and yield of snap bean (Phaseolus vulgaris L.) genotypes differing in sensitivity to ozone. Environ. Exp. Bot. 61, 190–198. doi: 10.1016/j.envexpbot.2007.05.009
Gelman, A., Goodrich, B., Gabry, J., and Vehtari, A. (2019). R-squared for Bayesian Regression Models. Am. Stat. 73, 307–309. doi: 10.1080/00031305.2018.1549100
Gerhards, M., Rock, G., Schlerf, M., and Udelhoven, T. (2016). Water stress detection in potato plants using leaf temperature, emissivity, and reflectance. Int. J. Appl. Earth Obs. Geoinf. 53, 27–39. doi: 10.1016/j.jag.2016.08.004
Gitelson, A. A., Gritz, Y., and Merzlyak, M. N. (2003). Relationships between leaf chlorophyll content and spectral reflectance and algorithms for non-destructive chlorophyll assessment in higher plant leaves. J. Plant Physiol. 160, 271–282. doi: 10.1078/0176-1617-00887
Gorissen, A., Tietema, A., Joosten, N. N., Estiarte, M., Peñuelas, J., Sowerby, A., et al. (2004). Climate change affects carbon allocation to the soil in shrublands. Ecosystems 7, 650–661. doi: 10.1007/s10021-004-0218-4
Govender, M., Dye, P. J., Weiersbye, I. M., Witkowski, E. T. F., Ahmed, F., Govender, P., et al. (2009). Review of commonly used remote sensing and ground-based technologies to measure plant water stress. South Afr. Water Res. Commis. 5, 741–752. doi: 10.4314/wsa.v35i5.49201
Grieu, P., Guehl, J. M., and Aussenac, G. (1988). The effects of soil and atmospheric drought on photosynthesis and stomatal control of gas exchange in three coniferous species. Physiol. Plant. 73, 97–104. doi: 10.1111/j.1399-3054.1988.tb09199.x
Griffin-Nolan, R. J., Ocheltree, T. W., Mueller, K. E., Blumenthal, D. M., Kray, J. A., and Knapp, A. K. (2019). Extending the osmometer method for assessing drought tolerance in herbaceous species. Oecologia 189, 353–363. doi: 10.1007/s00442-019-04336-w
Guadagno, C. R., Ewers, B. E., Speckman, H. N., Aston, T. L., Huhn, B. J., DeVore, S. B., et al. (2017). Dead or alive? using membrane failure and chlorophyll a fluorescence to predict plant mortality from drought. Plant Physiol. 175, 223–234. doi: 10.1104/pp.16.00581
Guo, J. S., Gear, L., Hultine, K. R., Koch, G. W., and Ogle, K. (2020). Non-structural carbohydrate dynamics associated with antecedent stem water potential and air temperature in a dominant desert shrub. Plant Cell Environ. 43, 1467–1483. doi: 10.1111/pce.13749
Gutiérrez, S., Tardaguila, J., Fernández-Novales, J., and Diago, M. (2016). Data mining and NIR spectroscopy in viticulture: applications for plant phenotyping under field conditions. Sensors 16:236. doi: 10.3390/s16020236
Halcro, K. A., and Noble, S. D. (2018). The Prospect of Thermal Imaging to Estimate Stomatal Conductance through Energy Balance Modelling. Paper presented atASABE Annual International Meeting, St. Joseph, MI. doi: 10.13031/aim.201800271.
Hartmann, H., Ziegler, W., Kolle, O., and Trumbore, S. (2013). Thirst beats hunger - declining hydration during drought prevents carbon starvation in Norway spruce saplings. New Phytol. 200, 340–349. doi: 10.1111/nph.12331
Hatton, T. J., and Wu, H. I. (1995). Scaling theory to extrapolate individual tree water use to stand water use. Hydrol. Process. 9, 527–540. doi: 10.1002/hyp.3360090505
Hong, M., Bremer, D. J., and Merwe, D. (2019). Thermal imaging detects early drought stress in turfgrass utilizing small unmanned aircraft systems. Agrosyst. Geosci. Environ. 2, 1–9. doi: 10.2134/age2019.04.0028
Humplík, J. F., Lazár, D., Husièková, A., and Spíchal, L. (2015). Automated phenotyping of plant shoots using imaging methods for analysis of plant stress responses – a review. Plant Methods 11:29. doi: 10.1186/s13007-015-0072-8
Jarvis, P. G. G., and McNaughton, K. G. G. (1986). Stomatal control of transpiration: scaling up from leaf to region. Adv. Ecol. Res. 15, 1–49. doi: 10.1016/S0065-2504(08)60119-1
Jones, H. G. (1992). Plants and Microclimate: A Quantitative Approach To Environmental Plant Physiology. Cambridge: Cambridge University Press.
Jones, H. G. (2004). Application of Thermal Imaging and Infrared Sensing in Plant Physiology and Ecophysiology. Available online at: https://www.sciencedirect.com/science/article/pii/S0065229604410039 (Accessed March 16, 2019).
Jones, H. G., Serraj, R., Loveys, B. R., Xiong, L., Wheaton, A., and Price, A. H. (2009). Thermal infrared imaging of crop canopies for the remote diagnosis and quantification of plant responses to water stress in the field. Funct. Plant Biol. 36:978. doi: 10.1071/FP09123
Jud, W., Winkler, J. B., Niederbacher, B., Niederbacher, S., and Schnitzler, J. P. (2018). Volatilomics: a non-invasive technique for screening plant phenotypic traits. Plant Methods 14:109. doi: 10.1186/s13007-018-0378-4
Kalaji, H. M., Jajoo, A., Oukarroum, A., Brestic, M., Zivcak, M., Samborska, I. A., et al. (2016). Chlorophyll a fluorescence as a tool to monitor physiological status of plants under abiotic stress conditions. Acta Physiol. Plant. 38:102. doi: 10.1007/s11738-016-2113-y
Kalaji, H. M., Schansker, G., Ladle, R. J., Goltsev, V., Bosa, K., Allakhverdiev, S. I., et al. (2014). Frequently asked questions about in vivo chlorophyll fluorescence: practical issues. Photosynth. Res. 122, 121–158. doi: 10.1007/s11120-014-0024-6
Kim, Y., Still, C. J., Roberts, D. A., and Goulden, M. L. (2018). Thermal infrared imaging of conifer leaf temperatures: comparison to thermocouple measurements and assessment of environmental influences. Agric. For. Meteorol. 248, 361–371. doi: 10.1016/j.agrformet.2017.10.010
Kimball, B. A. (1973). Simulation of the energy balance of a greenhouse. Agric. Meteorol. 11, 243–260. doi: 10.1016/0002-1571(73)90067-8
King, G. B., Lovell, A. E., Neufcourt, L., and Nunes, F. M. (2019). Direct comparison between bayesian and frequentist uncertainty quantification for nuclear reactions. Phys. Rev. Lett. 122:232502. doi: 10.1103/PhysRevLett.122.232502
Köhler, P., and Huth, A. (2010). Towards ground-truthing of spaceborne estimates of above-ground life biomass and leaf area index in tropical rain forests. Biogeosciences 7, 2531–2543. doi: 10.5194/bg-7-2531-2010
Kruschke, J. K. (2010). Bayesian data analysis. Wiley Interdiscip. Rev. Cogn. Sci. 1, 658–676. doi: 10.1002/wcs.72
Kruschke, J. K. (2013). Bayesian estimation supersedes the t test. J. Exp. Psychol. Gen. 142, 573–603. doi: 10.1037/a0029146
Kumar, A., and Elston, J. (1992). Genotypic differences in leaf water relations between Brassica juncea and B. napus. Ann. Bot. 70, 3–9. doi: 10.1093/oxfordjournals.aob.a088436
Landsberg, J., Waring, R., and Ryan, M. (2017). Water relations in tree physiology: where to from here? Tree Physiol. 37, 18–32. doi: 10.1093/treephys/tpw102
Leigh, A., Sevanto, S., Close, J. D., and Nicotra, A. B. (2017). The influence of leaf size and shape on leaf thermal dynamics: does theory hold up under natural conditions? Plant Cell Environ. 40, 237–248. doi: 10.1111/pce.12857
Leuning, R., Kelliher, F. M., Pury, D. G. G., and Schulze, E. D. (1995). Leaf nitrogen, photosynthesis, conductance and transpiration: scaling from leaves to canopies. Plant Cell Environ. 18, 1183–1200. doi: 10.1111/j.1365-3040.1995.tb00628.x
Link, W. A., Cam, E., Nichols, J. D., and Cooch, E. G. (2002). Of bugs and birds: markov chain monte carlo for hierarchical modeling in wildlife research. J. Wildl. Manage. 66:277. doi: 10.2307/3803160
Liu, H., and Zhou, Q. (2004). Accuracy analysis of remote sensing change detection by rule-based rationality evaluation with post-classification comparison. Int. J. Remote Sens. 25, 1037–1050. doi: 10.1080/0143116031000150004
Liu, Y., Subhash, C., Yan, J., Song, C., Zhao, J., and Li, J. (2011). Maize leaf temperature responses to drought: thermal imaging and quantitative trait loci (QTL) mapping. Environ. Exp. Bot. 71, 158–165. doi: 10.1016/j.envexpbot.2010.11.010
Lu, D., Ricciuto, D., Walker, A., Safta, C., and Munger, W. (2017). Bayesian calibration of terrestrial ecosystem models: a study of advanced Markov chain Monte Carlo methods. Biogeosciences 14, 4295–4314. doi: 10.5194/bg-14-4295-2017
Mackay, D. S., Roberts, D. E., Ewers, B. E., Sperry, J. S., McDowell, N. G., and Pockman, W. T. (2015). Interdependence of chronic hydraulic dysfunction and canopy processes can improve integrated models of tree response to drought. Water Resour. Res. 51, 6156–6176. doi: 10.1002/2015WR017244
Magney, T. S., Bowling, D. R., Logan, B. A., Grossmann, K., Stutz, J., Blanken, P. D., et al. (2019). Mechanistic evidence for tracking the seasonality of photosynthesis with solar-induced fluorescence. Proc. Natl. Acad. Sci. U.S.A. 116, 11640–11645. doi: 10.1073/pnas.1900278116
Mahlein, A. -K. (2016). Plant disease detection by imaging sensors – parallels and specific demands for precision agriculture and plant phenotyping. Plant Dis. 100, 241–251. doi: 10.1094/PDIS-03-15-0340-FE
Mariotti, B., Maltoni, A., Jacobs, D. F., and Tani, A. (2015). Container effects on growth and biomass allocation in Quercus robur and Juglans regia seedlings. Scand. J. For. Res. 30, 1–15. doi: 10.1080/02827581.2015.1023352
Martínez-Vilalta, J., and Garcia-Forner, N. (2017). Water potential regulation, stomatal behaviour and hydraulic transport under drought: deconstructing the iso/anisohydric concept. Plant Cell Environ. 40, 962–976. doi: 10.1111/pce.12846
McDowell, N. G. (2011). Mechanisms linking drought, hydraulics, carbon metabolism, and vegetation mortality. Plant Physiol. 155, 1051–1059. doi: 10.1104/pp.110.170704
McDowell, N. G., and Sevanto, S. (2010). The mechanisms of carbon starvation: how, when, or does it even occur at all? New Phytol. 186, 264–266. doi: 10.1111/j.1469-8137.2010.03232.x
McElreath, R. (2020). Statistical Rethinking: A Bayesian Course With Examples in R and Stan. Boca Raton, FL: CRC Press.
Milton, E. J. (1987). Review article: principles of field spectroscopy. Int. J. Remote Sens. 8, 1807–1827. doi: 10.1080/01431168708954818
Moreno-Martínez, Á., Camps-Valls, G., Kattge, J., Robinson, N., Reichstein, M., van Bodegom, P., et al. (2018). A methodology to derive global maps of leaf traits using remote sensing and climate data. Remote Sens. Environ. 218, 69–88. doi: 10.1016/j.rse.2018.09.006
Murchie, E. H. H., and Lawson, T. (2013). Chlorophyll fluorescence analysis: a guide to good practice and understanding some new applications. J. Exp. Bot. 64, 3983–3998. doi: 10.1093/jxb/ert208
Murphy, R. J., Whelan, B., Chlingaryan, A., and Sukkarieh, S. (2019). Quantifying leaf-scale variations in water absorption in lettuce from hyperspectral imagery: a laboratory study with implications for measuring leaf water content in the context of precision agriculture. Precis. Agric. 20, 767–787. doi: 10.1007/s11119-018-9610-5
Naithani, K. J., Ewers, B. E., and Pendall, E. (2012). Sap flux-scaled transpiration and stomatal conductance response to soil and atmospheric drought in a semi-arid sagebrush ecosystem. J. Hydrol. 464–465, 176–185. doi: 10.1016/j.jhydrol.2012.07.008
Nolan, R. H., Tarin, T., Santini, N. S., McAdam, S. A., Ruman, R., and Eamus, D. (2017). Differences in osmotic adjustment, foliar abscisic acid dynamics, and stomatal regulation between an isohydric and anisohydric woody angiosperm during drought. Plant Cell Environ. 40, 3122–3134. doi: 10.1111/pce.13077
Ogle, K., and Barber, J. J. (2008). Bayesian Data—Model Integration in Plant Physiological and Ecosystem Ecology. Berlin: Springer, 281–311. doi: 10.1007/978-3-540-72954-9_12.
Ogle, K., and Barber, J. J. (2020). Ensuring identifiability in hierarchical mixed effects Bayesian models. Ecol. Appl. 30:e02159. doi: 10.1002/eap.2159
Olejnik, S. F., and Algina, J. (1983). Parametric ANCOVA vs. rank transform ANCOVA when As5umptions of conditional normality and homoscedasticity are violated. J. Educ. Behav. Statist. 9:33
Oxborough, K., and Baker, N. R. (1997). Resolving chlorophyll a fluorescence images of photosynthetic efficiency into photochemical and non-photochemical components - Calculation of qP and Fv′/Fm′ without measuring Fo′. Photosynth. Res. 54, 135–142. doi: 10.1023/A:1005936823310
Page, G. F. M., Liénard, J. F., Pruett, M. J., and Moffett, K. B. (2018). Spatiotemporal dynamics of leaf transpiration quantified with time-series thermal imaging. Agric. For. Meteorol. 256–257, 304–314. doi: 10.1016/J.AGRFORMET.2018.02.023
Parazoo, N. C., Magney, T., Norton, A., Raczka, B., Bacour, C., Maignan, F., et al. (2020). Wide discrepancies in the magnitude and direction of modeled solar-induced chlorophyll fluorescence in response to light conditions. Biogeosciences 17, 3733–3755. doi: 10.5194/bg-17-3733-2020
Pashanasi, B., Melendez, G., Szott, L., and Lavelle, P. (1992). Effect of inoculation with the endogeic earthworm pontoscolex corethrurus (glossoscolecidae) on n availability, soil microbial biomass and the growth of three tropical fruit tree seedlings in a pot experiment. Soil Biol. Biochem. 24, 1655–1659. doi: 10.1016/0038-0717(92)90165-T
Petrie, P. R., Wang, Y., Liu, S., Lam, S., Whitty, M. A., and Skewes, M. A. (2019). The accuracy and utility of a low cost thermal camera and smartphone-based system to assess grapevine water status. Biosyst. Eng. 179, 126–139. doi: 10.1016/j.biosystemseng.2019.01.002
Phillipson, J., Blair, G., and Henrys, P. (2020). Quantifying Uncertainty for Estimates Derived from Error Matrices in Land Cover Mapping Applications: The Case for a Bayesian Approach. in IFIP Advances in Information and Communication Technology. Berlin: Springer, 151–164. doi: 10.1007/978-3-030-39815-6_15.
Pierce, L. L., Running, S. W., and Riggs, G. A. (1990). Remote detection of canopy water stress in coniferous forests using the NS001 thematic mapper simulator and the thermal infrared multispectral scanner. Photogramm. Eng. Remote Sens. 56, 579–586.
Poggi, D., Porporato, A., Ridolfi, L., Albertson, J. D., and Katul, G. G. (2004). The effect of vegetation density on canopy sub-layer turbulence. Bound. Layer Meteorol. 111, 565–587. doi: 10.1023/B:BOUN.0000016576.05621.73
Prashar, A., and Jones, H. G. (2016). Assessing Drought Responses Using Thermal Infrared Imaging.New York, NY: Humana Press,, 209–219. doi: 10.1007/978-1-4939-3356-3_17.
Press, S. J. (2005). Applied Multivariate Analysis: Using Bayesian and Frequentist Methods of Inference. Chelmsford, MA: Courier Corporation.
Qiu, R., Kang, S., Du, T., Tong, L., Hao, X., Chen, R., et al. (2013). Effect of convection on the Penman-Monteith model estimates of transpiration of hot pepper grown in solar greenhouse. Sci. Hortic. 160, 163–171. doi: 10.1016/j.scienta.2013.05.043
Quaife, T., and Cripps, E. (2016). Bayesian analysis of uncertainty in the globcover 2009 land cover product at climate model grid scale. Remote Sens. 8:314. doi: 10.3390/rs8040314
Rahkonen, J., and Jokela, H. (2003). Infrared radiometry for measuring plant leaf temperature during thermal weed control treatment. Biosyst. Eng. 86, 257–266. doi: 10.1016/S1537-5110(03)00138-7
Ren, H., Liu, R., Yan, G., Mu, X., Li, Z. L., Nerry, F., et al. (2014). Angular normalization of land surface temperature and emissivity using multiangular middle and thermal infrared data. IEEE Trans. Geosci. Remote Sens. 52, 4913–4931. doi: 10.1109/TGRS.2013.2285924
Renzullo, L. J., Barrett, D. J., Marks, A. S., Hill, M. J., Guerschman, J. P., Mu, Q., et al. (2008). Multi-sensor model-data fusion for estimation of hydrologic and energy flux parameters. Rem. Sens. Environ. 112, 1306–1319. doi: 10.1016/j.rse.2007.06.022
Resco, V., Ewers, B. E., Sun, W., Huxman, T. E., Weltzin, J. F., and Williams, D. G. (2009). Drought-induced hydraulic limitations constrain leaf gas exchange recovery after precipitation pulses in the C3woody legume, Prosopis velutina. New Phytol. 181, 672–682. doi: 10.1111/j.1469-8137.2008.02687.x
Richardson, A. D. (2019). Tracking seasonal rhythms of plants in diverse ecosystems with digital camera imagery. New Phytol. 222, 1742–1750. doi: 10.1111/nph.15591
Ruan, Y. L., Jin, Y., Yang, Y. J., Li, G. J., and Boyer, J. S. (2010). Sugar input, metabolism, and signaling mediated by invertase: roles in development, yield potential, and response to drought and heat. Mol. Plant 3, 942–955. doi: 10.1093/mp/ssq044
Ruehr, N. K., Offermann, C. A., Gessler, A., Winkler, J. B., Ferrio, J. P., Buchmann, N., et al. (2009). Drought effects on allocation of recent carbon: from beech leaves to soil CO2 efflux. New Phytol. 184, 950–961. doi: 10.1111/j.1469-8137.2009.03044.x
Running, S. W., Loveland, T. R., Pierce, L. L., Nemani, R. R., and Hunt, E. R. (1995). A remote sensing based vegetation classification logic for global land cover analysis. Remote Sens. Environ. 51, 39–48. doi: 10.1016/0034-4257(94)00063-S
Ryan, A. C., Dodd, I. C., Rothwell, S. A., Jones, R., Tardieu, F., Draye, X., et al. (2016). Gravimetric phenotyping of whole plant transpiration responses to atmospheric vapour pressure deficit identifies genotypic variation in water use efficiency. Plant Sci. 251, 101–109. doi: 10.1016/j.plantsci.2016.05.018
Ryu, Y., Berry, J. A., and Baldocchi, D. D. (2019). What is global photosynthesis? History, uncertainties and opportunities. Remote Sens. Environ. 223, 95–114. doi: 10.1016/j.rse.2019.01.016
Sala, A., Piper, F., and Hoch, G. (2010). Physiological mechanisms of drought-induced tree mortality are far from being resolved. New Phytol. 186, 274–281.
Salmon, Y., Torres-Ruiz, J. M., Poyatos, R., Martinez-Vilalta, J., Meir, P., Cochard, H., et al. (2015). Balancing the risks of hydraulic failure and carbon starvation: a twig scale analysis in declining Scots pine. Plant. Cell Environ. 38, 2575–2588. doi: 10.1111/pce.12572
Salon, C., Avice, J. C., Colombié, S., Dieuaide-Noubhani, M., Gallardo, K., Jeudy, C., et al. (2017). Fluxomics links cellular functional analyses to whole-plant phenotyping. J. Exp. Bot. 68, 2083–2098. doi: 10.1093/jxb/erx126
Samanta, S., Mackay, D. S., Clayton, M. K., Kruger, E. L., and Ewers, B. E. (2007). Bayesian analysis for uncertainty estimation of a canopy transpiration model. Water Resour. Res. 43, 1–13. doi: 10.1029/2006WR005028
Santini, F., Kefauver, S. C., Resco de Dios, V., Araus, J. L., and Voltas, J. (2019). Using unmanned aerial vehicle-based multispectral, RGB and thermal imagery for phenotyping of forest genetic trials: a case study in Pinus halepensis. Ann. Appl. Biol. 174, 262–276. doi: 10.1111/aab.12484
Sayed, O. H. (2003). Chlorophyll fluorescence as a tool in cereal crop research. Photosynthetica 41, 321–330. doi: 10.1023/B:PHOT.0000015454.36367.e2
Schachtman, D. P., and Goodger, J. Q. D. (2008). Chemical root to shoot signaling under drought. Trends Plant Sci. 13, 281–287. doi: 10.1016/j.tplants.2008.04.003
Schuepp, P. H. (1993). Leaf boundary layers. Available online at: https://about.jstor.org/terms (Accessed February 28, 2020).
Sepulcre-Cantó, G., Zarco-Tejada, P. J. J., Jiménez-Muñoz, J. C. C., Sobrino, J. A. A., Miguel, E. D, and Villalobos, F. J. J. (2006). Detection of water stress in an olive orchard with thermal remote sensing imagery. Agric. For. Meteorol. 136, 31–44. doi: 10.1016/j.agrformet.2006.01.008
Sevanto, S., McDowell, N. G., Dickman, L. T., Pangle, R., and Pockman, W. T. (2014). How do trees die? A test of the hydraulic failure and carbon starvation hypotheses. Plant, Cell Environ. 37, 153–161. doi: 10.1111/pce.12141
Siddique, M. R. B., Hamid, A. I. M. S., and Islam, M. S. (2000). Drought stress effects on water relations of wheat. Bot. Bull. Acad. Sin. 41, 35–39.
Silva, E. N., Ferreira-Silva, S. L., Fontenele, A., de, V., Ribeiro, R. V., Viégas, R. A., and Silveira, J. A. G. (2010). Photosynthetic changes and protective mechanisms against oxidative damage subjected to isolated and combined drought and heat stresses in Jatropha curcas plants. J. Plant Physiol. 167, 1157–1164. doi: 10.1016/j.jplph.2010.03.005
Simon, H., Lindén, J., Hoffmann, D., Braun, P., Bruse, M., and Esper, J. (2018). Modeling transpiration and leaf temperature of urban trees – A case study evaluating the microclimate model ENVI-met against measurement data. Landsc. Urban Plan. 174, 33–40. doi: 10.1016/J.LANDURBPLAN.2018.03.003
Sims, D. A., and Gamon, J. A. (2003). Estimation of vegetation water content and photosynthetic tissue area from spectral reflectance: a comparison of indices based on liquid water and chlorophyll absorption features. Remote Sens. Environ. 84, 526–537. doi: 10.1016/S0034-4257(02)00151-7
Stan Development Team (2020). RStan: the R interface to Stan. Available online at: http://mc-stan.org/ (accessed August 1, 2020).
Steinkamp, J., and Hickler, T. (2015). Is drought-induced forest dieback globally increasing? J. Ecol. 103, 31–43. doi: 10.1111/1365-2745.12335
Still, C., Powell, R., Aubrecht, D., Kim, Y., Helliker, B., Roberts, D., et al. (2019). Thermal imaging in plant and ecosystem ecology: applications and challenges. Ecosphere 10:e02768.
Tague, C., Heyn, K., and Christensen, L. (2009). Topographic controls on spatial patterns of conifer transpiration and net primary productivity under climate warming in mountain ecosystems. Ecohydrology 2, 541–554. doi: 10.1002/eco.88
Tanner, C. B. (1963). Plant Temperatures1. Agron. J. 55:210. doi: 10.2134/agronj1963.00021962005500020043x
Tardieu, F., and Simonneau, T. (1998). Variability among species of stomatal control under fluctuating soil water status and evaporative demand: modelling isohydric and anisohydric behaviours. J. Exp. Bot. 49, 419–432.
Thomas, R. B., and Strain, B. R. (1991). Root restriction as a factor in photosynthetic acclimation of cotton seedlings grown in elevated carbon dioxide. Plant Physiol. 96, 627–634. doi: 10.1104/pp.96.2.627
Tschiersch, H., Junker, A., Meyer, R. C., and Altmann, T. (2017). Establishment of integrated protocols for automated high throughput kinetic chlorophyll fluorescence analyses. Plant Methods 13:54. doi: 10.1186/s13007-017-0204-4
Urli, M., Porte, A. J., Cochard, H., Guengant, Y., Burlett, R., and Delzon, S. (2013). Xylem embolism threshold for catastrophic hydraulic failure in angiosperm trees. Tree Physiol. 33, 672–683. doi: 10.1093/treephys/tpt030
Van Der Tol, C., Berry, J. A., Campbell, P. K. E., and Rascher, U. (2014). Models of fluorescence and photosynthesis for interpreting measurements of solar-induced chlorophyll fluorescence. J. Geophys. Res. Biogeosciences 119, 2312–2327. doi: 10.1002/2014JG002713
van Dusschoten, D., Metzner, R., Kochs, J., Postma, J. A., Pflugfelder, D., Bühler, J., et al. (2016). Quantitative 3D analysis of plant roots growing in soil using magnetic resonance imaging. Plant Physiol. 170, 1176–1188. doi: 10.1104/pp.15.01388
Van Kooten, O., and Snel, J. F. H. (1990). The Use of Chlorophyll Fluorescence Nomenclature in Plant Stress Physiology. Available online at: https://link.springer.com/content/pdf/10.1007/BF00033156.pdf (accessed January 7, 2019).
Verrelst, J., Rivera, J. P., van der Tol, C., Magnani, F., Mohammed, G., and Moreno, J. (2015). Global sensitivity analysis of the SCOPE model: what drives simulated canopy-leaving sun-induced fluorescence? Remote Sens. Environ. 166, 8–21. doi: 10.1016/j.rse.2015.06.002
Vinukollu, R. K., Wood, E. F., Ferguson, C. R., and Fisher, J. B. (2011). Global estimates of evapotranspiration for climate studies using multi-sensor remote sensing data: evaluation of three process-based approaches. Remote Sens. Environ. 115, 801–823. doi: 10.1016/j.rse.2010.11.006
Wang, G., Oyana, T., Zhang, M., Adu-Prah, S., Zeng, S., Lin, H., et al. (2009). Mapping and spatial uncertainty analysis of forest vegetation carbon by combining national forest inventory data and satellite images. For. Ecol. Manage. 258, 1275–1283. doi: 10.1016/j.foreco.2009.06.056
Waring, R. H., Schroeder, P. E., and Oren, R. (1982). Application of the pipe model theory to predict canopy leaf area. Can. J. For. Res. 12, 556–560. doi: 10.1139/x82-086
Will, R. E., Wilson, S. M., Zou, C. B., and Hennessey, T. C. (2013). Increased vapor pressure deficit due to higher temperature leads to greater transpiration and faster mortality during drought for tree seedlings common to the forest–grassland ecotone. New Phytol. 200, 366–374. doi: 10.1111/nph.12321
Xu, P., Tian, L., Kloz, M., and Croce, R. (2015). Molecular insights into Zeaxanthin-dependent quenching in higher plants. Sci. Rep. 5:13679. doi: 10.1038/srep13679
Xue, J., and Su, B. (2017). Significant remote sensing vegetation indices: a review of developments and applications. J. Sens. 2017:1353691. doi: 10.1155/2017/1353691
Zhang, L., and Lemeur, R. (1992). Effect of aerodynamic resistance on energy balance and Penman-Monteith estimates of evapotranspiration in greenhouse conditions. Agric. For. Meteorol. 58, 209–228. doi: 10.1016/0168-1923(92)90062-9
Keywords: aspen, chlorophyll a fluorescence, drought, phenotyping, leaf water potential, ponderosa pine, remote sensing, thermal imaging
Citation: Beverly DP, Guadagno CR and Ewers BE (2020) Biophysically Informed Imaging Acquisition of Plant Water Status. Front. For. Glob. Change 3:589493. doi: 10.3389/ffgc.2020.589493
Received: 30 July 2020; Accepted: 09 October 2020;
Published: 02 November 2020.
Edited by:
Víctor Resco De Dios, Southwest University of Science and Technology, ChinaReviewed by:
Cate Macinnis-Ng, The University of Auckland, New ZealandDrew Peltier, Northern Arizona University, United States
Copyright © 2020 Beverly, Guadagno and Ewers. This is an open-access article distributed under the terms of the Creative Commons Attribution License (CC BY). The use, distribution or reproduction in other forums is permitted, provided the original author(s) and the copyright owner(s) are credited and that the original publication in this journal is cited, in accordance with accepted academic practice. No use, distribution or reproduction is permitted which does not comply with these terms.
*Correspondence: Daniel P. Beverly, ZGJldmVybHlAdXd5by5lZHU=; ZHAuYmV2ZXJseUBnbWFpbC5jb20=