- Department of Plant Biology, University of Georgia, Athens, GA, United States
Growing appreciation for the importance of forest structural features to forest functioning has led to increased focus on tree spatial patterns. While the influence of disturbances on composition and diversity has been well-studied, understanding of how disturbances influence spatial pattern is still far from complete. In particular, very few studies have examined the change in spatial pattern as a result of wind disturbance. Here results are presented for change in spatial pattern after severe wind disturbance in four eastern North American forests. It is hypothesized that, as in other types of disturbances, severe wind will cause an increase in aggregation among survivors, and aggregated distribution of mortality. These trends were indeed observed; at very small distances (e.g., 5–10 m), all four sites showed significantly greater aggregation after wind disturbance. Mortality was also significantly aggregated at three of the four sites, but at different distances. Unexpectedly, at slightly larger distances (e.g., 30–50 m), all four sites showed significant decreases in aggregation; it is suggested that this second trend may generalize across disturbance types. A hypothesis proposed by Davis et al. (2005) is that intermediate disturbance severity produces the greatest aggregation; this hypothesis is tested in the four sites reported here, and the hypothesis is rejected. Two refinements to this hypothesis are proposed for further testing in future research.
Introduction
Ecologists, conservationists, and forest managers have increasingly recognized in recent years that forest structural characteristics may be as important as species composition and diversity for forest health, recovery from disturbance, and sustainable management (Franklin et al., 2000; Franklin and Van Pelt, 2004; McElhinny et al., 2005; Mitchell, 2013; Fraver et al., 2017). Undeniably, spatial pattern of trees is among the important structural characteristics, with the potential to influence a wide variety of forest processes (Pacala and Deutschmann, 1995; Turnbull et al., 2007; Hart and Marshall, 2009). Consequently, full understanding of forest function and dynamics will require knowledge of how major forest events and processes, such as disturbance, succession, and competition, influence spatial pattern (Bace et al., 2015; Carrer et al., 2018; Markham et al., 2019).
Larson et al. (2015) provide terminology that helps to clarify discussion of this topic, distinguishing between the spatial pattern of mortality (i.e., the distribution of the trees that die, which could be aggregated, random or uniform at a range of distances or spatial scales), and the spatial outcome (i.e., the change that is revealed when comparing living pre-event or pre-interval stems to post-event or post-interval survivors). Early considerations of both spatial pattern and spatial outcome concentrated on mortality driven by competition (Pielou, 1962; Laessle, 1965). Many subsequent authors have explored the ways that competition might drive changes in spatial patterns (Christensen, 1977; Kenkel, 1988; Kenkel et al., 1997; Hurst et al., 2012). Most fundamentally, competition is expected to cause a shift in plant spatial pattern over time toward greater regularity (overdispersion); this trend results from mortality of plants in high-density clusters. The trend can be difficult to examine because many long-term studies may document overall change in spatial pattern that results not only from mortality of an earlier cohort, but also the effect of later recruitment (Das et al., 2008). A corollary of this trend is that spatial pattern of competition-driven mortality should be aggregated, at least at small distances. Notably, while numerous investigations confirmed the expected change in spatial pattern, a number have not [e.g., Vandekerkhove et al., 2018 found that very large beech trees in an old-growth Belgian forest shifted from uniform to random over a 25 year period; similar trends were reported by Wolf (2005)]. Janik et al. (2014) showed that mortality in a mature beech-fir forest in the western Carpathian Mountains was spatially random across 30 years; and a review by Larson and Churchill (2008) found that in western U.S. conifer forests, spatially random mortality was in fact quite common.
Similar to the above spatial patterns of mortality, spatial outcomes are not universally consistent. Christensen (1977) found that immature climax oak-hickory forest on the North Carolina piedmont changed over a 23-year period from random to uniform. Ward et al. (1996) reported that an old-growth temperate hardwood stand in Indiana shifted from weakly aggregated to uniform over a 60-year period. In contrast, Wolf (2005) documented that a semi-natural deciduous forest in Denmark that already had a regular spatial distribution shifted toward greater randomness over a 50 years period.
Much less understood is the role of disturbances in determining plant spatial pattern. A first-principles perspective would suggest that because disturbances are rarely spatially uniform, the heterogeneity of disturbance impacts should cause the spatial pattern of survivors to be more aggregated than that of pre-disturbance plants. More nuanced expectations emerge if particular disturbances preferentially target certain size classes of trees. For example, Furniss et al. (2019) pointed out that some fire mortality models assume that smaller trees are more likely to be killed in a fire, and if large trees are more spatially regular, the result of fire mortality could be that trees within the stand become more regularly distributed after the fire. Alternatively, wind disturbance could cause increased aggregation via a very different mechanism. When large trees are more regularly distributed than small trees, the well-established trend (Peterson, 2007; Mitchell, 2013) of wind disturbance to preferentially remove large trees could leave survivors that are more spatially aggregated, but in this case as a result of removing regularly distributed elements of the stand. The majority of empirical evidence appears to strongly favor the trend toward greater aggregation in survivors due to aggregated mortality; this increase in aggregation is seen in two previous wind disturbance studies.
Hurricane Fran caused spatially aggregated mortality in North Carolina forests, although the scales at which the aggregation was found differed between a pine and a hardwood stand. Nevertheless, for both stands, the result was that surviving trees became more aggregated as a result of the hurricane (Xi et al., 2008). Wolf et al. (2004) found that a Danish mixed-species deciduous forest experienced strongly aggregated (at small scales of 5 m – 50 m) mortality as a result of the 1999 extratropical cyclone.
Based on the above, the first two hypotheses tested were that (1) wind-toppled trees would be spatially aggregated; and (2) wind disturbance would increase aggregation among survivors, relative to the pre-disturbance stand.
An intriguing proposition emerged from the comparison of once-burned vs. multiply-burned mixed deciduous woodland in Minnesota; Davis et al. (2005) proposed that, analogous to the landmark intermediate disturbance hypothesis of Connell (1978), intermediate frequencies or severities of disturbance should cause the maximal amount of aggregation among survivors and therefore maximal spatial heterogeneity. To the author’s knowledge, this hypothesis has not been subsequently tested. Therefore the third hypothesis tested here was (3) the expected shift toward greater aggregation as a result of wind disturbance would be greatest at intermediate severity.
Study Sites and Field Methods
For the four study sites, data and findings addressing other questions were reported in previous publications (Peterson, 2000, 2004, 2007) but spatial patterns have not been reported.
For all of the sites, field sampling consisted of a complete inventory of all trees > 10 cm dbh (diameter at breast height, or 1.4 m) within a single large sample plot; for each tree an identification number, species, type of damage, and dbh (cm) were recorded. Type of damage was categorized as: intact (undamaged), branches broken (<50% of crown missing), crown broken (>50% of crown missing), bent (trunk curved), leaning (trunk straight but >20° from vertical), trunk broken, or uprooted. For purposes of the analyses reported here, damage categories were collapsed into two categories of fallen (trunk broken or uprooted) or standing (all other categories). Trees obviously dead prior to disturbance were readily distinguished and excluded from sampling.
Tionesta Site
This site is a primary forest preserve (Tionesta Research Natural Area) within Allegheny National Forest of northwestern Pennsylvania (41.638°N, 78.940°W). The Kuchler forest type (Kuchler, 1985) is northern hardwoods, and dominant woody vegetation was Fagus grandifolia Ehrh. (American beech; greatly diminished since the 1990s because of beech bark disease) and Tsuga canadensis (L.) Carr (Eastern hemlock) with smaller components of Betula alleghaniensis Britton (Yellow birch), Betula lenta L. (Black or Sweet birch), Prunus serotina Ehrh. (Black cherry), and Acer rubrum L. (Red maple). Understory is predominantly Fagus grandifolia root suckers, and the herbaceous layer includes Oxalis acetosella L., Maianthemum canadense Desf., Arisaema triphyllum (L.) Schott., and Dryopteris spinulosa (Mueiler) Watt. Nomenclature follows Gleason and Cronquist (1991). Prior to disturbance, the forest averaged 35.19 m2 ha–1, with mean tree diameter at breast height (dbh) of 30.5 ± 20.0 cm. This site has been free of major disturbance (prior to 1994) for at least three centuries (Bjorkbom and Larson, 1977). Topography of the area consists of flat uplands and steep narrow valleys with elevations ranging from 518 to 594 m. The soils are Cookport sandy loams and are Fine-loamy, mixed, mesic, Aquic Fagiudults (Aguilar, 1981). Tionesta has a humid continental warm summers climate in the Köppen classification (Köppen, 1931), with an average annual precipitation of 1070 mm and an average annual temperature of 8°C (Bjorkbom and Larson, 1977).
The site was disturbed by a small F2-rated tornado on 10 July, 1994, which damaged a patch of roughly 2 ha. (tornadoes in the United States are rated according to severity of damage, on a six-level scale from F0 to F5 [prior to 2007] or EF0 to EF5 [2007 and later]; Storm Prediction Center Fujita Tornado Damage Scale). The entire damaged patch was mapped with surveying equipment in summer 1996 (Peterson, 2000).
Taylor Site
This site (41.266°N, 75.128°W) is located in secondary forests of northeastern Pennsylvania that are classified by Kuchler (1985) as northern hardwoods. The dominant woody vegetation was Acer rubrum (Red maple), Quercus alba (White oak), and Acer saccharum (Sugar maple), along with a mixture of other Quercus and Carya (hickory) species. Prior to the wind disturbance, the forest supported 20.92 m2 ha–1 of basal area, and mean tree dbh was 25.3 ± 10.6 cm. Soils are 22–36 cm deep moderately poorly drained silt loam over loam (Peterson, 2007); these are classified as Freetown mucky peat, and are Dysic, mesic, Typic Haplosaprists. There is almost no vertical topographic relief within the study area, which is bordered on all sides by swamp. The elevation is roughly 413 m. Taylor’s climate is humid continental hot summers in the Köppen (1931) system, having mean precipitation of 1090 mm and mean temperature of 8°C1.
The Taylor site was damaged by an F2-rated tornado on 30 May, 1998, which caused a 4-ha damage patch. This damaged patch was mapped with surveying equipment, in June–July 2000; tree distribution is shown in Figure 1.
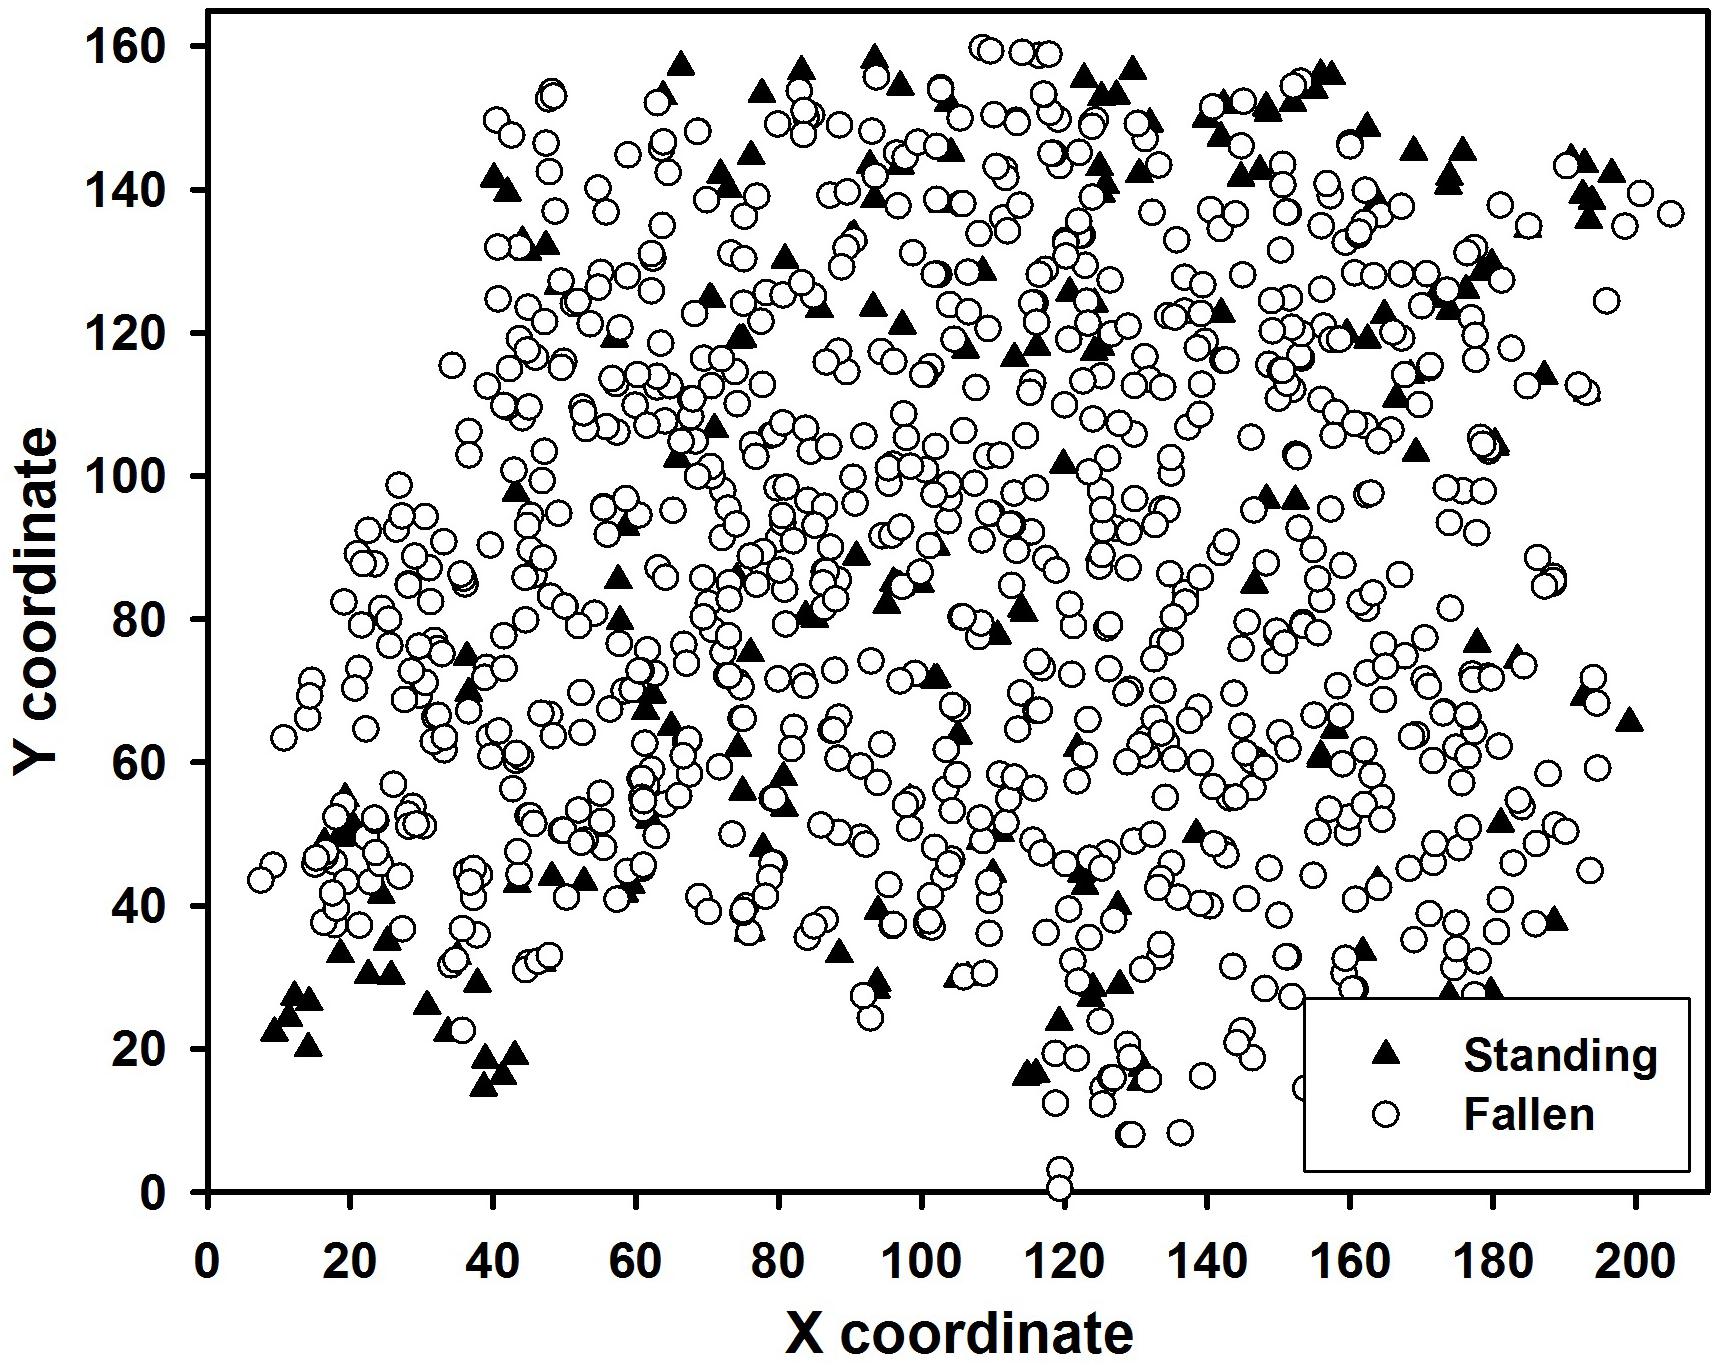
Figure 1. Spatial distribution of 1068 trees within the Taylor study site. Black triangles are standing survivors; white circles are fallen trees.
Fishhook and Shirttail Sites
These sites are only ∼ 5 km apart and are therefore described together. Fishhook and Shirttail are located near Seagull Lake within the Boundary Waters Canoe Area, a wilderness that consists of nearly 500,000 ha of primary sub-boreal forests in northeastern Minnesota, entirely within Superior National Forest. The forest type according to Kuchler (1985) is Great Lakes spruce-fir. Woody vegetation at Fishhook (48.138° N, 90.890° W) was predominantly Picea species, Pinus banksiana Lamb., and B. papyrifera, while that at Shirttail (48.118° N, 90.939° W) was a mixture of Abies balsamea (L.) Mill, Thuja occidentalis L., and Pinus resinosa Sol ex Aiton. Predisturbance, Fishhook had 24.66 m2 ha–1 and 19.1 ± 5.7 cm forest basal area and mean dbh, respectively. These parameters at Shirttail were 27.94 m2 ha–1 and 22.4 ± 12.9 cm. The Köppen (1931) climate classification is continental warm summer (Dfb): mean annual temperature is 3.1°C and mean annual precipitation is 684 mm2. Soils in the area are thin and composed of glacial till or glacial outwash over granite bedrock of the Canadian Shield; detailed soil classifications are not available, but in both sites, the soils are predominantly Udepts (a suborder of Inceptisols). Stand-replacing fires have been the predominant feature of the disturbance regime, and stand ages are the time elapsed since the most recent stand-replacing fire (Heinselman, 1996).
On 4 July 1999, a large and powerful windstorm crossed northern Minnesota and extreme southwestern Ontario, damaging ∼162 000 terrestrial hectares in Minnesota alone (Mattson and Shriner, 2001; Rich et al., 2007). During the summers of 2000, 2001, and 2002, tree damage was surveyed in a large mapped plot at each of the study sites. The sample area was square at Fishhook, while the sample area at Shirttail was defined by natural rock outcrops that formed boundaries to a roughly rectangular area.
Analyses
A variety of methods for spatial analysis are available, but for analysis of point patterns of trees, Ripley’s K(t) second-order statistic is widely used (Dale, 1999). This method totals all neighbors with a set of increasingly large circles centered on a focal plant, and then sums these totals across all focal plants; the result is compared for each size circle (i.e., each sample distance) to a Poisson expectation to test for departure from spatial randomness. However, for some purposes, the cumulative nature of the original K(t) statistic is a shortcoming. Simply put, because the number of neighbors tallied for a given size of circle consists of all neighbors at any distance out to the radius of the sampled circle, the statistic can become biased for larger circles, depending on the number of near neighbors. A modified statistic, variously called the pair-correlation function, neighbor density function (the term used here, Perry, 2004), or simply O-ring statistic (Wiegand and Moloney, 2004), alleviates this shortcoming by considering only non-overlapping annuli at increasing distances from a focal tree. The result is a non-cumulative statistic that more accurately characterizes the spatial pattern at a given scale (distance); the NDF statistic will be unity for a perfectly random spatial distribution, whereas values above unity indicate clustering while values below unity indicate overdispersion (regularity). This paper will report results based exclusively on the neighbor density function.
The SpPack spreadsheet add-in (Perry, 2004) was used here for NDF calculations. The spatial pattern was estimated in 5 m increments to a maximum scale of one-half of the shortest dimension of the study area. Significance of departure from spatial randomness was evaluated by generating 99% confidence intervals from 500 Monte Carlo randomizations of the input data set; when the calculated NDF statistic at a particular distance falls above the 99% confidence interval, the pattern is significantly aggregated, whereas when the NDF for a particular distance falls below the 99% confidence interval, the pattern is significantly overdispersed (regular or uniform).
While most of the spatial patterns examined here utilize the above method to test for significant departure from spatial randomness, an alternative approach is needed to test for difference in spatial patterns of two sets of points, where one is a subset of the other, such as pre- vs. post-event comparisons (in such cases the survivors are a subset of the predisturbance trees). Such a situation applies to two cases reported here: (1) Testing for significant aggregation or segregation of mortality, given the pre-disturbance initial spatial pattern; and (2) Testing for significant aggregation or segregation of survivors, given the pre-disturbance initial spatial pattern. For these cases, twenty Monte Carlo random data sets were generated and plotted along with the pre and post disturbance plot of the real data. For case #1 above, a number of randomly chosen individuals corresponding to the observed number of survivors were chosen from the pre-disturbance population and the NDF calculated on the basis of this ‘randomly disturbed’ population; this process was repeated twenty times and the twenty NDFs plotted. The outermost values among the twenty NDFs at any given distance define a 95% confidence band. If the observed post-disturbance NDF at a given distance lies outside the confidence band, the spatial pattern at that distance is declared significantly different between pre- and post-disturbance populations. For case #2 above, an analogous process was followed, except that the 20 random data sets were constructed based on the observed number of fallen trees (‘mortality’). In both of these cases, the result is a test for significant non-randomness among the mortality or the survivors, constrained by the pre-disturbance tree distribution.
Hypothesis 1 will be tested in both qualitative and quantitative manners. The informal qualitative test will consist of simply examining the NDF of fallen trees at each site; clustering indicated by NDF values greater than unity will support Hypothesis 1. The quantitative test will consist of calculating the NDF of observed fallen trees and comparing it to the NDFs of the 20 random-fallen datasets. Hypothesis 1 is quantitatively supported if the observed fallen NDF falls above the 20 random-fallen NDFs.
Hypothesis 2 will also be tested qualitatively and quantitatively. The informal, qualitative test will consist of examining the NDFs separately of each of the four sites (all species and sizes pooled) before (predisturbance datasets) and after (postdisturbance or survivor datasets); results consistent with Hypothesis 2 would show greater clustering in the postdisturbance than in the predisturbance populations. However, the preceeding does not control for or factor out the predisturbance spatial pattern. The quantitative test of Hypothesis 2 will consist of calculating the postdisturbance survivor NDF in each site, and comparing it to the 20 random-survivor NDFs described in the previous paragraph; if the NDF of the observed survivors falls above the 20 random-survivor NDFs, Hypothesis 2 is supported.
Like the original Ripley’s K(t) statistic, a bivariate version of the NDF can be calculated, that tests for attraction or repulsion between two sets of points (e.g., two species, or live and dead stems; Kenkel, 1988; Rebertus et al., 1989). A random-labeling randomization approach is used to generate confidence intervals that allow testing for departure from randomness in the distribution of the two sets of points relative to one another.
The hypothesis of a peak in aggregation at intermediate severities of disturbance was tested by plotting the overall site maximum aggregation against severity (defined as percent of trees fallen). Two additional measures were also plotted against severity as alternative ways to test the hypothesis: (a) the mean of the three highest NDF values within a given site; and (b) the percent increase in NDF values for the 5 and 10 m distances (these were inevitably the distances with the greatest aggregation among the distances tested).
Results
Prior to disturbance, the spatial patterns of most of the major species were highly aggregated at the smallest distances (e.g., 5–30 m, Figure 2), with the aggregation typically decreasing at greater distances; this trend is consistent across the four sites. The sole exception to this generalization was Picea mariana at Fishhook, which showed little departure from randomness at scales up to 40 m.
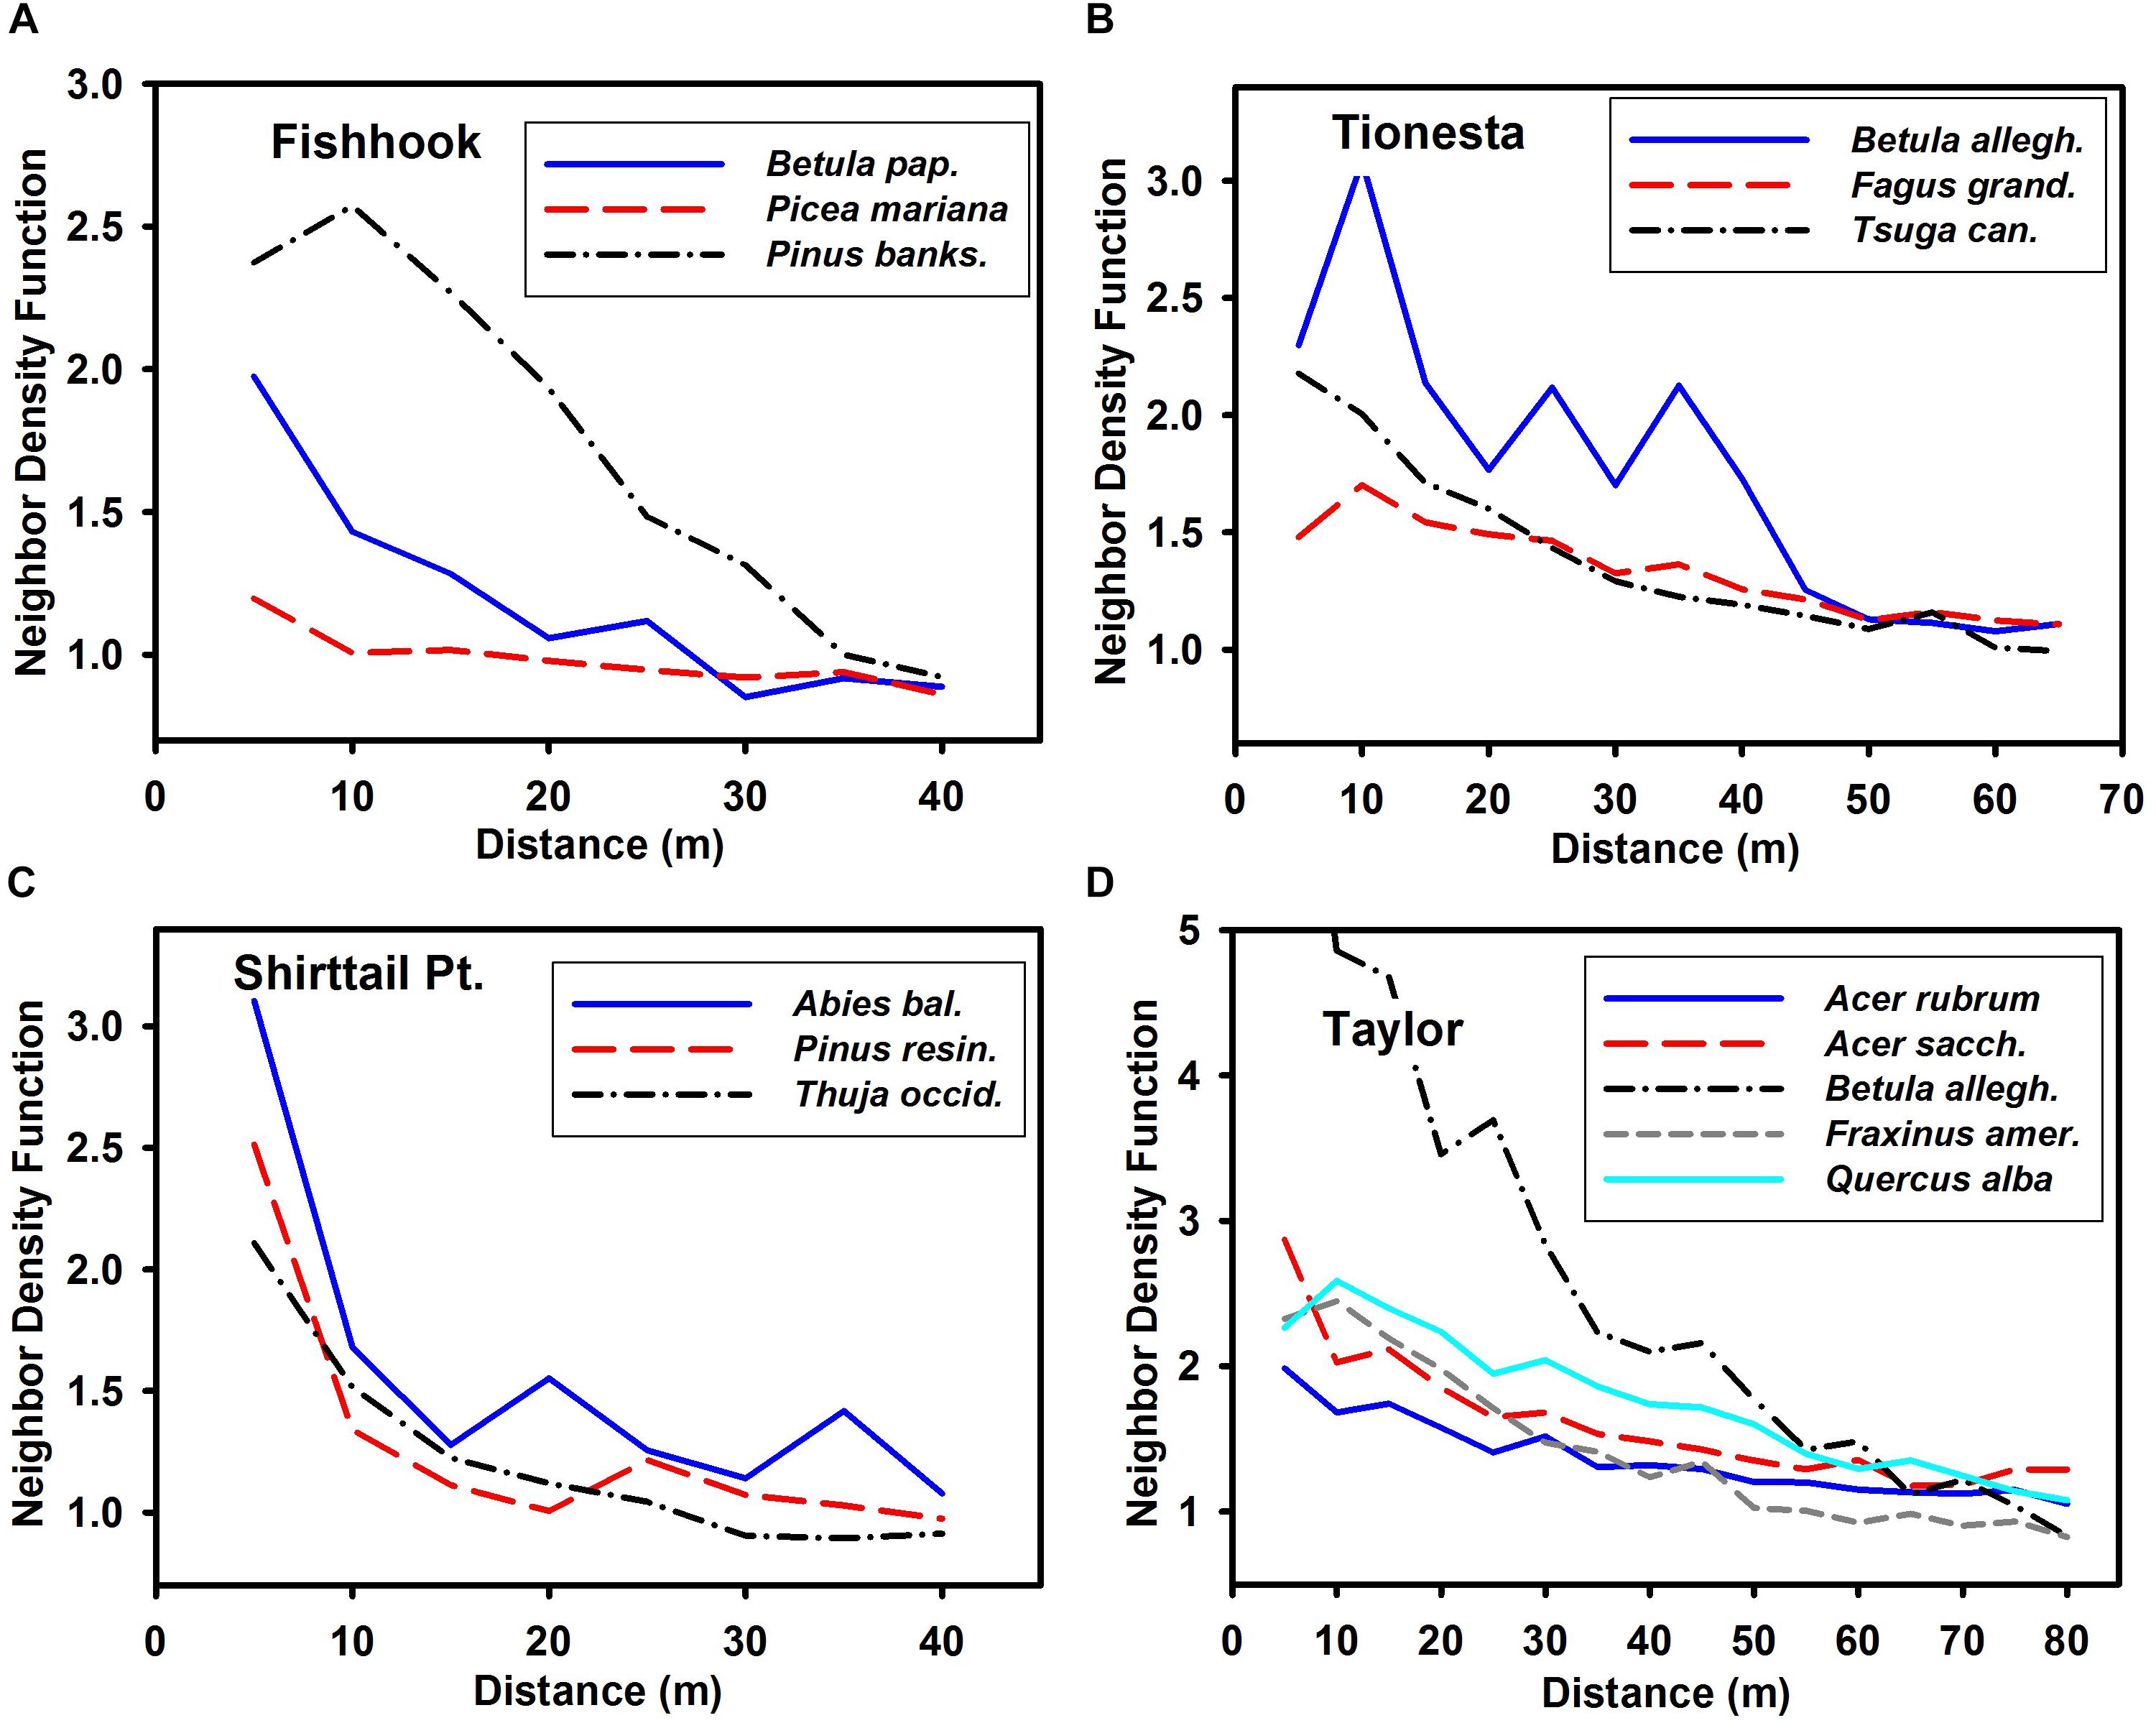
Figure 2. Neighbor density function of major (n > 40) species in pre-disturbance stands at the four sites. (A) Fishhook; (B) Tionesta; (C) Shirttail; and (D) Taylor. Note that x and y axes differ among the panels in this figure. Confidence intervals omitted for clarity; a value of unity on the y axis corresponds to complete spatial randomness. Values greater than unity are more aggregated than random; values less than unity are more uniform than random. Species abbreviations as follows: Betula pap., Betula papyrifera; Pinus banks., Pinus banksiana; Betula allegh., Betula alleghaniensis; Fagus grand., Fagus grandifolia; Tsuga can., Tsuga canadensis; Abies bal., Abies balsamea; Pinus res., Pinus resinosa; Thuja occid., Thuja occidentalis; Acer sacch., Acer saccharum; and Fraxinus amer., Fraxinus americana.
Prior to disturbance, small and large trees (defined as those less than or greater than the site median dbh, respectively) differed little in spatial pattern, except for a tendency for small trees to be somewhat more aggregated at the smallest (i.e., 5 m) scale (solid lines in Figure 3). Both small and large trees showed some trend toward aggregation in the 10 m – 20 m distance range, and the aggregation usually diminished at greater distances.
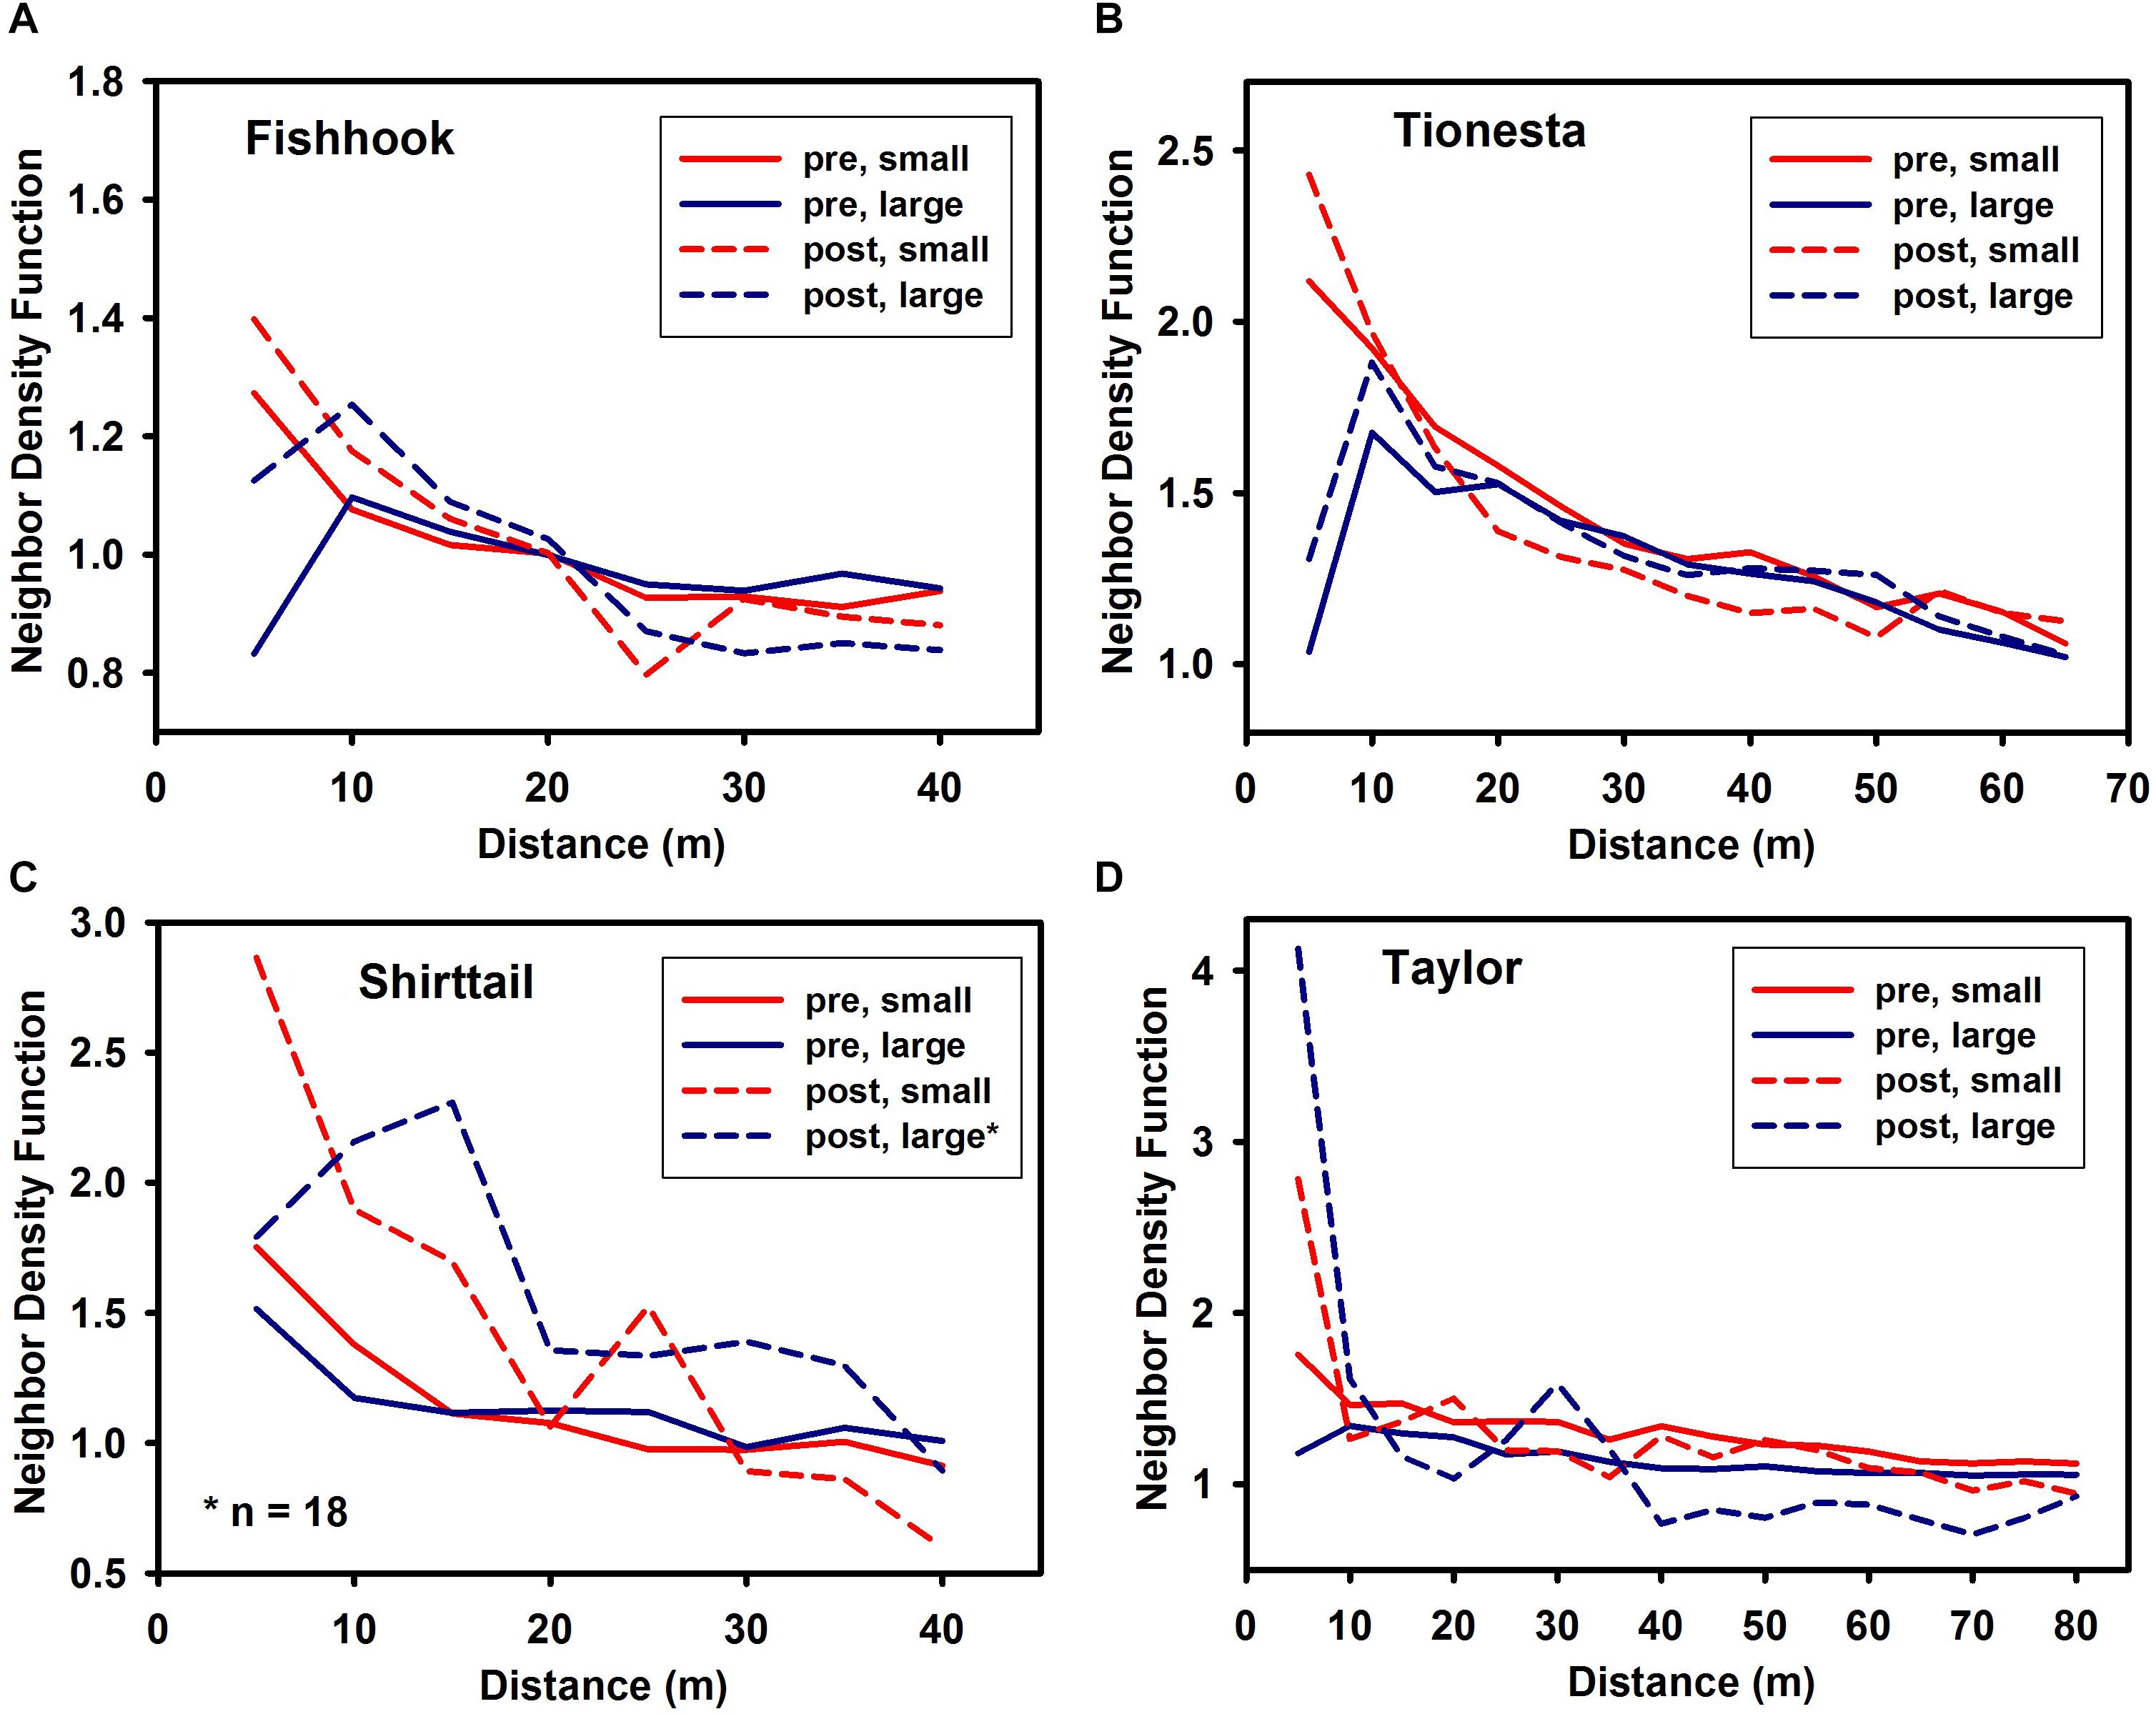
Figure 3. Neighbor density function of trees smaller than (‘small’) and larger than (‘large’) the site (pre-disturbance) median dbh in pre-disturbance and post-disturbance stands at the four sites. Pre-disturbance NDF shown with solid lines; post-disturbance NDF shown with dashed lines. (A) Fishhook; (B) Tionesta; (C) Shirttail; and (D) Taylor. Note that x and y axes differ among the panels in this figure. Confidence intervals omitted for clarity; a value of unity on the y axis corresponds to complete spatial randomness. Values greater than unity are more aggregated than random; values less than unity are more uniform than random.
In the qualitative test of Hypothesis 1, for all four sites, the mortality NDF (heavy dashed lines of Figure 4) was greater than unity across most of the distances tested (Figure 4). In the quantitative test of Hypothesis 1 (also shown in Figure 4), the observed mortality NDF fell above the 20 random-mortality NDFs (dotted lines) for at least some distances in three of the four sites; in contrast at Shirttail, mortality did not significantly deviate from random at any distance, when controlling for the predisturbance spatial pattern. While mortality at Tionesta and Taylor was significantly aggregated, given the pre-disturbance distribution, at most distances 5–35 or 5–50 m, at Fishhook the mortality was significantly aggregated only at 25–35 m. In no cases was mortality significantly regular.
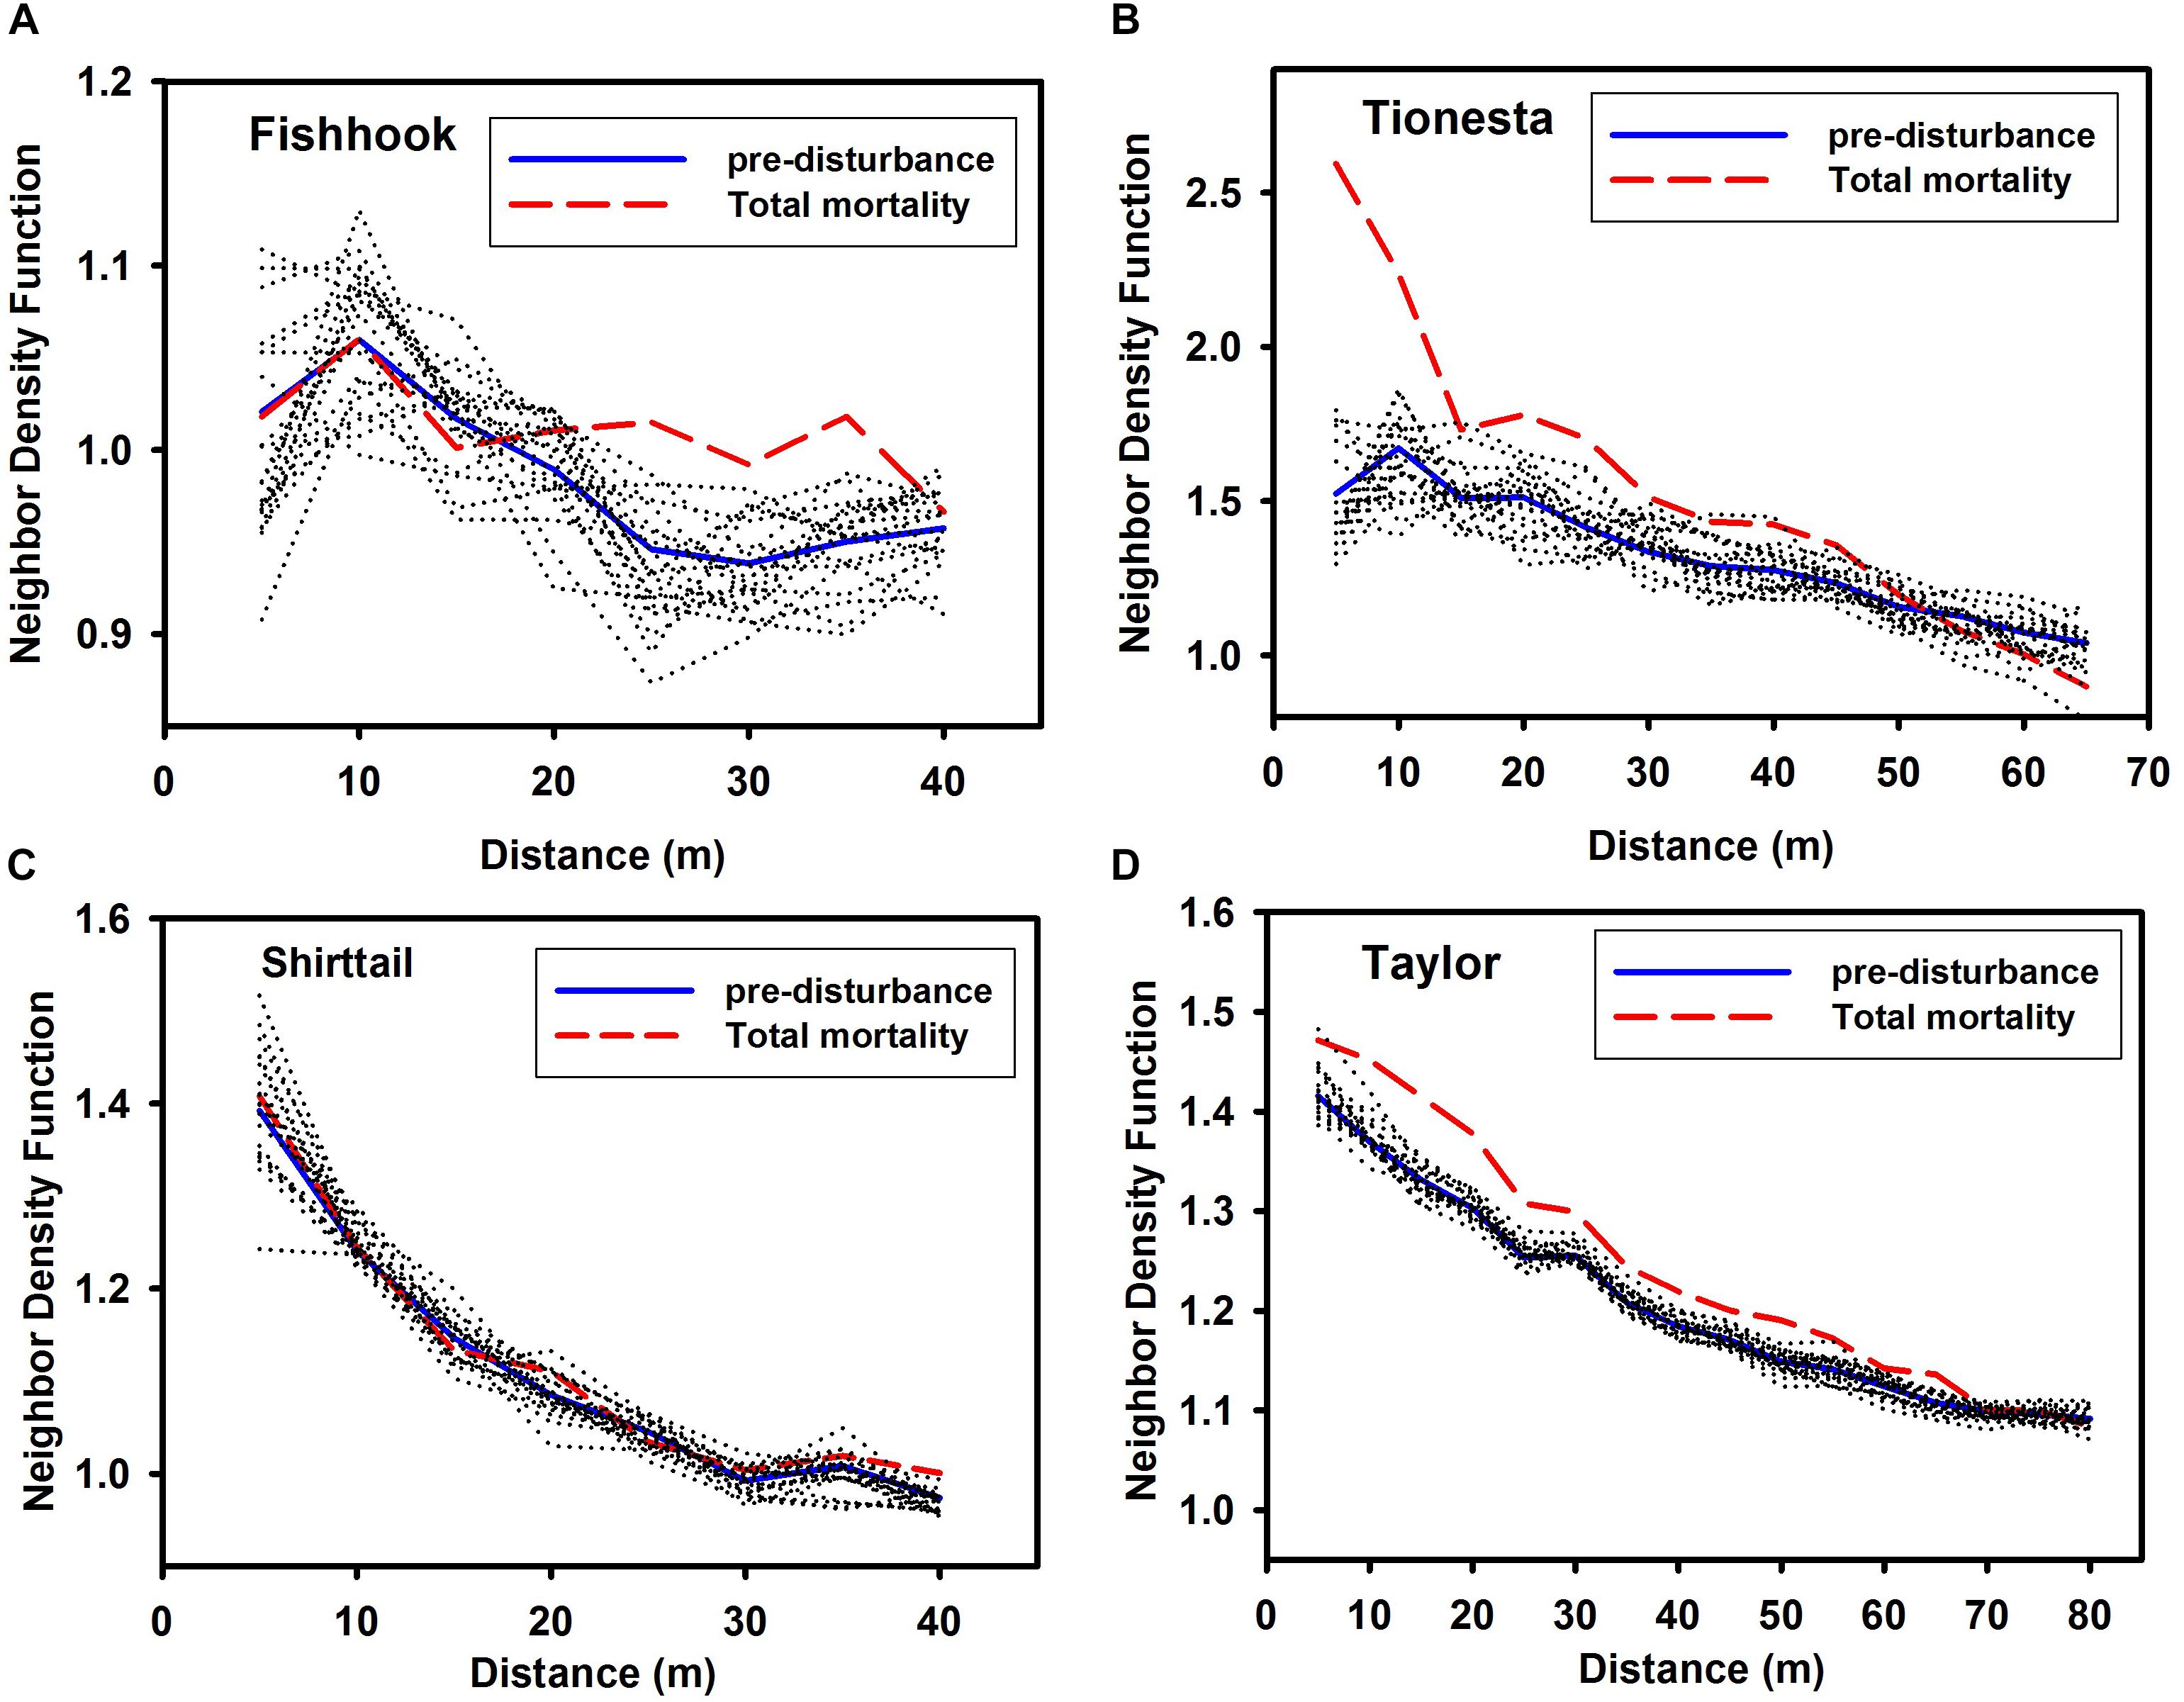
Figure 4. Neighbor density function of all pre-disturbance trees in stands at the four sites, and all fallen trees (‘total mortality’). (A) Fishhook; (B) Tionesta; (C) Shirttail; and (D) Taylor. Note that x and y axes differ among the panels in this figure. Pre-disturbance NDF shown with solid lines; total mortality NDF shown with dashed lines. Dotted lines shown NDF for 20 separate random selections from among the pre-disturbance trees, with n = the number of fallen trees at that site. Values greater than unity are more aggregated than random; values less than unity are more uniform than random. Values at any given distance that are outside the extremes of the 20 randomizations indicate that the spatial pattern of mortality is significantly non-random, given the pre-disturbance distribution of trees.
Small and large trees exhibited similar spatial patterns of mortality at scales of 10 m or greater at Fishhook and Shirttail, while at Tionesta and Taylor, mortality among small trees showed greater aggregation than mortality among large trees (data not shown). As with the pre-disturbance spatial distribution of small and large trees, the mortality of small and large stems was noticeably divergent for the 5 m distance in three of the sites (as before, Shirttail was the exception to this trend).
Fallen and surviving trees (Figure 5) were neither aggregated nor segregated relative to one another at any distance at Shirttail. At Fishhook, fallen and surviving trees were segregated at 5 m, randomly distributed relative to one another at 10–25 m, and aggregated at 30 m and greater distances. The most pronounced bivariate non-randomness was at Tionesta, where the two categories of trees were significantly and strongly aggregated between 10 and 45 m. At Taylor, the two groups exhibited weak segregation at 15–30 m and weak aggregation at 70 and 80 m; the bivariate pattern was random at other distances.
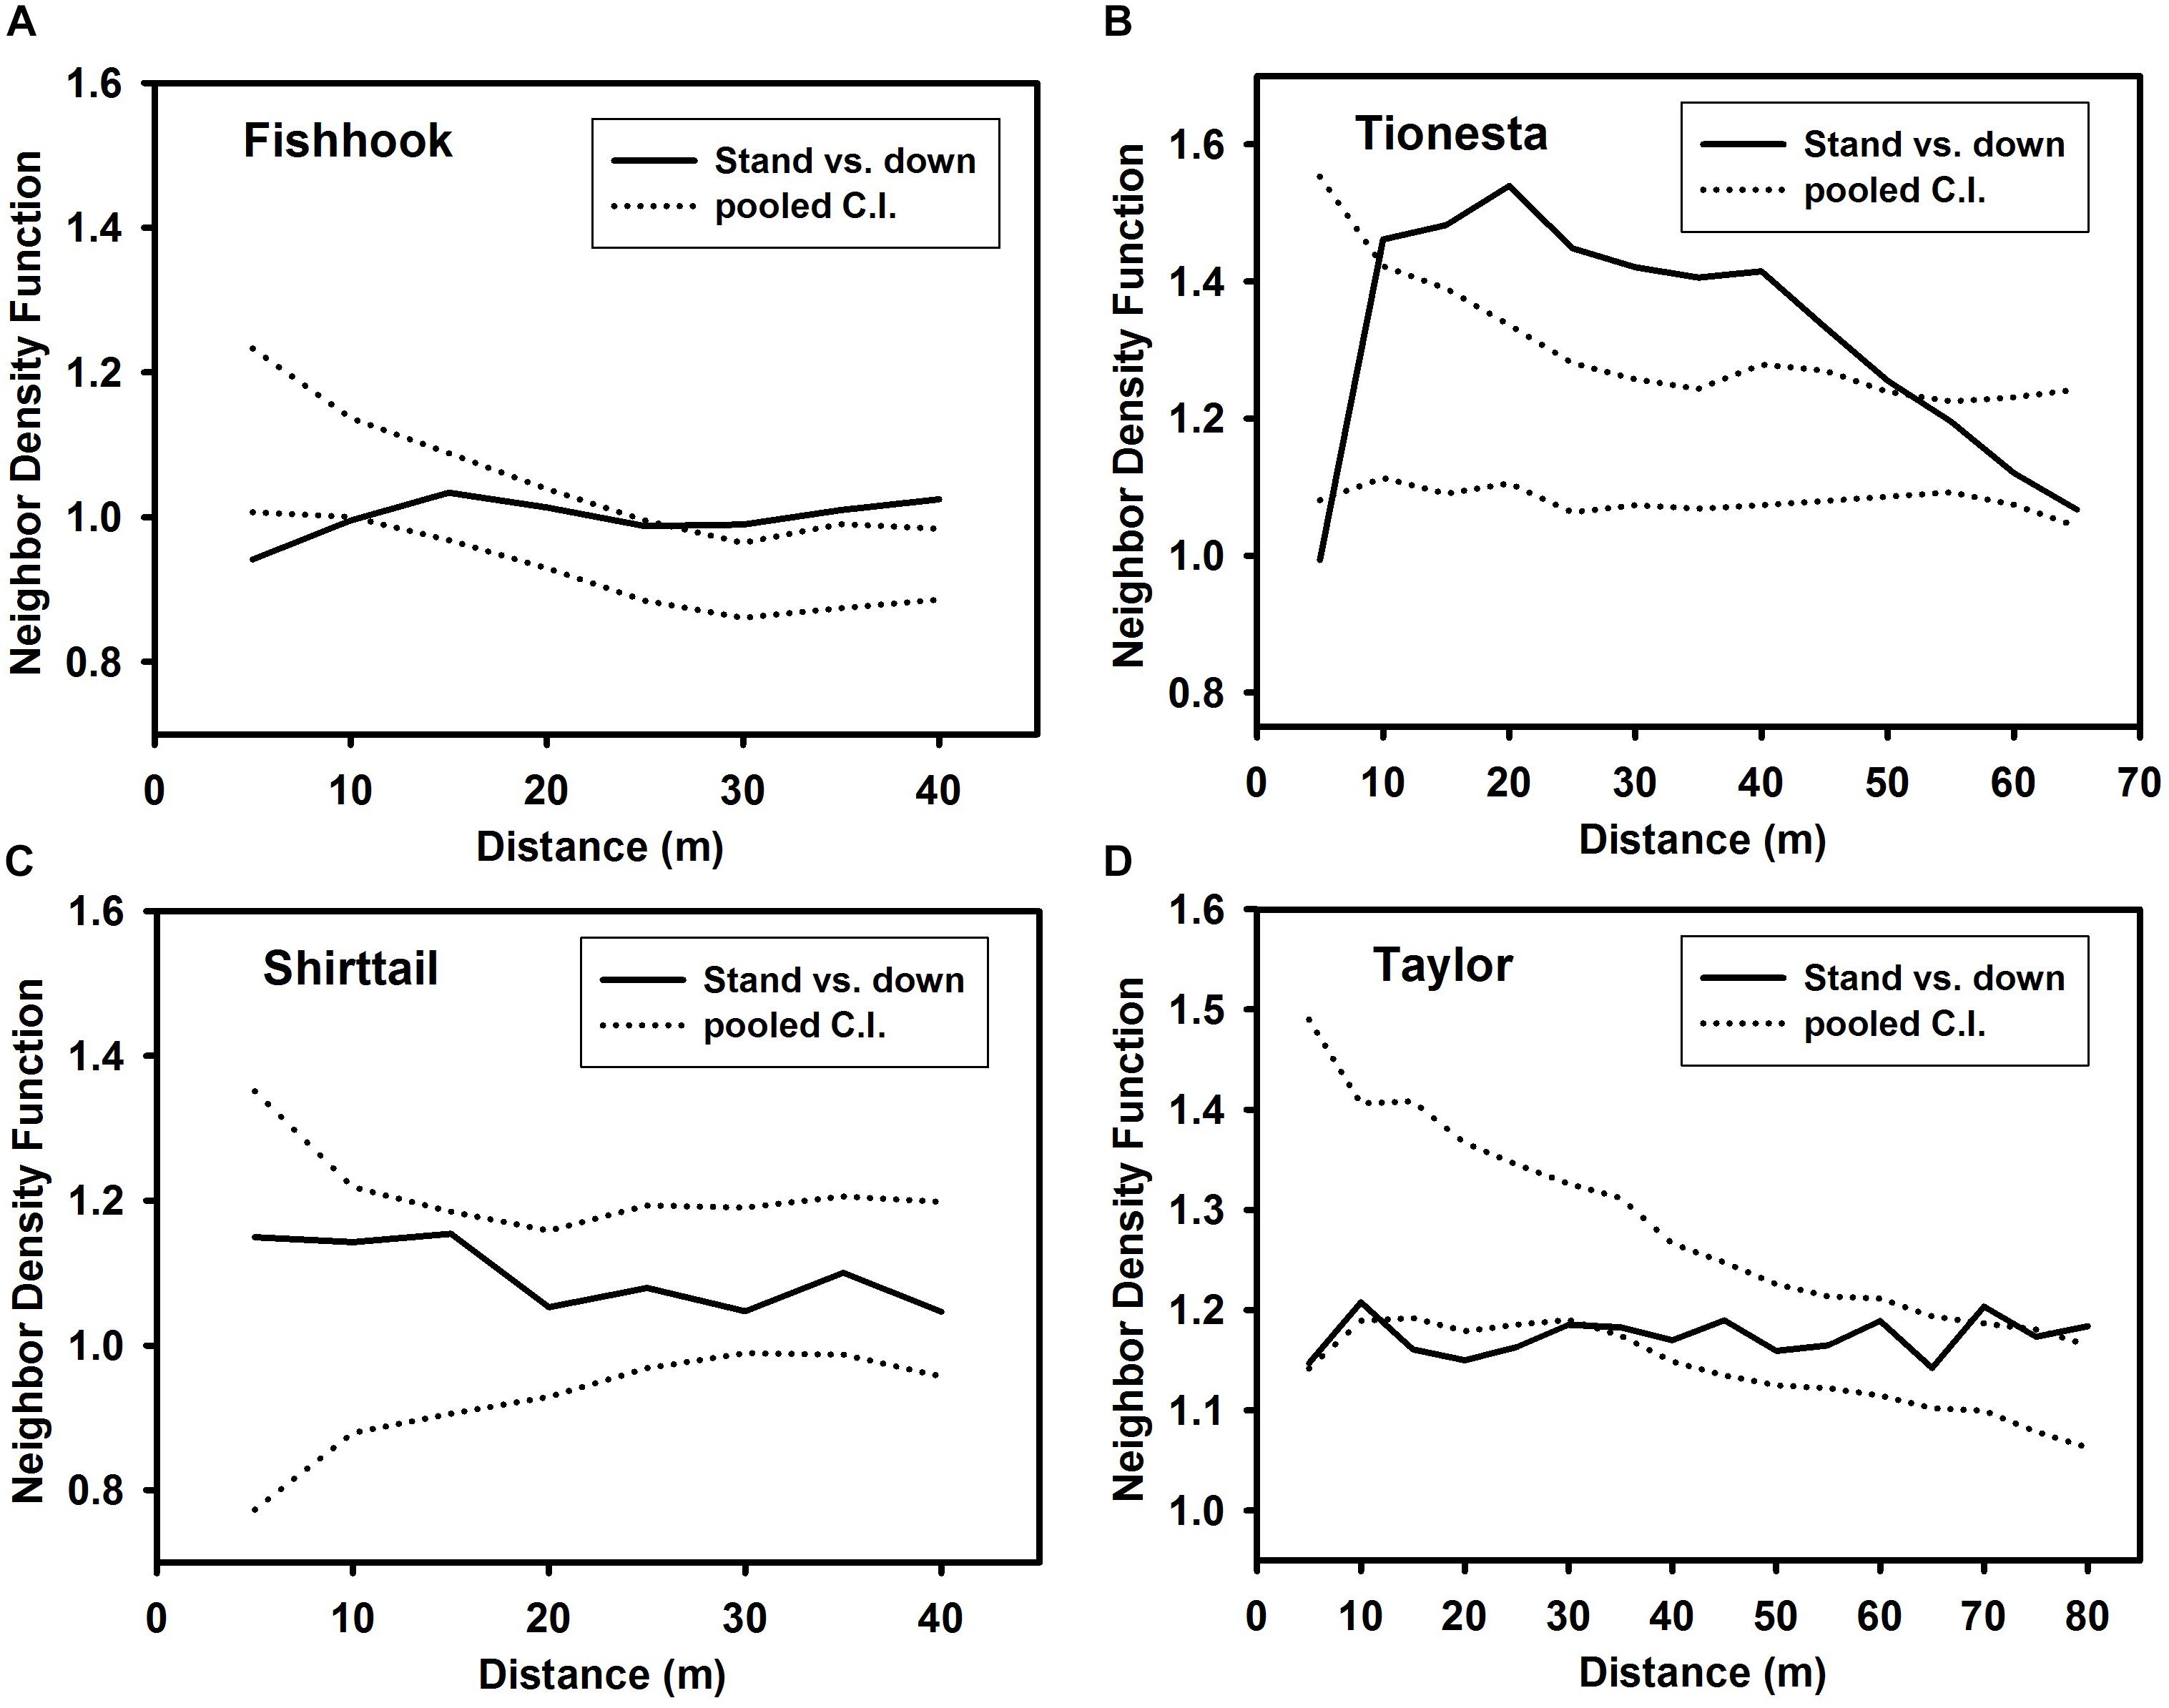
Figure 5. Bivariate Neighbor density function representing spatial relationship between standing survivors (‘standing’) and fallen trees (‘down’) at the four sites. (A) Fishhook; (B) Tionesta; (C) Shirttail; and (D) Taylor. Note that x and y axes differ among the panels in this figure. Dotted lines represent 99% confidence intervals; a value of unity on the y axis corresponds to complete spatial randomness. Values greater than the upper confidence interval indicate significant spatial attraction between standing and fallen trees at that distance; values less than the lower confidence interval indicate significant spatial segregation between standing and fallen trees at that distance.
In all four sites, spatial distribution of surviving trees was more aggregated at small scales (e.g., 5 and 10 m) than it had been prior to disturbance (heavy lines in Figure 6); this constitutes the qualitative test of Hypothesis 2. Conversely, in all four sites, the distributions became less aggregated (becoming random or even significantly regularly distributed) over intermediate distances (30 m – 40 m at Fishhook, 30 m – 45 m at Tionesta, 40 m at Shirttail, and 45–80 m at Taylor). The quantitative test of Hypothesis 2 is also shown in Figure 6; the observed survivor NDF falling above the 20 random-survivor NDFs (dotted lines in Figure 6) indicates that even controlling for the predisturbance spatial pattern, the survivors were more clustered at small scales in all four sites.
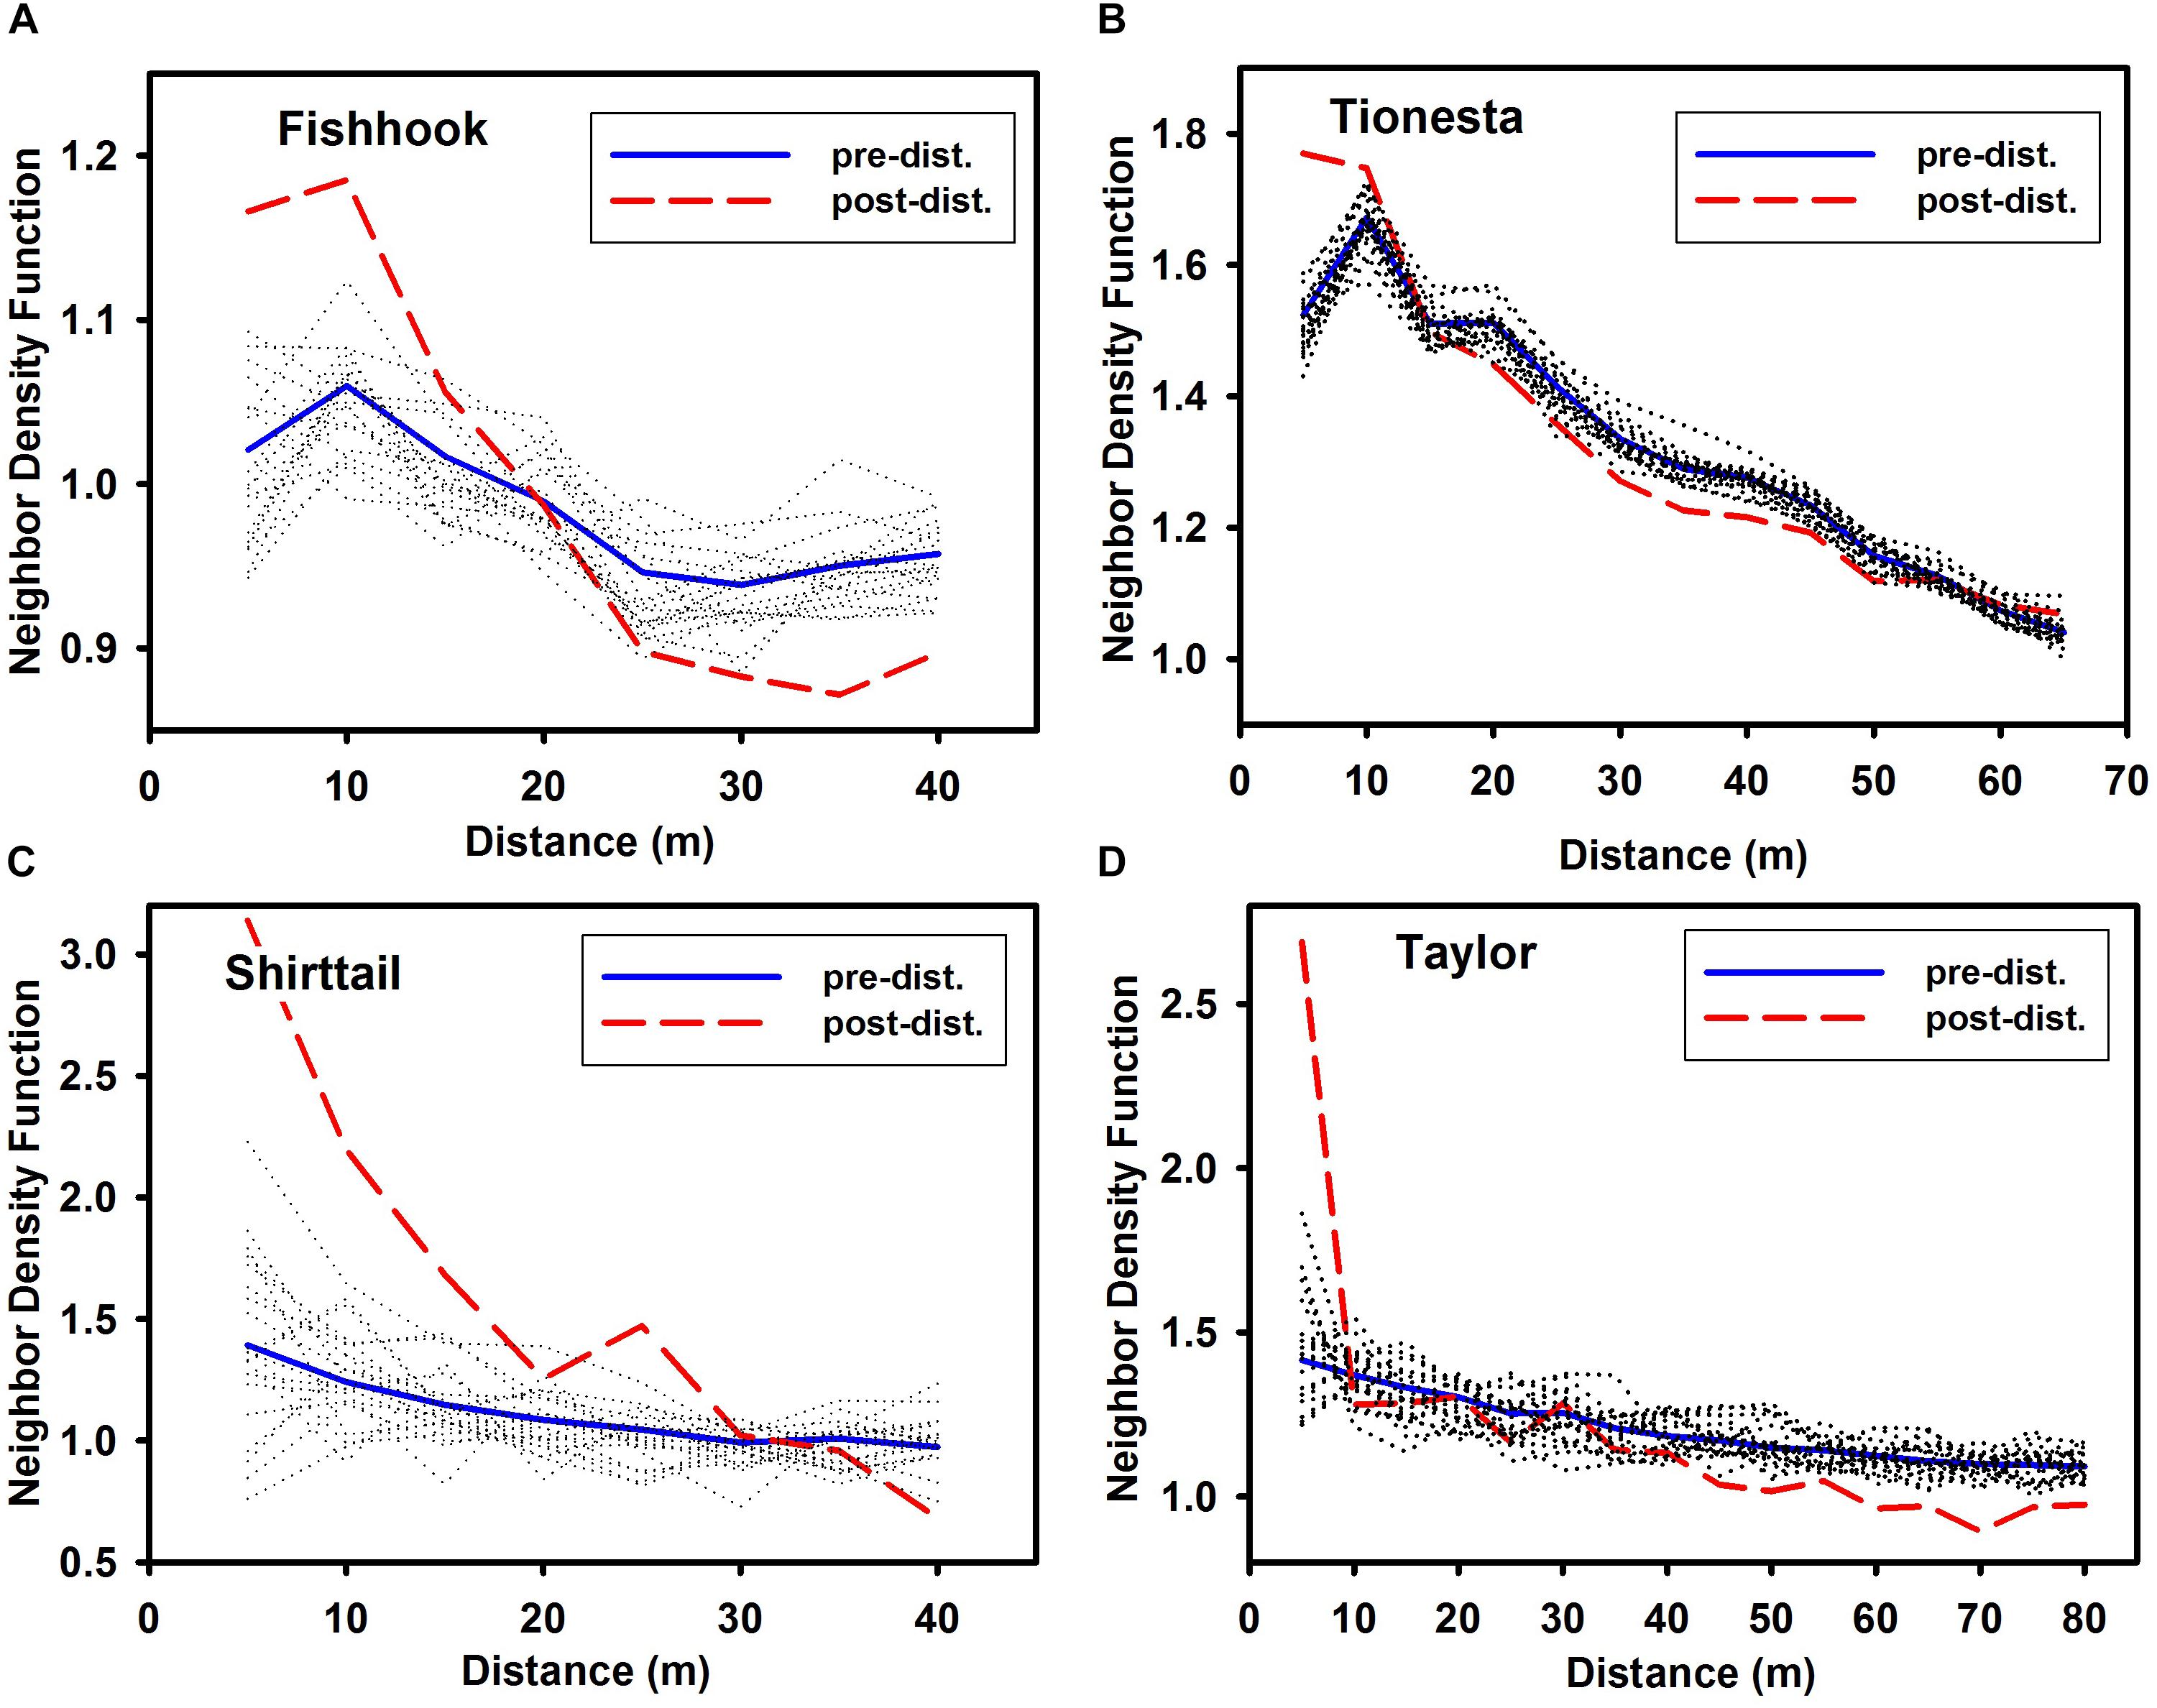
Figure 6. Neighbor density function of pre-disturbance standing trees and post-disturbance standing trees at the four sites. (A) Fishhook; (B) Tionesta; (C) Shirttail; and (D) Taylor. Note that x and y axes differ among the panels in this figure. As in Figure 4, dotted lines show the NDF for 20 separate random selections from among the pre-disturbance trees, with n = the number of surviving (standing post-disturbance) trees at that site. Values at any given distance that are outside the extremes of the 20 randomizations indicate that the spatial pattern of survivor trees is significantly non-random, given the pre-disturbance distribution of trees. Values greater than highest randomized NDF at that distance are more aggregated than random; values less than the lowest randomized NDF at that distance are more uniform than random.
Surviving trees smaller than the median were more aggregated than survivors larger than the median at the 5 m scale in three of the four sites (Fishhook, Tionesta, and Shirttail), while at Taylor large trees were more aggregated at 5 m. Across most of the remaining tested distances, spatial distribution did not differ between small and large survivors in any consistent fashion (Figure 3).
Overall aggregation across the four sites did not show the hypothesized (Davis et al., 2005) maximum at intermediate severities, either for the maximum NDF observed within a site, or for the average of the three highest NDF values observed within a site (Figure 7). By both of these measures, the peak was found at the highest severities. A potentially more refined way to test the hypothesis might be to determine if the change in aggregation (rather than the absolute post-disturbance magnitude) shows a peak at intermediate severities. This was also plotted in Figure 7 (right vertical axis), but this measure also was greatest at the highest severities.
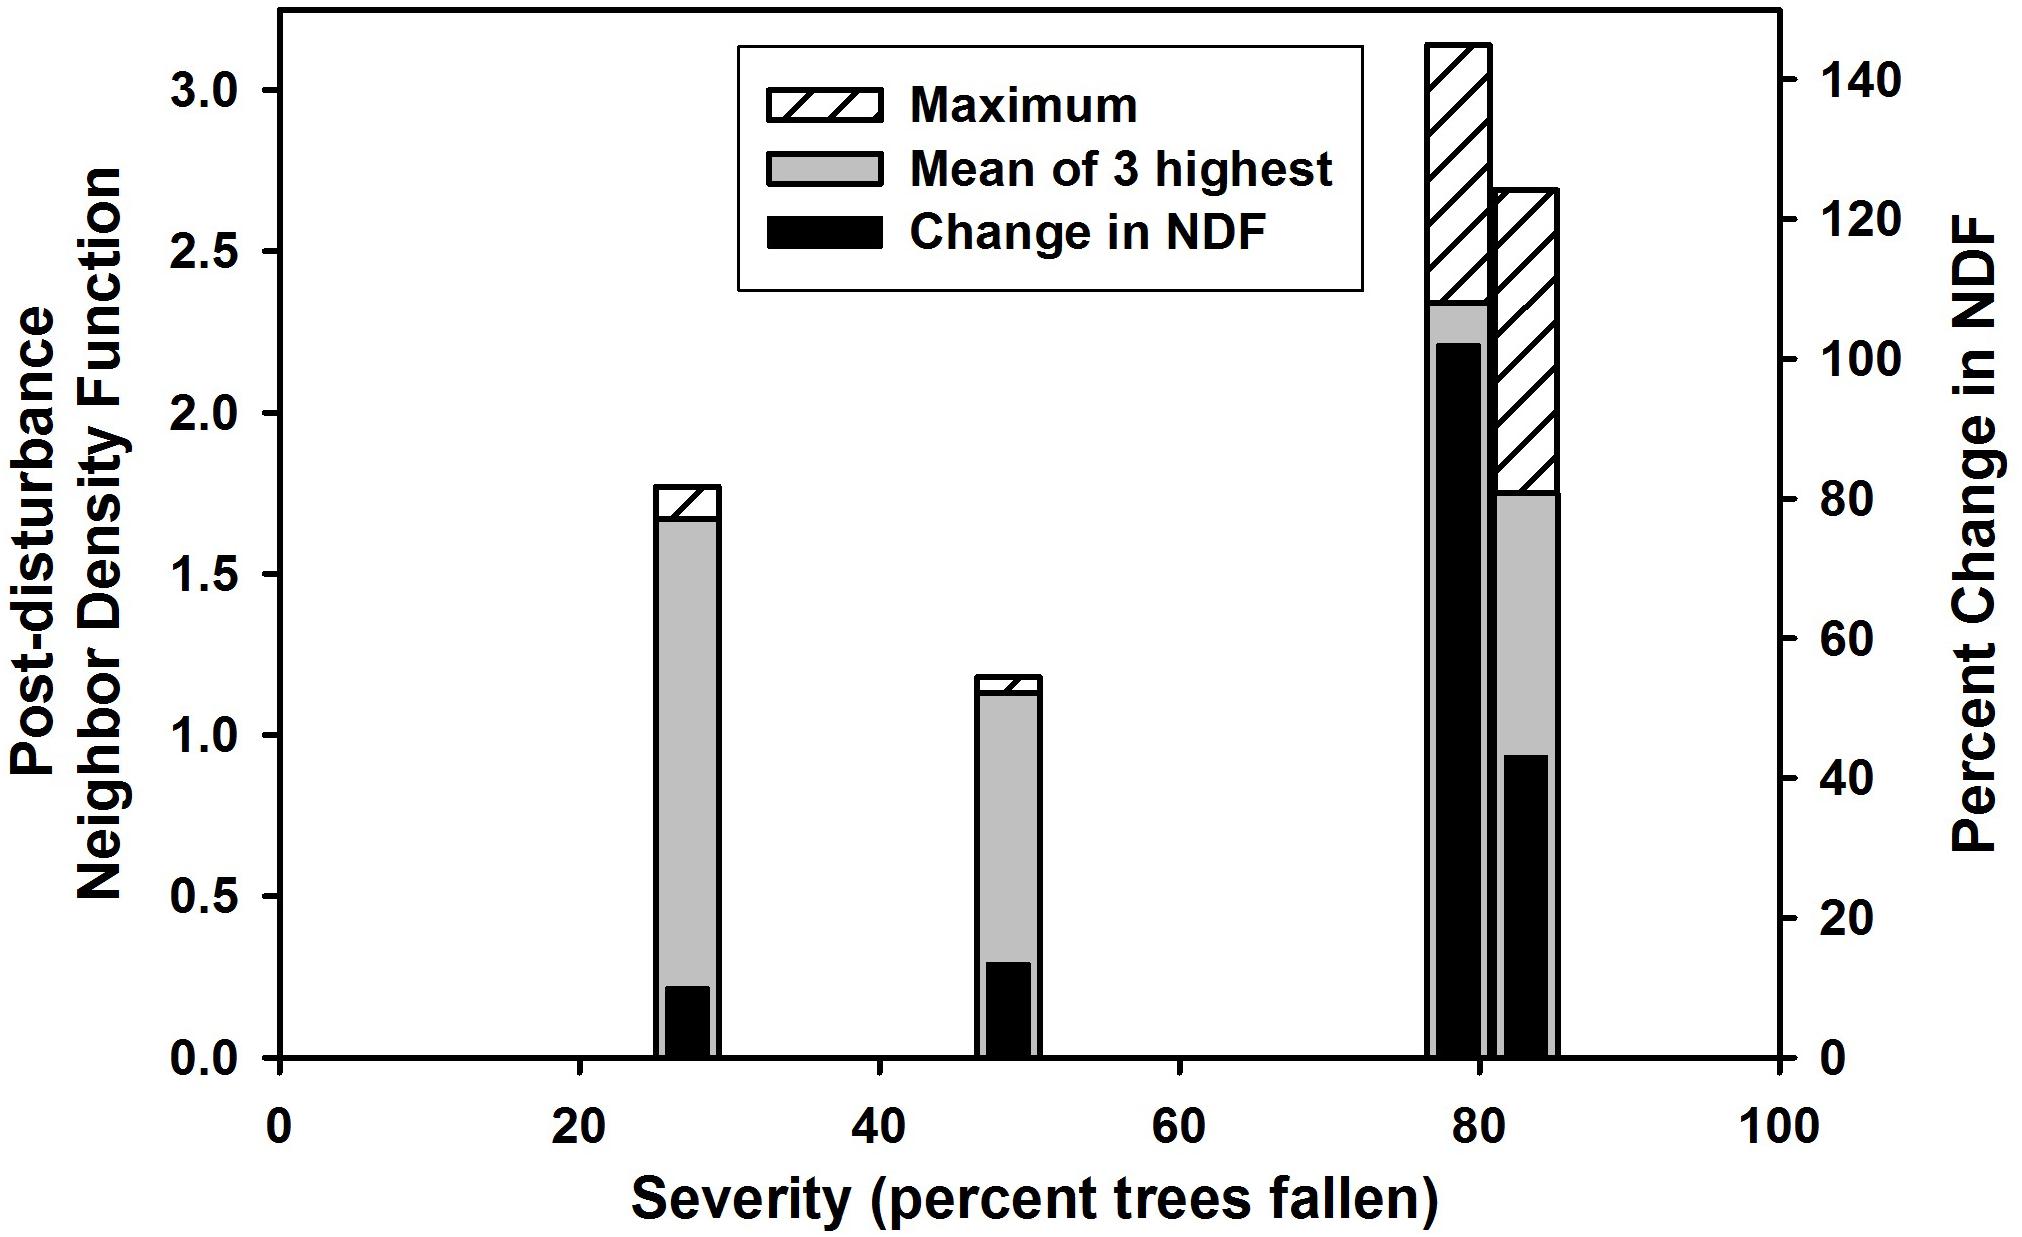
Figure 7. Severity of wind damage (proportion of trees fallen) vs. three measures of the greatest spatial aggregation of post-disturbance trees at the four sites. From left to right, the vertical bars represent Tionesta, Fishhook, Shirttail, and Taylor; severities were 27.2, 48.6, 80.6, and 81.1%, respectively. Shirttail and Taylor offset slightly to left and right, respectively, to avoid overlap of the bars on the x axis. ‘Maximum’ represents the highest NDF value among post-disturbance survivors at any scale at the given site; ‘mean of 3 highest’ represents the mean of the three highest NDF values among post-disturbance survivors at the given site; ‘change in NDF’ represents the proportional increase in NDF between pre-disturbance trees and post-disturbance standing trees at the given site.
Discussion
This study has added to the limited number of investigations of how wind disturbance affects fine scale spatial patterns of trees. In so doing, it has confirmed some trends found in two previous studies (Wolf et al., 2004; Xi et al., 2008), but provided less consistent support for other trends. Here, only two of four sites supported the hypothesis that spatial distribution of mortality is aggregated across a range of small distances (Hypothesis 1 here). Both this study and that of Wolf et al. (2004) found that some sites did not support the trend, i.e., after allowing for the pre-disturbance tree distribution, in some cases, mortality was spatially random; across the four sites, spatially random mortality was about equally as common as aggregated mortality. Precise details of the scales of aggregation vary among this study and the two previous reports, although the broad trends are consistent. Wolf et al. (2004) noted that their aggregated mortality occurred as a result of the December 1999 extra-tropical cyclone; in contrast, wind-induced mortality from lesser storms was randomly distributed. In this study, the lowest-severity site (Tionesta) exhibited aggregated mortality from 5 to 30 m, whereas the two high-severity sites showed inconsistent patterns, with random mortality at all distances (Shirttail) or aggregated mortality at most distances (Taylor). Thus a simple low vs. high severity distinction in aggregated or random mortality is not found in these sites.
The bivariate test for spatial association or segregation between standing and fallen trees in this study showed few consistent trends; most sites at most distances, were not significantly non-random, and the few significantly non-random tests were weak. The exception, at Tionesta, was the strong and significant bivariate association between standing and fallen trees at intermediate distances. The existing literature appears to be similarly inconsistent. Wolf (2005) reports significant aggregation between living and dead jack pine trees in 5 out of 8 tests; Kenkel (1988) found living and dead trees distributed randomly relative to each other; while Yu et al. (2009) found segregation in both birches and pines; and Hurst et al. (2012) found segregation in Nothofagus fusca but not Nothofagus menziessii. Nevertheless, competition and disturbance may be expected to result in opposite trends in terms of association between survivors and dead trees, with competition causing spatial association and disturbance potentially causing spatial segregation (Hurst et al., 2012). Given the multitude of possible starting arrangements, spatial scales (distances), and mechanisms of mortality, it may be premature to attempt to suggest more detailed generalizations on this trend.
Considered alongside the few previous studies of change in spatial pattern due to wind disturbances, the generalization is reinforced, that wind disturbance often increases spatial aggregation of survivors (Hypothesis 2 here), particularly at very fine scales. This trend may be common across various disturbance types, despite the distinction that some types of disturbance (e.g., beetle outbreaks, fire) predominantly spread via spatial contagion of the agent of disturbance, whereas ice storms and wind do not.
The increase in fine-scale aggregation among survivors could result from (a) fine-scale patchiness of the intensity of disturbance agents; (b) fine-scale clusters of relatively more resistant individuals; or (c) a combination of these causes. It is well-established (Peterson, 2007; Mitchell, 2013) that wind disturbance generally preferentially damages larger trees, causing the survivors to have smaller mean DBH. However, this trend was borne out at only three of the four study sites (Figure 8; no change at Fishhook was probably because trees at this site were initially rather small). Thus in three of the four sites the postdisturbance population was smaller and more aggregated. It is possible that these clusters of small trees are an imprint of gap colonization decades prior to the wind disturbances, although confirmation would require a stand chronology and dendrochronological information is not available for these sites. Nonetheless, if true, such a sequence would represent an intriguing continuation of patterns established decades earlier, through a major disturbance, and into the postdisturbance regeneration phase.
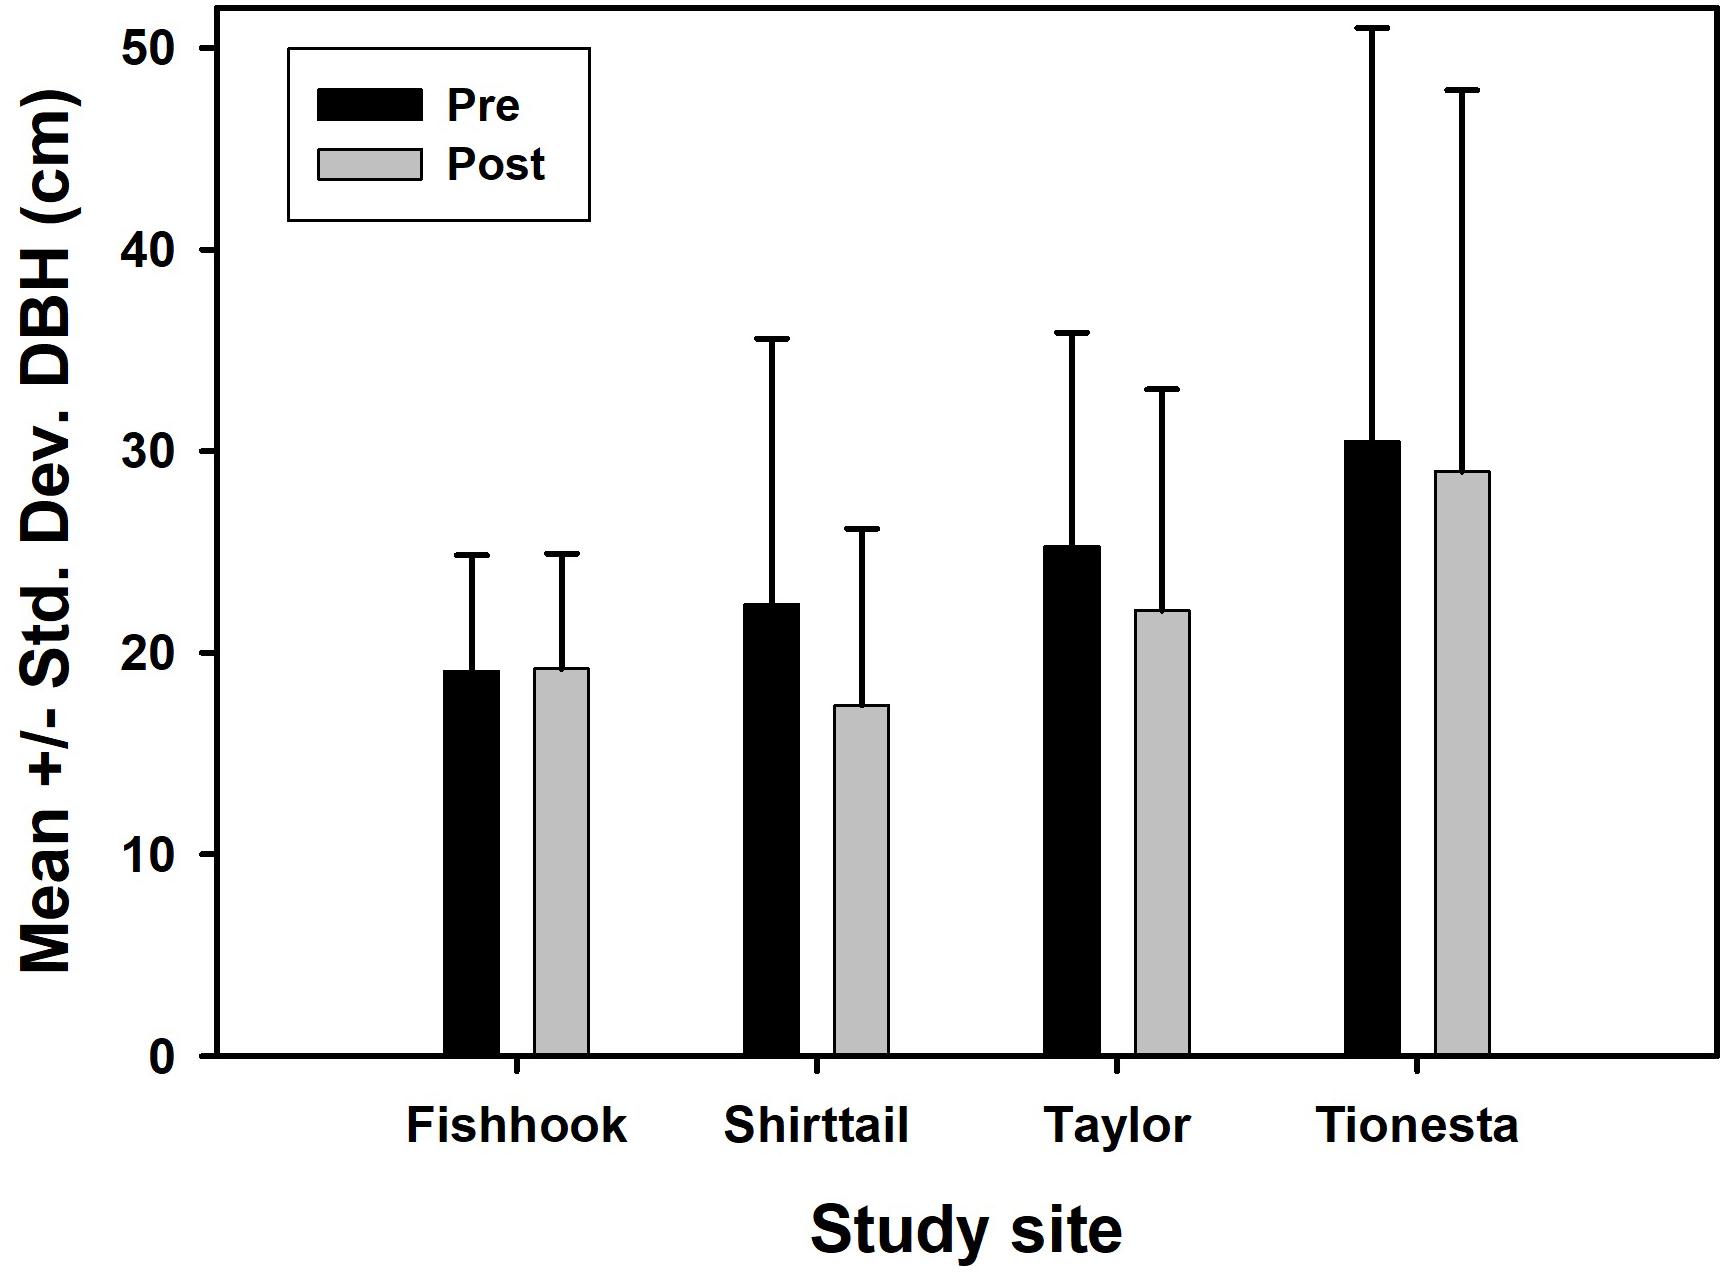
Figure 8. Pre- and postdisturbance mean tree diameter at 1.35 m (DBH), in cm, in the four study sites. Error bars represent one standard deviation.
The two-phase patterns reported here appear to be a novel finding. Empirical studies unsurprisingly show that disturbance-induced spatial shifts among survivors differ at different distances, but few generalizations have emerged regarding how spatial pattern might be expected to change at different distances. This study reports a consistent pattern of increased aggregation at very short distances (e.g., 5 m and occasionally 10 m), along with decreased aggregation (leading to randomness or sometimes greater regularity of distribution) at somewhat greater distances such as 30–50 m. Such two-phase change in spatial pattern may be driven by mortality reinforcing existing clusters of individuals but increasing distance between clumps. Some aspects of the findings in Rebertus et al. (1989) are consistent with this trend, with Quercus laevis in one of the study plots becoming more aggregated at scales up to 20 m, but more uniformly distributed at larger scales.
The hypothesis presented in Davis et al. (2005; Hypothesis 3 here) appears to be the first attempt to relate changes in spatial pattern to disturbance characteristics. These authors suggested that disturbance frequency and disturbance intensity (reinterpreted here as severity, because direct measures of disturbance intensity are quite rare) are interchangeable, and that intermediate levels of either frequency or severity should produce the greatest aggregation in survivors. This is a close analog of the classical Intermediate Disturbance Hypothesis of Connell (1978). Because the response variable in this hypothesis is spatial pattern – a product of the number and locations of trees – it is most appropriate to define severity on the basis of the number (percent) of pre-disturbance trees that are fallen. On this basis, Figure 7 shows that all three measures of maximal aggregation peak at highest severities rather than intermediate severities; therefore the hypothesis is not supported in this study. The author is unaware of any other tests of this hypothesis, but the following two constraints on the hypothesis are suggested. First, the post-disturbance spatial pattern of survivors may be strongly influenced (particularly when severity is low or intermediate) by the pre-disturbance distribution; therefore it is likely that an improved formulation of this hypothesis takes into consideration the pre-disturbance tree distribution, or examines the change in spatial pattern rather than the absolute post-disturbance pattern. Second, if the hypothesis is reformulated to use change in spatial pattern as the response variable, it is obvious that potential change in spatial pattern increases with the level of severity (i.e., the Tionesta site, with 27% mortality, could not have exhibited a large change in spatial pattern). This can be combined with the assumption given in Davis et al. (2005) that at the extreme of severity, very few stems remain and therefore aggregation is likely to be minimized – together, these ideas imply that aggregation is likely to peak at high but not extreme levels of severity. Thus the curve relating aggregation to severity is likely to be skewed, with a peak perhaps in the range of 75–90% mortality, as observed in this study.
Practical implications of these findings are straightforward. For silviculturists seeking to tailor harvest interventions to mimic natural disturbances, a type of retention harvest seems to be a suitable prescription. Clearcutting with reserves would be more extreme than warranted because the results reported here do not show complete absence of trees between clusters. However, perhaps a close approximation of the natural wind-induced spatial pattern can be achieved by an intervention that might be called shelterwood with reserves, where the reserves are small clusters. The areas between clusters would have a reduced tree density but not complete removal. Such a prescription may still be profitable because the removed trees would be from the largest size classes, yet the resulting stand structure would be a good analog of the stand structure resulting from moderate to severe (but not total) wind disturbance.
Data Availability Statement
The original contributions presented in the study are publicly available. This data can be found on figshare: https://doi.org/10.6084/m9.figshare.c.4927329.v1.
Author Contributions
CP directed field sampling, designed the surveys, collated the data, performed the statistical analyses, and wrote the manuscript.
Funding
Funding was provided by University of Georgia, USDA Forest Service Southern Research Station (cooperative agreement SRS 01-CA-11330136-405), the Mellon Foundation, and most recently the National Science Foundation [both Population and Community Ecology (DEB 114-3511), as well as Physical and Dynamic Meteorology (AGS 114-1926)].
Conflict of Interest
The author declares that the research was conducted in the absence of any commercial or financial relationships that could be construed as a potential conflict of interest.
Acknowledgments
I thank Allegheny National Forest, Superior National Forest, and Blooming Grove Hunting Club for permission to study wind-damage forests on their lands. Many field assistants over the period from 1996 to 2002 labored in often-difficult conditions to sample these four forests; I am grateful to all of them.
Footnotes
References
Aguilar, R. (1981). Soil-Landscape Relationships of the Tionesta Research Natural Area, Pennsylvania. Thesis, Cornell University, Ithaca, NY.
Bace, R., Svoboda, M., Janda, P., Morrissey, R. C., Wild, J., Clear, J. L., et al. (2015). Legacy of pre-disturbance spatial pattern determines early structural diversity following severe disturbance in montane spruce forests. PLoS One 10:e0139214. doi: 10.1371/journal.pone.0139214
Bjorkbom, J. C., and Larson, R. G. (1977). The Tionesta Scenic and Research Natural Areas. USDA Forest Service General Technical Report NE-31. Washington, DC: U.S. Department of Agriculture
Carrer, M., Castagneri, D., Popa, I., Pividori, M., and Lungua, E. (2018). Tree spatial patterns and stand attributes in temperate forests: the importance of plot size, sampling design, and null model. For. Ecol. Manag. 407, 125–134. doi: 10.1016/j.foreco.217/10.041
Christensen, N. L. (1977). Changes in structure, pattern and diversity associated with climax forest maturation in piedmont, North Carolina. Am. Midland Nat. 97, 176–188.
Connell, J. H. (1978). Diversity in tropical rain forests and coral reefs. Science 199, 1302–1309. doi: 10.1126/science.199.4335.1302
Dale, M. R. T. (1999). Spatial Pattern Analysis in Plant Ecology. New York, NY: Cambridge University Press.
Das, A., Battles, J., van Mantgem, P. J., and Stephenson, N. L. (2008). Spatial elements of mortality risk in old-growth forests. Ecology 89, 1744–1756. doi: 10.1890/07-0524.1
Davis, M. A., Curran, C., Tietmeyer, A., and Miller, A. (2005). Dynamic tree aggregation patterns in a species-poor temperate woodland disturbed by fire. J. Veg. Sci. 16, 167–174.
Franklin, J. F., Lindenmayer, D. B., MacMahon, J. A., McKee, A., Magnuson, J., Perry, D. A., et al. (2000). Threads of continuity: ecosystem disturbance, recovery, and the theory of biological legacies. Conserv. Biol. Pract. 1, 8–16.
Franklin, J. F., and Van Pelt, R. (2004). Spatial aspects of structural complexity. J. For. 102, 22–28.
Fraver, S., Dodds, K. J., Kenefic, L. S., Morrill, R., Seymour, R. S., and Sypitkowski, E. (2017). Forest structure following tornado damage and salvage logging in northern Maine, USA. Can. J. For. Res. 47, 560–564.
Furniss, T. J., Larson, A. J., Kane, V. R., and Lutz, J. A. (2019). Multi-scale assessment of post-fire tree mortality models. Int. J. Wildland Fire 28, 46–61. doi: 10.1071/WF18031
Gleason, H. A., and Cronquist, A. (1991). Manual of Vascular Plants of Northeastern United States and Adjacent Canada, 2nd Edn. Bronx, NY: New York Botanical Garden.
Hart, S. P., and Marshall, D. J. (2009). Spatial arrangement affects population dynamics and competition independent of community composition. Ecology 90, 1485–1491. doi: 10.1890/08-1813.1
Heinselman, M. (1996). The Boundary Waters Wilderness Ecosystem. Minneapolis, MN: University of Minnesota Press.
Hurst, J. M., Stewart, G. H., Perry, G. L. W., Wiser, S. K., and Norton, D. A. (2012). Determinants of tree mortality in mixed old-growth Nothofagus forest. For. Ecol. Manag. 270, 189–199.
Janik, D., Adam, D., Hort, L., Kral, K., Samonil, P., Unar, P., et al. (2014). Tree spatial patterns of Abies alba and Fagus sylvatica in the Western Carpathians over 30 years. Eur. J. For. Res. 133, 1015–1028. doi: 10.1007/s10342-014-0819-1
Kenkel, N. C. (1988). Pattern of self-thinning in jack pine: testing the random mortality hypothesis. Ecology 69, 1017–1024.
Kenkel, N. C., Hendrie, M. L., and Bella, I. E. (1997). A long-term study of Pinus banksiana population dynamics. J. Veg. Sci. 8, 241–254.
Kuchler, A. W. (1985). Potential Natural Vegetation of the Conterminous United States. Reston, VA: National Atlas of the United States of America.
Larson, A. J., and Churchill, D. (2008). Spatial patterns of overstory trees in late-successional conifer forests. Can. J. For. Res. 38, 2814–2825.
Larson, A. J., Lutz, J. A., Donato, D. C., Freund, J. A., Swanson, M. E., HilleRisLambers, J., et al. (2015). Spatial aspects of tree mortality strongly differ between young and old-growth forests. Ecology 96, 2855–2861. doi: 10.1890/15-0628.1
Markham, J., Adorno, B. V., and Weisser, N. (2019). Determinants of mortality in PInus banksiana (Pinaceae) stands during an ice storm and its effect on stand spatial structure. J. Torrey Bot. Soc. 146, 111–118. doi: 10.3159/TORREY-D-18-0002.1
Mattson, W. J., and Shriner, D. S. (2001). Northern Minnesota Independence Day Storm: A Research Needs Assessment. USDA Forest Service General Technical Report NC-216. Washington, DC: U.S. Department of Agriculture.
McElhinny, C., Gibbons, P., Brack, C., and Bauhus, J. (2005). Forest and woodland stand structural complexity: its definition and measurement. For. Ecol. Manag. 218, 1–24.
Mitchell, S. J. (2013). Wind as a natural disturbance agent in forests: a synthesis. Forestry 86, 147–157.
Pacala, S. W., and Deutschmann, D. E. (1995). Details that matter: the spatial distribution of individual trees maintains forest ecosystem function. Oikos 74, 357–365.
Perry, G. L. W. (2004). SpPack: spatial point pattern analysis in Excel using Visual Basic for Applications (VBA). Environ. Model. Softw. 19, 559–569.
Peterson, C. J. (2000). Damage and recovery of tree species after two different tornadoes in the same old growth forest: a comparison of infrequent wind disturbances. For. Ecol. Manag. 135, 237–252.
Peterson, C. J. (2004). Within-stand variation in windthrow in southern-boreal forests of Minnesota: is it predictable? Can. J. For. Res. 34, 365–375.
Peterson, C. J. (2007). Consistent influence of tree diameter and species on damage in nine eastern North America tornado blowdowns. For. Ecol. Manag. 250, 96–108.
Pielou, E. C. (1962). The use of plant-to-neighbour distances for the detection of competition. J. Ecol. 50, 357–367.
Rebertus, A. J., Williamson, G. B., and Moser, E. B. (1989). Fire-induced changes in Quercus laevis spatial pattern in Florida sandhills. J. Ecol. 77, 638–650.
Rich, R. L., Frelich, L. E., and Reich, P. B. (2007). Wind-throw mortality in the southern boreal forest: effects of species, diameter, and stand age. J. Ecol. 95, 1261–1273.
Turnbull, L. A., Coomes, D. A., Purves, D. W., and Rees, M. (2007). How spatial structure alters population and community dynamics in a natural plant community. J. Ecol. 95, 79–89. doi: 10.1111/j.1365-2745.2006.01184.x
Vandekerkhove, K., Vanhellemont, M., Vrska, T., Meyer, P., Tabaku, V., Thomaes, A., et al. (2018). Very large trees in a lowland old-growth beech (Fagus sylvatica L.) forest: density, size, growth, and spatial patterns in comparison to reference sites in Europe. For. Ecol. Manag. 417, 1–17. doi: 10.1016/j.foreco.2018.02.033
Ward, J. S., Parker, G. R., and Ferrandino, F. J. (1996). Long-term spatial dynamics in an old-growth deciduous forest. For. Ecol. Manag. 83, 189–202.
Wiegand, T., and Moloney, K. A. (2004). Rings, circles, and null-models for point pattern analysis in ecology. Oikos 104, 209–229.
Wolf, A. (2005). Fifty year record of change in tree spatial patterns within a mixed deciduous forest. For. Ecol. Manage. 215, 212–223. doi: 10.1016/j.foreco.2005.05.021
Wolf, A., Moller, P. F., Bradshaw, R. H. W., and Bigler, J. (2004). Storm damage and long-term mortality in a semi-natural temperate deciduous forest. For. Ecol. Manag. 188, 197–210.
Xi, W., Peet, R. K., Decoster, J. K., and Urban, D. L. (2008). Tree damage risk factors associated with large, infrequent wind disturbances of Carolina forests. Forestry 81, 317–333.
Keywords: wind, spatial pattern, aggregation, forest structure, segregation
Citation: Peterson CJ (2020) Change in Tree Spatial Pattern After Severe Wind Disturbance in Four North American Northern Hardwood and Sub-Boreal Forests. Front. For. Glob. Change 3:57. doi: 10.3389/ffgc.2020.00057
Received: 30 December 2019; Accepted: 15 April 2020;
Published: 04 June 2020.
Edited by:
Maurizio Mencuccini, Ecological and Forestry Applications Research Centre (CREAF), SpainReviewed by:
Lee E. Frelich, University of Minnesota Twin Cities, United StatesBrian J. Palik, Forest Service Northern Research Station (USDA), United States
Copyright © 2020 Peterson. This is an open-access article distributed under the terms of the Creative Commons Attribution License (CC BY). The use, distribution or reproduction in other forums is permitted, provided the original author(s) and the copyright owner(s) are credited and that the original publication in this journal is cited, in accordance with accepted academic practice. No use, distribution or reproduction is permitted which does not comply with these terms.
*Correspondence: Chris J. Peterson, Y2hyaXNAcGxhbnRiaW8udWdhLmVkdQ==
 Chris J. Peterson