- 1Institute for Applied Plant Biology, Witterswil, Switzerland
- 2Swiss TPH, University of Basel, Basel, Switzerland
- 3Meteotest, Berne, Switzerland
Excess deposition of the mineral nutrient nitrogen (N) is a serious threat for European forests. Its effect on foliar nutrient concentrations of Fagus sylvatica, along with other predictors, was analyzed in the present study which bases on 30 year's observation data in 74 forest monitoring plots in Switzerland. The data include gradients in soil chemistry, climate, nitrogen (N) deposition, and ozone concentration. This long-term forest monitoring study shows that foliar concentrations of phosphorus (P), magnesium (Mg), and potassium (K) decreased over time. Current foliar P concentrations indicate acute P deficiency, assessed both from the concentration and the N:P ratio thresholds. In addition, also the relation between N deposition and foliar concentrations of N and P changed over time. Initially, the N concentrations were positively and the P concentrations not correlated with N deposition. Today, N concentrations are negatively and P strongly negatively related, suggesting a progressive N saturation. Interactions between N deposition and soil chemistry suggest an impaired uptake of K and P at higher N loads. The decline of foliar Mg concentrations seems to be a result of soil acidification mediated by N deposition. Additionally, ozone impaired foliar P uptake. We could observe an increase in leaf weight over time while there was no time trend in P and K mass per leaf. This could be interpreted as a dilution effect but detailed regression analysis argues against the dilution hypothesis. Overall, the changing relation between N deposition and foliar N and P support the nitrogen saturation hypothesis.
Introduction
The assessment of tree mineral nutrition is part of the UNECE forest monitoring program ICP Forests (International Co-operative Programme on Assessment and Monitoring of Air Pollution Effects on Forests; ICP Forests, 2016). On the plots of this program, a deterioration of nutrition has been observed in the last two decades (Jonard et al., 2015; Talkner et al., 2015), and phosphorus (P) is the element most often declining in these studies. Unbalanced tree nutrition will affect growth and thus limit the uptake of increased atmospheric CO2 (Blanes et al., 2013). It will also have consequences for tree health and mortality (see e.g., St. Chaboussou, 1973; St. Clair et al., 2005; Vitousek et al., 2010; Sardans et al., 2012; Christina et al., 2015).
In permanent forest monitoring plots in Switzerland, decreases in foliar N and P concentrations have been observed for the last 30 years in European beech (Fagus sylvatica) (Braun et al., 2018). P concentrations have reached very low levels, far below the thresholds for normal nutrition. K and Mg concentrations have decreased, too, and leaves are showing an increasing incidence of Mg deficiency symptoms. Possible drivers for these changes may be progressive nitrogen saturation, soil acidification, changes of growth or climate or increasing tree age.
Increased tree productivity as a consequence of high nitrogen deposition, increased CO2 concentration or increased temperature has been proposed to be responsible for the changes in foliar nutrient concentrations (Pretzsch et al., 2014; Jonard et al., 2015). Dilution effects, when nutrients are dispersed over a larger biomass, may occur during the first stage of excess nitrogen addition, as long as N is still limiting (Menge and Field, 2007). When N deposition continues, this stage is, however, followed by a stage of nitrogen saturation (Aber et al., 1989; Emmett, 2007) characterized by an increase of nitrate concentration in soil solution (Aber et al., 1989). This may affect roots (Boxman et al., 1998b) or mycorrhiza (Nilsson and Wallander, 2003; Suz et al., 2014) and therefore nutrient uptake. Saturation may develop slowly, leading to changes in the responses to excessive N (Emmett, 2007; McNulty et al., 2017). Thus, a decadal perspective in monitoring is needed given the inherently slow processes involved.
Climate change and increased fructification of beech have been proposed as reasons for the decrease in foliar P concentrations (Talkner et al., 2015). While increasing temperatures will rather increase nutrient uptake (BassiriRad, 2000), increasing drought occurrence and intensity is expected to act in the opposite way (Kreuzwieser and Gessler, 2010). Since increasing temperature and pronounced drought events are often linked it is difficult to judge which process will be predominant.
In the case of Ca and Mg, a decrease of foliar concentrations is usually explained by soil acidification and the corresponding depletion of the exchangeable pools in the soils by leaching. Visible Mg deficiency in Norway spruce has been a forest decline symptom in parts of Germany affected by high acid loads in the 1980's (Cape et al., 1990; Elling et al., 2007). For anthropogenic soil acidification, both sulfur or nitrogen inputs are relevant. After the reduction of sulfur emissions achieved in the 1990's, the relative importance of nitrogen for soil acidification has become more important although sulfur is still leaching from the soils. Today's soil acidifying inputs are mainly mediated by nitrogen as sulfur deposition became very low (Augustin and Achermann, 2012).
The objective of the present paper was to disentangle the contribution of these possible factors, along with the role of edaphic predictors. Growth data for the study have been presented by Braun et al. (2017b). They show a marked decrease in stem increment, both on the basis of individual tree measurements and on plot surface.
Materials and Methods
Permanent Monitoring Plots
The study was conducted based on data from a network of long-term forest monitoring plots in Switzerland which was initiated in 1984. The plots cover a variety of soil types (including vertisols, cambisols, and rendzic leptosols) and environmental conditions (Table_Supplementary 1). Seventy-four beech plots were included in this study (Figure_Supplementary 1), each consisting of 60 mature Fagus trees on a surface area of 0.1–2 ha. The observation period of this study covers the time from 1984 to 2015, with harvests every 3–4 years (total of 9 harvests). The number of plots was 52 in 1984 and increased to 93 in 2015.
Soil Analysis
The solid phase of the soil was sampled in all plots once between 2005 and 2010. An Edelman auger (Eijkelkamp) was used for taking the samples at 6–8 points per plot in different horizons. The samples were pooled by horizon. Soil samples were air dried and passed through a 2 mm sieve. Exchangeable base cations and pH(CaCl2) were determined as described in Braun et al. (2003). Plant available P was extracted using 2% citric acid at a ratio of 1:10 (Hort et al., 1998; Manghabati et al., 2018). Total N and acid extractable P were determined after a Kjeldahl digestion. For P this digestion procedure yields lower values than real totals (Hornburg and Lüer, 1999). Lime (CaCO3) was determined by measuring the volume of CO2 evolved by addition of HCl. For data analysis, the element stocks in kg ha−1 were cumulated over the uppermost 40 or 60 cm, considering layer thickness, bulk density and stone content in the calculation. Bulk density was estimated in the field according to Sponagel et al. (2005) and adjusted for the content of organic carbon. pH and base saturation were averaged over the uppermost 40 cm. C:N ratios as well as total N and P concentrations were calculated for the forest floor or the uppermost mineral soil horizon, if no humic horizon was present (e.g., mull humus forms). This fraction is called “uppermost horizon” in the following.
Soil Solution
Soil solution was sampled in a subset of 19 plots covering a large range of chemical properties, starting between 1997 and 2002. Ceramic cups (Soilmoisture Inc., USA) were installed in 2–3 depths per plot and 5–8 replicates per depth. Depths varied per plot according to soil profile but a frequent sampling pattern was 20, 50, and 80 cm. Samples were collected monthly. The samples were combined per depth to one mixed sample per plot. Anions were analyzed in filtered samples using ion chromatography (Dionex GP50) with suppressed electrochemical detection (Dionex ED50). For the analysis of cations, samples were acidified after sampling. Ca, Mg, and Al were measured using atomic absorption spectrophotometry, K using flame emission spectrophotometry (Varian 240 AA).
Shoot Harvest and Plant Analysis
Shoots used for nutrient analysis were harvested every 4 years in July by helicopter from the top crown of the same eight trees per plot, starting in 1984. The shoots were visually assessed for discoloration symptoms (quantified as percentage of leaves affected) and for fructification by counting fruits or fruit scars on short shoots of different age. Leaves were dried, ground, and analyzed for N, P, K, Ca, Mg, and Mn according to Walinga et al. (1995). A subset of samples from previous harvests was reanalyzed each time to avoid systematic shifts in the analytical results. Quality control was achieved by analysis of certified samples (NIST apple leaves, National Institute of Standards and Technology, Gaithersburg, USA) and by taking part in a sample exchange program (WEPAL, University of Wageningen).
Ten leaves per tree were dried at 80°C and weighed. Nutrient contents in the leaves were obtained by multiplication of the dry weight per leaf with the concentration. The dry weight determination was not available for the years 1984 and 1995.
Climate
Meteorological data were interpolated for each plot from the nearest eight monitoring stations of the Federal Office of Meteorology and Climatology (MeteoSwiss) as described in Braun et al. (2017b). The resulting daily averages were used in the regression analysis or as input to the hydrological model Wasim-ETH (Schulla, 2013). With this model the following drought indicators were calculated:
i. Ratio between actual and potential evapotranspiration (ETa/ETp).
ii. Site water balance (SWB): cumulated difference between precipitation and potential evapotranspiration at a daily basis, with added water storage capacity of the soil (available water capacity). The cumulation started on January 1st. The lowest value reached during summer was used in the data analysis.
iii. Temperature, precipitation and drought indicators for the harvest year were averaged over the time between start of the season and the harvest date. Start and end of the season were taken from phenological data of beech budbreak and discoloration observed by MeteoSwiss and adjusted for altitude as described in Braun et al. (2017b). The season length thus differs between plots.
Nitrogen Deposition
We used for this study modeled nitrogen deposition covering all relevant dry and wet N components at a high spatial resolution, which gives an estimate of total deposition into forests. In Switzerland, ammonia (NH3) contribution to nitrogen deposition is quite high (Rihm and Achermann, 2016). The model based on emission inventories and dispersion models for the years 1990, 2000, 2007, and 2010 and was validated against measurements of NO2, NH3 and of ion concentrations in the precipitation (Rihm and Achermann, 2016) and against total deposition estimates by measurements of the single components with micrometeorological methods (Thimonier et al., 2018). Spatial resolution of the model was 1 ha for gaseous NO2 and NH3 and 1 km2 for wet deposition. The years between the model years were interpolated linearly. Such an interpolation is feasible as nitrogen emissions do not change very rapidly.
Ozone Flux
In earlier studies, annual ozone (O3) flux, expressed as the phytotoxic ozone dose over the threshold of 1 nmol m−2 s−1 (POD1), proved to be the best measure for ozone exposure of forest trees (Braun et al., 2014). It was calculated using the Central European parameterization for beech (UNECE, 2017) for the years 1991–2015. The model DO3SE (Emberson et al., 2000) was applied to monitoring data from 30 ozone monitoring stations, and the resulting annual flux values were mapped as described in Braun et al. (2014). Raster cell size was 250 m. The model was run including soil water (Büker et al., 2012) assuming medium soil water storage. Only annual ozone fluxes were available for analysis. It was therefore not possible to calculate ozone flux between budbreak and harvest date for an analysis of harvest year's ozone.
Statistics
Aim of the data analysis was the simultaneous evaluation of a broad range of possible covariates for foliar nutrient concentrations and ratios and to identify the most significant ones. A multivariable regression model was used with a backwards selection of predictors. The covariates included initially in the model are listed below. They were selected based on theoretical considerations.
i. Soil analysis
a. exchangeable stocks of K, Mg, Ca, or Mn (sum 0–40 cm) in kg ha−1, log transformed
b. citrate extractable stocks of P (sum 0–40 cm) in kg ha−1, log transformed.
c. stocks of N (Kjeldahl) and P (acid extractable) in t/ha (sum 0–60 cm)
d. base saturation in % (average 0–40 cm)
e. pH(CaCl2) (average 0–40 cm)
f. CaCO3 (lime, sum 0–40 cm) in t ha−1, log transformed.
ii. Meteorological parameters of the current or the previous year: In the year of the harvest they were averaged over the time between beech budbreak observed by the phonological network of MeteoSwiss and harvest date (“harvest year spring”), in the previous year over the time between beech budbreak and the following 85 days (“previous year spring”) or the whole season extending from budbreak to observed discoloration (“previous year season”).
a. air temperature
b. precipitation
c. ratio between actual and potential evapotranspiration (ETa/ETp)
d. site water balance: minimum value within each growing season.
iii. Time (continuous)
iv. Age: tree age at the beginning of the study for each plot as recommended for cohort studies (Glenn, 2007). In a dataset including a range of age classes, this procedure allows to disentangle the effects of age and of time.
v. Species composition: proportion of deciduous trees in the forest stand.
The number of plots allowed to include about 7 predictors with variations within plots and about 100 with variations within plot and time (Braun et al., 2017a). The covariates were subjected to a backwards removal procedure, based on the Akaike Information Criterion (AIC) which should be minimized. Linearity was tested using linear, quadratic or cubic functions of covariates using the function poly. Stocks of soil nutrients were tested for different depths (0–40, 0–60, 0–80 cm). The stocks accumulated over 40 cm proved to be the best predictors. As the arrangement of data in clusters of sites and years required a mixed linear regression model with site and year as random factors, the lmer function in R (version 1.1–15, package lme4, Bates et al., 2015) was used. Concentration predictors usually have a lognormal distribution. They were log-transformed if this led to an improvement of the AIC. After identification of the main effects, all possible interactions were tested one by one. Interactions which were significant in this screening procedure were added to the main model and subjected to another backward selection procedure. Residuals were checked for normal distribution using probability plots (qqplots) and for homoscedasticity and outliers using plots of residuals vs. fitted values. In case of non-conformance the dependent variable was transformed, and outliers which could clearly be visually identified in the Tukey-Anscombe plot were removed. In no case the removal of outliers changed the results. All variables were centered by subtracting the mean. Predictions and confidence intervals were extracted from the regression models using the R function ggpredict (R package ggeffects, version 0.14.0; Lüdecke, 2018). This function averages all covariates except the one(s) of interest. Plots with confidence bands were then produced using ggplot2 (Wickham, 2009). For the presentation of the results in the table, the significance of predictors with quadratic and cubic terms was tested using analysis of variance (R package car, function Anova, Fox and Weisberg, 2011). Collinearity of the predictors in the final models was tested using the variance inflation factor R function vif, package “car” (Fox and Weisberg, 2011). In most cases the factors were <2.5, in one case (manganese in soil, base saturation and lime) 4.3 and 5.2, respectively.
The number of plots has not been constant during the observation time. The monitoring program started with 52 plots in 1984. It increased to 93 in 2015. As the unequal number may introduce artifacts in time trends, predictions from a mixed regression with years as factor are shown in Figure 1 in addition to the raw concentrations. The covariates ozone, fructification, the chemistry of soil solution and leaf weight were not available for all years and/or plots. They were thus included with a reduced dataset (Table_Supplementary 2). As a starting point for these regressions, the same covariates as for the regression with all plots were used, but they were subjected to a further removal of predictors increasing the AIC.
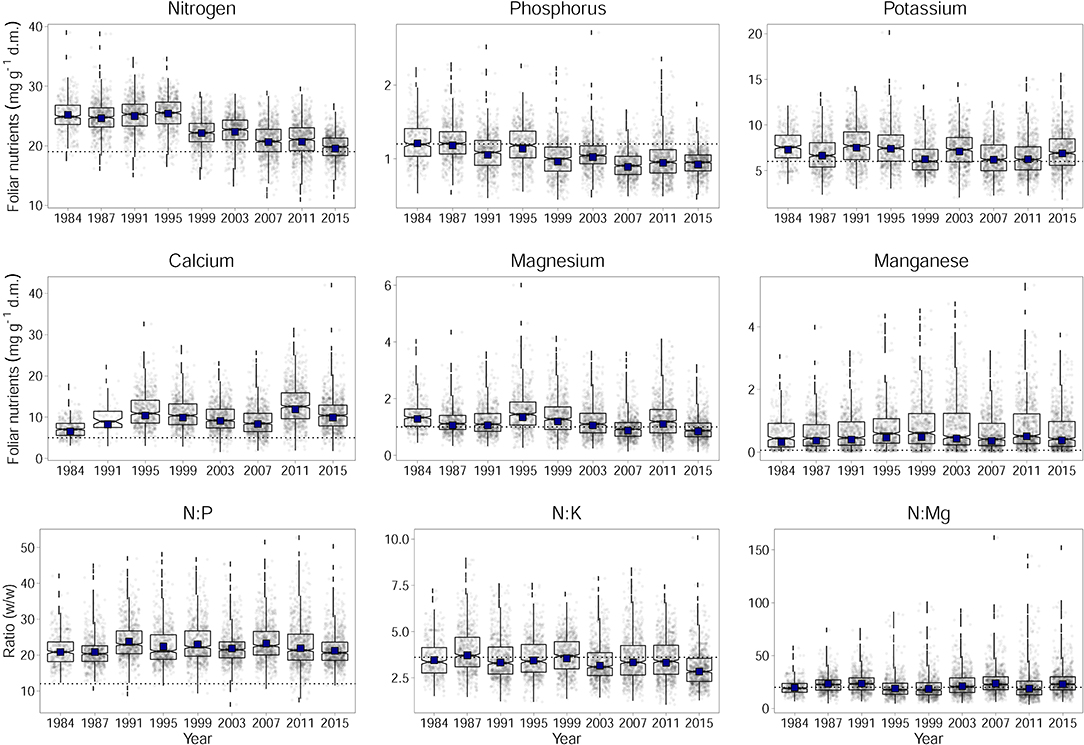
Figure 1. Development of foliar nutrient concentrations of N, P, K, Ca, Mg, and Mn for Fagus sylvatica per dry matter (d.m.) and the ratios of N to P, K, and Mg. Horizontal dashed lines indicates lower limits of normal ranges according to Göttlein (2015) and the upper limits of normal ranges for the ratios according to Flückiger and Braun (2003). Adjusted annual levels for the annually changing set of plots (by considering plot as a random effect) with year as fixed effect are given as black squares.
For the regression analysis of soil solution data, the average concentrations of the corresponding element in the soil solution of the year preceding the leaf harvest and in depths of <70 cm were used. The effect of soil solution chemistry on foliar concentrations was tested by comparing the AIC of a model with and without soil solution.
Fructification was not included as predictor in the general analysis as it is not an independent predictor: foliar nutrient concentrations may affect fructification and vice versa. It has, however, increased strongly during the observation period so its significance for the development of foliar concentrations of beech was assessed by comparing the time trend in regression models with and without fructification. Fructification, measured as number of fruits per short shoot in the respective season, was included for the current and the previous year in the same model. Attention was paid to the fruit coefficient on the one hand and on the time coefficient on the other hand. A change of the time coefficient would be an indication that fructification plays a role in explaining the observed time trend in the foliar nutrient concentrations.
The status of the nutrient supply was evaluated using the concentration thresholds published by Göttlein (2015) which base on a very large and well-documented data set compiled by van den Burg (1985, 1990). Recommendations for harmonized nutrient ratios in the compilations of van den Burg were summarized by Flückiger and Braun (1998).
Results
Time Trend of Element Foliar Concentrations and Contents
Over time, foliar concentrations of N, P, K, and Mg have decreased significantly (Figure 1). This is shown by the significance of the regression with time in Table 1. The observed time trend was not affected by the increasing number of plots as the values corrected for this do not differ from the uncorrected values (black squares in Figure 1). The increasing trend of Ca concentration in beech leaves is not significant as the variations between years are large. Inclusion of fructification reduced the variation for this element between years but the time trend remained insignificant (see Table 4). Changes of N and P concentrations were largely parallel resulting in rather constant N:P ratios. The N:K ratio have slightly decreased but this decrease is not significant as the variations from year to year are mostly explained by meteorological covariates (see also Figure 7). The time trend in Mn is not significant either.
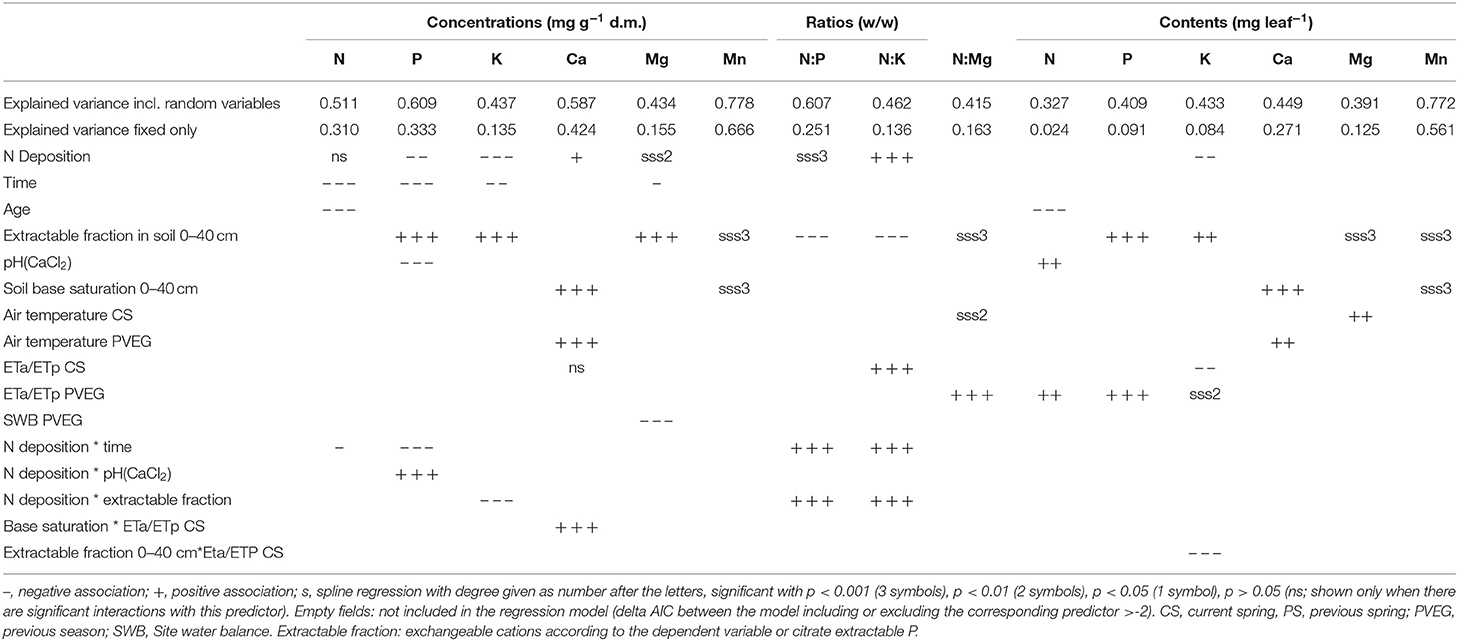
Table 1. Associations between element concentrations, ratios, and contents in foliage of Fagus sylvatica and different predictor variables.
Mg deficiency symptoms have increased since 1984 in parallel to the decreasing concentrations (Figure_Supplementary 2). Leaves with intercostal chloroses were clearly related to foliar Mg concentrations, less to Mg content (Figure_Supplementary 3).
The only element which was significantly associated with tree age was N. With increasing age foliar concentrations of N decreased. Age may thus have contributed to the decrease in foliar N concentrations but its inclusion in the regression model did not replace time as significant predictor. When looking at contents instead of concentrations there is no significant time trend (Figure 2, Table 1).
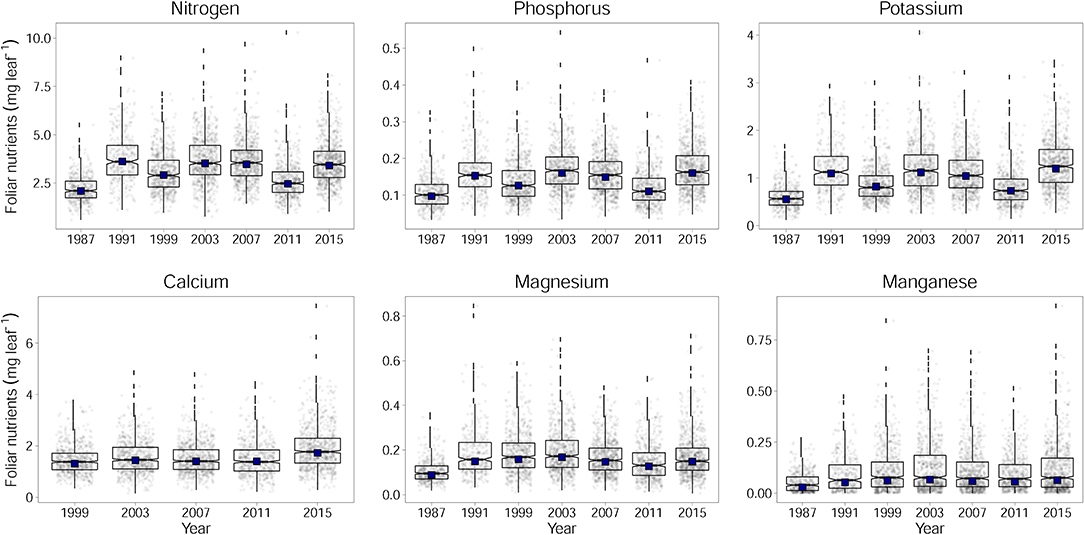
Figure 2. Development of foliar contents for N, P, K, Ca, Mg, and Mn for Fagus sylvatica calculated per leaf. Adjusted annual levels for the annually changing set of plots (by considering plot as a random effect) with year as fixed effect are given as black squares. The development is different when foliar contents are looked at instead of foliar concentrations (Figure 2). This contrasting development of concentrations and contents is mainly due to increasing leaf dry weight (Figure_Supplementary 4): while the specific leaf area slightly decreased throughout the observation period, leaf area increased (data not shown).
Relations of Foliar Nutrients With Soil Chemistry of the Solid Phase
Foliar N concentrations were not related to soil chemistry. Foliar P was higher, when the stock of acid extractable soil P cumulated over the uppermost 40 cm was high (Figure 3 left). For foliar Ca, the best predictor was base saturation. Foliar K, Mg, and Mn were related with the exchangeable pools of the corresponding element in the soil (K: Figure_Supplementary 5, Mg: Figure_Supplementary 6 left, Mn: Figure_Supplementary 7 left). Mn was also related with base saturation (Figure_Supplementary 7 center). If Mn is analyzed in an univariate spline regression with pH(CaCl2) as predictor, the foliar concentrations reflect the pH window of high Mn availability between pH 4 and 5 (Figure_Supplementary 7 right). The soil chemistry predictors for the foliar ratios to nitrogen were similar as for the corresponding single elements. Foliar N:P was related with acid extractable P in soil (Figure_Supplementary 8).
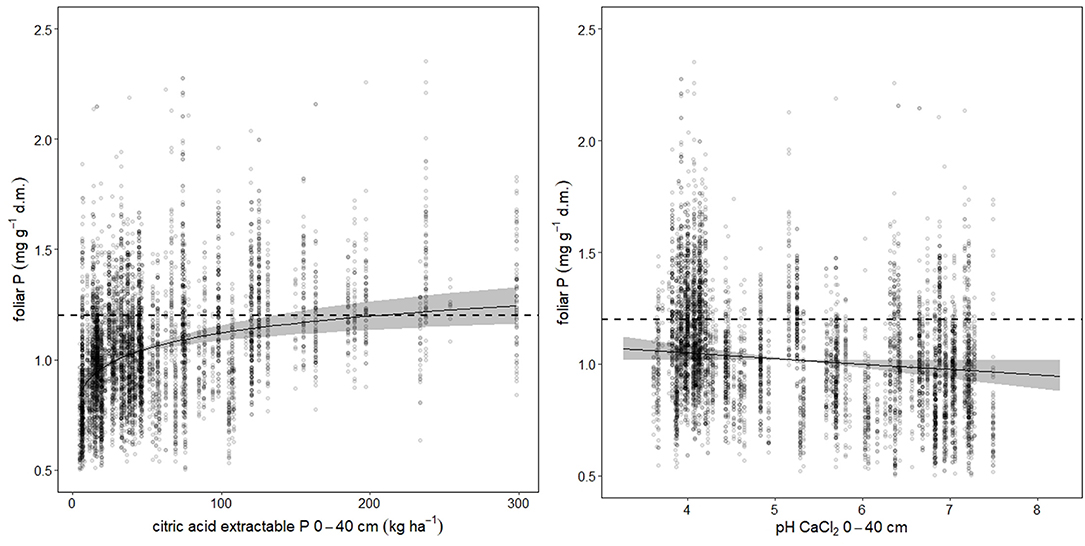
Figure 3. Soil chemistry predictors for foliar P. The dotted lines indicate the lower threshold of normal nutrition according to Göttlein (2015), the gray bands the 95% confidence intervals. Total variance explained is 60.9%, while citric acid extractable P (left graph) accounted for 41.5%, and pH (right graph) for 31.6%.
Development of Soil Solution Chemistry Over Time and Relations With Foliar Chemistry
Mg was the only element showing significant relations between foliar concentration and concentration in soil solution (20–40 cm depths), as indicated by the negative AIC difference (Table 2, Figure_Supplementary 6 right). Mg in soil solution was almost as good as predictor for foliar Mg as exchangeable Mg in soil, and the inclusion of soil solution chemistry along with exchangeable Mg into the regression model for foliar Mg decreased the magnitude of the time coefficient considerably (Table 3). By introducing soil solution Mg, the explained variance for fixed variables increased from 16.9 to 19.2%.
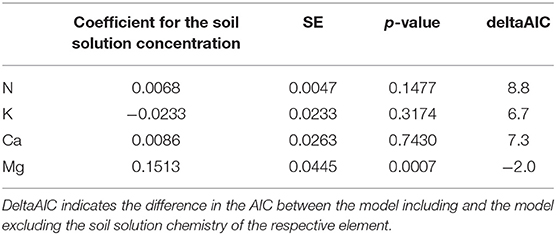
Table 2. Regression coefficients for the relation between foliar nutrient concentrations and the concentration of the corresponding element in soil solution for beech (19 plots).

Table 3. Regression coefficients for the relation between foliar nutrient concentrations with Mg concentration in soil solution (line 3), exchangeable Mg concentration in the soil (line 4), and time (line 5), for regression models including (left) and excluding Mg in soil solution.
During the observation period, all base cations as well as concentrations in the soil solution have decreased significantly (Table_Supplementary 3). The decrease in Mg concentrations is illustrated in Figure_Supplementary 9. The Al concentrations have increased but in beech plots the increase was small and not significant. The BC/Al ratio has, however decreased significantly in the plots with European beech which indicates a progressing acidification.
Relations of Tree Nutrition With Nitrogen Deposition
The relations of element concentrations with N deposition partially depended on other covariates as suggested by significant interaction terms. For foliar P concentration there were significant interactions with time and pH(CaCl2). On average over the whole observation period there was no significant correlation between foliar N concentration and N deposition but N deposition was positively correlated with foliar N in the beginning of the observation period (1984) and negatively in 2015 (Figure 4 left). Foliar P was negatively related to N deposition in beech. This relation was inexistent in the beginning and got stronger over time as suggested by the significant interaction between N deposition and time (Figure 4 center). The negative relation between foliar P and N deposition was stronger at low pH(CaCl2) (Figure_Supplementary 10). Similarly, the ratio of N:P in beech leaves responded much more to acid extractable P in soil at low N deposition (Figure_Supplementary 11). The uptake of K on soils with a high concentration of exchangeable K was only higher when N deposition was low (Figure 4 right). There was also a significant positive correlation of N deposition with the N:K ratio (Figure 5 right). The relation between foliar K and N deposition remains significant also when contents instead of concentrations are looked at (Figure_Supplementary 12).

Figure 4. Relationship between modeled N deposition and N (left), P (center), and foliar K concentrations (right) in Fagus sylvatica. Predicted values extracted from the regression models for 3 years (N, P) and for three levels of soil K stock (K). The lower thresholds to normal nutrition according to Göttlein (2015) are given as dashed lines. The colored bands indicate the 95% confidence intervals.
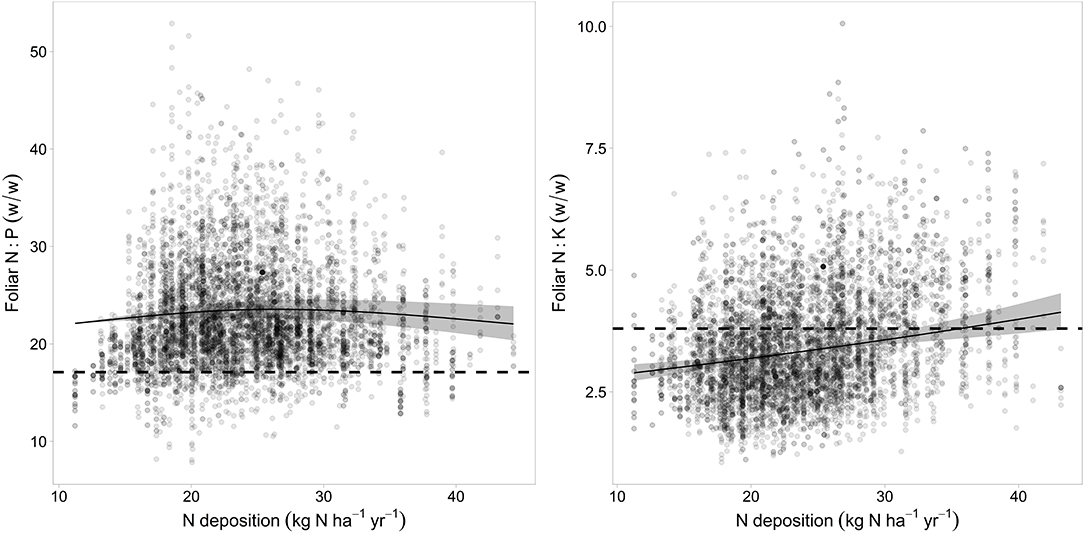
Figure 5. Relation between N deposition and the N:P ratio (left) and N:K (right). The upper limit for harmonic ratios according to Flückiger and Braun (2003) are given as dotted lines. The gray bands indicate the 95% confidence interval.
Relations of Foliar Nutrients With Ozone Flux
The ozone flux in the year preceding the harvest was correlated significantly and negatively with foliar P (Figure 6) while for N there was only a non-significant trend. The concentrations of the other foliar nutrients were not related to the ozone flux.
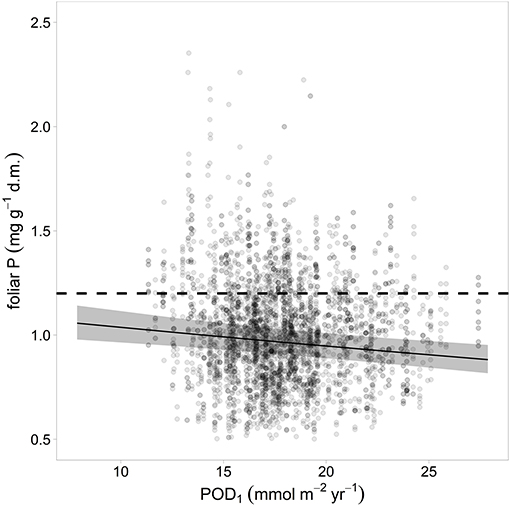
Figure 6. Relation between ozone flux in the preceding year and foliar P. The gray bands indicate the 95% confidence interval. Ozone unit is Phytotoxic Ozone Dose at Threshold 1 (POD1).
Relations of Foliar Nutrients With Fructification
Regression models with foliar concentrations as dependent variable and the significant predictors according to in Table 1 were compared to models with the number of fruits in the current and the previous year added as predictors. Table 4 shows the coefficients for current and previous year fruits and the AIC difference to the model without fruits, Table_Supplementary 4 the resulting time trends. The inclusion of fructification improved the model fit (as judged by the AIC) except for K. The coefficients with harvest year fruits were positive in all cases, i.e., foliar nutrient concentrations increased when fructification was high (Table_Supplementary 5). With previous year fruits, coefficients were positive for Ca and K concentrations and negative for N concentration. Inclusion of fruits did not affect the size of the time coefficient for any of the elements. The time trends for Ca and Mg were not significant and are shown in Table_Supplementary 4 for information only.
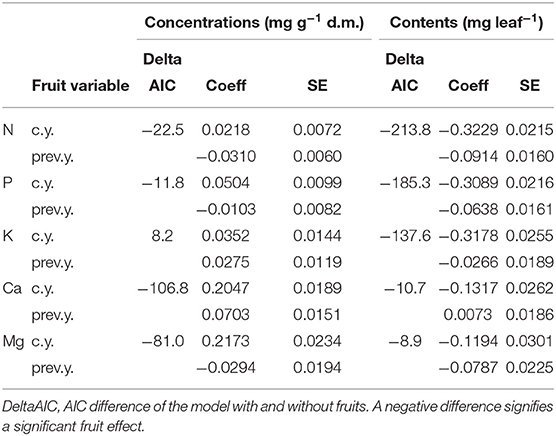
Table 4. Regression coefficients for the correlation of nutrient concentrations (left part) and nutrient contents (right) with the fructification of the current year (line c.y.) and of the previous year (line prev.y.).
It was also tested if there was a relationship with long-term average of fructification. Table 5 shows the regression coefficients obtained when the model in Table 1 is recalculated in presence of a long-term average per tree. In the case of P, the relation is significant: trees with more fruits have larger foliar P concentrations than trees with less fruits. For the other nutrients the AIC difference is positive, i.e., there is no significant relationship with long-term fructification average.
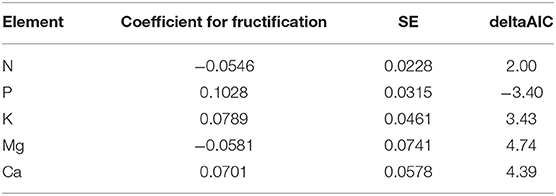
Table 5. Regression coefficients of the relation between foliar nutrient concentration and long-term average of fructification per tree (average year 2000–2015).
Relations of Foliar Concentrations With Climate
Air temperature, precipitation, evapotranspiration ratio and site water balance were significant predictors for foliar nutrient concentrations (Table 1). Drought was an important predictor, quantified either as ETa/ETp ratio, precipitation or soil water balance, for the cations K (as ratio to N); (Figure_Supplementary 16), Mg, and Ca (Figure_Supplementary 15). On soils with low base saturation, foliar Ca concentrations were higher under dry than under moist conditions (Figure_Supplementary 13).
The only clear temperature response was found for Ca which increased with increasing temperature of the previous season (Figure_Supplementary 14) while a non-linear relationship was observed for the N:Mg ratio.
When all predictors except the one(s) of interest are averaged, multivariate regression models allow to extract the response functions. This can be done for either single predictors or a group of predictors and was used to estimate the time trend of foliar nutrients explained by climate. The only modification to the models necessary was to run them without year as random effect. Then all non-climatic predictors were averaged and the predicted values from the regression model were extracted and averaged by year. The results are shown in Figure 7 for two examples with clear climatic relations: foliar concentrations of Ca and N:K ratios. While climate explains neither a trend nor a significant part of the variation of Ca concentrations (left part), it explains 57% of the observed negative time trend of N:K (right part).
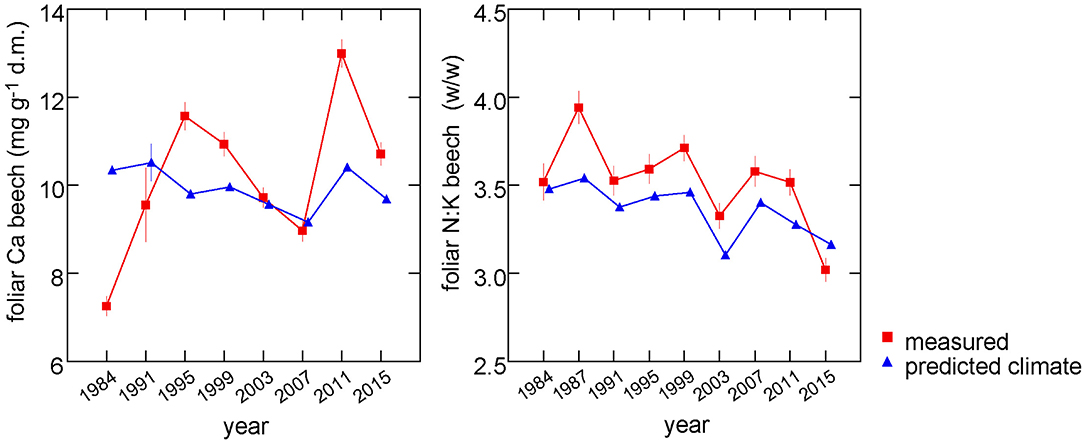
Figure 7. Predictions from the regression model for Ca concentrations (left) and N:K ratio (right) with non-climatic variables set at their means (blue triangles). These predictions thus reflect the annual variations explained by climatic variables. The measured values are shown for comparison (red squares).
Leaf Weight
As increasing leaf weight is an important reason for the contrasting trends of nutrient concentrations and contents, explanatory variables for this variable were also assessed. Only fructification was a significant predictor for leaf weight (Figure_Supplementary 17). This relation was strongly negative. A decreasing leaf weight with increasing fructification would thus have led to smaller, not larger, leaves and does not give an explanation for the increasing leaf weight.
If leaf weight explained decreasing concentrations by dilution, its inclusion in the regression model should affect the coefficient for time. The regression models in Table 1 were therefore recalculated adding leaf weight as additional covariate. The result is shown in Table 6. Only for foliar Mg the time trend got weaker after adjustment for leaf weight. This means that the time trend of Mg concentration may be partly explained by the increasing leaf weight while the others are not.
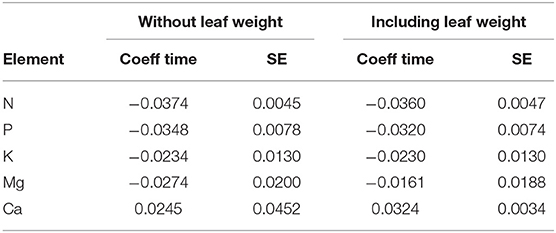
Table 6. Comparison of the time coefficient of the regression model with the covariates listed in Table 1 (left two columns) and including leaf weight as additional covariate (right columns).
Discussion
Time Trend and Nutrient Levels
The negative time trend of foliar nutrient concentrations found in this study is in accordance with several other recent studies in Europe. Prietzel and Stetter (2010) observed decreasing P concentration in two Scots pine (Pinus sylvestris) plots between 1991 and 2007, especially at the plot with high N deposition. Talkner et al. (2015) report on a strong P decrease in leaves of F. sylvatica in the ICP Forests plots. Jonard et al. (2015) analyzed the development of all macronutrients in nine tree species and found P concentrations deteriorating especially in F. sylvatica, Q. petraea, and P. sylvestris, partially down to critical levels. In F. sylvatica also the N, Ca, and Mg concentrations decreased, in Q. petraea the N, Ca, and K concentrations decreased while the changes of element concentrations in leaves of Q. robur were not significant. The authors attribute this development to an increased demand due to increased tree productivity (dilution hypothesis) although no growth data are presented along with the nutrient data. For the data presented here, a dilution due to an increased growth cannot have caused the concentration decrease as in F. sylvatica the stem increment was decreasing during the observation time (Braun et al., 2017b). Leaf weight has increased but the regression analysis including leaf weight as a covariate argues against its significance as it did not change the time trend. The increase of nutrient concentration in years with high fructification as suggested by the positive correlation between number of fruits and foliar nutrient concentrations can be interpreted as enrichment in smaller leaves.
P concentrations have to be considered as strongly deficient in F. sylvatica which is also supported by the high N:P ratios. The ratios between N and P were clearly above the normal range and did not change regardless of decreasing N or P concentrations. This may be interpreted as a decrease of N uptake to keep the N:P ratios rather constant when P concentrations are low as it has been observed e.g., for Abies pinsapo by Blanes et al. (2012). Ratios of nutrient concentrations are independent from changes in leaf weight. While P concentrations were clearly deficient for European beech, K concentrations were still in the normal range on an average (Göttlein, 2015). N:K ratios can be considered normal, too. The Mg supply was decreasing and reached clearly deficient levels after 2003 which was also expressed in increasing visual Mg deficiency symptoms. On an average, the Mn concentrations are well within the normal range. Toxic levels, causing visible dark spots, have been detected in two plots using X-ray analysis at concentrations of 1,163 and 1,328 mg kg−1 d.m., respectively (Flückiger and Braun, 2009) while Mn deficiency have been observed on two calcareous plots. No explanation can be given for the increasing leaf mass in the last 30 years. The increasing fructification can be excluded as reason as the relation of leaf mass with fructification was negative. There were no significant climate predictors for leaf mass but relations were found with leaf area: an increased leaf area was observed with increasing temperature and drought of the current season, and with decreasing drought of the previous season (not shown). A possible explanation could be increased CO2 in the atmosphere. In a FACE experiment with poplars, increased CO2 led to a larger area per leaf and heavier leaves while the specific leaf area decreased or remained constant (Gielen et al., 2001). The latter finding was confirmed in a meta-analysis by Ainsworth and Long (2005).
Nitrogen Deposition
Our results suggest that elevated nitrogen deposition is an important predictor for nutrition of European beech. This is in accordance with experimental evidence and gradient studies. In an N addition experiment, Balsberg-Påhlsson (1992) found a decrease of the concentrations of P and Cu in beech leaves in response to N fertilization with 40 kg N ha−1 yr−1 over 5 years. The fertilizer contained also small amounts of Ca and Mg. Although foliar K concentrations were unaffected, the increased N:K ratio suggests a changed K nutrition. Flückiger and Braun (1999) observed decreases in the concentrations of P, K, Mg, and Ca due to N addition in European beech and Norway spruce. In areas with high N input in the Netherlands, Houdijk and Roelofs (1993) observed low P, but also decreased Mg concentrations in Douglas fir needles.
Aber et al. (1989) suggested that P deficiency or a shortage of water limit the biotic functions when N saturation of forest ecosystems is reached. In the beginning of the saturation process, the biomass may be increasing. In our 74 European beech forests, the observed growth stimulation by nitrogen was small and detectable only at N inputs of <20 kg N ha−1 yr−1. In general, the stem increment has been decreasing during the last decades (Braun et al., 2017b). In the nitrogen saturation stage, an impairment of the root system (Aber et al., 1989; Boxman et al., 1998a) or of mycorrhiza (Rühling and Tyler, 1991; Wallander and Nylund, 1992) may reduce nutrient uptake and lead to reduced growth (Boxman et al., 1998a; Jönsson et al., 2004; Magill et al., 2004). Increased soil solution nitrate concentrations are also an indicator of the saturation stage. In the plots presented in this study, nitrate concentrations in 20–40 cm depth in the year 2015 were on an average 1.1 mg N l−1 which is much higher than the limit of 0.2 mg N l−1 for ecosystems unaffected by nitrogen set in the Mapping Manual of the UNECE Air Convention (CLRTAP, 2017). On an average, NH +-N was observed in soil solution was only 0.011 mg N l−1 (median) which suggests a rapid nitrification. In 15 of the beech stands examined in the present study, de Witte et al. (2017) observed that mycorrhizal species which are important for P uptake are reduced at higher N load. Such an impairment of mycorrhiza may lead to reductions not only in P nutrition but also in supply of other mineral nutrients—including N—and water.
Excess N deposition has certainly contributed to the low levels of P and K nutrition and the wide N:P ratios in leaves. The changing relations between foliar N and P with N deposition suggest progressive N saturation as proposed by Emmett (2007). Although N deposition has decreased by 25% during the observed period it is still considerably higher than the critical loads for nitrogen. The average N deposition in beech plots in 2010 was 24.6 kg N ha−1 yr−1 (Braun et al., 2017b). While effects of this decrease on soil solution chemistry are already visible (Braun, 2018), biological processes respond much more slowly (Stevens, 2016; Verstraeten et al., 2017).
Soil Chemistry
Favorable conditions for high K uptake were high exchangeable K concentrations in soil. High foliar P concentrations or low N:P ratios were observed at high acid extractable P concentration in the soil or at low pH. These positive relationships were, however, only valid when the nitrogen deposition was low. The observed interactions between N deposition and soil chemical parameters may beinterpreted as a reduced K and P uptake at higher N deposition. In our data there was no indication of K limitation in calcareous soils by the K-Ca-antagonism as discussed by Mellert and Ewald (2014). Lime stock of the soil was not a significant predictor for foliar K.
The significant decrease in BC/Al ratio in soil solution between 1998 and 2017 indicates an increase of acidification (Sverdrup and Warfvinge, 1993). The concentration of all base cations decreased significantly, but only foliar Mg was directly related to soil solution chemistry. This change in soil solution chemistry may therefore have contributed to the decrease in foliar Mg. Relations of foliar Mg with soil concentrations have been shown both for exchangeable Mg in soil (Ende and Evers, 1997) and for Mg in soil solution (Matzner et al., 1989). The significance of soil acidification for visible symptoms of Mg deficiency has been reported for Norway spruce in Germany e.g., by Cape et al. (1990) and Elling et al. (2007). For the chemistry of the solid soil phase no replicate in time is available for all plots. In a subset of plots, however, also a decrease in base saturation and in pH(CaCl2) was observed between 1996 and 2005 (Flückiger and Braun, 2009) while concentrations of citric-acid extractable P were stable (unpublished results).
The relation between foliar P concentration and pH(CaCl2) was linear which is not in accordance to the expectations from soil mineralogy. In acid soils P is immobilized as Al- and Fe-phosphates (Variscit, Strengit), in alkaline soils as Ca-phosphates (Apatite; Schachtschabel et al., 1998; Mellert and Ewald, 2014), with the highest availability at medium pH values. Other studies observed also a lower P availability in calcareous soils. Lower foliar P concentrations have been reported for European beech stands on limestone by Calvaruso et al. (2017), and a low P nutrition has been suggested to be responsible for a lower vitality of beech in the Bavarian alps (Ewald, 2000).
We found a clear correlation between foliar P concentrations and citric acid-soluble P stock in the soil This is in accordance to the results by Fäth et al. (2019) who also found that citrate extractable P is the best soil chemical predictor for foliar P. However, the level needed for sufficient foliar P nutrition in the present study (200 kg Pcitr ha−1 for 0–40 cm stocks) is much higher than in the study of Fäth et al. (2019) who observed sufficient foliar P concentrations in beech at 43 kg Pcitr ha−1 for 0–10 cm stocks and 50 kg Pcitr ha−1, respectively, for 0–80 cm stocks. This comparison suggests that the P nutrition of beech in Switzerland is much lower even when corrected for soil P stocks.
Climate
No temperature effects were found for N, P, and K concentrations in beech leaves which would have been expected for the actively absorbed elements (BassiriRad, 2000; Marschner, 2012). The climate effects observed in the present dataset can be summarized as increase either at high temperatures or under drought. This holds true for Mg which was higher when the minimum water balance of the previous season was low. Ca was either increased at warmer temperatures of the previous season or when the current spring was dry except on soils with high base saturation. These results may be explained by either an increased uptake when the transpiration stream is high due to high evaporative demand or by a concentration effect when drought leads to smaller leaves. The latter process has been proposed by e.g., Sardans and Peñuelas (2007) and Sardans et al. (2008) who suggested enrichment effects in Mediterranean ecosystems through reduced biomass. The decreasing N:K ratio with increasing drought is, however, not compatible with the concentration hypothesis as ratios are independent from the magnitude of the reference. In the case of N:K, drought is explaining a significant part of the observed increase. A decreased availability of nutrients in the soil as a result of reduced moisture as proposed by Kreuzwieser and Gessler (2010) would have led to decreased nutrient concentrations under dry conditions which was not observed.
Ozone
Ozone flux was negatively related with foliar P, as a trend also with N. These changes in foliar nutrients may be a result of a decreased carbon allocation to the roots (Samuelson and Kelly, 1996; review by Cooley and Manning, 1987) affecting the symbiosis with the mycorrhizal fungi which depend on these photosynthates. Ozone was a significant predictor for the composition of ectomycorrhiza community in a gradient study in the same beech plots used for the current study (de Witte et al., 2017). Effects of ozone on nutrient uptake may therefore be expected and are in accordance to the results of Wang et al. (2015) who found decreased needle P concentrations after chamber fumigation with 60 ppb ozone and changes in the ectomycorrhizal community in hybrid larch (L. gmelinii var. japonica _ L. kaempferi). In the Kranzberg ozone fumigation experiment labeled N was also more allocated to the roots of fumigated trees and showed up less in the leaves of mature beech and Norway spruce (Weigt et al., 2015). However, the number of vital ectomycorrhizal root tips and mycorrhizal species richness increased in the fumigated beeches (Grebenc and Kraigher, 2007).
Conclusions
The presented results of a 30 years time series of tree nutrition of Fagus sylvatica show effects of excess nitrogen deposition, of soil chemistry and of climate on tree nutrition, with interactions between the various predictors. Soil acidification is likely to have contributed to the decrease of the Mg concentration in beech leaves. Leaf weight increased in parallel to the reduction of foliar concentrations of N, P, and K. This increase in leaf weight explained parts of the time trend in Mg, not in the other nutrients. An increase of foliar concentrations by drought was observed for Mg and for Ca on base poor soils. Climate predictors explained the negative time trend in the case of the N:K ratio, but the data show no significant effect on the actively absorbed elements N and P. The drastic increase of fructification in beech has probably contributed to the annual variation in Ca concentrations but cannot be responsible for the changes in time as fructification decreased leaf size and most elements were positively, not negatively, related with the number of fruits. The observed interactions between N deposition and soil chemical parameters indicate a reduced nutrient uptake at higher N deposition. A decreased stem increment in parallel to the decreased nutrient concentrations contradicts the “dilution by increased growth” hypothesis. The high soil nitrate concentrations and the changing relations between foliar N and P with N deposition favor also the saturation hypothesis. Saturation develops slowly over time (Aber et al., 1998; Emmett, 2007). Nutrient imbalances are important indicators for this process. It has been shown that negative effects of increased nitrogen deposition on tree development often starts with nutrient imbalances, with consequences for e.g., parasite infestations (Flückiger and Braun, 1998; Eatough Jones et al., 2004) or drought induced mortality (Magill et al., 2004). With weakened resistances against abiotic or biotic incidents, external events may trigger visible decline processes. The present study supports the hypothesis that the changes in plant nutrition are a continuous process in which the nitrogen deposition plays a prominent role.
Data Availability Statement
The datasets generated for this study are available on request to the corresponding author.
Author Contributions
SB: forest observation, data analysis, and writing of manuscript. CS: data analysis. BR: model of nitrogen deposition and climate data.
Funding
This work was supported by Cantonal forestry departments of the cantons AG, BE, BL, BS, GR, TG, and ZH, environmental agencies of Central Switzerland Federal Office for the Environment, Berne, Switzerland.
Conflict of Interest
SB was employed by the company Institute for Applied Plant Biology AG, BR by the company Meteotest AG.
The remaining author declares that the research was conducted in the absence of any commercial or financial relationships that could be construed as a potential conflict of interest.
Acknowledgments
The authors thank the Swiss Cantons of Zurich, Bern, Zug, Solothurn, Basel-Stadt and Basel-Landschaft, Aargau and Thurgau for financing the long-term forest observations and the forest authorities for their interest in our work. We thank also the Federal Office for the Environment for financial support of the data analysis and helpful comments during the preparation of this manuscript, Jan Remund from Meteotest, for the interpolation of meteorological data, Simon Tresch for his help in R graphics, Daniel Lüdecke for extensive advice in the use of the R package ggeffects, the team of the Institute for Applied Plant Biology for field and lab work as well as all the foresters and forest owners enabling the long-term forest observation. I also thank a reviewer for very careful and helpful comments.
Supplementary Material
The Supplementary Material for this article can be found online at: https://www.frontiersin.org/articles/10.3389/ffgc.2020.00033/full#supplementary-material
References
Aber, J., McDowell, W., Nadelhoffer, K., Magill, A., Berntson, G., Kamakea, M., et al. (1998). Nitrogen saturation in temperate forest ecosystems. BioScience 48, 921–934. doi: 10.2307/1313296
Aber, J. D., Nadelhoffer, K. J., Steudler, P., and Melillo, J. M. (1989). Nitrogen saturation in northern forest ecosystems. BioScience 39, 378–386. doi: 10.2307/1311067
Ainsworth, E. A., and Long, S. P. (2005). What have we learned from 15 years of free-air CO2 enrichment (FACE)? A meta-analytic review of the responses of photosynthesis, canopy. New Phytol. 165, 351–371. doi: 10.1111/j.1469-8137.2004.01224.x
Augustin, S., and Achermann, B. (2012). Deposition von Luftschadstoffen in der Schweiz: Entwicklung, aktueller Stand und Bewertung. Schweizerische Zeitschrift Forstwesen 163, 323–330. doi: 10.3188/szf.2012.0323
Balsberg-Påhlsson, A. (1992). Influence of nitrogen fertilization on minerals, carbohydrates, amino acids and phenolic compounds in beech (Fagus sylvatica) leaves. Tree Physiol. 10, 93–100. doi: 10.1093/treephys/10.1.93
BassiriRad, H. (2000). Research review: kinetics of nutrient uptake by roots: responses to global change. New Phytol. 147, 155–169. doi: 10.1046/j.1469-8137.2000.00682.x
Bates, D., Maechler, M., Bolker, B., and Walker, S. (2015). Fitting linear mixed-effects models using lme4. J. Stat. Softw. 67, 1–48. doi: 10.18637/jss.v067.i01
Blanes, C., Viñegla, B., Merino, J., and Carreira, J. A. (2013). Nutritional status of Abies pinsapo forests along a nitrogen deposition gradient: do C/N/P stoichiometric shifts modify photosynthetic nutrient use efficiency? Oecologia 171, 797–808. doi: 10.1007/s00442-012-2454-1
Blanes, M. C., Emmett, B. A., Viñegla, B., and Carreira, J. A. (2012). Alleviation of P limitation makes tree roots competitive for N against microbes in a N-saturated conifer forest: a test through P fertilization and N-15 labelling. Soil Biol. Biochem. 48, 51–59. doi: 10.1016/j.soilbio.2012.01.012
Boxman, A. W., Blanck, K., Brandrud, T. E., Emmet, B. A., Gundersen, P., Hogervorst, R. F., et al. (1998b). Vegetation and soil biota response to experimentally-changed nitrogen inputs in coniferous forest ecosystems of the NITREX project. For. Ecol. Manage. 101, 65–79. doi: 10.1016/S0378-1127(97)00126-6
Boxman, A. W., van der Ven, P. J. M., and Roelofs, J. G. M. (1998a). Ecosystem recovery after a decrease in nitrogen input to a Scots pine stand at Ysselsteyn, The Netherlands. For. Ecol. Manage. 101, 155–163. doi: 10.1016/S0378-1127(97)00132-1
Braun, S. (2018). Untersuchungen über die Zusammensetzung der Bodenlösung. Bericht: Institut für Angewandte Pflanzenbiologie. Avaialble online at: http://www.bafu.admin.ch/wald.
Braun, S., Achermann, B., De Marco, A., Pleijel, H., Karlsson, P. E., Rihm, B., et al. (2017a). Epdemiological analysis of air pollution effects on vegetation: critical evaluation and recommendations. Sci. Total Environ. 603, 785–792. doi: 10.1016/j.scitotenv.2017.02.225
Braun, S., Hopf, S., and De Witte, L. (2018). Wie Geht es Unserem Wald? 34 Jahre Jahre Walddauerbeobachtung. Schönenbuch: Institut für Angewandte Pflanzenbiologie.
Braun, S., Schindler, C., and Rihm, B. (2014). Growth losses in Swiss forests caused by ozone: epidemiological data analysis of stem increment data of Fagus sylvatica L. and Picea abies Karst. Environ. Pollut. 192, 129–138. doi: 10.1016/j.envpol.2014.05.016
Braun, S., Schindler, C., and Rihm, B. (2017b). Growth trends of beech and Norway spruce in Switzerland: the role of nitrogen deposition, ozone, mineral nutrition and climate. Sci. Total Environ. 599–600, 637–646. doi: 10.1016/j.scitotenv.2017.04.230
Braun, S., Schindler, C., Volz, R., and Flückiger, W. (2003). Forest damage by the storm “Lothar” in permanent observation plots in Switzerland: the significance of soil acidification and nitrogen deposition. Water Air Soil Pollut. 142, 327–340. doi: 10.1023/A:1022088806060
Büker, P., Morissey, T., Briolat, A., Falk, R., Simpson, D., Tuovinen, J.-P., et al. (2012). DO3SE modelling of soil moisture to determine ozone flux to European forest trees. Atmospheric Chem. Phys. 12, 5537–5562. doi: 10.5194/acp-12-5537-2012
Calvaruso, C., Kirchen, G., Saint-André, L., Redon, P. O., and Turpault, M. P. (2017). Relationship between soil nutritive resources and the growth and mineral nutrition of a beech (Fagus sylvatica) stand along a soil sequence. CATENA 155, 156–169. doi: 10.1016/j.catena.2017.03.013
Cape, J. N., Freersmith, P. H., Paterson, I. S., Parkinson, J. A., and Wolfenden, J. (1990). TheNutritional-Status of Picea-Abies (L) Karst Across Europe, and implications for forest decline. Trees Struct. Funct. 4, 211–224. doi: 10.1007/BF00225318
Chaboussou, F. (1973). Le Rôle du Potassium et de L'équilibre Cationique Dans la Résistance de la Plante Aux Parasites et Aux Maladies. Au Service de l'Agriculture (SCPA) No 2, Document technique 16, Pont-de-la-Maye, 1–26.
Christina, M., Le Maire, G., Battie-Laclau, P., Nouvellon, Y., Bouillet, J. P., Jourdan, C., et al. (2015). Measured and modeled interactive effects of potassium deficiency and water deficit on gross primary productivity and light-use efficiency in Eucalyptus grandis plantations. Glob. Change Biol. 21, 2022–2039. doi: 10.1111/gcb.12817
CLRTAP (2017). Mapping Critical Loads for Ecosytems. Chapter V of Manual on Methodologies and Criteria for Modelling and Mapping Critical Loads and Levels and Air Pollution Effects, Risks and Trends. UNECE Convention on Long-range Transboundary Air Pollution.
Cooley, D. R., and Manning, W. J. (1987). The impact of ozone on assimilate partitioning in plants: a review. Environ. Pollut. 47, 95–113. doi: 10.1016/0269-7491(87)90040-6
de Witte, L. C., Rosenstock, N. P., van der Linde, S., and Braun, S. (2017). Nitrogen deposition changes ectomycorrhizal communities in Swiss beech forests and thereby hampers nutrient uptake. Sci. Total Environ. 605–606, 1083–1096. doi: 10.1016/j.scitotenv.2017.06.142
Eatough Jones, M., Paine, T. D., Fenn, M. E., and Poth, M. A. (2004). Influence of ozone and nitrogen deposition on bark beetle activity under drought conditions. For. Ecol. Manage. 200, 67–76. doi: 10.1016/j.foreco.2004.06.003
Elling, W., Heber, U., Polle, A., and Beese, F. (2007). Schädigung von Waldökosystemen. Auswirkungen athropogener Umweltveränderungen und Schutzmassnahmen. München: Elsevier, Spektrum Akademischer Verlag.
Emberson, L. D., Ashmore, M. R., Cambridge, H. M., Simpson, D., and Tuovinen, J.-P. (2000). Modelling stomatal ozone flux across Europe. Environ. Pollut. 109, 403–414. doi: 10.1016/S0269-7491(00)00043-9
Emmett, B. (2007). Nitrogen saturation of terrestrial ecosystems: some recent findings and their implications for our conceptual framework. Water Air Soil Pollut. Focus 7, 99–109. doi: 10.1007/s11267-006-9103-9
Ende, H. P., and Evers, F. H. (1997). “Visual magnesium deficiency symptoms (coniferous, deciduous trees) and threshold values (foliar, soil),” in Magnesium Deficiency in Forest Ecosystems, eds R. F. Hüttl and W. Schaaf (Dordrecht: Kluwer Academic Publishers), 2–22.
Ewald, J. (2000). Ist Phosphormangel für die geringe Vitalität von Buchen (Fagus sylvatica L.) in den Bayerischen Alpen verantwortlich? Forstwissenschaftliches Centralblatt 119, 276–296. doi: 10.1007/BF02769143
Fäth, J., Kohlpaintner, M., Blum, U., Göttlein, A., and Mellert, K. H. (2019). Assessing phosphorus nutrition of the main European tree species by simple soil extraction methods. For. Ecol. Manage. 432, 895–901. doi: 10.1016/j.foreco.2018.10.007
Flückiger, W., and Braun, S. (1998). Nitrogen deposition in Swiss forests and its possible relevance for leaf nutrient status, parasite attacks and soil acidification. Environ. Pollut. 102, 69–76. doi: 10.1016/S0269-7491(98)80017-1
Flückiger, W., and Braun, S. (1999). Nitrogen and its effects on growth, nutrient status and parasite attacks in beech and Norway spruce. Water Air Soil Pollut. 116, 99–110. doi: 10.1023/A:1005298609109
Flückiger, W., and Braun, S. (2003). “Critical limits for nutrient concentrations and ratios for forest trees - a comment. Critical Loads for Nitrogen,” in Expert Workshop on Critical Loads of Nitrogen, Proceedings, eds B. Achermann and R. Bobbink (Berne: Swiss Agency for the Environment, Forests and Landscape SAEFL), 273–280.
Flückiger, W., and Braun, S. (2009). Wie Geht es Unserem Wald? Bericht 3. Schönenbuch: Institut für Angewandte Pflanzenbiologie.
Gielen, B., Calfapietra, C., Sabatti, M., and Ceulemans, R. (2001). Leaf area dynamics in a closed poplar plantation under free-air carbon dioxide enrichment. Tree Physiol. 21, 1245–1255. doi: 10.1093/treephys/21.17.1245
Göttlein, A. (2015). Grenzwertbereiche für die ernährungsdiagostische Einwertung der Hauptbaumarten Fichte, Kiefer, Eiche und Buche. Allg. Forst Jagdz. 186, 110–116.
Grebenc, T., and Kraigher, H. (2007). Changes in the community of ectomycorrhizal fungi and increased fine root number under adult beech trees chronically fumigated with double ambient ozone concentration. Plant Biol. 9, 279–287. doi: 10.1055/s-2006-924489
Hornburg, V., and Lüer, B. (1999). Vergleich zwischen Total- und königswasserextrahierbaren Elementgehalten in natürlichen Böden und Sedimenten. J. Plant Nutr. Soil Sci. 162, 131–137. doi: 10.1002/(SICI)1522-2624(199903)162:2<131::AID-JPLN131>3.0.CO;2-1
Hort, R., Gupta, S., and Häni, H. (1998). “Methodenbuch für Boden-, Pflanzen- und Lysimeterwasseruntersuchungen,” in Schriftenreihe der FAL (Zürich-Reckenholz; Eidgenössische Forschungsanstalt für Agrarökologie und Landbau; Liebefeld-Bern: Institut für Umweltschutz und Landwirtschaft), 27, 1–228.
Houdijk, A., and Roelofs, J. G. M. (1993). The effects of atmospheric nitrogen deposition and soil chemistry on the nutritional status of Pseudotsuga menziesii, Pinus nigra and Pinus sylvestris. Environ. Pollut. 80, 79–84. doi: 10.1016/0269-7491(93)90013-E
ICP Forests (2016). Manual on Methods and Criteria for Hamonized Sampling, Assessment, Monitoring and Analysis of the Effects of Air Pollution on Forests. Revision 2016. Eberswalde: Johann Heinrich von Thünen Institute.
Jonard, M., Fürst, A., Verstraeten, A., Thimonier, A., Timmermann, V., Potocic, N., et al. (2015). Tree mineral nutrition is deteriorating in Europe. Glob. Change Biol. 418–430. doi: 10.1111/gcb.12657,
Jönsson, A. M., Rosengren, U., and Nihlgård, B. (2004). Excess nitrogen affects the frost sensitivity of the inner bark of Norway spruce. Ann. Forest Sci. 61, 293–298. doi: 10.1051/forest:2004022
Kreuzwieser, J., and Gessler, A. (2010). Global climate change and tree nutrition: influence of water availability. Tree Physiol. 30, 1221–1234. doi: 10.1093/treephys/tpq055
Lüdecke, D. (2018). ggeffects: Create Tidy Data Frames of Marginal Effects for 'ggplot' From Model Outputs. R package version 0.3.3.
Magill, A., Aber, J. D., Currie, W. S., Nadelhoffer, K. J., Martin, M. E., McDowell, W. H., et al. (2004). Ecosystem response to 15 years of chronic nitrogen additions at the Harvard Forest LTER, Massachusetts, USA. For. Ecol. Manage. 196, 7–28. doi: 10.1016/j.foreco.2004.03.033
Manghabati, H., Kohlpaintner, M., Ettl, R., Mellert, K.-H., Blum, U., and Göttlein, A. (2018). Correlating phosphorus extracted by simple soil extraction methods with foliar phosphorus concentrations of Picea abies (L.) H. Karst and Fagus sylvatica (L.). J. Plant Nutr. Soil Sci. 181, 547–556. doi: 10.1002/jpln.201700536
Marschner, P. (2012). Marschner's Mineral Nutrition of Higher Plants. Amsterdam; Boston; Heidelberg: Elsevier.
Matzner, E., Blanck, K., Hartmann, G., and Stock, R. (1989). “Needle chlorosis pattern in relation to soil chemical properties in two Norway spruce (Picea abies, Karst) forests of the German Harz mountains,” in IUFRO Conference: Air Pollution and Forest Decline, eds J. B. Bucher and I. Bucher-Wallin (Birmensdorf: Interlaken), 195–199.
McNulty, S., Boggs, J. L., Aber, J. D., and Rustad, L. E. (2017). Spruce-fir forest changes during a 30- year nitrogen saturation experiment. Sci. Total Environ. 605–606, 376–390. doi: 10.1016/j.scitotenv.2017.06.147
Mellert, K. H., and Ewald, J. (2014). Nutrient limitation and site-related growth potential of Norway spruce (Picea abies [L.] Karst) in the Bavarian Alps. Eur. J. For. Res. 133, 433–451. doi: 10.1007/s10342-013-0775-1
Menge, D. N. L., and Field, C. B. (2007). Simulated global changes alter phosphorus demand in annual grassland. Glob. Change Biol. 13, 2582–2591. doi: 10.1111/j.1365-2486.2007.01456.x
Nilsson, L. O., and Wallander, H. (2003). Production of external mycelium by ectomycorrhizal fungi 811 in a Norway spruce forest was reduced in response to nitrogen fertilization. New Phytol. 158, 409–418. doi: 10.1046/j.1469-8137.2003.00728.x
Pretzsch, H., Biber, P., Schütze, G., Uhl, E., and Rötzer, T. (2014). Forest stand growth dynamics in Central Europe have accelerated since 1870. Nat. Commun. 5:4947. doi: 10.1038/ncomms5967
Prietzel, J., and Stetter, U. (2010). Long-term trends of phosphorus nutrition and topsoil phosphorus stocks in unfertilized and fertilized Scots pine (Pinus sylvestris) stands at two sites in Southern Germany. For. Ecol. Manage. 259, 1141–1150. doi: 10.1016/j.foreco.2009.12.030
Rihm, B., and Achermann, B. (2016). Critical Loads of Nitrogen and Their Exceedances, Swiss Contribution to the Effects-Oriented Work Programme Under the Convention on Long Range Transboundary Air Pollution (UNECE). Berne: Federal Office for the Environment (FOEN)), 1–78.
Rühling, A., and Tyler, G. (1991). Effects of simulated nitrogen deposition to the forest floor on the macrofungal flora of a beech forest. Ambio 20, 261–263.
Samuelson, L. J., and Kelly, J. M. (1996). Carbon partitioning and allocation in northern red oak seedlings and mature trees in response to ozone. Tree Physiol. 16, 853–858. doi: 10.1093/treephys/16.10.853
Sardans, J., and Peñuelas, J. (2007). Drought changes phosphorus and potassium accumulation patterns in an evergreen Mediterranean forest. Funct. Ecol. 21, 191–201. doi: 10.1111/j.1365-2435.2007.01247.x
Sardans, J., Peñuelas, J., Coll, M., Vayreda, J., and Rivas-Ubach, A. (2012). Stoichiometry of potassium is largely determined by water availability and growth in Catalonian forests. Funct. Ecol. 26, 1077–1089. doi: 10.1111/j.1365-2435.2012.02023.x
Sardans, J., Peñuelas, J., and Ogaya, R. (2008). Drought's impact on Ca, Fe, Mg, Mo and S concentration and accumulation patterns in the plants and soil of a Mediterranean evergreen Quercus ilex forest. Biogeochemistry 87, 49–69. doi: 10.1007/s10533-007-9167-2
Schachtschabel, P., Blume, H. P., Brümmer, G., Hartge, K. H., and Schwertmann, U. (1998). Lehrbuch der Bodenkunde. Stuttgart: Enke.
Schulla, J. (2013). Model Description WaSIM (Water balance Simulation Model). Zurich. Available online at: http://www.wasim.ch/de/products/wasim_description.htm
Sponagel, H., Grottenthaler, W., and Hartmann, K.-J. (2005). Bodenkundliche Kartieranleitung. Hannover: E.Schweizerbart'sche Verlagsbuchhandlung.
St. Clair, S. B. S., Carlson, J. E., and Lynch, J. P. (2005). Evidence for oxidative stress in sugar maple stands growing on acidic, nutrient imbalanced forest soils. Oecologia 145, 258–269. doi: 10.1007/s00442-005-0121-5
Stevens, C. J. (2016). How long do ecosystems take to recover from atmospheric nitrogen deposition? Biol. Conserv. 200, 160–167. doi: 10.1016/j.biocon.2016.06.005
Suz, L. M., Barsoum, N., Benham, S., Dietrich, H. P., Fetzer, K. D., Fischer, R., et al. (2014). Environmental drivers of ectomycorrhizal communities in Europe's temperate oak forests. Mol. Ecol. 23, 5628–5644. doi: 10.1111/mec.12947
Sverdrup, H., and Warfvinge, P. (1993). The Effect of Soil Acidification on the Growth of Trees, Grass and Herbs as Expressed by the (Ca+Mg+K)/Al Ratio. Reports in Ecology and Environmental Engineering. Lund University, Department of Chemical Engineering II, Lund, 1–108.
Talkner, U., Meiwes, K. J., Potoèiæ, N., Seletkoviæ, I., Cools, N., De Vos, B., et al. (2015). Phosphorus nutrition of Beech (Fagus sylvatica) is decreasing in Europe. Ann. For. Sci 72, 919–928. doi: 10.1007/s13595-015-0459-8
Thimonier, A., Kosonen, Z., Braun, S., Rihm, B., Schleppi, P., Schmitt, M., et al. (2018). Total depositition of nitrogen in Swiss forests: comparison of assessment methods and evaluation of changes over two decades. Atmos. Environ. 198, 335–350. doi: 10.1016/j.atmosenv.2018.10.051
UNECE (2017). Mapping Critical Levels for Vegetation. Revised Chapter 3 of the UNECE Manual on Methodologies and Criteria for Modelling and Mapping Critical Loads and Levels and Air Pollution Effects, Risks and Trends. Prepared under the Convention on Long-range Transboundary Air Pollution (UNECE) by the International Cooperative Programme on Effects of Air Pollution on Natural Vegetation and Crops (Bangor: Center for Ecology & Hydrology (CEH); ICP Vegetation), 1–66.
van den Burg, J. (1985). Foliar Analysis for Determination of Tree Nutrient Status - A Compilation of Literature Data. Wageningen: Rijksinstituut voor Onderzoek in de Bos- en Landschapsbouw “De Dorschkamp”; Rapport.
van den Burg, J. (1990). Foliar Analysis for Determination of Tree Nutrient Status - A Compilation of Literature Data. Wageningen: Rijksinstituut voor Onderzoek in de Bos- en Landschapsbouw “De Dorschkamp”; Rapport.
Verstraeten, A., Neirynck, J., Cools, N., Roskams, P., Louette, G., de Neve, S., et al. (2017). Multiple nitrogen saturation indicators yield contradicting conclusions on improving nitrogen status of temperate forests. Ecol. Indicators 82, 451–462. doi: 10.1016/j.ecolind.2017.07.034
Vitousek, P. M., Porder, S., Houlton, B. Z., and Chadwick, O. A. (2010). Terrestrial phosphorus limitation: mechanisms, implications, and nitrogen-phosphorus interactions. Ecol. Appl. 20, 5–15. doi: 10.1890/08-0127.1
Walinga, I., van der Lee, J. J., Houba, V. J., van Vark, W., and Novozamsky, I. (1995). Plant Analysis Manual. Dordrecht: Kluwer Academic Publishers.
Wallander, H., and Nylund, J. E. (1992). Effects of excess nitrogen and phosphorus starvation on the extramatrical mycelium of ectomycorrhizas of Pinus sylvestris L. New Phytol. 120, 495–503. doi: 10.1111/j.1469-8137.1992.tb01798.x
Wang, X., Qu, L., Mao, Q., Watanabe, M., Hoshika, Y., Koyama, A., et al. (2015). Ectomycorrhizal colonization and growth of the hybrid larch F1 under elevated CO2 and O3. Environ. Pollut. 197, 116–126. doi: 10.1016/j.envpol.2014.11.031
Weigt, R. B., Häberle, K. H., Rötzer, T., and Matyssek, R. (2015). Whole-tree seasonal nitrogen uptake and partitioning in adult Fagus sylvatica L. and Picea abies L. [Karst.] trees exposed to elevated ground-level ozone. Environ. Pollut. 196, 511–517. doi: 10.1016/j.envpol.2014.06.032
Keywords: nitrogen deposition, phosphorus, potassium, magnesium, fructification, soil acidification
Citation: Braun S, Schindler C and Rihm B (2020) Foliar Nutrient Concentrations of European Beech in Switzerland: Relations With Nitrogen Deposition, Ozone, Climate and Soil Chemistry. Front. For. Glob. Change 3:33. doi: 10.3389/ffgc.2020.00033
Received: 30 September 2019; Accepted: 05 March 2020;
Published: 31 March 2020.
Edited by:
Friederike Lang, University of Freiburg, GermanyReviewed by:
Gregory Alexander Van Der Heijden, INRA Centre Nancy-Lorraine, FranceJunwei Luan, International Center for Bamboo and Rattan, China
Copyright © 2020 Braun, Schindler and Rihm. This is an open-access article distributed under the terms of the Creative Commons Attribution License (CC BY). The use, distribution or reproduction in other forums is permitted, provided the original author(s) and the copyright owner(s) are credited and that the original publication in this journal is cited, in accordance with accepted academic practice. No use, distribution or reproduction is permitted which does not comply with these terms.
*Correspondence: Sabine Braun, c2FiaW5lLmJyYXVuQGlhcC5jaA==
 Sabine Braun
 Christian Schindler2
 Beat Rihm