 Taehee Hwang1*
 Lawrence E. Band2,3
 Chelcy F. Miniat4
 James M. Vose5
 Jennifer D. Knoepp4
 Conghe Song6
 Paul V. Bolstad7
- 1Department of Geography, Indiana University Bloomington, Bloomington, IN, United States
- 2Department of Environmental Science, University of Virginia, Charlottesville, VA, United States
- 3Department of Engineering Systems and Environment, University of Virginia, Charlottesville, VA, United States
- 4Coweeta Hydrologic Laboratory, Southern Research Station, U.S. Forest Service, Otto, NC, United States
- 5Center for Integrated Forest Science, Southern Research Station, U.S. Forest Service, Raleigh, NC, United States
- 6Department of Geography, The University of North Carolina at Chapel Hill, Chapel Hill, NC, United States
- 7Department of Forest Resources, University of Minnesota, Saint Paul, MN, United States
In mountainous headwater catchments, downslope flow of subsurface water could buffer downslope forest communities from soil moisture stress during drought. Here we investigated changes in landscape-scale vegetation patterns at five forested headwater catchments in the Coweeta Hydrologic Laboratory in the southern Appalachians. We used a ca. 30-year Landsat Thematic Mapper (TM) image record of normalized difference vegetation index (NDVI), spanning a period of recorded warming since the mid-1970. We then, related spatial and temporal canopy patterns to seasonal water balance, streamflow recession behavior, and low flow dynamics from the long-term hydrologic records. All hydrologic metrics indicated increasing evapotranspiration, decreasing streamflow given precipitation, and potentially decreasing downslope subsidy at the watershed scale over time, especially during low-flow periods. Contrary to expectations, leaf area index (LAI) and basal area increased more upslope compared to downslope over time, coincident with warming. Trends in the ratio of NDVI in upslope and downslope topographic positions were also supported by long-term tree basal area increment, litterfall, and sap flux data in one of the reference watersheds. Mesophytic trees downslope appeared to respond more to frequent droughts and experience lower growth than xerophytic trees upslope, closely mediated by the isohydric/anisohydric continuum along hydrologic flow paths. Considering ongoing forest “mesophication” under a history of fire suppression across the eastern United States deciduous forests, this study suggests that mesophytic trees downslope may be more vulnerable than xerophytic trees upslope under ongoing climate change due to an apparent dependence on upslope water subsidy.
Introduction
Climate change is expected to bring warmer temperatures and increased hydrologic extremes including more frequent droughts and longer inter-storm periods (e.g., Seager et al., 2009; Pachauri et al., 2014). Although warming-induced lengthening of the growing season and increased atmospheric CO2 concentrations have generally facilitated vegetation growth (e.g., Keeling et al., 1996; Myneni et al., 1997; Keenan et al., 2014), enhanced hydroclimate variability has often led to increased periods of plant water stress (Anderegg et al., 2012), species-specific drought responses (Clark et al., 2011; Brzostek et al., 2014), xylem cavitation (Hoffmann et al., 2011), and subsequent widespread tree mortality (Adams et al., 2009; Klos et al., 2009; McDowell and Allen, 2015). For these reasons, water availability has become more widely recognized as a key driver of ecosystem response to climate change than before, in terms of carbon cycling (van der Molen et al., 2011), vegetation water use (Wullschleger and Hanson, 2006), and species distributions (Stephenson, 1990; Crimmins et al., 2011; VanDerWal et al., 2013) across different scales.
In addition to regional climate variability, topography provides variation in hydroclimate through topoclimate variation, lateral soil water redistribution, and differences in soil depth and storage. The interaction of climate and topography supports a wide range of microclimate and soil moisture conditions for both xeric and mesic tree species (Dobrowski, 2011; McLaughlin et al., 2017), and promotes high productivity and biodiversity especially in mountain forest ecosystems (Davis and Goetz, 1990; Beckage and Clark, 2003; Emanuel et al., 2011; Clark et al., 2014). In mountainous forested catchments, water consumption by vegetation downslope (green water) usually depends on water flow generation from upslope (blue water). Hillslope-riparian-stream connectivity by dominant subsurface hydrologic flow processes plays a key role in runoff generation (Jencso et al., 2009; Detty and McGuire, 2010; McGuire and McDonnell, 2010) and soil moisture organization at the watershed scale (Western et al., 1999; Ali and Roy, 2010). Downslope flows can mitigate the impact of droughts in convergent topographic areas (e.g., Hawthorne and Miniat, 2018). Therefore, topography-mediated soil moisture conditions provide an important control on the patterns of forest water use (Tromp-van Meerveld and McDonnell, 2006; Mackay et al., 2010), periodic water stress (Vicente-Serrano et al., 2008; Ford et al., 2011), tree growth (Clark et al., 2014; Elliott et al., 2015; Martin-Benito et al., 2015), mortality (Berdanier and Clark, 2016; Tai et al., 2017), and species distribution (Day et al., 1988; Crimmins et al., 2011). It is therefore important to understand climate-vegetation-topography-hydrology interactions and feedbacks to predict landscape-scale responses of forest ecosystems to ongoing climate change (e.g., Hoylman et al., 2018).
Forest vegetation often adjusts leaf area amount and duration in response to water and nutrient availability (e.g., Nemani and Running, 1989), which is mediated by lateral hydrologic flows along topographic gradients (Hwang et al., 2009). Hydrologic partitioning between localized water use and drainage often influences emergent vegetation dynamics in space and time (Thompson et al., 2011), which can be used as a simple diagnostic to infer underlying water balance patterns along hydrologic flow paths (Brooks et al., 2011; Voepel et al., 2011; Hwang et al., 2012; Hoylman et al., 2018). Furthermore, close interactions between hydroclimate variability and vegetation dynamics (e.g., large-scale mortality, growing season duration, etc.) have been demonstrated by measurable shifts in seasonal streamflow dynamics and forest water yield at the watershed scale (Adams et al., 2012; Bearup et al., 2014; Hwang et al., 2014, 2018; Creed et al., 2015; Kim et al., 2017, 2018). However, there have been few studies on feedbacks between climate change, lateral soil moisture distribution, and long-term forest canopy patterns at the watershed scale.
Following decades of active fire suppression in the eastern United States, fire-intolerant, mesophytic tree species (e.g., red maple and tulip poplar) have increased in southern Appalachian forests compared to fire-tolerant, xerophytic oak and hickory, often called as forest “mesophication” (Nowacki and Abrams, 2008, 2015). These long-term forest mesophication trends also have a great implication in understanding forest responses to frequent droughts under climate change. Red maple and tulip poplar typically exhibit as isohydric stomatal responses to declining soil water potentials, while oaks are typically anisohydric (Choat et al., 2012; Klein, 2014; Roman et al., 2015; Hwang et al., 2017). Anisohydric trees allow leaf water potential to drop as soil dries, so they maintain greater stomatal conductance to continue gas exchange under moderate droughts (Martínez-Vilalta et al., 2014). In contrast, trees that do not allow leaf water potential to drop as soil dries are known as isohydric, which close stomata to maintain a stable leaf water potential at the expense of CO2 uptake. For this reason, forest mesophication under fire suppression has been suggested to lead to greater sensitivity to frequent droughts under changing climate and reduced C sink across the eastern deciduous forests (Brzostek et al., 2014; Roman et al., 2015). However, this argument does not sufficiently consider changes in water balance patterns along hillslope gradients although mesophytic trees are usually found more at downslope topographic positions (Day et al., 1988).
Working in humid, mountainous, forest catchments, we hypothesize that climate-vegetation-topography-hydrology interactions will manifest in the following ways over time with warming:
(1) Increasing local evapotranspiration and decreasing downslope hydrologic flow at the watershed scale,
(2) Therefore, more frequently occurring drought stress for mesophytic trees at downslope topographic positions mediated by isohydric/anisohydric transition, and
(3) Lower growth of vegetation downslope than upslope due to potentially decreasing downslope subsidy from upslope ecosystems.
To test these hypotheses, we combined several long-term data sets to examine the role of topography, lateral hydrologic flows, and localized water use and growth at forested headwater catchments in the southern Appalachian Mountains, United States.
Materials and Methods
Study Site
This research was conducted at the U.S. Forest Service, Coweeta Hydrologic Laboratory in the southern Appalachian Mountains, North Carolina, United States (Figure 1), also a part of Long-Term Ecological Research (LTER) network. This area is characterized by steep topography with elevation ranging from 660 to 1590 m, providing highly variable yet distinct hydroclimate regimes within a relatively small area (about 20 km2). The climate is classified as marine, humid temperate. Long-term mean annual temperature is 12.6°C, and annual precipitation increases about 5% with each 100-m elevation increase (Swift et al., 1988); 1870 mm at 685 m elevation to 2500 mm at 1430 m. Precipitation is relatively evenly distributed throughout the year, characterized by small, low-intensity rainfall events with less-than 2% falling as snow (Laseter et al., 2012), but also subject to periodic tropical storms in late summer and fall. The dominant canopy tree species are Quercus spp. (oaks), Carya spp. (hickory), Nyssa sylvatica (black gum), Acer rubrum (red maple), and Liriodendron tulipifera (yellow poplar). Northern hardwood forests occur at the highest elevations (about 1200 m above), and are dominated by Betula alleghaniensis (yellow birch), Tilia heterophylla (basswood), Aesculus flava (yellow buckeye), and Acer saccharum (sugar maple) (Day et al., 1988). At low elevations in the study site, isohydric trees (e.g., tulip poplar, birch, and maple) are common in downslope forest community, while trees that allow leaf water potential to drop as soil dries (anisohydric) are more dominant in upslope community (e.g., oaks) (Supplementary Figure S8).
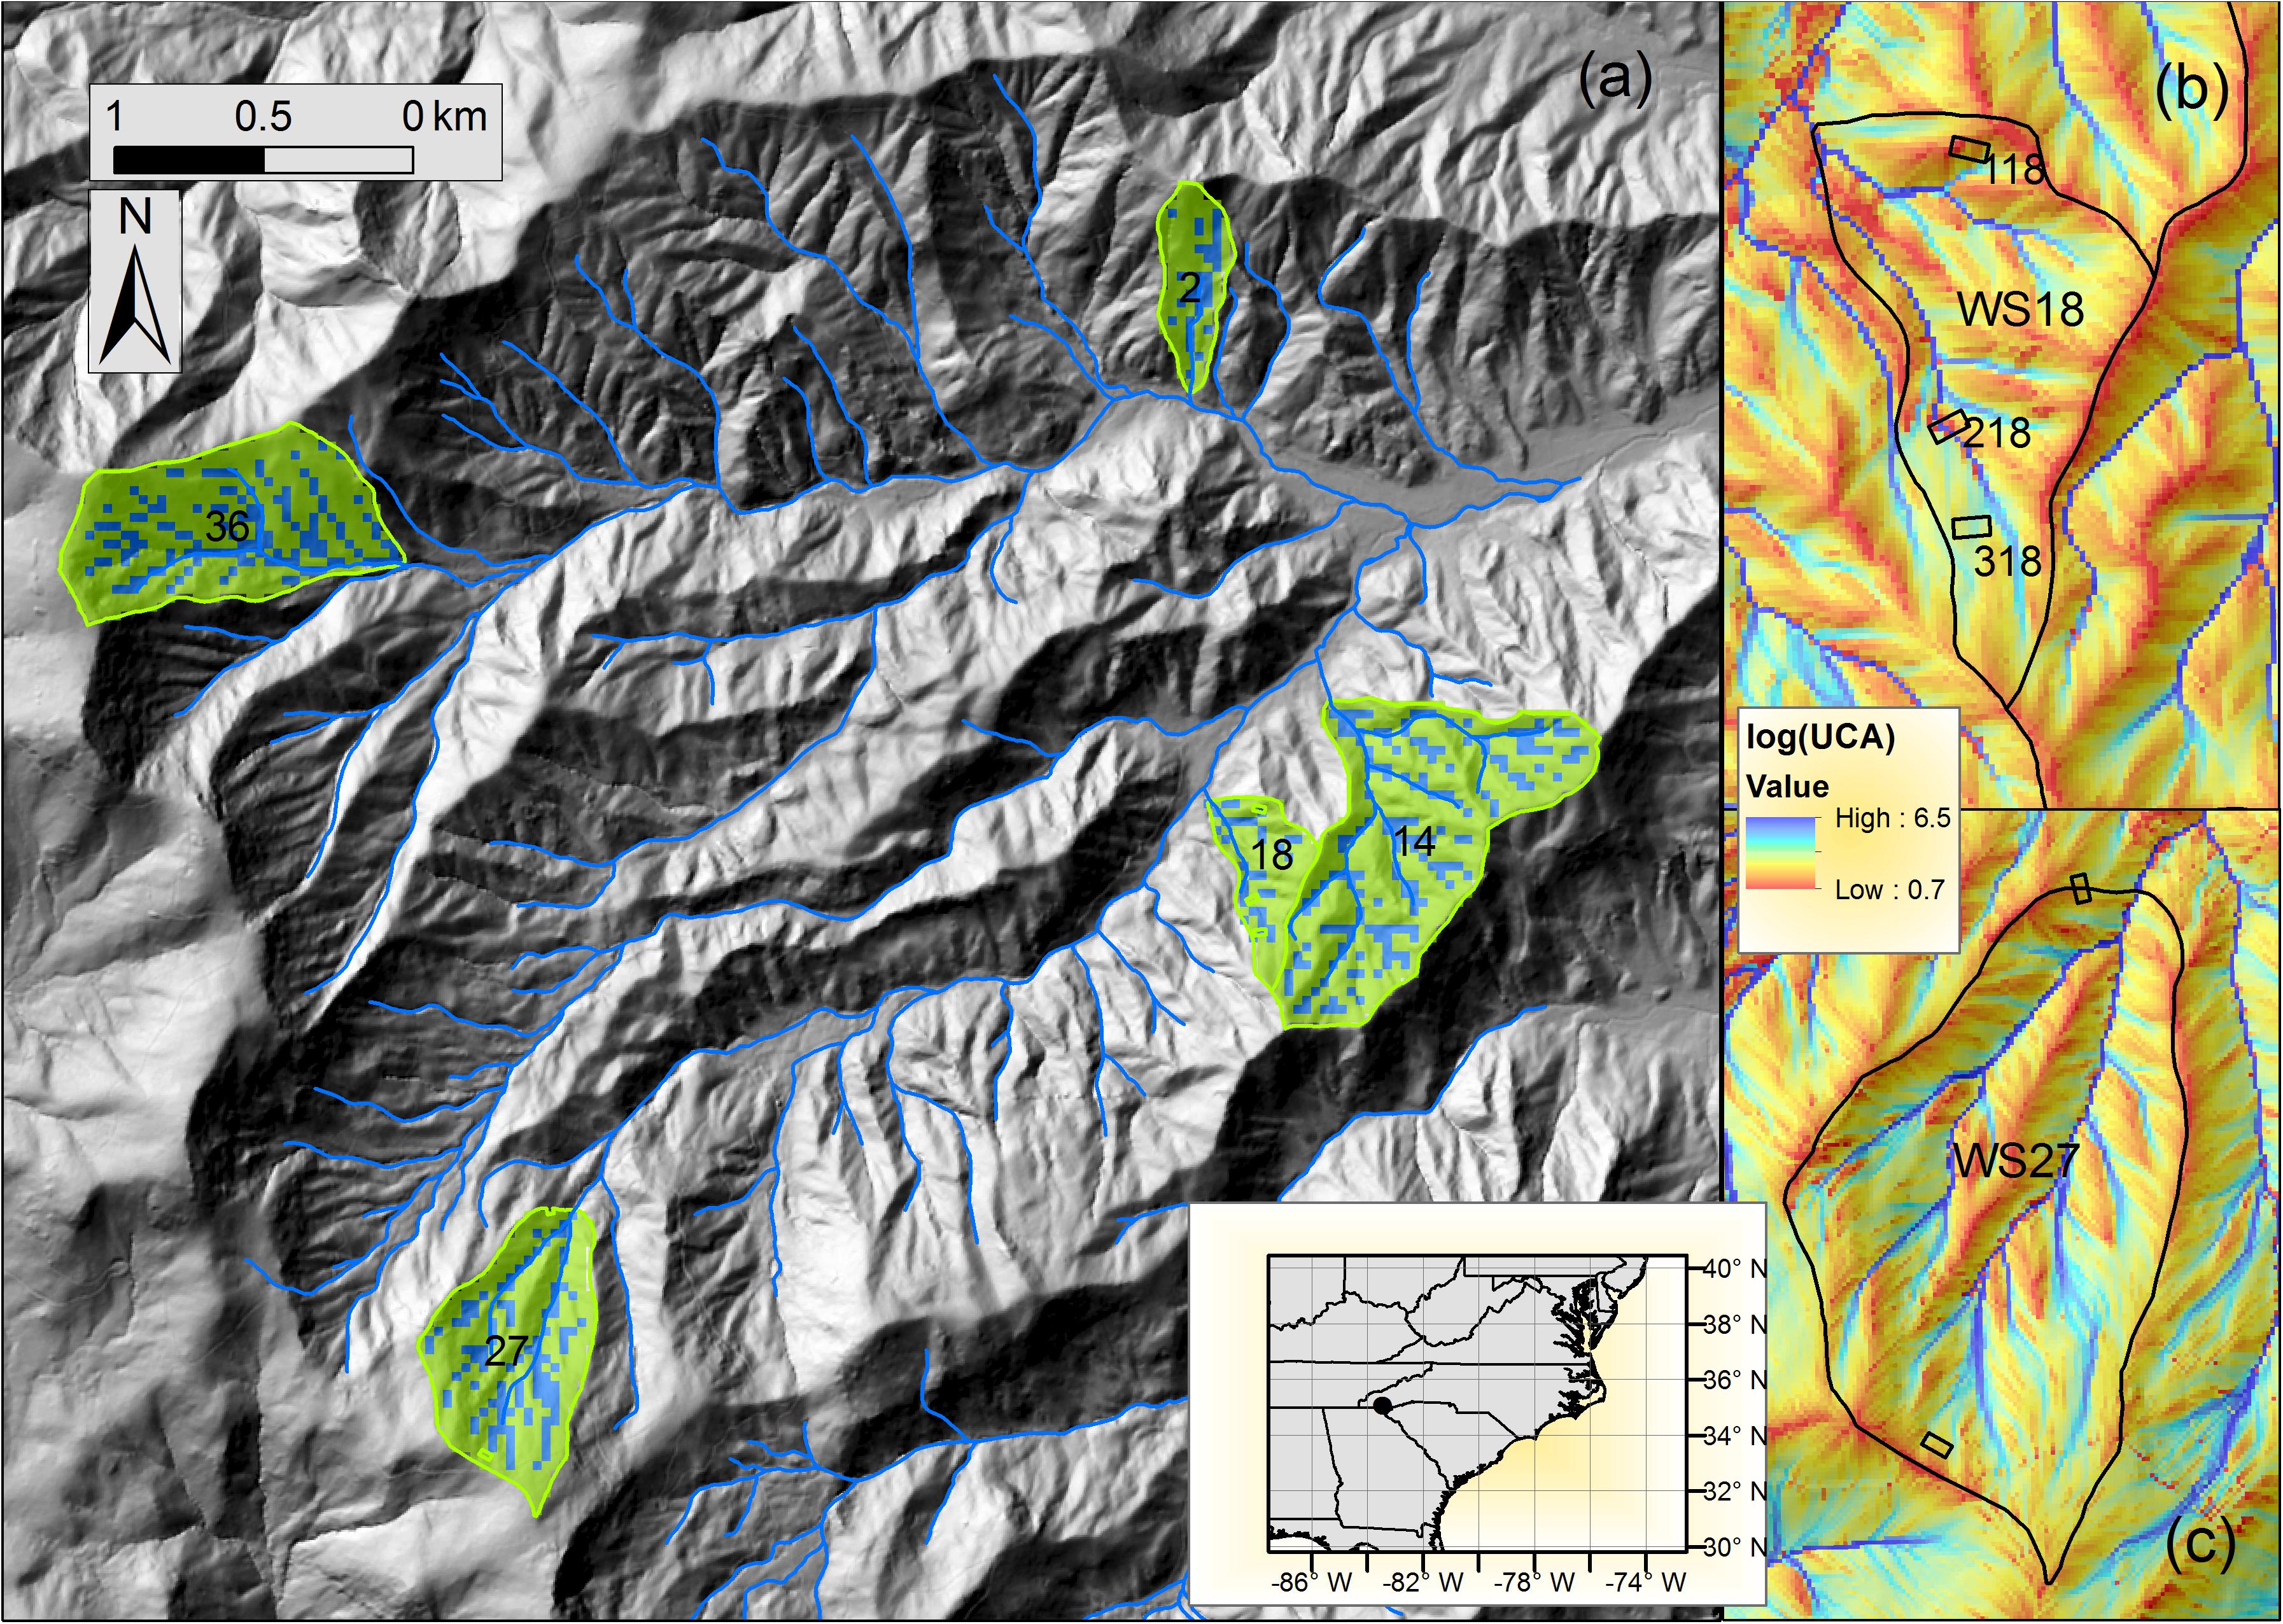
Figure 1. (a) Five reference headwater catchments (WS02, WS14, WS18, WS27, and WS36) in the study site (Coweeta Hydrologic Lab., North Carolina, United States). Green and blue-colored regions represent the pixels classified as upslope and downslope at a 30-m Landsat scale at each catchment, based on the distribution of upslope contributing area (UCA). Detailed UCA maps were generated from the original LiDAR (6.1-m scale) for (b) WS18 and (c) WS27, calculated from a D-infinity method (Tarboton, 1997). Three 80 by 80 m gradient plots (SITE 118, 218, 318) are located in WS18. Detailed explanations of the gradient plots are available in Supplementary Table S1.
Soils are relatively uniform, described as coarse sandyloam Inceptisols and Ultisols, typically residual with colluvial material in the coves, and areas of deeper, more organic rich soils in toe slope positions (Knoepp and Swank, 1998; Knoepp et al., 2018). Although the research was conducted at five reference watersheds (WS02, WS14, WS18, WS27, and WS36 - 3 low- and 2 high-elevation), due to limitations on data availability and access all five watersheds were used for remote sensing analyses; three watersheds for hydrologic analyses (WS14, WS18, and WS27); and one watershed (WS18) for detailed analyses of vegetation growth and sap flow (Table 1). The study watersheds are mostly composed of second succession forests (at least 90–110 years old). The age and stand dynamics reflect logging in the early 1900s, chestnut blight in the 1930s that eliminated most of the American chestnut (Vose and Elliott, 2016), and multiple droughts in the 1980s and 2000s that caused high mortality in red oak group at middle elevations (Clinton et al., 2003). Long-term Forest Inventory and Analysis data showed consistent forest mesophication trends since 1930s with increasing the basal area compositions of maples and tulip poplar while decreasing oaks, across the unmanaged forests in the study site (Elliott and Vose, 2011) and at the two of study watersheds (WS14 and WS18) (Caldwell et al., 2016).
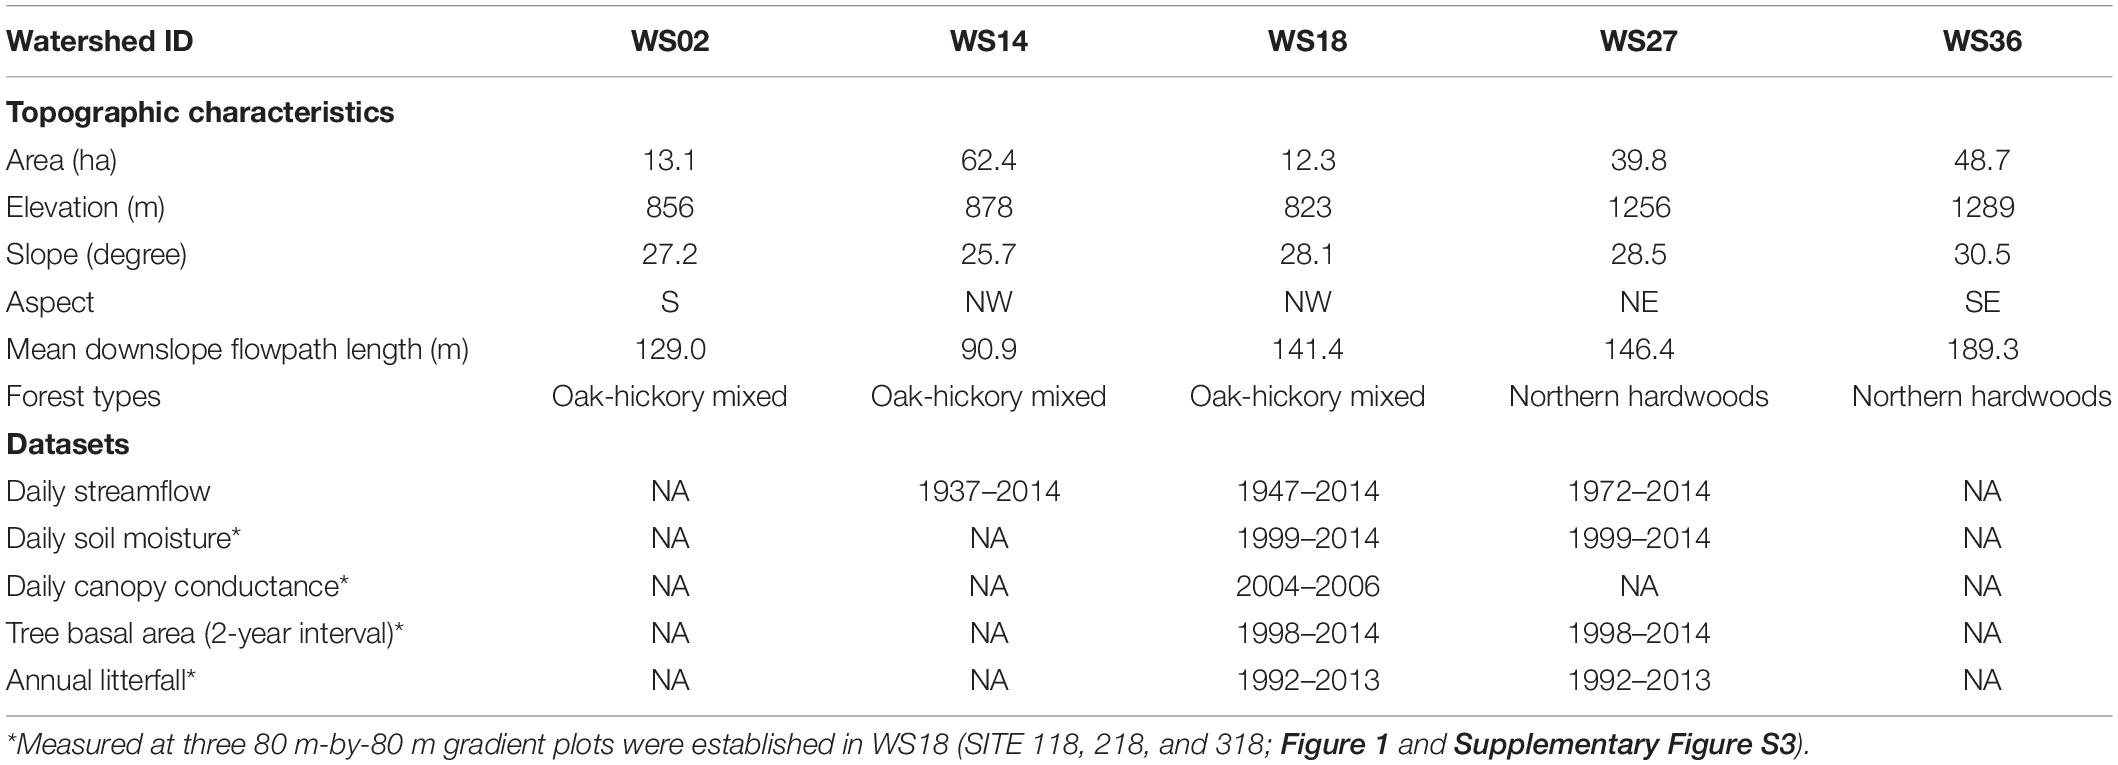
Table 1. Summary of five study headwater catchments and datasets used in this study.
Long-Term Climate and Hydrologic Records
We used the long-term climate records at the base (CS01; RG06) and high-elevation (RG31) climate stations (Supplementary Figure S1) in the study site (Miniat et al., 2017). We used universal kriging with an elevation trend from seven rain gauges from 1991 to 1995 developing a long-term isohyet to scale daily precipitation over the terrain (Hwang et al., 2012). Three water balance based metrics were calculated from observed daily precipitation (P) and stream discharge (Q) records at three reference headwater catchments (WS14, WS18, and WS27; Figure 1) (Miniat et al., 2016): (1) evapotranspiration (ET estimated as P − Q), (2) runoff ratio (RR; Q/P), and (3) Horton index (HI; ET/W), which represents the ratio of evapotranspiration (ET) to catchment wetting (W) (Troch et al., 2009). Note that relatively wet condition of the study site without permanent snowpack actually minimizes the effect of dormant-season precipitation in these mass balanced based approach based on the vegetation year (see Figure 2 in Hwang et al., 2014). Catchment wetting (W; P − S) is the precipitation retained in the catchment and potentially available to vegetation, calculated by removing quick flow component (stormflow, S) from precipitation. HI has been suggested to remove the precipitation variation and better represent water available for vegetation use at the catchment scale (Brooks et al., 2011; Voepel et al., 2011). We used the Web-based Hydrograph Analysis Tool (Lim et al., 2005) to separate base flow from daily streamflow records using the two-parameter digital filtering method (Eckhardt, 2005). The three hydrologic metrics above were calculated during the peak growing-season period (June–August) annually from all available daily precipitation and streamflow data (Table 1). Note that the ET estimates implicitly include seasonal storage changes, and thus effectively represent dryness of watershed systems (Hwang et al., 2018).
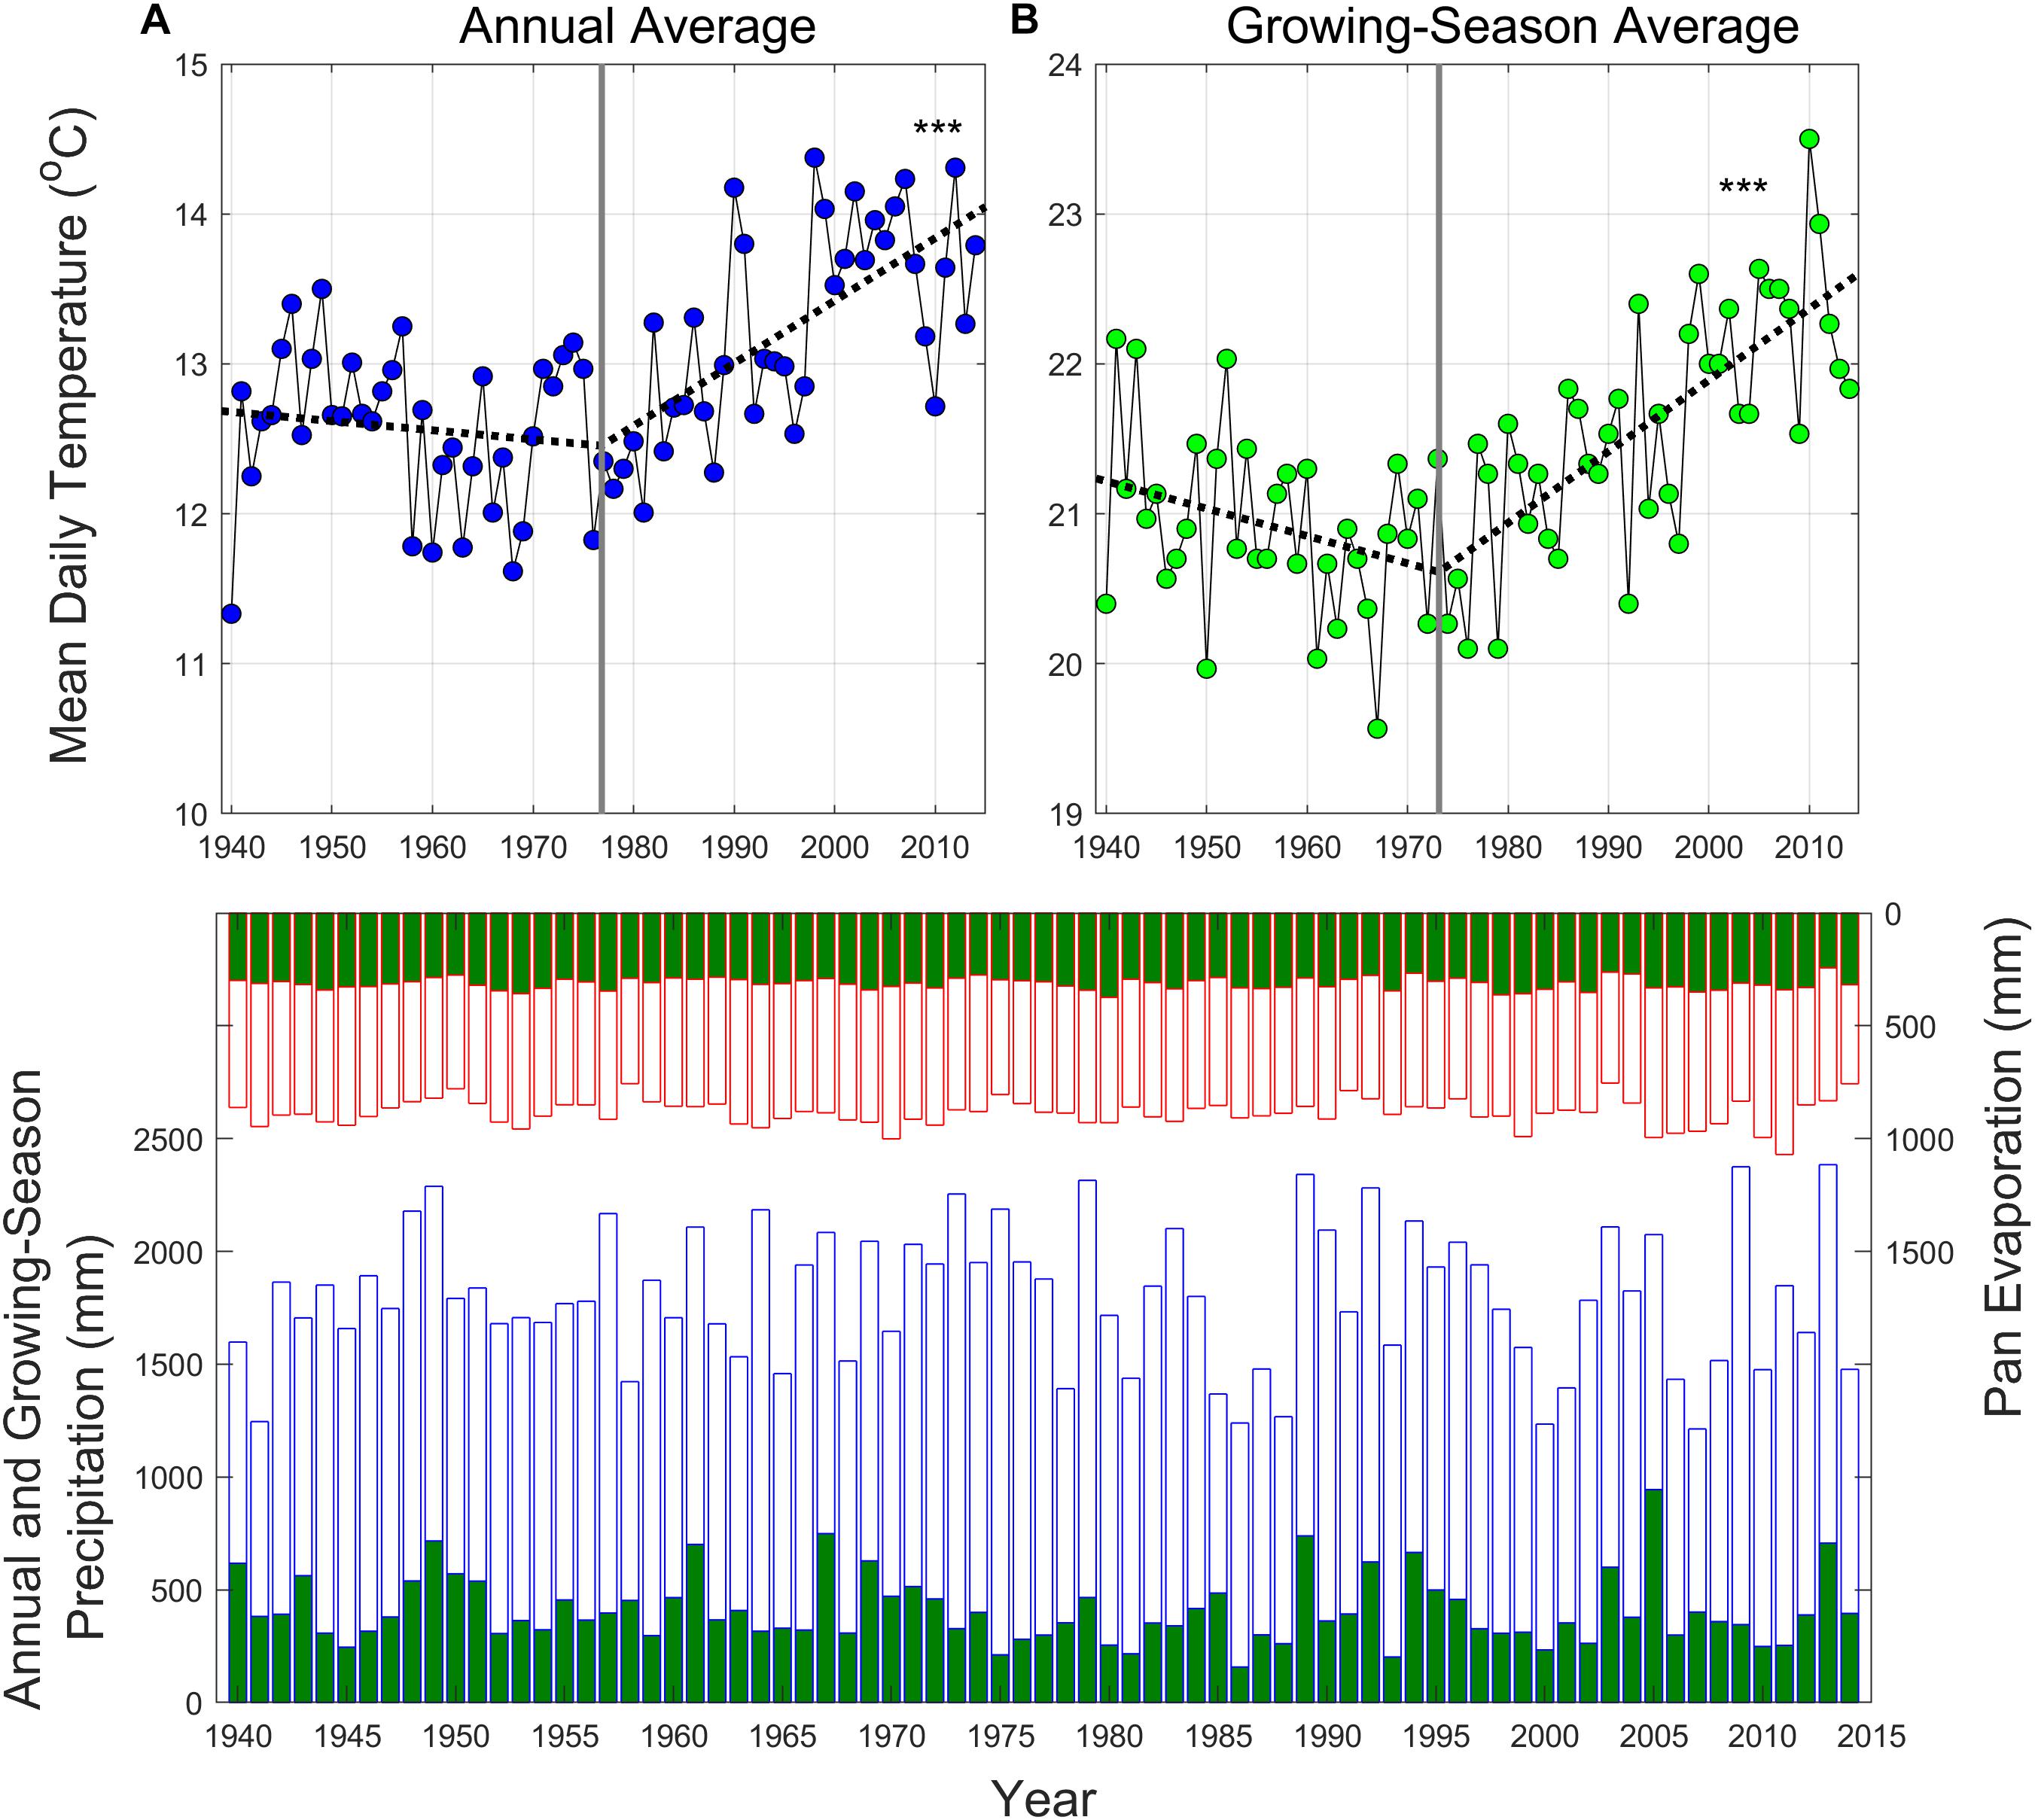
Figure 2. Upper panel: observed mean annual (A) and growing-season (B) temperatures at the base climate station (CS01) in the study site, calculated from mean daily temperature data. Growing season is defined as a period from June to August. Dashed lines correspond to a piecewise regression model, where vertical lines represent the break points. Bottom panel: annual (blue bars) and growing-season (green) precipitation and pan evaporation (reverse y-axis; red bars) at the base climate station (RG06; 685 m) in the study site. ***p < 0.005.
We also performed a recession slope analysis from the long-term daily streamflow to characterize the recession behavior of hydrographs (Brutsaert and Nieber, 1977). The observed recession slopes (−dQ/dt) were plotted with the daily stream discharge (Q) using a power function (Supplementary Figure S2) as follows:
These two recession parameters (a and b) represent the steepness and non-linearity of the recession curve, reflecting hydraulic properties and connectivity of draining aquifers (Rupp and Selker, 2006b). We applied the recession slope analyses for days of decreasing flows without precipitation during the peak growing season. We also applied the recession analyses with 3-year moving windows to ensure a sufficient number of recession periods for the analyses. In this study, the “scaled-dt” recession slope analysis was used, which allows time intervals (dt) adjusted based on -dQ values (Rupp and Selker, 2006a). To characterize low flow regimes, we also employed the widely-used low-flow index, n-day m-year low flow (nQm), defined as the lowest average flows that occur for a consecutive n-day period at the recurrence interval of m years (Smakhtin, 2001). We performed both Mann-Kendall and Spearman’s rho tests with the null hypothesis of trend absence in all time-series data. We also adjusted the sample sizes when we found significant first-order positive autocorrelation (p < 0.05), based on Dawdy and Matalas (1964).
Landsat Thematic Mapper (TM) Dataset
To estimate long-term vegetation patterns at the watershed scale, we analyzed fifty-seven cloud-free summer Landsat Thematic Mapper (TM) images (June–August) at the five reference headwater catchments (WS02, WS14, WS18, WS27, and WS36; Figure 1 and Table 1) between 1984 and 2011. Landsat TM, initially launched in 1984, provides a nearly three-decade multispectral image record, and was used to estimate changes in landscape vegetation pattern at a 30 m resolution. All images were standard level-1, terrain-corrected (L1T) products and checked manually for cloud contamination due to frequent rain events in the study site. A modified dark object subtraction (DOS) method with the effect of Rayleigh scattering was applied to correct atmospheric effects on surface reflectance (Song et al., 2001). Normalized Difference Vegetation Index (NDVI) was calculated as follows:
where RNIR and RRED are near-infrared (NIR) and red band reflectance. NDVI values tend to be non-linearly correlated with leaf area index values (Nemani et al., 1993; Chen and Cihlar, 1996), also observed in the study site (see Figure 4 in Hwang et al., 2009). NDVI is closely correlated to various vegetation biophysical parameters (e.g., leaf area, aboveground biomass, etc.) across different ecosystems (Tucker, 1979; Asrar et al., 1984; Sellers, 1985), and effectively removes much of the multiplicative noise by illumination differences and topographic variation in complex terrain (Huete et al., 2002). Although NDVI is not a direct measure of ecosystem water use or carbon uptake, it is linearly related to the fraction of absorbed photosynthetically active radiation, and thus the energy input into the system (e.g., Song et al., 2015).
Characterization of Watershed-Scale Vegetation Dynamics
We used the NDVI data to estimate long-term vegetation dynamics at all reference (i.e., not harvested or manipulated since the 1920s) headwater catchments in the study site, located at different combinations of aspect and elevation (Figure 1 and Table 1). We first calculated mean values of NDVI separately at upslope and downslope positions of each study watershed. Upslope and downslope positions were determined based on upslope contributing area (UCA) (Erskine et al., 2006). We calculated UCA from 6.1-m (20 ft) LiDAR elevation data with a D-infinity method (Whitebox Geospatial Analysis Tools)1, allowing flow to be proportioned between two downslope pixels to the steepest topographic gradient under the assumption of the same hydraulic gradient (Tarboton, 1997). This UCA map was later aggregated to 30-m Landsat resolution, and the 75th percentile of the UCA distribution was applied to classify upslope and downslope pixels for each watershed (Figure 1).
Although the objective of atmospheric correction is to align multi-temporal images on the same radiometric scale, it is almost impossible to consider the full vertical profiles of atmospheric transmissivity in the study site as scene-based atmospheric correction cannot consider small-scale topoclimate variations in rugged terrain, often featured by mountain fogs and aerosol conditions (Song et al., 2001). Therefore, another spatial normalization was performed between upslope and downslope NDVI values at each watershed to effectively cancel out most of the remnant atmospheric effects assuming that atmospheric conditions between downslope and upslope within a catchment are not different. We calculated the ratio of normalized difference vegetation index (NDVI) between each catchment’s downslope and upslope components (NDVIdownslope/NDVIupslope) to characterize the vegetation patterns along the hydrologic flow paths as ratio values are less sensitive to inter-image differences in atmospheric corrections.
Long-Term Tree Basal Area and Leaf Litter Data
Long-term soil water content is a core dataset in the Coweeta Long-Term Ecological Research (LTER) program (Data ID 1046), measured in three 80-by-80 m gradient plots established along an elevation gradient in 1991. These plots are classified as upslope (SITE 118), midslope (SITE 318), and downslope (SITE 218) based on the topography in the field (Figure 1). Volumetric soil moisture was continuously measured every 15 min at two locations and two depths (0–30 cm and 30–60 cm) in these plots by time domain reflectometer (TDR) probes (CS615; Campbell Scientific, Logan, UT, United States) (Coweeta LTER Data ID 1023). The 60-cm depth of measurements is slightly less than the measured rooting depth in the study site (Hales et al., 2009). The cumulative distributions of long-term observed volumetric water content are consistent with classification of these plots as up-, down-, and midslope, as they show clear differences in soil moisture dynamics at shallow soils (0–60 cm) (Supplementary Figure S7). Note that SITE 318 (midslope) is generally classified as an upslope topographic position in the remote sensing analyses above (see Figure 1).
There are clear transitions in vegetation community types along these gradient plots, mixed oak/pine upslope, mixed oak/hickory at midslope, and cove hardwood species downslope (Supplementary Table S1 and Figure S8), which represent three typical forest community types at low- to mid-elevation ranges in the study site (Day et al., 1988; Bolstad et al., 1998). At these three gradient plots, tree census was performed approximately every 2 years since 1991 in smaller sub-plots (40 by 20 m). A whole tree census within the plots has been conducted since 1998. Diameter at breast height (DBH) of all trees (over 2 m height), and all new and dead trees were recorded at each census, although shrubs species (e.g., Rhododendron maximum) were excluded. Annual basal area increment rates were calculated for all measured trees, and aggregated into the plot scale only for live trees. To compare with the catchment-scale vegetation metrics above, the ratio of downslope to upslope total basal area was computed for each census measurement.
Leaf litter was collected from ten 0.92-m by 0.92-m leaf collectors in each gradient plot since 1992 (Sites 118, 218, and 318; n = 30 total). Collectors were located near the middle of each plot along two 40 m transects that follow the contour of the slope. Litter was collected on a quarterly basis and monthly in the autumn. Leaf litter was oven dried at 65°C until a constant mass was obtained, and then weighed to the nearest 0.01 g. Annual litterfall was estimated as the sum of dried leaf litter from ten collectors during April to March. Litter mass was converted to leaf area index (LAI; m2 m–2) using specific leaf area (SLA; m2 kg–1) values at each plot. Mean plot SLA values were from the weighted SLA values with species basal area information at each site (Supplementary Table S2). We calculated the mean litterfall and leaf area values at plot (n = 10) and watershed scales (n = 30), as well as the litterfall change rates at each collector using a simple linear regression (Supplementary Figure S9). Lastly, the ratios of leaf area downslope to upslope and watershed-scale standard deviations were computed each year to compare with the catchment-scale vegetation metrics above. More details on plot establishment, basal area, and litterfall sampling can be found in Knoepp et al. (2018).
Canopy Conductance Data From Sap Flux Measurements
To examine soil moisture control on stomatal dynamics at different topographic positions between dry and wet years, we reanalyzed the published data of Ford et al. (2011) in the context of soil moisture deficit (Supplementary Figure S3). Canopy conductance (Gc, mmol H2O m–2 s–1) of 30 hardwood trees was estimated from sap flux measurements for four dominant hardwood species, including Liriodendron tulipifera (tulip poplar), Carya spp. (hickory), Q. montata (chestnut oak), and Q. rubra (northern red oak), over 3 years (2004–2006) (Supplementary Figure S3). These trees were located adjacent to the midslope (SITE 318; n = 15 trees) and downslope (SITE 218; n = 15 trees) plots within WS18. More details of field methods and post-processing are available in Ford et al. (2011) and Hawthorne and Miniat (2018).
We classified the 3 years into normal (2004), wet (2005), and dry (2006) years, based on total precipitation amount and its seasonal patterns (Supplementary Figure S3) and observed soil moisture ranges between days of year (DOY) 130 and 280 (Supplementary Figure S7). We converted volumetric soil moisture (SM) to a normalized soil moisture deficit (SMD; dimensionless) each year based on max and min ranges to align relative values seasonally.
We regressed the mean daytime Gc values with SMD separately at the mid- and downslope positions each year.
Results
Long-Term Climate and Hydrology
Long-term temperature data showed that this study site has experienced increases both in mean annual and growing-season air temperature since the mid-1970s (Figure 2; p < 0.005). Since 1977 and 1973, mean annual and growing-season temperatures have been increasing at rates of 0.42 and 0.48°C per decade, respectively. Prior to the increases, slight cooling trends dominated for both series since early 1940s. Total annual and growing-season precipitation had no trend over time (Figure 2), however, inter-annual and seasonal variability has been increasing, featured by more frequent and severe growing season droughts (Figure 2). Coincident with the start of increasing air temperature trends, the year 1973 was henceforth used as a starting point for time-series analyses of growing-season hydrologic metrics from the long-term streamflow records.
Temperature patterns were paralleled by long-term trends in three hydrologic metrics during the growing season. ET and HI increased over time, while RR decreased (Figure 3). In general, the temporal trends were more pronounced at the two low-elevation catchments (WS18 and WS14; p < 0.05) than at the high-elevation catchment (WS27), while the direction of the trends remained the same. Note that the similar temporal patterns were also reported in other two catchments (WS02 and WS36) (Figure 3 in Caldwell et al., 2016). The observed recession slopes (-dQ/dt) given the discharge (Q) also got steepened and became more linear over the same period, featured by significant trends in two recession parameters (a and b; Supplementary Figure S4) for the two low-elevation catchments. Like the three hydrologic metrics above (Figure 3), these trends were significant in the two-low elevation catchments (p < 0.05), while trends were the same across all catchments. This indicates that, over time, these watersheds had a more linear storage-discharge relationship during low flow periods. Coinciding with the recent increases in temperatures, there are also lower and more frequent 10-day average low flow periods (Supplementary Figure S5). The level of low flow dynamics was log-linearly correlated with observed root zone soil moisture (0–60 cm) patterns in the two reference catchments (WS18 and WS27; Supplementary Figure S6). All these long-term hydrologic metrics are generally following the long-term temperature trends, slight cooling until early 1970s and warming afterward.
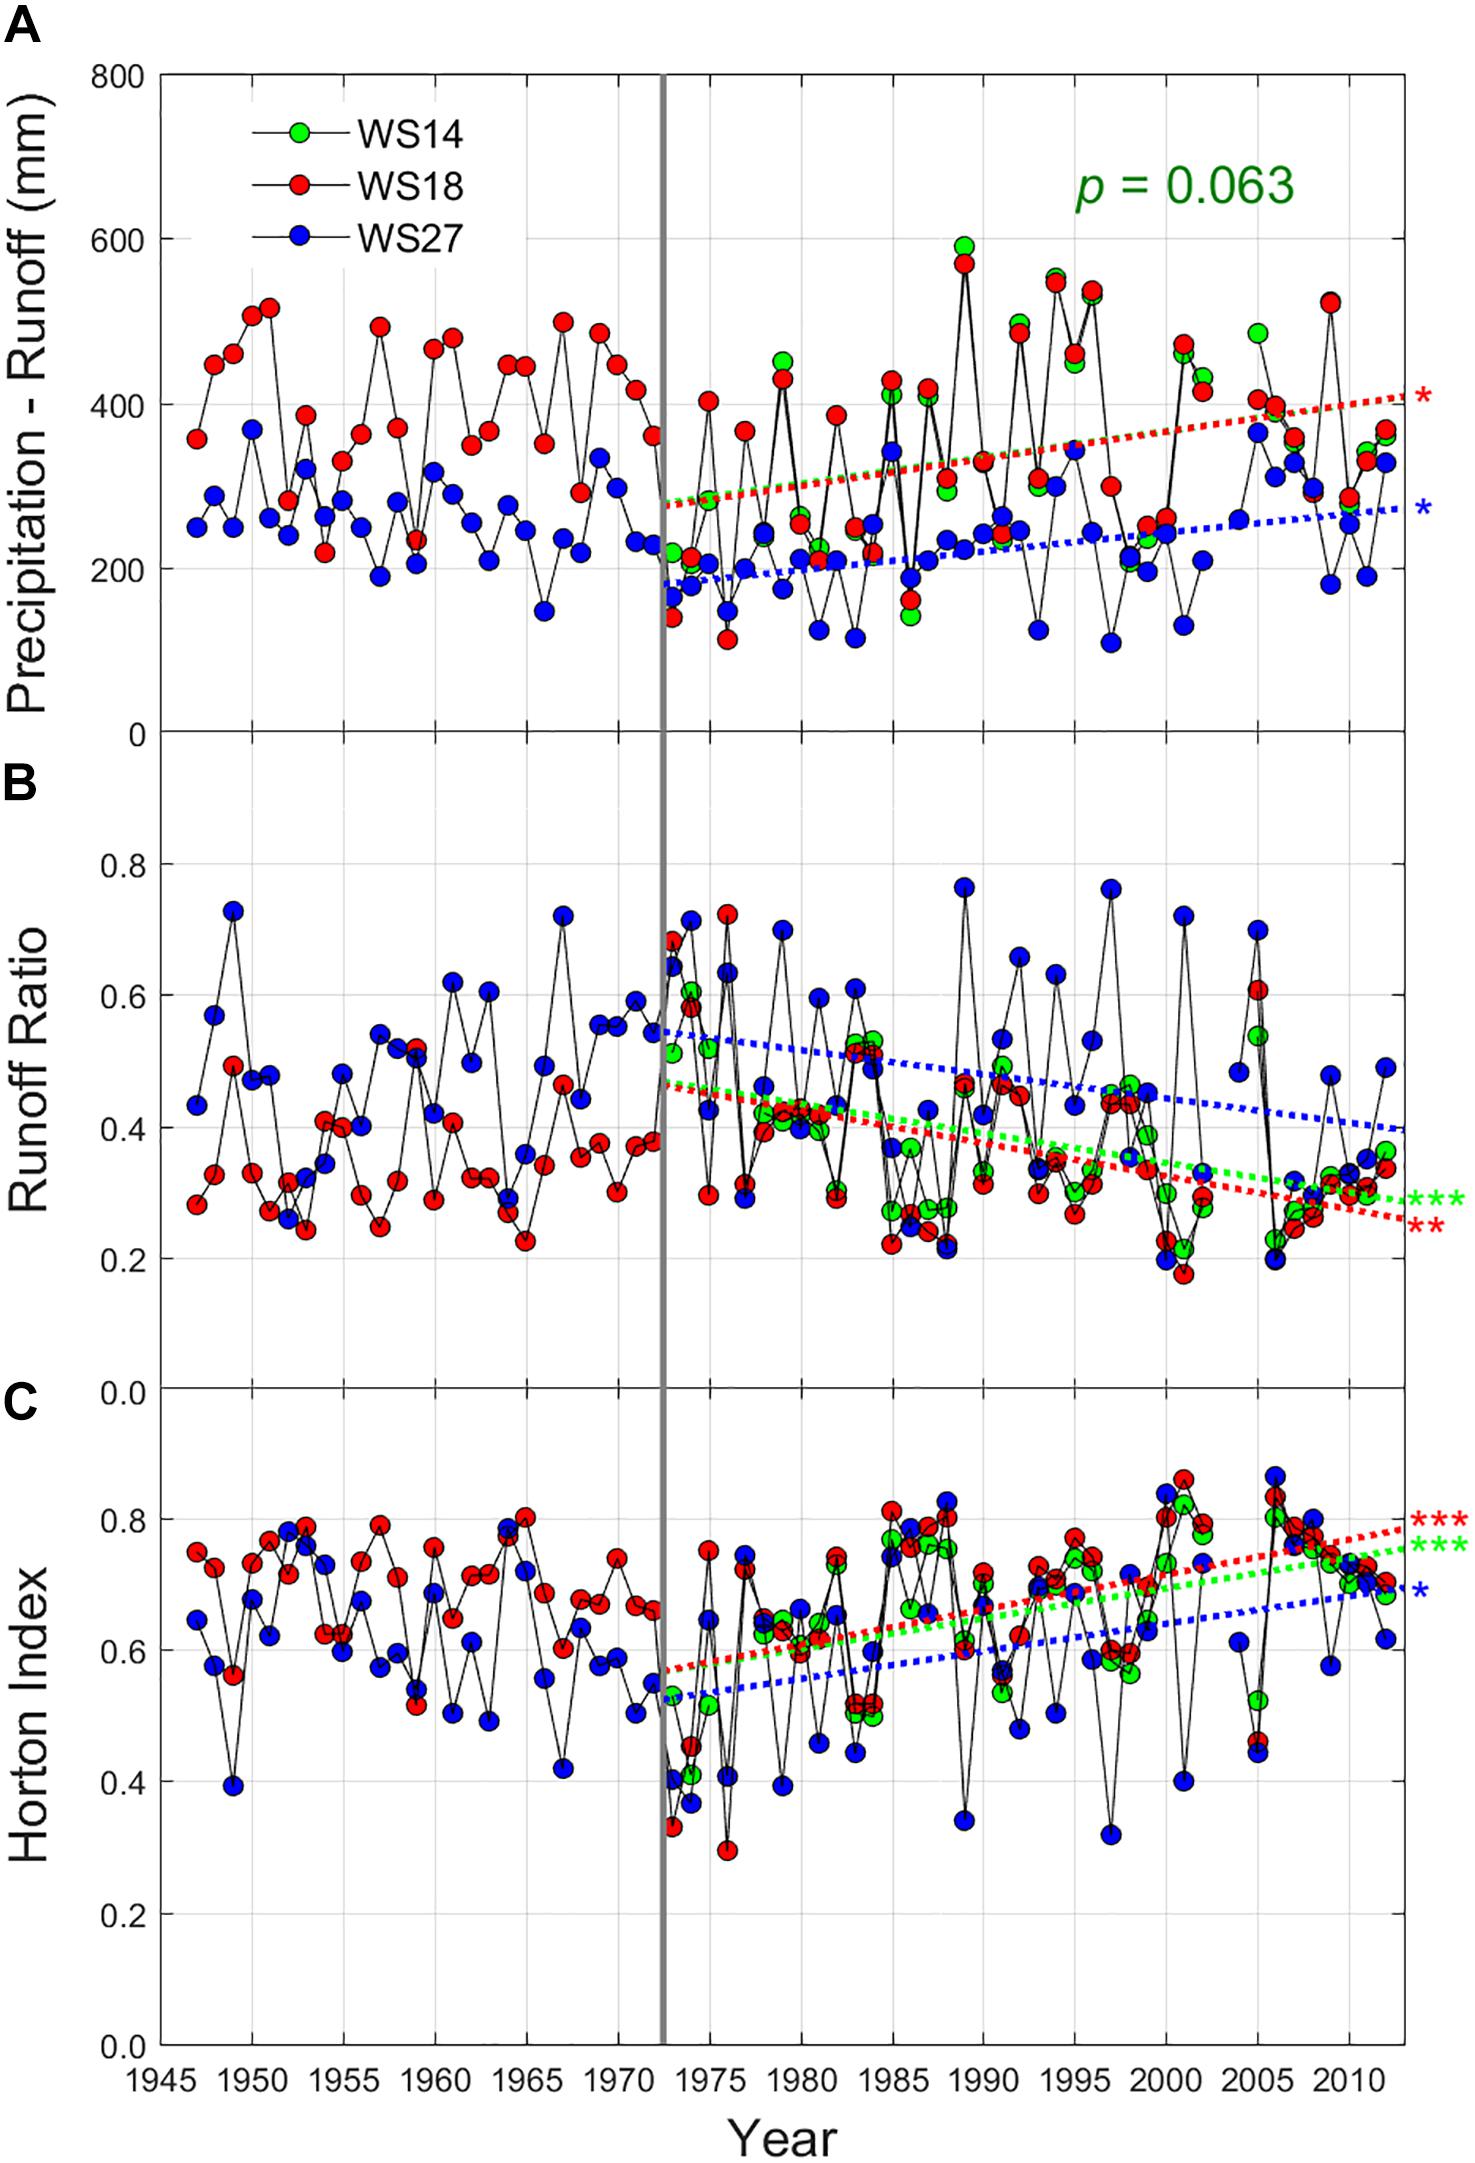
Figure 3. Long-term patterns of growing season (A) evapotranspiration (P–Q), (B) runoff ratio (Q/P), and (C) Horton index [(P–Q)/(P–S)] at three headwater catchments in the study site (WS14 – green, WS18 – red, and WS27 – blue). Peak growing season is defined as the period from June through September at two low elevation catchments (WS14 and WS18), but from June through August for a high elevation catchment (WS27). These linear fits were analyzed from 1973, which break point was estimated from the long-term growing season temperature trend (Figure 2). The significance levels were determined from linear regressions while the similar significances were found in Spearman’s rho tests with the null hypothesis of trend absence. P: precipitation, Q: runoff, and S: storm runoff. ***p < 0.005, **p < 0.01, and *p < 0.05.
Vegetation Patterns Between Upslope and Downslope
Average NDVI values at the upslope, downslope, and catchment scales did not show any significant trends over time (not shown here), even after the scene-based atmospheric correction. This might be due to the difficulty of atmospheric corrections in complex terrain, or saturation of NDVI at higher LAI in the study site (Myneni et al., 2002). The study site is featured by frequent fogs and localized mists, which could make atmospheric correction difficult. However, the NDVI ratio of down- to upslope topographic positions decreased over time for all catchments, approaching unity over the study period (Figure 4A). The standard deviation of NDVI decreased over time at three low-elevation catchments (WS02, WS14, and WS18; Figure 4B). These patterns were generally more pronounced in the low-elevation catchments, compared with the high-elevation catchments (WS27 and WS36) (Figure 1).
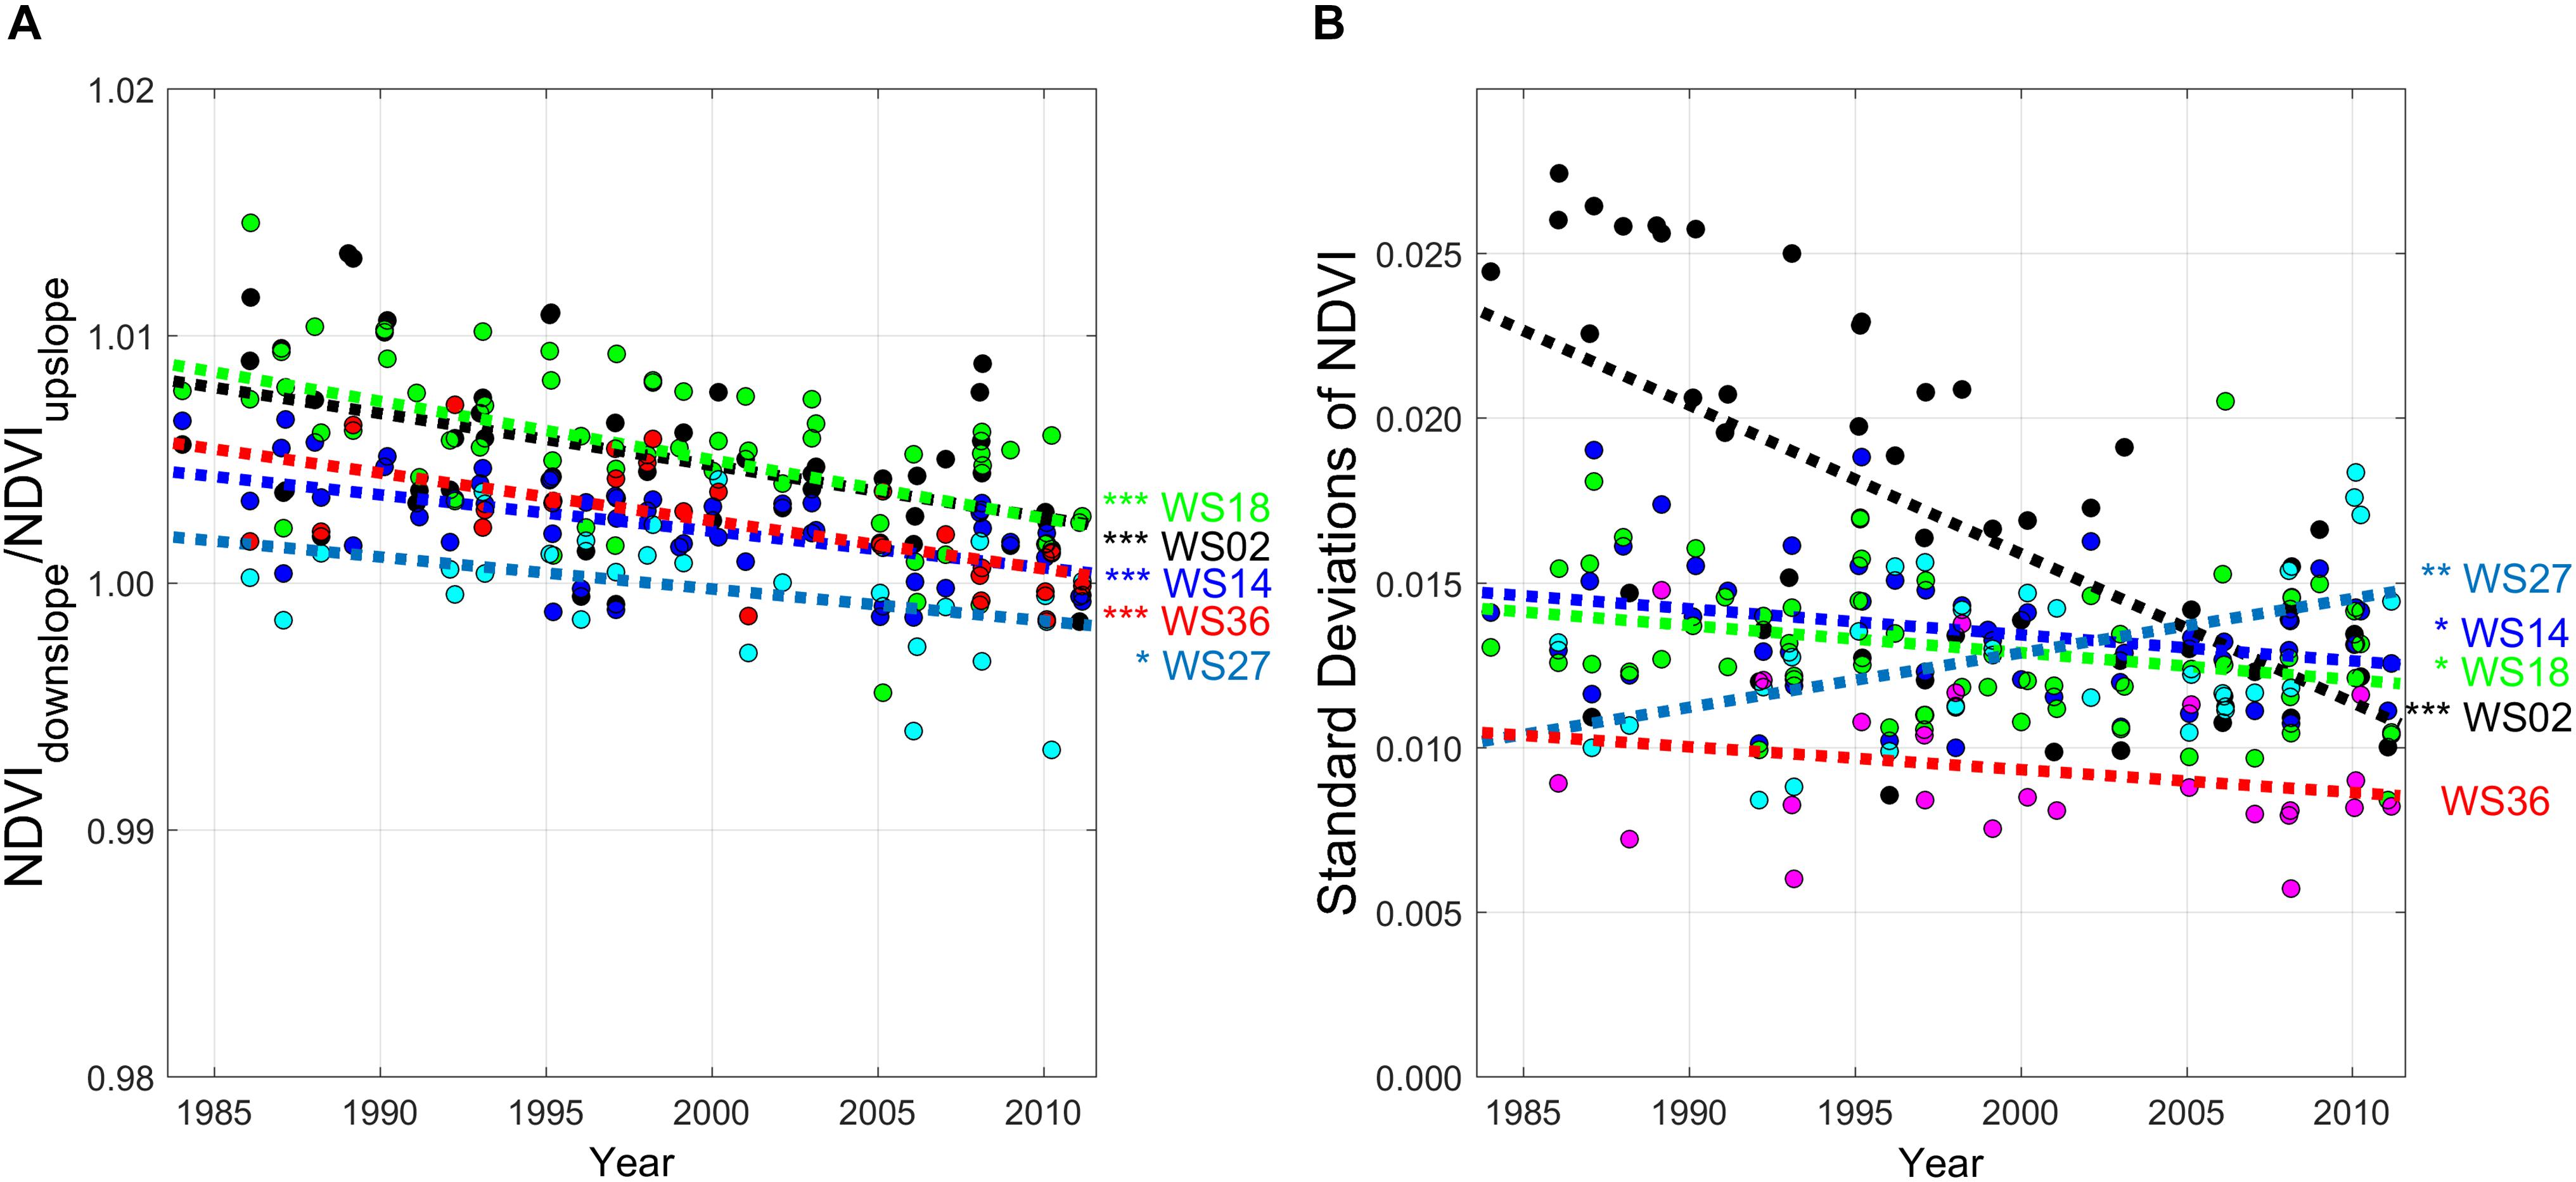
Figure 4. (A) Time-series of the ratios of Normalized Difference Vegetation Index (NDVI) downslope to upslope (NDVIdown/NDVIup), and (B) their standard deviations at a watershed scale. NDVI values were from Landsat Thematic Mapper (TM) images from 1984 to 2011 at five preserved headwater catchments (WS02 - black, WS14 - blue, WS18 - green, WS27 - cyan, and WS36 - red) in the study site (Coweeta Hydrologic Lab, North Carolina, United States). Each watershed was divided into upslope (75%) and downslope (25%) regions at the same resolution with Landsat TM based on the distribution of upslope contributing area (see Figure 1). The detailed site information is available in Table 1. ***p < 0.005, **p < 0.01, and *p < 0.05.
These remotely-sensed canopy patterns at the watershed scale generally coincided with the long-term plot measurements in WS18. Leaf area index (LAI) significantly increased over time only at the upslope topographic position since the early 1990s (Figure 5A; p < 0.01), with a general convergence in LAI among slope positions toward the end of the measurement period. Live tree basal area at the plot scale also generally increased over time in the up- and midslope positions, relative to downslope (Figure 5B); therefore, basal area increment rates monotonically decreased from upslope to downslope topographic positions (Figure 6A). Interestingly, inter-annual variation in basal area increment rates increased from up- to downslope plots (Figure 6A). Litterfall also increased over time more in the upslope than in midslope and downslope plots (Figure 6B and Supplementary Figure S9). Species-level basal area data showed that these divergent growth patterns between upslope and downslope have largely been driven by greater growth of oak and pine trees upslope/midslope and lesser growth of maple and birch trees downslope (Figure 5C). As a result, the down- to upslope ratios of leaf and basal areas also decreased (Figure 6C; p < 0.05 and p < 0.005, respectively), as well as the standard deviations of leaf area within the catchment (p < 0.005). Note that higher interannual variations of litterfall-based metrics were from wind conditions, and we removed 2003 data from the original data because the large wind blowouts were reported.
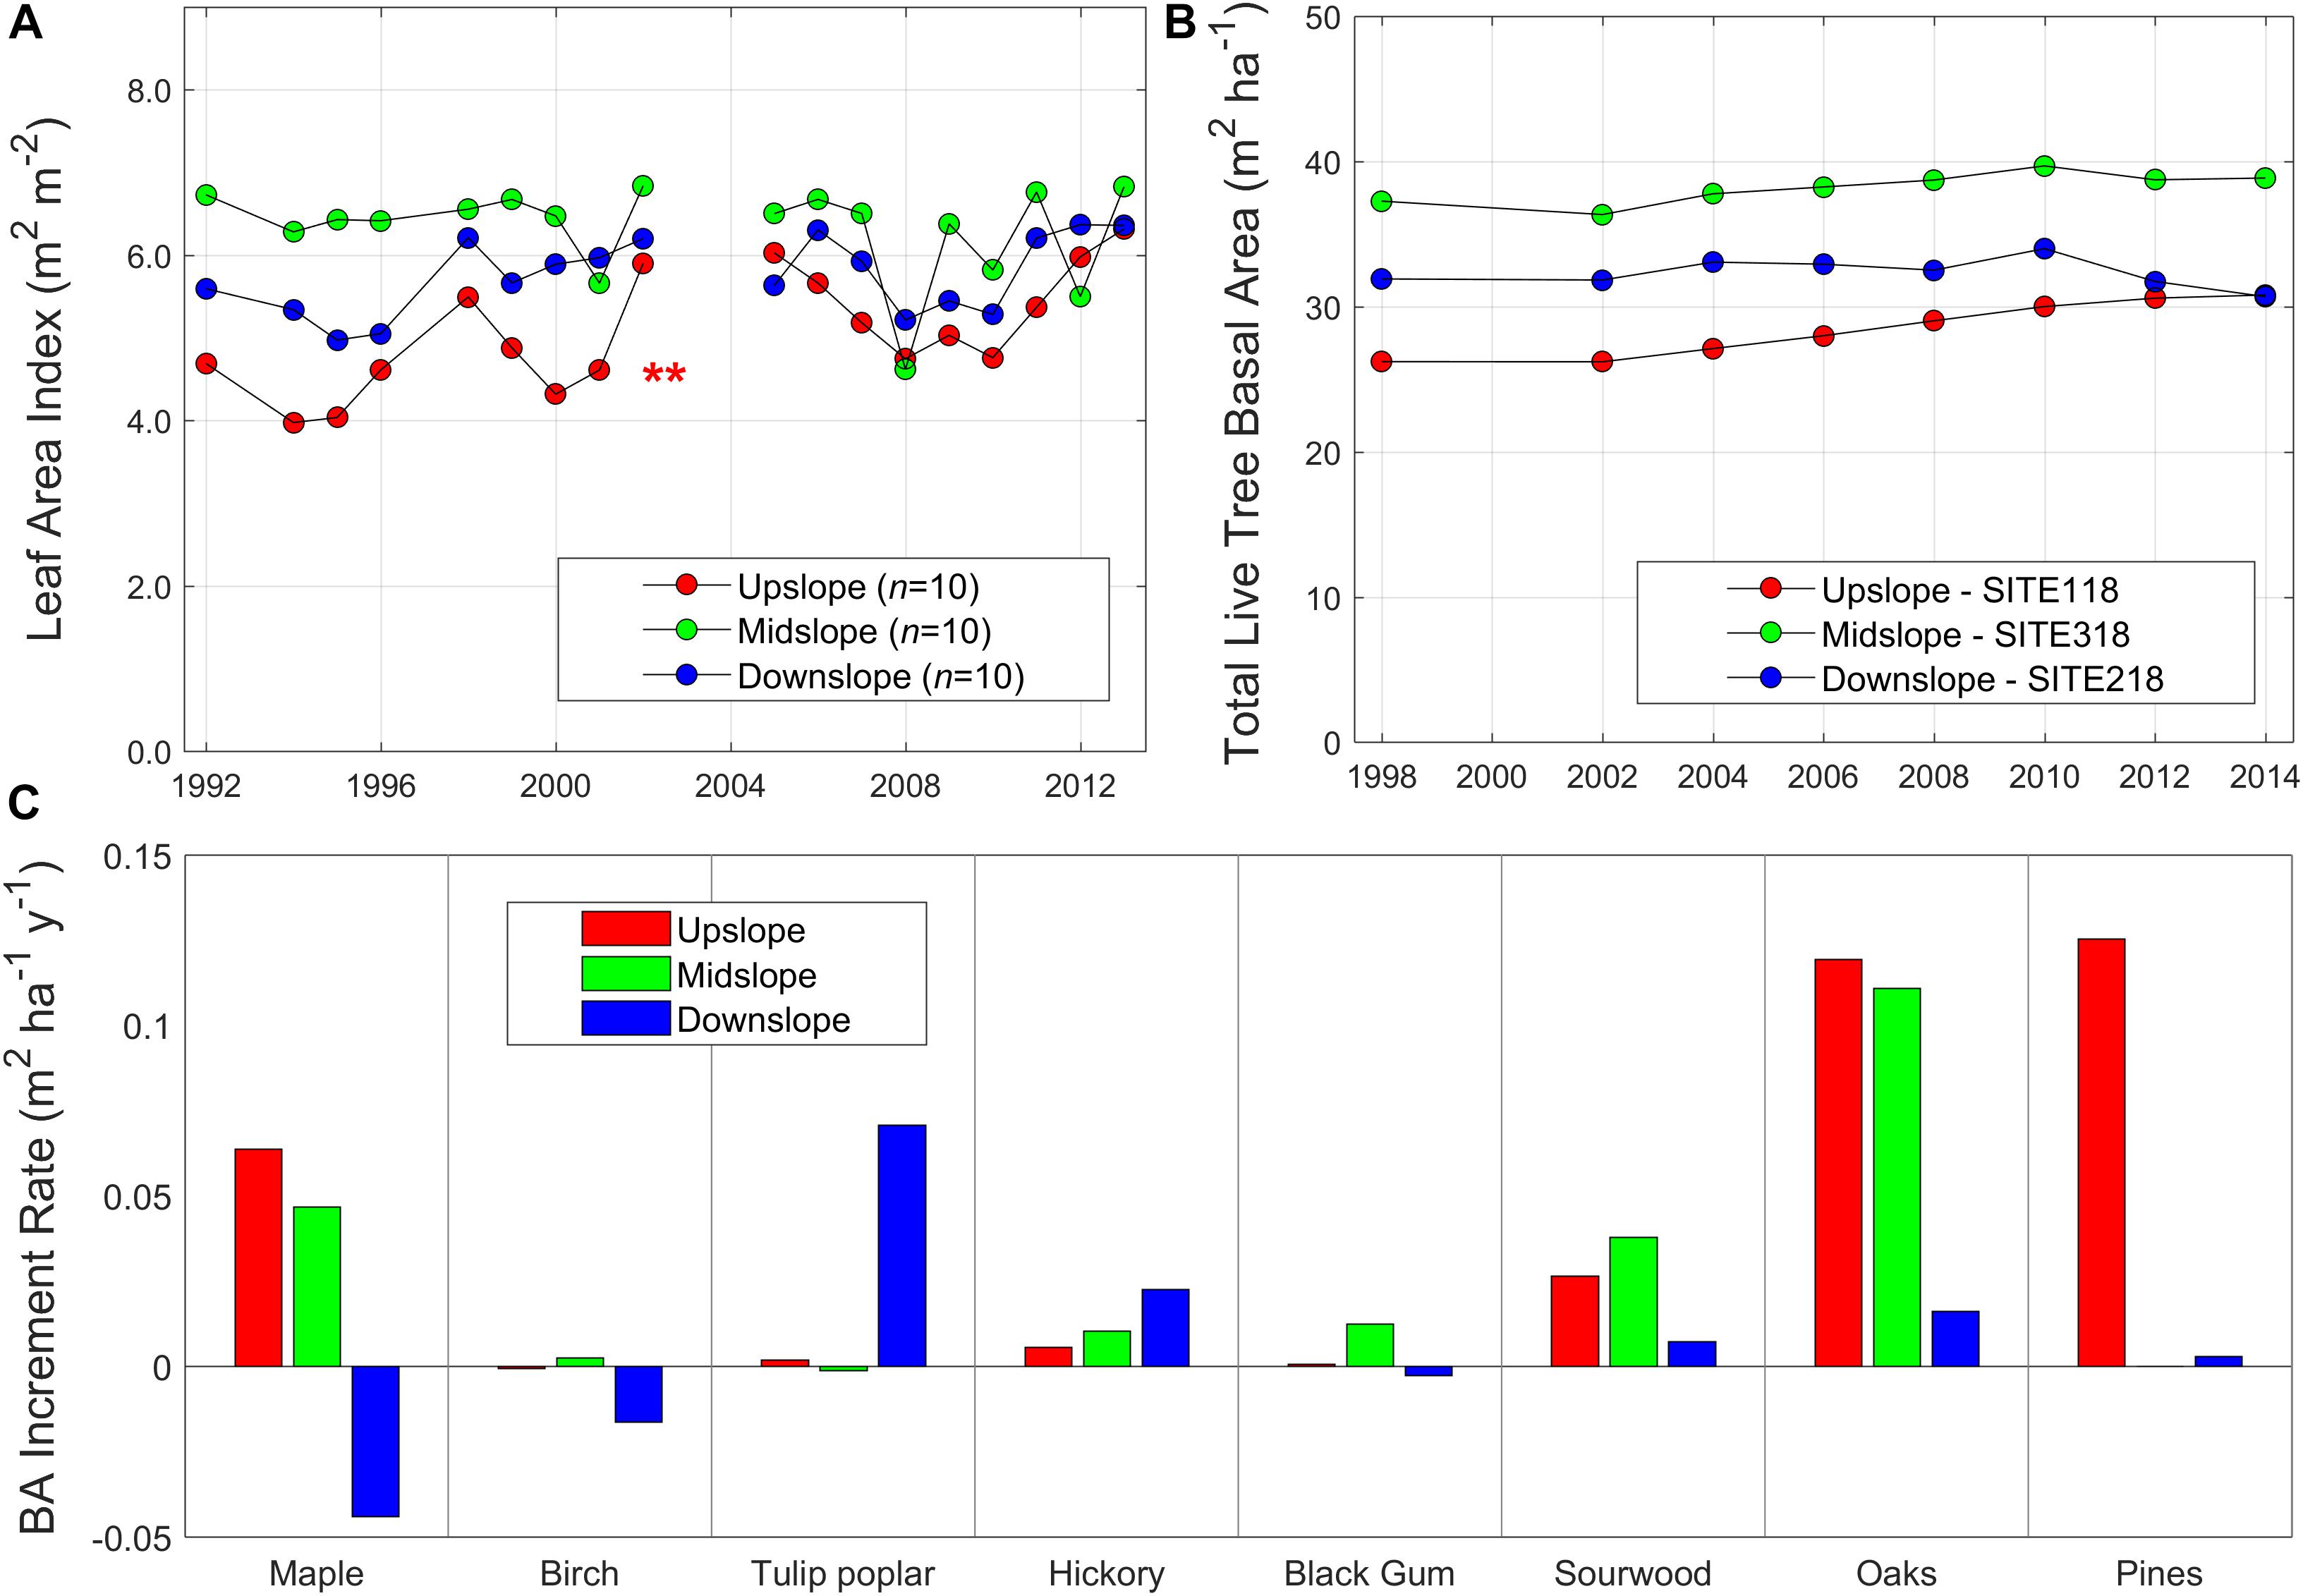
Figure 5. (A) Time series of leaf are index (LAI; m2 m–2) values (n = 10 each) and (B) total basal area (BA) (m2 ha–1) of all live trees from three gradient plots (upslope - SITE 118, midslope - SITE 318, and downslope - SITE 218; 80-by-80 m size) in the study site (WS18), and (C) total basal area change rates (m2 ha–1 y–1) of live trees. LAI values were calculated from total dried litter weight (Supplementary Figure S9) and site averaged specific leaf area values (Supplementary Table S2). Dry litter fall weights have been measured from 10 litter baskets at each plot every year since 1992 (except for 1993 and 1997). Total basal area has been measured since 1998 with roughly 2-year intervals (except for 2000). Scientific names are available in Supplementary Table S2. **p < 0.01.
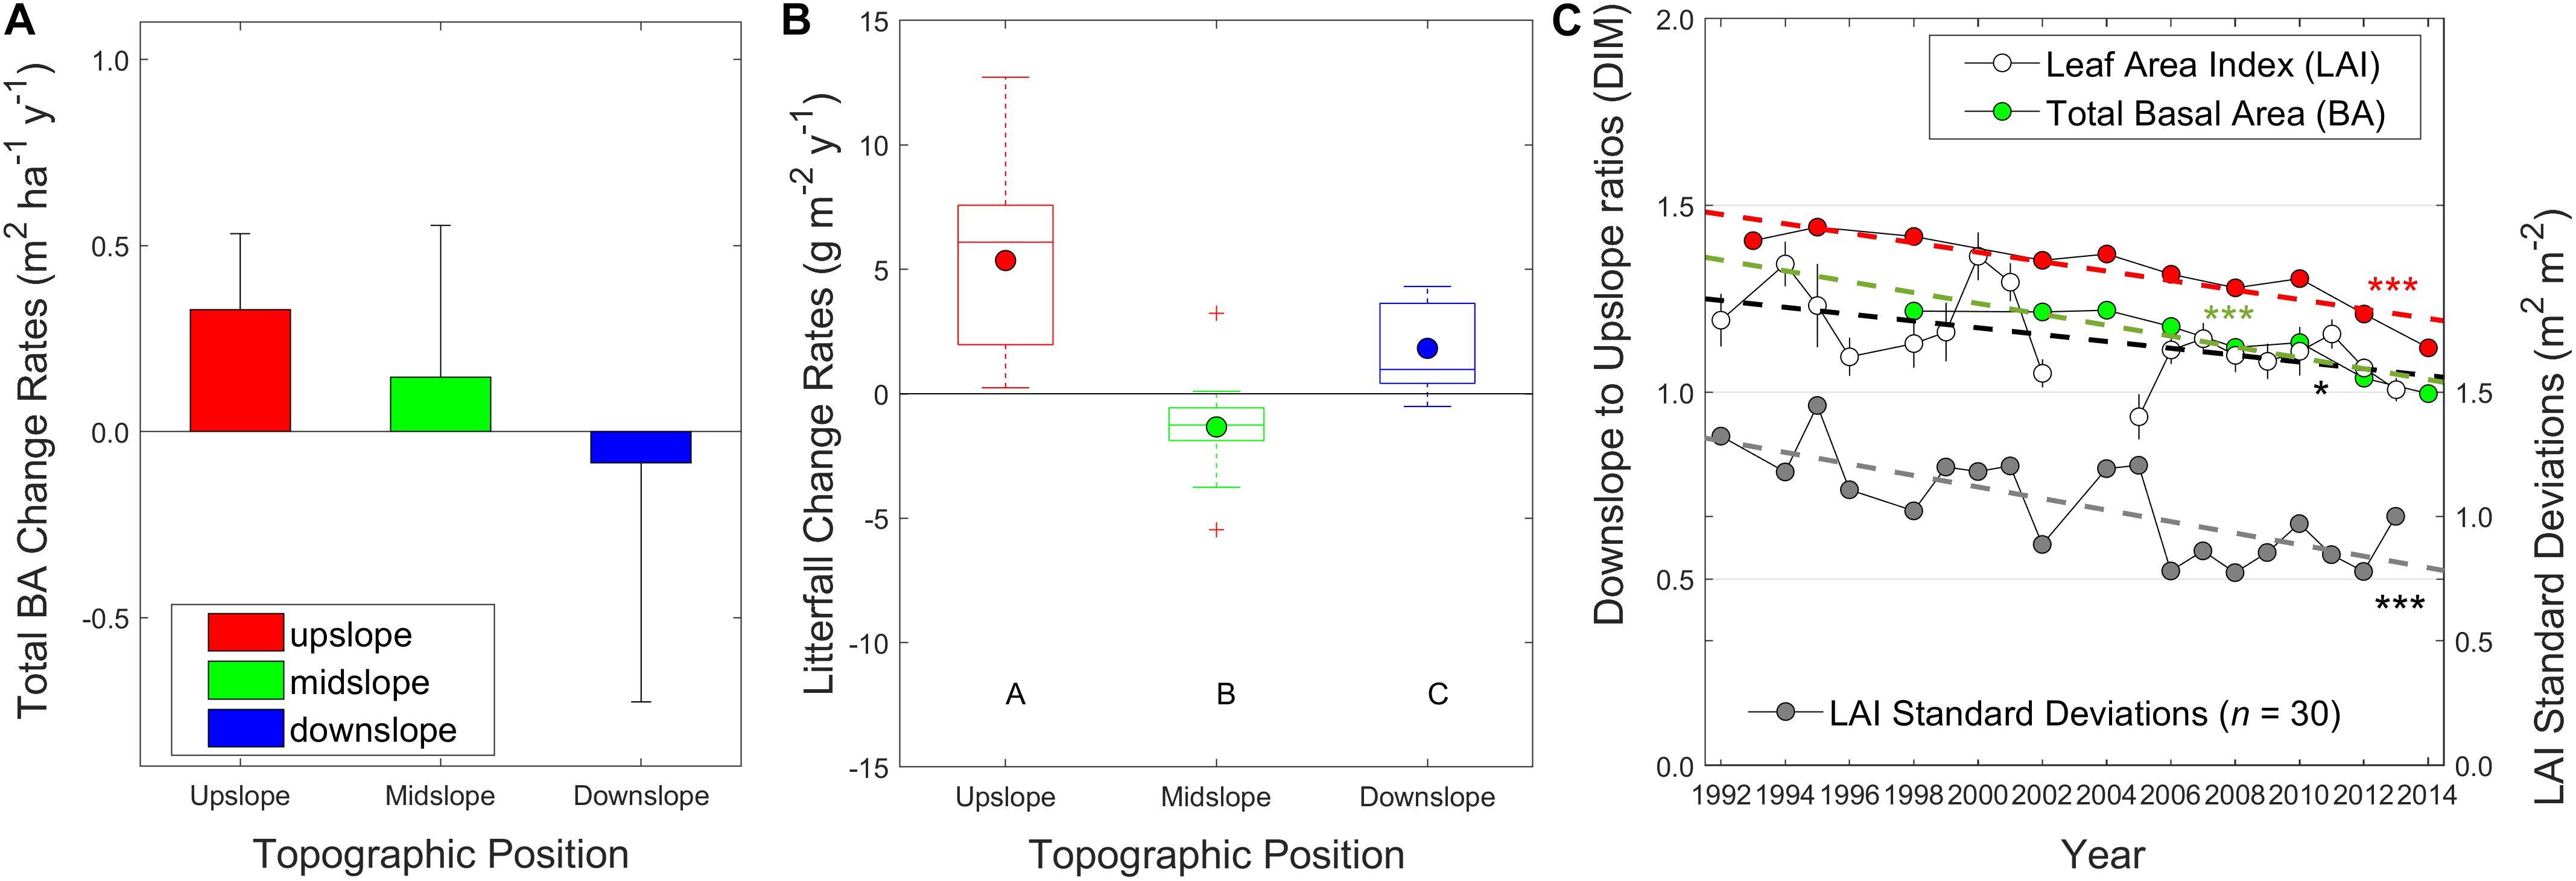
Figure 6. (A) Total basal area (BA) increment rates per year (m2 ha–1 y–1) from 1998 to 2014, and (B) Boxplots of litterfall increment rates (g m–2 y–1; n = 10 each; Supplementary Figure S9) at three 80-by-80 m gradient plots (upslope - red, midslope - green, and downslope - blue) in the watershed 18 (1992 to 2013) (Supplementary Table S1). Circles are mean values, while black crosses are outliers. (C) Ratios of downslope to upslope in total BA (green and red) and leaf area index (LAI – blank) values, and their standard deviations (gray). Basal area ratio values with red color were calculated from the 40-by-20 m subplots since 1992. Litterfall was collected from ten baskets at each plot, dried, weighted, and converted to LAI using site-averaged specific leaf area values and basal area information (Supplementary Table S2). Different letters (A–C) denote significant differences in the group means using an analysis of variance (ANOVA) test (p < 0.01). Note that error bars in the BA change rates represent interannual variability at the plot scale, while boxplots for litterfall and error bars of LAI values are from the ten sample plots at each landscape position. ***p < 0.005, **p < 0.01, and *p < 0.05.
Canopy Conductance
Soil moisture deficit (SMD) affected daytime Gc (Figure 7), but varied among species and between years and sites. As reported in Ford et al. (2011) and in Hawthorne and Miniat (2018), daytime Gc of more mesophytic tree species (e.g., tulip poplar) was far greater than that of more xerophytic trees (e.g., oaks) consistently across the sites and years (Figure 7). This indicates that the mesophytic trees downslope use much more water for daytime evapotranspiration than the xerophytic trees upslope (Supplementary Figure S3), also featured by greater daily soil moisture amplitudes from soil TDR measurements (Hawthorne and Miniat, 2018). However, shallow soils remained consistently wetter downslope than upslope even in dry years (Supplementary Figure S7) due to higher nighttime recharge (Hawthorne and Miniat, 2018).
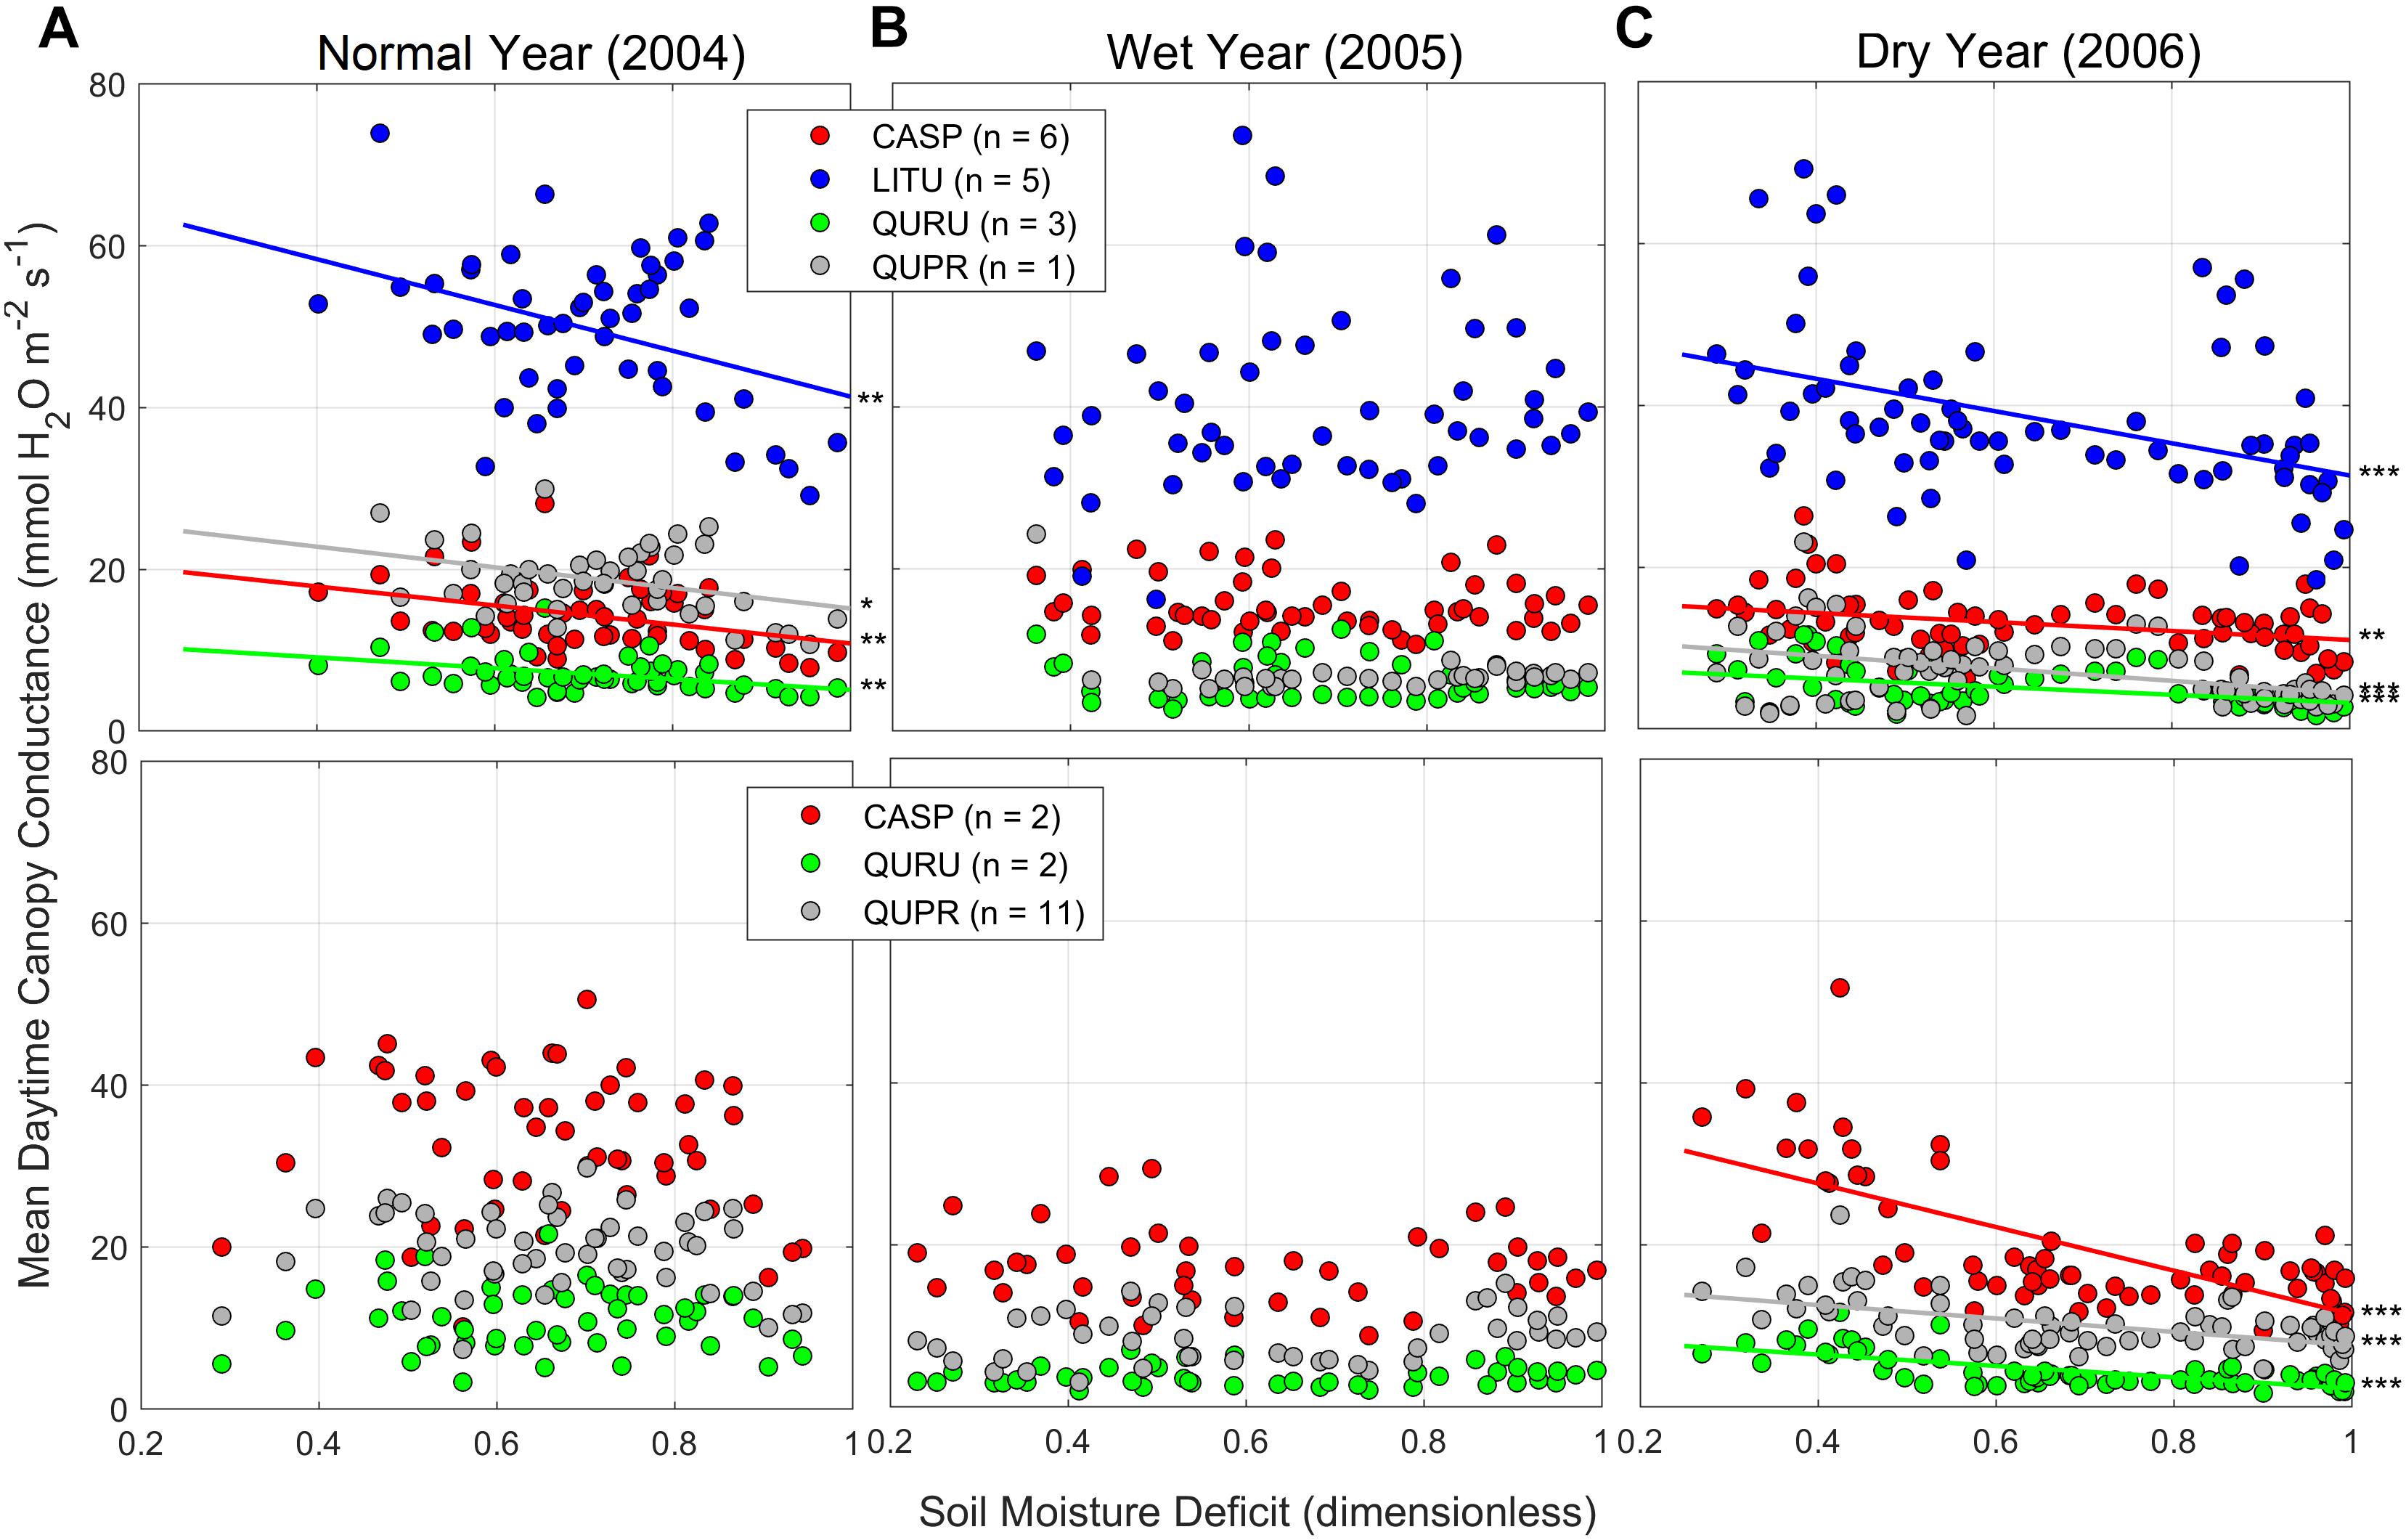
Figure 7. Mean daytime canopy conductance (Gc, mmol H2O m–2 s–1, left axis; Supplementary Figure S3) for trees in downslope (218: upper panel) and mid-slope (318: upper panel) plots in WS18 (85-year old low-elevation reference watershed) during (A) 2004 (normal year), (B) 2005 (wet year), and (c) 2006 (dry year) growing season. Soil moisture was measured at two locations and two depths (0–30 and 30–60 cm) in each plot on site (Supplementary Figure S7), used to calculate soil moisture deficit (SMD) each year [(SMmax–SM)/(SMmax–SMmin)]. Different species denoted with different colored symbols and lines: Liriodendron tulipifera (LITU), blue; Carya spp. (CASP), red; Quercus prinus (QUPR), gray; Q. rubra (QURU), green. For details, see Ford et al. (2011). ***p < 0.005, **p < 0.01, and *p < 0.05.
The sensitivity of Gc to SMD was greater in normal and dry years (2004 and 2006), compared to a wet year (2005). Interestingly, mesophytic tree species downslope showed greater sensitivity to SMD than xerophytic tree species upslope despite the downslope site having a consistently higher water content than midslope. Gc responded to SMD only at the downslope plot in a normal year (2004) (Figure 7A), while this effect was observed at both downslope and midslope in a dry year (2006). In addition, tulip poplar and hickory showed greater declines in Gc with increasing SMD than oak species (mostly p < 0.005), which indicates typical isohydric behavior.
Discussion and Conclusion
In this study, we first show that the evapotranspiration has increased, and streamflow yield given precipitation has decreased in the three reference catchments during the growing season using mass balance-based hydrologic metrics (ET, RR and HI; Figure 3). Significance levels were greater for the two normalized hydrologic metrics, RR and HI, than ET, suggesting that these two metrics may better capture vegetation water use patterns with normalizing precipitation variability. These long-term trends in three hydrologic metrics effectively represent increasing localized forest water use and decreasing runoff generation given precipitation over the period. Second, we show that hydrograph declines are becoming steeper and more linear over time through empirical recession slope analyses (Supplementary Figure S4). The late recession behavior is mostly contributed by slow response units of the catchment (mostly upslope portions with longer flow path) (Woods and Sivapalan, 1997; Li and Sivapalan, 2011), and shallow subsurface flow is a main source of sustained base flow in the study site (Hewlett and Hibbert, 1963). Therefore, steeper declines and more linear responses in hydrograph recession suggest that the upslope regions are potentially less hydrologically connected to streams over time (Harman et al., 2009; McGuire and McDonnell, 2010; Hwang et al., 2012). Third, low streamflow dynamics also showed more frequent and prolonged drought periods during the growing season over time, which closely corresponded with root zone soil moisture patterns in the study watersheds. This suggests that despite relatively high annual precipitation (ca. 1,800 mm at low elevations), the study watersheds are moving toward seasonally-drier conditions with greater canopy water use, lower runoff production given precipitation, and potentially lower downslope subsidy.
More frequent and prolonged dry periods could be also partially explained by the increased seasonal and interannual precipitation variability over time. This site has been characterized by an increasing length of inter-storm periods and total rainfall amounts per storm over the period of warming (Laseter et al., 2012; Burt et al., 2018). However, changing precipitation patterns cannot fully explain the increasing ET signals in that more frequent and less intense rainfall usually provides optimal conditions for vegetation water use (both transpiration and interception), and our site is experiencing the opposite. In addition, stormflow dynamics in the study watersheds are characterized by threshold behavior that is a combined function of antecedent soil moisture and storm precipitation (Scaife and Band, 2017); therefore, greater rainfall amounts per storm could lead to higher streamflow generation by subsurface stormflow. Furthermore, pan evaporation has not increased in the study site with warming (Figure 2C), thus atmospheric forcing cannot explain the increasing ET trends in hydrologic records (Roderick and Farquhar, 2002). Therefore, increasing ET signals may be better explained by vegetation responses to changing climate and ongoing forest mesophication (Creed et al., 2014; Caldwell et al., 2016; Hwang et al., 2018; Kim et al., 2018) rather than directly driven by climate forcing variables.
Leaf area patterns have been homogenized along hydrologic flow paths over time (approaching the unity) in all the study catchments, as shown in the long-term remote sensing (Figure 4) and supported by long-term field data in one catchment (Figure 5). Although the ratios of NDVI values decreased <1% over time, there are two main reasons why these signals are not trivial. First, the NDVI metrics from Landsat imagery were from aggregated greenness signals at a 30-m resolution (Hwang et al., 2011a), which may provide inaccurate representations both in topographic and vegetation classifications between upslope and downslope positions (Figure 1). Second, the percent changes in NDVI values should be interpreted as greater changes in LAI values due to the non-linear relationship between NDVI and LAI values in the study site (see Figure 4 in Hwang et al., 2009). Our field-based basal area increment and leaf area index data also showed that the vegetation upslope has grown more than downslope vegetation at least 20% in the similar ratio metrics in the basal area and LAI datasets (Figure 6C), as well as the standard deviations. The homogenization patterns were also more statistically significant at the drier low elevation catchments (WS02, WS14, and WS18; Figure 4) where we also had more significant seasonal drying signals in streamflow dynamics (Figure 3), compared to the wetter high elevation catchments (WS27 and WS36). WS27 might show slightly different patterns both in the NDVI ratios and standard deviations (Figure 4) possibly due to the damage by an ice storm in 2006 at high elevations (>1200 m), reflected in long-term basal area and litterfall data (not shown here).
The xerophytic trees upslope showed greater and more consistent growth over time, while mesophytic trees downslope showed lower growth with larger inter-annual variation (Figure 6). The canopy conductance of the trees downslope also showed greater declines and sensitivity to relative soil moisture deficit than the trees upslope (Figure 7). In other words, mesophytic trees downslope behaved more isohydrically, while xerophytic trees upslope showed typical anisohydric behavior under the moderate drought condition. Although shallow soils remained consistently wetter downslope than upslope, even in dry years (Supplementary Figure S7), vegetation downslope was more responsive to mild drought stress than upslope. This suggests that trees downslope may be experiencing more frequent drought stress and subsequent lower growth due to combined effect of frequent droughts, more water use by vegetation upslope, and potentially lower downslope subsidy over time.
A recent study also showed the strong dependency of vegetation downslope on upslope water subsidy in the study site. Hawthorne and Miniat (2018) showed that despite greater transpiration, there was greater overnight recharge of soil moisture in the downslope plot, driven by downslope flow or hydraulic redistribution. This may indicate the strong dependency of vegetation downslope on upslope water subsidy through lateral hydrologic redistribution, shown to have been potentially decreasing over time in long-term hydrologic records above. This also suggests that emergent decreases in hydrologic subsidy to downslope areas over time might be driven by both changing precipitation patterns, forest mesophication (more mesophytic trees), and subsequent increased ET mostly by up- and midslope tree communities, which occupy major portions of watershed landscapes (Day et al., 1988). Recently, Caldwell et al. (2016) also attributed declining water yield to a shift toward mesophytic dominance in the study site that uses more water than xerophytic oak species (Figure 7).
The divergent growth responses of trees between up- and downslope may be explained by stomatal responses to mild drought stress across the forest landscape (Meinzer et al., 2016). A recent study in the study site also demonstrated that anisohydric oaks in the upslope plot could maintain relatively high transpiration rates in the spring until presumably hydraulic adjustments (embolism) were incurred following the first major dry period (Hawthorne and Miniat, 2018). Meinzer et al. (2013) also showed that water use by maple and poplar trees was twice as sensitive to soil drying compared to oak species, while oaks were relatively insensitive to drying. This may allow trees in the upslope plots to take advantage of warmer springs with earlier greenup (Hwang et al., 2018; Kim et al., 2018; Oishi et al., 2018) and increasing atmospheric CO2 concentrations. Although CO2 fertilization can decrease transpiration by improving water use efficiency especially during dry periods (Warren et al., 2011), we did not see any decreasing vegetation water use signals from the long-term hydrologic records (Figure 3). Similar increasing trends of ET were also recently reported at other undisturbed forested watersheds in the southern Appalachians (Hwang et al., 2018). This suggests that the potential CO2-driven reduction in transpiration might be outweighed by other factors, such as lengthened growing season (Hwang et al., 2011b, 2014) and greater vegetation growth by CO2 fertilization (Figure 5; Frank et al., 2015; Ward et al., 2018).
However, with increasing ET upslope and frequent droughts, water subsidies to downslope vegetation would decline over time as indicated in the long-term hydrologic records (Figure 3 and Supplementary Figures S4, S5). Mesophytic, isohydric trees downslope appeared to respond more to increased hydroclimate variability due to their dependence on downslope flows and subsidy (Figure 8). A recent tree-ring study in the study site showed that downslope tree species were more sensitive to hydroclimate variability than trees upslope with larger inter-annual variation (Elliott et al., 2015). They demonstrated that radial growth of oaks was greater than maple, birch and tulip poplar on upslope sites in dry years, while the latter species had higher basal increments than oaks on downslope sites in wet years. This pattern has also been confirmed across the eastern deciduous forests using Forest Inventory and Analysis data (Brzostek et al., 2014). This suggests that the isohydric/anisohydric continuum along hillslope gradients will play an important role in forest ecosystem responses to climate change, which would be closely mediated by changes in partitioning between localized water use and lateral hydrologic flows.
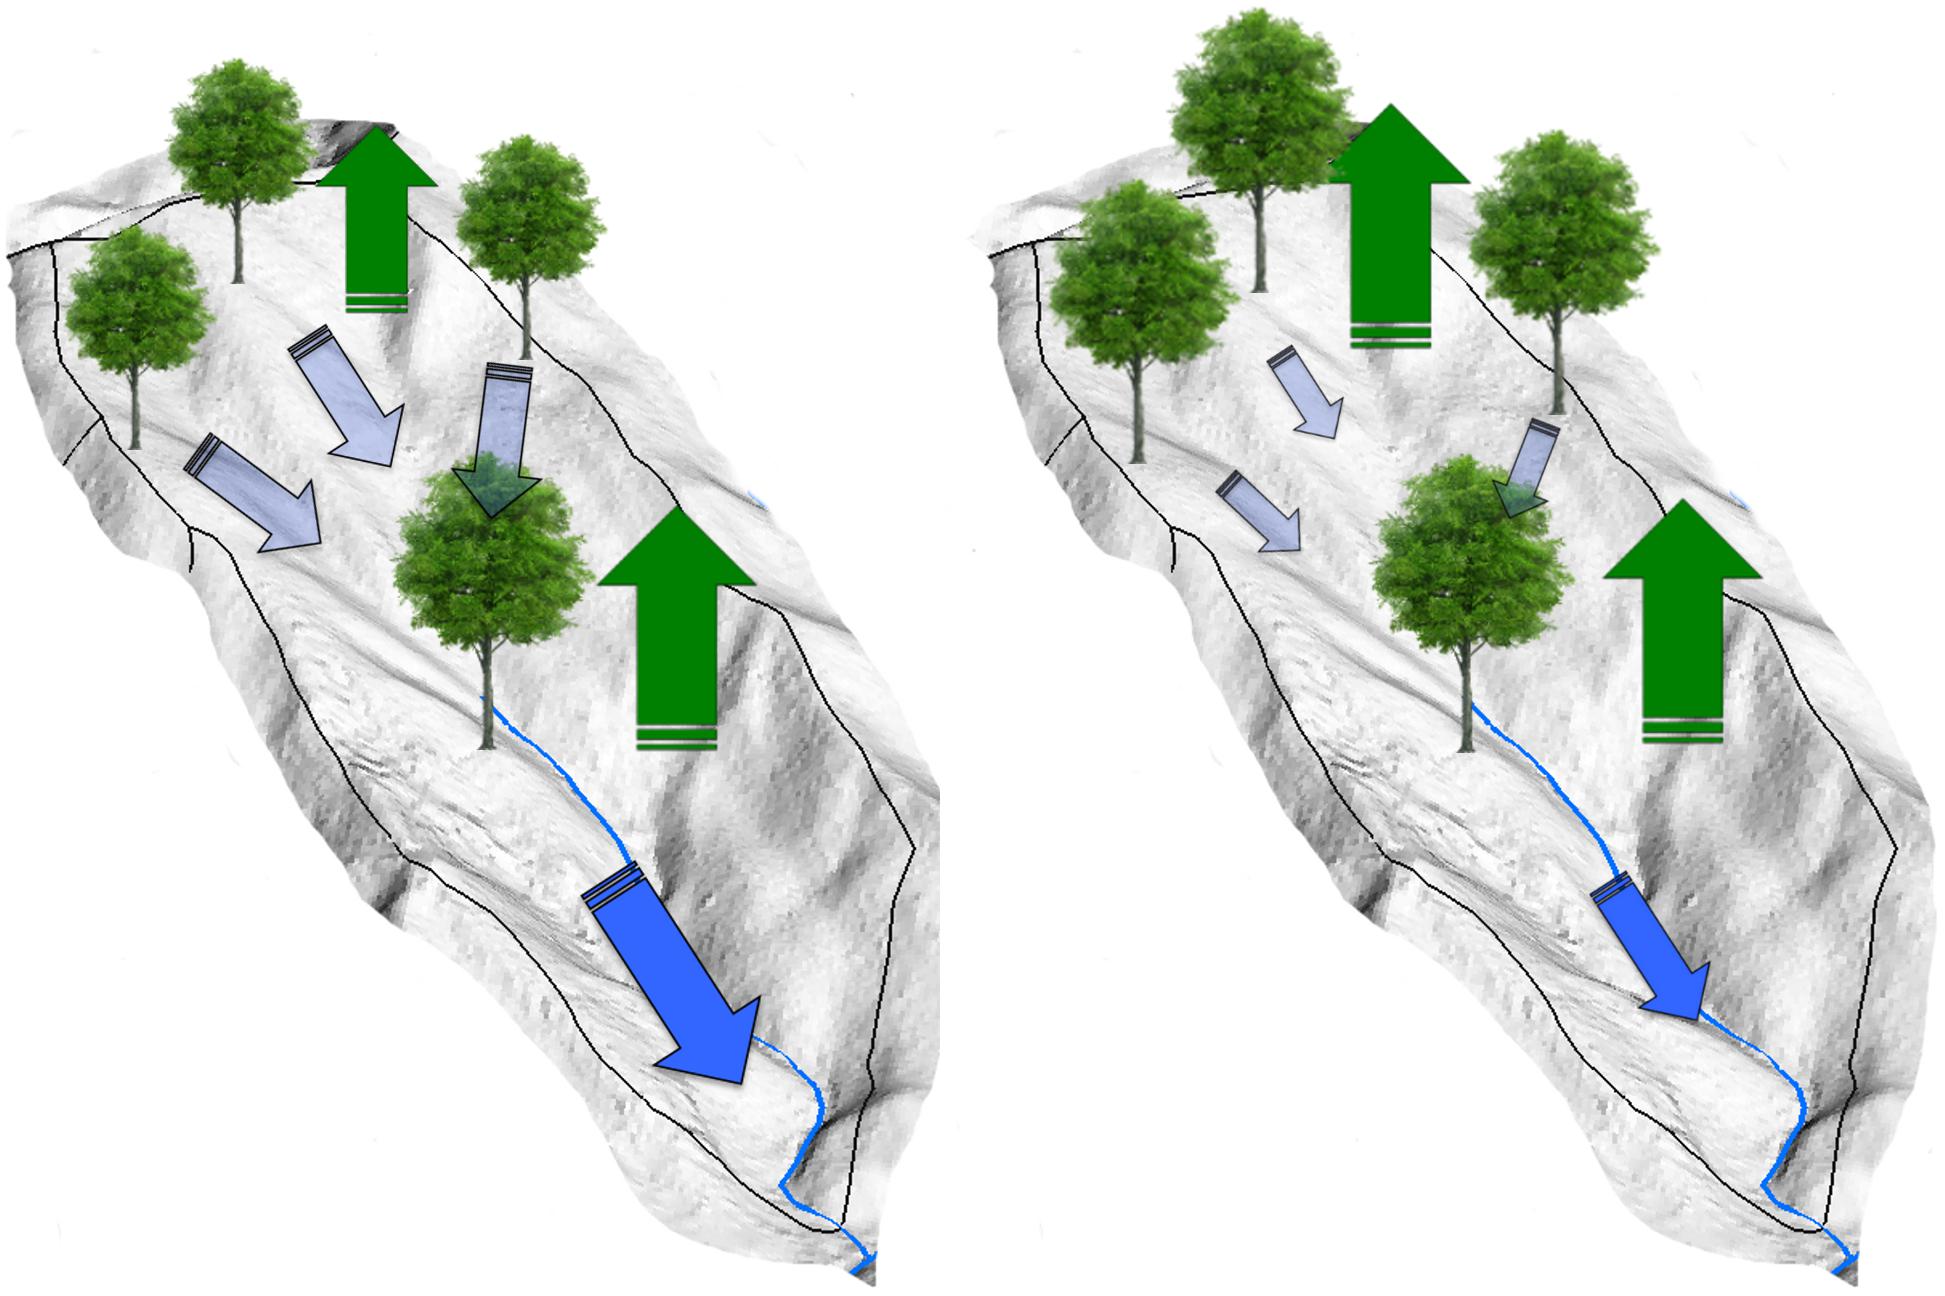
Figure 8. Conceptual models for hydrologic partitioning between localized water use and lateral hydrologic flows between vegetation in up- and downslope positions at the watershed scale. Vegetation water use downslope (green water) partially depends on upslope subsidy (blue water). Therefore, small increases in water use by upland xerophytic species with lengthened growing season and subsequent greater growth would be amplified in downslope topographic positions, where mesophytic tree species has already acclimated to greater soil moisture availability. Note that potential decreases in upslope subsidy may be also driven by more frequent and prolonged drought periods with warming. Green and blue arrows represent evapotranspiration and lateral hydrologic flows, respectively.
The divergent responses of vegetation to soil moisture deficit are not likely attributed to differences in vertical root structures between up- and downslope communities. In this study, we found that trees downslope showed a greater response to mild drought than those upslope, even within the same tree species in a normal year (Figure 7). Recent studies in the study site reported rooting depth and vertical distribution from 27 soil pits across different topographic positions and vegetation types (Hales et al., 2009; Hwang et al., 2015; Hales and Miniat, 2017). They found that roots were distributed deeper and more evenly in wet, hollow (areas of convergent topography) locations, compared to drier, nose (divergent topography) landscape positions. However, maximum rooting depth (around 1 m), total root biomass, and root frequency did not vary systematically between dry/nose and wet/hollow topographic positions and among different tree species. They did report observing distinct tap root structures around the depth of saprolite at several nose pits. Although many studies reported that deep tap roots play an important role in vegetation water use via hydraulic lift during dry periods (Nepstad et al., 1994; Canadell et al., 1996; Caldwell et al., 1998; Siqueira et al., 2008), the study by Hawthorne and Miniat (2018) reported greater overnight recharge in soil moisture at downslope rather than at upslope plots. This suggests that stomatal behavior and seasonally high local water use, rather than differences in rooting distributions, may be responsible for greater upslope growth and LAI over time compared to downslope vegetation.
Our study is in contrast with results from drier and colder ecosystems (e.g., Anning et al., 2013). Bunn et al. (2005) showed that tree ring growth patterns of Pinus balfouriana in the Sierra Nevada Mountains showed stronger correlations with temperature at wet and high convergence areas (downslope), while they correlated more with precipitation at dry and low convergence areas (upslope). Adams et al. (2014) also reported that tree ring growth of P. contorta and P. ponderosa at wet downslope areas showed decoupled responses to regional temperature and precipitation patterns, contrary to trees at dry upslope areas. In the western United States, vegetation water use can be usually decoupled from dominant lateral hydrologic flows during the growing season (Brooks et al., 2010) due to a seasonally dry climate (Tague et al., 2008; Tague, 2009). These abiotic factors would lead to less tight coupling between vegetation dynamics and watershed-scale hydrological behavior especially in dry regions (Adams et al., 2012). In the southern Appalachians, hydrologic subsidy by lateral hydrologic flows often leads to a gradient in plant-available water during dry periods (Yeakley et al., 1998), which may indicate strong dependency of downslope vegetation use on upslope water subsidy. This highlights the need to understand landscape-scale ecosystem responses to changing climate as connected systems between upslope and downslope via associated dominant lateral hydrologic flows.
Convergent or downslope topographic areas are often considered to be potential locations of thermal (climatic) microrefugia where local environment conditions may be decoupled from regional climate conditions (e.g., Dobrowski et al., 2009). While this argument has been mostly driven by topographic effects on temperature regimes, such as adiabatic lapse rates with elevation (e.g., Dobrowski et al., 2009; Gollan et al., 2014) and cold air drainage to valley bottoms (Novick et al., 2016), few studies related the changes in topography-mediated water balance patterns with vegetation responses to climate change (but see Crimmins et al., 2011). With an increase in upslope water use and subsequent decreases in hydrologic downslope subsidy, the effect of increased hydroclimate variability with warming should be amplified in downslope topographic positions, where mesophytic trees have already acclimated to greater soil moisture availability through physiological and rooting strategies. Considering ongoing forest “mesophication” under a history of fire suppression across the eastern United States deciduous forests, this study suggests that mesophytic trees downslope may be more vulnerable in terms of growth reduction and enhanced mortality due to the combined effect of frequent droughts and decreased lateral hydrologic flows under changing climate.
Conclusion
In this study, we combined long-term streamflow, remote sensing, soil moisture, tree basal area, litterfall, and sap flux datasets to explain long-term changes in vegetation patterns at the hillslope to watershed scales. We showed increasing evapotranspiration, decreasing streamflow yield given precipitation, and potential decreasing upslope subsidy to downslope topographic positions over the period of warming. This led to emergent homogenization of canopy density (leaf area) patterns along the hydrologic flow paths, supported by both long-term remote sensing and field observations. Xerophyric trees upslope showed greater growth over time compared to mesophytic trees downslope, closely mediated by the isohydric/anisohydric continuum along the hydrologic flow paths. This study also suggests that the changes in hydrologic partitioning between localized water use (green water) and lateral hydrologic flows (blue water) mediates the divergent responses of vegetation between upslope and downslope topographic positions. We speculate that with forest growth and more frequent droughts, they may become more hydrologically disconnected and increase the ratio of ET to Q, and as a result downslope mesophytic trees become more susceptible to frequent drought due to their strong dependency of green water use on blue water generation upslope. Our findings highlight the need to understand the underlying hydrologic balance along hillslope gradients to predict how forested mountain ecosystems may respond to climate change, possibly reinforced by ongoing forest mesophication under active fire suppression.
Data Availability Statement
The datasets generated for this study can be found in the https://coweeta.uga.edu/dbpublic/dataset_details.asp?accession=1046.
Author Contributions
TH, LB, and CM designed the overall research plan, analyzed and interpreted the data, and wrote the manuscript. CM, JV, JK, and PB are in charge of long-term climate, hydrology, soil moisture, and vegetation data, and contributed to writing of the manuscript. CS participated in Landsat TM data analysis and contributed to writing of the manuscript.
Funding
This research was supported by the U.S. Forest Service Southern Research Station, and the National Science Foundation (NSF) awards, DEB-0218001, DEB-0823293, DEB-1226983, DEB-1440485, and DEB-1637522 from the Long Term Ecological Research (LTER) Program to the Coweeta LTER. Any opinions, findings, conclusion, or recommendations expressed in the material are those of the authors and do not necessarily reflect the views of the USDA or NSF.
Conflict of Interest
The authors declare that the research was conducted in the absence of any commercial or financial relationships that could be construed as a potential conflict of interest.
Acknowledgments
We thank to Brian Kloeppel and Jason P. Love, who coordinated field work, and ensured the quality of field LTER data. We also thank the two reviewers for constructive comments on the manuscript.
Supplementary Material
The Supplementary Material for this article can be found online at: https://www.frontiersin.org/articles/10.3389/ffgc..00017/full#supplementary-material
Footnotes
References
Adams, H. D., Guardiola-Claramonte, M., Barron-Gafford, G. A., Villegas, J. C., Breshears, D. D., Zou, C. B., et al. (2009). Temperature sensitivity of drought-induced tree mortality portends increased regional die-off under global-change-type drought. Proc. Natl. Acad. Sci. U.S.A. 106, 7063–7066. doi: 10.1073/pnas.0901438106
Adams, H. D., Luce, C. H., Breshears, D. D., Allen, C. D., Weiler, M., Hale, V. C., et al. (2012). Ecohydrological consequences of drought- and infestation- triggered tree die-off: insights and hypotheses. Ecohydrology 5, 145–159. doi: 10.1002/eco.233
Adams, H. R., Barnard, H. R., and Loomis, A. K. (2014). Topography alters tree growth–climate relationships in a semi-arid forested catchment. Ecosphere 5:art148. doi: 10.1890/es14-00296.1
Ali, G. A., and Roy, A. G. (2010). Shopping for hydrologically representative connectivity metrics in a humid temperate forested catchment. Water Resour. Res. 46:W12544.
Anderegg, W. R., Berry, J. A., Smith, D. D., Sperry, J. S., Anderegg, L. D., and Field, C. B. (2012). The roles of hydraulic and carbon stress in a widespread climate-induced forest die-off. Proc. Natl. Acad. Sci. U.S.A. 109, 233–237. doi: 10.1073/pnas.1107891109
Anning, A. K., Rubino, D. L., Sutherland, E. K., and McCarthy, B. C. (2013). Dendrochronological analysis of white oak growth patterns across a topographic moisture gradient in southern Ohio. Dendrochronologia 31, 120–128. doi: 10.1016/j.dendro.2012.10.002
Asrar, G., Fuchs, M., Kanemasu, E. T., and Hatfield, J. L. (1984). Estimating absorbed photosynthetic radiation and leaf-area index from spectral reflectance in wheat. Agron. J. 76, 300–306. doi: 10.2134/agronj1984.00021962007600020029x
Bearup, L. A., Maxwell, R. M., Clow, D. W., and McCray, J. E. (2014). Hydrological effects of forest transpiration loss in bark beetle-impacted watersheds. Nat. Clim. Chang. 4, 481–486. doi: 10.1038/nclimate2198
Beckage, B., and Clark, J. S. (2003). Seedling survival and growth of three forest tree species: the role of spatial heterogeneity. Ecology 84, 1849–1861. doi: 10.1890/0012-9658(2003)084%5B1849:ssagot%5D2.0.co;2
Berdanier, A. B., and Clark, J. S. (2016). Multiyear drought−induced morbidity preceding tree death in southeastern US forests. Ecol. Appl. 26, 17–23. doi: 10.1890/15-0274
Bolstad, P. V., Swank, W., and Vose, J. (1998). Predicting Southern Appalachian overstory vegetation with digital terrain data. Landsc. Ecol. 13, 271–283.
Brooks, J. R., Barnard, H. R., Coulombe, R., and McDonnell, J. J. (2010). Ecohydrologic separation of water between trees and streams in a Mediterranean climate. Nat. Geosci. 3, 100–104. doi: 10.1038/ngeo722
Brooks, P. D., Troch, P. A., Durcik, M., Gallo, E., and Schlegel, M. (2011). Quantifying regional scale ecosystem response to changes in precipitation: not all rain is created equal. Water Resour. Res. 47:W00J08.
Brutsaert, W., and Nieber, J. L. (1977). Regionalized drought flow hydrographs from a mature glaciated plateau. Water Resour. Res. 13, 637–644.
Brzostek, E. R., Dragoni, D., Schmid, H. P., Rahman, A. F., Sims, D., Wayson, C. A., et al. (2014). Chronic water stress reduces tree growth and the carbon sink of deciduous hardwood forests. Glob. Change Biol. 20, 2531–2539. doi: 10.1111/gcb.12528
Bunn, A. G., Waggoner, L. A., and Graumlich, L. J. (2005). Topographic mediation of growth in high elevation foxtail pine (Pinus balfouriana Grev. et Balf.) forests in the Sierra Nevada, USA. Glob. Ecol. Biogeogr. 14, 103–114. doi: 10.1111/j.1466-822x.2005.00141.x
Burt, T. P., Ford Miniat, C., Laseter, S. H., and Swank, W. T. (2018). Changing patterns of daily precipitation totals at the Coweeta Hydrologic Laboratory, North Carolina, USA. Int. J. Climatol. 38, 94–104. doi: 10.1002/joc.5163
Caldwell, M. M., Dawson, T. E., and Richards, J. H. (1998). Hydraulic lift: consequences of water efflux from the roots of plants. Oecologia 113, 151–161. doi: 10.1007/s004420050363
Caldwell, P. V., Miniat, C. F., Elliott, K. J., Swank, W. T., Brantley, S. T., and Laseter, S. H. (2016). Declining water yield from forested mountain watersheds in response to climate change and forest mesophication. Glob. Chang. Biol. 22, 2997–3012. doi: 10.1111/gcb.13309
Canadell, J., Jackson, R. B., Ehleringer, J. R., Mooney, H. A., Sala, O. E., and Schulze, E. D. (1996). Maximum rooting depth of vegetation types at the global scale. Oecologia 108, 583–595. doi: 10.1007/BF00329030
Chen, J. M., and Cihlar, J. (1996). Retrieving leaf area index of boreal conifer forests using Landsat TM images. Remote Sens. Environ. 55, 153–162. doi: 10.1016/0034-4257(95)00195-6
Choat, B., Jansen, S., Brodribb, T. J., Cochard, H., Delzon, S., Bhaskar, R., et al. (2012). Global convergence in the vulnerability of forests to drought. Nature 491, 752–755. doi: 10.1038/nature11688
Clark, J. S., Bell, D. M., Hersh, M. H., and Nichols, L. (2011). Climate change vulnerability of forest biodiversity: climate and competition tracking of demographic rates. Glob. Chang. Biol. 17, 1834–1849. doi: 10.1111/j.1365-2486.2010.02380.x
Clark, J. S., Bell, D. M., Kwit, M. C., and Zhu, K. (2014). Competition-interaction landscapes for the joint response of forests to climate change. Glob. Chang. Biol. 20, 1979–1991. doi: 10.1111/gcb.12425
Clinton, B. D., Yeakley, J. A., and Apsley, D. K. (2003). Tree growth and mortality in a Southern Appalachian deciduous forest following extended wet and dry periods. Castanea 68, 189–200.
Creed, I. F., Hwang, T., Lutz, B., and Way, D. (2015). Climate warming causes intensification of the hydrological cycle, resulting in changes to the vernal and autumnal windows in a northern temperate forest. Hydrol. Process. 29, 3519–3534. doi: 10.1002/hyp.10450
Creed, I. F., Spargo, A. T., Jones, J. A., Buttle, J. M., Adams, M. B., Beall, F. D., et al. (2014). Changing forest water yields in response to climate warming: results from long-term experimental watershed sites across North America. Glob. Chang. Biol. 20, 3191–3208. doi: 10.1111/gcb.12615
Crimmins, S. M., Dobrowski, S. Z., Greenberg, J. A., Abatzoglou, J. T., and Mynsberge, A. R. (2011). Changes in climatic water balance drive downhill shifts in plant species’ optimum elevations. Science 331, 324–327. doi: 10.1126/science.1199040
Davis, F. W., and Goetz, S. (1990). Modeling vegetation pattern using digital terrain data. Landsc. Ecol. 4, 69–80. doi: 10.1007/bf02573952
Dawdy, D., and Matalas, N. (1964). “Statistical and probability analysis of hydrologic data, part III: analysis of variance, covariance and time series,” in Handbook of Applied Hydrology: A Compendium of Water-Resources Technology, ed. V. T. Chow, (New York, NY: McGraw-Hill Education), 68–90.
Day, F. P., Philips, D. L., and Monk, C. D. (1988). “Forest communities and patterns,” in Forest Hydrology and Ecology at Coweeta, eds W. T. Swank and J. D. A. Crossley, (New York, NY: Springer-Verlag), 141–149. doi: 10.1007/978-1-4612-3732-7_10
Detty, J. M., and McGuire, K. J. (2010). Topographic controls on shallow groundwater dynamics: implications of hydrologic connectivity between hillslopes and riparian zones in a till mantled catchment. Hydrol. Process. 24, 2222–2236. doi: 10.1002/hyp.7656
Dobrowski, S. Z. (2011). A climatic basis for microrefugia: the influence of terrain on climate. Glob. Chang. Biol. 17, 1022–1035. doi: 10.1111/j.1365-2486.2010.02263.x
Dobrowski, S. Z., Abatzoglou, J. T., Greenberg, J. A., and Schladow, S. G. (2009). How much influence does landscape-scale physiography have on air temperature in a mountain environment? Agric. For. Meteorol. 149, 1751–1758. doi: 10.1016/j.agrformet.2009.06.006
Eckhardt, K. (2005). How to construct recursive digital filters for baseflow separation. Hydrol. Process. 19, 507–515. doi: 10.1002/hyp.5675
Elliott, K. J., Miniat, C. F., Pederson, N., and Laseter, S. H. (2015). Forest tree growth response to hydroclimate variability in the southern Appalachians. Glob. Chang. Biol. 21, 4627–4641. doi: 10.1111/gcb.13045
Elliott, K. J., and Vose, J. M. (2011). The contribution of the Coweeta Hydrologic Laboratory to developing an understanding of long-term (1934–2008) changes in managed and unmanaged forests. For. Ecol. Manage. 261, 900–910. doi: 10.1016/j.foreco.2010.03.010
Emanuel, R. E., Riveros-Iregui, D. A., McGlynn, B. L., and Epstein, H. E. (2011). On the spatial heterogeneity of net ecosystem productivity in complex landscapes. Ecosphere 2, 1–13.
Erskine, R. H., Green, T. R., Ramirez, J. A., and MacDonald, L. H. (2006). Comparison of grid−based algorithms for computing upslope contributing area. Water Resour. Res. 42:W09416.
Ford, C. R., Hubbard, R. M., and Vose, J. M. (2011). Quantifying structural and physiological controls on variation in canopy transpiration among planted pine and hardwood species in the southern Appalachians. Ecohydrology 4, 183–195. doi: 10.1002/eco.136
Frank, D., Poulter, B., Saurer, M., Esper, J., Huntingford, C., Helle, G., et al. (2015). Water-use efficiency and transpiration across European forests during the Anthropocene. Nat. Clim. Chang. 5, 579–584.
Gollan, J. R., Ramp, D., and Ashcroft, M. B. (2014). Assessing the distribution and protection status of two types of cool environment to facilitate their conservation under climate change. Conserv. Biol. 28, 456–466. doi: 10.1111/cobi.12212
Hales, T. C., Ford, C. R., Hwang, T., Vose, J. M., and Band, L. E. (2009). Topographic and ecologic controls on root reinforcement. J. Geophys. Res. Earth Surf. 114:F03013.
Hales, T. C., and Miniat, C. F. (2017). Soil moisture causes dynamic adjustments to root reinforcement that reduce slope stability. Earth Surf. Process. Landf. 42, 803–813. doi: 10.1002/esp.4039
Harman, C. J., Sivapalan, M., and Kumar, P. (2009). Power law catchment-scale recessions arising from heterogeneous linear small-scale dynamics. Water Resour. Res. 45:W09404.
Hawthorne, S., and Miniat, C. F. (2018). Topography may mitigate drought effects on vegetation along a hillslope gradient. Ecohydrology 11:e1825. doi: 10.1002/eco.1825
Hewlett, J. D., and Hibbert, A. R. (1963). Moisture and energy conditions within a sloping soil mass during drainage. J. Geophys. Res. 68, 1081–1087. doi: 10.1029/jz068i004p01081
Hoffmann, W. A., Marchin, R. M., Abit, P., and Lau, O. L. (2011). Hydraulic failure and tree dieback are associated with high wood density in a temperate forest under extreme drought. Glob. Chang. Biol. 17, 2731–2742. doi: 10.1111/j.1365-2486.2011.02401.x
Hoylman, Z. H., Jencso, K. G., Hu, J., Martin, J. T., Holden, Z. A., Seielstad, C. A., et al. (2018). Hillslope topography mediates spatial patterns of ecosystem sensitivity to climate. J. Geophys. Res. Biogeosci. 123, 1–19.
Huete, A., Didan, K., Miura, T., Rodriguez, E. P., Gao, X., and Ferreira, L. G. (2002). Overview of the radiometric and biophysical performance of the MODIS vegetation indices. Remote Sens. Environ. 83, 195–213. doi: 10.1016/s0034-4257(02)00096-2
Hwang, T., Band, L. E., and Hales, T. C. (2009). Ecosystem processes at the watershed scale: extending optimality theory from plot to catchment. Water Resour. Res. 45:W11425.
Hwang, T., Band, L. E., Hales, T. C., Miniat, C. F., Vose, J. M., Bolstad, P. V., et al. (2015). Simulating vegetation controls on hurricane-induced shallow landslides with a distributed ecohydrological model. J. Geophys. Res. Biogeosci. 120, 361–378. doi: 10.1002/2014jg002824
Hwang, T., Band, L. E., Miniat, C. F., Song, C., Bolstad, P. V., Vose, J. M., et al. (2014). Divergent phenological response to hydroclimate variability in forested mountain watersheds. Glob. Chang. Biol. 20, 2580–2595. doi: 10.1111/gcb.12556
Hwang, T., Band, L. E., Vose, J. M., and Tague, C. (2012). Ecosystem processes at the watershed scale: hydrologic vegetation gradient as an indicator for lateral hydrologic connectivity of headwater catchments. Water Resour. Res. 48:W06514.
Hwang, T., Gholizadeh, H., Sims, D. A., Novick, K. A., Brzostek, E. R., Phillips, R. P., et al. (2017). Capturing species-level drought responses in a temperate deciduous forest using ratios of photochemical reflectance indices between sunlit and shaded canopies. Remote Sens. Environ. 199, 350–359. doi: 10.1016/j.rse.2017.07.033
Hwang, T., Martin, K. L., Vose, J. M., Wear, D., Miles, B., Kim, Y., et al. (2018). Non−stationary hydrologic behavior in forested watersheds is mediated by climate−induced changes in growing season length and subsequent vegetation growth. Water Resour. Res. 54, 5359–5375. doi: 10.1029/2017wr022279
Hwang, T., Song, C., Bolstad, P. V., and Band, L. E. (2011a). Downscaling real-time vegetation dynamics by fusing multi-temporal MODIS and Landsat NDVI in topographically complex terrain. Remote Sens. Environ. 115, 2499–2512. doi: 10.1016/j.rse.2011.05.010
Hwang, T., Song, C., Vose, J. M., and Band, L. E. (2011b). Topography-mediated controls on local vegetation phenology estimated from MODIS vegetation index. Landsc. Ecol. 26, 541–556. doi: 10.1007/s10980-011-9580-8
Jencso, K. G., McGlynn, B. L., Gooseff, M. N., Wondzell, S. M., Bencala, K. E., and Marshall, L. A. (2009). Hydrologic connectivity between landscapes and streams: transferring reach-and plot-scale understanding to the catchment scale. Water Resour. Res. 45:W04428.
Keeling, C. D., Chin, J. F. S., and Whorf, T. P. (1996). Increased activity of northern vegetation inferred from atmospheric CO2 measurements. Nature 382, 146–149. doi: 10.1038/382146a0
Keenan, T. F., Gray, J., Friedl, M. A., Toomey, M., Bohrer, G., Hollinger, D. Y., et al. (2014). Net carbon uptake has increased through warming-induced changes in temperate forest phenology. Nat. Clim. Chang. 4, 598–604. doi: 10.1038/nclimate2253
Kim, J., Hwang, T., Schaaf, C. L., Orwig, D. A., Boose, E., and Munger, J. W. (2017). Increased water yield due to the hemlock woolly adelgid infestation in New England. Geophys. Res. Lett. 44, 2327–2335. doi: 10.1002/2016gl072327
Kim, J. H., Hwang, T., Yang, Y., Schaaf, C. L., Boose, E., and William Munger, J. (2018). Warming−induced earlier greenup leads to reduced stream discharge in a temperate mixed forest catchment. J. Geophys. Res. Biogeosci. 123, 1960–1975. doi: 10.1029/2018jg004438
Klein, T. (2014). The variability of stomatal sensitivity to leaf water potential across tree species indicates a continuum between isohydric and anisohydric behaviours. Funct. Ecol. 28, 1313–1320. doi: 10.1111/1365-2435.12289
Klos, R. J., Wang, G. G., Bauerle, W. L., and Rieck, J. R. (2009). Drought impact on forest growth and mortality in the southeast USA: an analysis using forest health and monitoring data. Ecol. Appl. 19, 699–708. doi: 10.1890/08-0330.1
Knoepp, J. D., See, C. R., Vose, J. M., Miniat, C. F., and Clark, J. S. (2018). Total C and N pools and fluxes vary with time, soil temperature, and moisture along an elevation, precipitation, and vegetation gradient in southern appalachian forests. Ecosystems 21, 1623–1638. doi: 10.1007/s10021-018-0244-2
Knoepp, J. D., and Swank, W. T. (1998). Rates of nitrogen mineralization across an elevation and vegetation gradient in the southern Appalachians. Plant Soil 204, 235–241.
Laseter, S. H., Ford, C. R., Vose, J. M., and Swift, L. W. (2012). Long-term temperature and precipitation trends at the Coweeta Hydrologic Laboratory, Otto, North Carolina, USA. Hydrol. Res. 43, 890–901. doi: 10.2166/nh.2012.067
Li, H., and Sivapalan, M. (2011). Effect of spatial heterogeneity of runoff generation mechanisms on the scaling behavior of event runoff responses in a natural river basin. Water Resour. Res. 47:W00H08.
Lim, K. J., Engel, B. A., Tang, Z. X., Choi, J., Kim, K. S., Muthukrishnan, S., et al. (2005). Automated web Gis based hydrograph analysis tool, what. J. Am. Water Resour. Assoc. 41, 1407–1416. doi: 10.1016/j.scitotenv.2018.09.225
Mackay, D. S., Ewers, B. E., Loranty, M. M., and Kruger, E. L. (2010). On the representativeness of plot size and location for scaling transpiration from trees to a stand. J. Geophys. Res. Biogeosci. 115:G02016.
Martin-Benito, D., Pederson, N., and Svenning, J.-C. (2015). Convergence in drought stress, but a divergence of climatic drivers across a latitudinal gradient in a temperate broadleaf forest. J. Biogeogr. 42, 925–937. doi: 10.1111/jbi.12462
Martínez-Vilalta, J., Poyatos, R., Aguadé, D., Retana, J., and Mencuccini, M. (2014). A new look at water transport regulation in plants. New Phytol. 204, 105–115. doi: 10.1111/nph.12912
McDowell, N. G., and Allen, C. D. (2015). Darcy’s law predicts widespread forest mortality under climate warming. Nat. Clim. Chang. 5, 669–672. doi: 10.1038/nclimate2641
McGuire, K. J., and McDonnell, J. J. (2010). Hydrological connectivity of hillslopes and streams: characteristic time scales and nonlinearities. Water Resour. Res. 46:W10543.
McLaughlin, B. C., Ackerly, D. D., Klos, P. Z., Natali, J., Dawson, T. E., and Thompson, S. E. (2017). Hydrologic refugia, plants, and climate change. Glob. Chang. Biol. 23, 2941–2961. doi: 10.1111/gcb.13629
Meinzer, F. C., Woodruff, D. R., Eissenstat, D. M., Lin, H. S., Adams, T. S., and McCulloh, K. A. (2013). Above-and belowground controls on water use by trees of different wood types in an eastern US deciduous forest. Tree Physiol. 33, 345–356. doi: 10.1093/treephys/tpt012
Meinzer, F. C., Woodruff, D. R., Marias, D. E., Smith, D. D., McCulloh, K. A., Howard, A. R., et al. (2016). Mapping ‘hydroscapes’ along the iso- to anisohydric continuum of stomatal regulation of plant water status. Ecol. Lett. 19, 1343–1352. doi: 10.1111/ele.12670
Miniat, C. F., Laseter, S. H., Swank, W. T., and Swift, L. W. J. (2017). Daily Precipitation Data from Recording Rain Gages (RRG) at Coweeta Hydrologic Lab, North Carolina. Fort Collins, CO: Forest Service Research Data Archive.
Miniat, C. F., Laseter, S. H., Swank, W. T., and Vose, J. M. (2016). Daily Streamflow Data for Watersheds at Coweeta Hydrologic Lab, North Carolina. Fort Collins, CO: Forest Service Research Data Archive.
Myneni, R. B., Hoffman, S., Knyazikhin, Y., Privette, J. L., Glassy, J., Tian, Y., et al. (2002). Global products of vegetation leaf area and fraction absorbed PAR from year one of MODIS data. Remote Sens. Environ. 83, 214–231. doi: 10.1016/s0034-4257(02)00074-3
Myneni, R. B., Keeling, C. D., Tucker, C. J., Asrar, G., and Nemani, R. R. (1997). Increased plant growth in the northern high latitudes from 1981 to 1991. Nature 386, 698–702. doi: 10.1038/386698a0
Nemani, R., Pierce, L., Running, S., and Band, L. (1993). Forest ecosystem processes at the watershed scale: sensitivity to remotely-sensed leaf area index estimates. Int. J. Remote Sens. 14, 2519–2534. doi: 10.1080/01431169308904290
Nemani, R. R., and Running, S. W. (1989). Testing a theoretical climate soil leaf-area hydrologic equilibrium of forests using satellite data and ecosystem simulation. Agric. For. Meteorol. 44, 245–260. doi: 10.1016/0168-1923(89)90020-8
Nepstad, D. C., Decarvalho, C. R., Davidson, E. A., Jipp, P. H., Lefebvre, P. A., Negreiros, G. H., et al. (1994). The role of deep roots in the hydrological and carbon cycles of amazonian forests and pastures. Nature 372, 666–669. doi: 10.1038/372666a0
Novick, K. A., Oishi, A. C., and Miniat, C. F. (2016). Cold air drainage flows subsidize montane valley ecosystem productivity. Glob. Chang. Biol. 22, 4014–4027. doi: 10.1111/gcb.13320
Nowacki, G. J., and Abrams, M. D. (2008). The demise of fire and “mesophication” of forests in the eastern United States. BioScience 58, 123–138. doi: 10.1641/b580207
Nowacki, G. J., and Abrams, M. D. (2015). Is climate an important driver of post−European vegetation change in the Eastern United States? Glob. Chang. Biol. 21, 314–334. doi: 10.1111/gcb.12663
Oishi, A. C., Miniat, C. F., Novick, K. A., Brantley, S. T., Vose, J. M., and Walker, J. T. (2018). Warmer temperatures reduce net carbon uptake, but do not affect water use, in a mature southern Appalachian forest. Agric. For. Meteorol. 252, 269–282. doi: 10.1016/j.agrformet.2018.01.011
Pachauri, R. K., Allen, M., Barros, V., Broome, J., Cramer, W., Christ, R., et al. (2014). Climate Change 2014: Synthesis Report. Contribution of Working Groups I, II and III to the Fifth Assessment Report of the Intergovernmental Panel on Climate Change. Geneva: Intergovernmental Panel on Climate Change.
Roderick, M. L., and Farquhar, G. D. (2002). The cause of decreased pan evaporation over the past 50 years. Science 298, 1410–1411.
Roman, D., Novick, K., Brzostek, E., Dragoni, D., Rahman, F., and Phillips, R. (2015). The role of isohydric and anisohydric species in determining ecosystem-scale response to severe drought. Oecologia 179, 641–654. doi: 10.1007/s00442-015-3380-9
Rupp, D. E., and Selker, J. S. (2006a). Information, artifacts, and noise in dQ/dt-Q recession analysis. Adv. Water Resour. 29, 154–160. doi: 10.1016/j.advwatres.2005.03.019
Rupp, D. E., and Selker, J. S. (2006b). On the use of the Boussinesq equation for interpreting recession hydrographs from sloping aquifers. Water Resour. Res. 42:W12421.
Scaife, C. I., and Band, L. E. (2017). Nonstationarity in threshold response of stormflow in southern Appalachian headwater catchments. Water Resour. Res. 53, 6579–6596. doi: 10.1002/2017wr020376
Seager, R., Tzanova, A., and Nakamura, J. (2009). Drought in the Southeastern United States: causes, variability over the last millennium, and the potential for future hydroclimate change. J. Clim. 22, 5021–5045. doi: 10.1175/2009jcli2683.1
Sellers, P. J. (1985). Canopy reflectance, photosynthesis and transpiration. Int. J. Remote Sens. 6, 1335–1372. doi: 10.1080/01431168508948283
Siqueira, M., Katul, G., and Porporato, A. (2008). Onset of water stress, hysteresis in plant conductance, and hydraulic lift: scaling soil water dynamics from millimeters to meters. Water Resour. Res. 44:W01432.
Smakhtin, V. U. (2001). Low flow hydrology: a review. J. Hydrol. 240, 147–186. doi: 10.1016/s0022-1694(00)00340-1
Song, C., Chen, J. M., Hwang, T., Gonsamo, A., Croft, H., Zhang, Q., et al. (2015). “Ecological characterization of vegetation using multisensor remote sensing in the solar reflective spectrum,” in Land Resources Monitoring, Modeling, and Mapping with Remote Sensing, ed. P. S. Thenkabail, (Boca Raton, FL: CRC Press), 533–575.
Song, C., Woodcock, C. E., Seto, K. C., Lenney, M. P., and Macomber, S. A. (2001). Classification and change detection using Landsat TM data: when and how to correct atmospheric effects? Remote Sens. Environ. 75, 230–244. doi: 10.1016/s0034-4257(00)00169-3
Stephenson, N. L. (1990). Climatic control of vegetation distribution: the role of the water balance. Am. Nat. 135, 649–670. doi: 10.1086/285067
Swift, L. W., Cunningham, J. G. B., and Douglass, J. E. (1988). “Climatology and hydrology,” in Forest Hydrology and Ecology at Coweeta, eds W. T. Swank and J. D. A. Crossley, (New York, NY: Springer-Verlag), 35–55.
Tague, C., Grant, G., Farrell, M., Choate, J., and Jefferson, A. (2008). Deep groundwater mediates streamflow response to climate warming in the Oregon Cascades. Clim. Chang. 86, 189–210. doi: 10.1007/s10584-007-9294-8
Tague, C. L. (2009). Assessing climate change impacts on alpine stream-flow and vegetation water use: mining the linkages with subsurface hydrologic processes. Hydrol. Process. 23, 1815–1819. doi: 10.1002/hyp.7288
Tai, X., Mackay, D. S., Anderegg, W. R., Sperry, J. S., and Brooks, P. D. (2017). Plant hydraulics improves and topography mediates prediction of aspen mortality in southwestern USA. New Phytol. 213, 113–127. doi: 10.1111/nph.14098
Tarboton, D. G. (1997). A new method for the determination of flow directions and upslope areas in grid digital elevation models. Water Resour. Res. 33, 309–319. doi: 10.1029/96wr03137
Thompson, S. E., Harman, C. J., Troch, P. A., Brooks, P. D., and Sivapalan, M. (2011). Spatial scale dependence of ecohydrologically mediated water balance partitioning: a synthesis framework for catchment ecohydrology. Water Resour. Res. 47:W00J03.
Troch, P. A., Martinez, G. F., Pauwels, V. R. N., Durcik, M., Sivapalan, M., Harman, C., et al. (2009). Climate and vegetation water use efficiency at catchment scales. Hydrol. Process. 23, 2409–2414. doi: 10.1002/hyp.7358
Tromp-van Meerveld, H. J., and McDonnell, J. J. (2006). On the interrelations between topography, soil depth, soil moisture, transpiration rates and species distribution at the hillslope scale. Adv. Water Resour. 29, 293–310. doi: 10.1016/j.advwatres.2005.02.016
Tucker, C. J. (1979). Red and photographic infrared linear combinations for monitoring vegetation. Remote Sens. Environ. 8, 127–150. doi: 10.1016/0034-4257(79)90013-0
van der Molen, M. K., Dolman, A. J., Ciais, P., Eglin, T., Gobron, N., Law, B. E., et al. (2011). Drought and ecosystem carbon cycling. Agric. For. Meteorol. 151, 765–773.
VanDerWal, J., Murphy, H. T., Kutt, A. S., Perkins, G. C., Bateman, B. L., Perry, J. J., et al. (2013). Focus on poleward shifts in species’ distribution underestimates the fingerprint of climate change. Nat. Clim. Chang. 3, 239–243. doi: 10.1038/nclimate1688
Vicente-Serrano, S. M., Perez-Cabello, F., and Lasanta, T. (2008). Assessment of radiometric correction techniques in analyzing vegetation variability and change using time series of Landsat images. Remote Sens. Environ. 112, 3916–3934. doi: 10.1016/j.rse.2008.06.011
Voepel, H., Ruddell, B., Schumer, R., Troch, P. A., Brooks, P. D., Neal, A., et al. (2011). Quantifying the role of climate and landscape characteristics on hydrologic partitioning and vegetation response. Water Resour. Res. 47:W00J09.
Vose, J. M., and Elliott, K. (2016). Oak, fire, and global change in the eastern USA: what might the future hold? Fire Ecol. 12, 160–178.
Ward, E. J., Oren, R., Kim, H. S., Kim, D., Tor−ngern, P., Ewers, B. E., et al. (2018). Evapotranspiration and water yield of a pine−broadleaf forest are not altered by long−term atmospheric [CO2] enrichment under native or enhanced soil fertility. Glob. Chang. Biol. 24, 4841–4856. doi: 10.1111/gcb.14363
Warren, J. M., Pötzelsberger, E., Wullschleger, S. D., Thornton, P. E., Hasenauer, H., and Norby, R. J. (2011). Ecohydrologic impact of reduced stomatal conductance in forests exposed to elevated CO2. Ecohydrology 4, 196–210. doi: 10.1002/eco.173
Western, A. W., Grayson, R. B., Bloschl, G., Willgoose, G. R., and McMahon, T. A. (1999). Observed spatial organization of soil moisture and its relation to terrain indices. Water Resour. Res. 35, 797–810. doi: 10.1029/1998wr900065
Woods, R. A., and Sivapalan, M. (1997). A connection between topographically driven runoff generation and channel network structure. Water Resour. Res. 33, 2939–2950. doi: 10.1029/97wr01880
Wullschleger, S. D., and Hanson, P. J. (2006). Sensitivity of canopy transpiration to altered precipitation in an upland oak forest: evidence from a long−term field manipulation study. Glob. Chang. Biol. 12, 97–109. doi: 10.1111/j.1365-2486.2005.001082.x
Keywords: forest mesophication, fire suppression, isohydricity and anisohydricity, forest hydrology, drought
Citation: Hwang T, Band LE, Miniat CF, Vose JM, Knoepp JD, Song C and Bolstad PV (2020) Climate Change May Increase the Drought Stress of Mesophytic Trees Downslope With Ongoing Forest Mesophication Under a History of Fire Suppression. Front. For. Glob. Change 3:17. doi: 10.3389/ffgc.2020.00017
Received: 28 October 2019; Accepted: 04 February 2020;
Published: 26 February 2020.
Edited by:
Anthony Parolari, Marquette University, United StatesReviewed by:
Phong V. V. Le, Vietnam National University, VietnamJohn T. Van Stan, Georgia Southern University, United States
Copyright © 2020 Hwang, Band, Miniat, Vose, Knoepp, Song and Bolstad. This is an open-access article distributed under the terms of the Creative Commons Attribution License (CC BY). The use, distribution or reproduction in other forums is permitted, provided the original author(s) and the copyright owner(s) are credited and that the original publication in this journal is cited, in accordance with accepted academic practice. No use, distribution or reproduction is permitted which does not comply with these terms.
*Correspondence: Taehee Hwang, dGFlaGVlQGluZGlhbmEuZWR1