
94% of researchers rate our articles as excellent or good
Learn more about the work of our research integrity team to safeguard the quality of each article we publish.
Find out more
PERSPECTIVE article
Front. For. Glob. Change, 05 February 2020
Sec. Forests and the Atmosphere
Volume 3 - 2020 | https://doi.org/10.3389/ffgc.2020.00009
This article is part of the Research TopicClimate Effects on Tree Volatile Phytochemistry: Patterns and ConsequencesView all 5 articles
 Steffen M. Noe1*
 Ülo Niinemets1,2
Processes that change the carbon exchange between terrestrial ecosystems and the atmosphere are pivotal in understanding climate impact on global scale. Volatile organic compounds (VOC) emissions change substantially with biotic stressors like gall-forming insects. We provide a first global estimate of the effect of changes in VOC emission dynamics due to parasitic gall-forming insects on broad-leaved tree species. Overall, the effect investigated lead to a reduction in VOC emissions on global scale which lead to changes in the carbon driven climate feedback loop.
The interlinked processes between the atmosphere and the biosphere play a crucial role in the global climate system (Carslaw et al., 2010; Zhao et al., 2017). The exchange of matter and energy between these spheres determines climatic changes within the Earth system. Global warming leads to changes in the balance between carbon sources and sinks globally. Especially factors that lead to large scale changes in plant cover are effecting on this complex adaptive system.
A carbon-induced terrestrial climate feedback loop, linking carbon dioxide (CO2) dynamics by terrestrial ecosystems to clouds was proposed by Kulmala et al. (2004, 2014). The feedback mechanism links plant emitted biogenic volatile organic compounds (BVOC), aerosol nucleation, secondary organic aerosol (SOA) growth, and cloud formation processes together. It positively affects plant growth by modulating the fraction of diffuse and direct radiation (Ezhova et al., 2018) and is controlling cloud formation and therefore impacts on temperature (Carslaw et al., 2010). The impact of SOA and organic aerosols (OA) was recently reviewed (Kerminen et al., 2018). From the feedback mechanism, we can deduce that phenomena, altering plant growth or BVOC emissions will effect on climate.
Typically, plant stressors like herbivorous insects alter the emission patterns of BVOC emitting plants and shift the share of BVOCs of different atmospheric oxidation capacity which subsequently alter the dynamics of SOA formation, abundance, and properties (Yli-Pirilä et al., 2016; Faiola et al., 2018). As example, a predominately isoprene emitting species may, under stress, emit monoterpenes as major share of compounds or increase the overall emission by induced BVOCs that are not apparent in non-stressed situations (Brilli et al., 2009; Toome et al., 2010; Copolovici et al., 2014b, 2017; Jiang et al., 2016, 2018; Kmieć et al., 2018). While herbivorous insects have got already large attention in the literature of plant stress physiology (Holopainen and Gershenzon, 2010; Blande et al., 2014; Copolovici et al., 2014a; Loreto et al., 2014) much less is known on BVOC emissions induced by insects that do not destroy plant tissue or defoliate plants. Recently, gall-forming insects and their modifications on plant leaves and BVOC emission patterns came into focus (Augustyn et al., 2010; Damasceno et al., 2010; Jiang et al., 2018). Even though galls can be formed on coniferous plants as well, the largest body of literature exists for deciduous trees, shrubs, or crops.
In this perspective paper, we focus on biotic stressors, namely, gall-forming insects, that lead to changes in plant performance related to terrestrial plant carbon exchange, plant growth and emission of BVOC from plant tissues. Because the majority of measurements performed in past studies including gall-forming insects was done using broad-leaved species we limit our perspective to those in this analysis. In particular, we intended to assess, how the impact of biotic stress exerted by non-defoliating insects could potentially impact BVOC emission pattern on a global scale. The goal is to get a provisional estimate about the effect of the interaction between gall-forming insects and broad-leaved trees on global scale.
Gall-forming insects do not lead to severe defoliation or large necrotic areas of foliage that chewing or sap sucking insects or fungal infections may cause. Nevertheless, galls may be formed such that a leaf is loosing its normal functionality totally. In most cases, galls form swollen, tumor-like, compartments on leaves or other plant organs. A common feature of galls reported is the production of extra tissue at the cost of essential functionality and increased demand for nutrients and sugars while reducing photosynthetic capacity (Florentine et al., 2004; Dorchin et al., 2006; Jiang et al., 2018). It has also been reported, that larvae developing inside the gall tissues feed on cells that the plant grows to restore damaged tissues (Raman, 2011). Gall infestation at petioles was reported to alter the leaf lamina gas exchange, source-sink relations, and leaf water relations (Ye et al., 2019) including stress-induced changes in VOC emissions.
Most research on gall-forming insects reports about the changes in crop yield, crop market value, biomass production, photosynthetic capacity, and plant growth (Larson and Whitham, 1991, 1997; Fay et al., 1996; Stratton et al., 2018). However, literature on changes of BVOC emissions due to gall formation are still scarce but reports on BVOC emissions and related signaling (Tooker and De Moraes, 2008; Tooker et al., 2008; Damasceno et al., 2010; Jiang et al., 2018) have been published recently.
Assessing the impact of these changes is difficult in the way that there are few measurements of gall-induced BVOC emission patterns available and even fewer made the distinction between constitutive and elicited emissions. Summarizing the effects shown by the available literature gall infestation leads to a reduction in photosynthetic capacity and a change in the BVOC emission patterns.
Insect-driven gall formation on plants was observed globally (Skuhravá, 2006; Tokuda and Yukawa, 2007; Skuhravá and Skuhravý, 2009) and gall-forming insects have been reported as invasive species, e.g., in Europe (Roques et al., 2016). The formation of galls is linked with the phenology and the highest rates of galls appear when the foliage is developed to its maximum extent. In temperate and arctic zones, this time spans from spring to summer with a typical peak of leaf area in the middle of summer and therefore, galls are found most frequent during these seasons. In tropical species, where leaf area tends to be more stable over the year galls can be developed over the entire seasonal course and a season with a remarkable gall infection occurrence is maybe lacking. The gall-forming insects life cycle plays a role as well. While in temperate and arctic climate the life cycle is usually synchronized with the seasonal cycle, this must not hold for the tropics. However, the insects life cycle may follow the monsoon regime (Mardi et al., 2009) leading to dry and wet seasons and the gall formation may not occur uniformly over the year.
The severity of gall infections has a rather high variability. In literature, the share of infected plants has been reported to reach from below 10% easily to above 90% (Cuevas-Reyes et al., 2006; Espírito-Santo, 2007; Yang et al., 2013). Such a large range suggests, that the impact of galls on plants may be locally very uncertain but on regional and larger spatial scale this uncertainty may be lower when taking enough data into account.
Although BVOC measurements regarding gall infected plant emissions are scarce and the number of plant species investigated is limited it is of interest to give an estimation of the climate relevant effect of gall-induced BVOC emission changes. Because climate relevant activities, such as deforestation, afforestation, and land use change together with climate warming are impacting the Earth system on global scale any kind of large scale process can have a strong impact on the climate system.
We decided to use the Model of Emissions of Gases from Nature (MEGAN) version 2.1 together with the Community Land Model version 4 (CLM4.5) as a reliable base to obtain a reproducible status quo of global BVOC emissions (Guenther et al., 2012). We did not intend to run a modified MEGAN model ourself. Instead, we used its output as a gridded base emission factor to which we applied possible changes introduced by gall-forming insects. We adopted therefore the plant functional types (PFT) as described in Guenther et al. (2012) and chose a set of terpenoids and stress-emitted VOCs described by MEGAN.
We then used the information from measured gall infected plant species (Augustyn et al., 2010; Damasceno et al., 2010; Jiang et al., 2018; Ye et al., 2019) to infer a factor that carries information on the possible change in relative emission due to the infection. The approach uses two assumptions:
• All leaves are fully developed and we ignore seasonality on the northern and southern hemispheres and use summer everywhere, because the measurements were done under this conditions.
• Detailed information on the infection level is not available on global scale and it is highly variable (Cuevas-Reyes et al., 2006; Espírito-Santo, 2007; Yang et al., 2013). We use a scenario where the infection is assumed maximal on global scale.
To obtain gridded global BVOC emissions we used data calculated by CLM4.5 and MEGAN as described before. These global emission data were produced using atmospheric forcing with a 0.5 × 0.5° grid size as input data set to MEGAN (Guenther et al., 2012). The resulting dataset contains monthly gridded BVOC emission over the period 2001 to 2010. Because we were interested to achieve a maximal possible emission change, regardless of the difference in seasons, we used the maximum emission per each grid cell in the year 2010. The reason for this choice is that maximum emission is linked with maximum leaf development and that gall infection has then maximal impact on the plant physiological status.
We used the gridded plant functional type data set that is available from the CLM4.5 Dynamic Global Vegetation Model (CLM-DGVM) which is provided on a 0.5 × 0.5° grid. Because the measured BVOC data impacted by gall-forming insects came all from broad-leaved species we used for this estimation only matching PFTs. Those are, broadleaf deciduous boreal, temperate, and tropical tree species according to Guenther et al. (2012). The combined PFT data were used as a mask to select relevant grid cells with a PFT coverage bigger than zero by defining p(PFT) = 1 in that case and p(PFT) = 0 else. Because the percentage of area covered is already applied in the MEGAN output a double accounting is avoided by that strategy.
According to the major principle applied by the Guenther algorithm, that an emission rate E equals a base emission rate ES modulated by a series of multiplicative factors f, we get the general scheme E = ESf1f2…fn. A new factor f(g) that is modulating the emissions of gall infected plants needs therefore to be multiplicative and should compute to 1 for non-infected leaves. Assuming that the BVOC concentration in the atmosphere is smaller than that inside the leaf a deposition (negative emission) is not happening within the model. Therefore, we use median values of the measured constitutive Eg,c and elicited emissions Eg,i that have been reported to construct the emission modulating factor:
Given that Eg,c and Eg,i ≥ 0 we have f(g) ≥ 0 and f(g) = 1 if Eg,c = Eg,i. Values calculated from literature data (Jiang et al., 2018; Ye et al., 2019) were 0.36 for isoprene, 2.19 α-pinene, 1.48 β-pinene, 1,15 limonene, 1.57 ocimene, 1.05 myrcene, 1.27 other monoterpenes, 1.02 sesquiterpenes, and 1.04 for LOX.
To calculate the impact of the VOCs represented in CLM4.5/MEGAN we distinguished between isoprene, monoterpenes, sesquiterpenes and LOX compounds (called “Stress VOC” in the notion of Guenther et al., 2012) and define Fc,i as the “constitutive” VOC flux for compound i. We then apply the gall-induced change factor to isoprene and lumped monoterpene, sesquiterpene, and LOX data separately. By that, we achieve four categories of gall infected fluxes Fg,i = f(g)Fc,i. Finally we calculate the maximal relative change in VOC fluxes by galls per grid cell by:
where i iterate over the BVOC categories and x and y iterate over the grid cells. Figure 1 explains the workflow to achieve the gridded data and output visually.
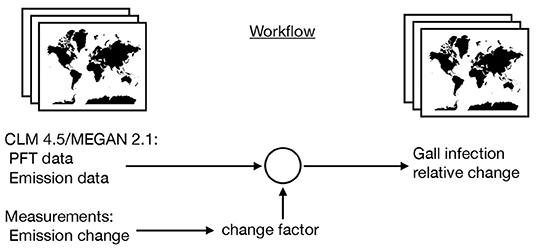
Figure 1. Schematic workflow of the model to assess the maximal possible effect of gall insect-induced changes in BVOC emissions on global scale. Using MEGAN 2.1 and CLM 4.5 emission data with climate forcing in 2010 as starting point and adding information from gall-induced emission changes.
To calculate the gridded output and to perform statistical analyses we used Mathematica [Wolfram Research, Inc., Mathematica, Version 11.3, Champaign, IL (2018)].
Our modeling exercise shows that in most areas of the globe a reduction in VOC load to the atmosphere takes place due to plant infestation by insects (Figure 2). The major driving factor is the reduction in isoprene emissions by up to 64% in some areas. Even though, we found that monoterpene emission increases by 68% this accounts only for 22% of the carbon by the gall-induced isoprene emission reduction. Given that the emission per grid cell depends on the share of species per land area, leaf area and the constitutive and induced emission fraction it is not possible to point the reductions and enhancements in induced emissions to one reason only. Also, sesquiterpene and LOX emissions were increasing by 2 and 4%, respectively but accounted for 0.2% in case of sesquiterpenes and 0.3% of LOX of reduced isoprene emissions. Taken together, isoprene emission reduction dominates in most regions the carbon release dynamics in our scenario.
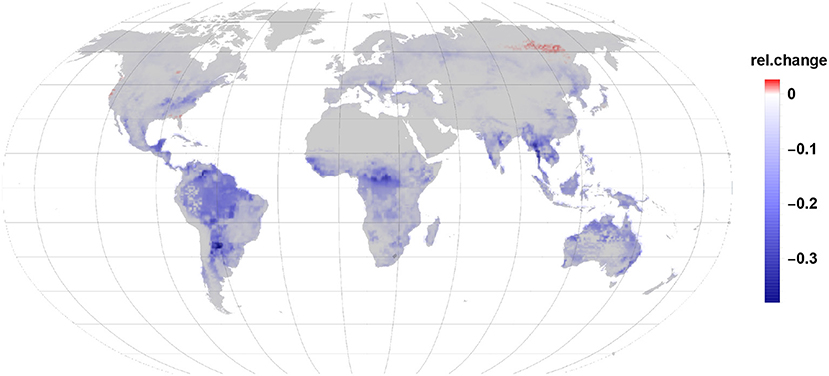
Figure 2. Global impact of gall-forming insects on BVOC emission from broad-leaved trees.
The relative net changes in VOC emissions due to gall-forming insects on broad-leaved tree species range therefore between a reduction of 40% and an increase of just 2.6% for some few areas (Figure 2).
To grade the relative changes better we need to note that in case of sesquiterpenes, the uncertainties in emissions are high. The high reactivity and the short lifetime of the compounds can lead to failure in detecting sesquiterpene emissions. Further, non-stressed leaves may have no or weak sesquiterpene emissions while stressed plants have high, induced, sesquiterpene emissions (Duhl et al., 2008). Using global averages or an average of stressed and non-stressed leaves can lead to significant bias and sesquiterpene contribution may be well-underestimated.
Also, we would like to mention that for different tree species strong changes between constitutive and induced emissions are apparent. Beside some evergreen Mediterranean species (Kesselmeier and Staudt, 1999; Staudt et al., 2008), oaks do emit few or no mono- or sesquiterpenes while unstressed (Copolovici et al., 2014b, 2017; Jiang et al., 2018). Therefore, stress-induced mono- and sesquiterpene emissions could reach up to 100% in regions dominated by such species and averaged emission data may not reflect such situations. Having used global gridded data we are aware that we cannot capture such events on global scale unless new information and data are available.
The strongest reduction in VOC emissions occurs in the tropics wherein the largest impacted areas are the rainforest in the Amazon basin and Congo, but also Mid-America and South-East Asia show a substantial reduction in net VOC emission. In the tropical belt Indonesia and North-Australia show a drop in VOC emission.
While in the temperate vegetation zone the east part of the United States shows the strongest reduction in VOC emission this is also apparent in the area of south-east Europe and in China. In comparison to the tropics the emission reductions in the temperate zone are already quite moderate. That means, that the amount of reduced and enhanced emissions are in their range more similar to each other in that regions. In the southern hemisphere a similar effect is visible in Africa and Australia where more southern locations have less reduction in relative VOC emissions. It should be noted, that the tree species used here are all broad-leaved and therefore monoterpenes are originated mostly from newly synthesized precursors or non-specific storage within the leaves tissues.
Net VOC emission changes are fading the further north we look. In the boreal zone, only weak reductions are visible and in the far north-east of Siberia the largest area with an increase in net VOC emissions is visible. One reason is the low abundance of isoprene emitting species in the boreal zone. We mention once more, that our study does not include the dominating monoterpene emitting conifer species due to a lack of measured data. Minor positive net emissions changes are found in South-Canada, along the coast line of the north-western USA and the south-eastern coastline near Florida.
The relative change in isoprene emissions remains with 64% at the second place, behind the relative change of monoterpenes (68%). The fact, that isoprene emissions are about 4.5 times higher than monoterpene emissions, using CLM4.5 and MEGAN as previously noted and that isoprene offset more than 600 times sesquiterpene and more than 300 times LOX emissions of broadleaved tree species let it dominate the reduction of BVOC emissions. Given that, gall infection of tree species has effects on global scale BVOC dynamics.
Comparing Figures 3, 4 it becomes clear, that the relative change in isoprene and monoterpene emission due to the gall-insect impact are similar in the tropics. The emission potential for isoprene and monoterpene of the different tree species will therefore determine the net effect.
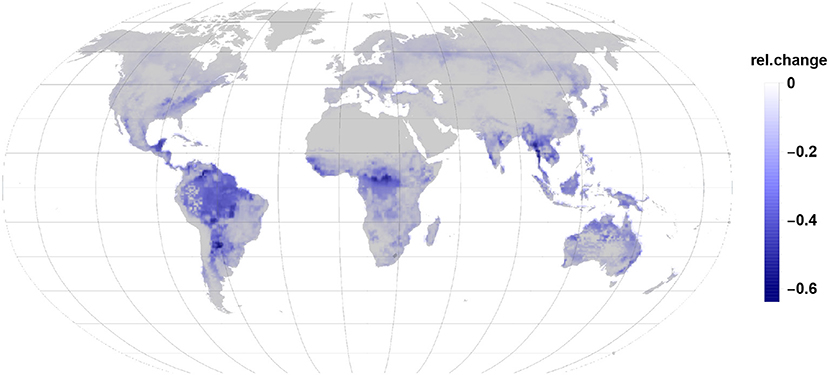
Figure 3. The relative changes in isoprene emission are the largest impact in the reduction of global relative emissions due to gall insect infections. Isoprene reduction dominates in tropic and subtropic regions.
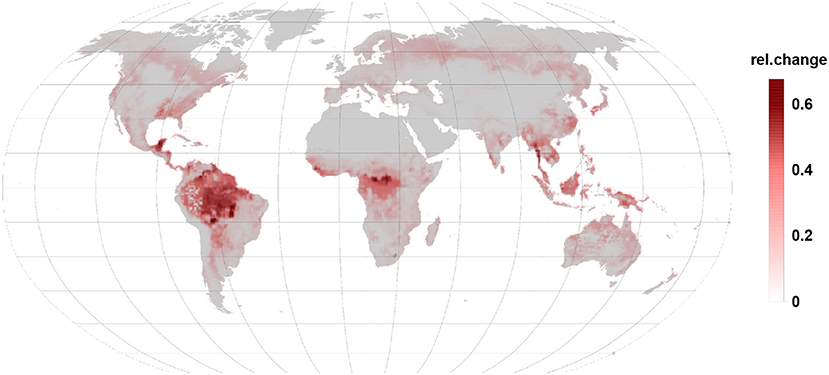
Figure 4. Relative changes in monoterpene emission are of the same order than isoprene changes but they increase emissions. Besides the tropic and subtropic areas they are more prominent in temperate and boreal regions.
An increase in relative monoterpene emissions (Figure 4) dominates in the northern, boreal forests. However, the 4.5-fold higher offset of isoprene against monoterpenes allows only in the far north-eastern Siberia a change in the relative emission dynamics. So that a gall infection could lead to an increased BVOC load of the atmosphere as compared to the constitutive emissions. Boreal broad-leaved species emit isoprene and monoterpenes. Depending on the species composition and under stressed conditions monoterpene and also sesquiterpene emissions can dominate over the reduction in isoprene emission (Hakola et al., 2001).
We note, that similar to the gall-induced changes isoprene emitting oak species infected with mildew showed a similar behavior and reduced isoprene emissions but increased mono- and sesquiterpene emissions (Copolovici et al., 2014b). The reverse relationship between isoprene and monoterpene emissions from stress was also reported for herbivore attacks and gall-induced emissions from leaves or petioles (Copolovici et al., 2017; Jiang et al., 2018; Ye et al., 2019).
Sesquiterpene relative emissions (Figure 5) almost follow the same pattern seen for monoterpenes. These emissions are, however, substantially smaller and usually not detected in non-stressed condition. Surprisingly, they dominate the relative change in Australia where monoterpene and isoprene relative changes remain moderate.
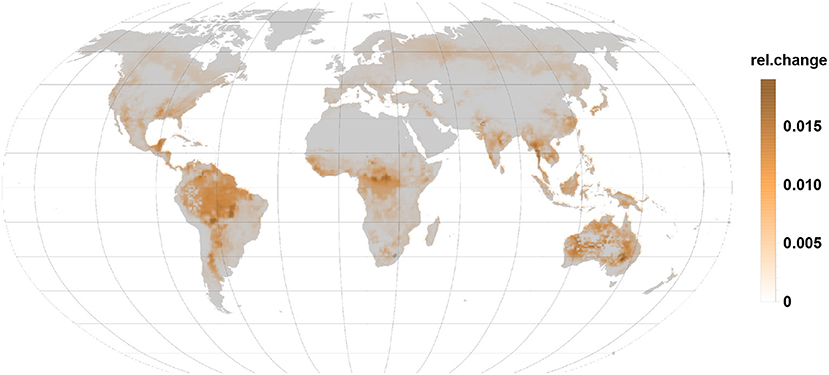
Figure 5. The relative changes in sesquiterpene emission are also positive indicating an emission increase under gall infection. Highest relative changes are reached in the tropics, subtropics, and in Australia.
Stress related to relative LOX emissions (Figure 6) are more or less a map of the combined PFTs used in the simulation. Absent in constitutive case, they show everywhere a substantial relative increase but remain small in their contribution to the BVOC emission as compared to isoprene or monoterpenes.
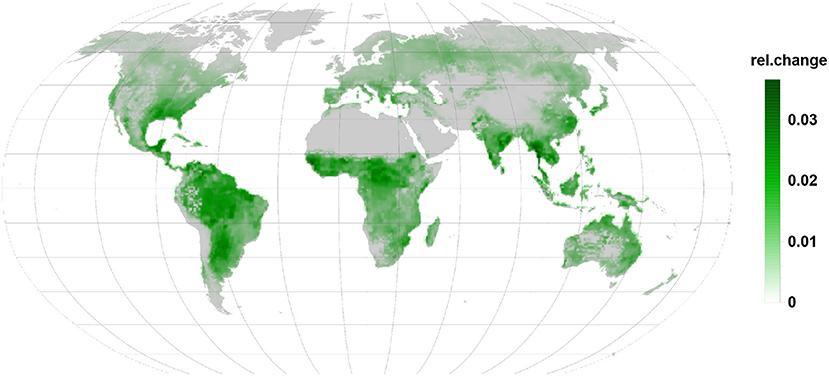
Figure 6. Relative changes in LOX emission are as well positive and indicate increased emission. Being linked to the infected leaves they are apparent in all regions during the infection.
Similar to monoterpenes, LOX emissions are rising with stress and damages of leaves due to insect attacks and gall-induced changes on leaves or petioles (Copolovici et al., 2017; Jiang et al., 2018; Ye et al., 2019).
The proposed changes on the carbon-induced terrestrial climate feedback loop due to changing BVOC emissions from plants to the atmosphere will have an effect on climate. The magnitude of the effect depends on many factors where our knowledge is yet limited. Therefore, we used a maximal infection scenario in our simulation. The major uncertainties are the scarcity of gall infected plants BVOC emissions, the lack of data on coniferous tree species, and the uncertainty in the severity of the infection on a large scale and over the seasonal cycle. These uncertainties encourage for further work on these topics.
Major simplifications in our approach are based on the use of MEGAN2.1/CLM4.5 which delivers averaged global BVOC emissions and the lack of information on the actual gall-induced infection state of plants, and the assumption of a “global summer” with maximal infection, because the available measurements were done in these conditions. Another major simplification the usage of the same changes in BVOCs in each PFT. Clearly, there are differences in plant species and their contribution to BVOC emissions in the real world that need to be taken into account once such information becomes available. Given new information becomes available the estimates can be rendered more accurate.
The change in emission by insect pests, fungal infection, and insect parasites like gall-forming insects followed a similar scheme, reduction in emissions from constitutive VOC and increase in induced VOC (Brilli et al., 2009; Toome et al., 2010; Copolovici et al., 2014b, 2017; Jiang et al., 2016, 2018) but in some cases both, constitutive and induced emissions, increased (Staudt and Lhoutellier, 2007; Ye et al., 2019). In that sense, our approach can be applied to different stresses when it is possible to account for a change in the emission factor. In reality, all these stressors act together on the VOC emission dynamics and may alter the BVOC effect in climate substantially.
Our simulation showed, that the reduction in isoprene emission dominates the global dynamics of gall insect-induced BVOC emissions from deciduous tree species. In context to recent estimates on global isoprene and monoterpene (Hantson et al., 2017; Chen et al., 2018) our findings can add another puzzle piece and increase our knowledge on BVOC changes on climate. In the light of the carbon induced climate feedback (Kulmala et al., 2004, 2014; Ezhova et al., 2018) changes in VOC load to the atmosphere and in GPP will be of relevance.
The raw data supporting the conclusions of this article will be made available by the authors, without undue reservation, to any qualified researcher. The MEGAN-CLM gridded input data used are openly available at https://www.acom.ucar.edu/webt/MEGAN/05degree_MEGAN/.
SN and ÜN conceived, designed, executed this study, and they wrote the manuscript together.
The authors declare that the research was conducted in the absence of any commercial or financial relationships that could be construed as a potential conflict of interest.
We acknowledge support from the European network for observing our changing planet project (ERA-PLANET, grant agreement no. 689443) under the European Union's Horizon 2020 research and innovation programme and the Estonian Ministry of Sciences projects (grant nos. P180021, P180274), the Estonian Research Infrastructures Roadmap project Estonian Environmental Observatory (3.2.0304.11-0395), the European Commission through the European Regional Fund (the Center of Excellence in Environmental Adaptation), and the European Research Council (advanced grant 322603, SIP-VOL+).
Augustyn, W., Botha, B., Combrinck, S., and Plooy, W. D. (2010). Correlation of volatile profiles of twenty mango cultivars with their susceptibilities to mango gall fly infestation. South Afr. J. Bot. 76, 710–716. doi: 10.1016/j.sajb.2010.07.005
Blande, J. D., Holopainen, J. K., and Niinemets, U. (2014). Plant volatiles in polluted atmospheres: stress responses and signal degradation. Plant Cell Environ. 37, 1892–1904. doi: 10.1111/pce.12352
Brilli, F., Ciccioli, P., Fratoni, M., Prestininzi, M., Spanedda, A. F., and Loreto, F. (2009). Constitutive and herbivore-induced monoterpenes emitted by populus x euroamericana leaves are key volatiles that orient chrysomela populi beetles. Plant Cell Environ. 32, 542–552. doi: 10.1111/j.1365-3040.2009.01948.x
Carslaw, K. S., Boucher, O., Spracklen, D. V., Mann, G. W., Rae, J. G. L., Woodward, S., et al. (2010). A review of natural aerosol interactions and feedbacks within the earth system. Atmos. Chem. Phys. 10, 1701–1737. doi: 10.5194/acp-10-1701-2010
Chen, W. H., Guenther, A. B., Wang, X. M., Chen, Y. H., Gu, D. S., Chang, M., et al. (2018). Regional to global biogenic isoprene emission responses to changes in vegetation from 2000 to 2015. J. Geophys. Res. Atmos. 123, 3757–3771. doi: 10.1002/2017JD027934
Copolovici, L., Kännaste, A., Remmel, T., and Niinemets, Ü. (2014a). Volatile organic compound emissions from alnus glutinosa under interacting drought and herbivory stresses. Environ. Exp. Bot. 100, 55–63. doi: 10.1016/j.envexpbot.2013.12.011
Copolovici, L., Pag, A., Kännaste, A., Bodescu, A., Tomescu, D., Copolovici, D., et al. (2017). Disproportionate photosynthetic decline and inverse relationship between constitutive and induced volatile emissions upon feeding of quercus robur leaves by large larvae of gypsy moth (lymantria dispar). Environ. Exp. Bot. 138, 184–192. doi: 10.1016/j.envexpbot.2017.03.014
Copolovici, L., Väärtnõu, F., Portillo Estrada, M., and Niinemets, Ü. (2014b). Oak powdery mildew (erysiphe alphitoides)-induced volatile emissions scale with the degree of infection in quercus robur. Tree Physiol. 34, 1399–1410. doi: 10.1093/treephys/tpu091
Cuevas-Reyes, P., Quesada, M., and Oyama, K. (2006). Abundance and leaf damage caused by gall-inducing insects in a mexican tropical dry forest1. Biotropica 38, 107–115. doi: 10.1111/j.1744-7429.2006.00115.x
Damasceno, F. C., Nicolli, K. P., Caramão, E. B., Soares, G. L. G., and Zini, C. A. (2010). Changes in the volatile organic profile of Schinus polygamus (Anacardiaceae) and Baccharis spicata (Asteraceae) induced by galling psyllids. J. Braz. Chem. Soc. 21, 556–563. doi: 10.1590/S0103-50532010000300023
Dorchin, N., Cramer, M. D., and Hoffmann, J. H. (2006). Photosynthesis and sink activity ofwasp-induced galls in acacia pycnantha. Ecology 87, 1781–1791. doi: 10.1890/0012-9658(2006)87[1781:PASAOW]2.0.CO;2
Duhl, T. R., Helmig, D., and Guenther, A. (2008). Sesquiterpene emissions from vegetation: a review. Biogeosciences 5, 761–777. doi: 10.5194/bg-5-761-2008
Espírito-Santo, M. M. (2007). How many species of gall-inducing insects are there on earth, and where are they? Ann. Entomol. Soc. Am. 100, 95–99. doi: 10.1603/0013-8746(2007)100[95:HMSOGI]2.0.CO;2
Ezhova, E., Ylivinkka, I., Kuusk, J., Komsaare, K., Vana, M., Krasnova, A., et al. (2018). Direct effect of aerosols on solar radiation and gross primary production in boreal and hemiboreal forests. Atmos. Chem. Phys. 18, 17863–17881. doi: 10.5194/acp-18-17863-2018
Faiola, C. L., Buchholz, A., Kari, E., Yli-Pirilä, P., Holopainen, J. K., Kivimäenpää, M., et al. (2018). Terpene composition complexity controls secondary organic aerosol yields from scots pine volatile emissions. Sci. Rep. 8, 3053–3053. doi: 10.1038/s41598-018-21045-1
Fay, P. A., Hartnett, D. C., and Knapp, A. K. (1996). Plant tolerance of gall-insect attack and gall-insect performance. Ecology 77, 521–534. doi: 10.2307/2265627
Florentine, S. K., Raman, A., and Dhileepan, K. (2004). Effects of gall induction by epiblema strenuana on gas exchange, nutrients, and energetics in parthenium hysterophorus. Biocontrol 50, 787–801. doi: 10.1007/s10526-004-5525-3
Guenther, A. B., Jiang, X., Heald, C. L., Sakulyanontvittaya, T., Duhl, T., Emmons, L. K., et al. (2012). The model of emissions of gases and aerosols from nature version 2.1 (megan2.1): an extended and updated framework for modeling biogenic emissions. Geosci. Model Dev. 5, 1471–1492. doi: 10.5194/gmd-5-1471-2012
Hakola, H., Laurila, T., Lindfors, V., Hellén, H., Gaman, A., and Rinne, J. (2001). Variation of the VOC emission rates of birch species during the growing season. Boreal Environ. Res. 6, 237–249. Available online at: http://www.borenv.net/BER/pdfs/ber6/ber6-237s.pdf
Hantson, S., Knorr, W., Schurgers, G., Pugh, T. A., and Arneth, A. (2017). Global isoprene and monoterpene emissions under changing climate, vegetation, Co2 and land use. Atmos. Environ. 155, 35–45. doi: 10.1016/j.atmosenv.2017.02.010
Holopainen, J. K., and Gershenzon, J. (2010). Multiple stress factors and the emission of plant VOCs. Trends Plant Sci. 15, 176–184. doi: 10.1016/j.tplants.2010.01.006 Special Issue: Induced biogenic volatile organic compounds from plants.
Jiang, Y., Veromann-Jürgenson, L.-L., Ye, J., and Niinemets, Ü. (2018). Oak gall wasp infections of quercus robur leaves lead to profound modifications in foliage photosynthetic and volatile emission characteristics. Plant Cell Environ. 41, 160–175. doi: 10.1111/pce.13050
Jiang, Y., Ye, J., Veromann, L.-L., and Niinemets, Ü. (2016). Scaling of photosynthesis and constitutive and induced volatile emissions with severity of leaf infection by rust fungus (Melampsora larici-populina) in Populus balsamifera var. suaveolens. Tree Physiol. 36, 856–872. doi: 10.1093/treephys/tpw035
Kerminen, V.-M., Chen, X., Vakkari, V., Petäjä, T., Kulmala, M., and Bianchi, F. (2018). Atmospheric new particle formation and growth: review of field observations. Environ. Res. Lett. 13:103003. doi: 10.1088/1748-9326/aadf3c
Kesselmeier, J., and Staudt, M. (1999). Biogenic volatile organic compounds (VOC): an overview on emission, physiology and ecology. J. Atmos. Chem. 33, 23–88. doi: 10.1023/A:1006127516791
Kmieć, K., Rubinowska, K., Michałek, W., and Sytykiewicz, H. (2018). The effect of galling aphids feeding on photosynthesis photochemistry of elm trees (Ulmus sp.). Photosynthetica 56, 989–997. doi: 10.1007/s11099-018-0813-9
Kulmala, M., Nieminen, T., Nikandrova, A., Lehtipalo, K., Manninnen, H., Kajos, M., et al. (2014). CO2-induced terrestrial climate feedback mechanism: from carbon sink to aerosol source and back. BER 19, 122–131. Available online at: http://hdl.handle.net/10138/228728
Kulmala, M., Suni, T., Lehtinen, K. E. J., Dal Maso, M., Boy, M., Reissell, A., et al. (2004). A new feedback mechanism linking forests, aerosols, and climate. Atmos. Chem. Phys. 4, 557–562. doi: 10.5194/acp-4-557-2004
Larson, K. C., and Whitham, T. G. (1991). Manipulation of food resources by a gall-forming aphid: the physiology of sink-source interactions. Oecologia 88, 15–21. doi: 10.1007/BF00328398
Larson, K. C., and Whitham, T. G. (1997). Competition between gall aphids and natural plant sinks: plant architecture affects resistance to galling. Oecologia 109, 575–582. doi: 10.1007/s004420050119
Loreto, F., Dicke, M., Schnitzler, J.-P., and Turlings, T. C. J. (2014). Plant volatiles and the environment. Plant Cell Environ. 37, 1905–1908. doi: 10.1111/pce.12369
Mardi, G., Pandey, A., and Kumar, S. (2009). Occurrence and management of rice gall midge in transplanted rice (Orseolia oryzae wood mason). Ecol. Environ. Conserv. 15, 361–365. Available online at: http://www.envirobiotechjournals.com/article_abstract.php?aid=2840&iid=101&jid=3
Raman, A. (2011). Morphogenesis of insect-induced plant galls: facts and questions. Flora Morphol. Distrib. Funct. Ecol. Plants 206, 517–533. doi: 10.1016/j.flora.2010.08.004
Roques, A. R., Auger-Rozenberg, M.-A., Blackburn, T. M., Garnas, J. R., Pysek, P., Rabitsch, W. B., et al. (2016). Temporal and interspecific variation in rates of spread for insect species invading europe during the last 200 years. Biol. Invas. 18, 907–920. doi: 10.1007/s10530-016-1080-y
Skuhravá, M. (2006). Species richness of gall midges (Diptera: Cecidomyiidae) in the main biogeographical regions of the world. Acta Soc. Zool. Bohem. 69, 327–372. Available online at: http://skuhrava-skuhravy.cz/Skuhrava_Skuhravy_II_low.pdf
Skuhravá, M., and Skuhravý, V. (2009). Species richness of gall midges (Diptera: Cecidomyiidae) in Europe (West Palaearctic): biogeography and coevolution with host plants. Acta Societatis Zoologicae Bohemicae 73, 87–156.
Staudt, M., Ennajah, A., Mouillot, F., and Joffre, R. (2008). Do volatile organic compound emissions of Tunisian cork oak populations originating from contrasting climatic conditions differ in their responses to summer drought? Can. J. Forest Res. 38, 2965–2975. doi: 10.1139/X08-134
Staudt, M., and Lhoutellier, L. (2007). Volatile organic compound emission from holm oak infested by gypsy moth larvae: evidence for distinct responses in damaged and undamaged leaves. Tree Physiol. 27, 1433–1440. doi: 10.1093/treephys/27.10.1433
Stratton, C. A., Hodgdon, E. A., Zuckerman, S. G., Shelton, A. M., and Chen, Y. H. (2018). A single swede midge (Diptera: Cecidomyiidae) larva can render cauliflower unmarketable. J. Insect Sci. 18:24. doi: 10.1093/jisesa/iey062
Tokuda, M., and Yukawa, J. (2007). Biogeography and evolution of gall midges (Diptera: Cecidomyiidae) inhabiting broad-leaved evergreen forests in oriental and eastern palearctic regions. Orient. Insects 41, 121–139. doi: 10.1080/00305316.2007.10417502
Tooker, J. F., and De Moraes, C. M. (2008). Gall insects and indirect plant defenses: a case of active manipulation? Plant Signal. Behav. 3, 503–504. doi: 10.4161/psb.3.7.6184
Tooker, J. F., Rohr, J. R., Abrahamson, W. G., and De Moraes, C. M. (2008). Gall insects can avoid and alter indirect plant defenses. New Phytol. 178, 657–671. doi: 10.1111/j.1469-8137.2008.02392.x
Toome, M., Randjärv, P., Copolovici, L., Niinemets, Ü., Luik, A., and Noe, S. M. (2010). Leaf rust induced volatile organic compounds signalling in willow during the infection. Planta 232, 235–243. doi: 10.1007/s00425-010-1169-y
Yang, X.-H., Zhu, D.-H., Liu, Z., Zhao, L., and Su, C.-Y. (2013). High levels of multiple infections, recombination and horizontal transmission of wolbachia in the Andricus mukaigawae (Hymenoptera; Cynipidae) communities. PLoS ONE 8:e0078970. doi: 10.1371/journal.pone.0078970
Ye, J., Jiang, Y., Veromann-Jürgenson, L.-L., and Niinemets, Ü. (2019). Petiole gall aphid (Pemphigus spyrothecae) infestation of populus × petrovskiana leaves alters foliage photosynthetic characteristics and leads to enhanced emissions of both constitutive and stress-induced volatiles. Trees 33, 37–51. doi: 10.1007/s00468-018-1756-2
Yli-Pirilä, P., Copolovici, L., Kännaste, A., Noe, S., Blande, J. D., Mikkonen, S., et al. (2016). Herbivory by an outbreaking moth increases emissions of biogenic volatiles and leads to enhanced secondary organic aerosol formation capacity. Environ. Sci. Technol. 50, 11501–11510. doi: 10.1021/acs.est.6b02800
Keywords: stress-induced VOC, gall-forming insects, plant emissions, carbon climate feedback, global model
Citation: Noe SM and Niinemets Ü (2020) Impact of Gall-Forming Insects on Global BVOC Emissions and Climate: A Perspective. Front. For. Glob. Change 3:9. doi: 10.3389/ffgc.2020.00009
Received: 08 November 2019; Accepted: 20 January 2020;
Published: 05 February 2020.
Edited by:
Alex B. Guenther, University of California, Irvine, United StatesReviewed by:
Tao Li, University of Copenhagen, DenmarkCopyright © 2020 Noe and Niinemets. This is an open-access article distributed under the terms of the Creative Commons Attribution License (CC BY). The use, distribution or reproduction in other forums is permitted, provided the original author(s) and the copyright owner(s) are credited and that the original publication in this journal is cited, in accordance with accepted academic practice. No use, distribution or reproduction is permitted which does not comply with these terms.
*Correspondence: Steffen M. Noe, c3RlZmZlbi5ub2VAZW11LmVl
Disclaimer: All claims expressed in this article are solely those of the authors and do not necessarily represent those of their affiliated organizations, or those of the publisher, the editors and the reviewers. Any product that may be evaluated in this article or claim that may be made by its manufacturer is not guaranteed or endorsed by the publisher.
Research integrity at Frontiers
Learn more about the work of our research integrity team to safeguard the quality of each article we publish.