 Pauliina Schiestl-Aalto
 Kira Ryhti
 Annikki Mäkelä
 Mikko Peltoniemi
 Jaana Bäck
 Liisa Kulmala1,4
95% of researchers rate our articles as excellent or good
Learn more about the work of our research integrity team to safeguard the quality of each article we publish.
Find out more
ORIGINAL RESEARCH article
Front. For. Glob. Change , 03 May 2019
Sec. Forest Ecophysiology
Volume 2 - 2019 | https://doi.org/10.3389/ffgc.2019.00017
This article is part of the Research Topic Carbon Transport and Dynamics in Trees View all 8 articles
Photosynthesis is not entirely synchronized with carbon sinks, implying that trees are capable of storing non-structural carbohydrates (NSC), such as soluble sugars and starch. These storages provide a buffer between carbohydrate supply and demand and also allow trees to resist drought through osmoregulation. However, estimates of the total pool size and seasonal dynamics of the NSC storage of mature trees are still rare. Part of NSC is allocated outside roots, mainly to symbiotic, root-associated mycorrhizal fungi. The quantity and dynamics of this allocation are difficult to estimate in field conditions due to the close interaction between the symbionts. The aims of this study were to (1) determine the temporal development of NSC concentrations in tree organs, (2) upscale the storage compounds to whole-tree level and (3) analyse the significance of NSC allocation to belowground symbionts as part of the carbon balance in mature pines in a boreal Scots pine stand in southern Finland. We took samples every 2–4 weeks of needles, fine roots, stem wood, shoot wood and phloem from 1 to 3 trees in 2015. Concentrations of soluble sugars and starch were analyzed from the samples and upscaled to tree level. For quantifying the third aim, we used a whole-tree carbon balance model CASSIA that incorporates daily photosynthesis, respiration and organ-specific growth as functions of environmental factors. In this study, we included the allocation to belowground symbionts as an additional carbon sink and scaled the flux using the NSC pool over the whole tree. We observed that organ-specific NSC concentrations were highest in phloem, needles and fine roots. Total NSC increased in spring, peaked during mid-summer and decreased again in autumn without any notable decrease during the most intensive growth period at midsummer. In the model analysis, 6% of yearly photosynthesis was allocated to the root-associated symbionts. The study highlights the applicability of the carbon balance approach in evaluating the importance of processes that cannot yet be directly measured.
Processes underlying tree growth have been subject to great interest in forest productivity research, but the need to understand the capability of trees to assimilate and store atmospheric carbon has recently become a topic of scientific and political debate, especially due to climate change and the critical role of forests as carbon sinks and storages. Studies on tree growth and survival have indicated that species responses to expected changes in climate differ, being beneficial to some species and disadvantageous for others. For example, Scots pine, a common tree species in Northern Eurasia is assumed to benefit from climate change as it is less sensitive to stress conditions than competing tree species (Kellomäki et al., 2008; Reich and Oleksyn, 2008). However, projections like this are still very uncertain due to limitations in our theoretical understanding of the underlying processes. This lack of understanding also concerns the carbon processes in trees, even if the assimilation of carbon, i.e., photosynthesis, is very well-understood. For example, the tree's ability to allocate photosynthesized sugars either to storage or growth in different environmental conditions is poorly known (Martínez-Vilalta et al., 2016). Thus, the estimation of tree growth under future climate requires a holistic view on whole-tree carbon balance (Fatichi et al., 2019).
Trees bind carbon via photosynthesis and use it for example for vital functions and building up new structures, i.e., for growth. The overall level of the carbon source, i.e., photosynthesis must meet the level of carbon use. However, photosynthesis is not entirely synchronized with carbon sinks and thus, internal carbon reserves that allow delaying the use of carbon are critical for tree survival. Carbon can be stored in several forms which are most commonly divided to starch and soluble sugars. Starch is largely inactive and an effective storage molecule, whereas small-sized monosaccharides are actively used for growth, energy production and other purposes. By controlling the concentration of these monosaccharides in cells, trees are also able to regulate their water content and osmotic potential (Ingram and Bartels, 1996). Thus, not only do stored carbohydrates provide a buffer between carbohydrate supply and demand, but they also allow trees to resist drought through osmoregulation and to continue water uptake and maintain both supply and demand of carbohydrates during drier periods. In cold areas, small-sized storage carbohydrates are also important because they increase the freezing tolerance of tissues (Yuanyuan et al., 2009). Hartmann and Trumbore (2016) give a detailed review of our current knowledge of these roles of non-structural-carbon compounds (NSC) in tree metabolism.
Estimates of the total NSC storage of a mature tree are difficult to obtain (Fatichi et al., 2019) and studies combining NSC storages and carbon fluxes of a tree are very rare (but see Hartmann et al., 2015; Klein and Hoch, 2015). Schiestl-Aalto et al. (2015) estimated in a model study that the total NSC storage of a boreal Scots pine increases in spring with photosynthesis, decreases during the most intensive growth period in midsummer, and increases again in autumn. Knowledge about storage processes in relation to whole-tree carbon acquisition and consumption is very limited (Stitt and Zeeman, 2012; Hartmann and Trumbore, 2016). However, the role of NSC may be pronounced under environmental change and stress-conditions. Thus, understanding of NSC regulation would be valuable for evaluating the ability of trees to survive and bind carbon during stress periods (Galiano et al., 2011; Sala et al., 2012; Dietze et al., 2014).
Species, such as Scots pine, form symbiosis with microorganisms, most importantly with ectomycorrhizal fungi (ECM, Smith and Read, 2008), extending their reach to nutrients and water via their widespread mycelium. This symbiosis with ECM is beneficial for the tree especially in nutrient poor soils, because ECM produce extracellular enzymes that decay soil organic matter (Read et al., 2004), thus releasing nutrients for tree use. Trees allocate NSC to the root-associated fungi mostly in the form of monosaccharides and organic acids (Bais et al., 2006). Free exudation passively from roots straight to the soil in ECM systems is considered minor (Jones et al., 2009), due to particularly developed functions to exchange nutrients and carbohydrates (e.g., Hartig net) between plant and fungus, thus preventing the leaking of carbohydrates and nutrients (Nehls, 2008).
This allocation, here called allocation to belowground symbionts, has been studied for decades in controlled conditions, yet the dynamics of fluxes and their quantities under varying environmental conditions in field settings are not well-understood (Dilkes et al., 2004; Jones et al., 2004). The flux of carbon to belowground symbionts is not solely determined by the rate of photosynthesis, but also dependent on the overall import rate of carbon to the root, as well as on its physiological status and surrounding environment (Farrar et al., 2003; Dilkes et al., 2004). Plants are, to some extent, able actively to regulate the carbon flux to mycorrhizal fungi (Jones et al., 2004) in relation to the nutrients derived by the fungus (Nehls, 2008). However, some recent findings suggest that the process is more complex and may lead to a suboptimal trade between carbon and nitrogen from the tree's perspective (Franklin et al., 2014; Hasselquist et al., 2016). In ECM systems, fungi have been reported to receive up to 19 times more carbohydrates from the host tree compared with the normal exudation of root systems (Nehls, 2008), resulting in a strong belowground carbon sink. As a result, an appreciable amount of carbon flows via roots and associated microorganisms in a boreal mixed-conifer forest, as newly produced photosynthates released from the rhizosphere may temporarily account for 65% of the total CO2 emissions of the forest floor (Ekblad and Högberg, 2001). Such observations are still sparse and uncertain, and the feedback effects of this investment on whole-tree carbon balance are poorly quantified.
At least to date, there are no direct methods of measuring the allocation to symbionts, due to the close interaction between root and fungi. Indirectly, the carbon flux to the symbionts could be estimated as a “missing sink” of carbon, if all other fluxes and storages could be traced. For such a synthesis, the within-season variation of the NSC storage is of crucial importance but has rarely been available at the whole-tree level. Dynamic process models of the carbon balance are efficient tools suited for synthesizing such measured information about fluxes and storages. As noted above, the dynamic carbon balance model CASSIA (Schiestl-Aalto et al., 2015) has already been used for estimating the dynamics of NSC during the growing season, however, without any direct measurements of storage compounds. Measurements of NSC combined with other available data on carbon flux rates could constrain the model sufficiently to allow us to make inferences about the allocation to belowground symbionts.
The aims of this study were to
1) Determine the temporal development of NSC concentrations in tree organs
2) Upscale the storage compounds to whole-tree level
3) Link the observed NSC dynamics to the CASSIA model to explore the possible role of carbon allocation to belowground symbionts in the carbon dynamics of trees.
First, we measured the soluble sugar and starch concentrations of needles, shoot wood, stem wood, phloem and fine roots to study questions 1 and 2. For analyzing question 3 we included carbon allocation to belowground symbionts as a new carbon consuming process in the CASSIA model, collected data about other carbon fluxes and storages at our site, then estimated the level of carbon allocation to belowground symbionts as that leading to an agreement between the measured and simulated NSC storage levels. Finally, we discuss the significance, reliability and challenges of the results.
The study site is a Scots pine stand at the SMEAR II station (Hari and Kulmala, 2005) located in southern Finland (61.52°N, 24.17°E). It was established by sowing in, 1962 on a medium fertile site, classified as Vaccinium type (Cajander, 1926). Soil above the bedrock is Haplic podzol and soil depth is ~0.5–0.7 m. Norway spruce forms an understory below the pine canopy. The ground vegetation is formed by dwarf shrubs, such as Vaccinium sp. and feather mosses, such as Pleurozium schreberi with a sparse occurrence of grasses and herbs, such as Deschampsia flexuosa.
The site has a boreal climate with long cool days in the summer and short cold days in the winter. The mean annual temperature is +3.5°C whereas mean monthly temperature varies from −7.7°C in February to 16.0°C in July (mean for 1980–2009, Pirinen et al., 2012). Mean annual rainfall is 711 mm distributed quite evenly throughout the year.
The site was partly thinned in 2001 but our NSC measurements (see below) took place in the unthinned part. Diameters and heights of all trees taller than 1.3 m were measured in an unthinned area of 1,800 m2 in the summer 2016. Based on the diameter at 1.3 m, trees were divided into four classes (Table 1). We calculated the needle mass of a mean tree in each class based on Repola (2009) and assumed the crown width to be 40% of the total height in classes 1–2 and 30% in class 3.
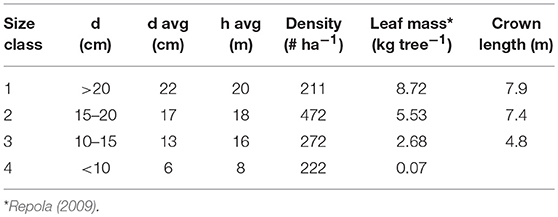
Table 1. Diameter (d), height (h), and stocking density at the study site divided into different size classes.
Photosynthetically active radiation (PAR) was measured at the height of 18 m at 1 min intervals. Air temperature, CO2 and water vapor (H2O) concentrations and relative humidity (RH) were measured at the height of 16.8 m. The net ecosystem CO2 exchange (NEE) was measured with a closed-path eddy-covariance (EC) measuring system above the stand at the height of 23 m. A detailed description of the instrumentation is in Vesala et al. (2005) and the data post-processing in Kolari et al. (2009). Gross primary production (GPP) was derived from NEE by subtracting ecosystem respiration, which was modeled based on night-time observations. Missing values were replaced by empirically modeled ecosystem photosynthesis as described in detail in Kolari et al. (2009). Soil temperature was measured with thermocouples from the A, B, and C-horizons (2–5, 5–23, and 23–60 cm, respectively) and volumetric water content (m3 m−3) was measured at 15 min intervals by time domain reflectometry (TDR). More information about the measuring devices used is available in Vesala et al. (1998).
In order to analyse the temporal dynamics of storage pools, we regularly took samples of needles, roots, stem and shoot wood from three trees (1, 2, 3) in 2015. The samples of fine roots were collected from soil cores taken near the sample trees. The sampling interval was ca. 3 weeks for the most intensively studied tree 2 in the active season 2015 with a sparser interval offseason. In total, we had 13 sampling dates during the year. Trees 1 and 3 were analyzed less frequently, during 3–9 of the sampling dates, depending on the organ. Phloem was collected with a sparser interval from other, close-by trees because we wanted to cause as little damage to our sample trees as possible. From the phloem sample trees, also stem xylem samples were taken in order to ensure that their NSC concentrations were consistent with the actual sample trees. Two stem wood samples were taken at the height 1.3 m and inside the canopy using a corer (= 5 mm). Fine roots of two size classes (<1 and 1–2 mm) were sampled separately from a soil core (= 5 cm,) taken from humus and A-horizon layers. The needles were pooled on each measurement day from six shoots selected from around the canopy. We took one pooled sample per tree of 1–2 years old needles and one sample per tree of current needles. Since the sampling of the current needles only began after they reached their final length in mid-August 2015, we completed the series by comparing NSC concentrations in growing needles and 1–2 years old ones by taking samples of both age classes in a 3 weeks interval in July-August in 2017.
All samples were frozen in liquid nitrogen: needles, wood and phloem immediately after sampling and roots after they had been washed and separated from soil. Samples were stored at −80°C until they were freeze-dried (SciQuip Ltd, Merrington, UK) for 3 days and milled (2000-230 Geno/Grinder, Spex SamplePred, USA). After pre-processing, non-structural carbon concentrations in the samples were analyzed at Finnish Forest Research Institute (now Natural Resources Institute Finland). Approximately 50 mg of dried lyophilizator and finely ground samples were extracted twice by 80% ethanol in a block heater (100.5°C for 15 min) and the extracts were analyzed after being vaporized with nitrogen and silylated with 500 μl 20% TMSI (trimethylsilyl-imidazole in pyridine) reagent overnight. Soluble sugars were analyzed by gas chromatograph [Agilent 7890B GC, Agilent, Santa Clara, CA, US) equipped with a DB-5MS capillary column (30 m × 0.25 mm id. × 0.25 μm)] and mass spectrometer (Agilent 5977A MSD). Split injection ratio was 20:1 and helium was the carrier gas. The initial temperature of 110°C was increased at the rate of 10°C min−1 up until 320°C and kept there for 14 min. Injector temperature was 260°C, MS interface: 300°C, and ion source 230°C. Compound identification was Agilent Chemstation software with mass spectral libraries. Quantitative analyses were performed based on internal standard ertyhritol and external sugar standards. After the extraction of the soluble sugars, the pellet was resuspended in sodium acetate buffer and starch was enzymatically degraded to glucose with α-amylase with K-TSTA Total Starch Assay Kit (Megazyme Internation Ireland, Wicklow, Ireland) and the concentrations were determined using Shimadzu UV-2600 (Shimadzu Co, Kyoto, Japan). The samples were pre-processed and analyzed in three sets according to the same procedure.
When there was more than one daily sample per organ, we calculated the average concentrations of starch and soluble sugars and standard deviations (s) of those as
We used the average concentrations in stem wood samples taken at 1.3 m and inside tree canopy because the differences in the soluble sugar and starch values were minor and not systematic between these two heights.
To obtain whole-tree storage pool sizes, we used allometric models that are suitable for our site for upscaling from individual samples. The NSC sample trees belonged to size class 2 and we made the mass calculations according to their mean dimensions (Table 1). Needle mass was calculated based on tree height and diameter as suggested by Repola (2009). Needle longevity at our site is 3 years. Based on the litter measurements at the study site, we assumed that needle mass was reduced by 1/3 from mid-October when the oldest needle class falls down as litter until the beginning of June when the new needle age class grows. We set the needle:fine root mass ratio as 2:1 (Vanninen and Mäkelä, 1999). Total xylem volume, i.e., wood in stem, branches and coarse roots was calculated with tree height (h), diameter at 1.3 m (d) and form factor ϕ (0.6, Chiba, 1998; Mäkelä and Valentine, 2006; Falster et al., 2015) and converted to wood mass (mw) with mean wood density, ρ, of 200 kg C m−3 (Hakkila, 1979), as follows:
80% of total xylem was assumed to be sapwood based on data gathered in southern Finland from similar types of forests as our study site (Falster et al., 2015). Sapwood was further divided to 1) smaller branches (later called shoot wood) and 2) bigger branches and trunk (later called stem wood) with ratio 1/9. Following Hölttä et al. (2013), phloem mass was assumed to be 10% of sapwood mass. Shoot and stem wood and phloem masses were considered constant throughout the year. According to Mäkelä and Vanninen (2000), fine root biomass in middle-aged and old Scots pine stands did not have clear seasonal cycle in southern Finland. Thus, we assumed also fine root biomass to be stable throughout the year i.e., the mortality equals the growth rate. The upscaled masses are presented in Table 2.
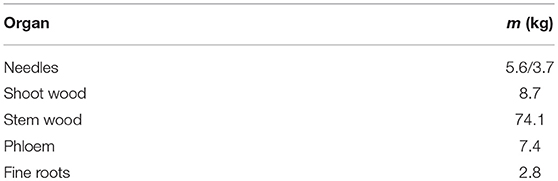
Table 2. Estimated mean dry masses (m) of tree organs in our sample trees. Needle mass is higher during growing season and lower after litter fall in autumn.
For each measurement day i, the total mass of carbon in soluble sugars W or starch W (g C) in the whole tree is derived as follows:
where m is the dry mass of organ k (needles, shoot wood, stem wood, phloem, roots, Table 2) and cSs and cSt are the soluble sugar and starch concentrations (g g−1) of the organ, respectively. The average concentrations of the three sample trees were used when possible; otherwise, we used the value for the most intensively studied tree 2.
Soluble sugar and starch concentrations in shoot wood were missing on the first sampling date (Mar 17 2015) and were amended by the value of the second sampling date (Apr 2). The sugar and starch content did not vary significantly between roots smaller than 1 mm and roots with diameter of 1–2 mm and therefore, we pooled those and used the average for all fine roots. Our root NSC content showed a similar yearly pattern and level as observed by Oleksyn et al. (2000) with starch content peaking during early summer and again in autumn whereas soluble sugar content stayed more invariant. Thus, we filled the three missing observations from our root NSC series (Mar 17, Apr 21 and Nov 17) by combining the results by Oleksyn et al. (2000) with our measurements (Figure S4). Similarly, we combined the yearly patterns of phloem NSC contents measured by Gruber et al. (2013) and Jyske et al. (2015) with our measurements to form a full series of phloem NSC data. The datasets of Gruber et al. (2013) and Jyske et al. (2015) show similar patterns of phloem NSC even though they are measured from different locations and different conifer species (Figure S4). Three and eight out of 13 data points were gapfilled in root and phloem series, respectively.
We analyzed the sensitivity of total NSC storage to the concentration differences in different trees using the 3 sampling days on which we had more than one measurement for most of the organs. For organs with one measurement available only, we used the average deviation of all sampling dates for that organ. We calculated “low” and “high” total NSC estimates by assuming the concentrations to be one standard deviation below or above the average, respectively.
To analyse the seasonal dynamics of whole tree carbon balance and C allocation to different functional pools, we used the recently developed process based model CASSIA (Schiestl-Aalto et al., 2015). It is a tree carbon balance model with time step of 1 day. Photosynthesis (P) is modeled as well as carbon used for structural growth (G), carbon released as respiration (R) and carbon allocation to belowground symbionts (B). Thereafter the change in total NSC storage (W, kg C tree−1) is
We further divided the storage to soluble sugars (WSs) and starch (WSt) so that W = WSs + WSt assuming that photosynthates enter the soluble sugar pool and respiration, growth and other carbon sinks take carbon from the soluble sugar pool, i.e.,
and
where Fw is carbon flux from starch to soluble sugar pool or from soluble sugar to starch pool.
Soluble sugars are known to contribute to maintaining the water potential of the tree (Ingram and Bartels, 1996). The concentrations of soluble sugars have also been observed to be less variant than those of insoluble sugars (Sofronova and Kaipiainen, 1996; Hoch et al., 2003; Martínez-Vilalta et al., 2016; Smith et al., 2018). Thus, we assumed that soluble sugars are kept at a constant level () by converting soluble sugars to starch when and starch to soluble sugars when . As a result, the variation in total NSC storage will be reflected in the starch pool if .
We applied the model to simulate the daily storage pool sizes and the carbon sinks for the year 2015 using modeled photosynthesis and environmental factors measured at SMEARII station as input (see section Site and Background Measurements). We initialized the model with the first measured storage of the data series on Mar 2015 (day = 76) so that W0 was set to 0.75 kg C tree−1.
For estimating the photosynthesis of our sample trees, we used a photosynthesis model which provides stand photosynthesis distributed into tree size classes. The simulated stand consisted of the size classes measured, the sample trees representing size class 2 (Table 1). The SPP model (Stand Photosynthesis Program) uses a time step of 30 min and it is calibrated at the study site (Mäkelä et al., 2004, 2006; Kolari et al., 2007; Duursma et al., 2009). SPP dynamically calculates the light attenuation of direct and diffuse radiation, stomatal conductance, transpiration, evaporation and photosynthesis for each size class through the canopy using meteorological input, site and tree characteristics, and the simulated water balance of the stand. We included size classes 1–3 (Table 1) into the program. The model determines the light environment based on the locations and leaf masses of crowns in the different size classes and does not automatically account for stems that shade the leaves underneath. We therefore also included a bare tree stem class which had the mean tree diameter, height and density of all trees but only affected the light attenuation as its photosynthetic features were set off. Leaf photosynthesis was modeled with the Farquhar model (Farquhar et al., 1980) using the analytical solution by Baldocchi (1994) and the formulation adopted from Collatz et al. (1992). The stomatal model used is described in Leuning (1995). The fourth size class and ground vegetation were ignored in the simulation. We estimated the tree-specific photosynthesis in size class 2 by dividing the estimated daily production with its number of trees (Table 1).
Growth and maintenance respiration of organs were calculated from organ masses and organ-specific temperature functions as in Schiestl-Aalto et al. (2015). However, parameterization of root maintenance respiration was refined using continuous, darkened soil chamber measurements (Pumpanen et al., 2015) of years 2002–2005 at the study site. These chambers measure forest floor CO2 emissions i.e., the sum of autotrophic respiration by ground vegetation and tree roots and heterotrophic respiration. First, we estimated the respiration of ground vegetation using the primary production of ground vegetation at the study site which is reported to be in average 146 g C m−2 y−1 (Kulmala et al., 2011). We assumed that half of it is released in snow-free season as autotrophic respiration based on daily average soil temperature (T) in A horizon and a common temperature response, as follows,
where Q10 was set to 2.5 and r0 was estimated so as to make the annual sum equal the estimated annual respiratory flux. We subtracted the daily estimate of the ground vegetation respiration from the mean daily soil respiration measurements of years 2002–2005 and fitted a similar temperature response (eq. 7) to the residual to describe soil respiration without ground vegetation, resulting to r0 = 0.001 kg C m−2 and Q10 = 2.9. These parameters were used for calculating soil respiration for our measurement year (2015). Pumpanen et al. (2015) determined the daily ratio of autotrophic tree root respiration to heterotrophic respiration at our study site. We used this parameter to decouple the autotrophic respiration from the total soil respiration. Finally, we multiplied the resulting autotrophic respiration with , where mR is the fine root mass of the model tree (Table 2) and mRtot is the total fine root mass per m2.
Tree growth was divided into the growth of needles, primary (shoot) wood, secondary (stem) wood, and fine roots. Growth is determined as a combination of the sink and the source: Environmental factors, mainly air temperature, determine the potential daily sink of carbon for each organ separately and the NSC storage reduces the growth from potential if the level of the storage is lower than a threshold Wcrit. The rate of growth of each organ, i, is determined as:
where k(t) ϵ[0,1] is the limitation by storage when NSC is lower than Wcrit. Wcrit was set to equal the initial NSC pool W0 which we assume to be the baseline that the tree attempts to maintain to prepare for stress occasions (Schiestl-Aalto et al., 2015). Previously, we found out that carbon availability did not affect intra-annual growth variation in most conditions but instead, the effect of varying environmental factors explained the interannual variation of growth in all organs with (Schiestl-Aalto et al., 2015). Thus, the effect of k(t) is minor for the results of the growth model in common, non-stressed conditions. The immediate response of growth to environmental factors is represented by gi(t), described with a sigmoid function (Sarvas, 1972) and parameterized for boreal Scots pine (Hänninen, 1990). The growth response to the ontogenetic development stage of an organ is represented by fi(t) ϵ[0,1], described with a sine shaped (primary growth and roots) or asymmetric (secondary growth and needles) function and parameterized for our study site (Schiestl-Aalto et al., 2015). Li is the maximum daily growth rate which is reached in the middle of the growth period if environmental conditions are optimal and NSC storage is not limiting. More information on the growth modeling and parameters are described by Schiestl-Aalto et al. (2015). The parameters of the height and diameter submodels (LS and LD0, Table 3) were re-calibrated against measured average yearly growth of trees in the same size class (2) at the study site during years 2011–2015 to further increase the reliability of the estimated growth.
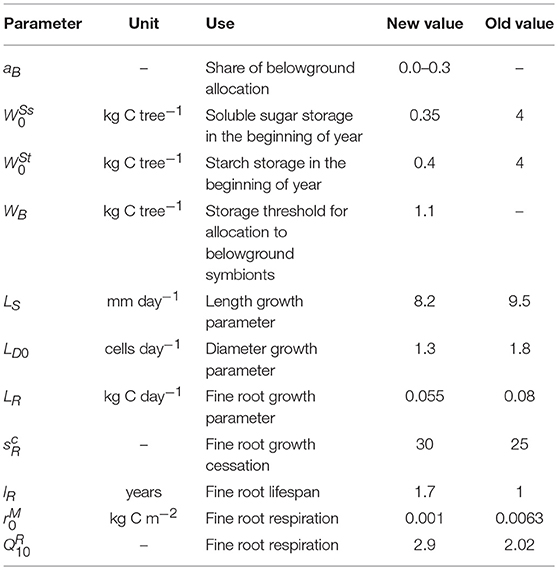
Table 3. New or adjusted parameters compared with Schiestl-Aalto et al. (2015).
As an alteration to the original parameters by Schiestl-Aalto et al. (2015), the value of root growth cessation parameter (unitless) was increased from 25 to 30 based on qualitative analysis of root elongation photographs taken at our study site (pers. communication with Heljä-Sisko Helmisaari). We previously assumed the mean lifespan of 1 year according to the available information on the smallest fine roots. In this study, we increased the average lifespan of fine roots to 1.7 years as various studies have reported decreasing root turnover rates with increasing diameter (Janssens et al., 2002; Leppälammi-Kujansuu et al., 2014; McCormack et al., 2015; Solly et al., 2018).
NSC allocation to belowground symbionts, mainly to root-associated fungi, was added to the model as a new carbon consuming process assuming that a certain proportion, aB, of daily photosynthesis is allocated to belowground symbionts if the total storage level exceeds a threshold. Belowground carbon allocation is sensitive to soil temperature (Ericsson et al., 1996; Hawkes et al., 2008) and synchronized with decrease in shoot growth (Iivonen et al., 2001). Thus, the process was set to begin after soil temperature in B-horizon has increased above 10°C, which coincides with the cessation of shoot growth period. The threshold for the allocation to belowground symbionts (WB, kg C tree−1), was determined as the sum of the level of storage under which growth decreases in the original model version (Wcrit) and the average pool of carbon that was needed for autotrophic respiration during late season (Oct-Dec) in 1997–2012 according to Schiestl-Aalto et al. (2015). Thus, allocation to soil symbionts Bi on day i, after shoot growth cessation, is,
where Pi is photosynthesis (kg C day−1 tree−1) during day i.
We tested the behavior of modeled NSC storage by altering the parameter aB value from 0 to 0.3.
The forest was a strong sink of carbon for most part of the year except for the winter months when respiration caused small carbon losses from the forest while photosynthesis was not active (Figure 1A). Daily PAR radiation was close to zero during winter and around 600 μmol m–2 during mid summer (Figure 1B). Daily average temperature varied between –20 and +20 Celsius degrees in January and July, respectively (Figure 1C). Soil was moist throughout the year except for Aug-Nov when soil moisture in horizon A remained at ~0.1 m3 m−3 (Figure 1D).
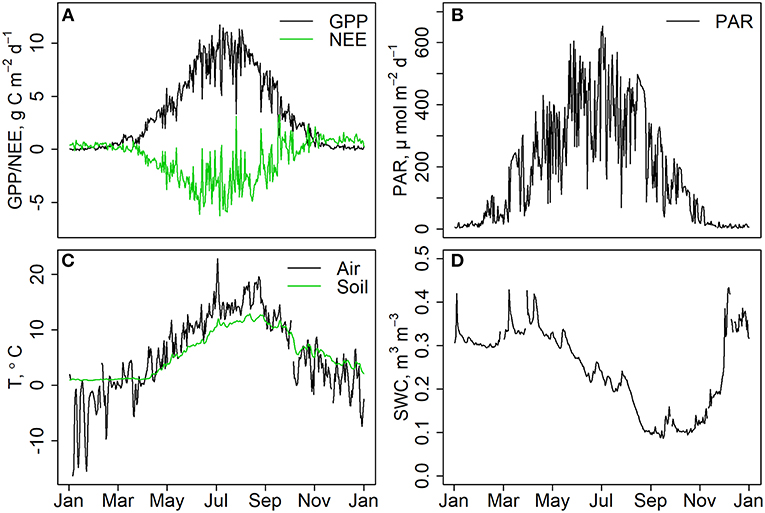
Figure 1. (A) Daily gross primary production (GPP) and net ecosystem exchange (NEE), measured with eddy covariance technique in the study year 2015. Negative NEE indicates that the forest was a sink of carbon. (B) Daily mean PAR radiation at the canopy height, (C) daily mean air and soil temperature in A-horizon. (D) Soil water content in upper B-horizon.
In general, the largest soluble sugar concentrations were measured in needles and phloem with the highest values in winter and early spring and the lowest in the middle of the season (Figure S1; Figure 2A). This is mainly due to alpha- and beta-glucose as well as fructose which showed the highest values in the early spring before the growing season and the lowest in the middle of the summer (Figure S1). Sucrose, on the other hand, showed an opposite pattern with the highest values in needles in the middle of the season (Figure S1). The concentration of soluble sugars in xylem did not show an equally clear seasonal cycle as that in the needles (Figure 2B) even if the sucrose was clearly increasing in the xylem in the upper part of the stem (Figure S1). The soluble sugar concentrations in roots were also slowly increasing during the season (Figure S1; Figure 2A).
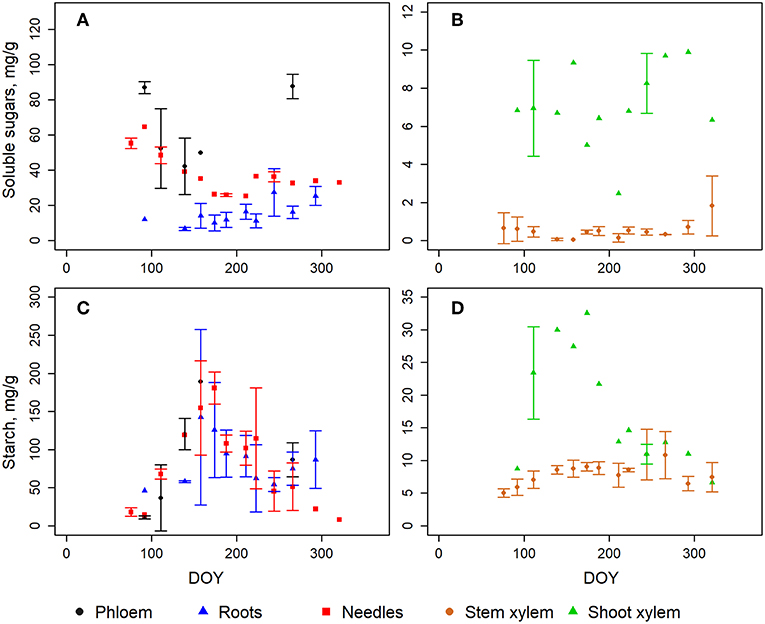
Figure 2. The measured content of soluble sugars (A,B) and starch (C,D) in different tree organs. The error bars represent the standard deviation when samples from three trees were analyzed. Note different scales in y-axes. The fine roots are a mean of six samples since the concentration in the ones smaller than 1 mm did not differ from those of 1–2 mm. DOY represents day of year.
The annual cycles of starch concentration in needles, phloem and roots were comparable, peaking at midsummer and being very low in the offseason (Figure 2C). Xylem had much lower starch content but had some distinguished annual patterns in shoot wood (Figure 2D).
The mean concentration of glucose and fructose were similar in the current and 1-year-old needles during needle development in Jun-Aug (Figure S2). However, sucrose and starch had remarkably different patterns: the sucrose concentrations declined (from 32 to <1 mg g−1) and starch concentration slowly increased (21–80 mg g−1) in growing needles (Figure S2). At the same time, sucrose stayed low (2–4 mg g−1) and starch decreased (from 175 to 56 mg g−1) in old needles.
The concentrations and annual patterns of NSC in different tree individuals were comparable except for some fructose and sucrose values (Figure S1). However, it is noteworthy that the fructose concentration seemed to be overall higher in the samples that were analyzed in the third set compared to the two earlier sets (Figure S3) despite the exact same procedure and analysers. Thus, we decided to exclude the fructose concentrations measured at the third time from the analysis due to possible offset in fructose standard at that time.
Phloem had the highest pool of stored carbohydrates when the concentrations were scaled up to the whole tree (Figure 3A). The share of phloem was on average 41% of the total NSC storage of the tree. NSC storage in stem xylem was on average the second largest (24% of total NSC) due to high sapwood mass despite the low concentrations of both soluble sugars and starch. During summer, however, NSC in needles exceeded that of stem xylem. NSC in fine roots represented on average 9% of the total NSC. The total NSC storage varied from 0.8 to 1.9 kg C tree−1 within the year, being the highest in June.
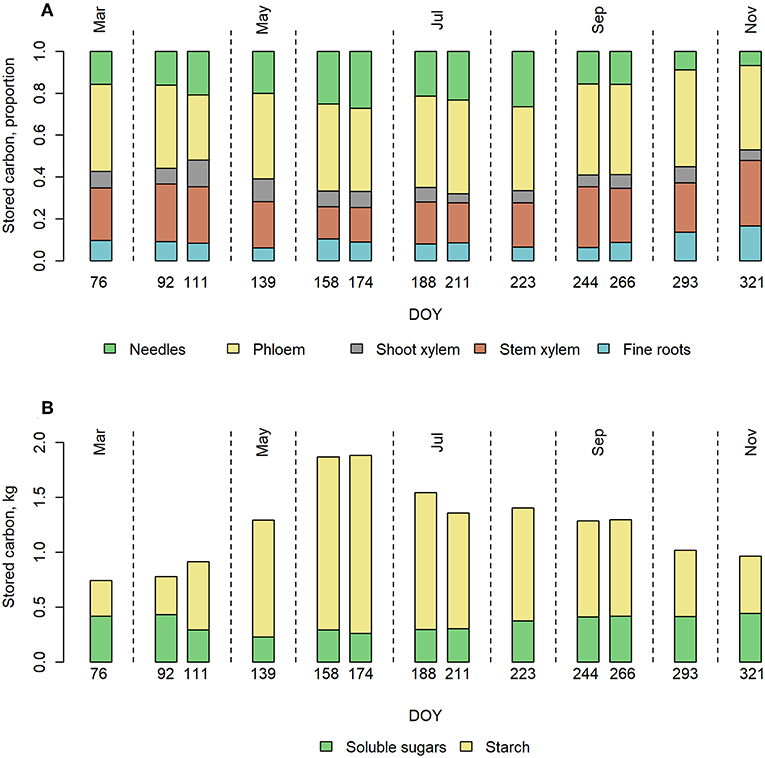
Figure 3. Upscaled NSC storages in pine trees over the year 2015. (A) Proportion of NSC in the different tree organs and (B) total NSC storage divided to soluble sugars and starch, in a Scots pine belonging to the size class 2 (Table 1) at our measurement site in 2015.
The soluble sugar level stayed rather stable throughout the year. However, some variation could be seen such that in spring, sugar levels drop below average and below model prediction. Total starch storage increased rapidly in spring, peaked during early summer and decreased slowly toward winter (Figure 3B).
The sensitivity of the upscaled whole-tree NSC storage to the concentration differences in different trees revealed that the higher or lower estimates for NSC concentrations (see Upscaling the Sizes of Storages) increased or decreased the total NSC storage by up to 26%, being the highest in September and the lowest in July (Figure S5). However, the possible inaccuracy in the measurements mainly affects the total NSC storage and not the seasonal pattern in it.
The assumption of no allocation to belowground symbionts (i.e., parameter aB in eq. 9 was set to 0) resulted in an overestimation of NSC in the latter half of the year whereas the highest estimation (aB = 0.3) resulted in an underestimation of NSC (Figure 4A). The closest estimation was based on the assumption that 10% of the daily GPP is allocated to root-associated fungi, i.e., aB = 0.1. Thus, we used this formulation in the further analysis. This assumption also led to a close correspondence between measured and modeled NSC when total storage was divided to starch and soluble sugars (Figure 4B).
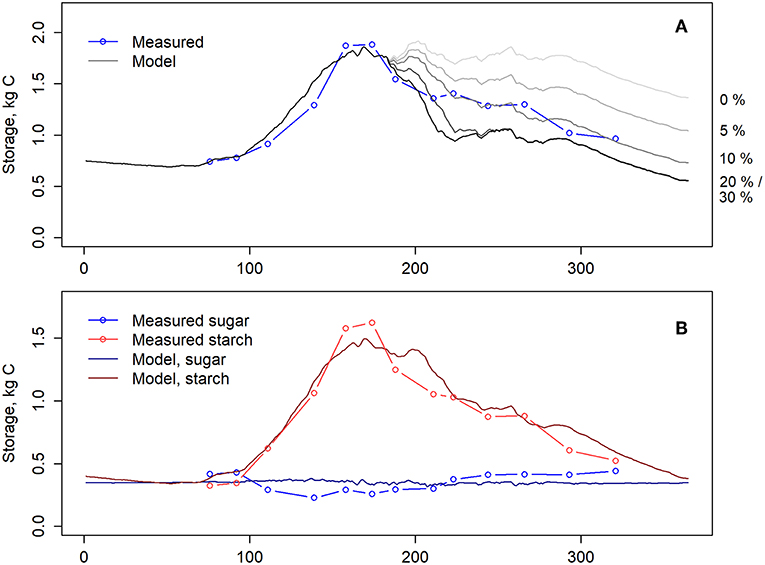
Figure 4. (A) Measured (blue) and modeled (gray) total NSC storage. The model was simulated with various allocation levels to belowground symbionts, via changing parameter aB in equation 9 from 0 to 0.3. The allocation levels of the different simulations are shown on the right side. (B) Measured and modeled soluble sugars and starch. Model simulations were conducted with aB = 0.1. Lines with dots indicate measurements and solid lines model. Blue denotes soluble sugars and red starch.
10.8 kg C per tree (in size class 2) was assimilated in photosynthesis during the year. 6.4 kg (59%) of this was released as maintenance and growth respiration and 3.8 kg (35%) was used for structural growth (Figure 5A). The respiration and growth values include the whole tree, i.e., needles, stem and roots. During midsummer, respiration was the most active because of both intensive growth and high temperatures. According to the formulation of symbiont allocation (B) that led to the closest NSC storage, 0.64 kg C was allocated to belowground symbionts which was 6% of annual photosynthetic production. Photosynthesis exceeded carbon consumption (i.e., the sum of growth, respiration and allocation to below ground symbionts) during spring and early summer whereas during the latter part of the year daily consumption was mostly higher than photosynthesis (Figure 5B).
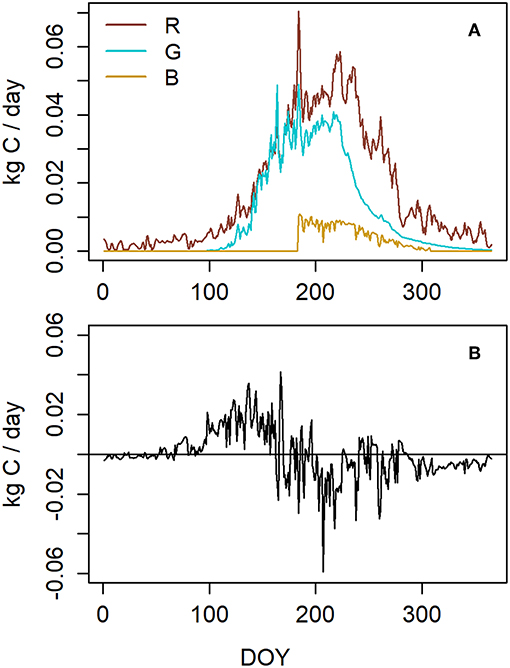
Figure 5. (A) Modeled carbon sinks. R stands for respiration, G for growth, and B for the allocation to belowground symbionts. G and R include growth and respiration of the whole tree, i.e., needles, stem, and roots. (B) The difference between photosynthesis and carbon consumption in a Scots pine belonging to the size class 2 (Table 1) at our measuring site in 2015.
Whole tree NSC analyses in field conditions are not commonly reported although understanding of growth processes and C allocation is needed to estimate the potential of C storage in future conditions. In this study, we reported the seasonal changes in sugar and starch concentrations and total pool sizes of different organs in a mature Scots pine tree in southern Finland. We found that while the soluble sugar pools and concentrations were relatively stable over the whole year, the total NSC pool increased from the start of the growing season, peaking in June and declining again toward September. At the peak time most of the NSC reserves were stored as starch. Incorporating our measurements into a whole-tree daily carbon balance model revealed a late-summer carbon sink previously unaccounted for, which we propose to be explained by allocation to belowground symbionts.
The measured soluble sugar and starch concentrations in different tissues in this study are in line with several previously reported values (e.g., Hoch et al., 2002; Gruber et al., 2012, 2013). However, also higher concentrations for needles and stems have been found (Sofronova and Kaipiainen, 1996; Mandre et al., 2002; Hoch et al., 2003; Würth et al., 2005) which naturally lead to higher whole-tree NSC. Martínez-Vilalta et al. (2016) compiled NSC storage data from 121 studies for different functional tree types. Our values for soluble sugar and starch in different organs fit into the range of the reported values for coniferous tree species even though our soluble sugar content of needles is at the lower end of the range of variation. Hartmann et al. (2015) reported similar soluble sugar values for Norway spruce saplings as measured in our study while their estimates for starch storages were substantially lower. Different methods for analyzing NSC concentrations may also lead to large differences in the estimates (Quentin et al., 2015) and thus, comparing absolute values of different studies is problematic.
The soluble sugar concentration in needles of this study follows the well-known pattern where the concentration increases for the cold period (Figure 2A) because soluble sugars increase freezing tolerance of tissues (Yuanyuan et al., 2009). In accordance with Gruber et al. (2012), we did not observe similar increase in other organs' soluble sugar concentrations. This led to whole-tree soluble sugar storage staying rather stable throughout the year except for a small decrease in the middle of the growing season (Figure 3B). Stable soluble sugar concentrations accompanied with fluctuations in starch have also been found in coniferous tree species (Martínez-Vilalta et al., 2016) and evergreen broadleaves under warmer climatic conditions (Smith et al., 2018). The observations support our model formulation where soluble sugars are kept constant by regulating starch storage size according to the activity of the source and the sinks. Nevertheless, this assumption should be tested in conditions with strongly limited carbon availability.
Our data indicated that in most tree organs, within comparable tree individuals in the same stand, NSC concentrations are highly synchronized in time. This justifies our choice of coarser temporal sampling resolution for a subset of the sample trees especially as regards stem xylem, roots and needles. However, larger between-tree differences were observed in phloem sugars and root starch (Figure S1 and Figure 2), suggesting that special attention should be paid to these measurements in the future. We acknowledge that a higher number of spatial and temporal replicates would have made the dataset and the interpretation of the results more reliable. Greater sample size would also allow more accurate comparison with previous studies on NSC concentration in tree organs.
However, total NSC estimates for the whole tree are very rare and as such valuable for increasing our understanding on the variations of the storage roles between organs and further to whole tree carbon dynamics (Fatichi et al., 2019; but see Furze et al., 2019). In our analysis, the total NSC storage in the tree (size class 2) before the beginning of growing season (DOY = 76) was 0.74 kg C which is only 20% of the simulated structural growth during the year and 30–40% of total leaf biomass. This suggests that the majority of carbon used for growth has to originate in recent photosynthates. Indeed, isotopic measurements have indicated that current photosynthates mostly provide the material for growth in normal conditions (Gessler and Treydte, 2016). In contrast, NSC storages in aboveground woody biomass alone were sufficient to replace about 60% of total leaf biomass of Picea abies, Abies alba and Pinus sylvetrsis in the study by Hoch et al. (2003). Also, substantially higher NSC estimates have been obtained for deciduous tree species (Hoch et al., 2003; Furze et al., 2019). In woody plants, the majority of non-structural carbon is stored in the form of starch, fructosans, soluble sugars and fat (triacylglycerol; Fischer and Höll, 1991). Lipids, which were not measured in this study, are forming a large portion of storage carbohydrates in some tree species but the pool of lipids does not vary significantly across the growing season in any species (Hoch et al., 2003).
There is an ongoing debate of whether NSC storages are “active” vs. “passive” (Sala et al., 2012; Dietze et al., 2014) that is, is carbon actively allocated to NSC storages or are they only a direct consequence of a difference between the source and sinks of carbon. Recent findings suggest that carbon is allocated to storage even under strongly limited carbon supply (Wiley et al., 2013; Hartmann et al., 2015). Thus, allocation to storage on the one hand and to growth and tissue maintenance on the other hand may be different under stress from normal conditions (Wiley and Helliker, 2012; Hartmann and Trumbore, 2016). This is in line with our model structure where growth is reduced by decreased NSC storage. Further model development would benefit from a higher NSC measurement resolution which would also allow us to study the possible effects of water stress in NSC allocation dynamics.
In our calculations NSC in phloem accounts for 31–46% of the total NSC of the tree and as such phloem is the most significant individual tissue for NSC storage. We assumed that the amount of phloem was related to sapwood mass (Hölttä et al., 2013). Increasing or decreasing phloem mass by 20% only affected total NSC by <8%. We conclude that the uncertainty that arises from estimating phloem mass is smaller than the uncertainties that arise from the analysis method.
As photosynthesis mainly exceeds carbon consumption during the first half of the year (Figure 5B), NSC increases without decreasing below the pre-growth level even during the most intensive growth period. On the other hand, an inhibition of photosynthesis for example due to some stress condition would quickly lead to a shortage of carbon given that the stressor didn't directly affect the growth rates. At our study site, this kind of conditions have not yet been observed. Instead, growth is limited by temperature rather than photosynthesis at short timescales (Schiestl-Aalto et al., 2015).
We previously estimated the level and yearly pattern of NSC storages in Schiestl-Aalto et al. (2015). The estimated level was based on previous concentration measurements of, for example, Sofronova and Kaipiainen (1996) that are higher than our current concentration estimates. Thus, our current total NSC storage (0.74–2 kg C tree−1) is significantly lower than in the original model version (app 8 kg). Nevertheless, the magnitude of the annual variation is similar. The yearly pattern of measured NSC showed a similar peak during spring and early summer as suggested by the original CASSIA version. However, the original version of the model also predicted a second NSC peak in early autumn after aboveground growth cessation, which we did not observe in the measurements.
The quantification of carbon allocation to symbionts in field conditions remains challenging even though its importance is widely recognized at sites with low fertility, where nutrients can be mobilized from insoluble sources by microbes (Bais et al., 2006; Finlay, 2008; Phillips et al., 2008). As nutrient uptake increases growth potential (i.e., enhanced photosynthesis rate), there are feedbacks between above- and belowground allocation. As a result, there is a site and forest type dependent limit of carbon that is profitable for the tree to allocate to belowground symbionts for exchange of nutrients. Trees are known to some extent to be able to regulate the rate of this carbon allocation (Jones et al., 2004) and the control is assumed to depend on photosynthesis, environment as well as tree and root status (Farrar et al., 2003; Dilkes et al., 2004). However, it is also suggested that in some conditions, mycorrhizal fungi can have a parasitic rather than symbiont role, which would mean that this regulation does not always function (Franklin et al., 2014; Hasselquist et al., 2016). In this study, we explored the proposition that the late summer carbon sink unaccounted for by the original CASSIA model could be explained by carbon allocation to belowground symbionts. Assuming this allocation to take place after soil has warmed and the primary aboveground growth has ceased, we estimated the proportion of daily GPP that was allocated to root-associated symbionts in such a way that the model closed the carbon balance, when all other parameters and flux rates had been estimated to match the measurement site to our best knowledge. Nevertheless, our current formulation of the allocation to belowground (Equation 9) leads to a sudden onset after aboveground primary growth cessation. In nature, the switch is probably slower and overlapping but without further knowledge, the current formulation is simple and leads to a match between the estimated and observed NSC pool.
Our results indicate that 6% of the yearly photosynthesis, which is 16% of non-respiratory carbon consumption, is allocated below ground to symbionts in this particular site. In forest ecosystems where ectomycorrhizal fungi are abundant, photosynthates are mostly allocated to root-associated ectomycorrhizal fungi, whereas free exudation to soil is considered negligible (Nehls, 2008; Jones et al., 2009). Our modeled estimation is in agreement with other estimates for experiments conducted with different methods. In a 14C pulse labeling study, the carbon allocation of Scots pine saplings to ectomycorrhizal fungi was estimated to be ~16% of net primary production (NPP) (Leake et al., 2001). Finlay and Söderström (1992) estimated the carbon cost of ectomycorrhizal fungi to be 15% of NPP in a Swedish Scots pine stand and Vogt et al. (1982) 14 and 15% in young and old Abies amabilis stands, respectively. Ryan et al. (1996) estimated the carbon balance of Pinus radiata in Australia and found an unknown sink of 22 and 0% of NPP in control and fertilized/irrigated plots, respectively, which can be interpreted as allocation to root-associated fungi. Hobbie and Hobbie (2006) combined nitrogen and carbon fluxes at Arctic tundra and suggested that 8–17% of GPP was allocated to fungi.
Our simulations indicated 59% share of autotrophic respiration which is somewhat higher than the commonly used estimate 50% but well in line with the respiration values reported for boreal ecosystems (DeLucia et al., 2007). The environmental relationship for respiration is parametrized using chamber measurements at the same site (see Schiestl-Aalto et al., 2015 and Photosynthesis) and thus, modeled respiration as well as the consumption in aboveground growth can be seen as rather accurate estimates. Nevertheless, an overestimation of respiration would lead to an underestimate in the allocation to fungi. The aboveground growth has been tested at the study site but the fine root growth and biomass were here estimated on the basis of the best available scientific literature, as these are expensive and laborious to measure accurately. Nevertheless, additional data especially on the annual dynamics of fine root growth and turnover rate should prove helpful for further tests of the approach, as those estimates affect the carbon consumed in root respiration and growth. Without better information, the fine root biomass is currently estimated to be stable throughout the year, that is, momentary growth and mortality rates are assumed to equal but complementary studies are needed in order to strengthen the described root processes in the model. Errors in the overall root biomass and the growth and mortality rates would affect the storage size of NSC which would further propagate to the estimation of allocation to belowground symbionts.
According to eddy covariance measurements, the site was a net carbon sink of 300 g C m−2 in 2015. As stems are the long-living tree organs, stem growth can be considered the net carbon increment of a tree. If we assume that, in average, all the trees at the site (1,117 trees ha−1, Table 1) grew stem wood as much as the trees in the size class 2 (2.0 kg C tree−1), this would indicate a net sink of 235 g C m−2 in 2015 which is quite close to the eddy covariance measurement. The difference between these two values can be explained by 1) the possible imbalance between the decomposition and the re-growth rates of short living tree organs (leaves and fine roots), 2) changes in soil carbon pool and, 3) the growth of understory vegetation.
The model lacks the description of some other carbon fluxes, such as reproduction and defense. The cone production is on average 0.12 kg C in cones year−1 tree−1 (1% of GPP of our model tree) according to litter measurements conducted at our study site whereas the protection as the emissions of volatile organic carbon is <0.1% of GPP according to Schallhart et al. (2018). Inclusion of these would naturally decrease the share of carbon allocated to root-associated fungi. Cone production takes place during the whole summer, beginning in spring and continuing until autumn. Thus, the daily amount of carbon used for cone production is minor and including it in the model would add a small carbon sink for the whole growing season period.
High frequency NSC measurements from all the important tree organs have very rarely been conducted to date, especially in the boreal zone. Thus, NSC storage is a poorly known component of tree carbon balance despite its potentially crucial role on regulating tree growth and survival. Basic understanding of storage processes, such as knowledge about the size of the storage, its variation in time and the way it is distributed among the tree, is an inevitable requirement to be able to estimate tree growth in the changing environment. Here, we observed that the whole-tree NSC storage increased from its minimum in late winter to its maximum in midsummer and decreased again toward autumn. The yearly pattern was mostly caused by variation in the amount of stored starch.
We combined whole-tree daily carbon fluxes with non-structural carbon storage measurements to cover every major part of tree carbon balance and to reveal the size of non-structural carbon storages in the tree carbon budget. This allowed us to treat allocation to belowground symbionts as a “missing sink” of carbon and thus to provide a first estimate for the annual flux of photosynthates to ECM fungi. Although the approach leaves many uncertainties to be further studied, it gives a reasonable and transparent quantitative approximation of a process that is extremely difficult to determine with field measurements. From a wider perspective, this demonstrates the potential of the whole-tree carbon balance approach to give insights into processes that cannot be directly measured.
PS-A, LK, AM, and MP planned the hypotheses and measurements. PS-A and LK conducted sampling and data analysis. PS-A, LK, and KR did the sample analysis. PS-A updated the model. PS-A and LK were responsible for writing the manuscript. All authors contributed to the writing of the manuscript at various stages.
This work was supported by the Finnish Center of Excellence Programme by the Academy of Finland (grant No 272041), Knut and Alice Wallenberg Foundation (#2015.0047), Helsinki University Funds and Kone Foundation.
The authors declare that the research was conducted in the absence of any commercial or financial relationships that could be construed as a potential conflict of interest.
The Supplementary Material for this article can be found online at: https://www.frontiersin.org/articles/10.3389/ffgc.2019.00017/full#supplementary-material
Bais, H. P., Weir, T. L., Perry, L. G., Gilroy, S., and Vivanco, J. M. (2006). The role of root exudates in rhizosphere interactions with plants and other organisms. Annu. Rev. Plant Biol. 57, 233–266. doi: 10.1146/annurev.arplant.57.032905.105159
Baldocchi, D. (1994). An analytical solution for coupled leaf photosynthesis and stomatal conductance models. Tree Phys. 14, 1069–1079. doi: 10.1093/treephys/14.7-8-9.1069
Cajander, A. K. (1926). The theory of forest types. Acta For. Fenn. 29, 1–108. doi: 10.14214/aff.7193
Chiba, Y. (1998). Architectural analysis of relationship between biomass and basal area based on pipe model theory. Ecol. Model. 108, 219–225. doi: 10.1016/S0304-3800(98)00030-1
Collatz, G. J., Ribas-Carbo, M., and Berry, J. A. (1992). Coupled photosynthesis-stomatal conductance model for leaves of C4 plants. Aust. J. Plant Physiol. 19, 519–538. doi: 10.1071/PP9920519
DeLucia, E. H., Drake, J. E., Thomas, R. B., and Gonzalez-Meler, M. (2007). Forest carbon use efficiency: is respiration a constant fraction of gross primary production? Glob. Change Biol. 13, 1157–1167. doi: 10.1111/j.1365-2486.2007.01365.x
Dietze, M. C., Sala, A., Carbone, M. S., Czimczik, C. I., Mantooth, J. A., Richardson, A. D., et al. (2014). Nonstructural carbon in woody plants. Ann. Rev. Plant Biol. 65, 667–687. doi: 10.1146/annurev-arplant-050213-040054
Dilkes, N. B., Jones, D. L., and Farrar, J. F. (2004). Temporal dynamics of carbon partitioning and rhizodeposition in wheat. Plant Physiol. 134, 706–715. doi: 10.1104/pp.103.032045
Duursma, R. A., Kolari, P., Perämäki, M., Pulkkinen, M., Mäkelä, A., Nikinmaa, E., et al. (2009). Contributions of climate, leaf area index and leaf physiology to variation in gross primary production of six coniferous forests across Europe: a model-based analysis. Tree Phys. 29, 621–639. doi: 10.1093/treephys/tpp010
Ekblad, A., and Högberg, P. (2001). Natural abundance of 13C in CO2 respired from forest soils reveals speed of link between tree photosynthesis and root respiration. Oecologia 127, 305–308. doi: 10.1007/s004420100667
Ericsson, T., Rytter, L., and Vapaavuori, E. (1996). Physiology of carbon allocation in trees. Biomass Bioenergy 11, 115–127. doi: 10.1016/0961-9534(96)00032-3
Falster, D. S., Duursma, R. A., Ishihara, M. I., Barneche, D. R., and FitzJohn, R. G. (2015). BAAD: a biomass and allometry database for woody plants. Ecology 96:1445. doi: 10.1890/14-1889.1
Farquhar, G. D., von Caemmerer, S., and Berry, J. A. (1980). A biochemical model of photosynthetic CO2 assimilation in leaves of C3 species. Planta 149, 78–90. doi: 10.1007/BF00386231
Farrar, J., Hawes, M., Jones, D., and Lindow, S. (2003). How roots control the flux of carbon to the rhizosphere. Ecology 84, 827–837. doi: 10.1890/0012-9658(2003)084[0827:HRCTFO]2.0.CO;2
Fatichi, S., Pappas, C., Zscheischler, J., and Leuzinger, S. (2019). Modelling carbon sources and sinks in terrestrial vegetation. New Phytol. 221, 652–668. doi: 10.1111/nph.15451
Finlay, R. D. (2008). Ecological aspects of mycorrhizal symbiosis: with special emphasis on the functional diversity of interactions involving the extraradical mycelium. J. Ex. Bot. 59, 1115–1126. doi: 10.1093/jxb/ern059
Finlay, R. D., and Söderström, B. (1992). “Mycorrhiza and carbon flow to the soil,” in Mycorrhizal Functioning, ed. M. F. Allen (New York, NY: Chapman and Hall), 134–160.
Fischer, C. H., and Höll, W. (1991). Food reserves of scots pine (Pinus sylvestris L.). I. Seasonal changes in the carbohydrate and fat reserves of pine needles. Trees 5, 187–195. doi: 10.1007/BF00227524
Franklin, O., Näsholm, T., Högberg, P., and Högberg, M. N. (2014). Forests trapped in nitrogen limitation–an ecological market perspective on ectomycorrhizal symbiosis. New Phytol. 203, 657–666. doi: 10.1111/nph.12840
Furze, M., Huggett, M. E., Aubrecht, D. M., Stolz, C. D., Carbone, M. S., and Richardson, A. D. (2019). Whole-tree non-structural carbohydrate storage and seasonal dynamics in five temperate species. New Phytol. 221, 1173–1176. doi: 10.1111/nph.15462
Galiano, L., Martinez-Vilalta, J., and Lloret, F. (2011). Carbon reserves and canopy defoliation determine the recovery of scots pine 4 yr after a drought episode. New Phytol. 190, 750–759. doi: 10.1111/j.1469-8137.2010.03628.x
Gessler, A., and Treydte, K. (2016). The fate and age of carbon–insights into the storage and remobilization dynamics in trees. New Phytol. 209, 1338–1340. doi: 10.1111/nph.13863
Gruber, A., Pirkebner, D., Florian, C., and Oberhuber, W. (2012). No evidence for depletion of carbohydrate pools in scots pine (Pinus sylvestris L.) under drought stress. Plant Biol. 14, 142–148. doi: 10.1111/j.1438-8677.2011.00467.x
Gruber, A., Pirkebner, D., and Oberhuber, W. (2013). Seasonal dynamics of mobile carbohydrate pools in phloem and xylem of two alpine timberline conifers. Tree Phys. 33, 1076–1083. doi: 10.1093/treephys/tpt088
Hakkila, P. (1979). Wood density survey and dry weight tables for pine, spruce and birch stems in Finland. Commun. Inst. For. Fenn. 96:59.
Hänninen, H. (1990). Modeling dormancy release in trees from cool and temperate regions. in: Process Modeling Of Forest Growth Responses To Environmental Stress, eds R. K. Dixon, R. S. Meldahl, G. A. Ruark, and W. G. Warren (Portland, OR: Timber Press), 159–165.
Hari, P., and Kulmala, M. (2005). Station for measuring ecosystems-atmosphere relations (SMEAR II). Boreal Env. Res. 10, 315–322.
Hartmann, H., Mcdowell, N. G., and Trumbore, S. (2015). Allocation to carbon storage pools in norway spruce saplings under drought and low Co2. Tree Physiol. 35, 243–252. doi: 10.1093/treephys/tpv019
Hartmann, H., and Trumbore, S. (2016). Understanding the roles of nonstructural carbohydrates in forest trees–from what we can measure to what we want to know. New Phytol. 211, 386–403. doi: 10.1111/nph.13955
Hasselquist, N. J., Metcalfe, D. B., Inselsbacher, E., Stangl, Z., Oren, R., Näsholm, T., et al. (2016). Greater carbon allocation to mycorrhizal fungi reduces tree nitrogen uptake in a boreal forest. Ecology 97, 1012–1022. doi: 10.1890/15-1222
Hawkes, C. W., Hartley, I. P., Ineson, P., and Fitter, A. H. (2008). Soil temperature affects carbon allocation within arbuscular mucorrhizal networks and carbon transport from plant to fungus. Glob. Change Biol. 14, 1181–1190. doi: 10.1111/j.1365-2486.2007.01535.x
Hobbie, J. E., and Hobbie, E. A. (2006). 15N content in symbiotic fungi and plants estimates nitrogen and carbon flux rates in arctic tundra. Ecology 87, 816–822. doi: 10.1890/0012-9658(2006)87[816:NISFAP]2.0.CO;2
Hoch, G., Popp, M., and Körner, C. (2002). Altitudinal increase of mobile carbon pools in Pinus cembra suggests sink limitation of growth at the Swiss tree line. Oikos 98, 361–374. doi: 10.1034/j.1600-0706.2002.980301.x
Hoch, G., Richter, A., and Körner, C. (2003). Non-structural carbon compounds in temperate forest trees. Plant Cell Environ. 26, 1067–1081. doi: 10.1046/j.0016-8025.2003.01032.x
Hölttä, T., Kurppa, M., and Nikinmaa, E. (2013). Scaling of xylem and phloem transport capacity and resource usage with tree size. Front. Plant Sci. 4:496. doi: 10.3389/fpls.2013.00496
Iivonen, S., Rikala, R., and Vapaavuori, E. (2001). Seasonal root growth of Scots pine seedlings in relation to shoot phenology, carbohydrate status, and nutrient supply. Can. J. For. Res. 31, 1569–1578. doi: 10.1139/x01-094
Ingram, J., and Bartels, D. (1996). The molecular basis of dehydration tolerance in plants. Ann. Rev. Plant Physiol. Plant Mol. Biol. 47, 377–403. doi: 10.1146/annurev.arplant.47.1.377
Janssens, I. A., Sampson, D. A., Curiel-Yuste, J., Carrara, A., and Ceulemans, R. (2002). The carbon cost of fine root turnover in a scots pine forest. Forest Ecol. Manag. 168, 231–240. doi: 10.1016/S0378-1127(01)00755-1
Jones, D. L., Hodge, A., and Kuzyakov, Y. (2004). Plant and mycorrhizal regulation of rhizodeposition. New Phytol. 163, 459–480. doi: 10.1111/j.1469-8137.2004.01130.x
Jones, D. L., Nguyen, C., and Finlay, R. D. (2009). Carbon flow in the rhizosphere: carbon trading at the soil-root interface. Plant Soil 321, 5–33. doi: 10.1007/s11104-009-9925-0
Jyske, T. M., Suuronen, J. P., Pranovich, A. V., Laakso, T., Watanabe, U., Kuroda, K., et al. (2015). Seasonal variation in formation, structure, and chemical properties of phloem in picea abies as studied by novel microthecniques. Planta 242, 613–629. doi: 10.1007/s00425-015-2347-8
Kellomäki, S., Peltola, H., Nuutinen, T., Korhonen, K. T., and Strandman, H. (2008). Sensitivity of managed boreal forests in Finland to climate change, with implications for adaptive management. Phil. Trans. R. Soc. B 363, 2341–2351. doi: 10.1098/rstb.2007.2204
Klein, T., and Hoch, G. (2015). Tree carbon allocation dynamics determined using a carbon mass balance approach. New Phytol. 205, 147–159. doi: 10.1111/nph.12993
Kolari, P., Kulmala, L., Pumpanen, J., Launiainen, S., Ilvesniemi, H., Hari, P., et al. (2009). CO2 exchange and component CO2 fluxes of a boreal scots pine forest. Bor. Env. Res. 14, 761–778.
Kolari, P., Lappalainen, H. K., Hänninen, H., and Hari, P. (2007). Relationship between temperature and the seasonal course of photosynthesis in Scots pine at northern timberline and in southern boreal zone. Tellus 59B, 542–552. doi: 10.1111/j.1600-0889.2007.00262.x
Kulmala, L., Pumpanen, J., Kolari, P., Muukkonen, P., Hari, P., and Vesala, T. (2011). Photosynthetic production of ground vegetation in different-aged Scots pine (Pinus sylvestris) forests. Can. J. For. Res. 41, 2020–2030. doi: 10.1139/x11-121
Leake, J. R., Donnelly, D. P., Saunders, E. M., Boddy, L., and Read, D. J. (2001). Rates and quantities of carbon flux to ectomycorrhizal mycelium following 14C pulse labeling of pinus sylvestris seedlings: effects of litter patches and interaction with a wood-decomposer fungus. Tree Physiol. 21, 71–82. doi: 10.1093/treephys/21.2-3.71
Leppälammi-Kujansuu, J., Salemaa, M., Berggren Kleja, D., Linder, S., and Helmisaari, H. S. (2014). Fine root turnover and litter production of Norway spruce in a long-term temperature and nutrient manipulation experiment. Plant Soil 374, 73–88. doi: 10.1007/s11104-013-1853-3
Leuning, R. (1995). A critical appraisal of a combined stomatal-photosynthesis model for C3 plants. Plant Cell Environ. 18, 339–357. doi: 10.1111/j.1365-3040.1995.tb00370.x
Mäkelä, A., Hari, P., Berninger, F., Hänninen, H., and Nikinmaa, E. (2004). Acclimation of photosynthetic capacity in Scots pine to the annual cycle of temperature. Tree Physiol. 24, 369–376. doi: 10.1093/treephys/24.4.369
Mäkelä, A., Kolari, P., Nikinmaa, E., Perämäki, M., and Hari, P. (2006). Modelling five years of weather-driven variation of GPP in a boreal forest. Agric. For. Meteorol. 139, 382–398. doi: 10.1016/j.agrformet.2006.08.017
Mäkelä, A., and Valentine, H. (2006). Crown ratio influences allometric scaling in trees. Ecology 87, 2967–2972. doi: 10.1890/0012-9658(2006)87[2967:CRIASI]2.0.CO;2
Mäkelä, A., and Vanninen, P. (2000). Estimation of fine root mortality and growth from simple measurements: a method based on system dynamics. Trees 14, 316–323. doi: 10.1007/s004680050224
Mandre, M., Tullus, H., and Klõšeiko, J. (2002). Partitioning of carbohydrates and biomass of needles in Scots pine canopy. Z. Naturfors. 57, 296–302. doi: 10.1515/znc-2002-3-417
Martínez-Vilalta, J., Sala, A., Asensio, D., Galiano, L., Hoch, G., Palacio, S., et al. (2016). Dynamics of non-structural carbohydrates in terrestrial plants: a global synthesis. Ecol. Monogr. 86, 495–516. doi: 10.1002/ecm.1231
McCormack, M. L., Dickie, I. A., Eissenstat, D. M., Fahey, T. J., Fernandez, C. W., Guo, D., et al. (2015). Redefining fineroots improves understanding of below-ground contributions to terrestrial biosphere processes. New Phytol. 207, 505–518. doi: 10.1111/nph.13363
Nehls, U. (2008). Mastering ectomycorrhizal symbiosis: the impact of carbohydrates. J. Exp. Botany 59, 1097–1108. doi: 10.1093/jxb/erm334
Oleksyn, J., Zytkowiak, R., Karolewski, P., Reich, P. B., and Tjoelker, M. G. (2000). Genetic and environmental control of seasonal carbohydrate dynamics in trees of diverse Pinus sylvestris populations. Tree Phys. 20, 837–847. doi: 10.1093/treephys/20.12.837
Phillips, R. P., Erlitz, Y., Bier, R., and Bernhardt, E. S. (2008). New approach for capturing soluble root exudates in forest soils. Funct. Ecol. 22, 990–999. doi: 10.1111/j.1365-2435.2008.01495.x
Pirinen, P., Simola, H., Aalto, J., Kaukoranta, J. P., Karlsson, P., and Ruuhela, R. (2012). Climatological Statistics of Finland 1981-2010. Finnish Meteorological Institute, Reports 2012:1. Finnish Meteorological Institute, Helsinki.
Pumpanen, J., Kulmala, L., Linden, A., Kolari, P., Nikinmaa, E., and Hari, P. (2015). Seasonal dynamics of autotrophic respiration in boreal forest soil estimated by continuous chamber measurements. Boreal Env. Res 20, 637–650.
Quentin, A. G., Pinkard, E. A., Ryan, M. G., Tissue, D. T., and Baggett, L. S. (2015). Non-structural carbohydrates in woody plants compared among laboratories. Tree Phys. 35, 1146–1165. doi: 10.1093/treephys/tpv073
Read, D., Leake, J., and Perez-Moreno, J. (2004). Mycorrhizal fungi as drivers of ecosystem processes in heathland and boreal forest biomes. Can. J. Bot. 82, 1243–1263. doi: 10.1139/b04-123
Reich, P. B., and Oleksyn, J. (2008). Climate warming will reduce growth and survival of scots pine except in the far north. Ecol. Lett. 11:588–597. doi: 10.1111/j.1461-0248.2008.01172.x
Repola, J. (2009). Biomass equations for Scots pine and Norway spruce in Finland. Silva Fenn. 43, 625–647. doi: 10.14214/sf.184
Ryan, M. G., Hubbard, R. M., Pongracic, S., Raison, R. J., and McMurtrie, R. E. (1996). Foliage, fine-root, woody-tissue and stand respiration in Pinus radiata in relation to nitrogen status. Tree Phys. 16, 333–344. doi: 10.1093/treephys/16.3.333
Sala, A., Woodruff, D. R., and Meinzer, F. C. (2012). Carbon dynamics in trees: feast or famine. Tree Phys. 32, 764–775. doi: 10.1093/treephys/tpr143
Sarvas, R. (1972). Investigations on the annual cycle of development of forest trees. Active period. Commun Inst Forest Fenn 76, 1–110.
Schallhart, S., Rantala, P., Kajos, M. K., Aalto, J., Mammarella, I., Ruuskanen, T. M., et al. (2018). Temporal variation of VOC fluxes measured with PTR-TOF above a boreal forest. Atmos. Chem. Phys. 18, 815–832. doi: 10.5194/acp-18-815-2018
Schiestl-Aalto, P., Kulmala, L., Mäkinen, H., Nikinmaa, E., and Mäkelä, A. (2015). CASSIA-a dynamic model for predicting intra-annual sink demand and interannual growth variation in scots pine. New Phytol. 206, 647–659. doi: 10.1111/nph.13275
Smith, M. G., Miller, R. E., Arndt, S. K., Kasel, S., and Bennett, L. T. (2018). Whole-tree distribution and temporal variation of non-structural carbohydrates in broadleaf evergreen trees. Tree Phys. 38, 570–581. doi: 10.1093/treephys/tpx141
Smith, S. E., and Read, D. J. (2008). Mycorrhizal Symbiosis, 3rd Edn. Amsterdam: Elsevier Academic Press, 787.
Sofronova, G., and Kaipiainen, L. (1996). Dynamics of carbohydrate distribution in Scots pine. Acta Forest Fenn. 254, 21–25. doi: 10.14214/aff.7525
Solly, E. F., Brunner, I., Helmisaari, H. S., Herzog, C., Leppälammi-Kujansuu, J., and Schönling, I. (2018). Unravelling the age of fine roots of temperate and boreal forests. Nat. Commun. 9:3006. doi: 10.1038/s41467-018-05460-6
Stitt, M., and Zeeman, S. C. (2012). Starch turnover: pathways, regulation and role in growth. Curr. Opin. Plant Biol. 15, 282–292. doi: 10.1016/j.pbi.2012.03.016
Vanninen, P., and Mäkelä, A. (1999). Fine root biomass of Scots pine stands differing in age and soil fertility in southern Finland. Tree Phys. 19, 823–830. doi: 10.1093/treephys/19.12.823
Vesala, T., Haataja, J., Aalto, P., Altimir, N., Buzorius, G., Garam, E., et al. (1998). Long-term field measurements of atmosphere-surface interactions in boreal forest combining forest ecology, micrometeorology, aerosol physics and atmosphere chemistry. Trends Heat Mass Momentum Transfer 4, 17–35.
Vesala, T., Suni, T., Rannik, Ü., Keronen, P., Markkanen, T., Sevanto, S., et al. (2005). Effect of thinning on surface fluxes in a boreal forest. Global Biogeochem. Cycles 19:GB2001. doi: 10.1029/2004GB002316
Vogt, K. A., Grier, C., Meier, C. E., and Edmonds, R. L. (1982). Mycorrhizal role in net primary production and nutrient cycling in Abies amabilis ecosystems in western Washington. Ecology 63, 370–380. doi: 10.2307/1938955
Wiley, E., and Helliker, B. (2012). A re-evaluation of carbon storage in trees lends greater support for carbon limitation to growth. New Phytol. 195, 285–289. doi: 10.1111/j.1469-8137.2012.04180.x
Wiley, E., Huepenbecker, S., Casper, B. B., and Helliker, B. R. (2013). The effects of defoliation on carbon allocation: can carbon limitation reduce growth in favour of storage? Tree Phys. 33, 1216–1228. doi: 10.1093/treephys/tpt093
Würth, M. K. R., Peláez-Riedl, S., Wright, J., and Körner, C. (2005). Non-structural carbohydrate pools in a tropical forest. Oecologia 143, 11–24. doi: 10.1007/s00442-004-1773-2
Keywords: non-structural carbon, storage dynamics, soluble sugar, starch, allocation to belowground symbionts, carbon balance, Scots pine
Citation: Schiestl-Aalto P, Ryhti K, Mäkelä A, Peltoniemi M, Bäck J and Kulmala L (2019) Analysis of the NSC Storage Dynamics in Tree Organs Reveals the Allocation to Belowground Symbionts in the Framework of Whole Tree Carbon Balance. Front. For. Glob. Change 2:17. doi: 10.3389/ffgc.2019.00017
Received: 12 November 2018; Accepted: 16 April 2019;
Published: 03 May 2019.
Edited by:
Anna Sala, College of Humanities and Sciences, University of Montana, United StatesReviewed by:
Katie M. Becklin, Syracuse University, United StatesCopyright © 2019 Schiestl-Aalto, Ryhti, Mäkelä, Peltoniemi, Bäck and Kulmala. This is an open-access article distributed under the terms of the Creative Commons Attribution License (CC BY). The use, distribution or reproduction in other forums is permitted, provided the original author(s) and the copyright owner(s) are credited and that the original publication in this journal is cited, in accordance with accepted academic practice. No use, distribution or reproduction is permitted which does not comply with these terms.
*Correspondence: Pauliina Schiestl-Aalto, cGlpYS5zY2hpZXN0bEBoZWxzaW5raS5maQ==
Disclaimer: All claims expressed in this article are solely those of the authors and do not necessarily represent those of their affiliated organizations, or those of the publisher, the editors and the reviewers. Any product that may be evaluated in this article or claim that may be made by its manufacturer is not guaranteed or endorsed by the publisher.
Research integrity at Frontiers
Learn more about the work of our research integrity team to safeguard the quality of each article we publish.