 Angelo Fierravanti
 Sergio Rossi
 Daniel Kneeshaw
 Louis De Grandpré
 Annie Deslauriers
94% of researchers rate our articles as excellent or good
Learn more about the work of our research integrity team to safeguard the quality of each article we publish.
Find out more
ORIGINAL RESEARCH article
Front. For. Glob. Change, 26 April 2019
Sec. Forest Ecophysiology
Volume 2 - 2019 | https://doi.org/10.3389/ffgc.2019.00015
This article is part of the Research TopicCarbon Transport and Dynamics in TreesView all 8 articles
Spruce budworm (Choristoneura fumiferana) outbreaks are important disturbance events in the boreal forests of northeastern North America, causing major growth loss and widespread tree mortality. The physiological mechanisms leading to tree mortality remain poorly understood and two important functional traits, tree-ring width and concentration of stored carbohydrate, can serve as indicators of tree vitality during defoliation. This study aims to test the hypothesis that storage starch is an indicator of tree vitality by (1) exploring the link among reductions in storage, growth and mortality, and (2) identifying starch or sugar threshold to predict the risk of mortality. We use balsam fir and black spruce, two main host species of spruce budworm. We sampled 81 trees across seven experimental sites in eastern Quebec, Canada, and assessed defoliation intensity, tree-ring growth, and tree vitality. Soluble sugar and starch concentrations in needles, twigs, and roots were measured from spring to autumn. Under conditions of increased defoliation, carbon allocation to reserves and radial growth decreased in a similar manner for both species. Starch concentration within twigs and needles in May and June was the best indicator of carbon status in defoliated trees. We observed the highest reductions in growth two to 3 years prior to mortality concurrently with reductions in starch in May and June. When starch concentrations were lower than 28 mg· in needles, the probability of balsam fir mortality exceeded 50%. At this level of starch, reserves and newly produced carbon are insufficient to support tree growth and vitality.
In northeastern North America, cyclical outbreaks of spruce budworm (Choristoneura fumiferana Clemens, SBW) are one of the main causes of growth reduction and tree mortality in several conifer species (Gray, 2008; Zhang et al., 2014). During the 20th century, there were three SBW outbreaks (Blais, 1962; Morin, 1994). Since 2006, a new outbreak has been ongoing, affecting more than of 8 M ha with defoliation concentrated in stands dominated by balsam fir and black spruce (Boulanger et al., 2016, 2017; Bouchard et al., 2018). SBW lay eggs mainly in upper crown of trees in July. The eggs hatch in later July and early August. The larvae disperse, entering in diapause in September (Régnière et al., 1989). In May of the following year, the SBW emerges as second-instar larvae and feed on the current-year foliage, only eating old foliage in very severe outbreak years (Lawrence et al., 1997; Nealis and Régnière, 2004; Rossi et al., 2018). From 5 to 7 years of feeding are needed to defoliate a tree completely, even low levels of cumulative defoliation can lead to stand-level mortality in managed forests (Chen et al., 2017).
Regardless of the host species (balsam fir, white spruce, or black spruce), successive years of defoliation lead to a decline in starch accumulation in the spring (Deslauriers et al., 2015, 2018). In conifers, starch concentration throughout the tree increases prior to the resumption of shoot and stem growth (Little, 1970; Hoch et al., 2003; Martínez-Vilalta et al., 2016; Desalme et al., 2017), with the highest quantities of starch found in the foliage. Previous studies conducted on conifers showed that there are differences in carbon reserves between non-defoliated and highly-defoliated trees, the latter having lower starch content (Webb and Karchesy, 1977; Webb, 1980, 1981). Starch levels then decrease slowly during the summer due to primary and secondary growth (Webb and Karchesy, 1977; Deslauriers et al., 2018). However, storage starch decreases proportionally with increasing defoliation (Vanderklein and Reich, 1999; Li et al., 2002; Deslauriers et al., 2015; Puri et al., 2015). Boreal stands can withstand long periods of SBW-related defoliation, because trees allocate most carbon resources to the production of new shoots and needles (Piene, 1989; Deslauriers et al., 2018) rather than to storage starch and radial growth in the stem.
This carbon allocation strategy allows trees to endure defoliation events that last several years before eventually succumbing if the event persists even longer. Moreover, this suggest either a downregulation of storage formation (i.e., regulated as a competing sink), or a lack in carbon overflow before growth resumption (i.e., not regulated as a competing sink), or both (Hartmann and Trumbore, 2016). Compensatory mechanisms are also used to maximize carbon gain under defoliation, such as longer needle retention (Doran et al., 2017) or greater epicormic bud production (Piene, 1989). In all cases, carbon allocation to storage is not maintained under defoliation (a strong C limitation) and the challenge remains how the absence of reserve formation has an impact on the growth and survival of defoliated mature trees. High levels of non-structural carbohydrate are required for survival, mainly in form of soluble sugars (Martínez-Vilalta et al., 2016) because of their direct role in plant metabolism. Under defoliation however, the absence of storage before growth resumption affects the seasonal carbon buffer usually provided by the storage starch to support conversion to soluble sugars for growth and metabolism.
During an outbreak, radial growth drops within a relatively short period of time (ca. 4–5 years), after which the tree dies (Morin, 1994; Morin et al., 2007; Krause et al., 2012). Growth reductions that precede mortality are very common (Wyckoff and Clark, 2002; Das et al., 2016; Cailleret et al., 2017) and, for spruce budworm defoliation, represent a direct consequence of carbon allocation toward primary growth (i.e., photosynthetic tissues) to enhance tree vigor and carbon gain (Piene, 1989; Deslauriers et al., 2018). Thus, the synchronous decrease in growth rate and carbon storage (mainly starch) observed in defoliated balsam fir (Deslauriers et al., 2015) represents an indicator of tree vitality, or a functional trait underlying the mechanism leading to death. According to Dobbertin (2005), the hypothetical optimal tree vitality, i.e., the capacity to survive, grow, and to store starch, is unknown, but it can be estimated by comparing living and dead trees. In this study, we use non-structural carbon (including both soluble sugars and starch) as a proxy of tree vitality under dieback episodes during a spruce budworm outbreak. Emphasis was put on storage starch [i.e. produced in the amyloplastic for long term energy storage (Sulpice et al., 2009; MacNeill et al., 2017)] because this fraction of non-structural carbohydrate has profound impact on the tree physiology especially during growth and development (Hartmann and Trumbore, 2016). Specifically, we wanted to test the hypothesis that storage starch is an indicator of tree vitality by (1) exploring the link among reductions in storage, growth and mortality, and (2) identifying starch or sugar threshold to predict the risk of mortality.
To test this hypothesis, measurements of radial growth, carbon allocation, and mortality for balsam fir [Abies balsamea (L.) Mill.] and black spruce (Picea mariana Mill. B.S.P.) were performed on two of the main hosts of the spruce budworm, but of contrasting vulnerability. During a spruce budworm outbreak, the phase of needle development in balsam fir is favorable to the insect as the availability of resources, i.e., the developing buds, increased herbivore fitness (Nealis, 2012; Régnière and Nealis, 2018). As bud phenology in black spruce occurs 2 weeks after that of balsam fir (Antonucci et al., 2015), black spruce is about half as vulnerable as balsam fir (Bognounou et al., 2017).
The study sites are in the boreal forest of eastern Quebec, Canada. We selected three areas for this study [Girardville (GIR), Gaspard (GAS), and Toulnustouc–Lac Dionne (TLD)] (Figure 1). In TLD, we established four 0.4 ha plots (plots A–D) that correspond to three stand compositions (one black spruce, one balsam fir, and two mixed fir-spruce stands) having various levels of defoliation. Similarly, we established two 0.4 ha plots at the GIR site, where both represented mixed fir-spruce stands having various levels of defoliation. At the GAS site, two 0.4 ha plots were located within a mixed fir-spruce stand, although these sites had a low level of defoliation (<10%). The region has a cold climate with harsh winters and mild summers. GIR and GAS have a mean annual temperature of 2.6°C, with 176 days above 0°C. Mean annual precipitation is 864 mm and 31% falls as snow. At the TLD site, the mean temperature is 2.1°C, with 165 days above 0°C. Mean annual precipitation is 921 mm; 28% falls as snow (Gouvernment of Canada, 2018).
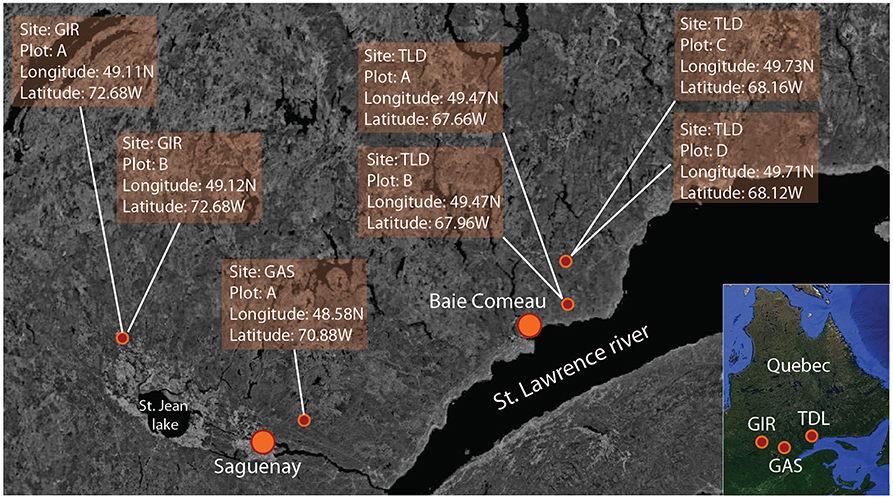
Figure 1. Location of the study sites: Girardville (GIR), Gaspard (GAS), and Toulnustouc–Lac Dionne (TLD). Source: Google earth imagery was used as reference background image (Google Earth 2018).
In 2014, we selected between 6 and 18 mature balsam fir and black spruce in each plot. We sampled a total of 84 trees (48 fir and 36 spruce) (Table S1). Sampling for carbohydrates content occurred fortnightly between May and September. One twig per tree was sampled using a pruning shear at mid-crown between 4 and 6 m in height from the ground (Régnière and Nealis, 2007). We sampled in the middle crown to reduce the error in the evaluation of defoliation (Piene, 1989) because the tree top is the first part of the tree to reach 100% of defoliation and dies. Moreover, the larval density is higher in the middle crown (Régnière et al., 1989). A terminal part of branch, of about 20–30 cm long, was cut using a pruning shear. Roots of 1–2 cm in diameter were also sampled at a distance of 1.0–2.5 m from the base of the tree, thus ensuring that the samples effectively corresponded to the studied tree. All samples used for determining amounts of non-structural carbon were placed in plastic bags that were vacuum sealed and stored at −20°C.
Defoliation levels within each plot were assessed visually from the sampled branches following a shoot-count method (Piene et al., 1981; Maclean and Lidstone, 1982) modified to four classes: D0 represents non-defoliated trees, and D1, D2, and D3 represent 1–33, 33–66, and 66–100% defoliation, respectively. In the spring of 2015, before the onset of defoliation, we again visited the sites to assess the vitality of all the study trees; twelve out of 84 trees were classified as dead, all were to balsam fir. Tree mortality was determined by complete needle wilting (red color).
We collected two cores per tree at breast height (1.3 m) using a 0.5 cm diameter Pressler increment borer. Cores were mounted on wood plates, dried, and sanded. We used LINTAB-measurement equipment at magnifications of 60 × to measure tree-ring width to the nearest 0.01 mm (Fonti and García-González, 2004; van der Sleen et al., 2014; Fierravanti et al., 2015). The two time series from each tree were cross-dated (Holmes, 1983; Kaennel and Schweingruber, 1995) using the TSAPWin software package (Ver. 4.81 Scientific, Rinntech, Heidelberg, Germany, 2008) and averaged. Statistical indexes Gleichläufigkeit (Glk), T-values of Bailie and Pilcher (TVBP), and the cross-date index (CDI) assessed the performance of cross-dating (Kaennel and Schweingruber, 1995), which was considered acceptable only where Glk > 70, TVBP > 5, and CDI > 20 (Battipaglia et al., 2015; Fierravanti et al., 2015). The mean time series were standardized using double-detrending with a 50-year spline (Krause et al., 2012). For each class of defoliation, we calculated a yearly tree-ring index from 2006 (year of SBW arrival on our sites) to 2015 (year of cores sampling) defoliation period based on the mean tree-ring width of each n year and defoliation class, relative to the year 2006 (Deslauriers et al., 2015), i.e., the year corresponding to the beginning of the spruce budworm outbreak:
Where 2006 is the starting year of spruce budworm outbreak at the study site and n is a sampling year (between 2007 and 2015) (Deslauriers et al., 2015).
A second tree-ring index was calculated based on the ratio between the mean standardized tree-ring width of dead and living trees (Cailleret et al., 2017). We calculated this tree-ring width ratio for the 1958–2015 period and included only balsam fir. We also fitted a cubic trend line to easily understand the general trend. We evaluated 12 balsam fir trees that died between May and September 2015 in GIR and TDL.
Needles, twigs, and roots were immersed in liquid nitrogen at −196°C to stop all enzymatic activity, and the samples were then freeze-dried for 5 days (Deslauriers et al., 2009). The external part of the bark on twigs and roots was removed only if they contained impurities (e.g., lichen). We separated needles and small terminal twigs from the branches. We ground the samples into a fine powder (1 μm) using a mill (Retsch MM200 Vibrant) for 5 min. Samples were then stored at −20°C until analysis (Caron et al., 2013).
Soluble sugars were extracted in 80% ethanol using 40 mg from dry powder of needles, twigs, or roots. The sugars were extracted three times and chemically treated with phenol (2%) and sulfuric acid (96%) following Chow and Landhäusser (2004). The absorbance of the extracts was measured at 490 nm with a UV–VIS spectrophotometer. The concentration of soluble sugars was converted to mg per g of dry weight (mg·) using a dosage curve and the equation:
where A490 is the absorbance at 490 nm, a is the absorbance of the control, d is the dilution factor, v is the total extracted volume, and w is the weight (g) of the sample.
Starch concentrations were determined through enzymatic digestion (Bellasio et al., 2014) of the remaining pellets. α-amylase (3000 U/L, Megazyme) and amyloglucosydase (3260 U/L, Megazyme) were applied to split the glucose chains that form the starch. This mixture was then chemically treated with a Reagent and sulfuric acid (75%). The absorbance was read at 530 nm with a UV–VIS spectrophotometer. Starch concentrations were then converted to mg per g dry weight (mg·) using the equation:
where A530 is the absorbance at 530 nm of the sample, As is the absorbance of the control and enzyme that digested the starch, vsg is the volume of the glucose solution, v is the total volume of the sample, c is the conversion coefficient (= 0.9), Asg is the absorbance of glucose, Aw is the absorbance of water, m is the sample weight (g), and vs. is the volume of the enzymatic solution (= 60 μL).
A linear mixed model was used to analyze the difference between defoliation classes of standardized tree-ring widths. Year, defoliation, and their interaction were the fixed factors, and site and trees nested in site were the random factors. Non-structural carbon concentration was compared between defoliation classes also using a linear mixed model, where defoliation and month and their interaction were the fixed effects, while sites and trees nested in the sites were the random effects. Multiple comparisons were performed with student t-tests. Normality of the data was assessed graphically by plotting the normal residuals; normality was confirmed by Shapiro's test.
A nominal logistic regression was used to calculate the probability of tree mortality based on sugar and starch concentrations for the different organs and months. The logistic regression takes the general form:
where πx is the probability to be alive, xj is the sugar and starch concentration of a given organ and month j, β0, and β1are the intercept and the slope of the logit regression (Rossi et al., 2007). Sugar and starch concentration thresholds (x) were calculated when the probability of being alive was 0.5, i.e., when Logit(π) = 0 and then when x = −β0/β1. In other words, for a sugar and starch concentration below x, the tree was more likely to be dead than alive. For clarity, sugars or starch concentrations at which the probability of tree mortality was 50% were assigned the name M50. The fit of the logistic regression was evaluated using R2 (uncertainty coefficient [], and Chi-square tests (χ2)). The sugar and starch M50 were then graphically compared with the mean sugar or starch concentration values found in each defoliation class (see Results).
Canonical discriminant analysis differentiated defoliation classes and tree vitality based on growth and non-structural carbon concentrations (CANDISC procedure in SAS). Wilk's λ and the Mahalanobis squared distance were used in canonical discriminant analysis. A preliminary discriminant stepwise analysis was performed by using the STEPDISC procedure in SAS. This procedure selects a subset of the quantitative variables to discriminate between the defoliation classes. All statistics were performed in JMP 14 Pro and SAS 9.2 (SAS Institute, Cary, NC).
Sugar concentrations measured in needles, twigs, and roots varied over time, i.e., by month, and between defoliation class (Table 1, Table S2, Figure 2). D0 had a higher soluble sugar concentration than D1–D3 but not for all months (Figure 2). This led to a significant effect of the defoliation × month interaction (Table 1). In needles, sugar concentrations dropped in July, especially in the defoliated trees of both species. In August, we observed the opposite pattern with the highest sugar concentrations in defoliated trees (Figure 2). In twigs, sugar concentration was higher in D0 during May, July, and August in black spruce and in June–September in balsam fir. In balsam fir, root soluble sugars varied by month, defoliation class and their interaction (P < 0.5; Table 1). However, the effect of month was stronger than that of defoliation; sugars increased from May to June and then dropped in July and August. Significant differences among defoliation classes occurred in May and July–September (Figure 2). No factors significantly affected root soluble sugar concentrations in spruce.
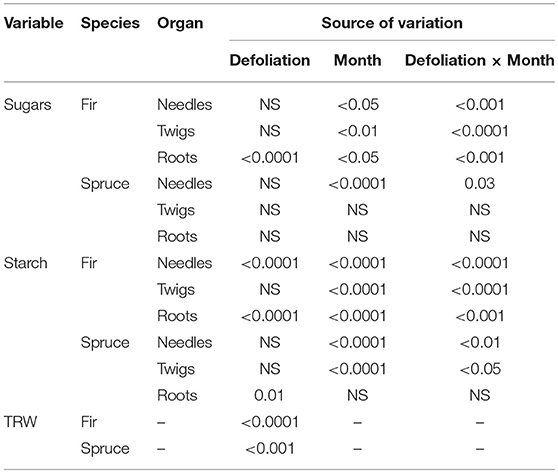
Table 1. Mixed effect model calculated for soluble sugars, starch, and tree-ring width. NS: not significant.
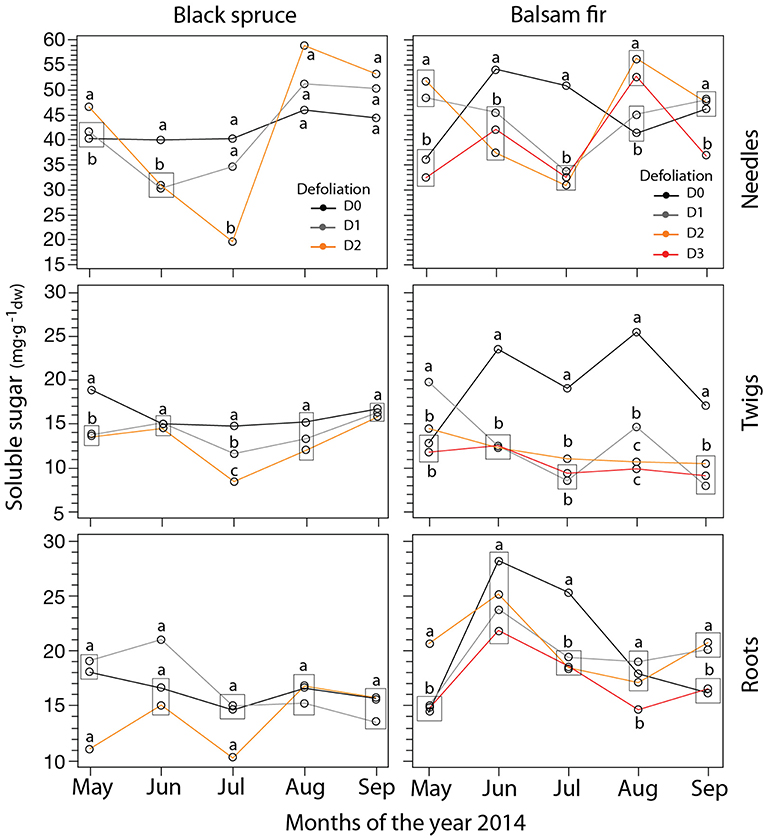
Figure 2. LS-mean predicted of soluble sugar concentrations (mg·) in balsam fir and black spruce for the four defoliation classes and each month obtained from mixed model. Different letters indicate significant differences between defoliation classes obtained from student's t-test. Rectangles indicate situations where data points sharing the same letter are overlapping on the plots.
Except in spruce roots, concentrations of starch showed a pronounced seasonal trend with values dropping gradually during the summer (Table 1, Table S3, Figure 3). D0 had higher starch concentrations compared to defoliated trees in May and June. In needles, we observed significant differences between all defoliation classes in May and June. However, these differences between defoliation classes disappeared as the summer progressed. A similar pattern was also observed in twigs, although starch concentrations were reduced in May for D0 and in June for defoliated trees (Figure 3). The seasonal trend was less pronounced in roots (especially in black spruce) and in the D2–D3 of balsam fir (Figure 3). Overall, D0 had higher starch concentrations, especially from May to July in balsam fir.
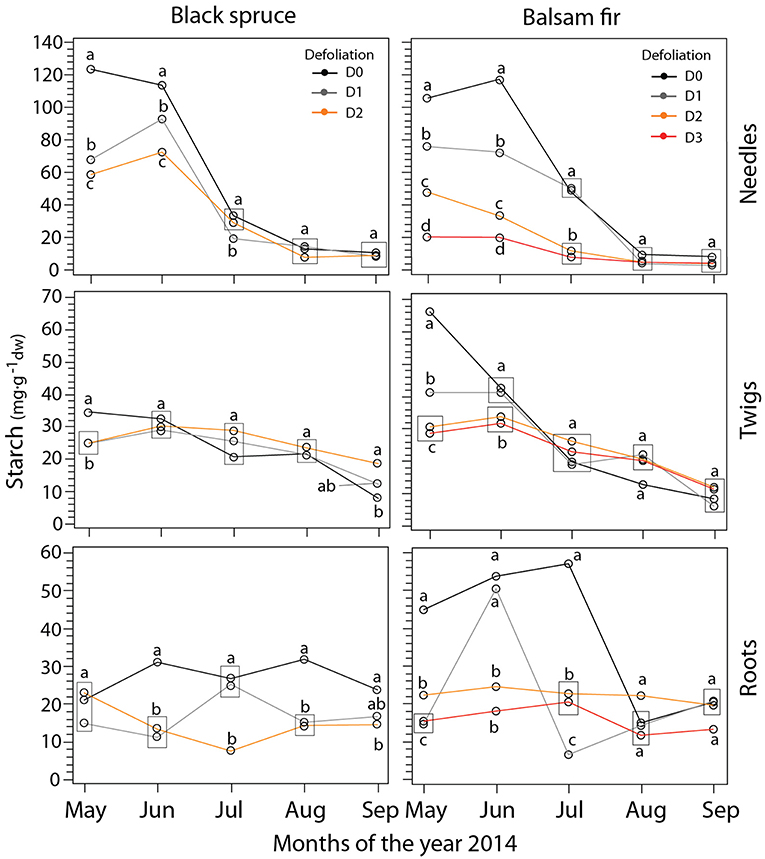
Figure 3. LS-mean predicted of starch concentration (mg·) in balsam fir and black spruce for the four defoliation classes and each month obtained from mixed model. Different letters indicate significant differences between defoliation classes. Rectangles indicate situations where data points sharing the same letter are overlapping on the plots.
For both species, the tree-ring index decreased significantly with increased defoliation (Figure 4, Table S4). In black spruce, radial growth in the non-defoliated and defoliated trees began to diverge in 2012. This divergence began even earlier (in 2010) in balsam fir. The D0 tree-ring index measured in both species differed significantly from all other defoliation classes (P < 0.0001). No significant difference was observed between D1 and D2 in black spruce (Figure 4), indicating a similar decrease in growth. In balsam fir, similar growth decreases were observed between defoliated trees (D1–D3).
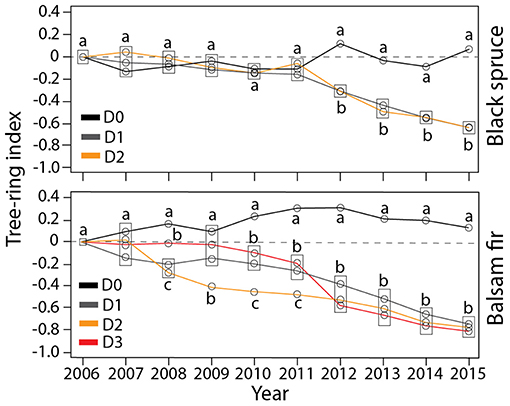
Figure 4. Tree-ring width of trees belonging to the four defoliation classes. Different letters indicate significant differences between defoliation classes. Rectangles indicate situations where data points sharing the same letter are overlapping on the plots.
In balsam fir, we observed two decreasing phases in the tree-ring ratio between dead and living trees during the 1950–2015 period (TRI-ratio, Figure 5). A ratio higher or lower than one indicates that the tree-ring width of the dead trees was greater or less than that of living trees, respectively. A TRI-ratio greater than one before 1965 indicated a vigorous growth for the trees that died in 2015 relative to the surviving trees. Afterward, we observed a very slow decrease in the TRI-ratio of the dead trees, showing a ratio of ca. 0.7 for nearly 40 years. This indicated that trees dying in 2015 had already been experiencing a sub-optimal growth of ca. 30%. This ratio decreased continuously until the sudden drop in 2012, i.e., during the current period of defoliation. From 2012 until death, the TRI-ratio dropped quickly and reached zero in 2015.
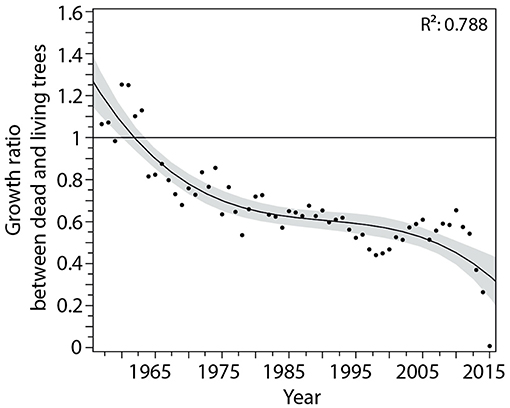
Figure 5. Tree-ring width ratio between dead and living trees of balsam fir. The black line represents the cubic trend with its confidence interval and R2 for the period 1950–2015.
Canonical axis 1 (Can 1) represented 96% and 87% of between-class variation in black spruce and balsam fir, respectively, and discriminated between control and defoliated trees (Figure 6, Table 2). Canonical axis 2 (Can 2) accounted for a lower proportion of variability (3% in black spruce and 10% in balsam fir) and discriminated between trees having different defoliation intensities. In both species, Wilk's λ was highly significant (P < 0.001) and the Mahalanobis squared distance separated all classes. Only six significant (P < 0.05) explanatory variables were retained (Table 2).
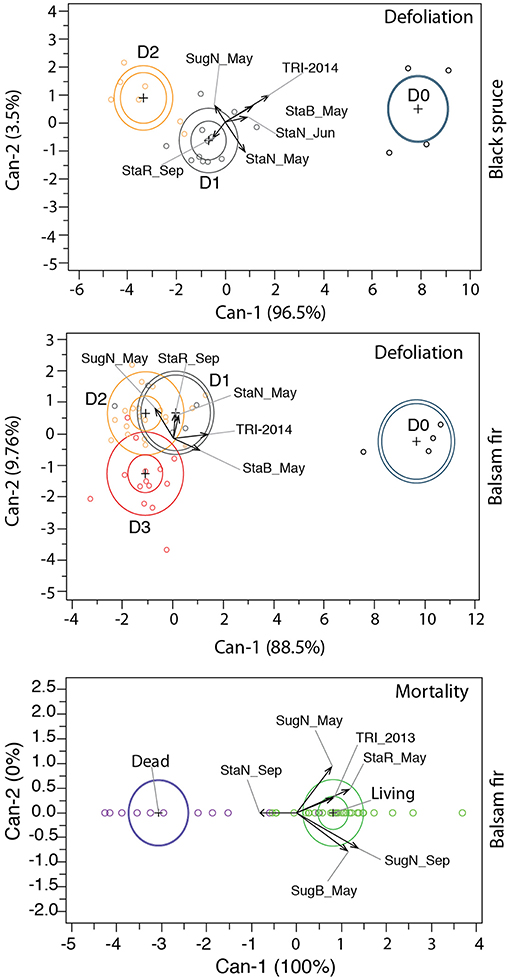
Figure 6. Canonical analyses discriminating the defoliation classes and tree vitality. TRI 2013: tree-ring index of 2013; TRI 2014: tree-ring index of 2014; StaN_May: starch in needles in May; StaN_Jun: starch in needles in June; StaN_Sep: starch in needles in September; SugN_May: sugars in needles in May; SugN_Sep: sugars in needles in September; StaB_May: starch in twig in May; SugB_May: sugars in twig in May; StaR_May: starch in roots in May; StaR_Sep: starch in roots in September.
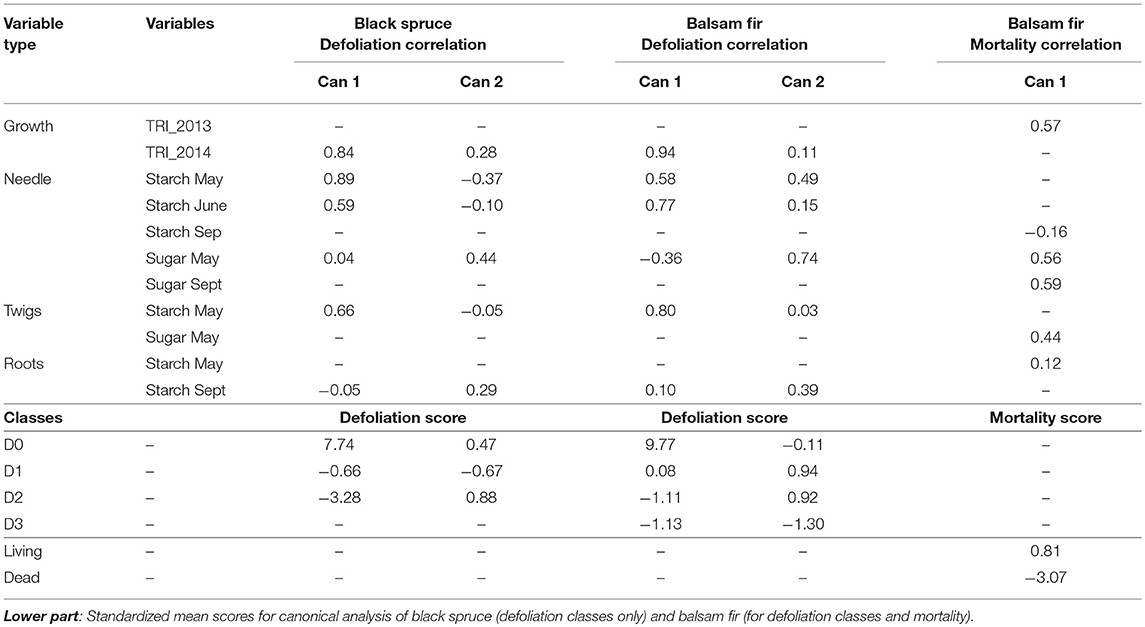
Table 2. Upper part: Correlation coefficients between the canonical axes (Can 1 and Can 2) and variables used in the multivariate analysis.
Defoliation intensity was correlated to changes in both growth and carbon allocation (Figure 6, Table 2). In both species, Can 1 and Can 2 were correlated with the tree-ring index in 2014, confirming that defoliation in that year was inversely correlated to radial growth. Can 1 was also positively correlated with starch concentration, especially in needles and twigs of May and June (Table 2, Figure 6). Weak (0.04, in black spruce) or negative (-0.36, in balsam fir) correlations observed between Can 1 and the sugar concentration of needles in May indicated higher sugar concentrations in defoliated trees, especially in balsam fir. Can 2 was positively correlated with the starch of roots in September, meaning that the more defoliated trees of both species exhibited a lower starch concentration. A divergence between species was observed in their respective correlations between Can 2 and starch in May–June; black spruce showed a negative correlation whereas for balsam fir, it was positive.
We investigated differences between living and dead trees in terms of starch, sugar, and tree-ring growth although only for balsam fir as no mortality occurred in black spruce [Wilk's λ (P < 0.001) and Mahalanobis squared distance (P < 0.001)]. As only two classes comprised the canonical discriminant analysis for mortality, Can 1 represented 100% of the between-class variation and discriminated between living (positive scores) and dead (negative scores) trees (Table 2, Figure 6). Variables had a positive correlation with living trees, whereas they had negative correlation with dead trees (Table 2). Can 1 was positively correlated with the tree-ring index in 2013 as well as the sugar concentrations of needles (May and September) and twigs (May). Since the tree-ring index of the previous year decreased with increased defoliation, the soluble sugars and starch of the current year were also reduced. In contrast, the starch concentration of needles in September was negatively correlated with Can 1.
For starch, the logistic models in needles of balsam fir produced the highest values of explained variance (R2 of 0.63, Table 3). The M50 calculated for May was significant, having a value of 28.1 mg· of starch concentration in needles (Table 3). This threshold was reached in D3 only (Figure 7), although the probability of mortality began to increase in D2. In June, the starch located in twigs decrease with increasing defoliation but the measured values in defoliated trees (~32 mg· in D2 and D3, Figure 3) did not reach the mortality threshold of 18.13 mg· (Table 3). Similarly, in August, the measured starch values in defoliated trees did not reach the threshold (18.16 mg· in twigs, Table 3) and even that, defoliated trees show a higher starch concentration in twigs than control (Figure 3). However, the variance explained in twig was very low (R2 of 0.26)
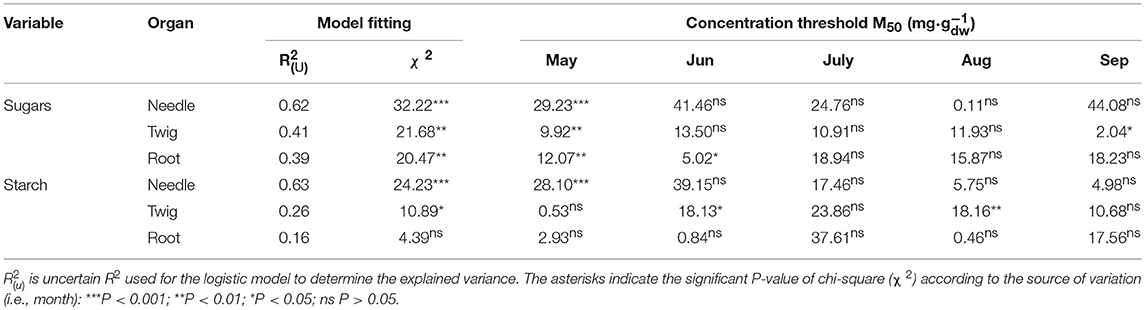
Table 3. Logistic results of each organ and variable including the calculated values of M50 from May to September in balsam fir.
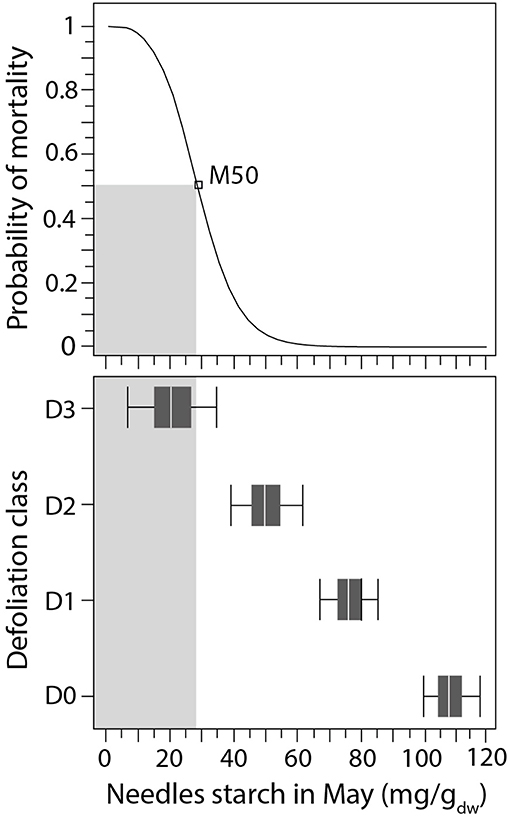
Figure 7. Logistic function linking starch concentrations in May with the probability of balsam fir mortality. The box plot represents starch concentrations across the different defoliation classes. The gray rectangles represent the threshold of tree vitality with probability of 50%.
The sugar concentrations at which the probability of plant mortality exceeded 50% were significant in all organs in May with the highest explained variance in needles (R2 of 0.62, Table 3). In needles, the model estimated a sugar threshold of 29.2 mg· in May, a concentration not reached in our observations due to the high variability in sugar concentrations (Figure 2, Table S2). In both twigs and roots, M50 was reached for D3 only, with 10.0 and 12.0 mg· of sugar in twigs and roots, respectively. For the other months (June–September), only a few models were significant (Table 3), including June (M50 of 5.0 mg· sugars in root) and September (M50 of 2.0 mg· sugars in twig). However, these were less parsimonious models because of their lower explained variance ().
Defoliation by spruce budworm reduces leaf area and carbon assimilation; this has dramatic consequences on carbon allocation (Vanderklein and Reich, 1999; Li et al., 2002; Deslauriers et al., 2015). During an outbreak, this reduced carbon assimilation is reflected in the tree's starch concentrations, which is a strong signal of a decrease in tree vitality, confirming our hypothesis. The stored starch in spring likely influences the free sugars availability when degradation occurs after budbreak, enabling a higher flux of sucrose export through the tree, thus representing an important future use of sugars (Martínez-Vilalta et al., 2016). Storage starch follows a clear and stable intra-annual pattern in all tree organs (Hoch et al., 2003; Deslauriers et al., 2018), increasing the possibility to use this form of NSC as a proxy. Our results demonstrate that under increasing defoliation, carbon allocation to reserves and radial growth decreases in a similar manner. In balsam fir, the most affected species, the decrease in starch and soluble sugar concentrations was linked to mortality thresholds at moderate and high levels of defoliation; this pattern thus reflects the decreasing resistance of trees to defoliation.
Even if not measured, other sources of stored reserves could also be used such as protein and lipids (Hoch et al., 2003; Hartmann and Trumbore, 2016). Depending on the species, the seasonal variation in lipids in conifers was reported to be either negligible (Hoch et al., 2003) or less pronounced (Lahr and Krokene, 2013), which makes this compound much less attractive to use as a proxy. Lipids and proteins have a well-documented roles as respiratory substrates (MacNeill et al., 2017), especially under shading (Fischer et al., 2015) when transient starch (starch synthetized and degraded according to a diurnal pattern in the chloroplast) is not sufficient to fulfill the metabolic needs at night (Wiley et al., 2016).
We found that our defoliation classes corresponded to differences in growth and carbon allocation to storage, with both variables decreasing at higher defoliation intensities. In conifers, needles can assimilate and store carbon, especially during the spring. Any changes in carbon balance under defoliation occur initially in the starch pool of needles (Vanderklein and Reich, 1999; Deslauriers et al., 2018) because of a reduced carbon allocation to storage (Wiley and Helliker, 2012). Our results agree with these findings as in May and June, the starch concentrations of twigs and needles (rather than soluble sugar concentrations) were indicative of the carbon status in defoliated trees. The molecular mechanism by which storage starch is gradually down-regulated along a defoliation gradient is not known but a decrease in key enzymes or essential products of photosynthesis could be involved (MacNeill et al., 2017).
Interestingly, the total sugars concentration slightly increases in defoliated trees in May, but the decreasing starch concentration across the defoliation gradient indicate a progressively lower storage. The increase in soluble sugars in May was however, not consistent between defoliation classes, organs and species. Even if sugar concentration in tree organs need to be kept above a critical threshold (Sala et al., 2012; Dietze et al., 2014; Martínez-Vilalta et al., 2016) a consistent decrease with higher defoliation levels in fir and spruce was not observed. Soluble sugar content is subject to less pronounced variations (Schiestl-Aalto et al., 2015) and is organ-dependent (Li et al., 2002; Hoch et al., 2003), which is in agreement with our results. Compared with un-defoliated trees, a drop in sugar concentrations was indeed observed in needles, twigs and roots of defoliated trees of both species in July which could be related to lower growth activity (Deslauriers et al., 2018).
Following defoliation, stem growth, a secondary sink of carbon, is quickly reduced (Dobbertin, 2005; Krause et al., 2012). Tree-ring formation is sink-driven (Körner, 2015; Deslauriers et al., 2016), and a modification in carbon allocation negatively affects radial growth. Severe defoliation by spruce budworm reduces radial growth (Blais, 1962; Morin and Gagnon, 1992; Krause et al., 2003; Pothier and Mailly, 2006) as confirmed by our 2012–2015 data. Indeed, our results followed a characteristic pattern, beginning with a gradual decrease in radial growth and then an accelerated decrease after 3–5 years (Morin and Gagnon, 1992; Morin, 1994; Boulanger et al., 2012; Fierravanti et al., 2015). Moreover, the 2014 growth reductions were closely linked to the severity of defoliation, such as previously observed in balsam fir (Deslauriers et al., 2015). In addition to growth reductions, defoliation also decreases the allocation to defense compounds (in term of number and concentration) due to lower carbohydrate availability (Deslauriers et al., 2015; Wiley et al., 2016), which may extend defoliation and, in turn, growth reduction.
We observed drastic growth reductions in dying balsam fir trees that occurred simultaneously with declines in non-structural carbon concentrations, especially for starch in May and June. Comparing the results of the logistic models, the starch concentration in needles in May was the best indicator of the decrease in tree vitality, with the minimum values indicating mortality recorded during the following year (Figure 7). Therefore, mortality in balsam fir was linked to both reduced tree-ring width and starch reserves, although establishing a direct link (i.e., causality) is difficult without a general understanding of carbon allocation. Indeed, understanding of the physiological mechanisms that lead to mortality and the associated change in growth rates remains limited, although mortality is preceded by growth reductions in 84% of the cases (Cailleret et al., 2017). Moreover, most models of forest dynamics assume that the probability of tree mortality is a function of the growth rate, with the slowest-growing trees having a higher probability of dying (Kneeshaw et al., 2006; Das et al., 2016;De Grandpré et al., 2019).
Spruce budworm instars usually eat new current-year needles, which have, at maturity, a higher photosynthetic rate compared to older foliage (Robakowski and Bielinis, 2017). Before the resumption of growth, the net carbon assimilated by photosynthesis is used for carbon reserves, representing a form of passive storage [i.e., overflow of carbon not regulated as a competing sink (Hartmann and Trumbore, 2016)]. However, as the outbreak continues, the carbon (in this case, starch) decreased to a threshold of 28 mg· during the spring. Beyond this threshold, the probability of observing mortality exceeded 50%. In early spring, starch refilling in needles and twigs is fundamental for supporting primary growth (Millard et al., 2007; Palacio et al., 2014) as the resumption of growth activity in the stem and in the canopy occurs when storage starch peaks at the end of May in both spruce and fir (Antonucci et al., 2015). In defoliated conifers however, the production of new needles has priority over carbon storage (Deslauriers et al., 2018) and stem and root growth (Piene, 1989). Therefore, because of the missing flux of sucrose from storage starch degradation, highly defoliated trees cannot allocate sufficient carbon to support new shoot growth, while non-structural carbon is insufficient to maintain stem growth. To some extent, this could explain why the probability of tree mortality is inversely related to the growth rate (Das et al., 2016; De Grandpré et al., 2019) and explain why mortality increases rapidly in highly defoliated trees (Alfaro et al., 1982). Even if black spruce was only moderately defoliated, the pattern of starch allocation with increased defoliation remains similar to that of balsam fir. We thus propose that severely defoliated black spruce could reach similar M50 values of starch before succumbing. However, more study is needed on defoliated black spruce to assess the starch and sugar concentrations for which the probability of plant mortality exceeds 50%.
An understanding of the drivers of decreasing tree vitality leading to mortality should also consider the overall cumulative set of environmental stressors [i.e., Manion's model of mortality, Manion (1981)]. For example, spruce budworm outbreaks are cyclical (Morin et al., 2007), and severe outbreaks occurred in the 1970s (Morin et al., 1993). Given that a first decreasing phase was observed in the tree-ring index ratio between dead and living trees during the last spruce budworm outbreak in the mid-sixties and seventies, the dead trees may be those already showing a sub-optimal growth (i.e., a value <1, Figure 5). Moreover, the decrease in tree vigor in the mid-sixties were also related with abiotic stress conditions characterized by below average spring temperature and above average summer temperature (De Grandpré et al., 2019). A large reduction in the probability of mortality is largely explained by an increase in tree growth (Soucy et al., 2012). Therefore, previous defoliation- or climate-related stresses may have led to a lower level of tree vitality, indicated by lower growth, before the current defoliation and tree mortality observed in this study (Soucy et al., 2012; De Grandpré et al., 2019).
All authors planned and designed the research under the coordination of AD. AF performed all the analysis presented in this study. AF wrote most of the manuscript under the supervision of AD with substantial contributions from SR, DK, and LD.
This study was funded by the Natural Sciences and Engineering Research Council of Canada (Discovery Grant), the Programme de Financement de la Recherche et Développement en Aménagement Forestier of the Province of Québec (Ministère des Forêts, de la Faune et des Parcs du Québec).
The authors declare that the research was conducted in the absence of any commercial or financial relationships that could be construed as a potential conflict of interest.
We thank S. Rivest and J. J. Monerris for their help in data collection, and I. Allie for the sugar and starch analyses.
The Supplementary Material for this article can be found online at: https://www.frontiersin.org/articles/10.3389/ffgc.2019.00015/full#supplementary-material
Alfaro, R. I., Van Sickle, G. A., Thomson, A. J., and Wegwitz, E. (1982). Tree mortality and radial growth losses caused by the western spruce budworm in a Douglas-fir stand in British Columbia. Can. J. Forest Res. 12, 780–787. doi: 10.1139/x82-117
Antonucci, S., Rossi, S., Deslauriers, A., Lombardi, F., Marchetti, M., and Tognetti, R. (2015). Synchronisms and correlations of spring phenology between apical and lateral meristems in two boreal conifers. Tree Physiol. 35, 1086–1094. doi: 10.1093/treephys/tpv077
Battipaglia, G., Zalloni, E., Castaldi, S., Marzaioli, F., Cazzolla-Gatti, R., Lasserre, B., et al. (2015). Long tree-ring chronologies provide evidence of recent tree growth decrease in a Central African tropical forest. PLoS ONE 10:e0120962. doi: 10.1371/journal.pone.0120962
Bellasio, C., Fini, A., and Ferrini, F. (2014). Evaluation of a high throughput starch analysis optimised for wood. PLoS ONE 9:e86645. doi: 10.1371/journal.pone.0086645
Blais, J. R. (1962). Collection and analysis of radial-growth data from trees for evidence of past spruce budworm outbreak. Forestry Chronicle 38, 474–484. doi: 10.5558/tfc38474-4
Bognounou, F., De Grandpré, L., Pureswaran, D. S., and Kneeshaw, D. (2017). Temporal variation in plant neighborhood effects on the defoliation of primary and secondary hosts by an insect pest. Ecosphere 8:e01759. doi: 10.1002/ecs2.1759
Bouchard, M., Martel, V., Régnière, J., Therrien, P., and Correia, D. L. P. (2018). Do natural enemies explain fluctuations in low-density spruce budworm populations? Ecology 99, 2047–2057. doi: 10.1002/ecy.2417
Boulanger, Y., Arseneault, D., Morin, H., Jardon, Y., Bertrand, P., and Dagneau, C. (2012). Dendrochronological reconstruction of spruce budworm (Choristoneura fumiferana) outbreaks in southern Quebec for the last 400 years. Can. J. Forest Res. 42, 1264–1276. doi: 10.1139/X2012-069
Boulanger, Y., Fabry, F., Kilambi, A., Pureswaran, D. S., Sturtevant, B. R., and Saint-Amant, R. (2017). The use of weather surveillance radar and high-resolution three dimensional weather data to monitor a spruce budworm mass exodus flight. Agricult. Forest Meteorol. 234–235, 127–135. doi: 10.1016/j.agrformet.2016.12.018
Boulanger, Y., Gray, D. R., Cooke, B. J., and De Grandpré, L. (2016). Model-specification uncertainty in future forest pest outbreak. Glob. Chang. Biol. 22, 1595–1607. doi: 10.1111/gcb.13142
Cailleret, M., Jansen, S., Robert, E. M. R., Desoto, L., Aakala, T., Antos, J. A., et al. (2017). A synthesis of radial growth patterns preceding tree mortality. Glob. Chang. Biol. 23, 1675–1690. doi: 10.1111/gcb.13535
Caron, L., Deslauriers, A., Mshvildadze, V., and Pichette, A. (2013). Volatile compounds in the foliage of balsam fir analyzed by static headspace gas chromatography (HS-GC): an example of the spruce budworm defoliation effect in the boreal forest of Quebec, Canada. Microchem. J. 110, 587–590. doi: 10.1016/j.microc.2013.07.003
Chen, C., Weiskittel, A., Bataineh, M., and Maclean, D. A. (2017). Even low levels of spruce budworm defoliation affect mortality and ingrowth but net growth is more driven by competition. Can. J. Forest Res. 47, 1546–1556. doi: 10.1139/cjfr-2017-0012
Chow, P. S., and Landhäusser, S. M. (2004). A method for routine measurements of total sugar and starch content in woody plant tissues. Tree Physiol. 24, 1129–1136. doi: 10.1093/treephys/24.10.1129
Das, A. J., Stephenson, N. L., and Davis, K. P. (2016). Why do trees die? Characterizing the drivers of background tree mortality. Ecology 97, 2616–2627. doi: 10.1002/ecy.1497
De Grandpré, L., Kneeshaw, D. D., Perigon, S., Boucher, D., Marchand, M., Pureswaran, D., et al. (2019). Adverse climatic periods precede and amplify defoliator-induced tree mortality in eastern boreal North America. J. Ecol. 107, 452–467. doi: 10.1111/1365-2745.13012
Desalme, D., Priault, P., Gérant, D., Dannoura, M., Maillard, P., Plain, C., et al. (2017). Seasonal variations drive short-term dynamics and partitioning of recently assimilated carbon in the foliage of adult beech and pine. New Phytol. 213, 140–153. doi: 10.1111/nph.14124
Deslauriers, A., Caron, L., and Rossi, S. (2015). Carbon allocation during defoliation: testing a defense-growth trade-off in balsam fir. Front. Plant Sci. 6, 1–13. doi: 10.3389/fpls.2015.00338
Deslauriers, A., Fournier, M. P., Carteni, F., and Mackay, J. (2018). Phenological shifts in conifer species stressed by spruce budworm defoliation. Tree Physiol. doi: 10.1093/treephys/tpy135. [Epubh ahead of print].
Deslauriers, A., Giovannelli, A., Rossi, S., Castro, G., Fragnelli, G., and Traversi, L. (2009). Intra-annual cambial activity and carbon availability in stem of poplar. Tree Physiol. 29, 1223–1235. doi: 10.1093/treephys/tpp061
Deslauriers, A., Huang, J., Balducci, L., Beaulieu, M., and Rossi, S. (2016). The contribution of carbon and water in modulating wood formation in black spruce saplings. Plant Physiol. 170, 2072–2084. doi: 10.1104/pp.15.01525
Dietze, M. C., Sala, A., Carbone, M. S., Czimczik, C. I., Mantooth, J. A., Richardson, A. D., et al. (2014). Nonstructural carbon in woody plants. Annu. Rev. Plant Biol. 65, 667–687. doi: 10.1146/annurev-arplant-050213-040054
Dobbertin, M. (2005). Tree growth as indicator of tree vitality and of tree reaction to environmental stress: a review. Eur. J. For. Res. 124, 319–333. doi: 10.1007/s10342-005-0085-3
Doran, O., MacLean, D. A., and Kershaw, J. A. (2017). Needle longevity of balsam fir is increased by defoliation by spruce budworm. Trees – Struct. Funct. 31, 1933–1944. doi: 10.1007/s00468-017-1597-4
Fierravanti, A., Cocozza, C., Palombo, C., Rossi, S., Deslauriers, A., and Tognetti, R. (2015). Environmental-mediated relationships between tree growth of black spruce and abundance of spruce budworm along a latitudinal transect in Quebec, Canada. Agricult. Forest Meteorol. 213, 53–63. doi: 10.1016/j.agrformet.2015.06.014
Fischer, S., Hanf, S., Frosch, T., Gleixner, G., Popp, J., Trumbore, S., et al. (2015). Pinus sylvestris switches respiration substrates under shading but not during drought. New Phytol. 207, 542–550. doi: 10.1111/nph.13452
Fonti, P., and García-González, I. (2004). Suitability of chestnut earlywood vessel chronologies for ecological studies. New Phytol. 163, 77–86. doi: 10.1111/j.1469-8137.2004.01089.x
Gouvernment of Canada (2018). Historical Climate Data. Available online at: http://climate.weather.gc.ca/index_e.html (accessed 2017-01-15).
Gray, D. R. (2008). The relationship between climate and outbreak characteristics of the spruce budworm in eastern Canada. Climatic Change 87, 361–383. doi: 10.1007/s10584-007-9317-5
Hartmann, H., and Trumbore, S. (2016). Understanding the roles of nonstructural carbohydrates in forest trees – from what we can measure to what we want to know. New Phytol. 211, 386–403. doi: 10.1111/nph.13955
Hoch, G., Richter, A., and Körner, C. (2003). Non-structural carbon compounds in temperate forest trees. Plant, Cell Env. 26, 1067–1081. doi: 10.1046/j.0016-8025.2003.01032.x
Holmes, R. L. (1983). Comput-assisted quality control in tree-ring dating and measurement. Tree-Ring Bull. 43, 69–78.
Kaennel, M., and Schweingruber, F. H. (1995). Multilingual Glossary of Dendrochronology. Terms and Definitions in English, German, French, Spanish, Italian, Portuguese, and Russian (Berne: Haupt).
Kneeshaw, D. D., Kobe, R. K., Coates, K. D., and Messier, C. (2006). Sapling size influences shade tolerance ranking among southern boreal tree species. J. Ecol. 94, 471–480. doi: 10.1111/j.1365-2745.2005.01070.x
Körner, C. (2015). Paradigm shift in plant growth control. Curr. Opin. Plant Biol. 25, 107–114. doi: 10.1016/j.pbi.2015.05.003
Krause, C., Gionest, F., Morin, H., and MacLean, D. A. (2003). Temporal relations between defoliation caused by spruce budworm (Choristoneura fumiferana Clem.) and growth of balsam fir (Abies balsamea (L.) Mill.). Dendrochronologia 21, 23–31. doi: 10.1078/1125-7865-00037
Krause, C., Luszczynski, B., Morin, H., Rossi, S., and Plourde, P. Y. (2012). Timing of growth reductions in black spruce stem and branches during the 1970s spruce budworm outbreak. Can. J. Forest Res. 42, 1220–1227. doi: 10.1139/X2012-048
Lahr, E. C., and Krokene, P. (2013). Conifer stored resources and resistance to a fungus associated with the spruce bark beetle Ips typographus. PLoS ONE 8:e72405. doi: 10.1371/journal.pone.0072405
Lawrence, R. K., Mattson, W. J., and Haack, R. A. (1997). White spruce and the spruce budworm: defining the phenological window of susceptibility. Can. Entomol. 129, 291–318. doi: 10.4039/Ent129291-2
Li, M., Hoch, G., and Körner, C. (2002). Source/sink removal affects mobile carbohydrates in Pinus cembra at the Swiss treeline. Trees - Struct. Funct. 16, 331–337. doi: 10.1007/s00468-002-0172-8
Little, C. H. A. (1970). Derivation of the springtime starch increase in balsam fir (Abies balsamea). Can. J. Botany 48, 1995–1999. doi: 10.1139/b70-291
Maclean, D. A., and Lidstone, R. G. (1982). Defoliation by spruce budworm: estimation by ocular and shoot-count methods and variability among branches, trees, and stands. Can. J. Forest Res. 12, 582–594. doi: 10.1139/x82-090
MacNeill, G. J., Tetlow, I. J., Patterson, J. A., Minow, M. A. A., Mehrpouyan, S., and Emes, M. J. (2017). Starch as a source, starch as a sink: the bifunctional role of starch in carbon allocation. J. Exp. Bot. 68, 4433–4453. doi: 10.1093/jxb/erx291
Martínez-Vilalta, J., Sala, A., Asensio, D., Galiano, L., Hoch, G., Palacio, S., et al. (2016). Dynamics of non-structural carbohydrates in terrestrial plants: a global synthesis. Ecol. Monogr. 86, 495–516. doi: 10.1002/ecm.1231
Millard, P., Sommerkorn, M., and Grelet, G. A. (2007). Environmental change and carbon limitation in trees: a biochemical, ecophysiological and ecosystem appraisal. New Phytol. 175, 11–28. doi: 10.1111/j.1469-8137.2007.02079.x
Morin, H. (1994). Dynamics of balsam fir forests in relation to spruce budworm outbreaks in the Boreal Zone of Quebec. Can. J. Forest Res. 24, 730–741. doi: 10.1139/x94-097
Morin, H., and Gagnon, R. (1992). Comparative growth and yield of layer- and seed-origin black spruce (Picea mariana) stands in Quebec. Can. J. Forest Res. 22, 465–473. doi: 10.1139/x92-061
Morin, H., Jardon, Y., and Gagnon, R. A. (2007). “Relationship between spruce budworm outbreaks and forest dynamics in Eastern North America,” in Plant Disturbance Ecology, eds E. A. Johnson and K. Miyanishi (Amsterdam: Elsevier), 555–577.
Morin, H., Laprise, D., and Bergeron, Y. (1993). Chronology of spruce budworm outbreaks near Lake Duparquet, Abitibi region, Quebec. Can. J. Forest Res. 23, 1497–1506. doi: 10.1139/x93-189
Nealis, V. G. (2012). The phenological window for western spruce budworm: seasonal decline in resource quality. Agric. For. Entomol. 14, 340–347. doi: 10.1111/j.1461-9563.2012.00574.x
Nealis, V. G., and Régnière, J. (2004). Insect –host relationships influencing disturbance by the spruce budworm in a boreal mixedwood forest. Can. J. Forest Res. 34, 1870–1882. doi: 10.1139/x04-061
Palacio, S., Hoch, G., Sala, A., Körner, C., and Millard, P. (2014). Does carbon storage limit tree growth? New Phytol. 201, 1096–1100. doi: 10.1111/nph.12602
Piene, H. (1989). Spruce budworm defoliation and growth loss in young balsam fir: recovery of growth in spaced stands. Can. J. Forest Res. 19, 1616–1624. doi: 10.1139/x89-244
Piene, H., Maclean, D. A., and Wall, R. E. (1981). Effects of spruce budworm-caused defoliation on the growth of balsam fir: experimental design and methodology. Fredericton: Environment Canada, Canadian Forestry Service, Maritimes Forest Research Centre, Information Report M-X-128.
Pothier, D., and Mailly, D. (2006). Stand-level prediction of balsam fir mortality in relation to spruce budworm defoliation. Can. J. Forest Res. 36, 1631–1640. doi: 10.1139/x06-062
Puri, E., Hoch, G., and Körner, C. (2015). Defoliation reduces growth but not carbon reserves in Mediterranean Pinus pinaster trees. Trees - Struct. Funct. 29, 1187–1196. doi: 10.1007/s00468-015-1199-y
Régnière, J., Lysyk, T. J., and Auger, M. (1989). Population density estimation of spruce budworm, choristoneura fumiferana (clem.) (lepidoptera: Tortricidae) on balsam fir and white spruce from 45-cm mid-crown branch tips. Can. Entomol. 121, 267–281. doi: 10.4039/Ent121267-3
Régnière, J., and Nealis, V. G. (2007). Ecological mechanisms of population change during outbreaks of the spruce budworm. Ecol. Entomol. 32, 461–477. doi: 10.1111/j.1365-2311.2007.00888.x
Régnière, J., and Nealis, V. G. (2018). Two sides of a coin: host-plant synchrony fitness trade-offs in the population dynamics of the western spruce budworm. Insect Sci. 25, 117–126. doi: 10.1111/1744-7917.12407
Robakowski, P., and Bielinis, E. (2017). Needle age dependence of photosynthesis along a light gradient within an Abies alba crown. Acta Physiologiae Plantarum 39:83. doi: 10.1007/s11738-017-2376-y
Rossi, S., Deslauriers, A., Anfodillo, T., and Carraro, V. (2007). Evidence of threshold temperatures for xylogenesis in conifers at high altitudes. Oecologia 152, 1–12. doi: 10.1007/s00442-006-0625-7
Rossi, S., Plourde, P. Y., and Krause, C. (2018). Does a spruce budworm outbreak affect the growth response of black spruce to a subsequent thinning? Front. Plant Sci. 9:1061. doi: 10.3389/fpls.2018.01061
Sala, A., Woodruff, D. R., and Meinzer, F. C. (2012). Carbon dynamics in trees: feast or famine? Tree Physiol. 32, 764–775. doi: 10.1093/treephys/tpr143
Schiestl-Aalto, P., Kulmala, L., Mäkinen, H., Nikinmaa, E., and Mäkelä, A. (2015). CASSIA - a dynamic model for predicting intra-annual sink demand and interannual growth variation in Scots pine. New Phytol. 206, 647–659. doi: 10.1111/nph.13275
Soucy, M., Lussier, J.-M., and Lavoie, L. (2012). Long-term effects of thinning on growth and yield of an upland black spruce stand. Can. J. Forest Res. 42, 1669–1677. doi: 10.1139/x2012-107
Sulpice, R., Pyl, E., Ishihara, H., Trenkamp, S., Steinfath, M., Witucka-Wall, H., et al. (2009). Starch as a major integrator in the regulation of plant growth. Proc. Natl. Acad. Sci. U.S.A. 106:10348. doi: 10.1073/pnas.0903478106
van der Sleen, P., Groenendijk, P., Vlam, M., Anten, N. P. R., Boom, A., Bongers, F., et al. (2014). No growth stimulation of tropical trees by 150 years of CO2 fertilization but water-use efficiency increased. Nat. Geosci. 8:24. doi: 10.1038/ngeo2313
Vanderklein, D. W., and Reich, P. B. (1999). The effect of defoliation intensity and history on photosynthesis, growth and carbon reserves of two conifers with contrasting leaf lifespans and growth habits. New Phytol. 144, 121–132. doi: 10.1046/j.1469-8137.1999.00496.x
Webb, W. L. (1980). Starch content of conifers defoliated by the Douglas-fir tussock moth. Can. J. Forest Res. 10, 535–540. doi: 10.1139/x80-087
Webb, W. L. (1981). Relation of starch content to conifer mortality and growth loss after defoliation by the Douglas-fir Tussock Moth. Forest Sci. 27, 224–232. doi: 10.1093/forestscience/27.2.224
Webb, W. L., and Karchesy, J. J. (1977). Starch content of Douglas-fir defoliated by the tussock moth. Can. J. Forest Res. 7, 186–188. doi: 10.1139/x77-026
Wiley, E., and Helliker, B. (2012). A re-evaluation of carbon storage in trees lends greater support for carbon limitation to growth. New Phytol. 195, 285–289. doi: 10.1111/j.1469-8137.2012.04180.x
Wiley, E., Rogers, B. J., Hodgkinson, R., and Landhäusser, S. M. (2016). Nonstructural carbohydrate dynamics of lodgepole pine dying from mountain pine beetle attack. New Phytol. 209, 550–562. doi: 10.1111/nph.13603
Wyckoff, P. H., and Clark, J. S. (2002). The relationship between growth and mortality for seven co-occurring tree species in the southern Appalachian Mountains. J. Ecol. 90, 604–615. doi: 10.1046/j.1365-2745.2002.00691.x
Keywords: balsam fir, black spruce, starch, carbon allocation, defoliation, tree-ring growth, tree vitality
Citation: Fierravanti A, Rossi S, Kneeshaw D, De Grandpré L and Deslauriers A (2019) Low Non-structural Carbon Accumulation in Spring Reduces Growth and Increases Mortality in Conifers Defoliated by Spruce Budworm. Front. For. Glob. Change 2:15. doi: 10.3389/ffgc.2019.00015
Received: 11 November 2018; Accepted: 10 April 2019;
Published: 26 April 2019.
Edited by:
Anna Sala, University of Montana, United StatesCopyright © 2019 Fierravanti, Rossi, Kneeshaw, De Grandpré and Deslauriers. This is an open-access article distributed under the terms of the Creative Commons Attribution License (CC BY). The use, distribution or reproduction in other forums is permitted, provided the original author(s) and the copyright owner(s) are credited and that the original publication in this journal is cited, in accordance with accepted academic practice. No use, distribution or reproduction is permitted which does not comply with these terms.
*Correspondence: Annie Deslauriers, YWRlc2xhdXJAdXFhYy5jYQ==
Disclaimer: All claims expressed in this article are solely those of the authors and do not necessarily represent those of their affiliated organizations, or those of the publisher, the editors and the reviewers. Any product that may be evaluated in this article or claim that may be made by its manufacturer is not guaranteed or endorsed by the publisher.
Research integrity at Frontiers
Learn more about the work of our research integrity team to safeguard the quality of each article we publish.