- 1College of Resources and Environment, Henan Agricultural University, Zhengzhou, China
- 2Henan Engineering Research Center of Land Consolidation and Ecological Restoration, Zhengzhou, China
- 3School of Engineering Management and Real Estate, Henan University of Economics and Law, Zhengzhou, China
- 4Wuhan Botanical Garden, Chinese Academy of Science, Wuhan, China
- 5College of Resources and Environment, Huazhong Agricultural University, Wuhan, China
A reasonable ecological security pattern can improve landscape connectivity, promote biological circulation, maintain ecological processes, and improve regional ecosystem service functions and human well-being. Accordingly, systematically and scientifically analyzing the spatiotemporal evolution characteristics of the regional ecological security pattern has essential theoretical and practical significance. This research proposed that the analysis framework of the ecological security pattern should include a complete system composed of ecological sources, resistance surfaces, and corridors. Thus, this research uses the ecological network method to systematically analyze the spatiotemporal evolution characteristics of the ecological security pattern in the Qinba–Dabie intersection zone in China, a complete natural ecological unit across administrative regions, from 2000 to 2020. Results revealed the following: (1) The distribution change law of the ecological sources in the study area was consistent with the distribution change law of their centrality. (2) In the northeast of the study area, the disappearance of the small ecological sources, which play a stepping stone role, led to a longer length and a weaker centrality of ecological corridors. (3) The resistance surface in the study area showed an overall growth trend, while the ecological corridor network showed an overall deterioration trend. Based on the results, this research suggests that the systematic analysis and targeted protection of ecological sources are the basis for maintaining the ecological security pattern, and targeted improvement of ecological resistance surface is the key to improving the ecological security pattern. Therefore, measures such as the protection of core ecological sources, the rational layout of ecological sources as stepping stones, and the improvement of resistance values at ecological key points should be paid attention to in the future.
1 Introduction
With the growth of population and the advancement of urbanization, the urban and agricultural space is constantly expanding to meet the needs of human survival and development (Sun et al., 2020). However, the expansion is at the cost of occupying and squeezing the ecological space. On the one hand, the continuous decrease of ecological space leads to the deterioration of the biological living environment, which reduces biological quantity, biodiversity, and ecosystem service function and breaks ecosystem balance (Gao et al., 2022). On the other hand, the fragmentation trend of ecological space has led to the decline of connectivity between different ecological patches, the obstruction of biological circulation, and the interruption of ecological processes, which further accelerated the decrease of ecological space and organisms (Maseko et al., 2020). Therefore, how to deal with the contradiction between urban, agricultural, and ecological space and curb the negative trend of ecological space reduction and fragmentation is an important issue facing countries worldwide. At present, the analysis and construction of the regional ecological security pattern through the ecological network method is an important means of ecological space protection and restoration (Baguette et al., 2013). The main concern of this research is how to analyze the regional ecological security pattern scientifically.
The premise of scientific analysis of regional ecological security patterns is to construct it reasonably. The current mainstream practice of the regional ecological security pattern identification is “ecological source identification–ecological resistance surface construction–ecological network generation (Nielsen and Bascompte, 2007; Merrick and Koprowski, 2017; An et al., 2021; Zhang et al., 2021a).” For example, Li et al. (2023) used different combinations of methods in the three steps of ecological security pattern identification to compare and analyze the construction methods and the applicability of the corresponding ecological network results. Similarly, Lumia et al. (2024) compared different connectivity models in their abilities to predict a wide range of simulated animal movement patterns. Considering the selection of study areas, most researchers directly use anthropogenic administrative regions (Li et al., 2021; Yu et al., 2022). For example, Alexander et al. (2016) used 11-county in eastern Montana as the study area and identified a large potential corridor of swift foxes that ran roughly from north to south through the middle of the study area. Ma and Xu (2022)selected the Yangtze River Delta as the study area and introduced a regional-scale ecological protection red line connectivity optimization, classification, and grading control scheme based on the minimum cumulative resistance model (MCR) and circuit model. However, using the anthropogenic administrative regions as the study area may split up the original, complete natural ecological unit. Regarding time scale, most studies on the ecological security pattern are limited to a particular time, while only a few focus on the evolution of the ecological security pattern (Yao et al., 2022a; Liu et al., 2023). Regarding result analysis, most studies on the ecological security pattern analysis pay more attention to the qualitative analysis of the identification results of ecological corridors from the “corridor” level and less attention to the important impact of “source” and “surface” on the ecological security pattern. For example, Santos et al. (2018) analyzed the landscape ecology and created ecological corridors in a Brazilian Atlantic Forest region. Morandi et al. (2020) identified suitable areas for ecological corridors between two conservation units located in the Espinhaço Range Biosphere Reserve in the Cerrado biome, Brazil.
To sum up, although relevant scholars have done much work on the ecological security pattern, some deficiencies remain to be further explored. This research mainly focuses on two aspects: (1) A spatiotemporal analysis framework of the ecological security pattern based on the ecological “source–surface–corridor” is proposed to systematically and scientifically analyze the spatiotemporal evolution characteristics of the pattern; (2) A relatively complete natural ecological unit is selected as the study area rather than an anthropogenic administrative region.
To achieve research objectives, this research investigates the spatiotemporal evolution characteristics of the ecological security pattern of the Qinba–Dabie intersection zone in China from 2000 to 2020 based on the ecological “source–surface–corridor”. First, this research constructed a comprehensive ecosystem service index to identify the ecological sources. Second, the research established the ecological resistance surfaces by selecting ten natural and human factors. Third, this research identified the ecological corridors, ecological pinch points, and ecological barrier points using the minimum cumulative resistance (MCR) model and the circuit model. Moreover, the spatiotemporal evolution characteristics of the ecological security pattern identification results were quantitatively analyzed, and the relationship between ecological sources, resistance surfaces, and corridors was further explored. Based on the relationship, the regional ecological protection and restoration pattern in the Qinba–Dabie intersection zone was constructed, and targeted ecological protection and restoration strategies were proposed.
2 Materials and methods
2.1 Study area
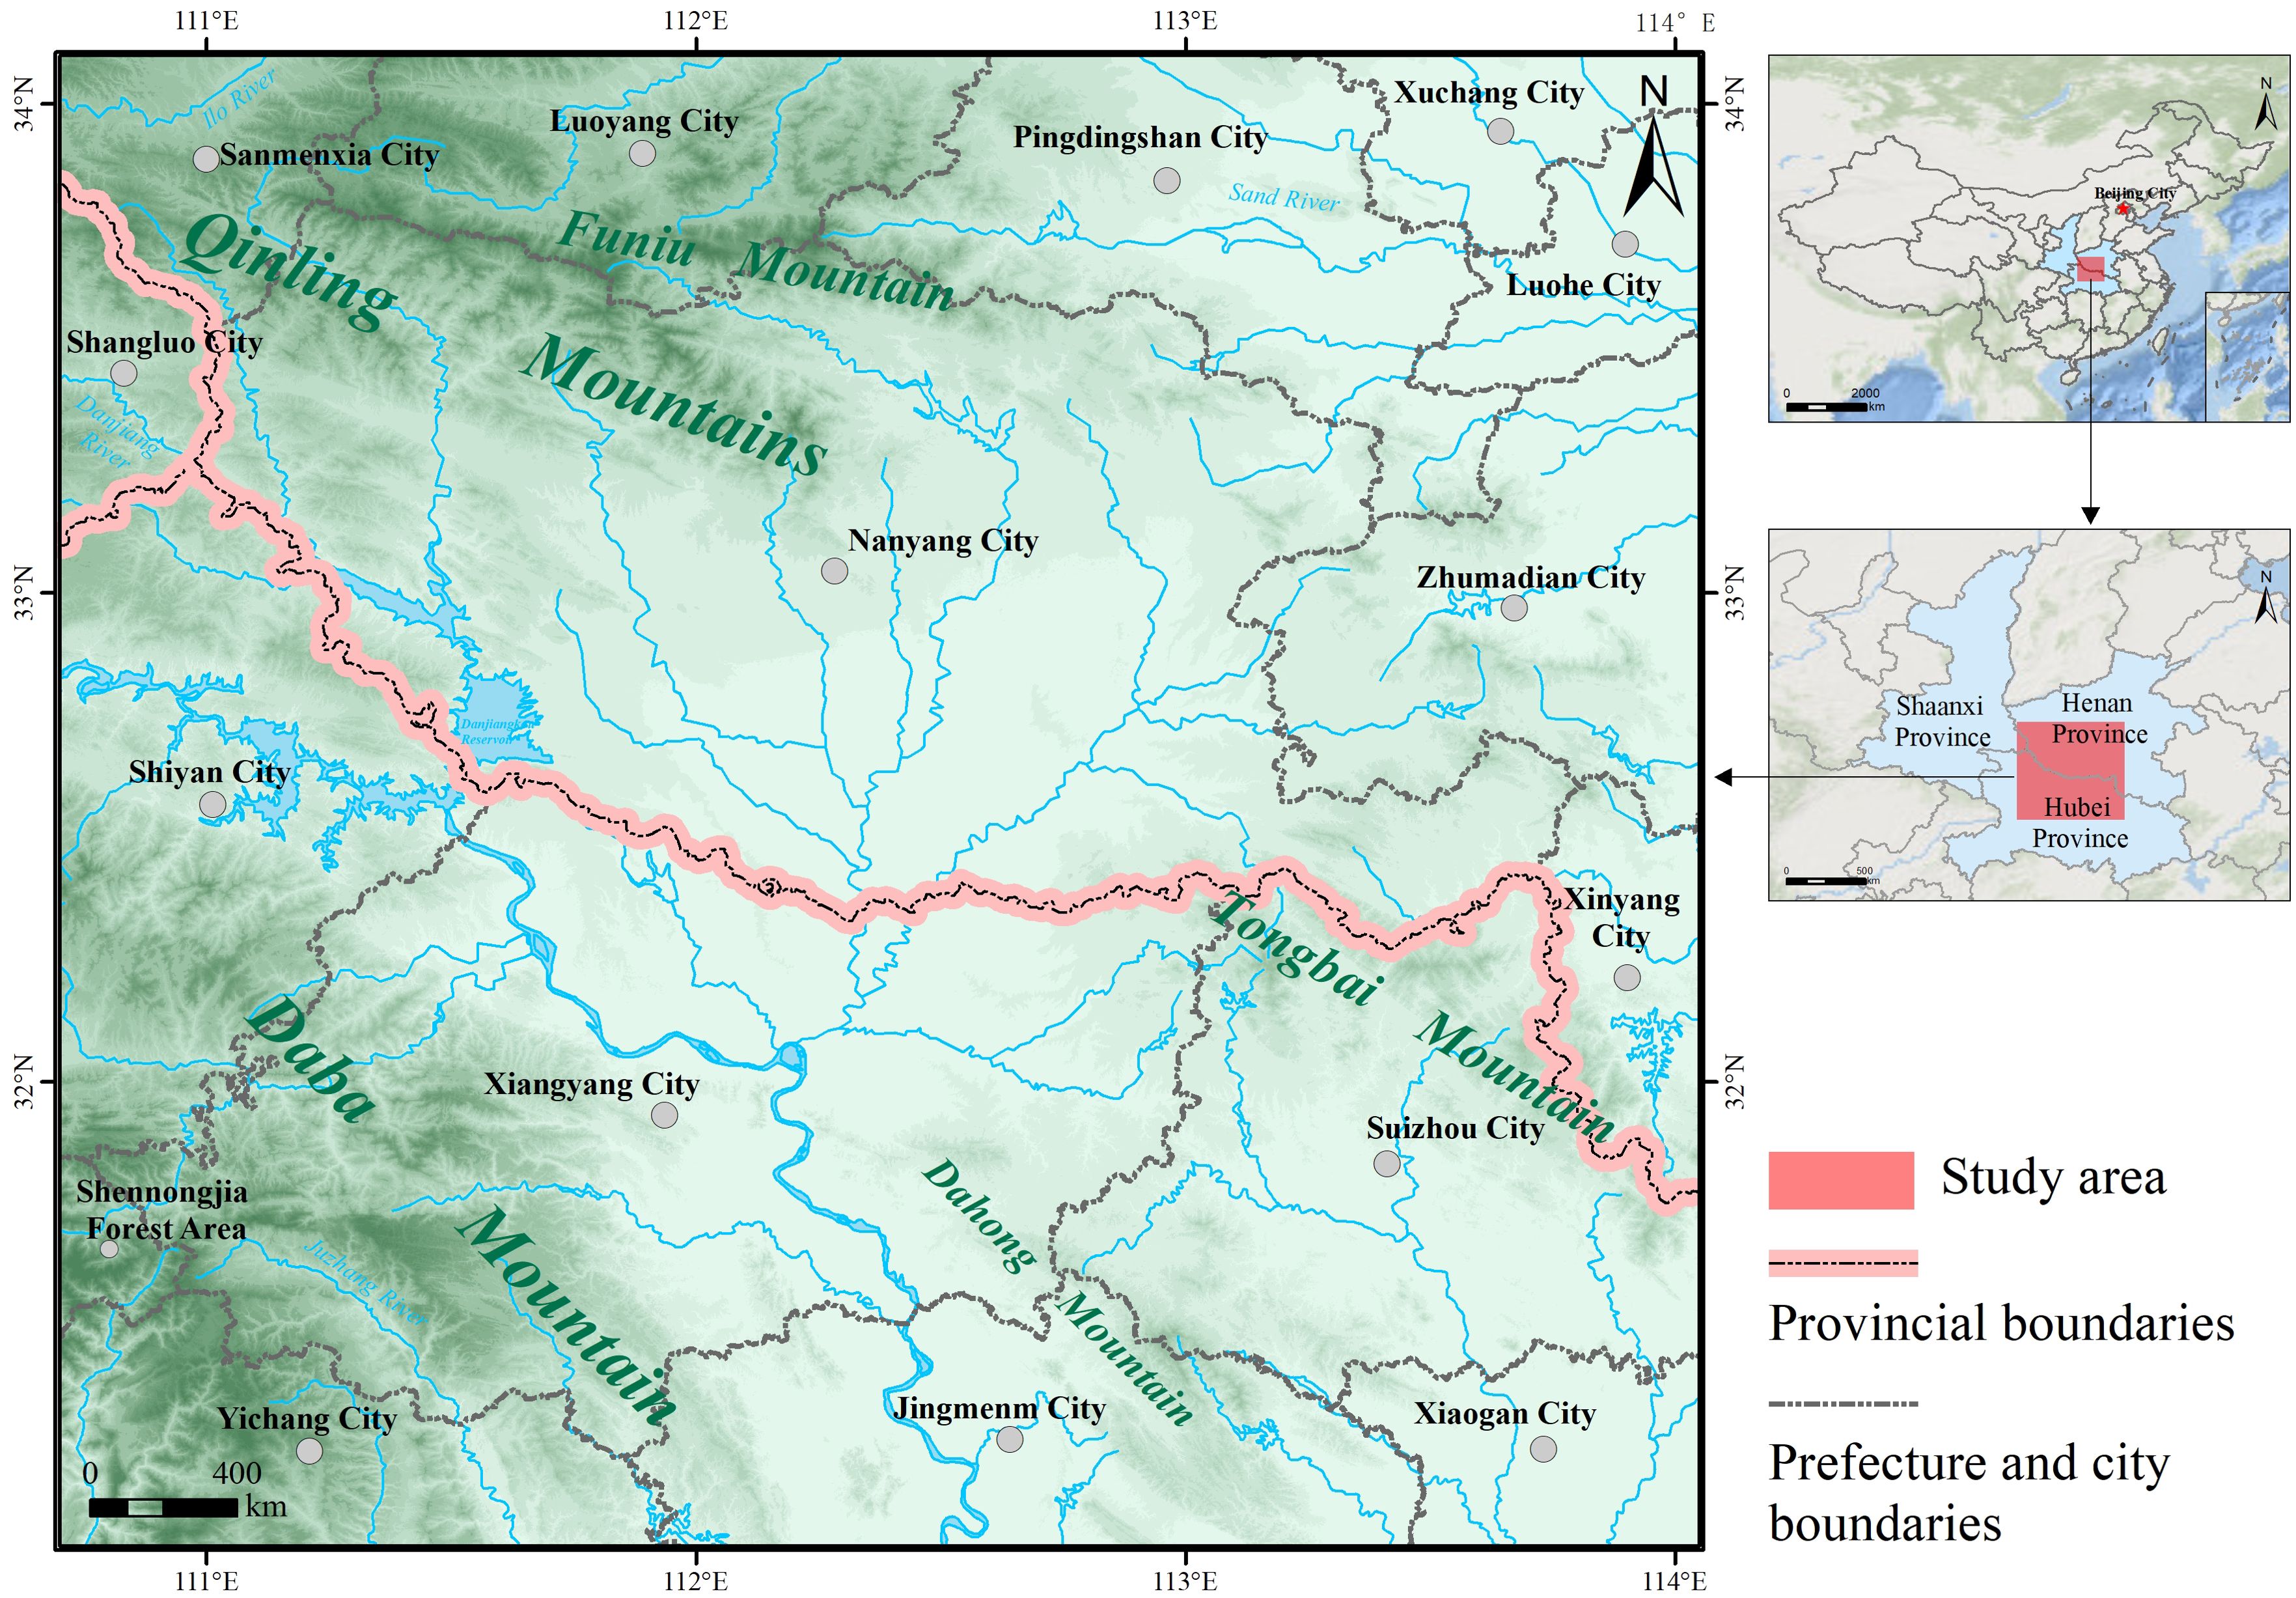
The Qinba–Dabie intersection zone is a critical ecological zone at the junction of Henan, Hubei, and Shanxi provinces in China, located between 31°05’–34°10’ N and 110°70’–114°05’ E (Figure 1). The zone extends north to the Funiu Mountain in the Qinling Mountains, south to the Dahong Mountains, east to the Tongbai Mountain in the Dabie Mountains, and west to the northeastern part of the Daba Mountains, including the Nanyang Basin and the surrounding natural ecological areas. Meanwhile, the zone located in the transition region ranges from a subtropical to a warm temperate zone, spanning the Yangtze and Huaihe Rivers. The ecology, agriculture, and urban space of the zone are interwoven distribution. On the one hand, the natural ecological background is good. The Danjiangkou Reservoir in the zone is the water source of the middle route of the South-to-North Water Diversion Project. The zone has 52 natural protection areas, such as the Baiyun Mountain National Forest Park in Henan, the Nanyang Dinosaur Egg Stone Group National Nature Reserve in Henan, and the Wudang Mountains National Geopark in Hubei. On the other hand, the Nanyang Basin in the Qinba–Dabie intersection zone is one of the critical agricultural areas in Henan Province, which is the concentrated production area of grain, cotton, oil, and tobacco in China. Simultaneously, the study area spans the Henan, Hubei, and Shanxi Provinces and distributes 16 cities such as Nanyang, Xiangyang, Suizhou, Jingmen, and Shiyan. Especially, Nanyang and Xiangyang are the sub-center cities of Henan and Hubei, respectively. Thus, the zone faces potential conflict risks between ecological protection, agricultural production, and urban development. Identifying the spatiotemporal evolution characteristics of the ecological security pattern in the zone and further formulating ecological protection and restoration strategies according to local conditions is of considerable importance for coordinating regional ecology, agriculture, and urban space utilization and achieving regional sustainable development (Song et al., 2020).
2.2 Data sources
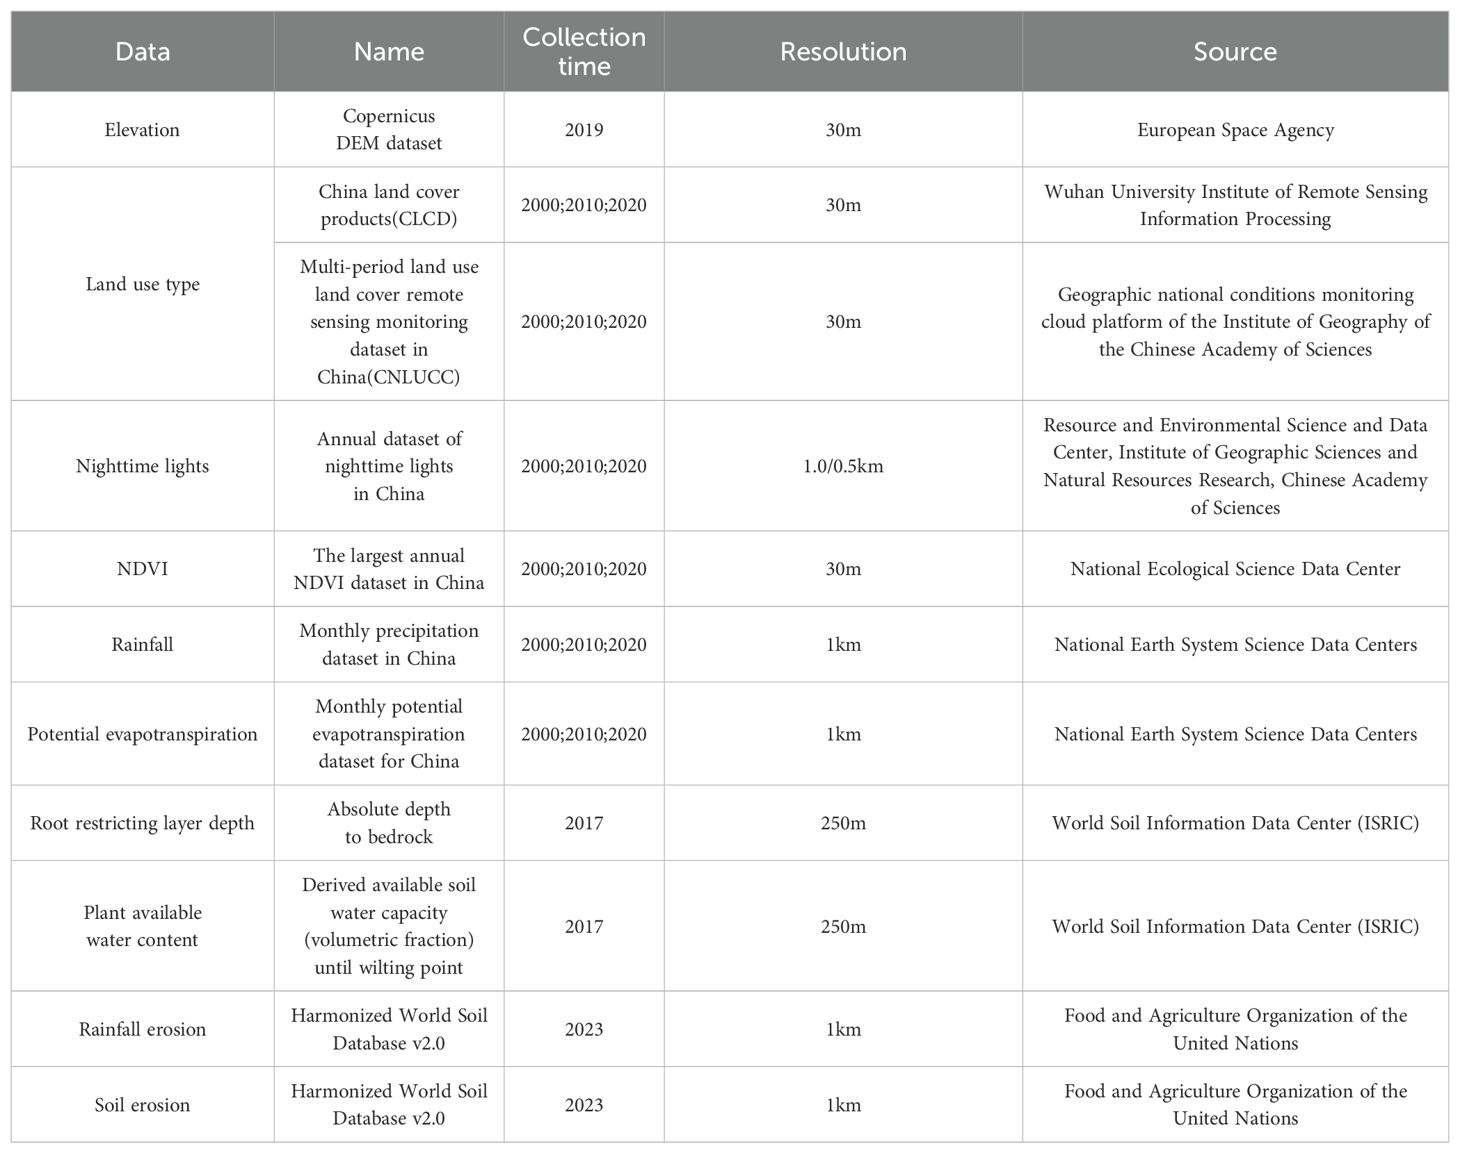
Identifying ecological sources and constructing ecological resistance surfaces requires 10 data items, such as elevation, land use type, and night light (Table 1). Due to the different spatial ratios and coordinate systems of each data, this research converted the spatial resolution of all data to 250 m and transformed the coordinate system to CGCS2000 according to the zone’s characteristics. In addition, this research mainly used the 30 m resolution of China’s annual land cover data (CLCD) based on Landsat remote sensing observations from the Institute of Remote Sensing Information Processing of Wuhan University. Besides, this research corrected the problem of mistranslation of water area into impervious surface in CLCD by using the China Land Use and Land Cover Remote Sensing Monitoring Data Set (CNLUCC) of the Geographical Conditions Monitoring Cloud Platform of the Institute of Geography of the Chinese Academy of Sciences.
2.3 Methods
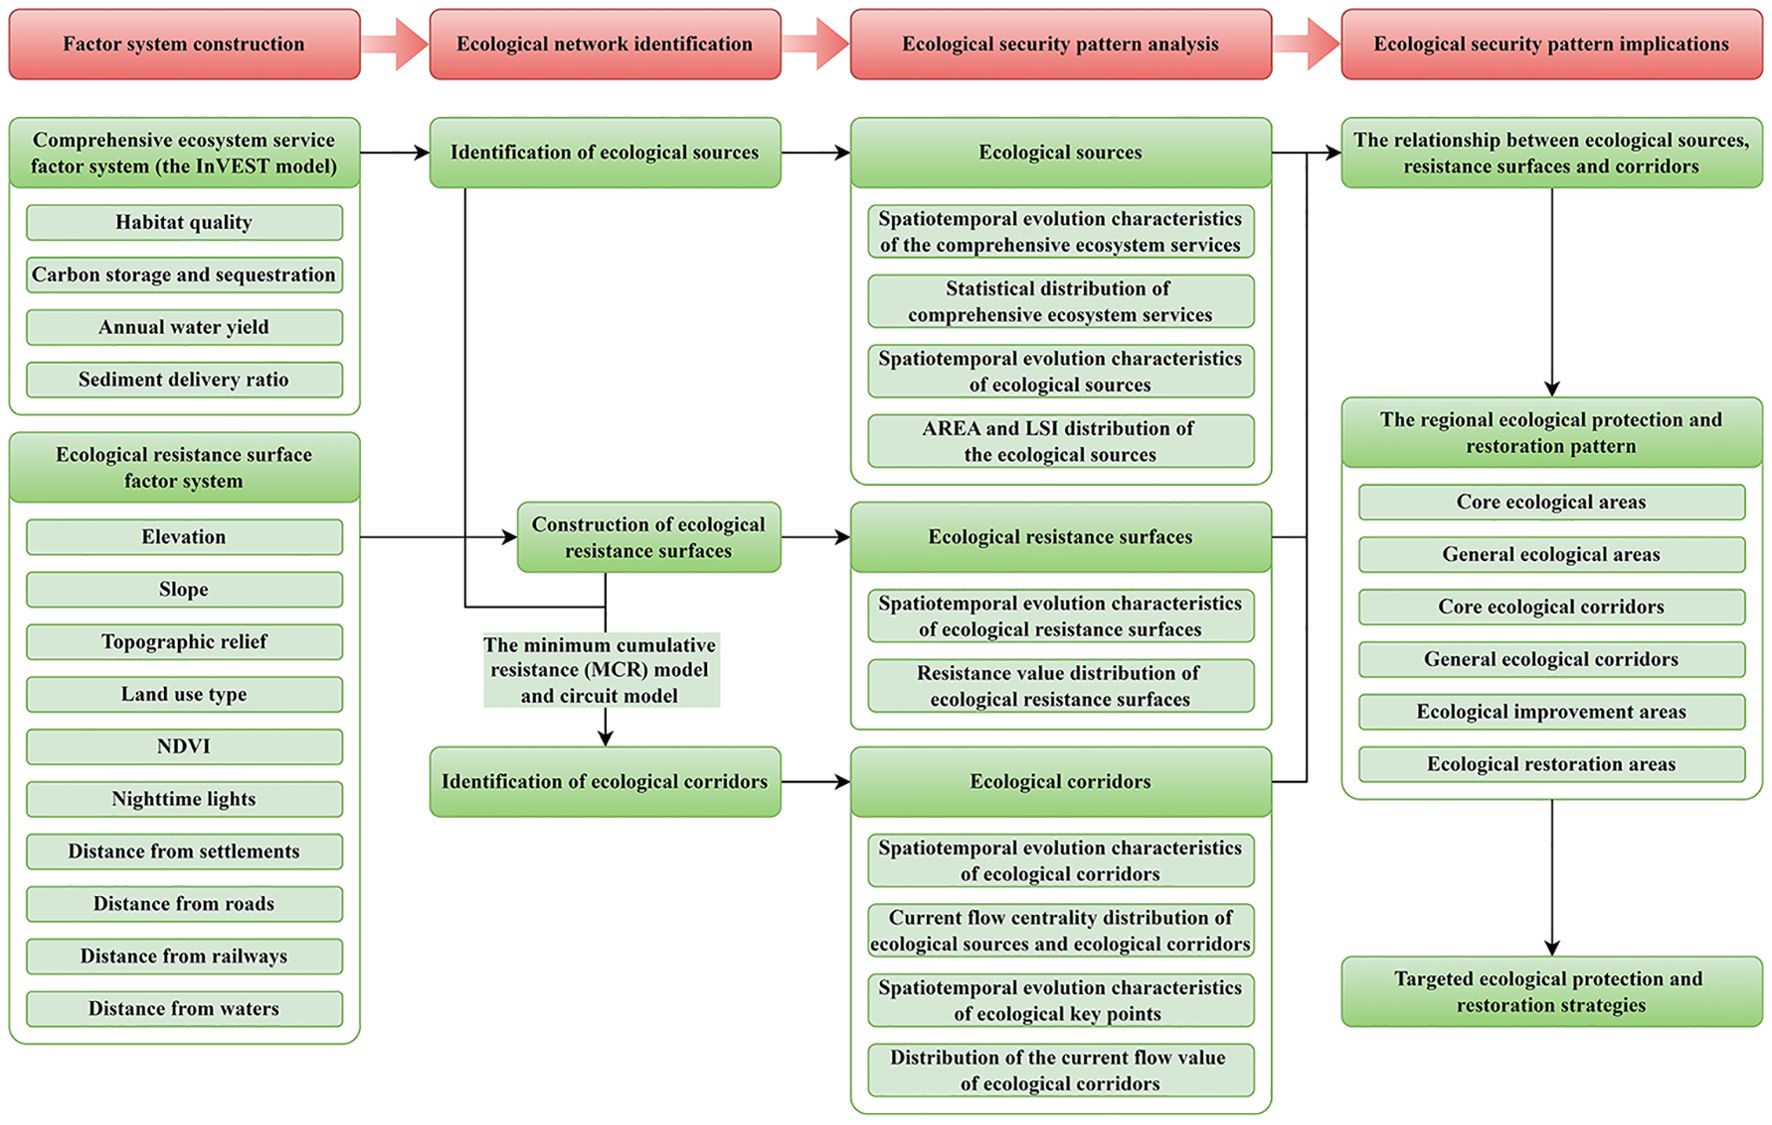
The research framework mainly includes four parts: (1) Factor system construction based on the comprehensive index method; (2) Ecological network identification based on the MCR model and the circuit model; (3) Ecological security pattern analysis based on the ecological “source–surface–corridor”; (4) Ecological security pattern implications based on the above results (Figure 2). Specifically, the comprehensive ecosystem service index system to identify the ecological sources used the InVEST (Integrated Valuation of Ecosystem Services and Tradeoffs) model. The MCR and circuit models to identify the ecological network used the Linkage Mapper software. The ecological security pattern’s spatiotemporal and quantitative evolution characteristics were based on the proposed spatiotemporal analysis framework composed of the ecological “source–surface–corridor”. The ecological security pattern implications consisted of the exploration of the relationship between the ecological sources, resistance surfaces, and corridors and the relationship’s application to regional ecological protection and restoration.
2.3.1 Identification of ecological sources
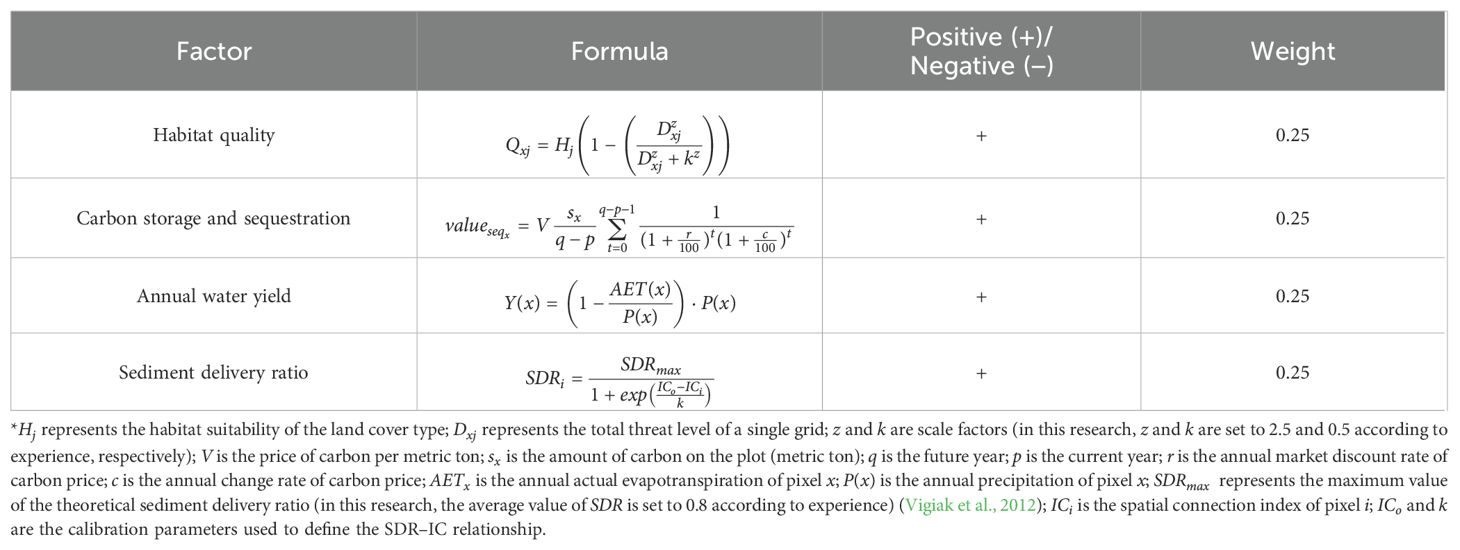
Ecological sources are not only the natural habitats of species that diffuse and maintain populations, but they are also the primary carriers for providing environmental products and ecosystem services. Researchers summarize the ecological source identification methods into two types. One method is direct identification, which selects natural protected areas such as national parks, nature reserves, natural parks, or forest land with high ecological values in land use classification as ecological sources (Peng et al., 2016; Wang et al., 2016; Yu et al., 2022). The other is indirect identification, which calculates the comprehensive value index by constructing a comprehensive evaluation index system and selecting patches with high comprehensive value as ecological sources (Vogt et al., 2007; Xu et al., 2015; Wu et al., 2017; Zhang et al., 2020). Anthropogenic boundaries will affect the direct identification method and cannot objectively and accurately reflect the changes in the scale and quality of ecological sources. Therefore, an indirect identification method is employed in this research to identify ecological sources, and the InVEST model is used in the construction of a comprehensive ecosystem service index system (Table 2) comprising four factors: habitat quality, carbon storage and sequestration, annual water yield, and soil and water conservation (Winkler et al., 2017; Bakker et al., 2019; Zhang et al., 2020; Zawadzka et al., 2021; Brasileiro et al., 2022). This research normalized the factors using the range normalization method and referred to previous studies (Su et al., 2019; Yuan et al., 2022; Zheng et al., 2024) to set equal weights for each factor. Furthermore, the composite index method is utilized to calculate the comprehensive ecosystem service index, and the patches with a high index are selected as the ecological sources. In addition, the research used Fragstats 4.2 software to analyze the landscape pattern characteristics such as AREA (Patch Area) and LSI (Landscape Shape Index) of ecological source areas.
2.3.2 Construction of ecological resistance surfaces
The key to identifying ecological corridors lies in the construction of ecological resistance surfaces. The MCR model and the circuit model need to scientifically construct the ecological resistance surfaces (Peng et al., 2018; Wang et al., 2019; Dai et al., 2021; Pan and Wang, 2021). An ecological resistance surface factor system comprising natural factors (such as elevation, slope, topographic relief, land use type, and NDVI) and human factors (such as distance from residential areas, highways, railways, water bodies, and nighttime lights) is established in this research (Table 3) (Wang et al., 2019; Zhu et al., 2020; Yao et al., 2022b; Liu et al., 2023; Li et al., 2024). Referring to relevant research, the values of each factor are graded and assigned, and the factor weight is then determined based on previous research and expert opinions (Liang and Zhao, 2020; Liu et al., 2021; Du et al., 2022; Zhang et al., 2023a). Finally, the ecological resistance surface is constructed using the comprehensive index method.
2.3.3 Identification of ecological corridors
The Linkage Mapper software developed by B. McRae et al. is adopted in this research to identify and analyze the ecological network (McRae et al., 2008; Mcrae and Shah, 2009). First, the ecological corridors are identified using the Build Network and Map Linkages tool. Among them, referring to the characteristics of existing research and research areas, the cost-weighted truncation distance for identifying the ecological corridors was set at 20 km (McRae and Kavanagh., 2011; Wu et al., 2024). Second, the ecological pinch and barrier points are determined using Pinchpoint and Barrier Mapper tools. Among them, the ecological pinch points are areas with high current flow density in the circuit model, generally located in ecological corridors. The ecological pinch points are also high-frequency areas for biological circulation and essential for regional ecosystem connectivity. However, the ecological pinch points may encounter high ecological degradation risks, and the ecological resistance values surrounding the ecological pinch points are frequently large. Therefore, the ecological pinch points should be critical areas for ecological protection (Mao et al., 2020). Meanwhile, the ecological barrier points can reduce ecological resistance and substantially improve ecosystem connectivity between ecological sources after restoration (Huang et al., 2020). Therefore, the ecological barrier points should be priority areas for ecological restoration. Specifically, the “all to one” and “maximum” modes are adopted when identifying ecological pinch and barrier points, respectively. The minimum search, maximum search, and growth radii are set to 500, 2000, and 500 m (McRae, 2012; Zhang, 2021b; Zhang et al., 2023b), respectively. Recognition results are divided into five levels, and the highest levels are the ecological pinch points and the ecological barrier points. In addition, the current flow centrality of ecological sources and corridors is investigated by adopting the Centrality Mapper tool to measure the importance of ecological sources or corridors to maintain the connection of the whole network.
3 Results
3.1 Ecological sources
The overall characteristics of the spatial distribution of comprehensive ecosystem services in the study area (Figure 3) indicate that the high-value areas are mainly concentrated in Funiu, Daba, Tongbai, and Dahong Mountains. Among these areas, the extremely high-value areas with a composite score of more than 80 are primarily distributed in the core areas of Daba Mountain in the Southwest and Tongbai and Dahong Mountains in the southeast. The extremely low-value areas are mainly distributed in urban and other population-gathering areas. The change characteristics of spatial distribution from 2000 to 2010 reveal that the comprehensive ecosystem services in the study area displayed an overall decline trend, especially in the eastern Tongbai Mountain areas, revealing a considerable decline. Only the northwest Funiu Mountain areas demonstrated a slight increase. From 2010 to 2020, the comprehensive ecosystem services in the study area showed an overall trend of increase in the southeast and decline in the northwest. Specifically, the comprehensive ecosystem services in the southeast Dahong and Tongbai Mountain areas substantially increased, while those in the northwest Funiu Mountain area declined. Finally, from 2000 to 2020, the comprehensive ecosystem services in the northwest Funiu Mountain areas declined, while those in the Daba, Tongbai, and Dahong Mountain areas in the southeast substantially increased.
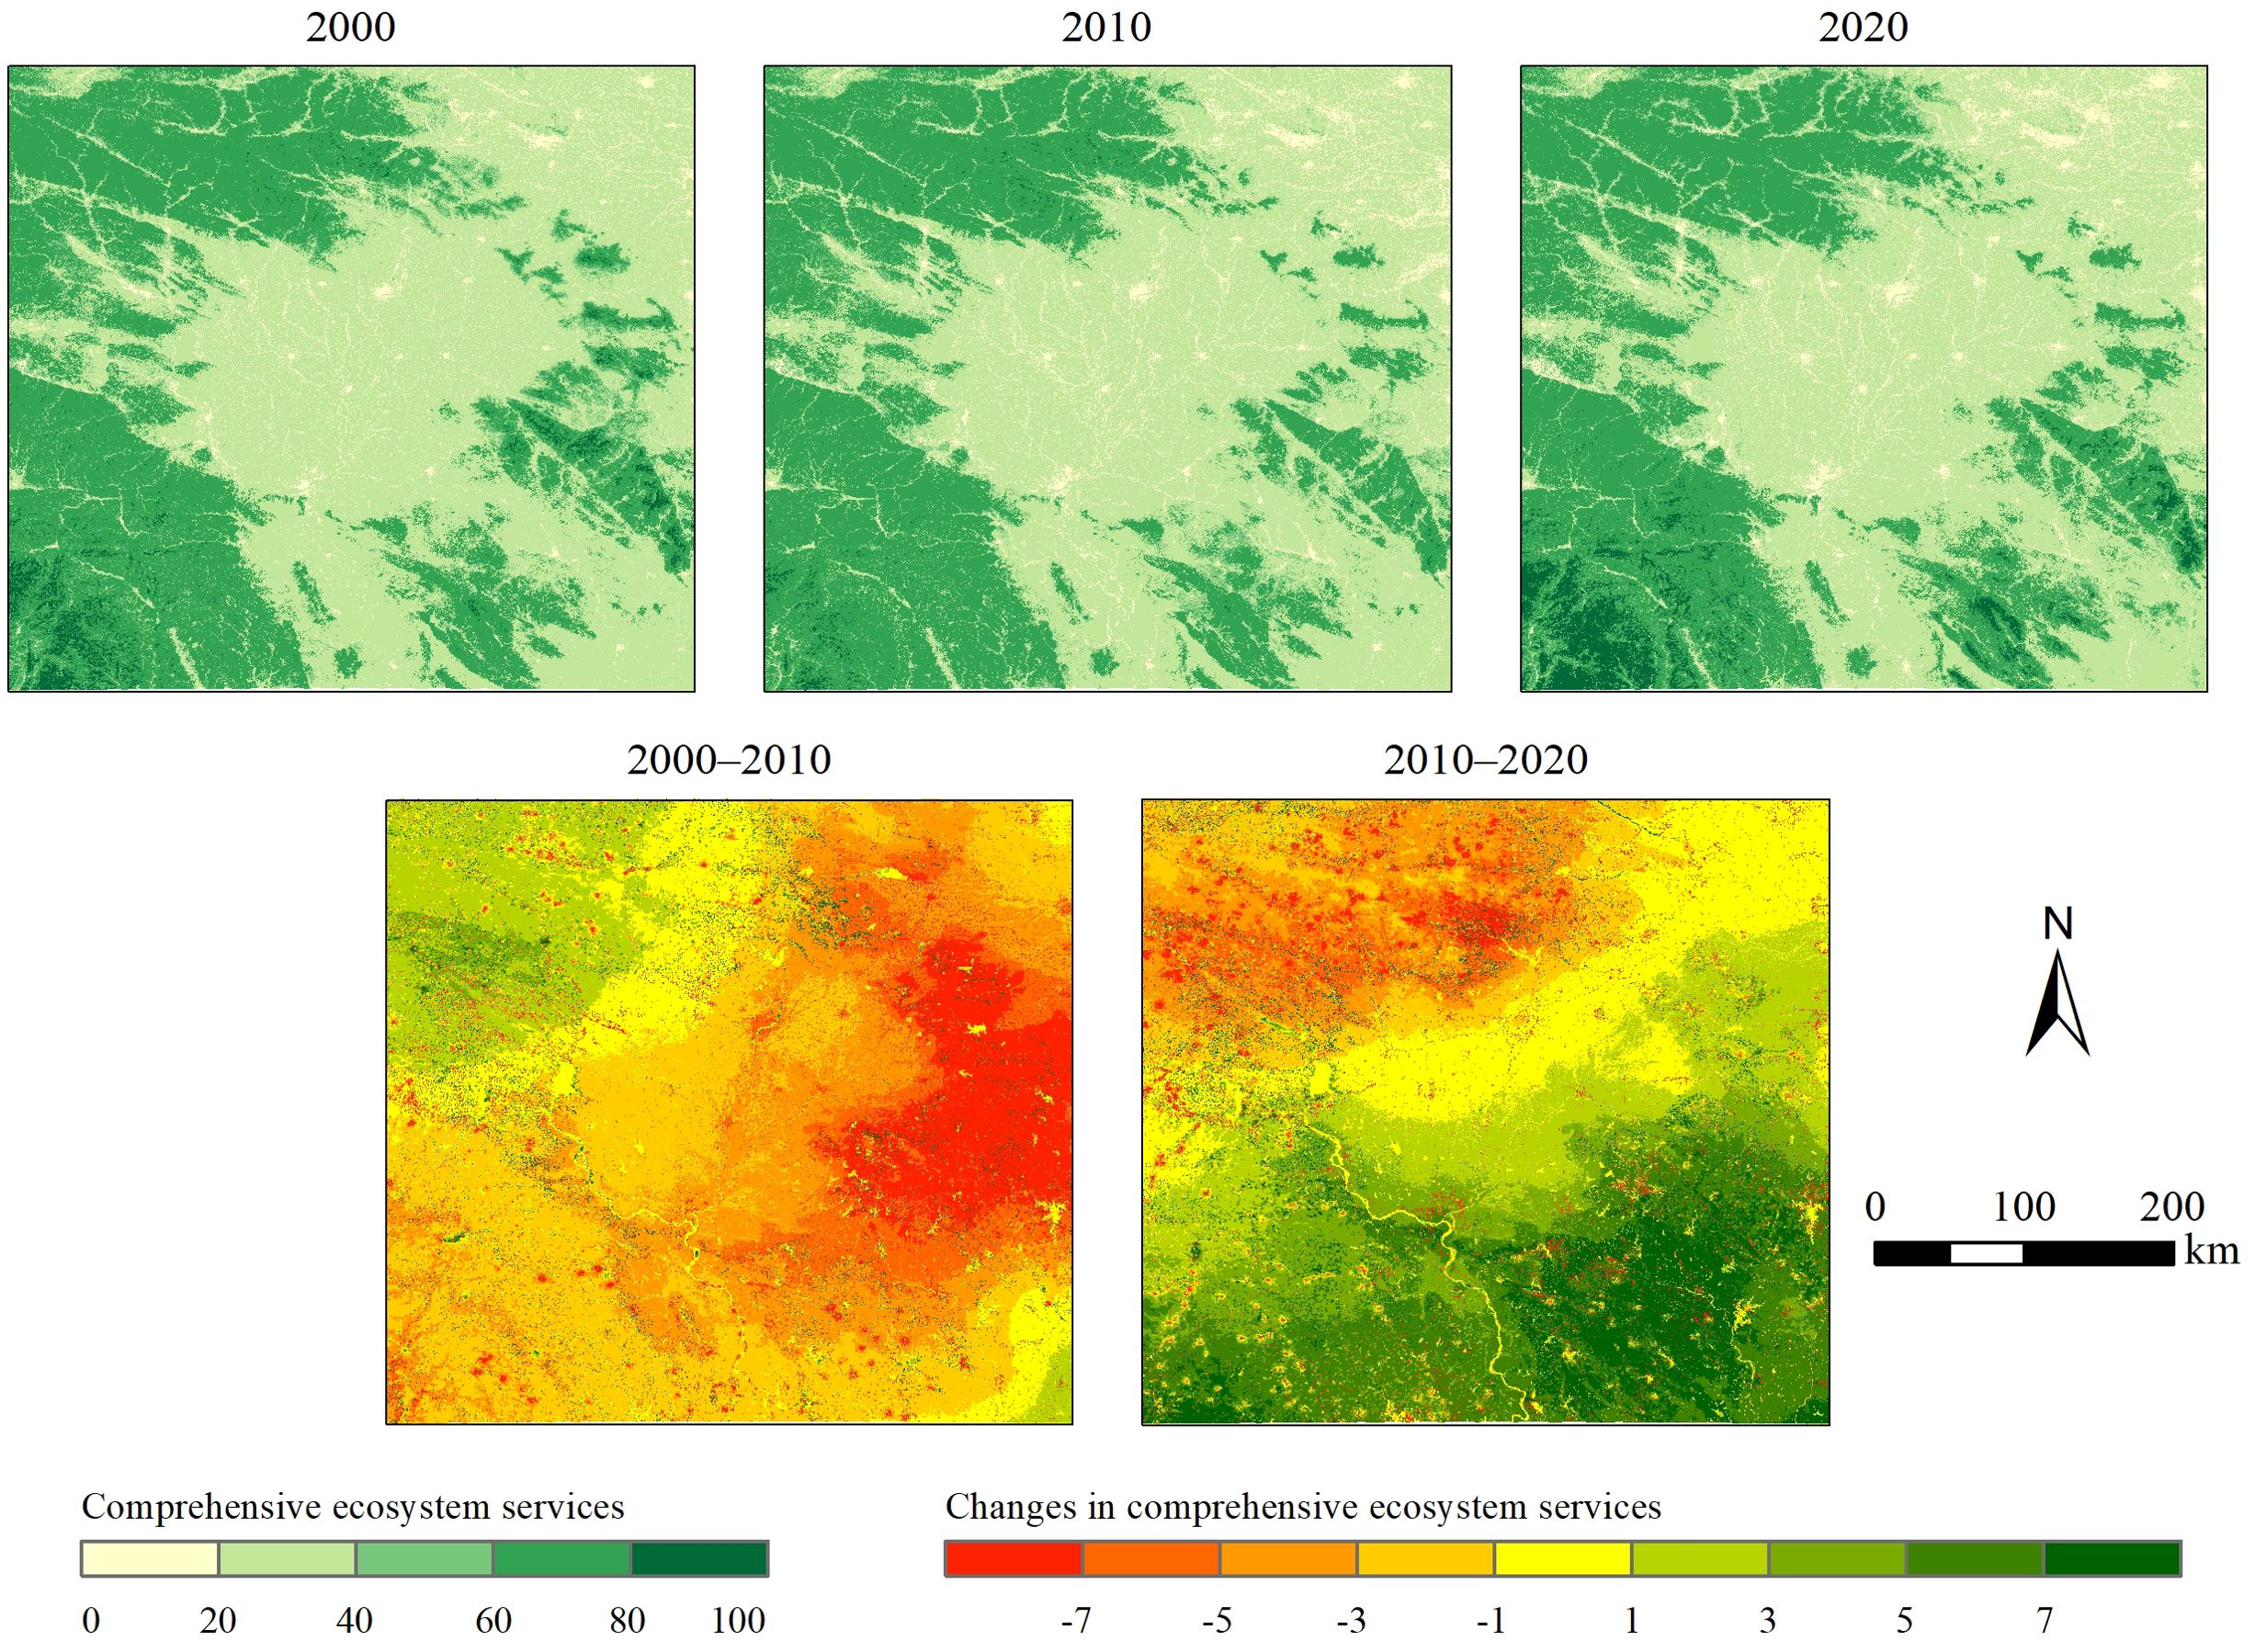
Figure 3. Spatiotemporal evolution characteristics of the comprehensive ecosystem services in the Qinba–Dabie intersection zone in China from 2000 to 2020.
Based on the overall characteristics of the statistical distribution of comprehensive ecosystem services in the study area (Figure 4), the histogram shows 0–20, 20–40, and 60–80 to form a “three-peak” distribution, corresponding to urban space, agricultural space, and ecological space, respectively. Specifically, the urban space parts of 0–20 display a slow left-skewed distribution in 2000 and a peak right-skewed distribution in 2010 and 2020, indicating a declining trend in the comprehensive ecosystem services of urban space. The agricultural space parts of 20–40 in 2000 and 2020 are relatively consistent, while the distribution in 2010 is right-skewed relative to the two. This finding reveals a trend of an initial decline and then an increase in the comprehensive ecosystem services of the agricultural space. In the ecological space parts of 60–80, the distribution of the three years is relatively consistent, generally indicating the stability of the comprehensive ecosystem services. However, a careful comparison shows an increase in the low-value part of 2010 and 2020 relative to 2000 and a decrease in the median part of 2020 relative to 2000 and 2010. Meanwhile, the high-value part declined in 2010 and substantially increased in 2020. Finally, the comprehensive ecosystem services of the study demonstrated an overall trend of first declining and then increasing according to the mean and median.
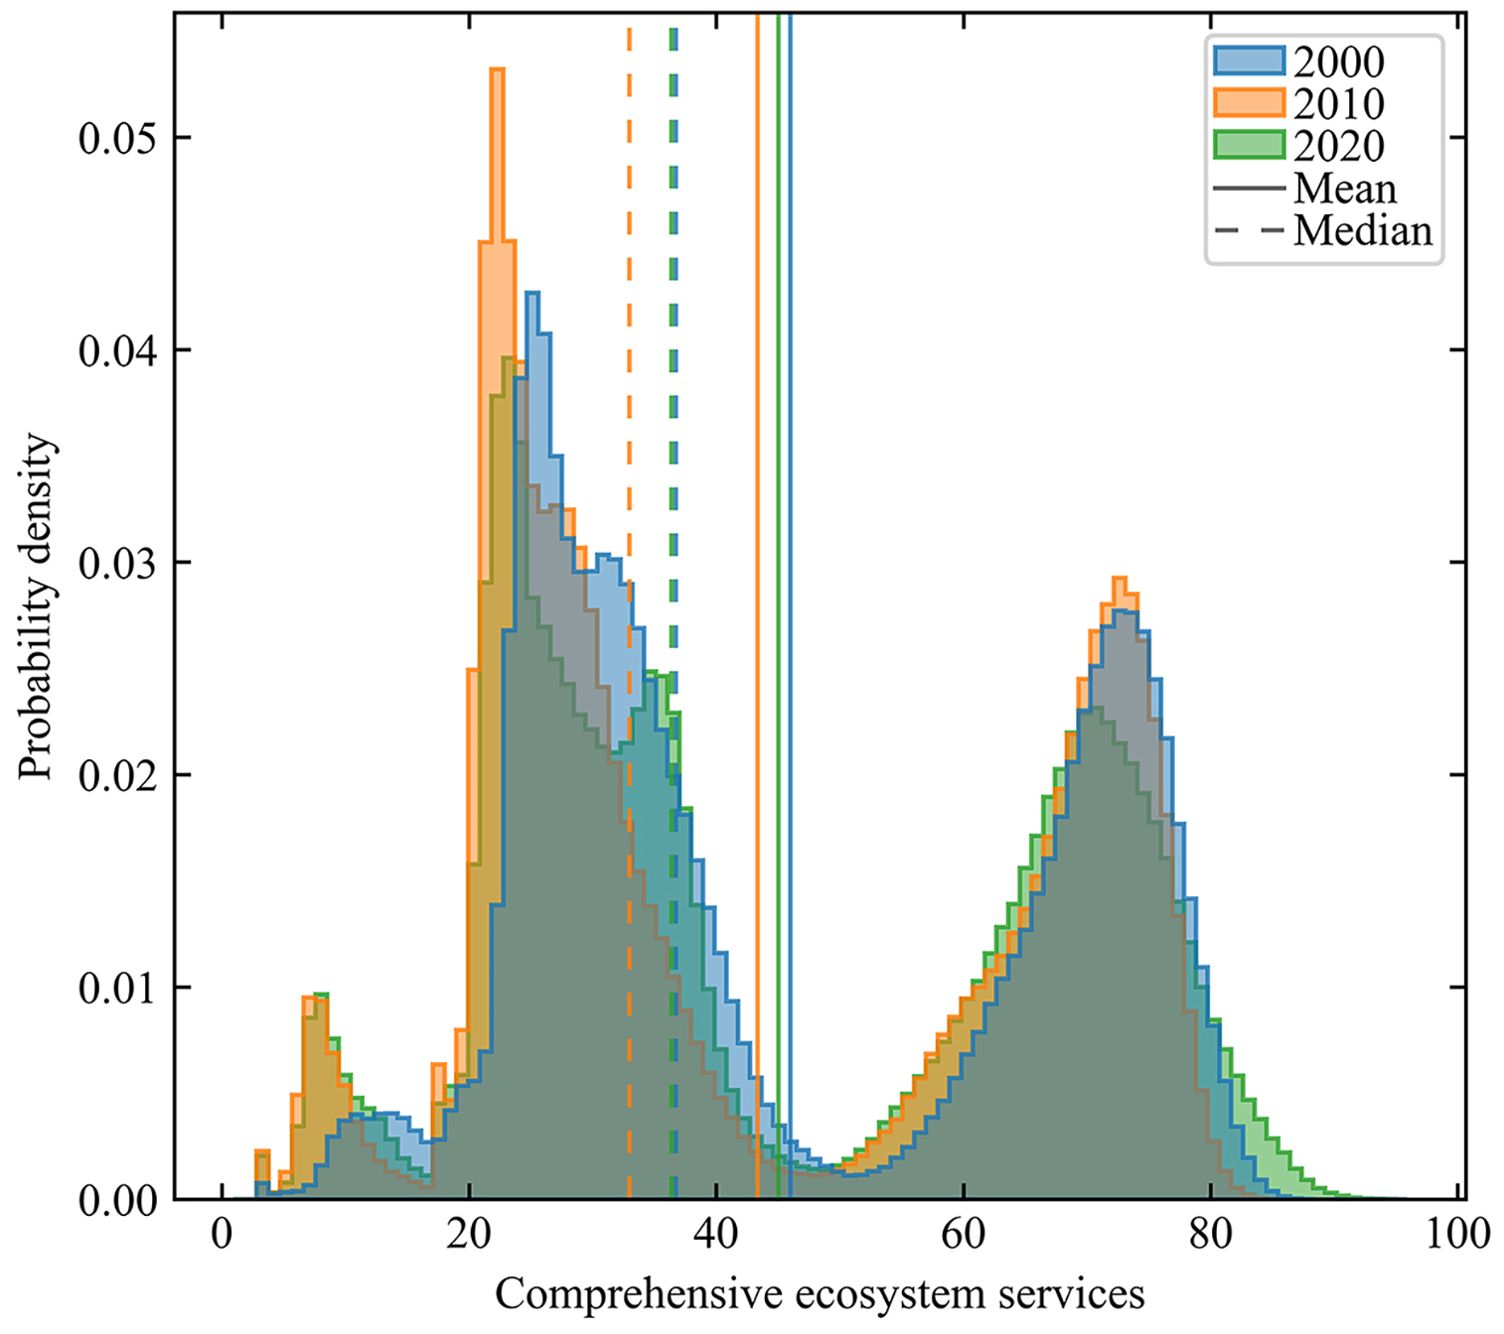
Figure 4. Statistical distribution of comprehensive ecosystem services in the Qinba–Dabie intersection zone in China from 2000 to 2020.
Based on the evaluation results of comprehensive ecosystem services, this research identified ecological source patches by initially using the 70% quantiles of all values in the study area in 2000, 2010, and 2020 as thresholds. In addition, the final ecological sources were determined after removing patches with an area of less than 10 km2 (Figure 5). In the three different years, 61, 60, and 60 ecological source patches were identified, accounting for 33.14%, 32.06%, and 32.43% of the total area of the study area, respectively. The overall spatial distribution characteristics were consistent with the evaluation results of the comprehensive ecosystem service. The largest of the ecological source patches is located in southwest Daba Mountain, followed by northwest Funiu, southeast Tongbai, and Dahong Mountains. The spatial variation and distribution characteristics were also consistent with the evaluation results of the comprehensive ecosystem service. The area of ecological source patches in southwest Daba Mountain and in southeast Tongbai and Dahong Mountains decreased first and then increased, while that in the northwest Funiu Mountain increased first and then decreased.
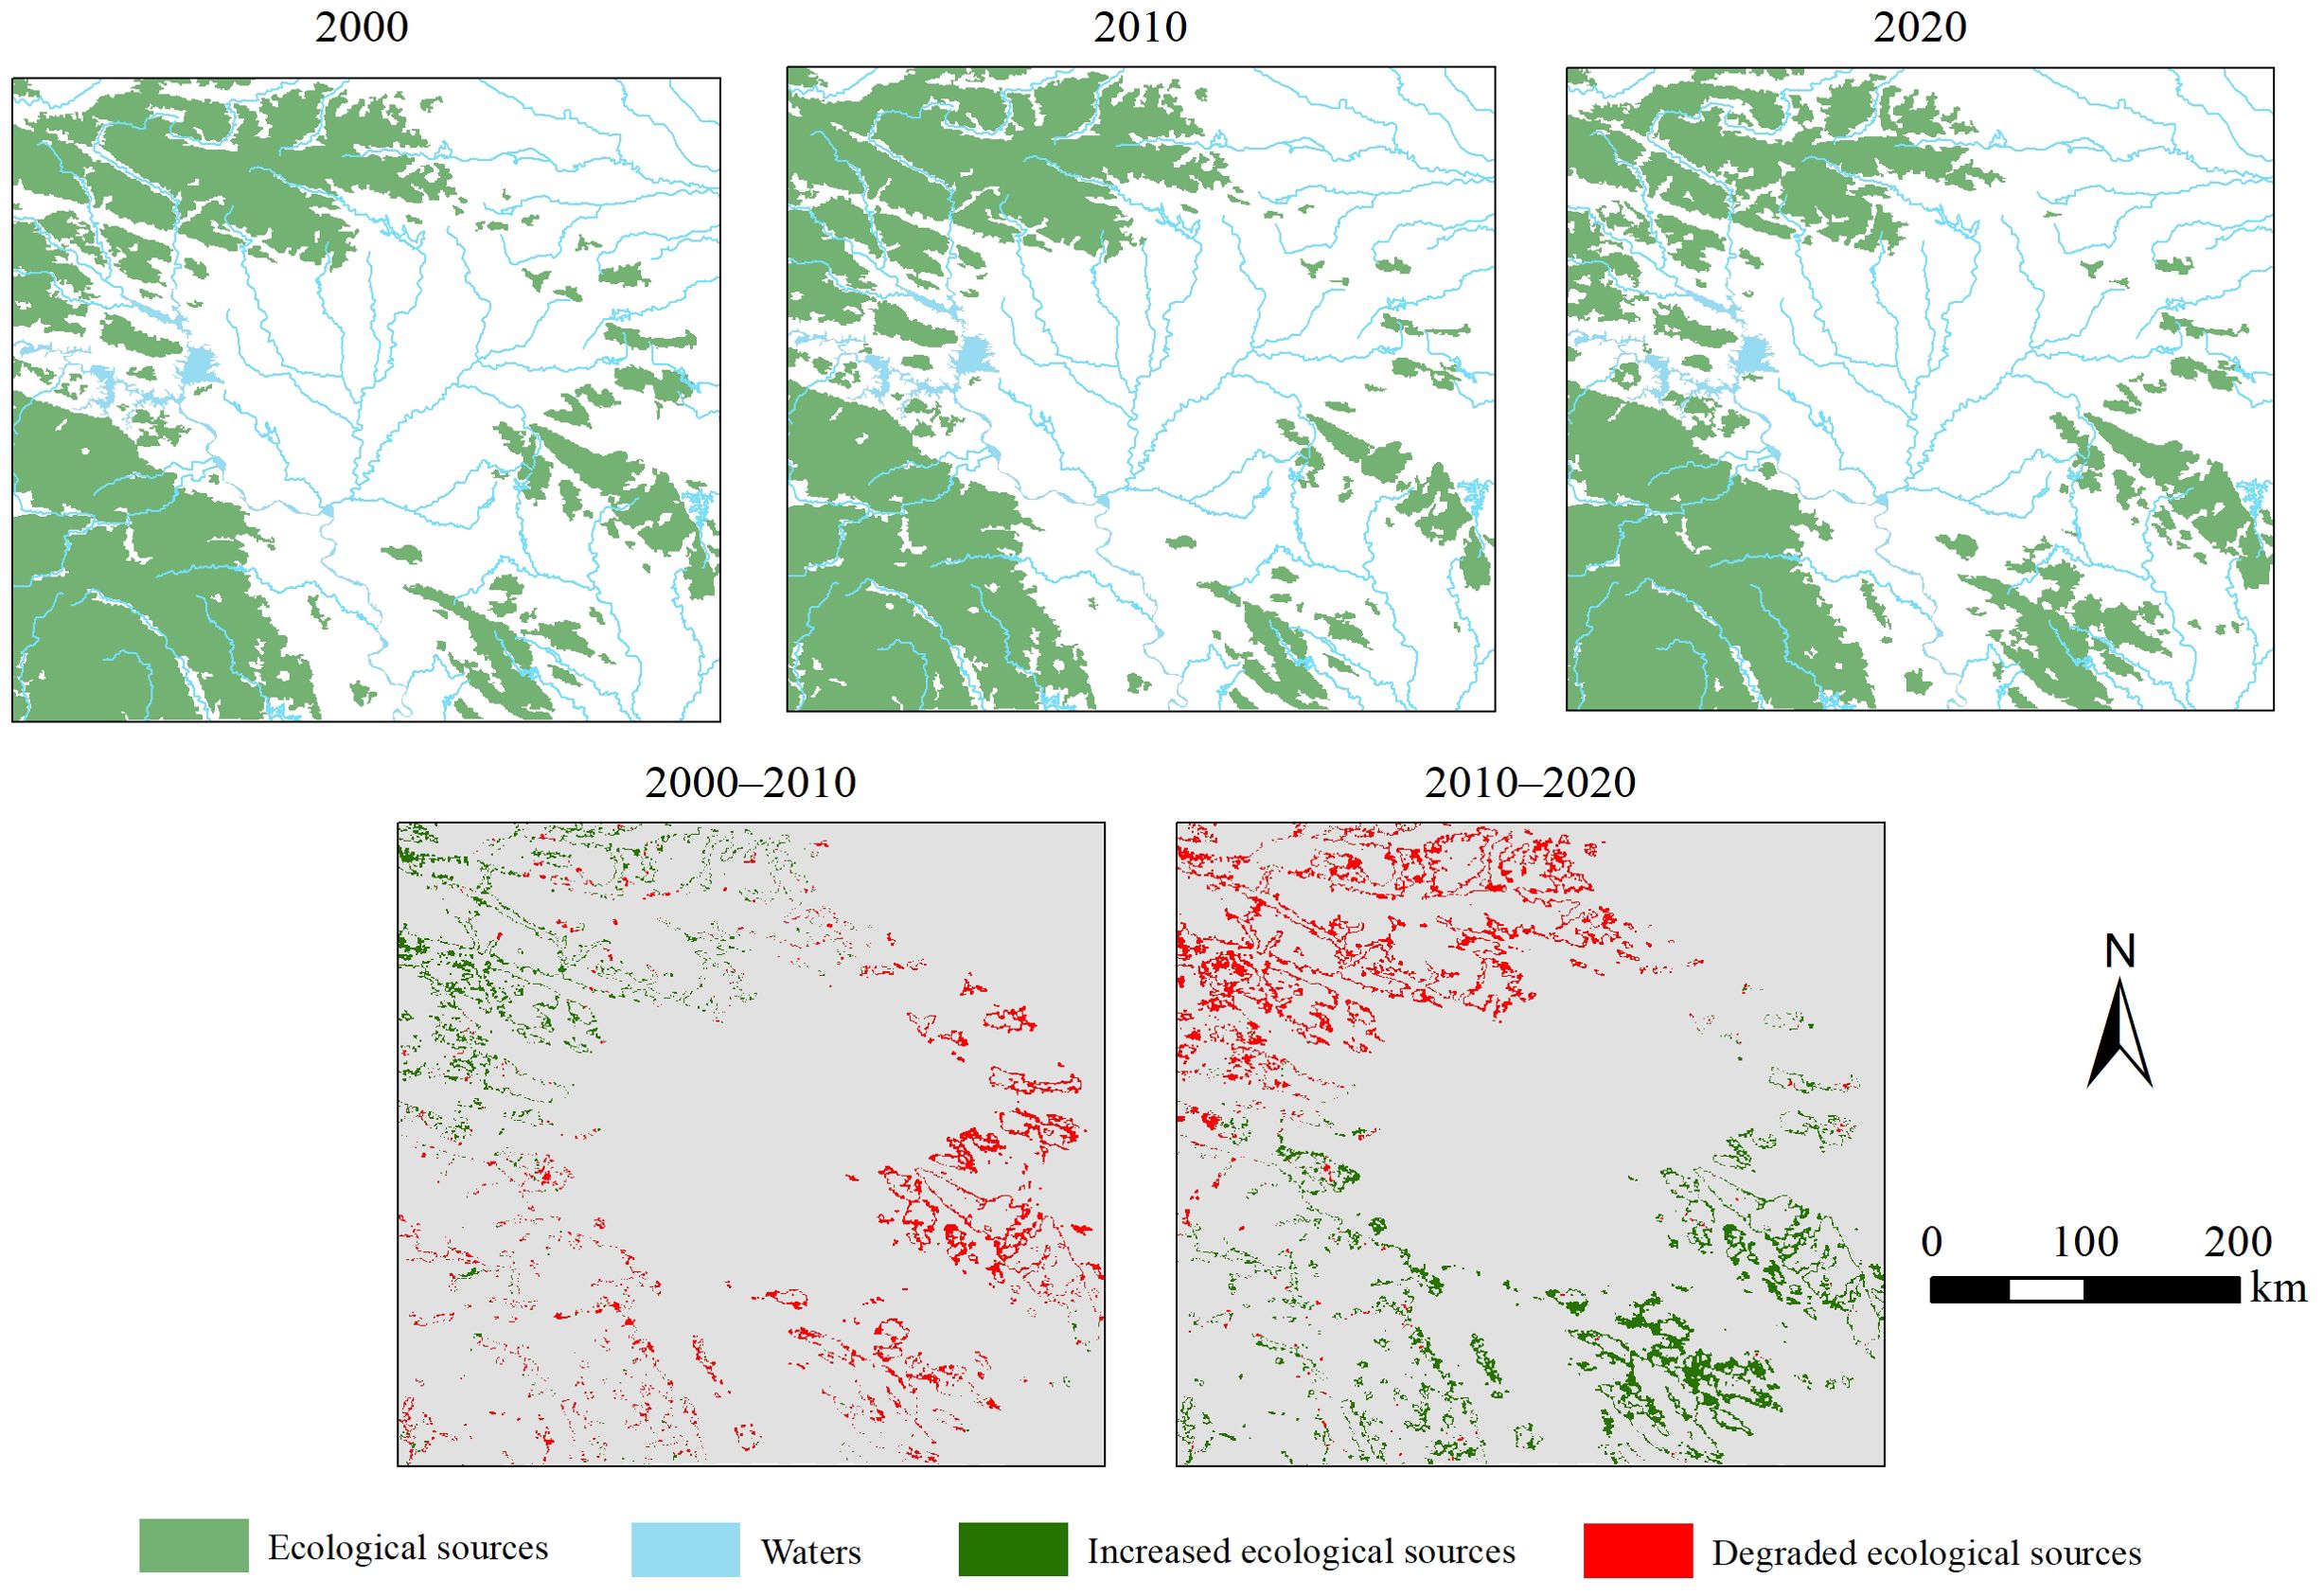
Figure 5. Spatiotemporal evolution characteristics of ecological sources in the Qinba–Dabie intersection zone in China from 2000 to 2020.
Furthermore, the landscape pattern characteristics of ecological source patches are analyzed using AREA and LSI. Figure 6 shows that the statistical distribution characteristics of the two indexes in 2000, 2010, and 2020 mostly remained the same. Specifically, the medians of the AREA in the three years were 38.38, 50.69, and 46.06 km2, respectively, while the quartile differences were 117.81, 80.50, and 124.92 km2, respectively. Overall, the AREA increased first and then decreased, and the difference in AREA among the three years decreased first and then increased. However, the AREA and its difference increased in the past 20 years. A large patch area can effectively support high-trophic organisms and enhance species diversity, and the differentiation patch area can provide habitats for species with various habitat scales. Therefore, the AREA of ecological sources has generally evolved in a benign direction. The medians of LSI in the three years were 1.80, 1.73, and 1.78, while the quartiles were 0.71, 0.44, and 0.73, respectively. The patch shape complexity and its difference decreased first and then increased. However, the overall situation was relatively stable, revealing minimal effects on ecological sources.
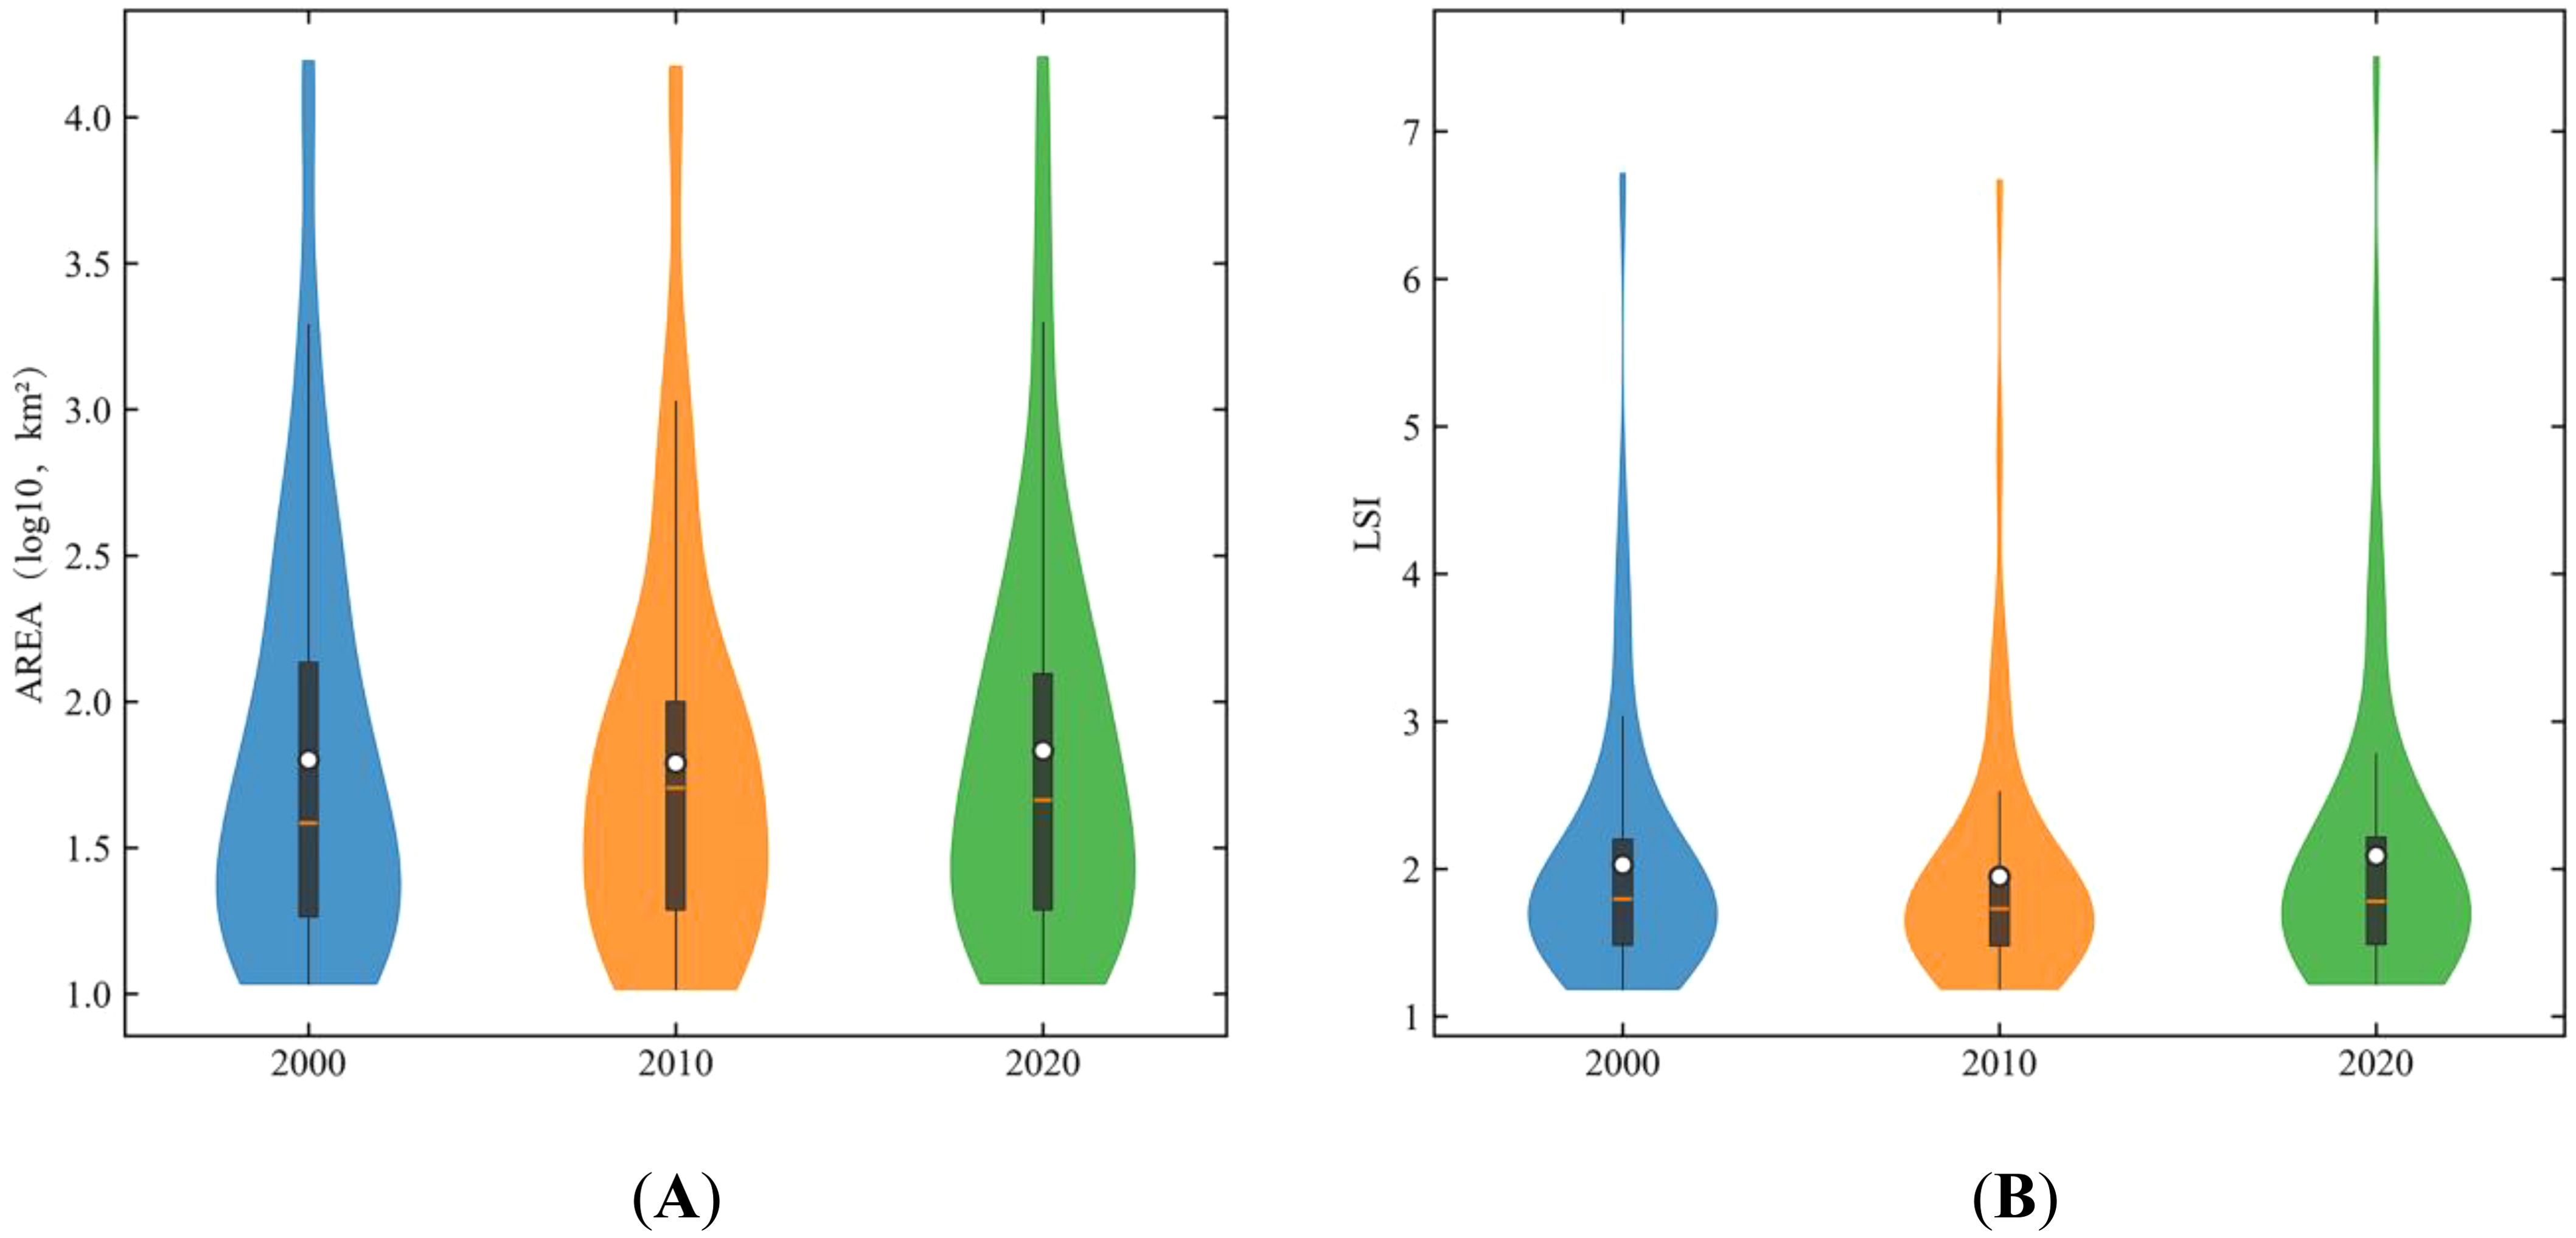
Figure 6. AREA and LSI distribution of the ecological sources in the Qinba–Dabie intersection zone in China from 2000 to 2020: (A) AREA distribution of ecological sources; (B) LSI distribution of ecological sources.
3.2 Ecological resistance surfaces
The overall spatial distribution characteristics of the ecological resistance surface in the study area (Figure 7) indicate that the high-value areas were mainly distributed around the urban settlements and the traffic arteries connecting the settlements. By contrast, the low resistance value areas were primarily distributed in the southeastern Dahong and Tongbai Mountain areas, and most areas in the study area showed medium resistance values. From the perspective of spatial distribution characteristics from 2000 to 2020 (Figure 7), the areas with substantially increased resistance values were mainly distributed around newly added urban settlements and traffic arteries, while the decreased areas had different characteristics in various periods. Specifically, from 2000 to 2010, most of the regional resistance values only demonstrated minimal changes. The areas with decreased resistance values were scattered in the flat agricultural space in the central region, and some areas in the northeast displayed a decreasing trend. From 2010 to 2020, only the resistance values in the southwestern Daba Mountains were relatively stable; the western region demonstrated a decreasing trend, while the central and eastern areas showed an increased trend. Finally, from 2000 to 2020, the high- and medium-value areas of the ecological resistance surface in the study area markedly increased, while the low-value areas were mainly scattered and distributed in the surrounding areas of Dahong Mountain in the southeast.
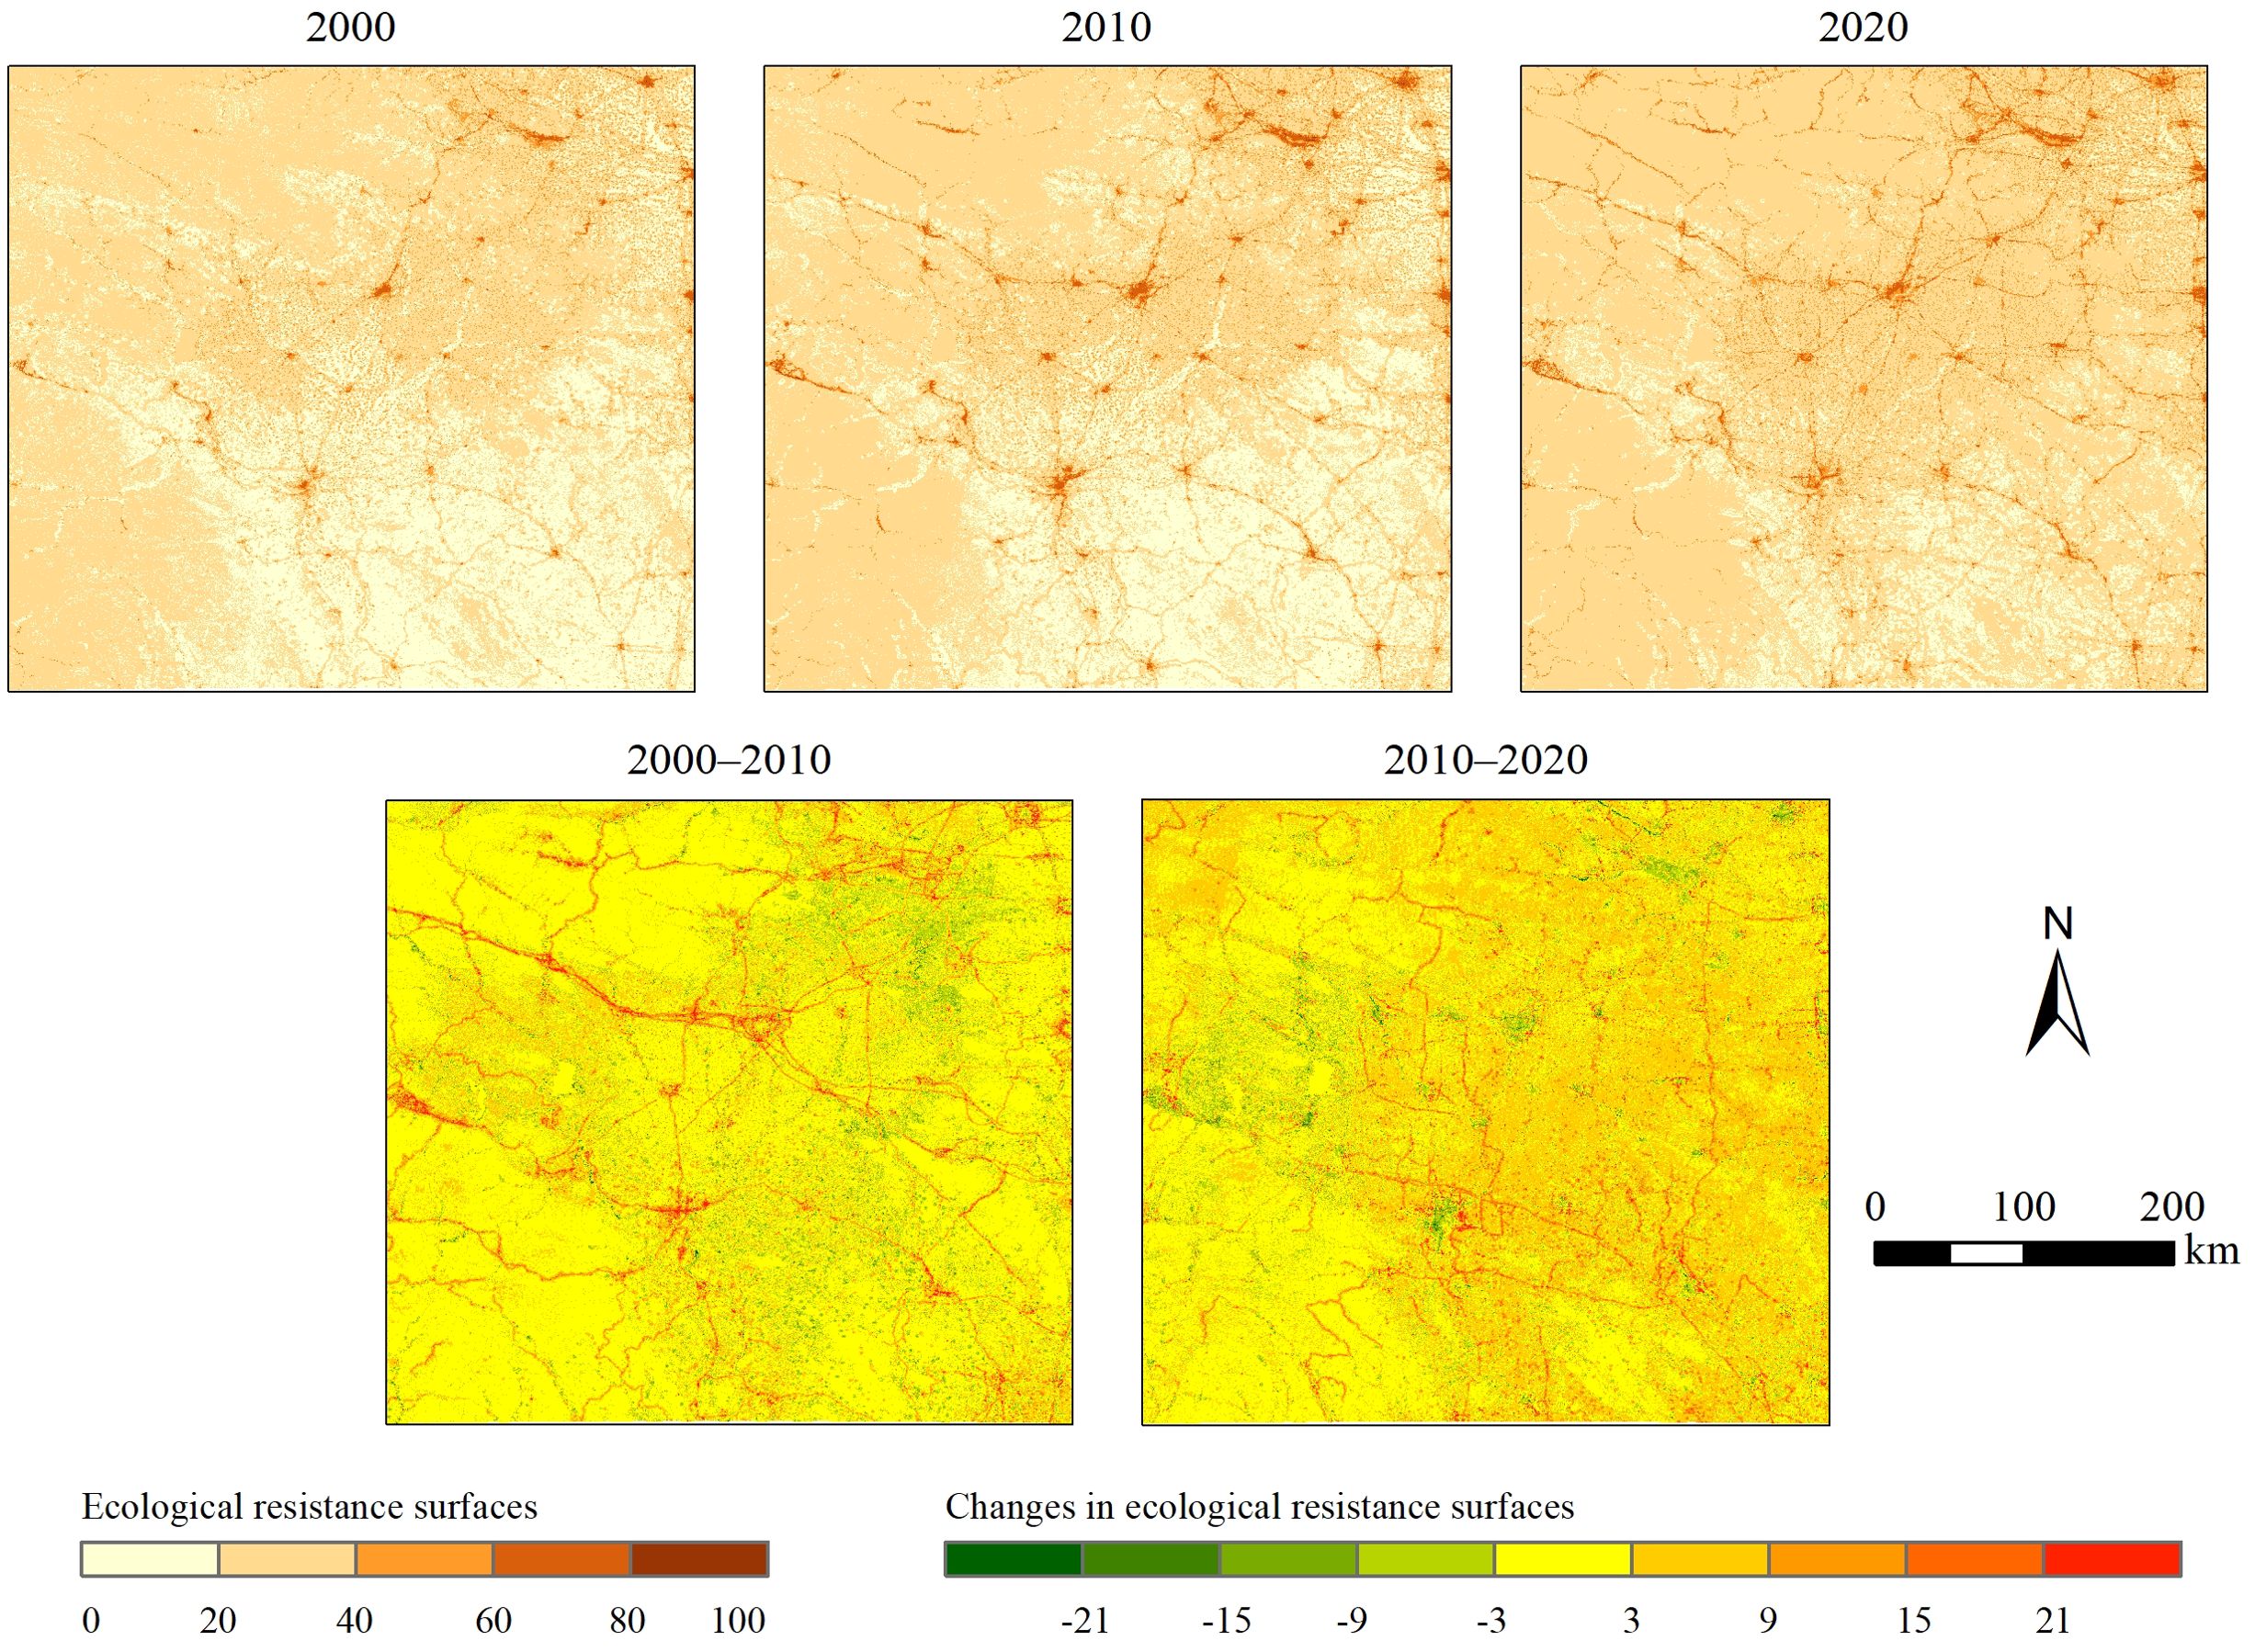
Figure 7. Spatiotemporal evolution characteristics of ecological resistance surfaces in the Qinba–Dabie intersection zone in China from 2000 to 2020.
Based on the overall statistical distribution characteristics of the ecological resistance value in the study area (Figure 8), the resistance values for the years 2000, 2010, and 2020 are all approximately normally distributed. The distributions generally display a gradual movement trend from left to right, revealing mean values of 22.58, 24.21, and 27.63. This phenomenon indicates the overall gradual increase in ecological resistance values, especially from 2010 to 2020. The ecosystem connectivity between the ecological sources in the study area will be affected by the growth of ecological resistance values.
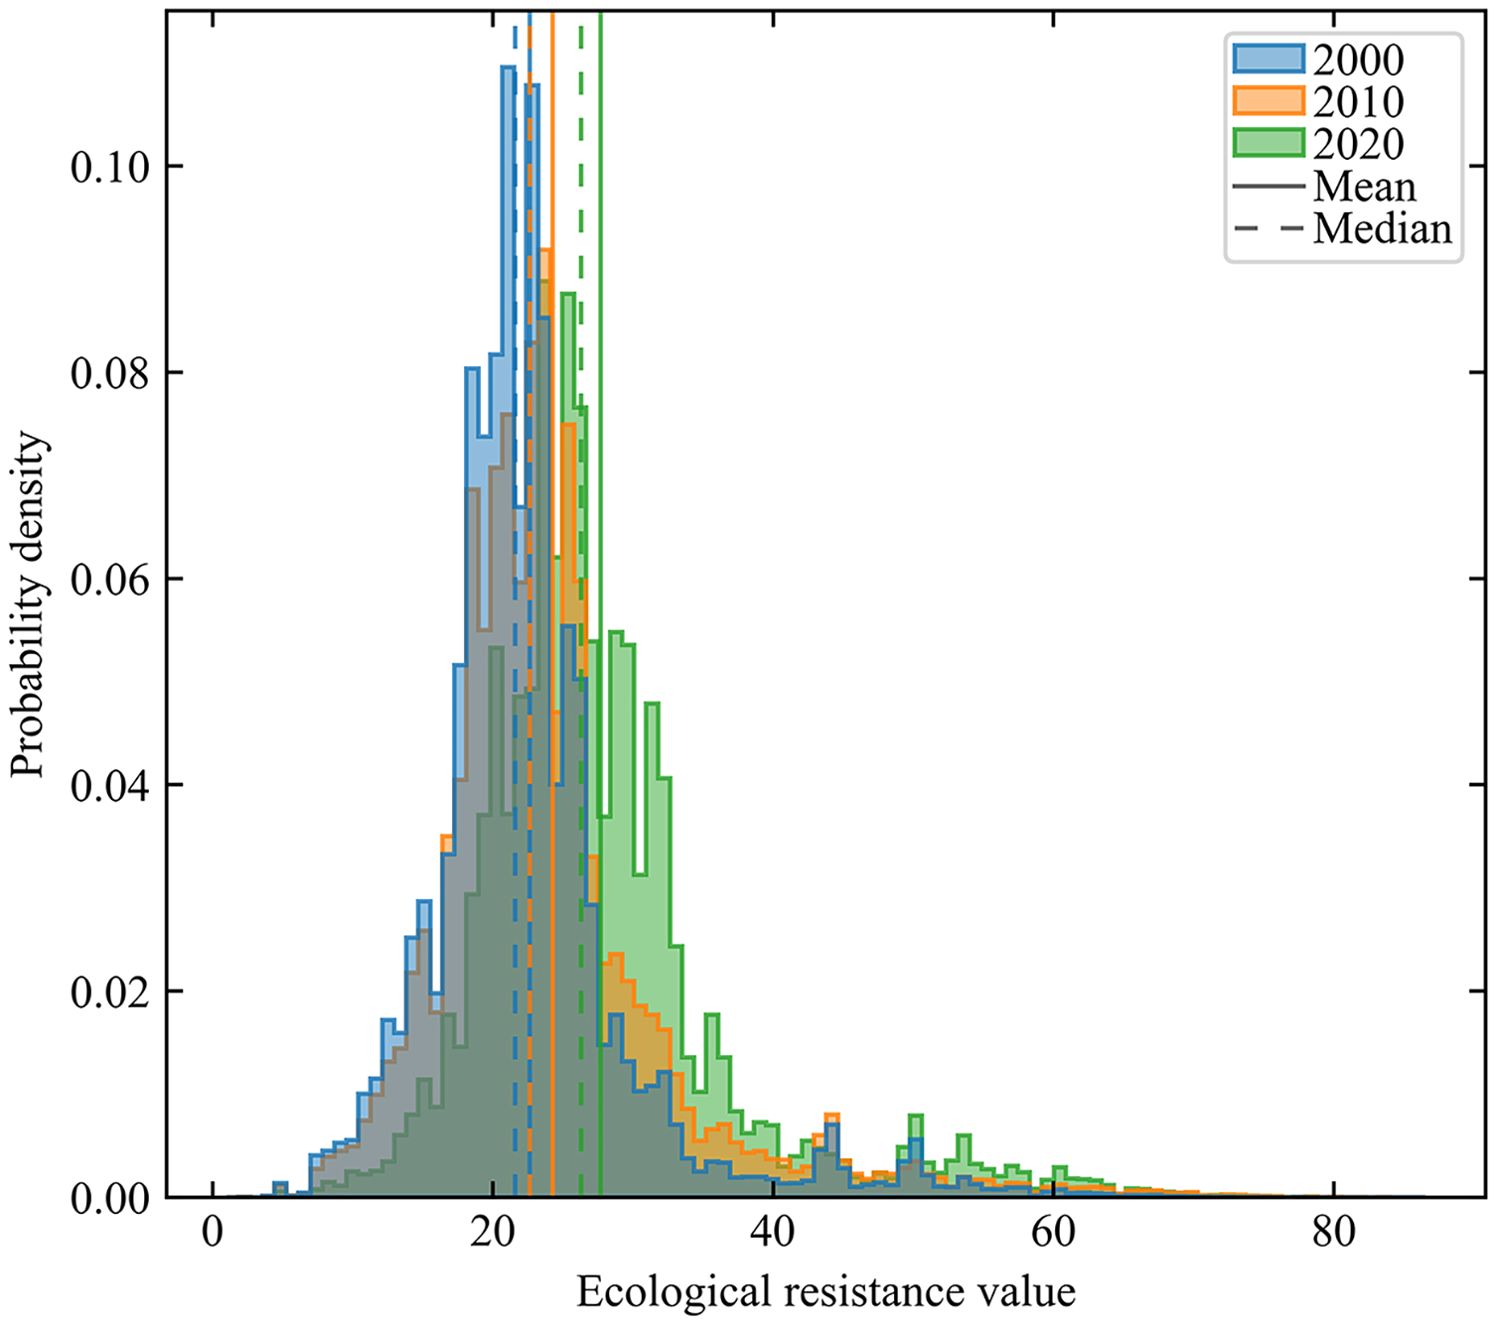
Figure 8. Resistance value distribution of ecological resistance surfaces in the Qinba–Dabie intersection zone in China from 2000 to 2020.
3.3 Ecological corridors
This research used the Build Network and Map Linkages tool in Linkage Mapper software to identify ecological corridors in the study area (Figure 9). The research identified 152, 154, and 137 ecological corridors in 2000, 2010, and 2020, respectively, while the total area was 15,819.31, 16,512.50, and 10,756.50 km2, respectively. The average length was 23.27, 26.52 and 20.99 km. Figure 9 indicates a decrease in the number and area of ecological corridors in 2020. The width of the ecological corridors in 2020 also considerably narrowed due to the overall growth of the resistance values around the ecological corridors. From the perspective of spatial distribution characteristics, the ecological corridors in the study area connect the Daba Mountain in the southwest, the Funiu Mountain in the northwest, the Tongbai Mountain in the southeast, and the Dahong Mountain, finally demonstrating a circular distribution. Among them, the reduced ecological corridors from 2010 to 2020 were mainly distributed in the northeastern plain area.
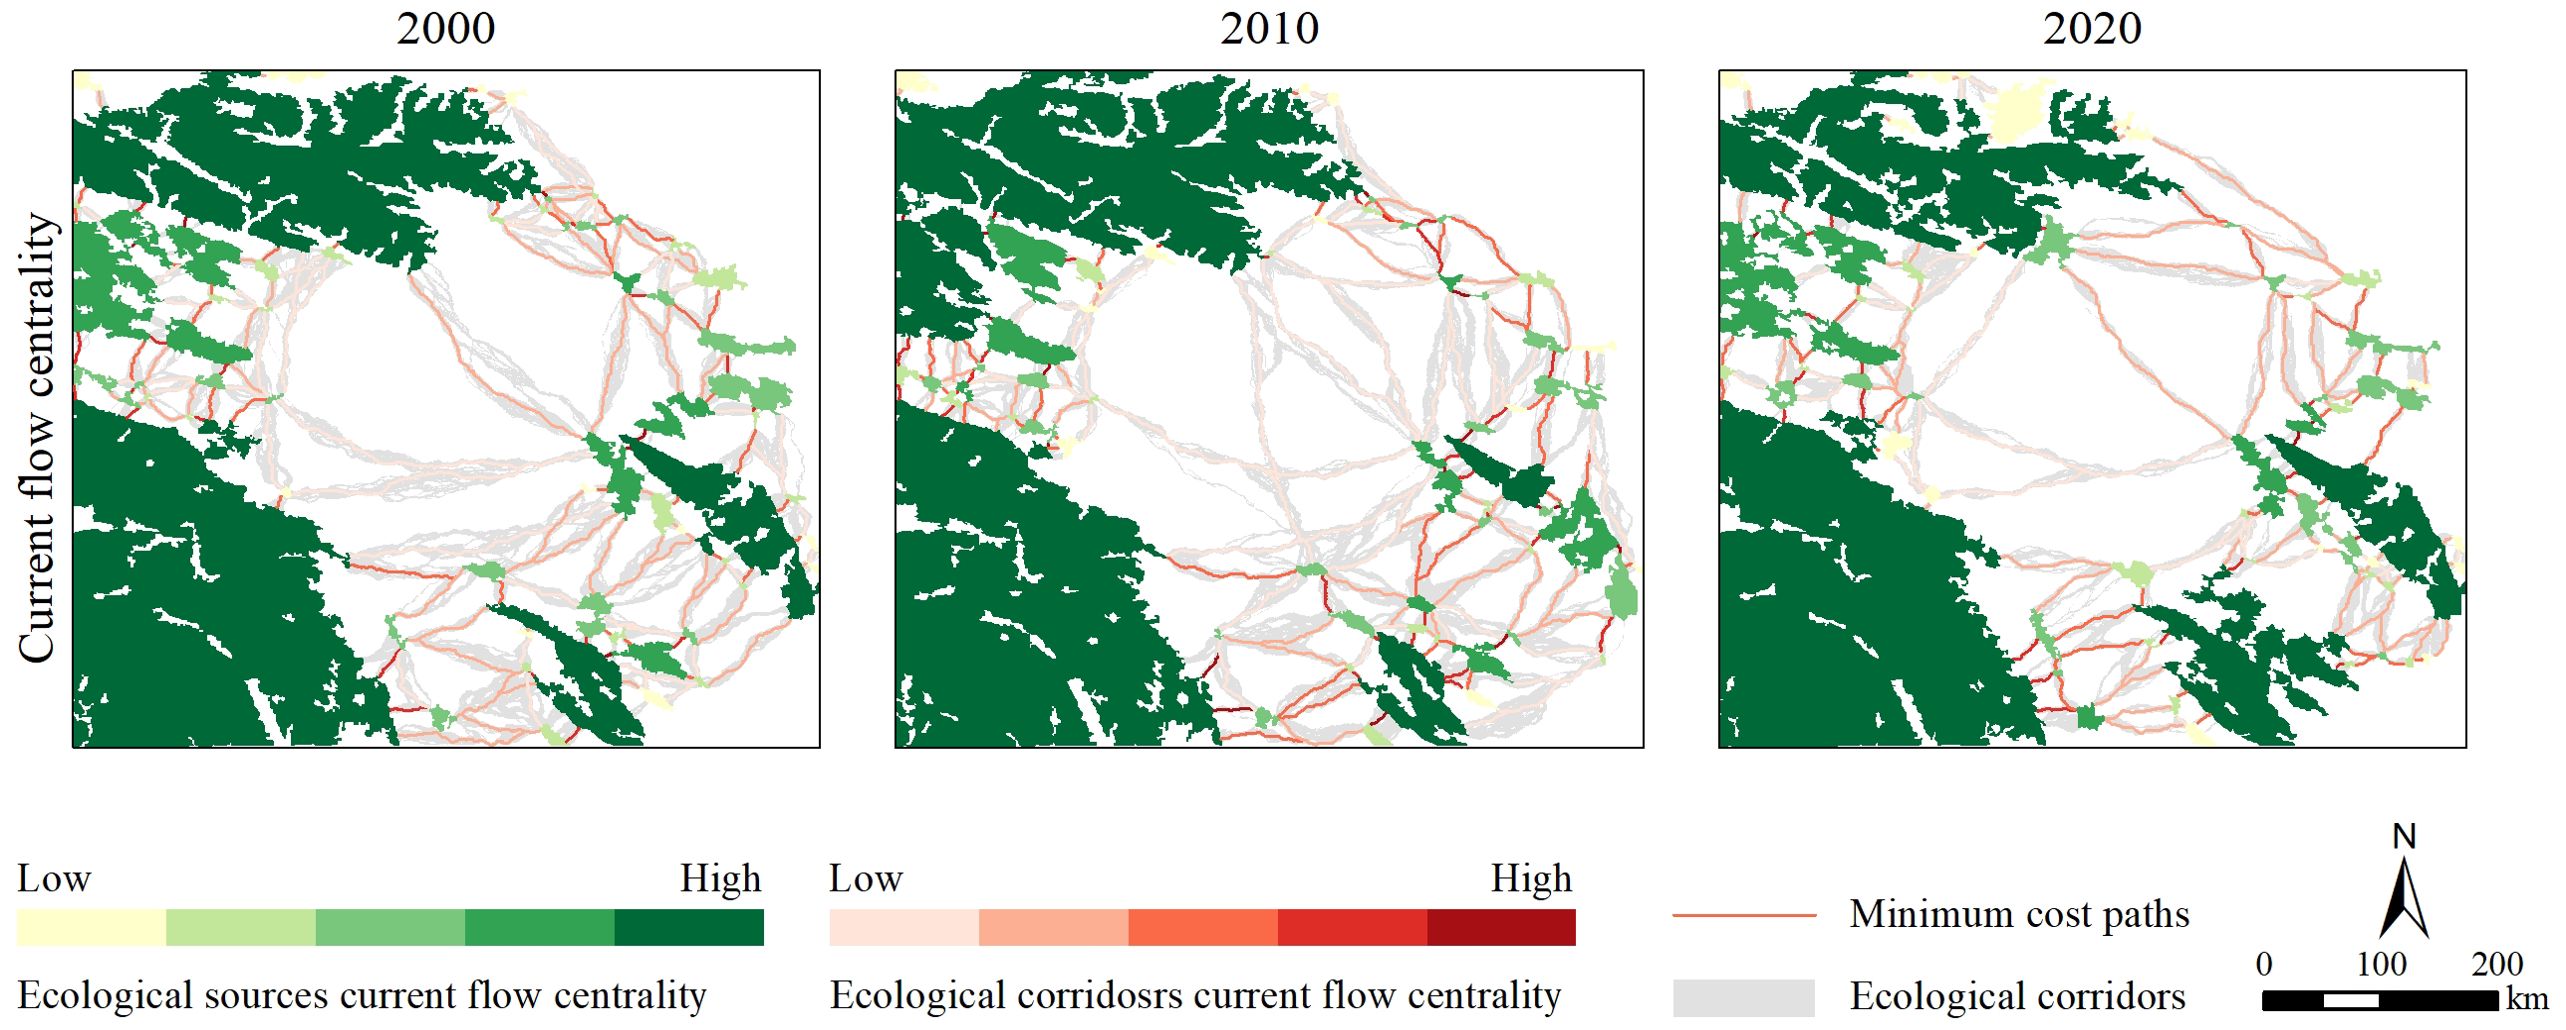
Figure 9. Spatiotemporal evolution characteristics of ecological corridors in the Qinba–Dabie intersection zone in China from 2000 to 2020.
This research further used the Centrality Mapper tool of Linkage Mapper to analyze the current flow centrality of ecological sources and corridors. First, considering the ecological sources, a large ecological source area generally indicates a strong centrality. By contrast, a small area indicates a weak centrality. Among them, the ecological source of Daba Mountain was relatively stable, and its current flow centrality was consistently the highest from 2000 to 2020. The area of ecological sources, such as Funiu, Tongbai, and Dahong Mountains, obviously changed in the past 20 years. However, the centrality strength of these ecological sources was second only to that of Daba Mountain. Therefore, maintaining the connectivity of ecological sources and preventing the fragmentation of ecological sources are crucial to improving centrality. Second, from the perspective of ecological corridors, long and short ecological corridors indicate weak and strong centrality, respectively. Specifically, the ecological corridors with strong centrality were mainly distributed in the circular area connecting Daba, Funiu, Tongbai, and Dahong Mountains. By contrast, the weaker ones were mainly distributed in the urban and agricultural space areas of the central Nanyang Basin. From the perspective of spatial variation characteristics, from 2010 to 2020, the short ecological corridors with strong centrality decreased, and the long ecological corridors with weak centrality increased due to the reduction of crucial ecological sources that serve as stepping stones. Therefore, maintaining and increasing the ecological sources that serve as stepping stones are crucial for increasing the number and centrality of ecological corridors.
This research further analyzed the essential characteristics of ecological sources and corridors by current flow centrality. Figure 10 shows that the statistical distribution characteristics of the two indexes in 2000, 2010, and 2020 mostly remained the same. Specifically, the medians of the current flow centrality of the ecological sources in the three years (Figure 10A) were 199.30, 219.22, and 197.74, while the quartile differences were 141.62, 105.74, and 150.90, respectively. These statistics indicated that the overall centrality of the ecological sources increased first and then decreased, while the difference in centrality decreased first and then increased, consistent with the statistical characteristics of the sources’ AREA. Accordingly, the trend again explains the correlation between the ecological source area and centrality. Moreover, the medians of the current flow centrality (Figure 10B) of the ecological corridors in the three years were 70.67, 71.40, and 74.26, while the quartile differences were 54.60, 53.10, and 62.93, respectively. These statistics indicated that the overall centrality of the ecological corridors gradually increased, while the difference in centrality slightly decreased first and then sharply increased. The trend indicated that the importance of the ecological corridors in the study area increased overall, but the regional differences in importance may also increase.
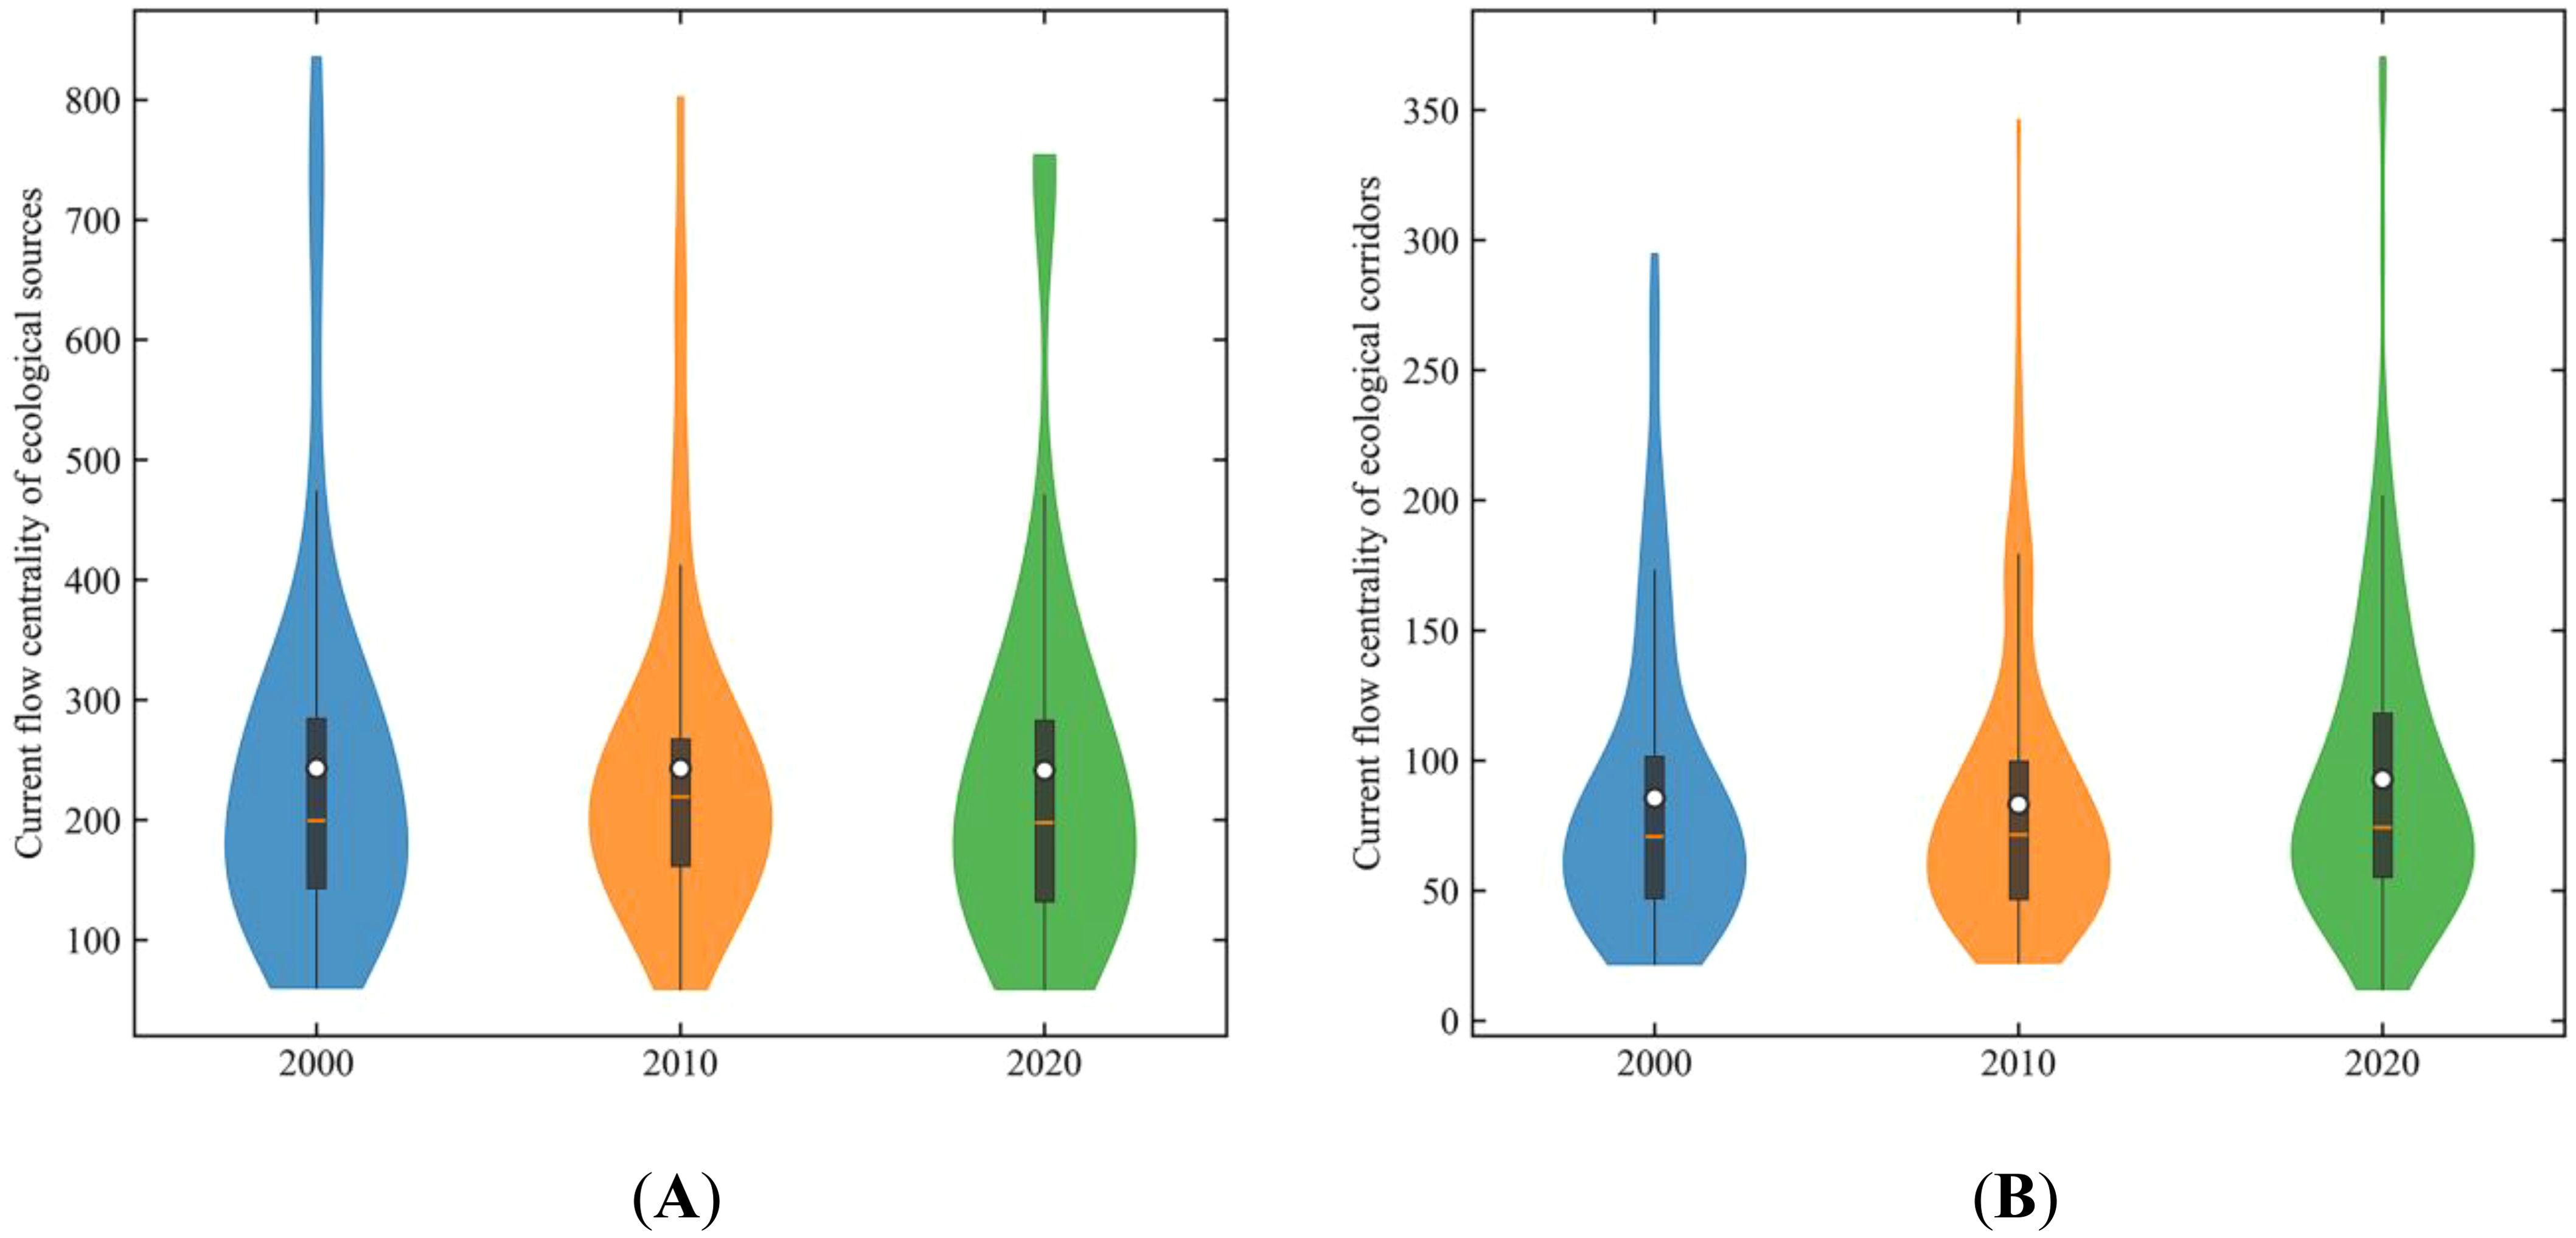
Figure 10. Current flow centrality distribution of ecological sources and ecological corridors in the Qinba–Dabie intersection zone in China from 2000 to 2020: (A) Current flow centrality distribution of ecological sources; (B) Current flow centrality distribution of ecological corridors.
The current flow density (Figure 11) of the ecological corridors in 2000, 2010, and 2020 was obtained using the Pinchpoint Mapper tool of Linkage Mapper software and then divided into five levels according to its statistical distribution characteristics. This research identified the highest level of current flow density as ecological pinch points, which were the critical protection areas for maintaining the connectivity of the ecosystem. Finally, 106, 141, and 148 ecological pinch points were identified in the three different years, revealing a total area of 641.28, 1,003.88, and 1,082.36 km2, respectively. This phenomenon displays an overall growth trend. The ecological pinch points were mainly distributed in the ring area connecting Daba, Funiu, Tongbai, and Dahong Mountains. Specifically, the ecological pinch points increased more from 2000 to 2010 and were mainly distributed in the junction area of the western Qinling and Daba Mountains.
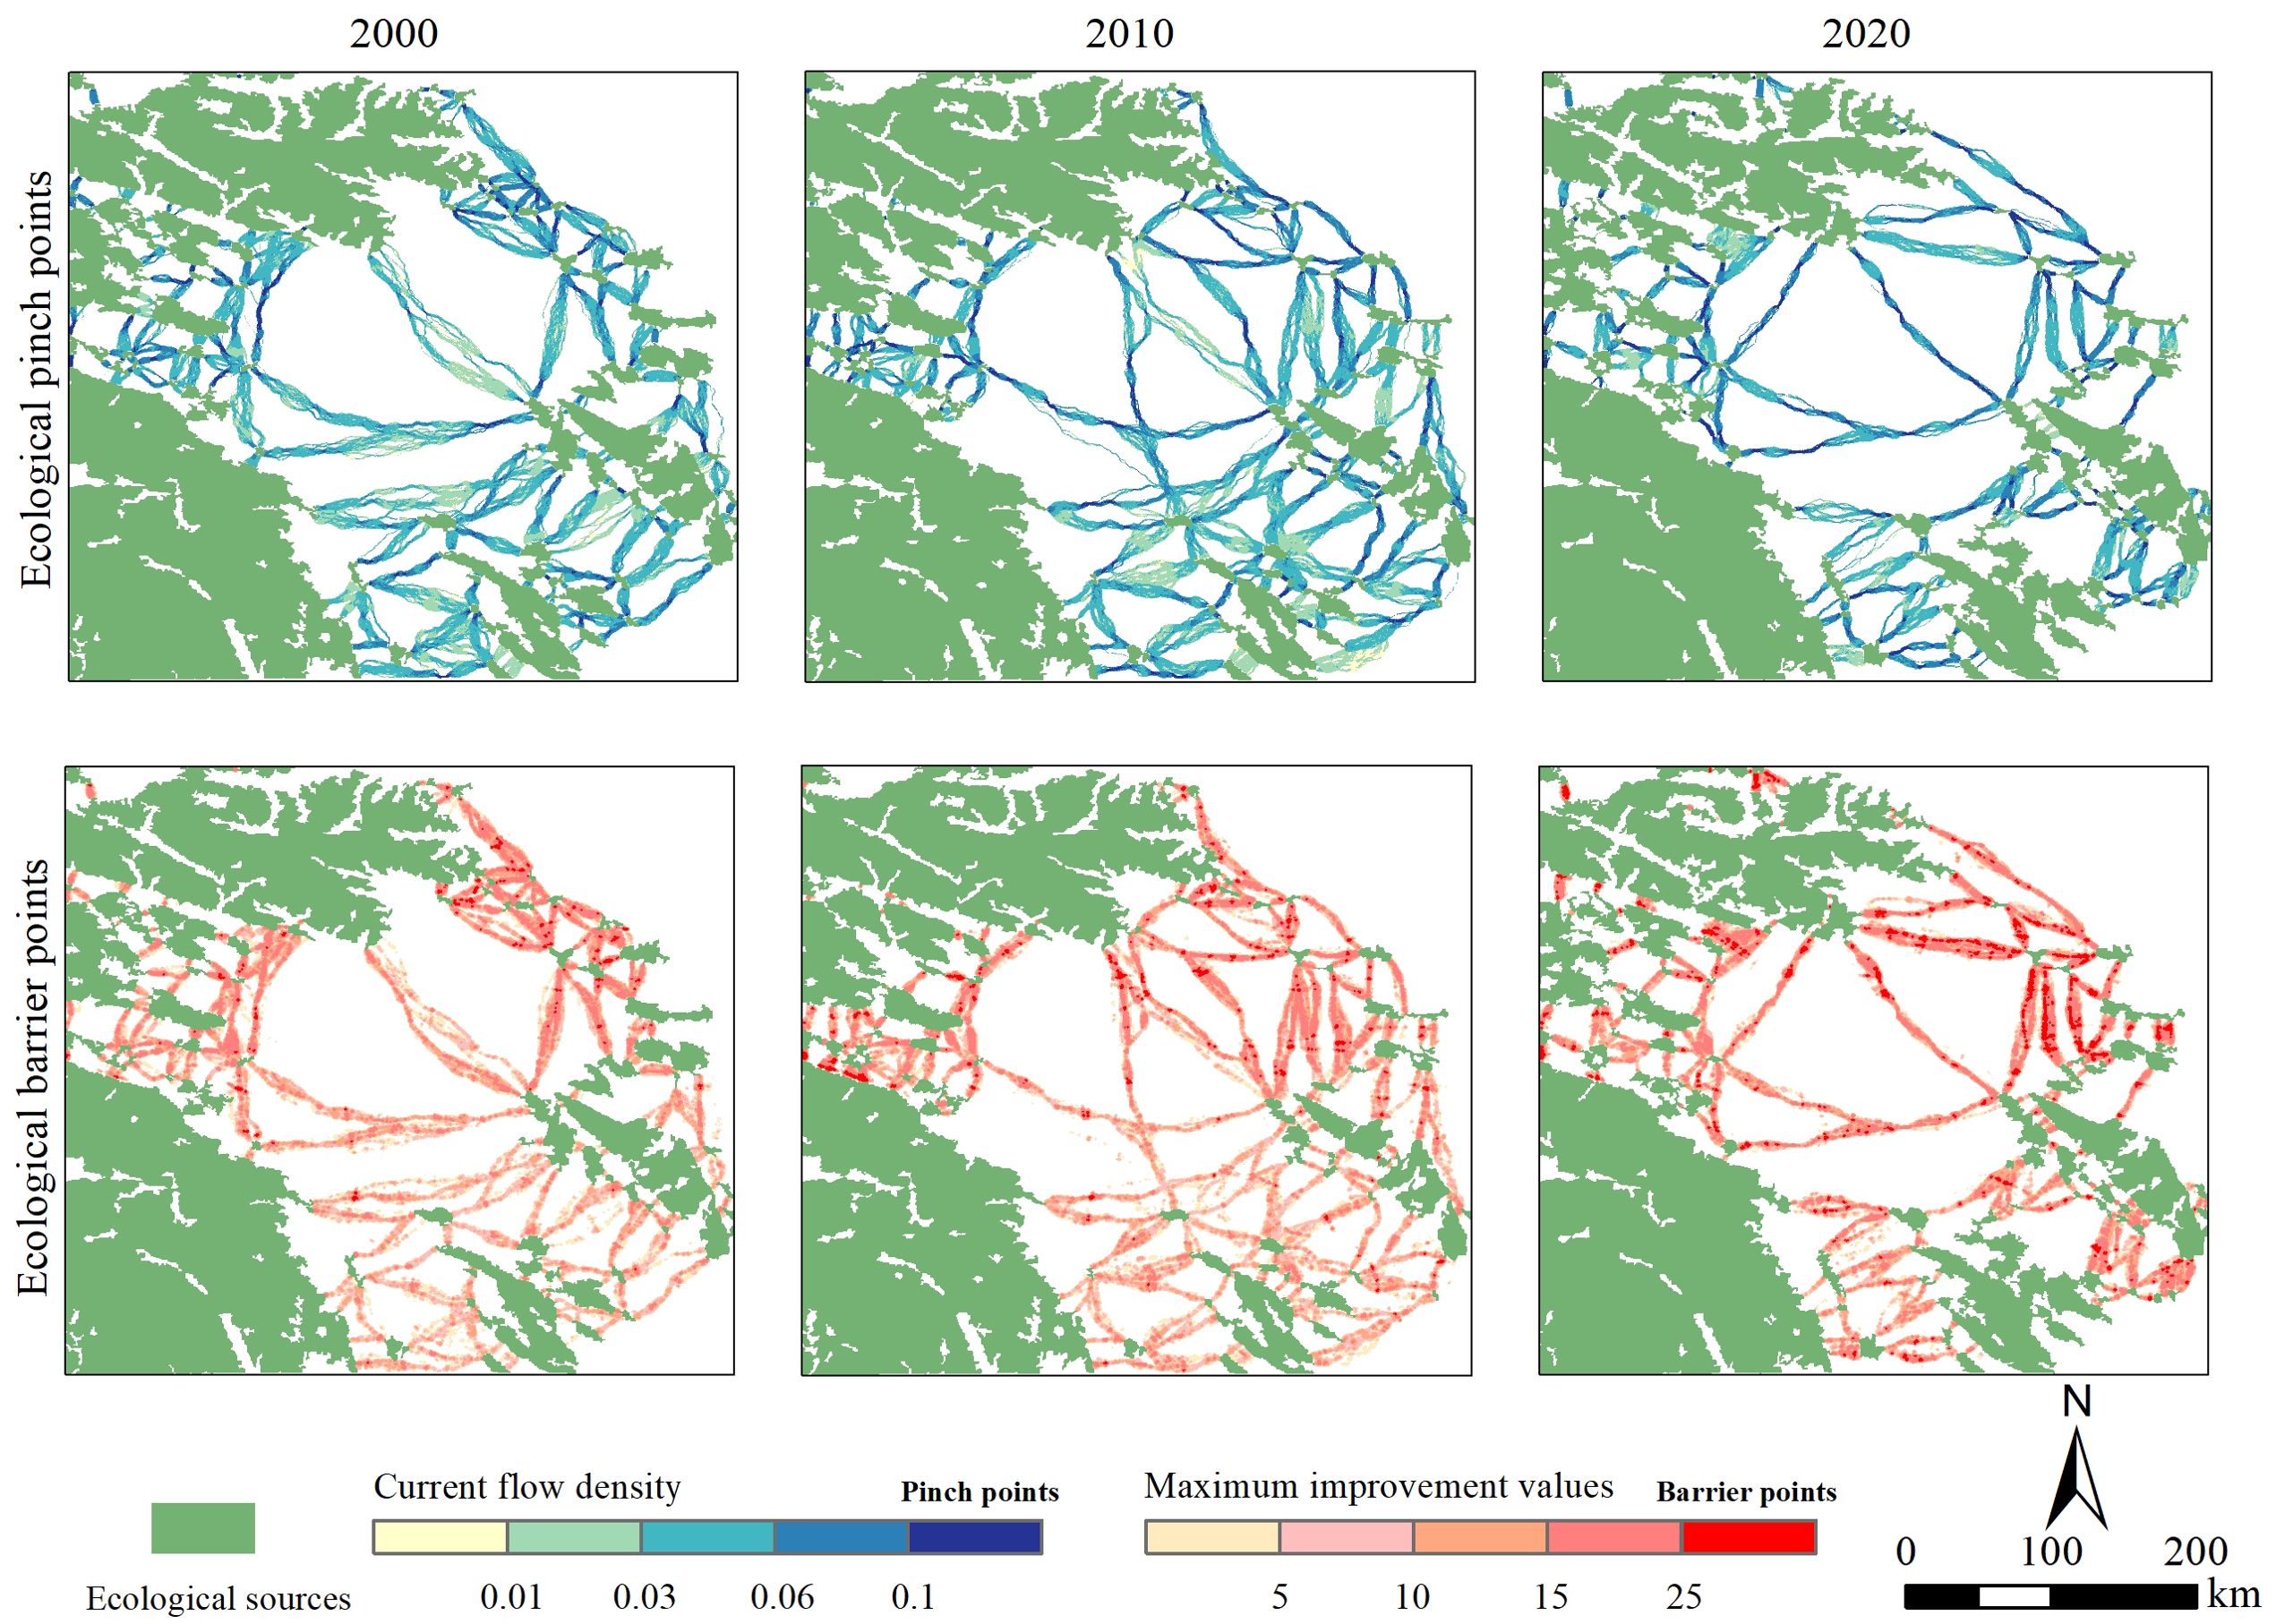
Figure 11. Spatiotemporal evolution characteristics of ecological key points in the Qinba–Dabie intersection zone in China from 2000 to 2020..
The maximum improvement values (Figure 11) of the ecological corridors in 2000, 2010, and 2020 were determined by the Barrier Mapper tool of Linkage Mapper software and then divided into five levels according to the statistical distribution characteristics. This research identified the highest level of maximum improvement values as the ecological barrier points, which are critical restoration areas that improve the connectivity of the ecosystem. Finally, this research identified 75, 151, and 223 ecological barrier points in the three different years, revealing a total area of 254.10, 541.86, and 1,304.95 km2, respectively. This phenomenon also demonstrated an overall growth trend. The ecological barrier points were mainly distributed in the northeastern plain area and the junction area between the western Qinling and the Daba Mountains. Specifically, the ecological barrier points increased more from 2010 to 2020 and were also mainly distributed in the northeastern plain area of the study area.
The statistical distributions of the ecological corridors’ current flow value in 2000, 2010, and 2020 in the study area (Figure 12) are all right-skewed. Moreover, the kurtosises in 2000 and 2010 are higher while that in 2020 is lower, and the distributions gradually shift to the right over time. The average value of the three years is 4.86, 4.95, and 6.64, indicating the gradual increase in the current flow density of the ecological corridors, which is more from 2010 to 2020.
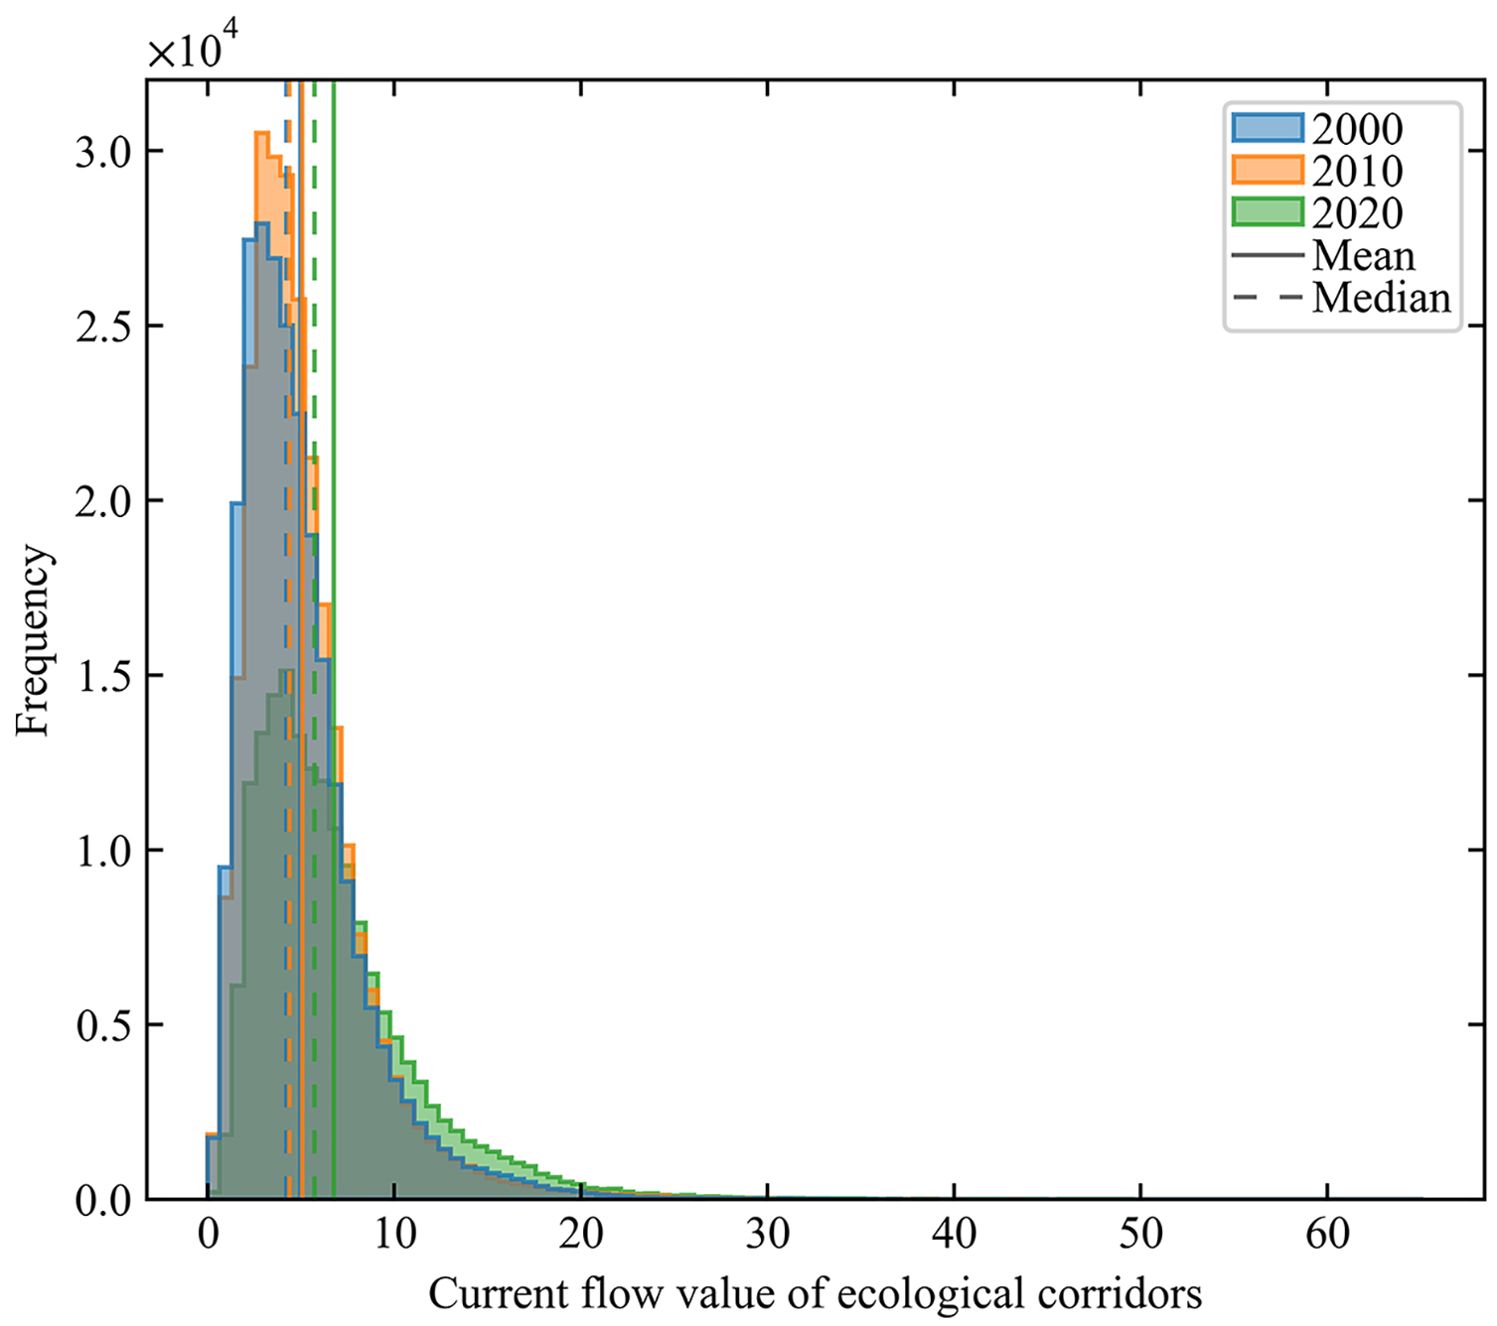
Figure 12. Distribution of the current flow value of ecological corridors in the Qinba–Dabie intersection zone in China from 2000 to 2020.
4 Discussion
4.1 Protection and restoration strategies of ecological security pattern
This research believes that the ecological security pattern in a region is an organic system composed of three parts of the ecological “source–surface–corridor”. Therefore, the evaluation of ecological security patterns should also be based on the three parts. Accordingly, this research proposed an analysis framework based on ecological “source–surface–corridor” to evaluate the ecological security patterns scientifically and quantitatively. This research suggests that a complete analysis of the ecological security pattern should be carried out from three aspects: ecological sources, resistance surface, and corridors. On the one hand, the ecological sources are the habitats of organisms and the sources of biological flow, and their area, shape, and fragmentation are the basis of the regional ecological security pattern quality (Carter et al., 2020; Mohammadi and Fatemizadeh, 2021; Fullman et al., 2021). This research found that the distribution change law of the ecological sources in the study area was consistent with the distribution change law of their centrality. Moreover, small ecological sources also played an important role in the ecological security pattern. Because of the disappearance of the small ecological sources in the northeast of the study area, which play a stepping stone role, the length of the ecological corridor in this area became longer, and the centrality became weaker. Therefore, the systematic analysis and targeted protection of ecological sources are the basis for maintaining the ecological security pattern. On the other hand, the ecological resistance surface is the environment for the formation of biological flows and the important basis for the identification of ecological corridors (Peterman et al., 2014; Chambers et al., 2023). The spatiotemporal characteristics of the ecological resistance surfaces affect and determine the spatiotemporal characteristics of the ecological corridors. As shown in the results of this research, the resistance surface in the study area showed an overall growth trend from 2000 to 2020, while the ecological corridor network showed an overall deterioration trend. This deterioration trend was reflected in the obvious reduction of the number and area of ecological corridors, the obvious narrowing of the ecological corridor width, the reduction of short ecological corridors with strong centrality, the increase of long ecological corridors with weak centrality, and the substantial increase of ecological pinch points and barrier points. Furthermore, the essence of protecting the ecological corridor is to reduce the ecological resistance of the ecological corridor and its surroundings and promote the formation of the ecological corridor by improving the ecological resistance in specific areas. Therefore, how to improve the ecological resistance surface pertinently based on systematic and scientific analysis is the key to improving the ecological security pattern.
Considering the ecological security pattern characteristics composed of ecological sources, resistance surface, and corridors in the Qinba–Dabie intersection zone in 2020 and the spatiotemporal evolution characteristics from 2000 to 2020, an ecological security protection and restoration pattern comprising core ecological areas, general ecological areas, core ecological corridors, general ecological corridors, ecological improvement areas, and ecological restoration areas is established in this research (Figure 13). Targeted protection and restoration strategies are also introduced to improve and enhance the regional ecological security pattern and promote the sustainable use of regional land space.
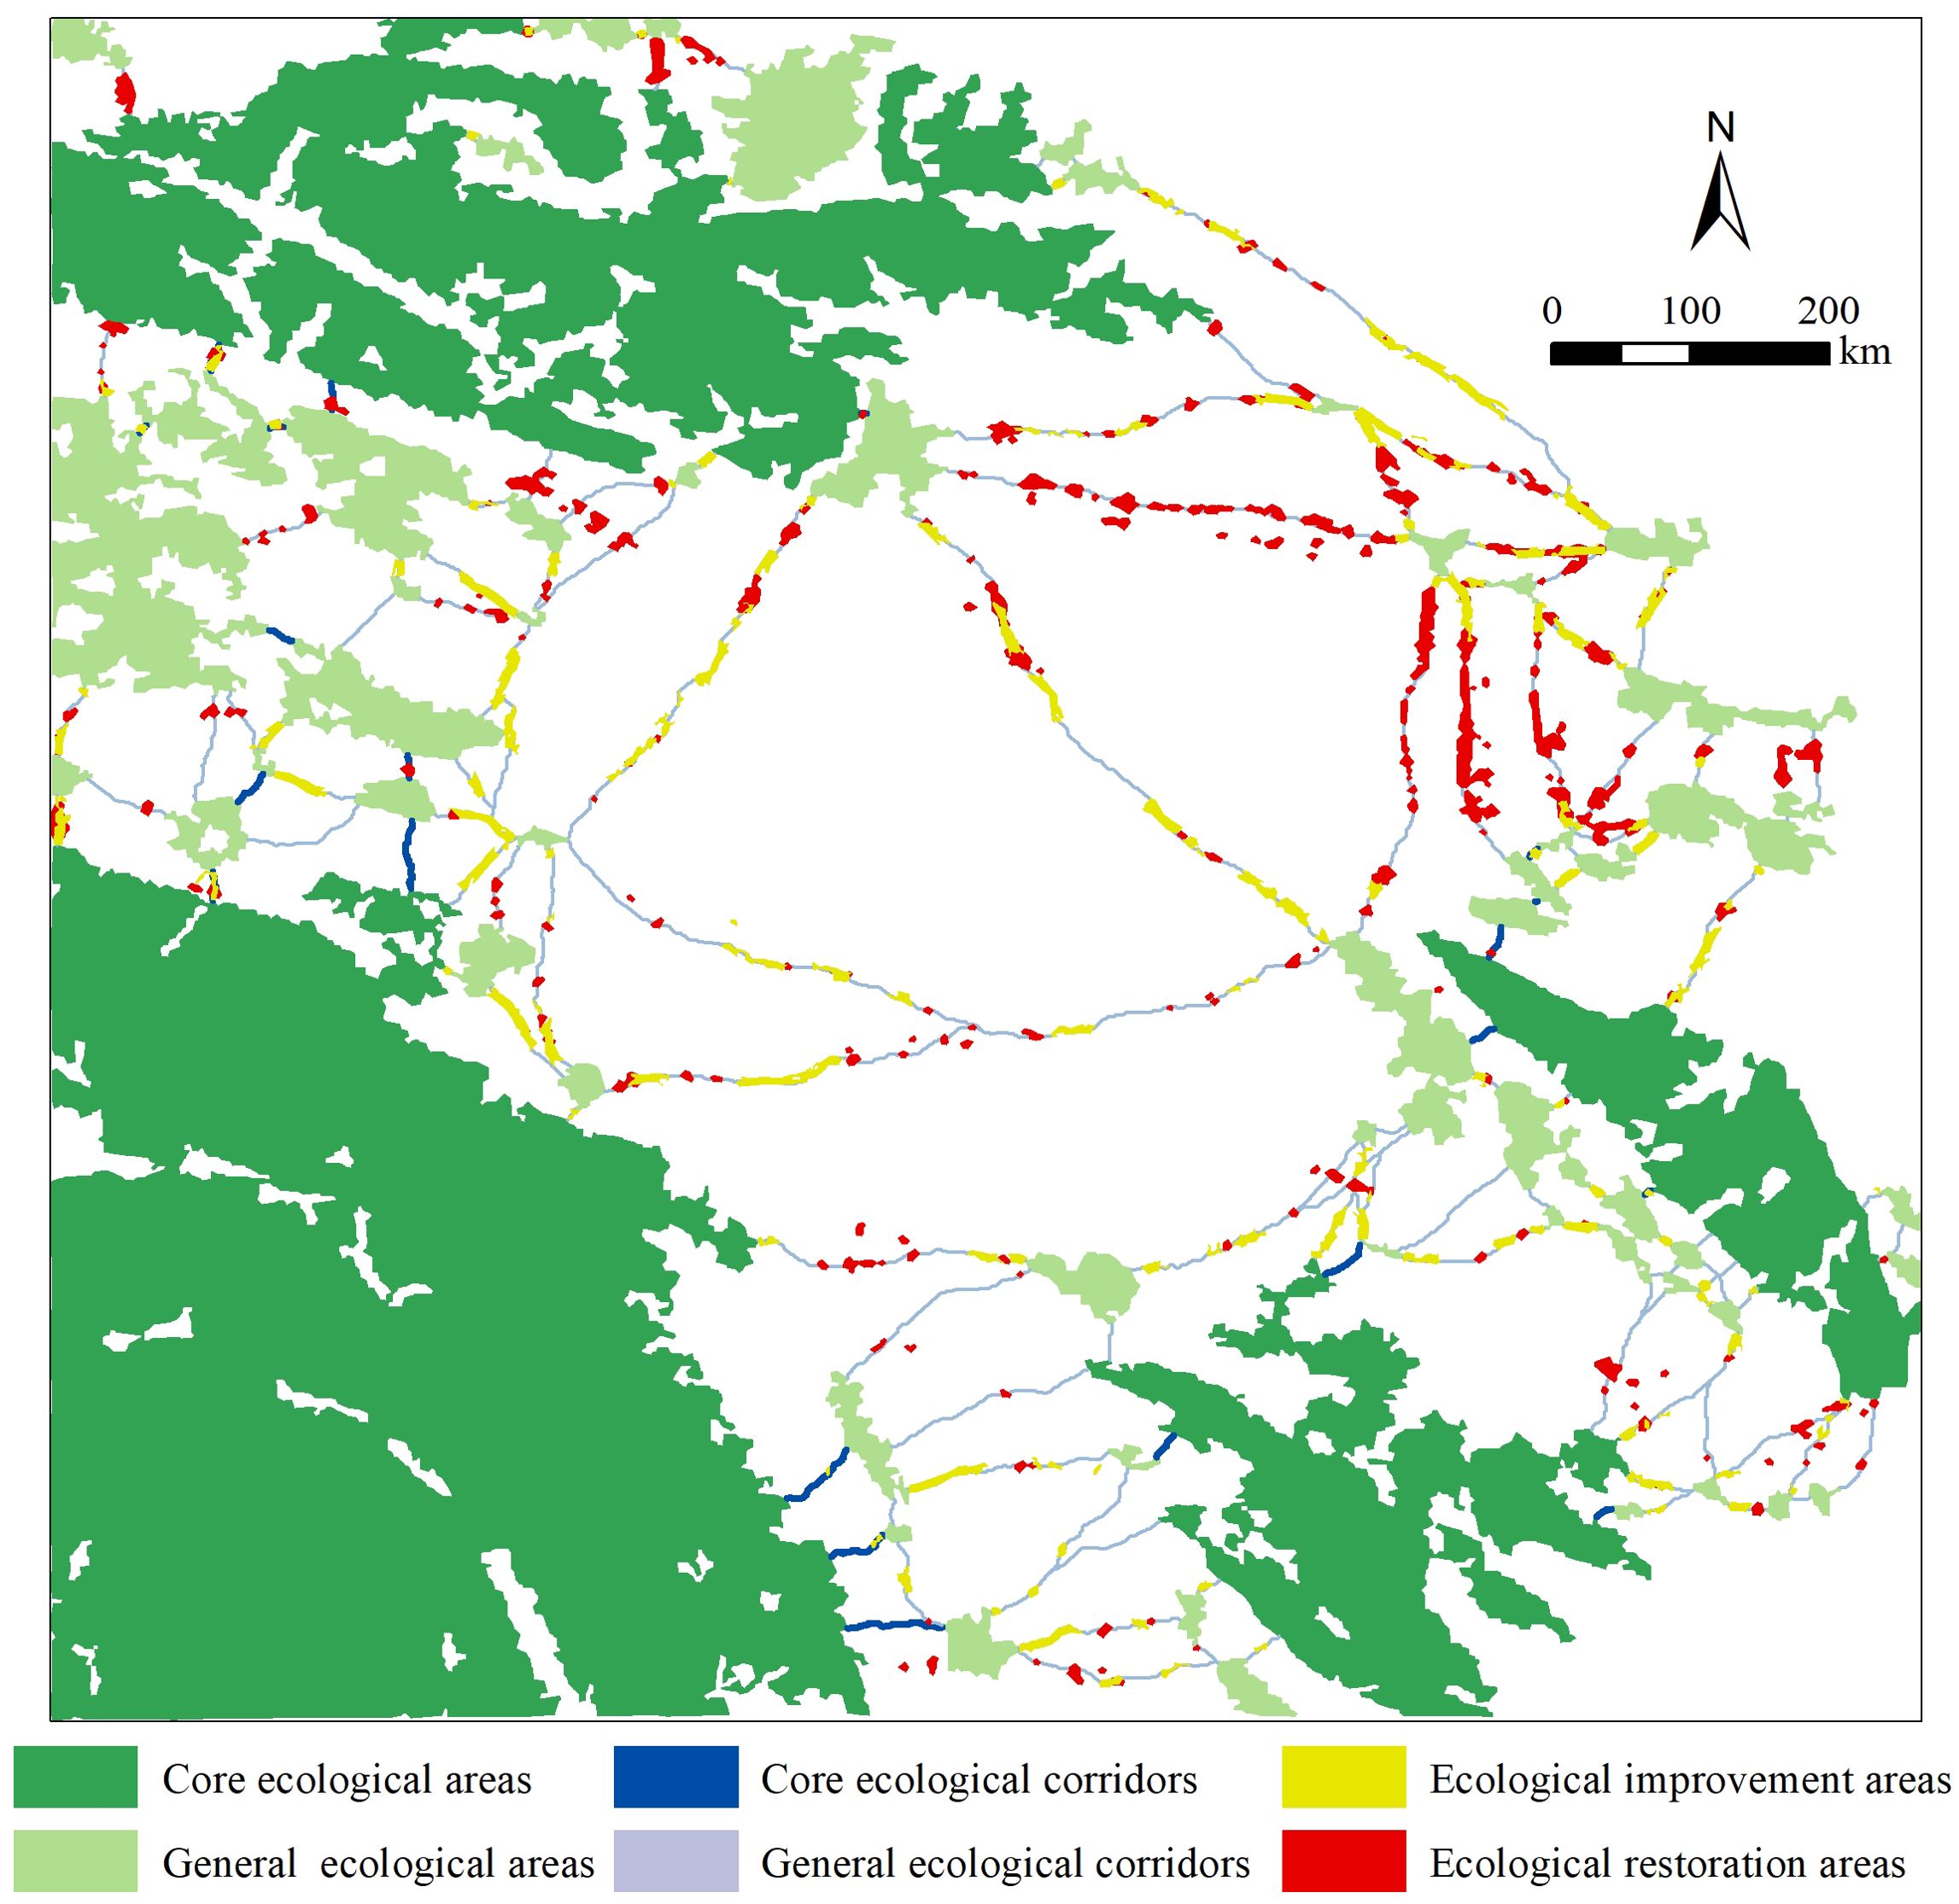
Figure 13. Spatial distribution of the ecological protection and restoration key areas in the Qinba–Dabie intersection zone in China.
4.1.1 Ecological areas
Based on the current flow centrality, this research divided the ecological source areas into the core and general ecological areas. Among them, the core ecological areas include four ecological sources with substantial current flow centrality, such as Funiu Mountain in the north, Daba Mountain in the southwest, Dahong Mountain in the southeast, and Tongbai Mountain, revealing a total of 28,523.49 km2. The other 56 ecological sources are general ecological areas, yielding a total of 5,913.01 km2. The core ecological areas are crucial bases for providing regional ecological products and services and maintaining species populations and diversity. Future measures, such as setting ecological protection red lines and establishing natural reserves, are necessary. Meanwhile, various human production and living activities that harm ecological functions should be strictly restricted. In addition, safeguarding and enhancing the ecosystem service functions of the core ecological areas aims to strengthen the foundation of ecological security. Among them, strengthening the ecological restoration of the northern Funiu Mountains is emphasized to achieve the goal of consolidating the ecological security foundation. Ecological function areas with different scales are habitats for species with various habitat sizes and are also stepping stones for biological circulation between ecological sources. Therefore, the general ecological areas are also key components of the regional ecological security pattern. In the future, the government should adopt planning measures to prevent ecological functional areas from being occupied by agricultural and urban space. Furthermore, some ecological sources that serve as key stepping stones, especially the disappeared ecological sources between Funiu and Tongbai Mountains in the northeast, should be restored as soon as possible to facilitate the formation of the main body of the ecological security pattern.
4.1.2 Ecological corridors
Based on the current flow centrality, this research divided the ecological corridors into core and general ecological corridors. Among them, 21 core ecological corridors with high current flow centrality and short lengths are mainly distributed between the Funiu and Daba Mountains and between the Daba and Dahong Mountains, revealing a total of 133.98 km. The other 116 ecological corridors are general ecological corridors, demonstrating a total of 2,742.46 km. The core ecological corridors are the key transmission channels for species to perform material and energy cycles and maintain the connectivity between ecological areas. In the future, strict protection can be realized through the development of special protection plans and control rules, the installation of corridor protection signs, and other means. Simultaneously, human production and construction activities that damage the core ecological corridors should be restricted. Priority should be given to ensuring the integrity of the core ecological corridors to reduce adverse effects such as gaps, interference, and breakpoints within the corridor. Protecting the core ecological corridors around the core ecological areas should be emphasized to maintain the connectivity of the core ecological areas. The general ecological corridors, which are generally long and widely distributed, are also key components of the regional ecological network. These corridors are also important channels connecting open space, nature reserves, and landscape elements. In the future, the government can appropriately increase small natural parks and other green spaces in long ecological corridors, such as the northeast and central regions, to reduce the length of corridors, minimize the cost of species circulation, and enhance the resilience of the ecological network.
4.1.3 Ecological improvement areas
The ecological improvement areas are derived based on the ecological pinch points. Among them, 148 areas with high current flow density are identified, revealing a total of 1,082.36 km2, scattered in the central and eastern agricultural and ecological spaces. The ecological improvement areas in the ecological security pattern are those with dense biology and energy flow and fragile ecology, thereby requiring critical maintenance. In the future, on the one hand, for agricultural spaces such as cultivated and garden lands within the ecological improvement areas, the government should further leverage the multifunctional value of agricultural land, develop green ecological agriculture, and improve ecological functions through farmland shelter forest construction, agricultural pollution prevention and control, and other measures. On the other hand, for the ecological spaces such as forests, grasslands, and water bodies within the ecological improvement areas, the government should focus on the forested mountainous areas in the southeast and northwest with notably changed comprehensive ecosystem services. Furthermore, comprehensive protection of natural forests, such as logging restriction, augmentation of vegetation cover through anthropogenic planting, and restoration and protection of natural forest ecosystems, should be implemented. The government should also strengthen the water environment and aquatic ecological protection, governance, and restoration, maintain water functions’ overall stability, and ensure biological circulation channels’ connectivity.
4.1.4 Ecological restoration areas
This research identified a total of 223 areas with high maximum improvement resistance values as the ecological restoration areas based on the ecological barrier points, demonstrating a total of 1304.95 km2, which are mainly scattered in urban and agricultural living spaces, especially in the northeast. The ecological restoration areas are the regions that can substantially improve the connectivity between ecological areas and the ecological security pattern stability at the lowest restoration cost. In the future, on the one hand, for urban spaces, the government should focus on the ecological restoration areas in the northeast, increase urban green space, and build and optimize urban green infrastructure. Specifically, ecological bridges or biological channels should be established on roads, highways, and other places to help restore the species flow. On the other hand, for agricultural living spaces, the government should mainly focus on the rural residential areas in the midwest and south regions of the study area. Specifically, they should integrate ecological landscape construction into village planning, strengthen village environmental management, and increase the connectivity of biological circulation channels.
4.2 Innovation, limitations and prospects
This research found that the systematic analysis and targeted protection of ecological sources are the basis for maintaining the ecological security pattern, and targeted improvement of ecological resistance surface is the key to improving the ecological security pattern. Therefore, measures such as the protection of core ecological sources, the rational layout of ecological sources as stepping stones, and the improvement of resistance values at ecological key points should be paid attention to in the future. Most previous studies focused on the analysis of ecological corridors while ignoring the analysis of ecological sources and resistance surfaces (Feng et al., 2022; Wu et al., 2022). Besides, unlike most previous researches that use anthropogenic administrative regions to study the ecological security pattern (Zhong et al., 2024; Lu et al., 2024), the relatively complete natural ecological unit of the Qinba–Dabie intersection zone, which spans Henan, Hubei, and Shaanxi Provinces, is selected in this research, thereby avoiding the problem of splitting the original complete natural ecological units. The results also indicate the necessity of selecting complete natural ecological units across anthropogenic administrative regions as the study area. This selection addresses the requirements of ecological civilization in the new era for regional ecological co-protection, co-construction, co-governance, and sharing (Kroll et al., 2012; Panagopoulos et al., 2016). Moreover, unlike previous studies that overemphasized specific timeframes (Mao et al., 2020; Sun et al., 2021), this research analyzed the spatiotemporal evolution characteristics of the ecological security pattern of the Qinba–Dabie intersection zone based on multi-period data, revealing the characteristics of changes across different historical periods. In addition, the results show that ecological security pattern research should not be limited to simple identification mapping and qualitative analysis of ecological sources and corridors. The application of quantitative methods to the analysis of the ecological security pattern identification results can further deepen and verify the research results, which is of considerable importance to the ecological security pattern methodology.
This research only conducted a preliminary exploration of the aforementioned aspects, but still has some limitations in some aspects. Thus, researchers still have a substantial amount of work to do in the future, such as how to choose the cross-administrative ecosystem as the study area. Longitude and latitude are used in this research to select the study area qualitatively. However, the effect of the selection results on the identification and analysis of the ecological security pattern should still be discussed. For another example, when defining the ecological sources, this research only selected four types of ecosystem services without considering the types of water purification and food production, which can be further improved in the future. In addition, as there is no uniform standard for setting some parameters of software tools, this research mainly depended on the empirical values of previous studies. Furthermore, this research only used simple statistical methods such as histograms and violin plots to conduct an overall quantitative analysis of the results of the ecological security pattern identification based on the ecological “source–surface–corridor”. How to perform a local quantitative analysis of the ecological security pattern in each region of the study area is crucial to the formulation of targeted regional ecological security pattern protection and restoration strategies, and further research is needed in the future.
5 Conclusions
The scientific analysis of the ecological security pattern should focus on a relatively complete natural ecological unit from three aspects: ecological sources, resistance surface, and corridors. Therefore, using the ecological security pattern analysis framework based on the ecological “source–surface–corridor”, this research explored the spatiotemporal evolution characteristics of the ecological security pattern in the Qinba–Dabie intersection zone in China, a complete natural ecological unit across administrative regions, from 2000 to 2020. In this research, ecological sources were identified using the comprehensive ecosystem service index, and ecological corridors, pinch points, and barrier points were identified using the LinkageMapper software. Based on the statistical and quantitative analysis of the spatiotemporal evolution characteristics of ecological sources, resistance surfaces, and corridors, this research constructed the ecological protection and restoration pattern in the study area and proposed targeted protection and restoration strategies. The main conclusions are presented as follows:
(1) From 2000 to 2020, the ecological sources in the study area exhibited an overall pattern of increasing first and then decreasing in the northwest while decreasing first and then increasing in the southeast. The ecological resistance surfaces demonstrated a consistent, gradual growth trend, with prominent increases observed in the central and eastern regions between 2000 and 2020.
(2) From 2000 to 2020, the ecological corridors in the study area showed an overall trend of increasing first and then decreasing, revealing a circular distribution pattern connecting Daba, Funiu, Tongbai, and Dahong Mountains in spatial order. Among them, the ecological corridors in the northeast plain area notably decreased from 2010 to 2020. Ecological pinch points and barrier points in the study area both display an increasing trend. Among them, from 2000 to 2010, the ecological pinch points in the junction area between the western Qinling and Daba Mountains markedly increased, while the ecological barrier points in the northeastern plain area notably increased from 2010 to 2020.
(3) Based on the aforementioned research, an ecological security protection and restoration pattern encompassing core ecological areas, general ecological areas, core ecological corridors, general ecological corridors, ecological improvement areas, and ecological restoration areas is introduced in this research. Targeted protection and restoration strategies are further proposed in this research based on the pattern.
Data availability statement
The raw data supporting the conclusions of this article will be made available by the authors, without undue reservation.
Author contributions
SZ: Conceptualization, Data curation, Formal Analysis, Investigation, Methodology, Resources, Software, Visualization, Writing – original draft. YC: Data curation, Formal Analysis, Investigation, Software, Visualization, Writing – original draft. JL: Conceptualization, Funding acquisition, Methodology, Supervision, Validation, Writing – review & editing. QY: Validation, Writing – review & editing. WC: Project administration, Writing – review & editing. XW: Writing – review & editing. HW: Funding acquisition, Writing – review & editing. QJ: Writing – review & editing. LG: Funding acquisition, Writing – review & editing.
Funding
The author(s) declare financial support was received for the research, authorship, and/or publication of this article. This research was funded by the National Natural Science Foundation of China (Grant Number: 41901259), the Scientific research project of “the open competition mechanism to select the best candidates” of natural resources in Henan Province (Grant Number: 2024-11) and the Technological Innovation Foundation of Henan Agricultural University (Grant Number: KJCX2018B04).
Conflict of interest
The authors declare that the research was conducted in the absence of any commercial or financial relationships that could be construed as a potential conflict of interest.
Publisher’s note
All claims expressed in this article are solely those of the authors and do not necessarily represent those of their affiliated organizations, or those of the publisher, the editors and the reviewers. Any product that may be evaluated in this article, or claim that may be made by its manufacturer, is not guaranteed or endorsed by the publisher.
References
Alexander J. L., Olimb S. K., Bly K. L. S., Restani M. (2016). Use of least-cost path analysis to identify potential movement corridors of swift foxes in Montana. J. Mammal. 97, 891–898. doi: 10.1093/jmammal/gyw032
An Y., Liu S., Sun Y., Shi F., Beazley R. (2021). Construction and optimization of an ecological network based on morphological spatial pattern analysis and circuit theory. Landsc. Ecol. 36, 2059–2076. doi: 10.1007/s10980-020-01027-3
Baguette M., Blanchet S., Legrand D., Stevens V. M., Turlure C. (2013). Individual dispersal, landscape connectivity and ecological networks. Biol. Rev. 88, 310–326. doi: 10.1111/brv.12000
Bakker M. R., Brunner I., Ashwood F., Bjarnadottir B., Bolger T., Børja I., et al. (2019). Belowground biodiversity relates positively to ecosystem services of european forests. Front. Forests Global Change 2. doi: 10.3389/ffgc.2019.00006
Brasileiro L. A. M., MaChado R. B., Aguiar L. M. S. (2022). Ecosystems services provided by bats are at risk in Brazil. Front. Ecol. Evol. 10. doi: 10.3389/fevo.2022.852177
Carter N., Killion A., Easter T., Brandt J., Ford A. (2020). Road development in Asia: Assessing the range-wide risks to tigers. Sci. Adv. 6, eaaz9619. doi: 10.1126/sciadv.aaz9619
Chambers J. C., Brown J. L., Bradford J. B., Board D. I., Campbell S. B., Clause K. J., et al. (2023). New indicators of ecological resilience and invasion resistance to support prioritization and management in the sagebrush biome, United States. Front. Ecol. Evol. 10. doi: 10.3389/fevo.2022.1009268
Dai L., Liu Y., Luo X. (2021). Integrating the MCR and DOI models to construct an ecological security network for the urban agglomeration around Poyang Lake, China. Sci. Total Environ. 754, 141868. doi: 10.1016/j.scitotenv.2020.141868
Du Y., Wang Z., Qinghe Y., Yongchong Y., Quanwen Z. (2022). Construction of a regional ecological security pattern based on a habitat quality model and circuit theory: A case study of the Qinling Mountains (Shaanxi section). J. Agric. Resour. Environ. 39, 1069–1078. doi: 10.13254/j.jare.2021.0531
Feng Y., Zhen J., Tian T. (2022). Optimization of land protection and restoration based on ecological security pattern: A case study of Hohhot-Baotou-Ordos Region in Inner Mongolia. J. Natural Resour. 37, 2915. doi: 10.31497/zrzyxb.20221111
Fullman T. J., Wilson R. R., Joly K., Gustine D. D., Leonard P., Loya W. M. (2021). Mapping potential effects of proposed roads on migratory connectivity for a highly mobile herbivore using circuit theory. Ecol. Appl. 31, e2207. doi: 10.1002/eap.2207
Gao J., Gong J., Yang J., Li J., Li S. (2022). Measuring Spatial Connectivity between patches of the heat source and sink (SCSS): A new index to quantify the heterogeneity impacts of landscape patterns on land surface temperature. Landscape Urban Plan. 217, 104260. doi: 10.1016/j.landurbplan.2021.104260
Huang J., Hu Y., Zheng F. (2020). Research on recognition and protection of ecological security patterns based on circuit theory: a case study of Jinan City. Environ. Sci. pollut. Res. Int. 27, 12414–12427. doi: 10.1007/s11356-020-07764-x
Kroll F., Müller F., Haase D., Fohrer N. (2012). Rural-urban gradient analysis of ecosystem services supply and demand dynamics. Land Use Policy 29, 521–535. doi: 10.1016/j.landusepol.2011.07.008
Li T., Gong Y. B., Ge J. Z., Qi Z. X., Xie S. B. (2021). Construction of urban landscape ecological security pattern based on circuit theory: A case study of Hengyang City, Hunan Province, China. Chin. J. Appl. Ecol. 32, 2555–2564. doi: 10.13287/j.1001-9332.202107.020
Li C., Huang L., Xu Q., Cao Z. (2024). Synergistic ecological network approach for sustainable development of highly urbanized area in the Bay Bottom region: A study in Chengyang District, Qingdao. Ecol. Indic. 158, 111443. doi: 10.1016/j.ecolind.2023.111443
Li Q., Jin X., Zhang X., Han B., Li H., Zhou Y. (2023). Comparison and evaluation of the ecological network construction method based on principles of landscape ecology. Acta Ecol. Sin. 43, 1461–1473. doi: 10.5846/stxb202106121571
Liang Y., Zhao Y. (2020). Construction and optimization of ecological network in Xi’an based on landscape analysis. Chin. J. Appl. Ecol. 31, 3767–3776. doi: 10.13287/j.1001-9332.202011.019
Liu J., Li S., Fan S., Hu Y. (2021). Identification of territorial ecological protection and restoration areas and early warning places based on ecological security pattern: a case study in Xiamen-Zhangzhou-Quanzhou Region. Acta Ecol. Sin. 41, 8124–8134. doi: 10.5846/stxb20201201307
Liu Q., Sun Y., Mei Y., Jian Z., Pan F., Zhang L. (2023). Construction and analysis of ecological security pattern of qingdao based on MSPA and MCR models. Pol. J. Environ. Stud. 32, 155–169. doi: 10.15244/pjoes/153431
Lu Y., Huang D., Tong Z., Liu Y., He J., Liu Y. (2024). A conceptual framework for constructing and evaluating directed ecological networks: Evidence from Wuhan Metropolitan Area, China. Environ. Impact Assess. Rev. 106, 107464. doi: 10.1016/j.eiar.2024.107464
Lumia G., Modica G., Cushman S. (2024). Using simulation modeling to demonstrate the performance of graph theory metrics and connectivity algorithms. J. Environ. Manage. 352, 120073. doi: 10.1016/j.jenvman.2024.120073
Ma X., Xu X. (2022). Optimization and management of the connectivity of ecological red lines at regional scale: A case study of Yangtze River Delta. J. Natural Resour. 37, 3088–3101. doi: 10.31497/zrzyxb.20221205
Mao C., Dai W., Qi L., Wang Y., Zhou W., Zhou L., et al. (2020). Constructing ecological security pattern based on ecosystem services: A case study in Liaohe River Basin, Liaoning Province, China. Acta Ecol. Sin. 40, 6486–6494. doi: 10.5846/stxb201909191954
Maseko M. S. T., Zungu M. M., Ehlers Smith D. A., Ehlers Smith Y. C., Downs C. T. (2020). Effects of habitat-patch size and patch isolation on the diversity of forest birds in the urban-forest mosaic of Durban, South Africa. Urban Ecosyst. 23, 533–542. doi: 10.1007/s11252-020-00945-z
McRae B. H. (2012). “Barrier mapper connectivity analysis software,” in The nature conservancy (Seattle Wa). Available at: http://www.circuitscape.org.
McRae B. H., Dickson B. G., Keitt T. H., Shah V. B. (2008). Using circuit theory to model connectivity in ecology, evolution, and conservation. Ecology 89, 2712–2724. doi: 10.1890/07-1861.1
McRae B. H., Kavanagh. D. M. (2011). “Linkage mapper connectivity analysis software,” in The nature conservancy (Seattle Wa). Available at: http://www.circuitscape.org.
Mcrae B., Shah V. (2009). Circuitscape user guide (Santa Barbara: The University of California). Available at: http://www.circuitscape.org.
Merrick M. J., Koprowski J. L. (2017). Circuit theory to estimate natal dispersal routes and functional landscape connectivity for an endangered small mammal. Landsc. Ecol. 32, 1163–1179. doi: 10.1007/s10980-017-0521-z
Mohammadi A., Fatemizadeh F. (2021). Quantifying landscape degradation following construction of a highway using landscape metrics in southern Iran. Front. Ecol. Evol. 9. doi: 10.3389/fevo.2021.721313
Morandi D. T., França L. C. D. J., Menezes E. S., MaChado E. L. M., Da Silva M. D., Mucida D. P. (2020). Delimitation of ecological corridors between conservation units in the Brazilian Cerrado using a GIS and AHP approach. Ecol. Indic. 115, 106440. doi: 10.1016/j.ecolind.2020.106440
Nielsen A., Bascompte J. (2007). Ecological networks, nestedness and sampling effort. J. Ecol. 95, 1134–1141. doi: 10.1111/j.1365-2745.2007.01271.x
Pan J., Wang Y. (2021). Ecological security evaluation and ecological pattern optimization in Taolai River Basin based on CVOR and circuit theory. Acta Ecol. Sin. 41, 2582–2595. doi: 10.5846/stxb202005111183
Panagopoulos T., González Duque J. A., Bostenaru Dan M. (2016). Urban planning with respect to environmental quality and human well-being. Environ. pollut. 208, 137–144. doi: 10.1016/j.envpol.2015.07.038
Peng J., Yang Y., Liu Y., Hu Y., Du Y., Meersmans J., et al. (2018). Linking ecosystem services and circuit theory to identify ecological security patterns. Sci. Total Environ. 644, 781–790. doi: 10.1016/j.scitotenv.2018.06.292
Peng J., Zhao H. J., Liu Y. X., Du Y. Y. (2016). Progress and conceptual framework of regional water security pattern construction. Acta Ecol. Sin. 36, 3137–3145. doi: 10.5846/stxb201503260580
Peterman W. E., Connette G. M., Semlitsch R. D., Eggert L. S. (2014). Ecological resistance surfaces predict fine-scale genetic differentiation in a terrestrial woodland salamander. Mol. Ecol. 23, 2402–2413. doi: 10.1111/mec.12747
Santos J. S., Leite C. C. C., Viana J. C. C., Dos Santos A. R., Fernandes M. M., de Souza A. V. (2018). Delimitation of ecological corridors in the Brazilian Atlantic Forest. al. Ecol. Indic. 88, 414–424. doi: 10.1016/j.ecolind.2018.01.011
Song T., Li D., Zhang L., Wang G., Gao Y., Yang C., et al. (2020). Importance evaluation of ecosystem services and construction of ecological security pattern in qinba mountain area. Chin. J. Eng. Sci. 22, 64. doi: 10.15302/J-SSCAE-2020.01.007
Su C., Dong J. Q., Ma Z. G., Qiao N., Peng J. (2019). Identifying priority areas for ecological protection and restoration of mountains-rivers-forests-farmlands-lakesgrasslands based on ecological security patterns: a case study in Huaying Mountain, Sichuan Province. Acta Ecol. Sin. 39, 8948–8956. doi: 10.5846/stxb201906111229
Sun L., Chen J., Li Q., Huang D. (2020). Dramatic uneven urbanization of large cities throughout the world in recent decades. Nat. Commun. 11, 5366. doi: 10.1038/s41467-020-19158-1
Sun F., Zhang J., Wang P., Wei G., Chu G., Cao Y. (2021). Construction and evaluation of urban ecological security pattern: a case study of Suzhou City. Geographical Res. 40, 2476–2493. doi: 10.11821/dlyj020200990
Vigiak O., Borselli L., Newham L. T. H., McInnes J., Roberts A. M. (2012). Comparison of conceptual landscape metrics to define hillslope-scale sediment delivery ratio. Geomorphology 138, 74–88. doi: 10.1016/j.geomorph.2011.08.026
Vogt P., Riitters K. H., Estreguil C., Kozak J., Wade T. G., Wickham J. D. (2007). Mapping spatial patterns with morphological image processing. Landsc. Ecol. 22, 171–177. doi: 10.1007/s10980-006-9013-2
Wang Q., Fu M., Wei L., Han Y., Quan Z. (2016). Urban ecological security pattern based on source-sink landscape theory and MCR model: A case study of Ningguo City, Anhui Province. Acta Scientiae Circumstantiae 36, 4546–4554. doi: 10.13671/j.hjkxxb.2016.0167
Wang Y., Jin X., Shen C., Bao G., Liu J., Zhou Y. (2019). Establishment of an ecological security pattern in the eastern developed regions: A case study of the Sunan District. Acta Ecol. Sin. 39, 2298–2310. doi: 10.5846/stxb201802050308
Winkler K. J., Viers J. H., Nicholas K. A. (2017). Assessing ecosystem services and multifunctionality for vineyard systems. Front. Environ. Sci. 5. doi: 10.3389/fenvs.2017.00015
Wu J., Yue X., Qin W. (2017). The establishment of ecological security patterns based on the redistribution of ecosystem service value: A case study in the Liangjiang New Area, Chongqing. Geographical Res. 36, 429–440. doi: 10.11821/dlyj201703003
Wu J., Zhang S., Luo Y., Wang H., Zhao Y. (2022). Assessment of risks to habitat connectivity through the stepping-stone theory: A case study from Shenzhen, China. Urban. For. Urban. Gree. 71, 127532. doi: 10.1016/j.ufug.2022.127532
Wu L. J., Zhou Q. G., Li H., Luo H. R., Mao Y. F., Zhu K. W., et al. (2024). Identification of key areas for ecological protection and restorationBased on circuit theory:A case study of liangping district in chongqing city. Areal Res. Dev. 43, 153–160. doi: 10.3969/j.issn.1003-2363.2024.02.023
Xu F., Yin H., Kong F., Xu J. (2015). Developing Ecological Networks based on MSPA and Least-cost Path Method in Bazhong western new district. Acta Ecol. Sin. 35, 6425–6434. doi: 10.5846/stxb201402130248
Yao Y., Huang Y., Lin J., Jiang F., Guan J., Ji X. (2022b). Benggang (collapsing hill) erosion hazard zoning based on the minimum cumulative resistance model: A case study of a small watershed in Anxi County, Fujian, China. Chin. J. Appl. Ecol. 33, 1370–1376. doi: 10.13287/j.1001-9332.202205.020
Yao Z., Jiang C., Zong-Cheng C., Shi-Yuan Z., Guo-Dong Z. (2022a). Construction of ecological security pattern based on ecological sensitivity assessment in jining city, China. Pol. J. Environ. Stud. 31, 5383–5404. doi: 10.15244/pjoes/151866
Yu J., Tang B., Chen Y., Zhang L. (2022). Landscape ecological risk assessment and ecological security pattern construction in landscape resource-based city: A case study of Zhangjiajie City. Acta Ecol. Sin. 42, 1290–1299. doi: 10.5846/stxb202012313341
Yuan Y., Bai Z. K., Shi X. Y., Zhao X. J., Zhang J. N., Yang B. Y. (2022). Determining priority areas for ecosystem preservation and restoratiorof territory based on ecological security pattem: A case study in Zunhua City, Hebei Province. Chin. J. Ecol. 41, 750–759. doi: 10.13292/j.1000-4890.202203.031
Zawadzka J. E., Harris J. A., Corstanje R. (2021). Assessment of heat mitigation capacity of urban greenspaces with the use of InVEST urban cooling model, verified with day-time land surface temperature data. Landscape Urban Plan. 214, 104163. doi: 10.1016/j.landurbplan.2021.104163
Zhang X. (2021b). Study on identification of key areas for ecological protection and restoration in resource-exhausted region: take dayu county, jiangxi as an example. J. Ecol. Rural Environ. 37, 1031–1040. doi: 10.19741/j.issn.1673-4831.2020.0872
Zhang W., Fu Y., Wang X. (2023a). Construction of ecological security pattern in xinzhou city based on evaluation of ecosystem service value. Res. Soil Water Conserv. 30, 355–364. doi: 10.13869/j.cnki.rswc.2023.04.008
Zhang Y., Jiang Z., Li Y., Yang Z., Wang X., Li X. (2021a). Construction and optimization of an urban ecological security pattern based on habitat quality assessment and the minimum cumulative resistance model in shenzhen city, China. Forests 12, 847. doi: 10.3390/f12070847
Zhang Y., Xu D., Li X., Zhang X. (2020). Construction of ecological corridors and identification of key nodes in the core area of China-Laos transportation corridors. Acta Ecol. Sin. 40, 1933–1943. doi: 10.5846/stxb201904040660
Zhang H. L., Ye Z. S., Hu M. S. (2023b). Identification and restoration strategy of key areas of ecological restoration in urban agglomeration around poyang lake based on ecological security pattern. Res. Soiland Water Conserv. 30, 393–402. doi: 10.13869/j.cnki.rswc.2023.02.012
Zheng Y., Tang P., Dong L., Yao Z., Guo J. (2024). Evaluation of ecological carrying capacity and construction of ecological security pattern in West Liaohe River Basin of China. Front. Ecol. Evol. 12. doi: 10.3389/fevo.2024.1335671
Zhong B., Wu S., Wu N., Sun G., He C., Liu L., et al. (2024). Constructing ecological security pattern based on spatio-temporal evaluation of ecosystem services and ecological health in Chengdu, Southwest China. Front. Environ. Sci. 12. doi: 10.3389/fenvs.2024.1415301
Keywords: ecological security pattern, ecological network, InVEST model, minimum cumulative resistance model, circuit model, Qinba-Dabie intersection zone
Citation: Zhang S, Chen Y, Li J, Ye Q, Chen W, Wang X, Wei H, Jiang Q and Guo L (2024) A spatiotemporal analysis framework of the ecological security pattern based on the ecological “source–surface–corridor” and its implications. Front. Ecol. Evol. 12:1480198. doi: 10.3389/fevo.2024.1480198
Received: 13 August 2024; Accepted: 30 October 2024;
Published: 18 November 2024.
Edited by:
Franco Leandro de Souza, Federal University of Mato Grosso do Sul, BrazilReviewed by:
Huiqing Han, Guizhou Institute of Technology, ChinaKun Jia, Shandong Jianzhu University, China
Shanzhong Qi, Shandong Normal University, China
Copyright © 2024 Zhang, Chen, Li, Ye, Chen, Wang, Wei, Jiang and Guo. This is an open-access article distributed under the terms of the Creative Commons Attribution License (CC BY). The use, distribution or reproduction in other forums is permitted, provided the original author(s) and the copyright owner(s) are credited and that the original publication in this journal is cited, in accordance with accepted academic practice. No use, distribution or reproduction is permitted which does not comply with these terms.
*Correspondence: Jiwei Li, bGlqaXdlaUBoZW5hdS5lZHUuY24=
 Shuai Zhang
 Yihao Chen1
 Jiwei Li
 Weiqiang Chen
 Hejie Wei
 Long Guo