 Timothy R. McClanahan
 Erwan Sola
- 1Wildlife Conservation Society, Global Marine Programs, Bronx, NY, United States
- 2Wildlife Conservation Society, Mozambique Country Program, Maputo, Mozambique
Introduction: Predictive models based on environmental proxy data are being used to predict biodiversity on large and even global scales. Yet, some of the underlying assumptions about the relationship between proxy variables and predictions require investigations and testing the consequences of using model alternatives, data sources, variables choices, and scales, extent, and overlap among the predictions. Mozambican coral reefs provide a good case study to test these assumptions given the paucity of field data, its long coastline, and transitions from tropical to temperate environments.
Methods: Three modelling formulations and 5 specific models were made using satellite and shipboard measurements and extensive fish and corals field data to test their performance in predicting numbers of fish species and coral taxa from field data. Model predictions were mapped for the 1180 ~6.25 km2 Mozambican coral reef cells. Predictions were made and mapped 1) based on ~1000 field sites in the Western Indian Ocean (WIO) faunal province model, 2) using environmental variable selected in the WIO model (WIOMOD) but trained only with Mozambican field data (<113 sites), and 3) using only Mozambican environmental and field data and standard variable redundancy and selection procedures.
Results and discussion: Training and testing cross validation of models indicated modest predictive ability (R2~0.42-0.56%) and reasonable transferability. Consequently, there was unexplained variation likely due to small-scale environmental variability finer than the mapped cell scale. Differences between model predictions were caused by different variable rankings and response relationship. For example, the Mozambique-only model predicted more fish but fewer coral taxa, a larger role of water quality and sediments, habitats, and temperature variation, and a lesser role of human influence than the WIOMOD. Therefore, differences between models indicate that large scale models (i.e. provincial or global) can contribute to understanding gross patterns but miss important local environmental and human drivers in transitional environments. Nevertheless, 79% of the fish and 88% of coral taxa cell-level predictions of taxonomic diversity had standardized coefficients of variations of <10%.
1 Introduction
Developments in environmental data availability, predictive modelling, and subsequent increases in spatial resolution provide emerging analytical technologies to evaluate and predict biodiversity (Araújo and New, 2007; Kuhn and Johnson, 2013; Yeager et al., 2017). In the absence of spatially complete field data, these tools can provide key information to make predictions for spatial planning (Pilowsky et al., 2022). Yet, comparisons of models are needed to consider the sources of variability among modelling platforms, data sources and density, and choices of variables that influence the scales and extent of the predictions. Comparing model options and performances stimulates several questions for understanding the consequences of model predictions. These comparisons are necessary as models influence important decisions, such as the location of managed and protected areas and predictions with changes in human pressure and climate (Wiens et al., 2009; Pressey et al., 2021). In many locations, the ability to make models with accurate predictions is limited, particularly in poor countries with limited data and analytic capacity. An important question therefore is how best to address the performance of spatial modelling predictions in these resource limited environments.
The coast of Mozambique is classified biogeographically as three separate geographic units associated with three ecoregions (Figure 1; Supplementary Table S1). These are the East African Coral Coast in the north, the Bight of Sofala/Swamp Coast in the middle, and the Delagoa ecoregion in the south. Mapping of coral reefs indicates a complex of island structures in northern Mozambique where many reefs are located around island edges of the Quirimbas Archipelago seascapes in the Cabo Delgado Province and fringing the coast or around the islands of the Primeiras and Segundas Archipelago in the Nampula Province (Burke et al., 2011). Around 80% of the coral reefs are in the north and missing south of Primeiras and Segundas Archipelago until the Delagoa region where there are scattered reefs on islands and patch reefs along the coastline south until the South African border. Published biodiversity distributions of the Mozambican coastline have used species distribution presence/absence interpolation methods to develop coarse scale maps (Selig et al., 2014; Jenkins and Van Houtan, 2016; Bullock et al., 2021). These inferential methods and associated maps produce coarse species and biodiversity distributions predictions. This makes it difficult to differentiate patterns of biodiversity on the finer scales required for protected areas and conservation planning at the national scale.

Figure 1. Map of the locations of the field study sites in Mozambique differentiating fish and coral sampling sites.
Mozambique provokes some key questions concerning the modelling of biodiversity. Specifically, if empirical environment- biodiversity proxy models are transferable to predict biodiversity beyond the conditions for which they were originally created (Wenger and Olden, 2012). For example, interpolations and transferability have been the focus of niche models’ predictions and recommendations under the influences of climate change (Wiens et al., 2009; Kujala et al., 2013; Pinsky et al., 2020; Couce et al., 2023). However, there are other more technical questions such as if the density of data is sufficient to make predictions at larger scales (Kusumoto et al., 2020; Dornelas et al., 2023). There are clearly tradeoffs in the resolution and accuracy of models as they change from local to global scales and vice versa, with consequences for conservation planning (Araújo et al., 2005; Barbosa et al., 2010; Van Wilgenburg et al., 2024). There is also the related question of transferability of model outputs or the performance of predictive models when large models are used in nearby locations where data are sparse (Boser, 2024). Differences among model predictions are expected to be most acute in these types of transitional environments and national border regions (Hughes et al., 2021). Finally, do standard variable selection mechanisms and machine learning algorithms have the capacity to predict biodiversity beyond the training and testing of the data sources and what level of variation or uncertainty occurs when transferred. Given the reality of limited information and tradeoffs, these questions are best addressed prior to the decision-making process to establish some levels of confidence around predictions. To address these questions in the Mozambique context, we examined three environment-biodiversity model decisions that are commonly made by spatial modelers and ask how confident we can be about the spatial predictions.
The specific goal of this study was to consider the consequences of common modeling choices when proposing key marine nearshore biodiversity areas for the national planning of Mozambican coral reefs. In Mozambique, the locations of high coral reef diversity areas are largely unknown and yet they are a major focus of biodiversity planning. To assist this process, we created and compared several key variations of predictive models of numbers of fish and coral taxa to better understand the consequences of modelling choices when predicting high biodiversity locations. This was done in the context of a larger Western Indian Ocean (WIO) faunal province model (WIOMOD) created from a larger environmental and field survey database of which Mozambique data was a small contribution (McClanahan et al., 2024a). The concern or hypothesis was that the larger provincial model would exhibit a bias favoring predictions for the southern equatorial coral reefs of the WIO where most of the data were collected. Therefore, WIOMOD might poorly predict the geographic changes in environmental conditions that exist along this ca. 2700 km national Mozambican coastline (Rodrigues et al., 2000). Therefore, we tested the hypotheses that large geographic models fail to adequately represent data-poor transitional tropical to temperate environments as potentially exemplified by our study of Mozambique.
2 Materials and methods
2.1 Study location
Distributions of biodiversity of coral reef species in the WIO Province is highest in the East African Coral Coast Ecoregion with the largest peak ~10°S or the Tanzanian-Mozambique national border (McClanahan, 2023). Patterns of biodiversity can, however, be quite variable along shorter distances of the coast due to local variation in environmental conditions (McClanahan and Muthiga, 2017). Therefore, the long coastline of Mozambique represents an environmental transition appropriate for testing the performance of models along an equatorial to more temperate influenced coastline. Moreover, data collection relative to the length of the coastline is limited allowing us to address the efficacy of using limited data to test modelling choices at multiple scales.
2.2 Data sources and response variables
Our goal was to provide a finer spatial resolution map of Mozambique coral reefs. A map based on environmental factors rather than past interpolations of presence/absence species distribution information. Past interpolation methods have produced coarse-scale maps that can be sensitive to the density of data, and therefore problematic for making good predictions in poorly sampled regions (Kusumoto et al., 2020). We therefore used environmental information as a proxy for predicting numbers of species for the 1180 6.25 km2 mapped reef cells in Mozambique (Burke et al., 2011). This environment-taxa machine learning prediction methodology was then investigated for the consequences of some common modelling choices (see Figure 2 for the analysis flowchart). Our method used satellite and shipboard environmental variables found to be associated with biodiversity (Tyberghein et al., 2012; Yeager et al., 2017; McClanahan et al., 2024a, 2024b). Several models based on provincial and country-level data were examined, and their predictions compared to establish variation and confidence around the mapped cells’ 6.25 km2 biodiversity predictions.
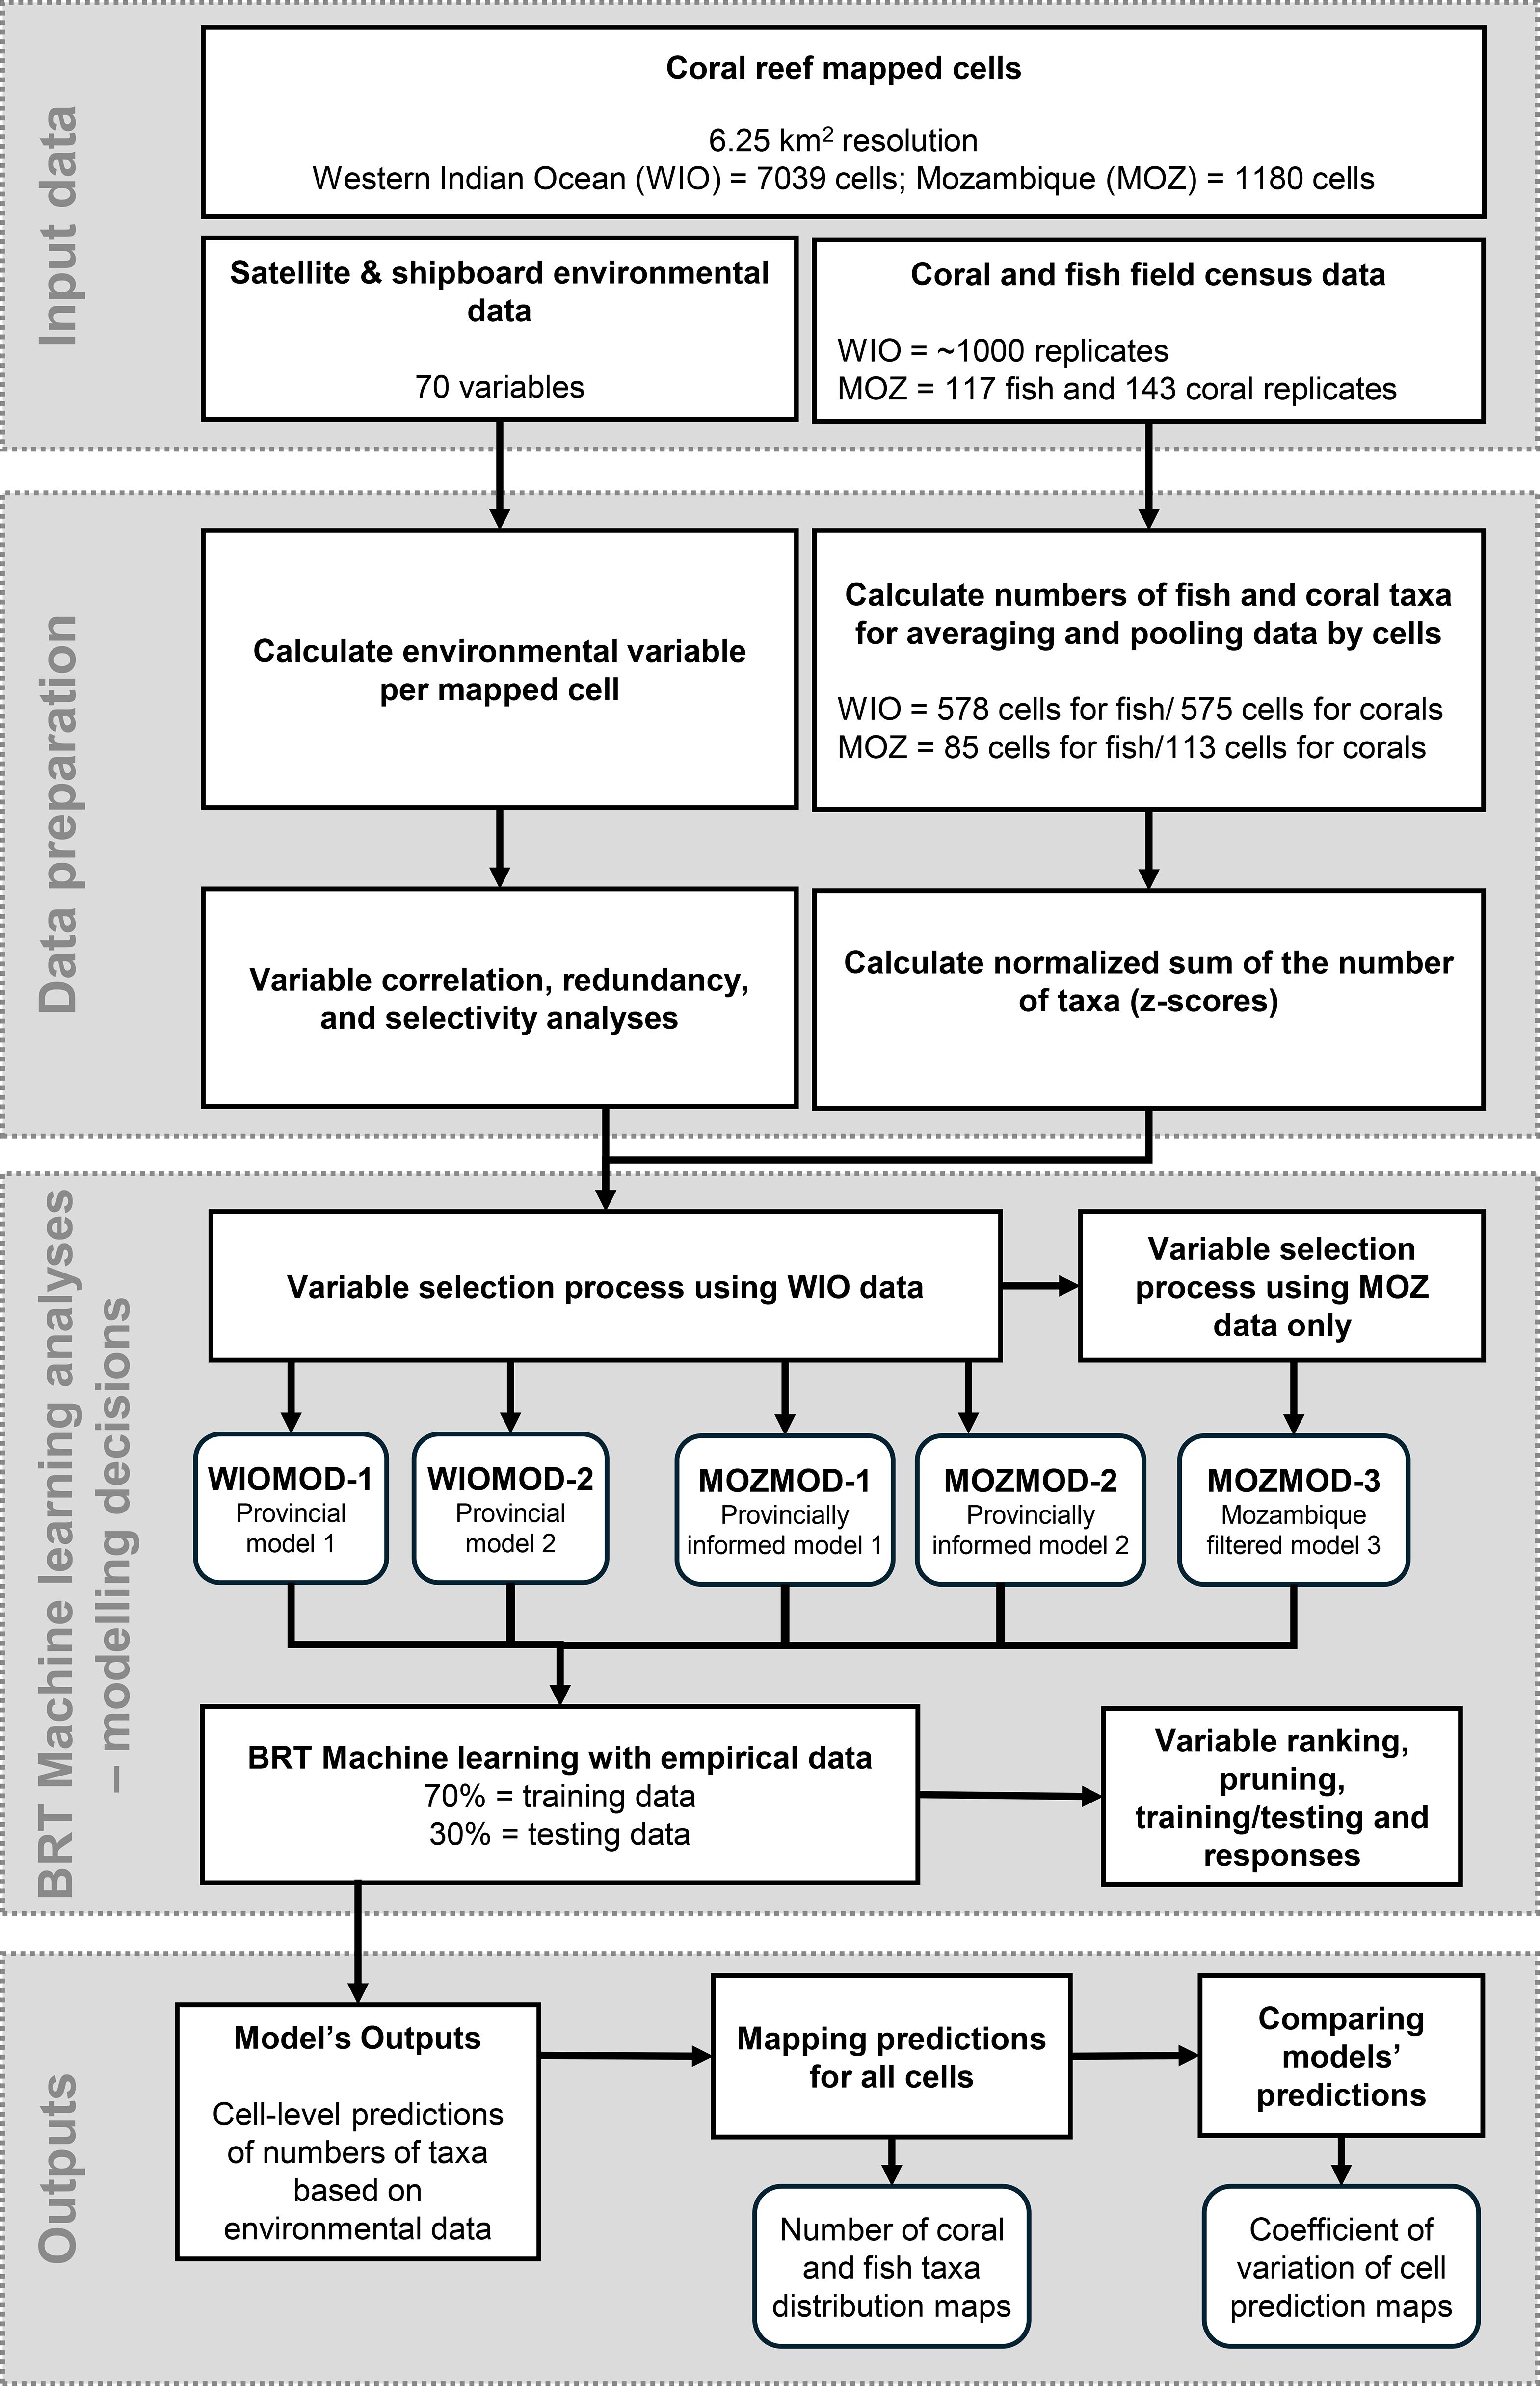
Figure 2. Flowchart showing the various steps of the data analysis and modeling process. Note that the Provincial models (WIOMOD-1 and 2) were developed using the entire WIO dataset. The Mozambique models MOZMOD-1 and 2 included only Mozambique data but used the variables selected for the WIOMOD. MOZMOD-3 used only Mozambique data and independently filtered variables.
The source of environmental and the number of fish and coral taxa data sources are described in the supplement (Supplementary Material, Supplementary Tables S2, S3). The key information is that 70 spatially complete environmental data layers derived from satellite and shipboard measurements were compiled. Variables were derived from numerous sources and included a mix of thermal (i.e., temperature and light), water chemistry (pH, calcite, dissolved oxygen), water quality (sediments, plankton, nutrients, and productivity), larval connectivity, fisheries management, and distance to humans (Maina et al., 2011; Tyberghein et al., 2012; McClanahan et al., 2015; Maire et al., 2016; Yeager et al., 2017; Andrello et al., 2022; Fontoura et al., 2022). Similarly, fish and coral field census data were taken from published methods and experienced observers (McClanahan et al., 2007; 2021; Friedlander et al., 2012), as well as new data collected in this study for Mozambique (Sola, E. unpublished data). The two WIOMODs were based on ~1000 replications of both fish (number of species in five diverse families per 500 m2) and coral (taxa per 40 m2). The Mozambique data was based on the smaller sample of 117 fish and 143 field sites. The WIO data and model were used to identify high biodiversity areas and to compare this modelling approach with past consultancy-based prioritization and protected area activities (McClanahan et al., 2024a).
Fish and coral field data from Mozambican study sites that fell inside the same reef cells were pooled and averaged, which reduced the number of fish replicates from 117 to 85 and coral replicates from 143 sites to 113 cells. In the case of the WIO provincial data, fish field samples were reduced from 1201 field sites to 578 cells and coral field samples from 1001 sites to 575 cells. This pooling of field samples to grid cells is expected to reduce spatial autocorrelation and make predictions specific to the cell and not the level of the field sampling. The proxy for total number of species was the normalized sum (z-scores) of the number of taxa in the fish and coral samples. To determine if they were positively related and potentially useful as a proxy for total numbers of species, regression analyses were performed on the empirical data, the predictions of the provincial model, the provincially informed Mozambique model, and the variable filtered model described below.
2.3 Data analyses
Several scientific advances have allowed finer-scale predictions and maps of marine biodiversity (Kuhn and Johnson, 2013; Pilowsky et al., 2022). These include: 1) moderate resolution (i.e., <10 km2) but large-scale mapping of coral reefs, 2) global satellite coverage of environmental variables and proxies (<10-km steps), and 3) statistical machine learning algorithms. Specifically, we used Boosted Regression Tree (BRT), which combines regression trees and boosting of many simpler models. BRT is a machine learning methods that uses large sets of empirical data to make predictions with large and complex data sets. BRT can handle large amounts of complex and interactive predictors and response data to make specific or non-probability predictions (Elith et al., 2008). BRT classification and tree methods allow nonlinear relationships, missing values in covariates, interactions between predictors, and produce high predictive performance (Kuhn and Johnson, 2013). BRT that uses environmental data have been shown to improve predictions of numbers of taxa compared to traditional rarefaction techniques (McClanahan et al., 2024b).
Five models that used the data-dependent BRT methods to evaluate the number of coral reef taxa. Two of the models were number of taxa predictions from the provincial or WIOMOD (McClanahan et al., 2024a). This model included small percentage (~10%) of field data from Mozambique. The 3 Mozambican models used different variable selection processes, but all used only Mozambican environmental and field species census data. For example, Mozambique Model 1 and 2 (MOZMOD-1 and MOZMOD-2) used the variables selected in the two WIOMOD versions but fit the environmental data to Mozambican field data. The third Mozambican model (MOZMOD-3) used an independent variable selection process and Mozambican field data that we refer to as the filtered Model 3. The filtered variable process is a default procedure for selecting variables where many potentially correlated variables are being considered to avoid overfitting when data are limited (Kuhn and Johnson, 2013).
Overfitting was addressed by reducing variables by two methods: namely standard variable redundancy and selection and the BRT selection and pruning process. For the variable selection process, both the regional and filtered model used a correlation cutoff of >0.70 and retained uncorrelated variables (Dormann et al., 2013) (Supplementary Figure S1). The (caret) package version (6.0-93) in the R statistical programming language was used for the variable selection, classification, and regression training. This reduced the considered variables from 70 to 36. Some variables removed from the selection cutoff but suspected of causation were retained to create an alternative and ensemble models when suspected of possible causation (Araújo and New, 2007). For example, water temperature variables such as skewness, bimodality, and kurtosis were highly correlated but represent different types of thermal stress. Therefore, Mozambique Model 1 included kurtosis but not skewness or bimodality whereas Model 2 included skewness and bimodality but not kurtosis (Supplementary Table S2). Additionally, human gravity (=population density/distance + constant)2 and travel time were correlated metrics and therefore Mozambique Model 1 used travel time and Model 2 used gravity. The BRT algorithm selects the importance of the variables based on the relative importance of the variables rank. This process further reduced the variables to 26 for Model 1 and 27 for Model 2. The effect of variable pruning was tested and described in the supplement (Supplementary Figure S2) as well as the BRT model settings (Supplementary Figure S3). The variable pruning process helps to reduce excess variables relative to the amount of data. However, our analyses found variable pruning had a minor effect on variable selection and model predictions.
To make fair comparisons of numbers of species between cells it was necessary to hold some variables constant. For example, fishing effort reduces biomass and is not uniform but an important predictor of number of fish species (McClanahan, 2019, 2022). Therefore, fish biomass was held constant and above a saturation point. Further, numbers of species may be influenced by the sampled area, water depth, and the observer/method. Depth and biomass response relationships were examined to determine where peak or saturation points occurred. These were 600 kg/ha and a depth of 10 m. Therefore, predictions for all cells were those for a fish biomass of 600 kg/ha and 10 m depth. For the observer and transect size effect, we chose the model’s predictions for 500 m2, which was the size of most transects. Partial effect predictions of the BRT allow for comparable solutions without eliminating replicates when these variables are held constant.
2.4 Mapping biodiversity and priorities
The BRT model predictions of numbers of coral taxa, fish species, and the two combined were mapped in all 1180 6.25 km2 Mozambican reef cells. Mapped reef cells are the averages of the ensemble models using the normalized average z-scores of fish and coral weighted by their R2 values.
3 Results
3.1 Model fits
Fits of the models to species survey census data indicated a stronger fit and lower RMSE for the large-data provincial models compared to both the informed and filtered Mozambique models (Supplementary Table S4). For example, the two WIOMOD’s training-testing validation R2 were between 0.55 and 0.64 with higher fits to the fish (R2 = 0.62-0.64) than the coral data (R2 = 0.55-0.56). The pruned and unpruned Mozambique models had similar modest fits (R2 = 0.43).Therefore, keeping or pruning weak variables had no clear effect on predictive strengths.
Mozambique models informed by the WIOMOD variables selections did not clearly improve fits relative to the standard filtered model (informed R2= 0.51 and filtered R2= 0.48). Therefore, standard variable filtering using uniquely Mozambique environmental and field data, performed as well as an informed variable selection process despite some differences among the variable ranks and number of variables selected. For the fish model, the two BRT provincially-informed models (MOZMOD-1 and 2) selected 10 and 11 large effect variables whereas the filtered Model 3 selected 17 (Figure 3). For corals, there were fewer difference with the provincially-informed models selecting 14 and 15 large effect variables whereas the filtered Model 3 selected 12 variables. Therefore, the models’ predictive strengths remained similar regardless of the number of variables selected.
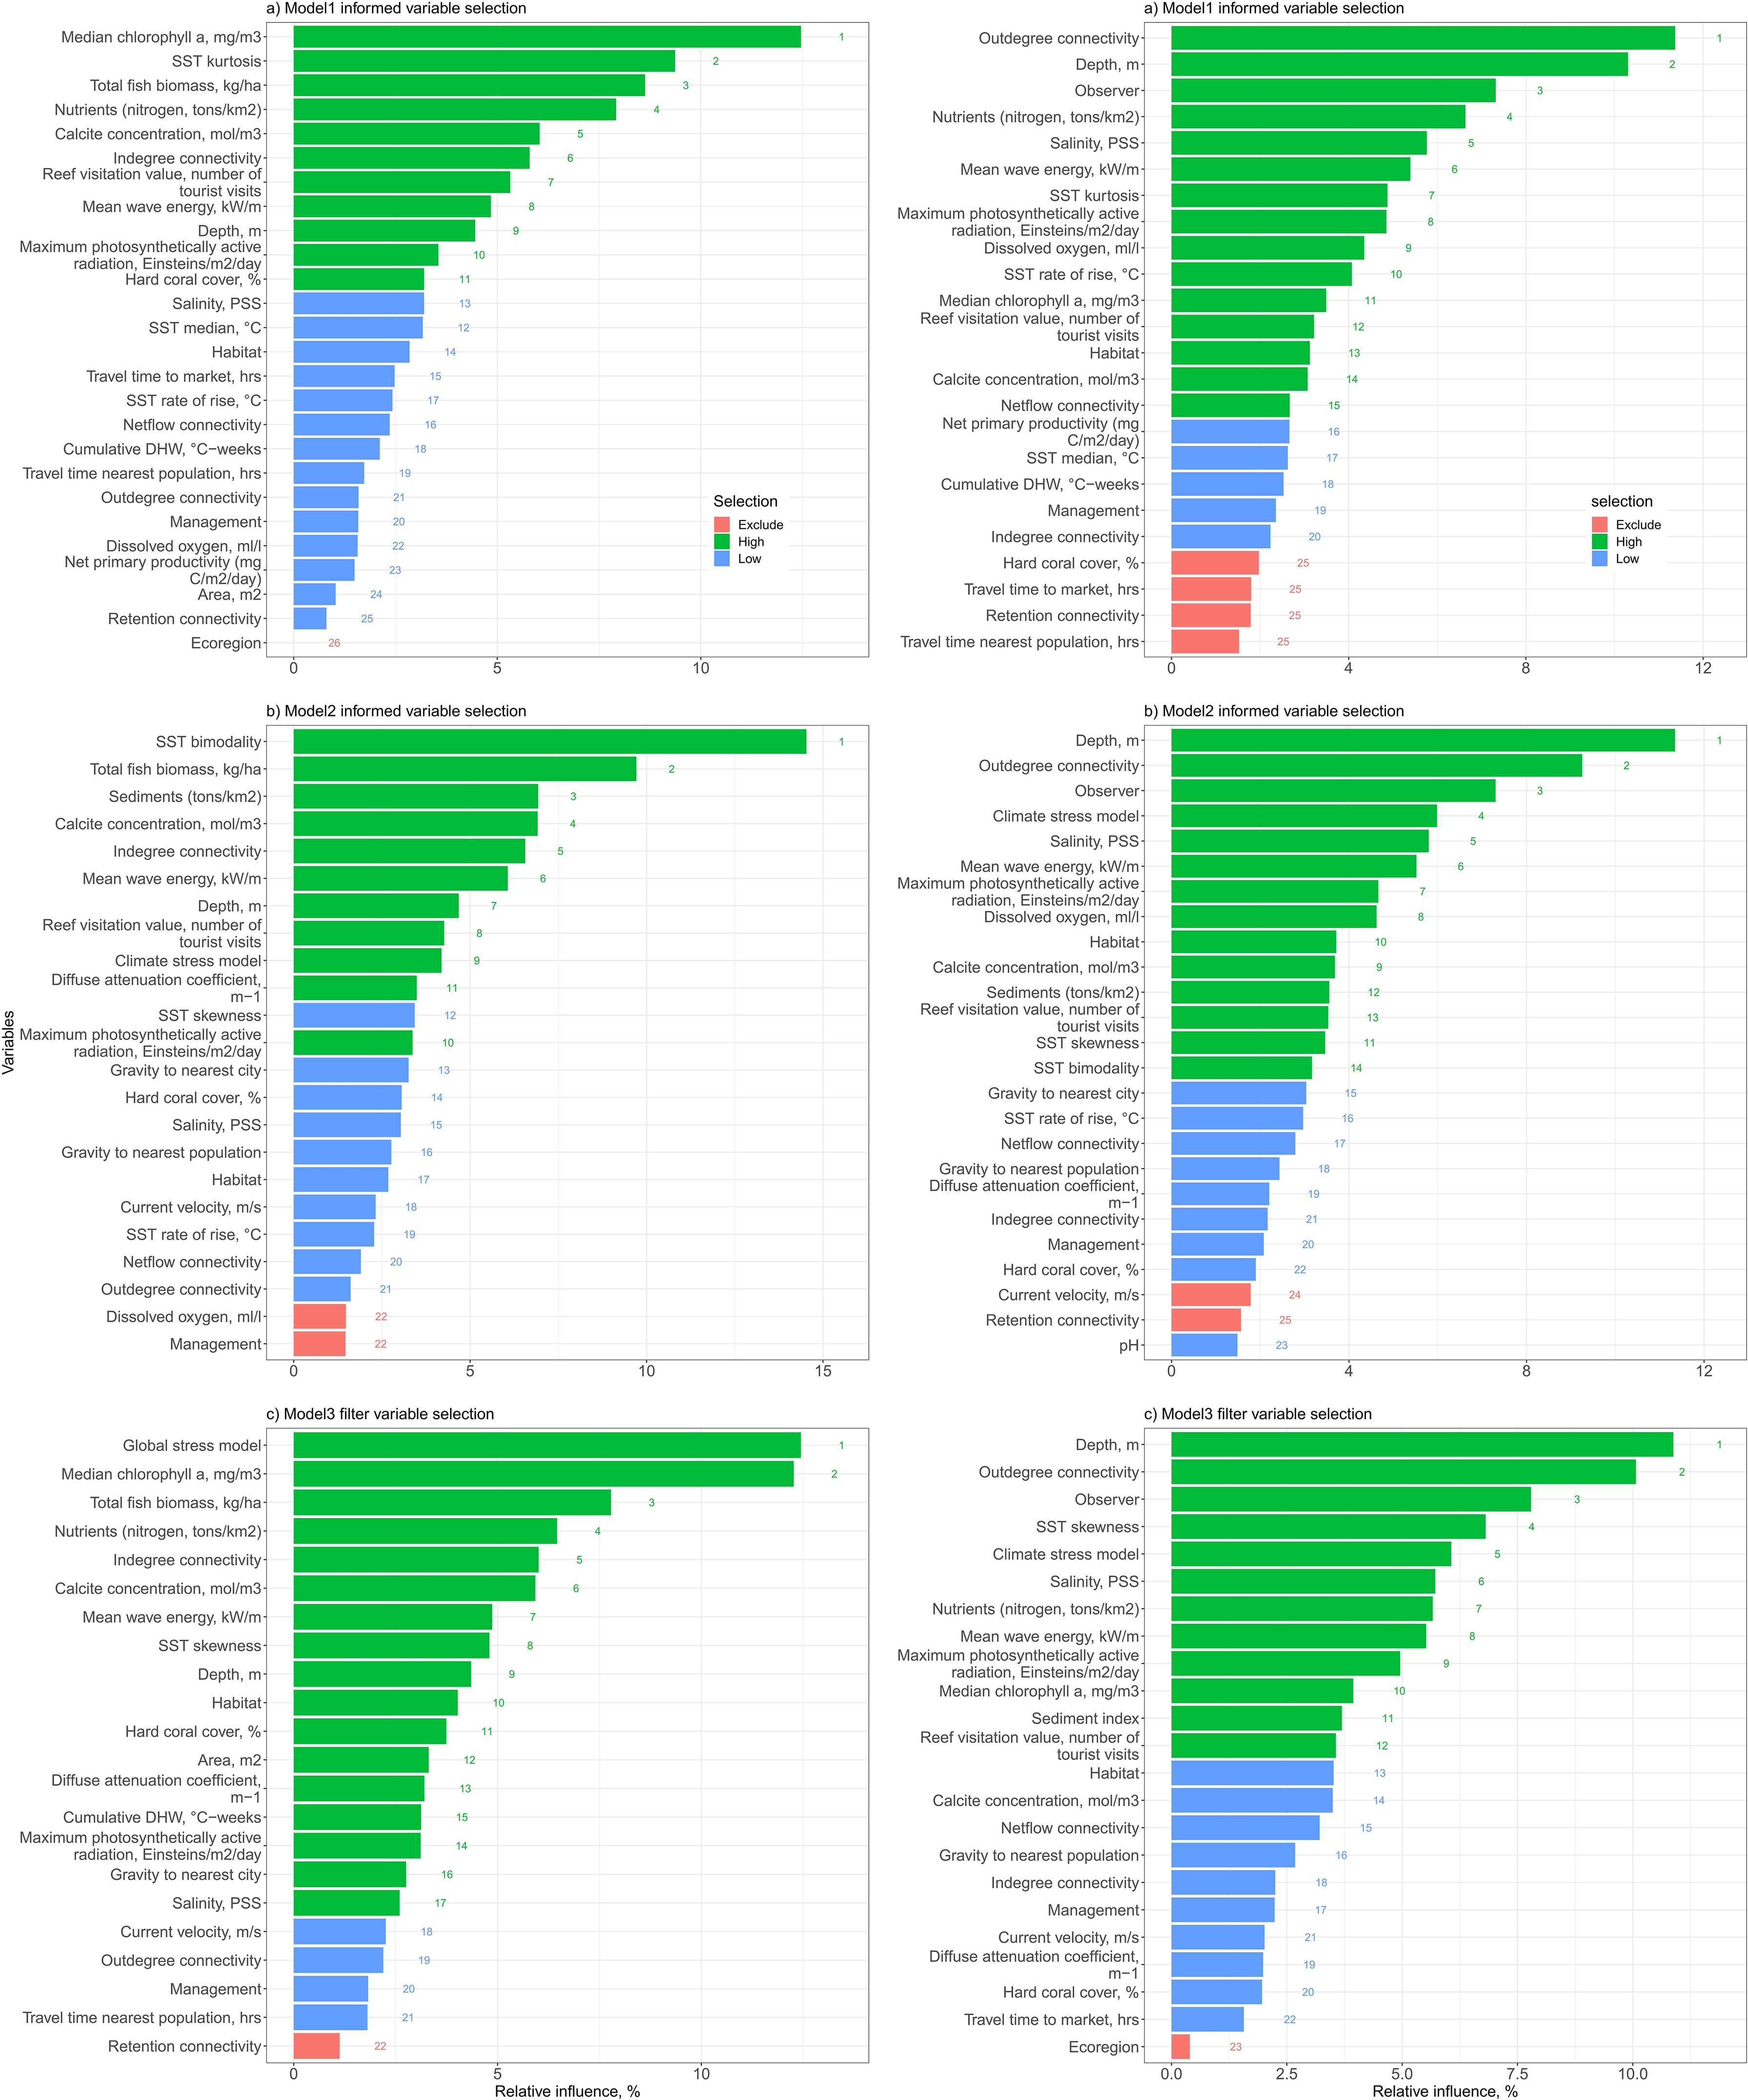
Figure 3. Relative importance of evaluated variables among three Mozambique models based on BRT recursive elimination. MOZMOD-1 (A) and MOZMOD-2 (B) were informed by provincially important variables whereas MOZMOD-3 (C) independently filtered variables prior to testing for fits to data. Shown are rankings and relative importance of BRT selected variables for (left) fish and (right) coral. Relative importance and BRT classifications shown for high, low, and excluded variables. The low and excluded variables were removed for testing the pruned models.
The WIOMODs predicted fewer fish species than the Mozambican models (41.8 versus ~45.0 species) but more coral taxa (24.3 versus 23.4 taxa per 40 m2) than the Mozambican models. Comparing the three Mozambican models indicated that fish species declined somewhat from MOZMOD-1 to 3 from 46 to 45 to 44 species per 500 m2. MOZMOD-1 predicted the lowest number of coral taxa (22.8 taxa per 40 m2) while MOZMOD-2 and 3 predicted similar numbers (~23.6 taxa per 40 m2).
3.2 Variable strengths and selection
3.2.1 The WIO model
Fish biomass was the strongest variable predicting numbers of fish species in WIOMOD versions 1 and 2 (Table 1; Figure 3; Supplementary Figure S4A). The other top variables in order of importance were median temperatures, pH, distance to people, retention connectivity, SST kurtosis and skewness, primary productivity, photosynthetically active radiation, and depth. Variables were ranked similarly in the two models and the differences resulted from the inclusion or exclusion of highly correlated variables. Therefore, numbers of fish species was largely influenced by the two interrelated variables of biomass and nearness to people, temperature and its variability, ocean productivity, larval retention connectivity, and depth.
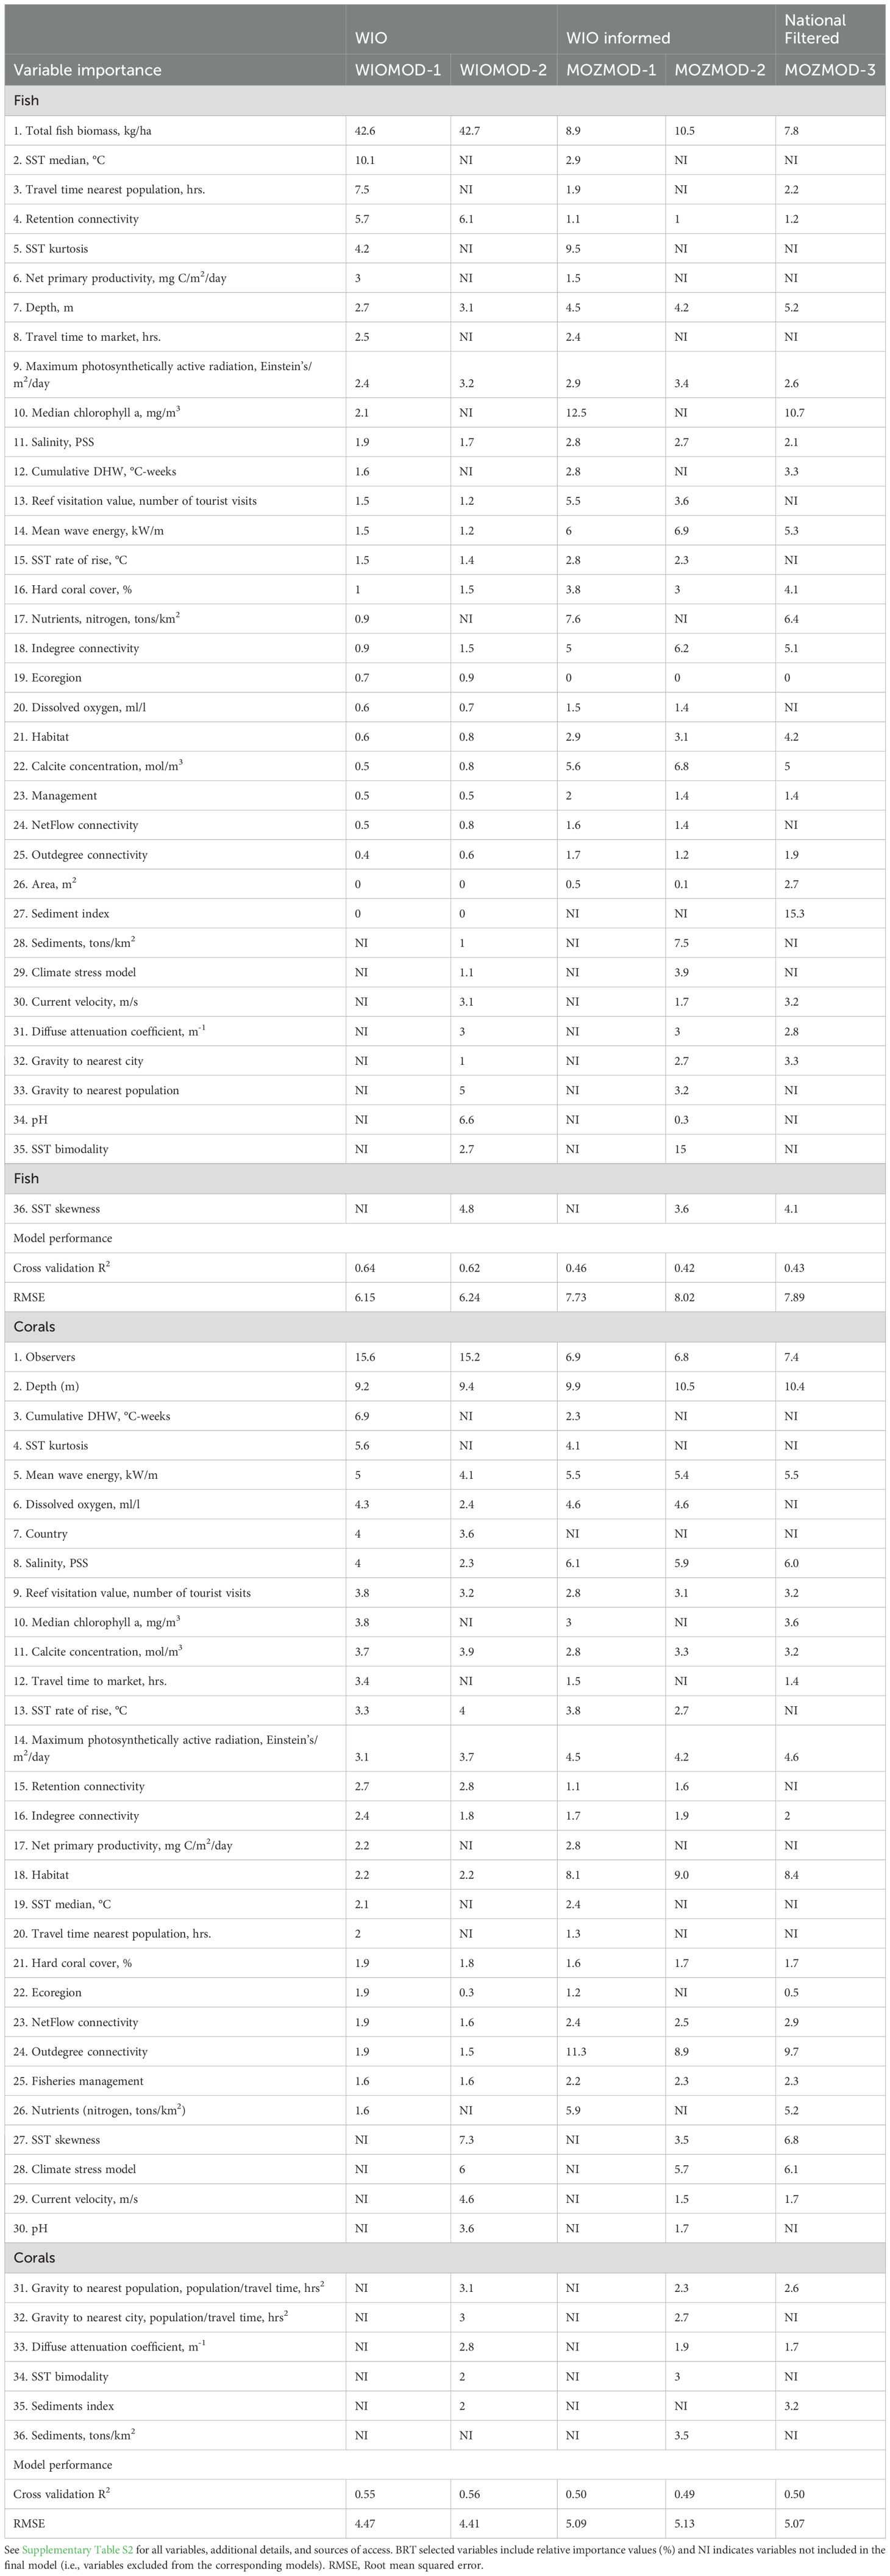
Table 1. Results of the BRT relative contributions (%) of selected variables for numbers of (a) fish and (b) corals taxa for the 5 evaluated models (M) and their respective R2 fits of models using cross validation methods (see methods).
For numbers of corals taxa, observer and depth were the two top-ranked variables. The uncorrelated variables of currents, waves, dissolved oxygen, photosynthetically active radiation, rate of rise in SST, calcite, and salinity were among the medium ranked variables. Lower ranked variables were the water quality as reflected in chlorophyl-a and sediments concentrations, human influences, and various connectivity metrics.
3.2.2 The Mozambique models
For the number of fish species, training-testing cross validations of three Mozambique models R2 ranged from 0.42 to 0.46. The highest ranked variables in the provincially- informed models 1 and 2 were a mix of biomass, water temperature (SST bimodality or kurtosis), nearness to people (reef visitation), water quality metrics (sediments, chlorophyll, nitrogen), calcite, larval indegree flow, depth, and waves (Supplementary Table 4). In contrast, the filtered Model 3 picked water quality as more important than fish biomass with the sediment and chlorophyl-a as the top two ranked variables, followed by biomass and nutrients as the fourth rank. Temperature, human influences, and connectivity metrics were less important contributions to numbers of species. Therefore, most of the variability among the three Mozambican models is attributable to the filtered Model 3.
For corals, cross validation R2 for the three models were similar (0.49 and 0.50) (Table 1). There were also strong similarities among the most important variables in the three models but more differences in the medium ranked variables (Figure 3). For example, depth, habitat, outdegree of larval flow, and observer were the top 4 ranked variables in all three models with minor differences in their rank positions. Differences in the models based on the inclusion or exclusion of variables also appeared to have minor effects. Many variables were selected as low importance in all three models, including larval net flow, management, larval flow indegree, coral cover, market gravity, light attenuation, and travel time to the site. In contrast to fish, the coral filtered Model 3’s most important variables were not easily distinguished from the provincially informed models. One exception was SST skewness as it was ranked higher in the filtered than in the other models. Another minor difference was that the filtered model selected fewer high importance variables than the two informed models.
Connectivity metrics were uniquely different when comparing Mozambican numbers of fish and coral taxa. For example, outdegree was the 2nd strongest ranked variables for the filtered coral Model 3 while indegree was ranked 5th and the highest connectivity variable for fish. Both connectivity variables were not ranked highly in the WIO province (Supplementary Figure S4). The other metrics of connectivity were similarly weak and showed variable responses between the categories of fish and coral and Mozambique and the WIOMODs. Pruning variables had little effect on the predictions (Supplementary Figure S6).
3.3 Response relationships between the environment and numbers of taxa
Responses to environmental variables generally aligned with ecological theory and empirical studies (Figure 4; Supplementary Figure S5). For example, numbers of fish species increased and saturated with fish biomass, indegree connectivity, distance from people and cities, and declined with SST variability and poor water quality (Figure 4A). Numbers of coral taxa increased with depth and thermal radiation (Global Thermal Stress) and declined with increased salinity, declining water quality, wave energy, and rare warm temperatures (skewness) (Figure 4B). Responses among the three Mozambique models often followed each other closely but deviated from the number of taxa predicted by the provincial models, although usually by <15%.
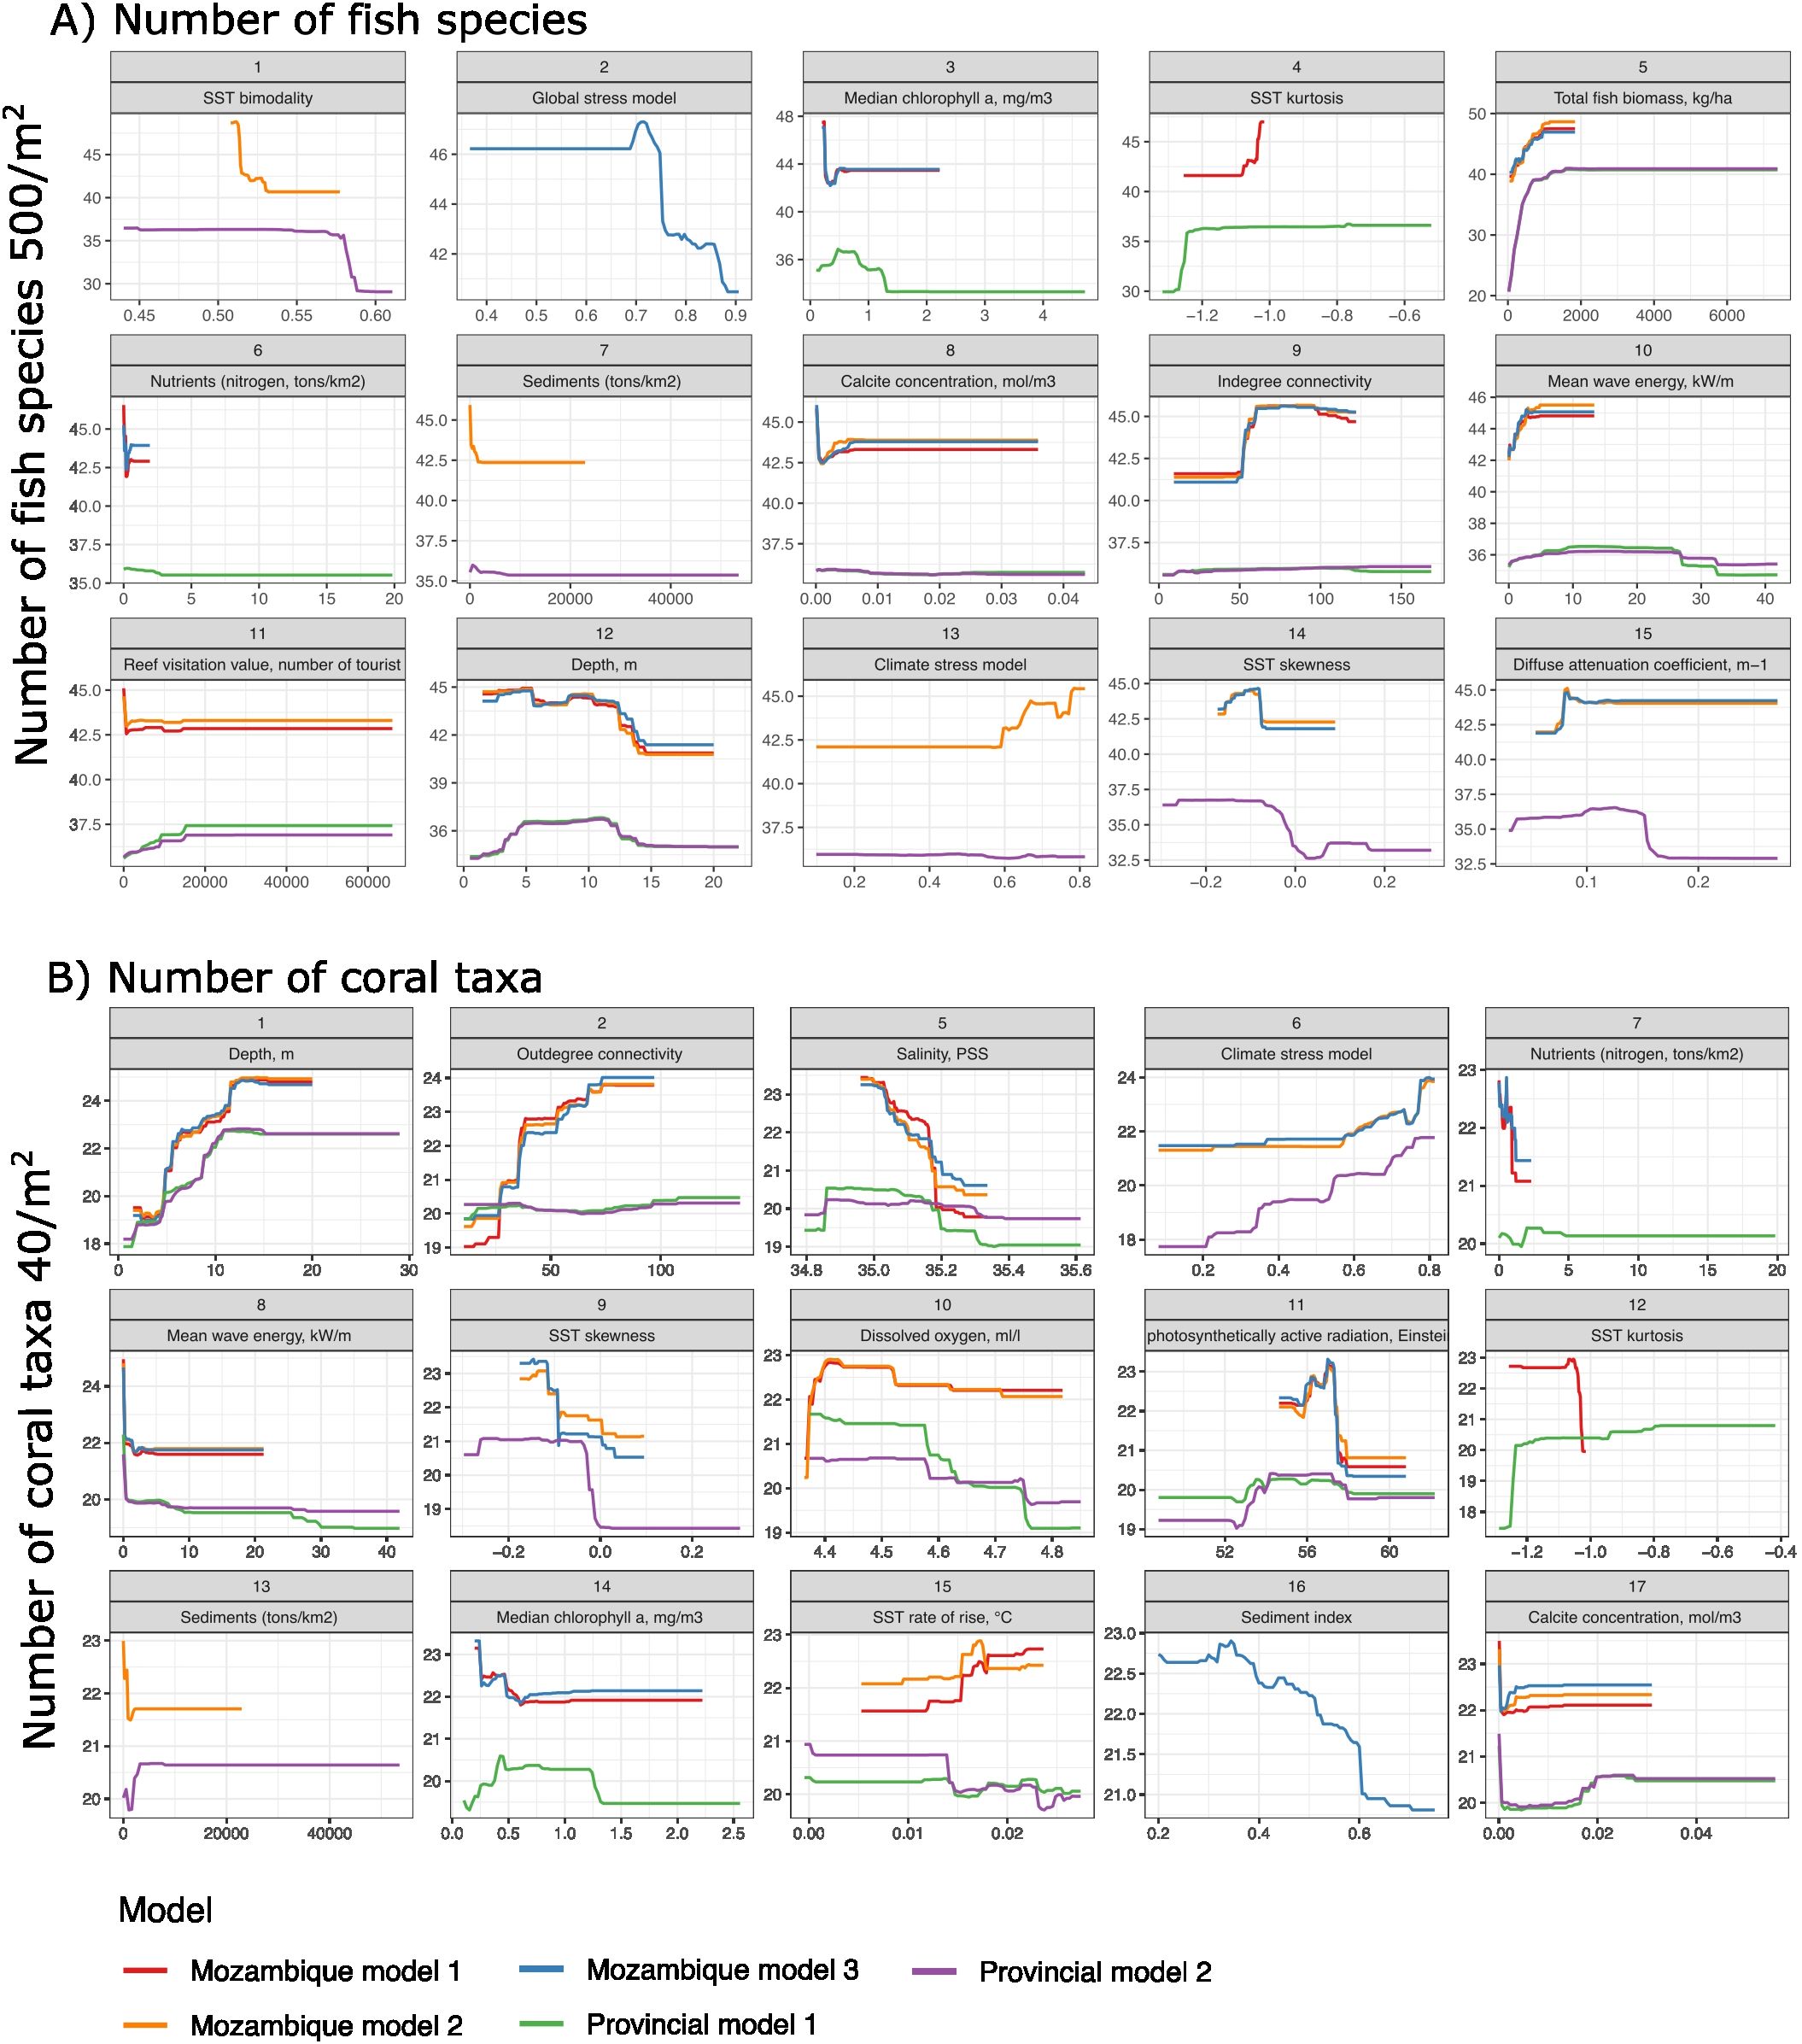
Figure 4. Response relationships between selected environmental variables and (A) numbers of fish and (B) coral taxa for the top 15 variables. BRT response plots compare two provincial models (WIODMOD-1 and 2) with the three Mozambican models. Mozambique models MOZMOD-1 and MOZMOD-2 variables selections were informed by the provincial models (WIOMODs) whereas MOZMOD-3 used a standard variable filtering procedure. Some highly correlated variables in MOZMOD-1 and MOZMOD-2 are missing because they were separated in models to distinguish their effects. Variables ordered from most to least importance based on the average relative influence in each model. See Supplementary Figure S5 for all 33 and 31 response relationships (for fish and corals, respectively).
Differences in responses between the WIOMODs and Mozambique models included the range of the data, and the directions and magnitude of the responses. The Mozambique data had a smaller data range than the WIO data and therefore responses reflected these differences in the variables’ windows. For both fish and coral predictions, for example, temperature, light, water quality, wave energy, and human influence variables had more restricted data ranges compared to the WIOMODs. Responses to the rate of rise in SST differed in the direction of the responses. As rates of rise in SST increased, more coral taxa were predicted for Mozambique but less for the WIO province. However, the numbers of Mozambican coral taxa were predicted to be less tolerant of warm-water skewness than the WIO. Finally, the WIOMOD underestimated the numbers of fish species but overestimated the numbers of coral taxa relative to the Mozambique models.
3.4 Relationships between fish and coral
Scatterplots and correlations of the relationships between numbers of fish and coral taxa indicated weak positive relationships (Supplementary Figure S6). In fact, the relationship was not statistically significant (p=0.11, n=104) for the empirical data but significant for the provincial and pruned and unpruned models (p<0.001, n=1180). The relationship was the strongest for the provincial model (R2= 0.31) while weakest for both the provincially informed and filtered models (R2= 0.05). Therefore, numbers of fish and coral taxa appeared to be distributed mostly independently despite some shared environmental responses. The weak association was most notable when relying on Mozambique-only data and standard variable selection processes.
3.5 Biodiversity maps
Mapped reef cells based on the model predictions for a constant biomass, sampling area, and depth largely reflected the distribution of the high importance variables. Maps predicted that reef cells north of mid-Nampula province had the highest numbers of taxa but with considerable variability both along and offshore from the coast (Figure 5). The provincial map showed the least variable patterns in having a strong onshore-offshore increase in predicted numbers of fish and combined taxa (Figure 5A). Corals had lower numbers of taxa in the middle of Cabo Delgado, particularly south of Pemba City. Predicted numbers of coral taxa increased again south of Memba Bay to Nacala City. South of this area, the provincial model maps predicted low numbers of coral taxa until the South African border. Fish had the strongest onshore-offshore pattern, which suggests declining species richness south from Nacala. The provincial model predicted that diversity in the Primeiras and Segundas Archipelago is not as high as in northern Mozambique reefs and generally declines to the south along these islands.
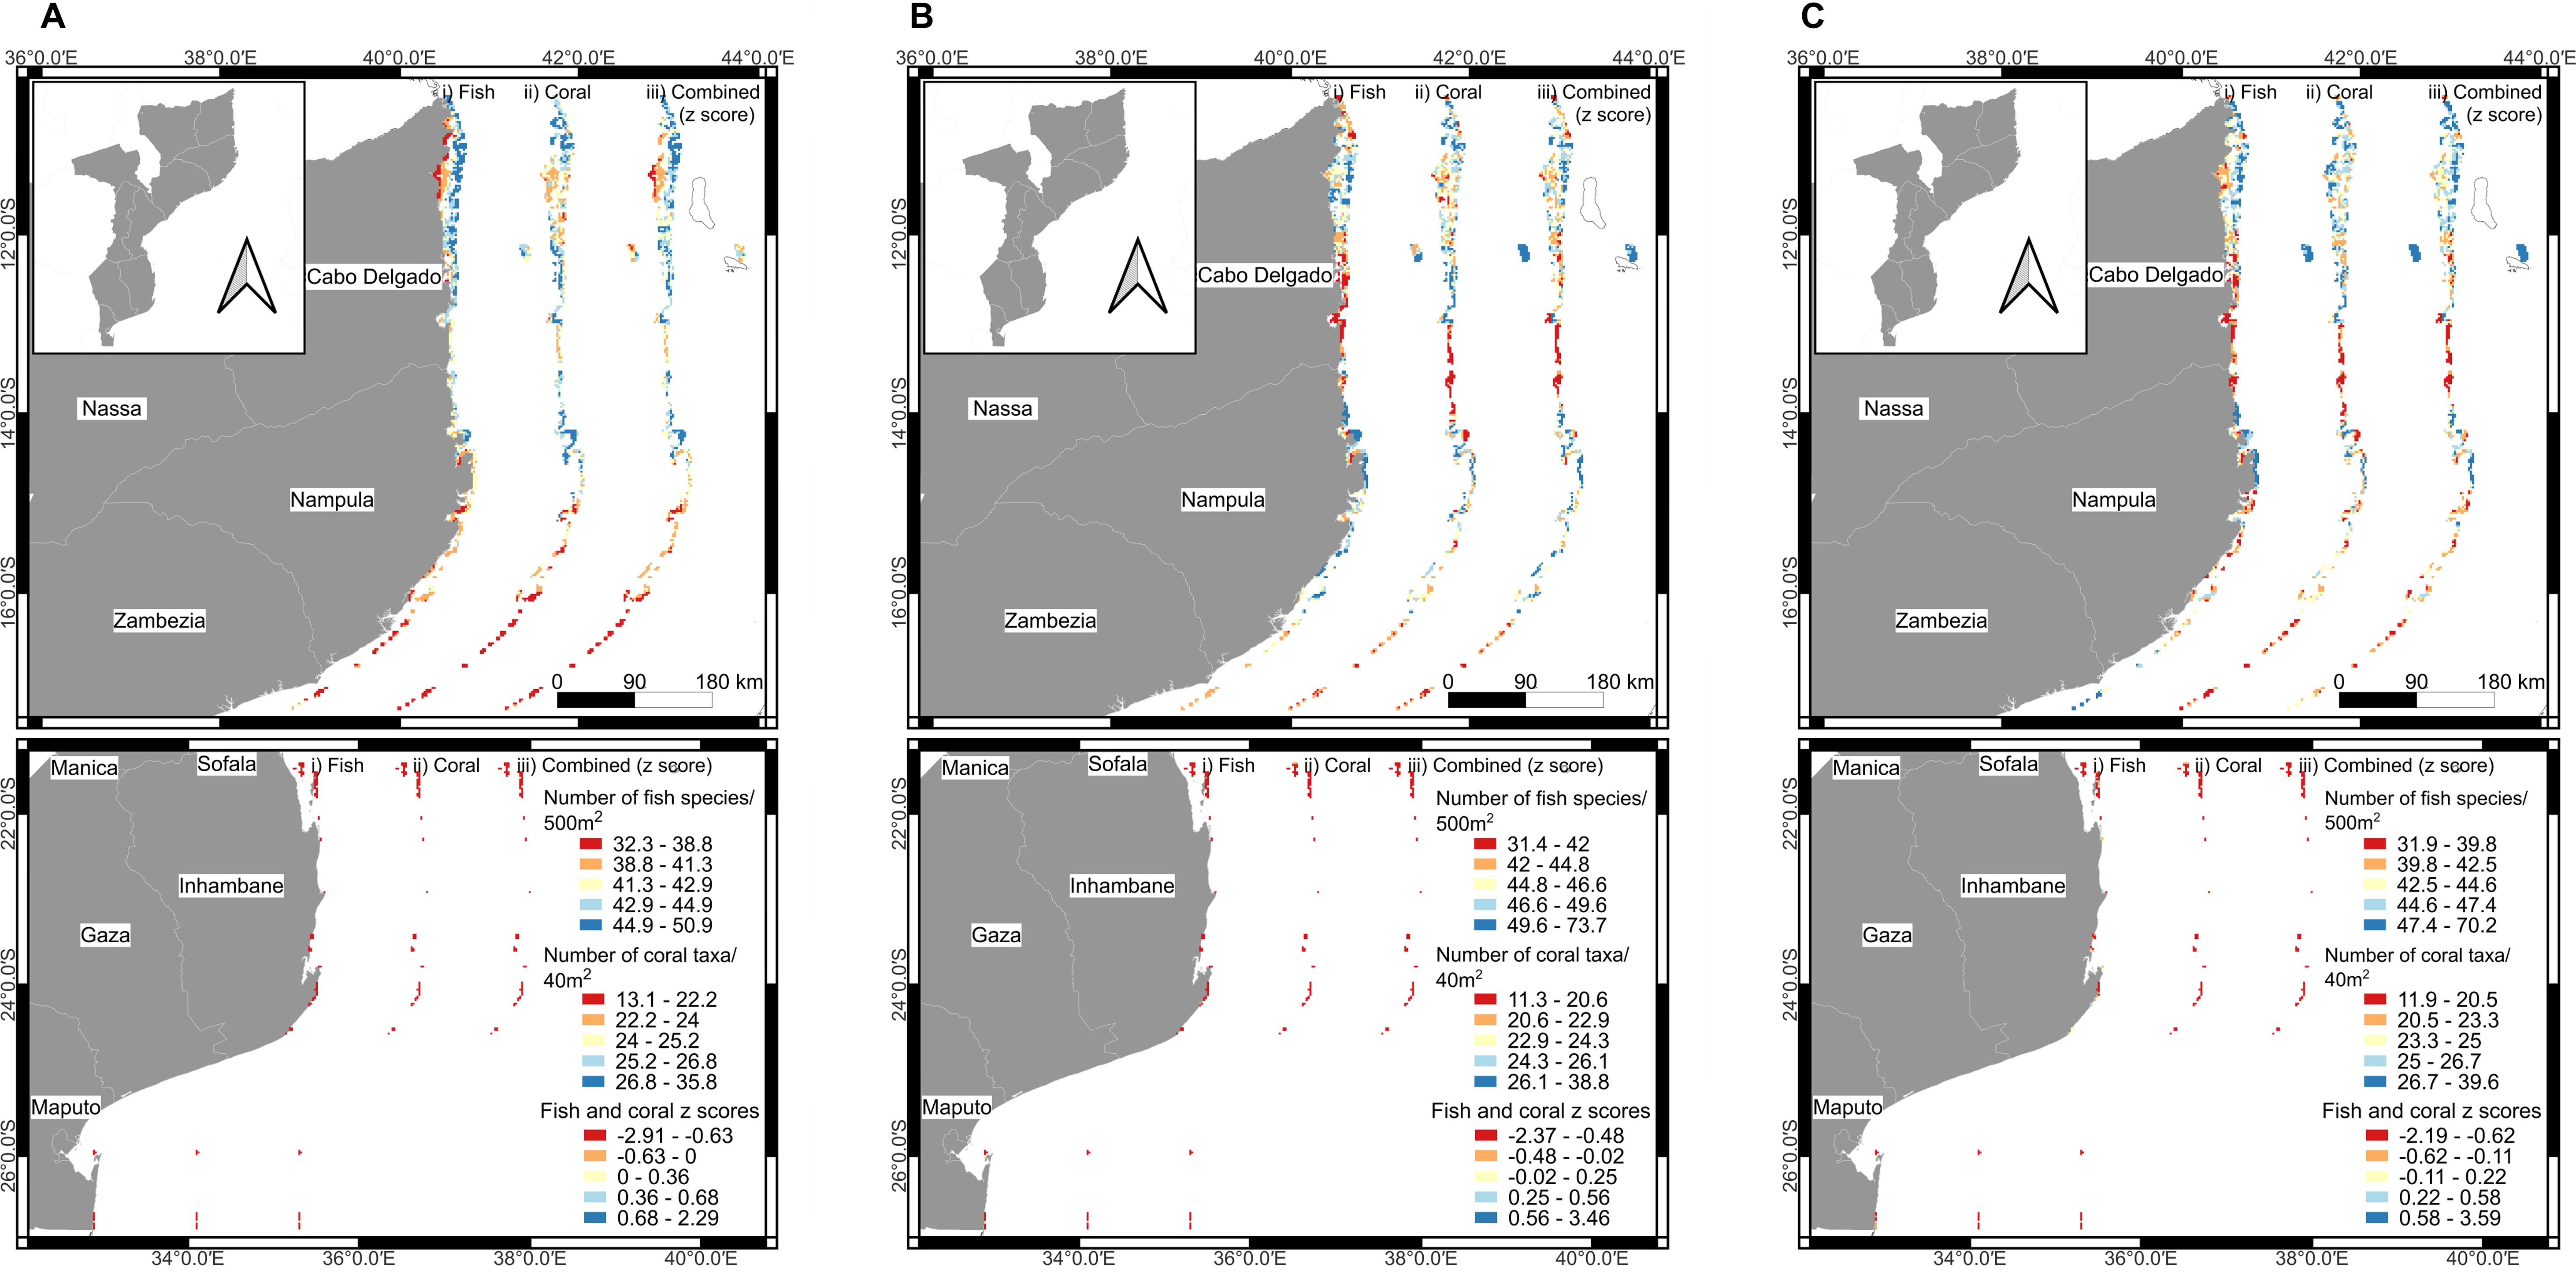
Figure 5. Maps showing the 1180 cellular predictions for (A) the average of the two provincial models for Mozambique (WIOMOD-1 and 2), (B) two provincially informed variables but calibrated using Mozambique data (MOZMOD-1 and 2), and (C) filtered or uninformed Mozambique model (MOZMOD-3). Each map contains outputs for number of fish species, coral taxa, and their normalized sums.
The provincially informed model using Mozambique data predicted a weaker on- to offshore gradient and fewer numbers of fish species in the far north or adjacent the Tanzania border (Figure 5B). Numbers of fish species also declined in the southern Quirimbas islands reefs and south of Pemba. Numbers of coral taxa were similar to the provincial model predictions for northern Cabo Delgado, but the provincial model predicted lower numbers of taxa for the southern Cabo Delgado and northern Nampula provinces and therefore, lower overall taxonomic diversity near the boundaries of these two national provinces.
The Mozambican filtered Model 3 predicted higher numbers of fish species in the far north compared to the provincial model but not the provincially informed models 1 and 2 (Figure 5C). Filtered Model 3 also predicted high numbers of fish species but not coral taxa for the most southern Primeiras and Segundas Archipelago, which contrasts with the provincially informed models.
3.6 Between-model variability
Variation among models as reflected in the coefficient of variation (COV) was generally small (Figure 6). For example, 78.6% of the fish and 87.6% of the 1180 coral cells had COV of <10%. Twenty percent of the fish and 8.7% of coral cells fell within the 10 to 20% COV interval. Only 1.1% of the fish and 3.6% of the coral cells had COV between 20 and 30%. The lowest between-model variation was observed in northern and southern Mozambique while most of the model variation was on the border between Cabo Delgado and Nampula. Nampula province had more variation in the numbers of fish species than coral taxa predictions. Variation in the fish models extended to the Primeiras and Segundas Archipelago while between-model coral variation was highest on the border between the Cabo Delgado and Nampula provinces.
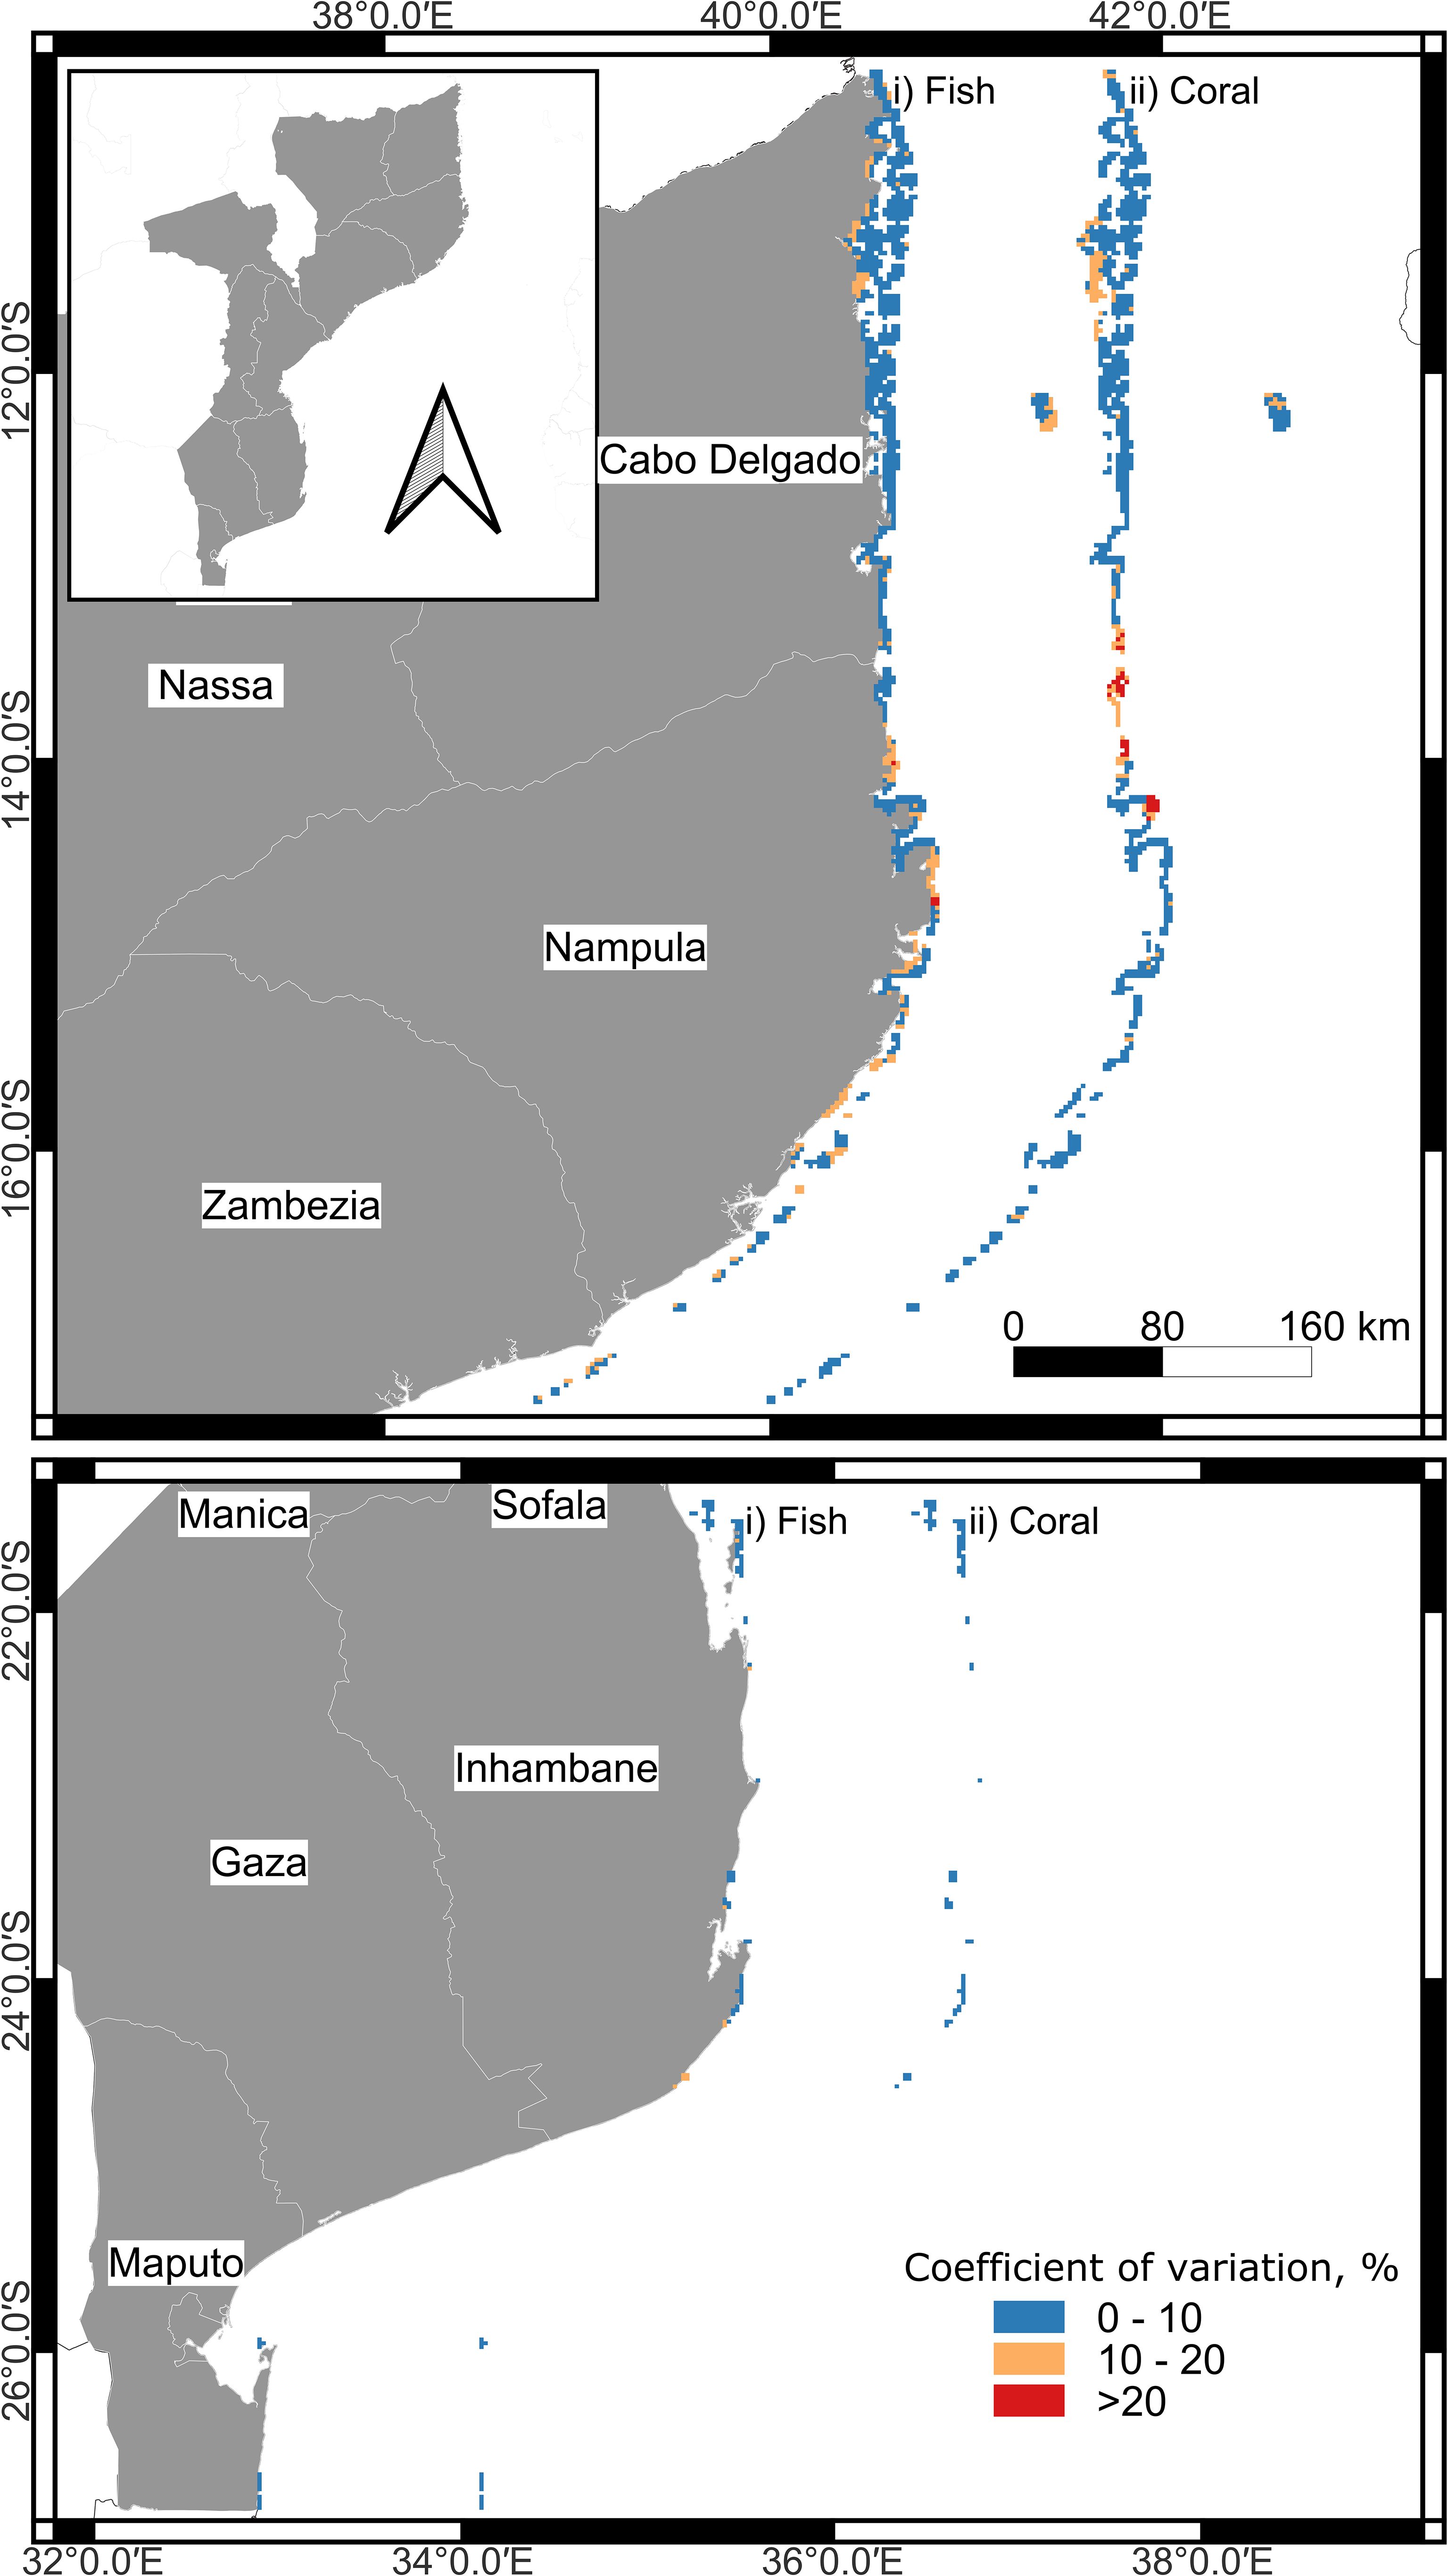
Figure 6. Map of the coefficient of variation (COV) in the predictions for each reef cell based on the 5 models per coral and fish taxa.
4 Discussion
The ability to model biodiversity has improved significantly following several scientific and technical advances (Pilowsky et al., 2022). Progress has been primarily dependent on the wide coverage of ocean surface data and associated environmental metrics and proxies. Nevertheless, the low availability of field data collected beneath-the-sea surface is often a major limitation to the use of these tools. This can produce errors associated with low sampling intensity and the possibility of unknowns, biases, overfitting, and other problems arising from preferred ecological theories and variable choices, low samples sizes, and weak field sampling designs. Arguably, this could be the case for Mozambique. However, the study here suggests these problems were not large and smaller than the natural variance. The filtered Model 3 (MOZMOD-3), using only Mozambique data and filtering of variables, produced similar results to the provincial and provincially informed models. Moreover, where the filtered Model 3 did produce local differences, these were insightful into potential environmental influences on diversity. It reminds modelers that large scale models based on many variables are useful and transferable but can miss identifying potentially important local environmental influences and high diversity locations.
Mozambique provided a good test location to study training and testing or transferability influences (Wenger and Olden, 2012). The combination of limited data, a long coastline, three ecoregions, and a tropical to temperate environmental gradient should have revealed some of the limitations of various model transferences. The partial effect methods allowed us to keep variables constant, which made it possible to account for sources of variability that can trouble comparisons and predictions. This included differences between observers, sampled area, fish biomass, and depth (Supplementary Table S3). Making fair comparisons is more likely when using constant and partial effects options allowed by BRT. Nevertheless, ground-truthing will provide a further test of model efficacy.
Several of the findings provide insights into the consequences of modelling choices. First, all models had reasonable fits to data considering the scale and complexity of the studied reef environments relative to the field sampling intensity. All models leave some variance unexplained whether due to unmeasured variables or natural and small-scale variability. Having more data reduced the variance and improved the fits, as reflected in the large WIOMOD. Higher fits would be expected given the large number of environmental variables used to make tree-based machine learning predictions (Kuhn and Johnson, 2013). However, the selected variables did not predict local patterns better than the national filtered model when fit to local data. Additionally, large losses of predictive ability were not evident when pruning weaker variables. Also, no clear differences were observed in the number of important variables selected in the informed and uninformed models. All models shared several variables but differences in their rankings were insightful into the influences of local versus provincial patterns.
The shared variables among all three model decisions varied between the taxonomic groups. However, the selected fish species’ variables were often a mixture of biomass, depth, waves, heat and its variability, distance to human populations, ocean productivity, specific connectivity metrics, and water quality metrics. For numbers of coral taxa, the depth, and thermal heat and temperature variability metrics were important and followed by a number moderate physico-chemical metrics including currents, waves, calcite, various water quality variables including dissolved oxygen, and salinity metrics. Human influences and connectivity metrics were among the weakest variables for both coral and fish. Despite sharing several predictive variables, numbers of fish and coral taxa were not well correlated in Mozambique relative to the WIO. Therefore, the total number of taxa or the sum of these two groups was likely to be a weak proxy for the total number of species in a cell. The qualitative literature has speculated about the patterns of biodiversity in Mozambique and some of the large-scale patterns, such as the influence of sediments and temperature variation, are supported by this study (Rodrigues et al., 2000).
Mozambique is likely to challenge any modelling methods as the coastline extends from dense tropical reefs in the north to sparse marginal reefs and more temperate conditions in the south. Therefore, the three model options allowed testing the consequences of tradeoff between local and limited versus more extensive regional data and knowledge. The provincial model was created to identify areas of high biodiversity with the potential for conservation prioritization and for triggering Key Biodiversity Areas, of which 19 were identified in Mozambique (McClanahan et al., 2024a). Our model experiments allowed us to test the consequences of building national models based on local data versus relying on variables and results from larger models. These two decisions are the expected options when, for example, national planning or policy requires a national assessment. Findings showed that a limited number of distributed field sites (~100) made reliable predictions at the national level with little evidence for overfitting from the pruning analyses. It suggests that local diversity patterns arise from both global (i.e., temperature variation, light, and waves) and local factors (i.e., sediment and nutrients). Our approach contributed to a perennial debate in geography of the value of global theories versus local scale empiricism. We find that larger models produced reasonable predictions, but they can miss important local variables that drive local diversity and important small-scale patterns.
4.1 Unique features of Mozambique
4.1.1 The thermal environment
Comparisons between models made it possible to distinguish the environmental conditions that influence Mozambique. The first indication of some important differences between Mozambique and the WIO region was the higher number of fish and lower number of coral taxa predicted by the Mozambican versus the provincial models. Secondly, we see factors such as temperature variation (bimodality and kurtosis) and connectivity were more important in Mozambique than in the WIO. Thereafter, key distinguishing variables included some connectivity metrics, habitats, nutrients, sediments, weak human effects, and temperature variation, possibly most influenced by temperature bimodality. The bimodality and kurtosis metrics were likely to reflect the latitudinal gradient but correlated with other temperature variable metrics associated with latitude. Unexpectedly, bimodality was the most important variable for numbers of fish species but ranked lowly for corals. Consequently, seasonality would appear to be more influential for numbers of fish than coral taxa.
The correlated variables of SST bimodality, SST skewness and kurtosis indicated that numbers of taxa declined as these metrics deviated from normal distributions. High negative kurtosis and high positive bimodality are proxies of chronic temperature stress, and positive skewness is a measure of the frequency of reoccurring hot water or acute stress. These metrics combined indicated that numbers of both corals and fish taxa declined as chronic and acute stress increased towards the southern Mozambican border. Typically, acute warm water stresses are common in tropical locations during episodic ocean conditions, such warm El Nino Southern (ENSO) and Southwest Indian Ocean Oscillations (SWIO) but also episodic cyclones (Bruggemann et al., 2012). However, the northern Mozambique (10-12°S) reefs appeared to be buffered from these acute stresses as warm skewness was shown to increase from the Tanzanian border south to Pemba and Nacala (McClanahan and Muthiga, 2017). In contrast to the WIOMOD findings, numbers of both coral and fish taxa increased with the rate of SST rise, although with a moderate effect. This supports the observation that conditions for high biodiversity will improve with climate change in transitional compared to equatorial regions (Chaudhary et al., 2021).
4.1.2 Connectivity
Connectivity metrics were more important in Mozambique than in the WIO. Greater isolation or the peripheral location of these reefs might be the cause. Madagascar has a large area of reefs and those in Tanzania and the East African Coral Coast Ecoregion to the north have the highest diversity (McClanahan et al., 2024a). A high diversity corridor of WIO reefs exists between northern Mozambique, east to Comoros, Mayotte, and the northwestern Islands of Madagascar (Obura, 2012; McClanahan et al., 2024a). The predicted numbers of taxa in the WIO models were more influenced by larval retention rather than in- and outdegree connectivity metrics found for fish and corals in Mozambique. In Mozambique, indegree connectivity was most important for numbers of fish but outdegree for coral taxa. Better understanding these intriguing differences will require more research. Regardless, the weak correlation between numbers of coral and fish taxa in Mozambique could be partially explained by their different connectivity patterns.
In the northern Mozambique Channel, gyres are created when the South Equatorial current bifurcates and produces mesoscale eddies that travel south along the Mozambique coast, known as the Mozambique Current (Lutjeharms et al., 2012; Halo et al., 2014; Gamoyo et al., 2019). Genetic connections between Madagascar and Mozambique were observed in a coral relatedness study (van der Ven et al., 2021). Moreover, connectivity relationships appear to be divided between northern reefs and mid-channel reefs. For species with short larval durations (<15 days), the transition in connectivity occurs near the border of the Cabo Delgado and Nampula provinces (Crochelet et al., 2016; Gamoyo et al., 2019; O’Donnell et al., 2017). Halo et al. (2014) predicted ~4 eddy cycles per year, which suggests regular connectivity within these divisions depending on the larval duration of the specific taxa. Nevertheless, the consequences of this gyre system appear to differ between coral and fish connectivity patterns.
An increase in numbers of fish species associated with indegree connectivity suggests that species travel east to west and north to south, which would fit with the overall current movement patterns and connectivity of northern Mozambique (Crochelet et al., 2016; Gamoyo et al., 2019). However, the outdegree importance for corals suggests a different connection system or possibly unstudied hidden variables correlated with the outdegree connectivity metric. For example, one viable hypothesis is outdegree connectivity correlates with remnant or climate change refuges of high numbers of coral species in the deep-water Pemba and Nacala bay channels (McClanahan et al., 2011; Obura, 2012; Halo et al., 2014; McClanahan and Muthiga, 2017). These locations are likely associated with the anticlockwise gyre systems that pull cool water offshore, creating some weak upwelling. In other words, the causes of the high numbers of species could be attributed to these taxa’s adjacency to deep, cool, and stable water. Therefore, thermal refuge created by gyres would lead to the increase in taxa rather than larval outdegree dynamics. Future research will need to consider these and other possibilities for understanding these unique deep-water high diversity refuges.
4.1.3 Water quality and human influences
Water quality effects on numbers of taxa was generally greater in Mozambique than the WIO. The latitudinal gradient should produce these patterns often associated with increased nutrients and sediments that are typical of cooler and more variable oceanic waters found in temperate latitudes. Yet, high sediment concentrations are observed in reefs south of Pemba and particularly south of Nacala Channel. Shallow reefs and associated species are missing along a long stretch of central Mozambique and high sediments and low water quality are the likely causes. Variability in numbers of taxa with habitats may also reflect differences in exposure to water quality and temperature variability.
Human influences on numbers of taxa appeared weaker in Mozambique than the WIO province. Coastal populations are more sparsely and evenly distributed (~40 people/km2) than elsewhere in the province. This combined with important environmental temperature and water quality effects may explain these patterns. In many countries of the WIO province, fish biomass has declined greatly, and this has reduced the numbers of species (McClanahan, 2022). Most Mozambican reefs are also overfished but not to the same extent as many reefs in Kenya, Tanzania, Reunion, and Comoros (McClanahan et al., 2023). Additionally, the existing fisheries management classifications were probably ranked low because there was little difference between protected, managed, and unmanaged reefs (McClanahan et al., 2015; Gill et al., 2017). This is potentially an attribute of the biomass of fish, which is more evenly distributed across management systems. However, most Mozambican reefs have low to moderate fish biomass regardless of management. A model estimating the recovery times of Mozambican reefs predicted it would take ~5 and 15 years of no fishing to recover biomass to optimal yield and the higher conservation levels (McClanahan et al., 2016).
It is likely that the influences of the above environmental variables led to the underprediction of numbers of fish and overprediction of corals when comparing the provincial and national models. The implication is that conditions are better for fish and worse for coral taxa in Mozambique than the WIO. This finding should provoke speculations but the complexity or number of variables in the model imply several different environmental forces. Perhaps this is an attribute of comparing a model developed largely for equatorial reefs versus a transitional coastline environment. Our findings suggest that the transition from tropical to temperate systems provokes a decoupling of important coral-fish species associations among these two tropical taxa. Therefore, fish are likely to adapt better than corals to transitional subtropical environments. This would be expected given that corals rely more on light and clear water than fish to survive.
4.2 Comparing models
Differences between models were less influenced by their predictive ability than the rankings of the medium to high strength variables. Shifts in rankings will affect numbers of taxa predictions for specific cells and therefore influence maps of biodiversity distributions. Overall, the between-model variation map was the best reflection of the variability in rankings (Figure 6). Most locations exhibited modest variation between models. However, patterns of variation indicated less confidence in predictions for nearshore reefs located between the Cabo Delgado and Nampula provinces. There was also less between-model confidence for numbers of fish than corals particularly in Nampula province and the southern Primeiras and Segunda Archipelago. However, limited and uneven sampling combined with a lack of field data and ground truthing in southern Nampula could have influenced the variability in the model’s predictions. From the perspective of improving modelling, sampling in southern Nampula province is a high priority. One prediction is that fish would have relatively more species than corals after accounting for any fishing or reduced biomass effects.
Tests of model performance indicated good predictive ability. Yet, when making predictions for many cells on large scales, overfitting and missing important local conditions are concerns, especially for predictions below the cell’s ~6.25 km2 scale. Moreover, the model cannot account for local unmodelled variables, such as damaging fishing methods or point-source effluents. Nevertheless, consideration of 70 relevant environmental variables, variable selection, validation, and comparative model methods represents a considerable advance in marine spatial modelling predictions for Mozambique. Challenges remain to test predictions and account for human and other local factors not currently available at large scales. Moreover, it is important to choose model variables that are amenable to management and human concerns. Nevertheless, all predictive models had good skill. Similar modelling methods to predict coral cover and fish stocks and yields have made good large-scale predictions (McClanahan and Azali, 2021; McClanahan et al., 2023, 2024b).
4.3 Proxy for total numbers of species
Estimating the total numbers of species using the sum of the fish and coral was expected to produce a good proxy for total numbers of species. However, our analysis found numbers of taxa of fish and coral were not highly related (R2~0.05). The modest fit in the provincial model (R2= 0.31) likely arose from a variable selection process weakly influenced by the Mozambican data. Consequently, the sum of the two taxa should be seen as having limited ability to predict the total numbers of species. As suggested above, the environmental conditions in Mozambique cause these two taxa to respond differently to environmental conditions. Interestingly, the ecoregion was also not selected in our model suggesting that this faunal delineation was not influencing numbers of coral and fish taxa apart from the most influential environmental variables used in the model. Therefore, Mozambican ecoregions likely represent different environments and qualitative aspects of the fauna and not the numbers of our studied taxa. It remains to be discovered if there is a good environmental proxy for total number of taxa for transitional locations like Mozambique.
4.4 Conclusions
Several technical advancements were represented in our modelling approach and outcomes. Nevertheless, the availability of field data and collaboration among experienced observers using similar methods was critical to making the predictive model. The ability to control for many factors is a key strength of the predictive modelling approach. Between-model tests indicated reasonable predictive ability (i.e., R2 >40%) with few exceptions. Yet, when making predictions for many cells on large scales, overfitting and missing important local conditions is a possibility, especially for biodiversity distributions below the 6.25 km2 scale of this study. Moreover, the findings indicate the importance of having large replicates and well-designed sampling to improve the models’ predictive strengths.
The approach used here provided a more spatially refined view of biodiversity of Mozambique’s coast than previous efforts. Our model found that both coral and fish were affected by the historical patterns of acute and chronic stress and not just excess heat. In fact, modest amounts of excess heat appeared to promote corals acclimation to climate change. Therefore, high environmental variability around Mozambique suggests low tolerance to excess heat but some resilience via high environmental spatial variation. The cell-level predictions of the models indicated that smaller scale environmental factors were among the most influential. Therefore, failure to account for this fine-scale variability is likely to produce weaknesses in identifying locations and biodiversity priority locations. Clearly, filling spatial gaps, ground-truthing, and considering environmental and important demographic influences will be an important next step to improve the prediction and the protected are prioritization process. Our approach of comparing common modelling decisions produced both differences and novel insights that should stimulate further investigations.
Data availability statement
The original contributions presented in the study are publicly available. This data can be found here: KNB repository: https://knb.ecoinformatics.org/view/doi:10.5063/F19885HT Dryad repository: https://doi.org/10.5061/dryad.3xsj3txn1.
Author contributions
TM: Conceptualization, Data curation, Formal analysis, Funding acquisition, Investigation, Methodology, Project administration, Resources, Validation, Writing – original draft. ES: Data curation, Investigation, Validation, Visualization, Writing – original draft, Writing – review & editing.
Funding
The authors declare financial support was received for the research, authorship, and publication of this article. Research was made possible by the generous support of the American people through the United States Agency for International Development (USAID), the U.S. Department of the Interior's International Technical Assistance Program (DOI-ITAP) and Supporting the Policy Enabling Environment for Development (USAID SPEED). The findings do not necessarily reflect the views of the United States Agency for International Development or the United States Government. Its contents are the sole responsibility of the author or authors and do not necessarily reflect the views of USAID or the U.S. Government. The original fieldwork was supported by the Wildlife Conservation Society, USA through grants from John D. and Catherine T. MacArthur, The Tiffany and Co Foundation.
Acknowledgments
We thank the Government of Mozambique and the Oceanographic Research Institute of Mozambique (InOM) for authorizing the fieldwork. Special thanks are due to Maxwell Azali for support with model analysis, to Francisco Zivane (InOM), Isabel Marques da Silva (Universidade Lúrio, Mozambique), Sidónio Machaieie (Universidade Lúrio, Mozambique), the late João Macuio (Universidade Lúrio, Mozambique) and Delson Vutane (WCS-Mozambique) for their help during data collection in the field, as well as Jesse Kosgei (WCS-Kenya) and Acacio Chechene (WCS-Mozambique) for their help with manuscript and figures editing.
Conflict of interest
The authors declare that the research was conducted in the absence of any commercial or financial relationships that could be construed as a potential conflict of interest.
Publisher’s note
All claims expressed in this article are solely those of the authors and do not necessarily represent those of their affiliated organizations, or those of the publisher, the editors and the reviewers. Any product that may be evaluated in this article, or claim that may be made by its manufacturer, is not guaranteed or endorsed by the publisher.
Supplementary material
The Supplementary Material for this article can be found online at: https://www.frontiersin.org/articles/10.3389/fevo.2024.1450383/full#supplementary-material
References
Andrello M., Darling E. S., Wenger A., Suárez-Castro A. F., Gelfand S., Ahmadia G. N. (2022). A global map of human pressures on tropical coral reefs. Conserv. Lett. 15, e12858. doi: 10.1111/conl.12858
Araújo M. B., New M. (2007). Ensemble forecasting of species distributions. Trends Ecol. Evol. 22, 42–47. doi: 10.1016/j.tree.2006.09.010
Araújo M. B., Thuiller W., Williams P. H., Reginster I. (2005). Downscaling European species atlas distributions to a finer resolution: Implications for conservation planning. Global Ecol. Biogeography. 14, 17–30. doi: 10.1111/j.1466-822X.2004.00128.x
Barbosa A. M., Real R., Vargas J. M. (2010). Use of coarse-resolution models of species’ distributions to guide local conservation inferences. Conserv. Biol. 24, 1378–1387. doi: 10.1111/j.1523-1739.2010.01517.x
Boser A. (2024). Validating spatio-temporal environmental machine learning models: Simpson's paradox and data splits. Environ. Res. Commun. 6, 031003. doi: 10.1088/2515-7620/ad2e44
Bruggemann J. H., Rodier M., Guillaume M. M. M., Andréfouët S., Arfi R., Cinner J. E., et al. (2012). Wicked social–ecological problems forcing unprecedented change on the latitudinal margins of coral reefs: The case of southwest Madagascar. Ecol. Soc. 17, 47. doi: 10.5751/ES-05300-170447
Bullock R., Ralph G. M., Stump E., Al Abdali F., Al Asfoor J., Al Buwaiqi B., et al. (2021). Conservation status of marine biodiversity of the Western Indian Ocean (Gland, Switzerland: International Union for Conservation of Nature).
Burke L., Reytar K., Spalding M., Perry A. (2011). Reefs at risk revisited (Washington, D.C: World Resources Institute).
Chaudhary C., Richardson A. J., Schoeman D. S., Costello M. J. (2021). Global warming is causing a more pronounced dip in marine species richness around the equator. Proc. Natl. Acad. Sci. 118, e2015094118. doi: 10.1073/pnas.2015094118
Couce E., Cowburn B., Clare D., Bluemel J. K. (2023). Paris Agreement could prevent regional mass extinctions of coral species. Global Change Biol. 29, 3794–3805. doi: 10.1111/gcb.16690
Crochelet E., Roberts J., Lagabrielle E., Obura D., Petit M., Chabanet P. (2016). A model-based assessment of reef larvae dispersal in the Western Indian Ocean reveals regional connectivity patterns—Potential implications for conservation policies. Regional Stud. Mar. Sci. 7, 159–167. doi: 10.1016/j.rsma.2016.06.007
Dormann C. F., Elith J., Bacher S., Buchmann C., Carl G., Carré G., et al. (2013). Collinearity: A review of methods to deal with it and a simulation study evaluating their performance. Ecography. 36, 27–46. doi: 10.1111/j.1600-0587.2012.07348.x
Dornelas M., Chase J. M., Gotelli N. J., Magurran A. E., McGill B. J., Antão L. H., et al. (2023). Looking back on biodiversity change: Lessons for the road ahead. Philos. Trans. R. Soc. B 378, 20220199. doi: 10.1098/rstb.2022.0199
Elith J., Leathwick J. R., Hastie T. (2008). A working guide to boosted regression trees. J. Anim. Ecol. 77, 802–813. doi: 10.1111/j.1365-2656.2008.01390.x
Fontoura L., D’agata S., Gamoyo M., Barneche D. R., Luiz O. J., Madin E. M. P., et al. (2022). Protecting connectivity promotes successful biodiversity and fisheries conservation. Science 375, 336–340. doi: 10.1126/science.abg4351
Friedlander A. M., Zgliczynski B. J., Ballesteros E., Aburto-Oropeza O., Bolaños A., Sala E. (2012). The shallow-water fish assemblage of Isla del Coco National Park, Costa Rica: Structure and patterns in an isolated, predator-dominated ecosystem. Rev. Biología Trop. 60, 321–338.
Gamoyo M., Obura D., Reason C. J. C. (2019). Estimating connectivity through larval dispersal in the Western Indian Ocean. J. Geophysical Research: Biogeosciences 124, 2446–2459. doi: 10.1029/2019JG005128
Gill D. A., Mascia M. B., Ahmadia G. N., Glew L., Lester S. E., Barnes M., et al. (2017). Capacity shortfalls hinder the performance of marine protected areas globally. Nature. 543, 665–669. doi: 10.1038/nature21708
Halo I., Backeberg B., Penven P., Ansorge I., Reason C., Ullgren J. E. (2014). Eddy properties in the Mozambique Channel: A comparison between observations and two numerical ocean circulation models. Deep Sea Res. Part II: Topical Stud. Oceanography 100, 38–53. doi: 10.1016/j.dsr2.2013.10.015
Hughes A. C., Orr M. C., Yang Q., Qiao H. (2021). Effectively and accurately mapping global biodiversity patterns for different regions and taxa. Global Ecol. Biogeography 30, 1375–1388. doi: 10.1111/geb.13304
Jenkins C. N., Van Houtan K. S. (2016). Global and regional priorities for marine biodiversity protection. Biol. Conserv. 204, 333–339. doi: 10.1016/j.biocon.2016.10.005
Kujala H., Moilanen A., Araújo M. B., Cabeza M. (2013). Conservation planning with uncertain climate change projections. PloS One 8, e53315. doi: 10.1371/journal.pone.0053315
Kusumoto B., Costello M. J., Kubota Y., Shiono T., Wei C. L., Yasuhara M., et al. (2020). Global distribution of coral diversity: Biodiversity knowledge gradients related to spatial resolution. Ecol. Res. 35, 315–326. doi: 10.1111/1440-1703.12096
Lutjeharms J. R. E., Biastoch A., van der Werf P. M., De Ruijter W. P. M., Ridderinkhof H. (2012). On the discontinuous nature of the Mozambique Current. South Afr. J. Sci. 108, 1–5. doi: 10.4102/sajs.v108i1/2.428
Maina J., McClanahan T. R., Venus V., Ateweberhan M., Madin J. (2011). Global gradients of coral exposure to environmental stresses and implications for local management. PloS One 6, e23064. doi: 10.1371/journal.pone.0023064
Maire E., Cinner J., Velez L., Huchery C., Mora C., Dagata S., et al. (2016). How accessible are coral reefs to people? A global assessment based on travel time. Ecol. Lett. 19, 351–360. doi: 10.1111/ele.2016.19.issue-4
McClanahan T. R. (2019). Coral reef fish community life history traits as potential global indicators of ecological and fisheries status. Ecol. Indic. 96, 133–145. doi: 10.1016/j.ecolind.2018.08.055
McClanahan T. R. (2022). Fisheries yields and species declines in coral reefs. Environ. Res. Lett. 17, 044023. doi: 10.1088/1748-9326/ac5bb4
McClanahan T. R. (2023). Local heterogeneity of coral reef diversity and environmental stress provides opportunities for small-scale conservation. Diversity Distributions 29, 1324–1340. doi: 10.1111/ddi.v29.11
McClanahan T. R., Ateweberhan M., Graham N. A. J., Wilson S. K., Sebastián C. R., Guillaume M. M., et al. (2007). Western Indian Ocean coral communities: Bleaching responses and susceptibility to extinction. Mar. Ecol. Prog. Ser. 337, 1–13. doi: 10.3354/meps337001
McClanahan T. R., Azali M. K. (2021). Environmental variability and threshold model’s predictions for coral reefs. Front. Mar. Sci. 8, 1774. doi: 10.3389/fmars.2021.778121
McClanahan T. R., D’Agata S., Graham N. A. J., Kodia M. A., Maina J. M. (2023). Multivariate environment-fish biomass model informs sustainability and lost income in Indian Ocean coral reefs. Mar. Policy 152, 105590. doi: 10.1016/j.marpol.2023.105590
McClanahan T. R., Friedlander A. M., Chabanet P., Bruggemann J. H., Wickel J., Azali M. K. (2024b). Modeling the spatial distribution of numbers of reef fish species and communities for prioritizing protected areas. Mar. Ecol. Prog. Ser. 730, 59–78. doi: 10.3354/meps14538
McClanahan T. R., Friedlander A. M., Graham N. A. J., Chabanet P., Bruggemann J. H. (2021). Variability in coral reef fish baseline and benchmark biomass in the central and western Indian Ocean provinces. Aquat. Conservation: Mar. Freshw. Ecosyst. 31, 28–42.
McClanahan T. R., Friedlander A. M., Wickel J., Graham N. A. J., Bruggemann H. J., Guillaume M. M. M., et al. (2024a). Testing for concordance between predicted species richness, past prioritization, and marine protected area designations in the western Indian Ocean. Conserv. Biol. e14256. doi: 10.1111/cobi.14256
McClanahan T. R., Graham N. A. J., MacNeil M. A., Cinner J. E. (2015). Biomass-based targets and the management of multispecies coral reef fisheries. Conserv. Biol. 29, 409–417. doi: 10.1111/cobi.2015.29.issue-2
McClanahan T. R., Maina J. M., Graham N. A. J., Jones K. R. (2016). Modeling reef fish biomass, recovery potential, and management priorities in the Western Indian Ocean. PloS One 11, e0154585. doi: 10.1371/journal.pone.0154585
McClanahan T. R., Maina J. M., Muthiga N. A. (2011). Associations between climate stress and coral reef diversity in the Western Indian Ocean. Global Change Biol. 17, 2023–2032. doi: 10.1111/j.1365-2486.2011.02395.x
McClanahan T. R., Muthiga N. A. (2017). Environmental variability indicates a climate-adaptive center under threat in northern Mozambique coral reefs. Ecosphere 8, e01812. doi: 10.1002/ecs2.2017.8.issue-5
Obura D. (2012). The diversity and biogeography of Western Indian Ocean reef-building corals. PloS One 7, e45013. doi: 10.1371/journal.pone.0045013
O’Donnell J. L., Beldade R., Mills S. C., Williams H. E., Bernardi G. (2017). Life history, larval dispersal, and connectivity in coral reef fish among the Scattered Islands of the Mozambique Channel. Coral Reefs 36, 223–232. doi: 10.1007/s00338-016-1495-z
Pilowsky J. A., Colwell R. K., Rahbek C., Fordham D. A. (2022). Process-explicit models reveal the structure and dynamics of biodiversity patterns. Sci. Adv. 8, eabj2271. doi: 10.1126/sciadv.abj2271
Pinsky M. L., Selden R. L., Kitchel Z. J. (2020). Climate-driven shifts in marine species ranges: scaling from organisms to communities. Annu. Rev. Mar. Sci. 12, 153–179. doi: 10.1146/annurev-marine-010419-010916
Pressey R. L., Visconti P., McKinnon M. C., Gurney G. G., Barnes M. D., Glew L., et al. (2021). The mismeasure of conservation. Trends Ecol. Evol. 36, 808–821. doi: 10.1016/j.tree.2021.06.008
Rodrigues M. J., Motta H., Whittington M. W., Schleyer M. (2000). “Coral reefs of Mozambique,” in Coral Reefs of the Indian Ocean. Eds. McClanahan T. R., Obura D. (New York: Oxford University Press), 132–154. NY.
Selig E. R., Turner W. R., Troëng S., Wallace B. P., Halpern B. S., Kaschner K., et al. (2014). Global priorities for marine biodiversity conservation. PloS One 9, e82898. doi: 10.1371/journal.pone.0082898
Tyberghein L., Verbruggen H., Pauly K., Troupin C., Mineur F., De Clerck O. (2012). Bio-ORACLE: A global environmental dataset for marine species distribution modelling. Global Ecol. Biogeography 21, 272–281. doi: 10.1111/j.1466-8238.2011.00656.x
van der Ven R. M., Flot J.-F., Buitrago-López C., Kochzius M. (2021). Population genetics of the brooding coral Seriatopora hystrix reveals patterns of strong genetic differentiation in the Western Indian Ocean. Heredity 126, 351–365. doi: 10.1038/s41437-020-00379-5
Van Wilgenburg S. L., Miller D. A., Iles D. T., Haché S., Francis C. M., Hope D. D., et al. (2024). Evaluating trade-offs in spatial versus temporal replication when estimating avian community composition and predicting species distributions. Avian Conserv. Ecol. 19(1), 11. doi: 10.5751/ACE-02604-190111
Wenger S. J., Olden J. D. (2012). Assessing transferability of ecological models: An underappreciated aspect of statistical validation. Methods Ecol. Evol. 3, 260–267. doi: 10.1111/j.2041-210X.2011.00170.x
Wiens J. A., Stralberg D., Jongsomjit D., Howell C. A., Snyder M. A. (2009). Niches, models, and climate change: assessing the assumptions and uncertainties. Proc. Natl. Acad. Sci. 106, 19729–19736. doi: 10.1073/pnas.0901639106
Keywords: Africa, boosted regression tree models, conservation prioritization, latitudinal change, machine learning, model choices, species diversity, variable selection
Citation: McClanahan TR and Sola E (2024) Comparing modeled predictions of coral reef diversity along a latitudinal gradient in Mozambique. Front. Ecol. Evol. 12:1450383. doi: 10.3389/fevo.2024.1450383
Received: 18 June 2024; Accepted: 30 August 2024;
Published: 30 September 2024.
Edited by:
Sergio Noce, Foundation Euro-Mediterranean Center on Climate Change (CMCC), ItalyReviewed by:
Maria Angeles Perez-Navarro, King’s College London, United KingdomOwusu Fordjour Aidoo, University of Environment and Sustainable Development, Ghana
Copyright © 2024 McClanahan and Sola. This is an open-access article distributed under the terms of the Creative Commons Attribution License (CC BY). The use, distribution or reproduction in other forums is permitted, provided the original author(s) and the copyright owner(s) are credited and that the original publication in this journal is cited, in accordance with accepted academic practice. No use, distribution or reproduction is permitted which does not comply with these terms.
*Correspondence: Timothy R. McClanahan, dG1jY2xhbmFoYW5Ad2NzLm9yZw==