 Matias E. Mac Allister1,2*
 Carlos E. Figueroa1,2
 Regina Mazzei1
 Ramiro G. Tintorelli2,3
 Diana B. Acosta1,2
 Orlando Gallo4
 Diego Castillo2,5
 Emiliano Pinardi1,2
 Virginia D. Zelada Perrone1,2
 Alejandro Rodríguez6
 Juan I. Zanón Martínez2,7
 Mariano L. Merino1,8
 Juan I. Túnez2,9
 Alejandro Travaini2,10
 Gabriela P. Fernández1*
- 1Centro de BioInvestigaciones (CeBio‑CICBA), Universidad Nacional del Noroeste de la Provincia de Buenos Aires (UNNOBA). Centro de Investigaciones y Transferencias del Noroeste de la Provincia de Buenos Aires (CITNOBA‑CONICET), Pergamino, Argentina
- 2Consejo Nacional de Investigaciones Científicas y Técnicas (CONICET), Buenos Aires, Argentina
- 3Laboratorio de Bioingeniería, Instituto Tecnológico de Buenos Aires (ITBA), Buenos Aires, Argentina
- 4Department of Biology and Biotechnologies “Charles Darwin”, University of Rome La Sapienza, Rome, Italy
- 5Laboratorio de Genética para la Conservación (GENCON), Instituto de Ciencias Biológicas y Biomédicas del Sur (INBIOSUR)-CONICET, Departamento de Biología, Bioquímica y Farmacia, Universidad Nacional del Sur, Bahía Blanca, Argentina
- 6Department of Conservation Biology and Global Change, Estación Biológica de Doñana-CSIC, Sevilla, Spain
- 7Instituto Multidisciplinario sobre Ecosistemas y Desarrollo Sustentable, Universidad Nacional del Centro de la Provincia de Buenos Aires (UNICEN), Tandil, Argentina
- 8Comisión de Investigaciones Científicas (CIC) de la Provincia de Buenos Aires, Buenos Aires, Argentina
- 9Grupo de Investigación en Ecología Molecular, Instituto de Ecología y Desarrollo Sustentable (INEDES-UNLu-CONICET, Departamento de Ciencias Básicas, Universidad Nacional de Luján), Lujan, Argentina
- 10Centro de Investigaciones Puerto Deseado, Universidad Nacional de la Patagonia Austral (UNPA), Santa Cruz, Argentina
The puma (Puma concolor Linnaeus, 1771) is the top predator with the widest distribution in America. Since the establishment of European settlers on the American continent, puma populations have experienced significant contractions and reductions in their original distribution. In Argentina, the management of the conflict between humans and pumas (direct persecution and habitat modification) focused on reduction or elimination methods, leading to a drastic contraction, even total eradication, of puma populations as seen in Patagonia and the eastern part of the country. Despite the lack of knowledge about puma population demographic trends, there are taxonomic issues that remain controversial and need to be resolved to implement appropriate management and conservation measures. Therefore, the aim of this study was to genetically characterize puma populations in the central-southern region of Argentina using two mitochondrial markers, evaluate their demographic history, compare our results at a macro-regional level, and discuss our findings in a conservation and management context. A total of 203 individuals were used, and a fragment of the control region and another of ND5 were sequenced. The genetic variability obtained was moderate. Substitution rates for each locus and the tMRCA were calculated from calibrated trees. In a concatenated tree, two main phylogenetic clades were identified (posterior probability = 1), although a reciprocal monophyly was not observed, with a divergence time of 228 thousand years and a 95% CI [117–363 thousand years]. When evaluating population structuring, three genetic clusters were found, one characteristic of the Patagonian region and the others in the central part of the country. Calculating the ФST values for pairs resulted in significant structuring between Patagonia and the rest of the populations, suggesting the arid diagonal as a possible barrier to gene flow. When evaluating the demographic history, neutrality tests would support a recent expansion in Patagonia. These findings are crucial in defining two distinct Management Units (MUs) in the southern part of puma distribution and providing valuable information for management and conservation measures for the species.
Introduction
The Puma (Puma concolor), is the terrestrial mammal with the largest distribution in the Western Hemisphere, occupying historically the entire American continent, from Alaska and northern Canada to the southern tip of Patagonia (Currier, 1983; Sunquist and Sunquist, 2002). In the Neotropics, the Puma is second in weight only to the jaguar (Panthera onca), with males 30–50% larger than females, reaching weights of up to 100 kg (Eisenberg, 1989; Gay and Best, 1995; Jansen and Jenks, 2011). Through its extensive distribution, pumas have adapted to living in a wide variety of ecosystems (Beier, 2010), preying on a diverse range of prey, from rodents to large ungulates (Iriarte et al., 1990). The Puma is often considered a top predator and an umbrella species in several regions (Caro and O’Doherty, 1999; Thorne et al., 2006), playing an important role in biodiversity conservation and as a regulator and shaper of ecosystems (Terborgh et al., 2001; Ripple and Beschta, 2006; Terborgh et al., 2006).
Since European settlers established in the Americas, puma populations have suffered large contractions and reductions in their original distribution (Anderson et al., 2010). Direct persecution by preying on domestic animals, reduction of prey populations, and modification and destruction of habitats have been the major factors reported in the decline and reduction of their populations (Nielsen et al., 2015). It is known that puma populations were extirpated in the eastern United States during european colonization with a management focused on methods of control or elimination (Gill, 2010). However, more recent conservation plans are being implemented in North America, designed to maintain viable puma populations as part of the ecological community (Anderson et al., 2010). In South America, particularly in Argentina, puma management was also focused on reduction or elimination methods, where puma populations suffered drastic contraction, even complete eradication, in their distribution as occurred in Patagonia and eastern Argentina (Chebez, 2009; De Lucca, 2010; Martínez et al., 2010; Chimento and De Lucca, 2014; Brancatelli and Yezzi, 2017). Due to their main function in regulating and structuring ecosystems, rewilding programs are being carried out in Argentina with a central focus on restoring large carnivores, such as the puma (Donadio et al., 2022).
Despite this, the Puma is classified as “Least Concern” in the IUCN Red list of Threatened Species (Nielsen et al., 2015), and by the Argentine Society for the Study of Mammals (Sociedad Argentina para el Estudio de los Mamíferos, SAREM; De Angelo et al., 2019) due to its broad distribution in the western hemisphere. Although being persecuted and extirpated from many areas in the past, Puma´s naturally recolonize environments from which it was eliminated and/or colonize others little or heavily modified by humans, ensuring the survival of this species (Jennings et al., 2015; LaRue and Nielsen, 2016). However, there are exceptions, such as the remaining population of Florida panthers (Roelke et al., 1993), which suffered a strong reduction due to their persecution, which generated drastic losses of genetic variability with consequences on the fertility and survival of individuals (Culver et al., 2008; Johnson et al., 2010; Hostetler et al., 2013; Saremi et al., 2019; van de Kerk et al., 2019; Gustafson et al., 2021).
In Argentina, the Puma, along with other native predators, has been heavily persecuted due to conflicts with farmers (e.g. Bellati and Von Thüngen, 1990; Novaro and Walker, 2005; Walker and Novaro, 2010; Guerisoli et al., 2017). Conflictive situations occur especially in the central-south of the country, where its persecution has been most intense and sustained over time, leading to local extinctions (Bellati and Von Thüngen, 1990; Novaro and Walker, 2005; Chebez, 2009; De Lucca, 2010; Martínez et al., 2010; Walker and Novaro, 2010; Chimento and De Lucca, 2014; Guerisoli et al., 2020). In much of Patagonia, it is considered the primary predator of sheeps (Llanos et al., 2019), replaced only by the Culpeo fox (Lycalopex culpaeus) in areas where pumas were eradicated (Díaz-Ruiz et al., 2020). In the central area of the country it has also been a significant game species (Walker and Novaro, 2010; Zanón Martínez et al., 2016). Management actions undertaken by regional authorities have been limited to compensating producers for losses or offering rewards for hunted pumas (Provincial Law N° XVII 52, 763, 2,373 and 2,539 for Chubut, Río Negro, Santa Cruz and Neuquén, respectively), with no further regulation beyond accepting harvest levels empirically imposed by livestock producers (Llanos et al., 2014).
Beyond the lack of knowledge regarding demographic trends for the puma populations, there are taxonomic issues that remains controversial. Based on morphological and geographical distribution data, 36 puma subspecies have been described (Young and Goldman, 1946; Neff, 1983), seven of which are found in Argentina (Cabrera, 1958). Culver et al. (2000), based on mitochondrial and microsatellite markers data, differentiated six phylogroups. They proposed these groups as distinct subspecies; three of them are distributed in Argentina (Puma c. puma, P. c. cabrerae and P. c. capricorniensis). On the other hand, a study involving the almost complete distribution of the species suggests the existence of three main genetic groups: North America, Central America and South America (Caragiulo et al., 2014). The IUCN relies on this study to recognize a single subspecies for all of South America, Puma c. concolor (Linnaeus, 1771), and another for the rest of America, Puma c. cougar (Kerr, 1792) (Kitchener et al., 2017).
Understanding patterns of genetic variability is essential for reconstructing the evolutionary history of species, defining the boundaries and distribution of different phylogroups, and thereby conserving the genetic pool. However, there is a significant knowledge gap regarding the genetic identity of puma populations across many areas of their range (for example, central and southern Argentina; Culver et al., 2000; Caragiulo et al., 2014). Consequently, the implications for conserving the genetic heritage of the species, particularly in the southern part of the distribution, remain unclear (Gallo et al., 2021, 2023). Molecular tools, as mitochondrial DNA, have proven to be effective in revealing the genetic structure of populations, their evolutionary history and the estimation of genetic variability indices at both the intra and inter population level (Avise, 1998). Furthermore, they have been widely used in phylogenetic and phylogeographic studies in felids (e.g. Johnson et al., 2006; Gómez Fernández et al., 2020), especially in Puma (Culver et al., 2000, 2008; Trigo et al., 2008; Matte et al., 2013; Caragiulo et al., 2014) and to determine ancestral-descendant relationships between taxa (Stoneking et al., 1991; Avise, 1994; Jae-Heup et al., 2001; Johnson et al., 2006; Culver et al., 2008).
Considering the context and the limited knowledge of Puma genetics in Argentina, the objective of this study was to genetically characterize puma populations in the central-southern region of the country using two mitochondrial markers. We aimed to assess its demographic history, comparing our results at a macro-regional level, and discussing our insights into a conservation and management context.
Materials and methods
Study area
The study area includes central and southern Argentina between 31°15’ and 51°51’ south latitude and 72°40’ to 57°52’ west longitude (Figure 1). The study area encompasses seven of the eleven phytogeographic provinces identified by Oyarzabal et al. (2018) in Argentina: Patagonian, Patagonian Monte, Monte, High Andean, Chaco, Pampas, and Espinal; which represents six ecoregions: Patagonian Steppe, Patagonian woodlands, Argentine Low Monte, Espinal, Pampa and Dry Chaco (Brown et al., 2006). An important biogeographic region that crosses the study area in a northwest-southeast direction, and covers many deserts (e.g. Sechura, Atacama, Monte and the Patagonian Desert) is the so-called “South American Arid Diagonal” (“Dry Diagonal”; Figure 1). This area, with an extension spanning from the northern coasts of Peru to the Patagonian coasts of Argentina (Bruniard, 1982) is characterized by being a region of scarce (to null) rainfall, transitioning between drier conditions towards the South and more humid towards the north (Bruniard, 1982).
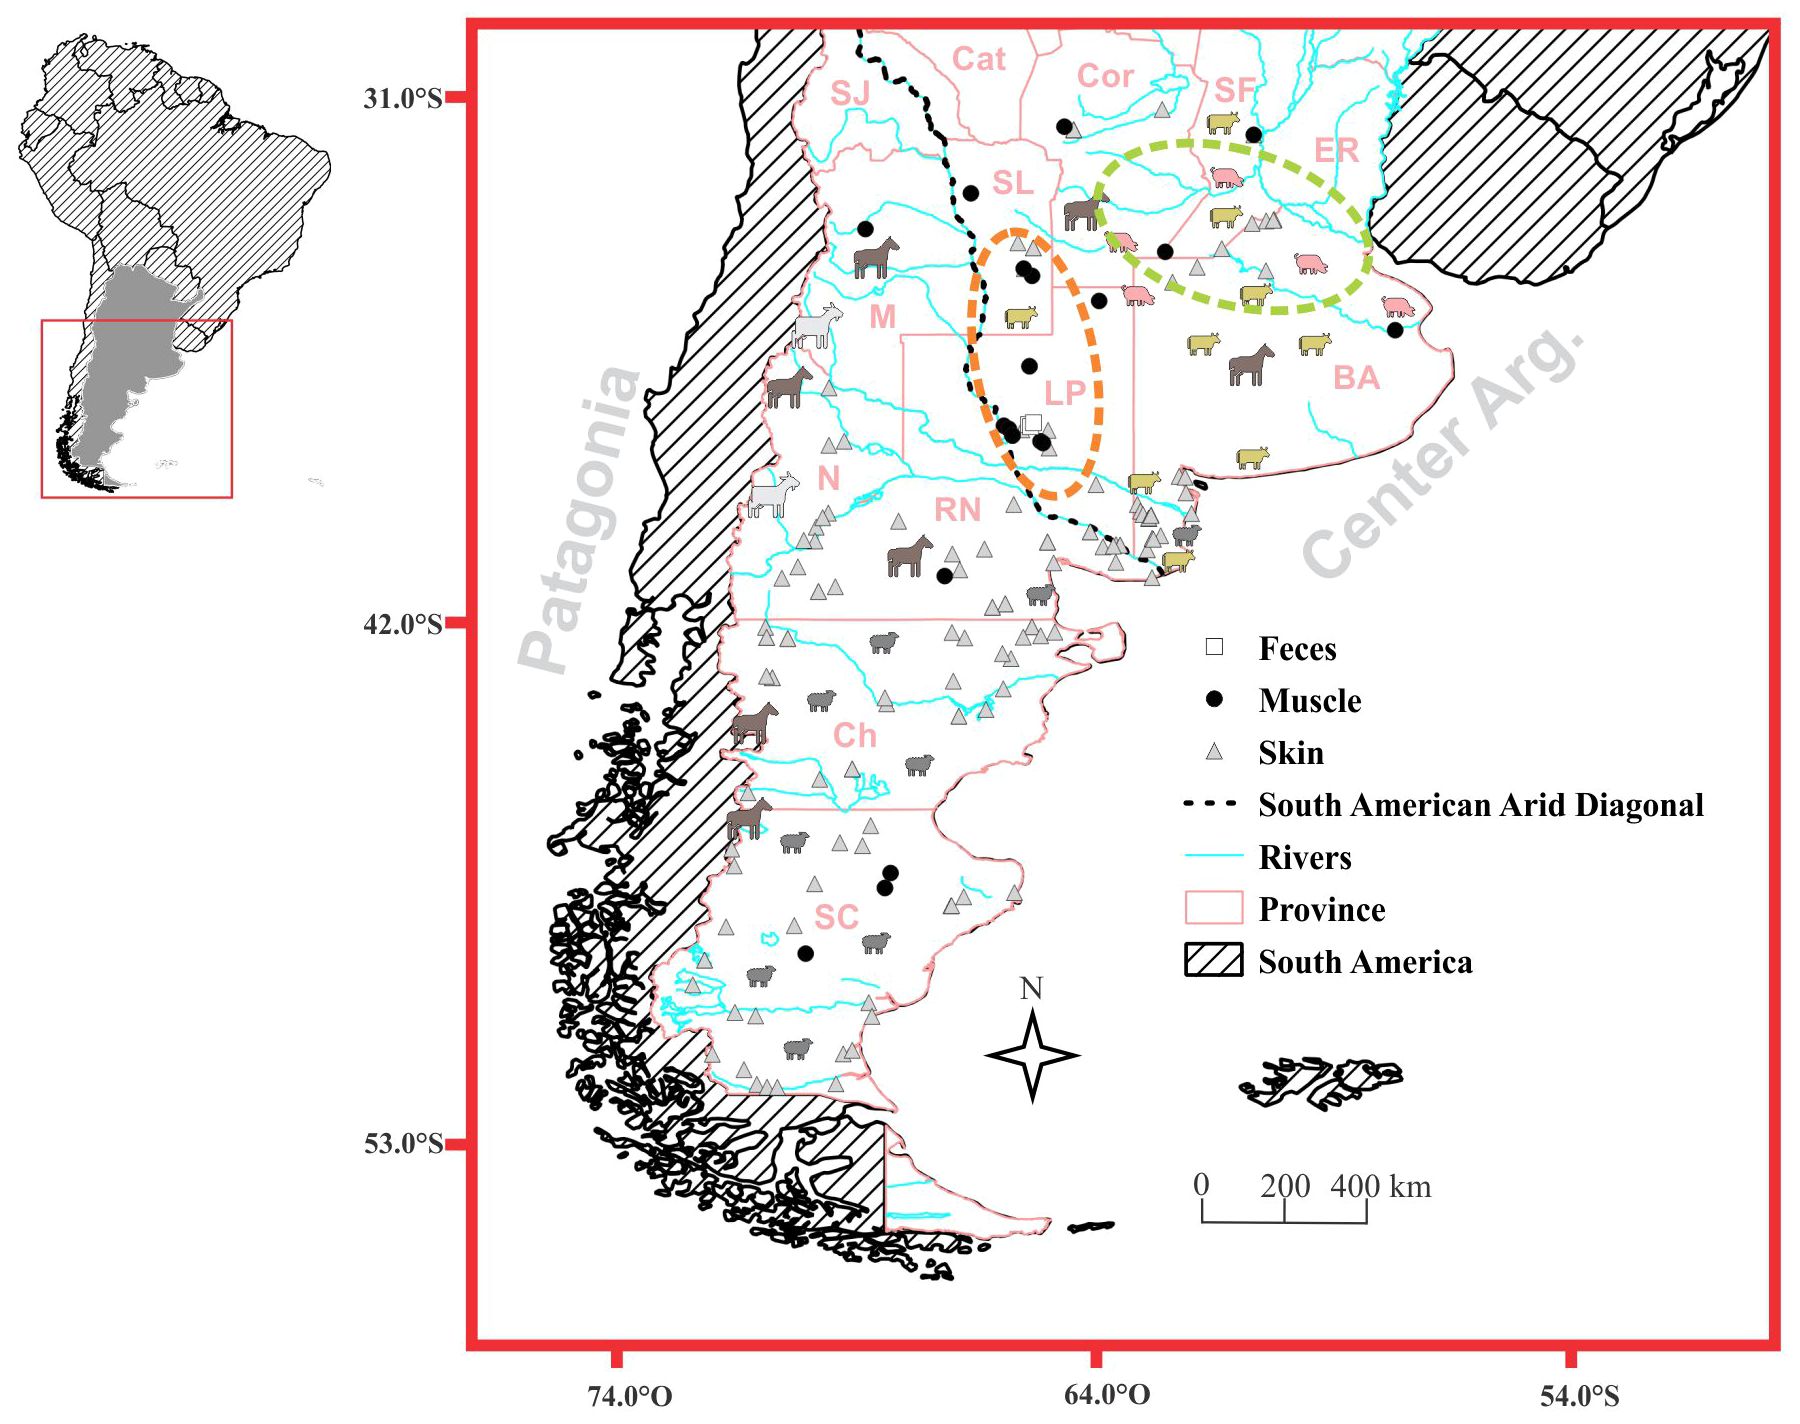
Figure 1. Sample distribution map. The main productive and hunting activities in the study area are identified. The animal silhouettes, the light green ellipse, and the orange ellipse refer to the primary animal production areas, the country’s core cultivation zone, and the region with the highest hunting activity, respectively. The black dotted line indicates South American Arid Diagonal. SC, Santa Cruz; Ch, Chubut; RN, Río Negro; N, Neuquén; M, Mendoza; LP, La Pampa; BA, Buenos Aires; ER, Entre Ríos; Cor, Córdoba; SL, San Luis; Cat, Catamarca and SJ, San Juan.
In the last century, the whole study area experienced a significant reduction of its wildlife due to the advancement of livestock and agricultural activities, affecting most of Patagonia (Novaro and Walker, 2005), the Pampas region (Parera, 2002; De Lucca, 2010, 2011), and a considerable portion of Entre Ríos province. Lately, sheep production covered the 82.3% (7,101,717 heads) of farmlands in Argentina (INDEC, 2021), with a higher concentration in the southern provinces of Patagonia and Buenos Aires. The study area also includes 49% (1,208,347 heads) of goat production, concentrated in the provinces of Neuquén and Mendoza (70.8%). Fifty-seven percent (23,034,785 heads) and 62% (2,232,766 heads) of cattle and pig populations, respectively, are concentrated in the provinces of Córdoba, Santa Fe, and Buenos Aires, where the highest value was reported also for horse population (21%; INDEC, 2021).
Central-south Argentina corresponds to the country’s agriculture core zone (northern Buenos Aires, southern Córdoba and Santa Fe province), with more than 24,115,143 (65.7% of the country) hectares of production located in our study area (INDEC, 2021). Additionally, Patagonia region is characterized by an extensive presence of mining and oil companies (INDEC, 2017), which have an important role in modifying the natural habitats and influencing puma presence and behavior.
Finally, game hunting is also a common practice, particularly in La Pampa province (Walker and Novaro, 2010; Zanón Martínez et al., 2016).
Sample collection
Tissue samples were collected in the field (individuals run over or hunted) or from samples previously deposited in biological collections (Supplementary Table S1). The last ones were mainly represented by material collected under the provincial legal hunting regimes of Santa Cruz, Neuquén, Chubut, and Río Negro province (Supplementary Table S1). Tissue samples were preserved in 96% alcohol. For each scat sample, we collected approximately 0.5 mL of fecal material and stored it at ambient temperature in 2 sterile, 2-mL screw-top tubes filled with dimethyl sulfoxide saline solution (DETs buffer; Seutin et al., 1991).
All samples were georeferenced (Supplementary Table S1) and stored at-20°C until their characterization at the Bioresearch Center (Pergamino, Argentina).
Mitochondrial DNA extraction and PCR amplification
Genomic DNA from tissue samples was obtained following extraction protocols with CTAB (Doyle and Doyle, 1987) or the Phenol-Chloroform protocol (Sambrook and Russell, 2006). For fecal samples the Guanidinium Thiocyanate/Silica method (GuSCN—Boom et al., 1990) was employed. After that, DNA was purified using a commercial kit (Monarch Genomic DNA Purification Kit, BioLabs), following the manufacturer’s recommendations.
A 750 bp fragment of the NADH dehydrogenase subunit 5 gene (ND5) and a 430 bp fragment of the conserved mitochondrial control region (CR) were amplified using the ND5-DF1 and ND5-DR1 primers (Trigo et al., 2008), and PDL3N (Culver et al., 2008), and RCP_R (5´-GTCCTGTGACCATTGACTGA-3´, self-designed) primers, respectively. PCR amplifications were performed in a final volume of 20 μL, containing 25–100 ng of template DNA, 0.2 μM of each primer, 0.2 mM dNTP, 1x TAS reaction buffer, 1.5 mM MgCl2, 0.5U of Taq T-Plus DNApolymerase and ultrapure sterile water to came to final volume. Thermocycling conditions for ND5 were as described in Tchaicka et al. (2007). For the control region, thermocycling consisted of 94°C for 2 min, followed by 30 cycles of denaturing at 94°C for 45 s and annealing at 62°C for 45 s and extension at 74°C for 1.5 min. Negative controls were included in all PCR runs to check for contamination.
Amplification success was confirmed by electrophoresis on 1% (w/v) agarose gel, stained with ethidium bromide and visualized under UV light. Amplification products were purified using 10U of Exonuclease I and 1U of FastAp thermosensible alkaline phosphatase (ThermoFisher Scientific). The purified DNA products were sent to an external laboratory (Macrogen Co. Ltd., South Korea) for direct sequencing using the same oligonucleotide primers.
The obtained sequences for both markers were visualized and aligned using the Clustal W algorithm and checked for accuracy and edited using BioEdit (Hall, 2004).
Data analyses
Genetic diversity
Genetic variability was estimated by determining the number of haplotypes (Ha), polymorphic sites per sampling location (SP), haplotype diversity (Hd), nucleotide diversity (π), and the mean number of pairwise differences (k) using DnaSP 6.0 (Rozas et al., 2017).
Phylogenetic analysis
Prior to any analysis, the retention of phylogenetic signals was checked for both data sets (ND5 and CR) using the Xia et al. (2003) test, implemented in the DAMBE program (Xia and Xie, 2001). This test estimates a sequence saturation index (Iss) and compares it to a critical saturation index (Iss.c) generated by a randomization process with 95% confidence. In this context, this test analyzes whether the observed Iss is significantly less than the estimated Iss (Iss.c). IssSym, assuming a symmetric topology, and IssAsym, assuming an asymmetric topology represent such estimated value; both topologies are taken into account. Our sequences are suitable for a phylogenetic study since they meet this condition (Supplementary Table S2).
Likewise, we examined the congruence of substitution rates between each data sets using the partition homogeneity test (Farris et al., 1995), as implemented in PAUP* (Swofford, 1998). Their congruence (P = 0.48) allowed the concatenated fragment (ND5+CR) to be used for subsequent analysis.
Additionally, the molecular evolution models that best fit both datasets were estimated using the Corrected Akaike Information Criterion (AICc) through the jModelTest software (Posada, 2008).
Phylogenetic inferences were conducted independently for each dataset (ND5 and CR) using five calibration points (Table 1) through the BEAST 2.5.2 software (Bouckaert et al., 2019). In both cases, sequences from the superfamily Feloidea (Carnivora - Feliformia) retrieved from the GenBank database were included (Supplementary Table S3). The family Felidae (subfamilies Felinae and Pantherinae) was used as the ingroup and Prionodontidae as the outgroup (Supplementary Table S3).
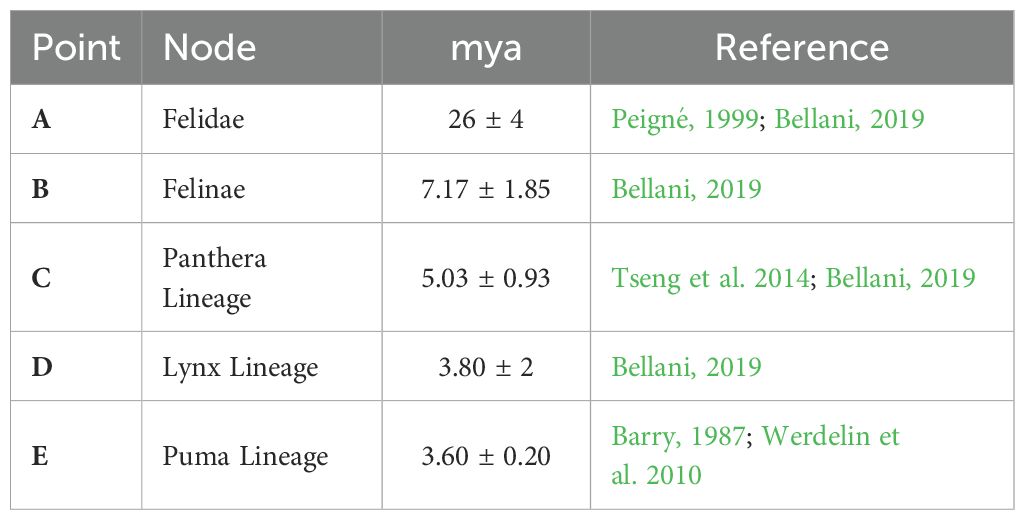
Table 1. Calibration nodes used in this study (A–E), ages are expressed in million years ago (mya), lognormal distribution was used in every node and publication reference of each one is shown.
The log-normal distribution was employed for the calibration points, enforcing monophyly for each of these nodes. A relaxed lognormal clock model and a calibrated birth-death branching rate were utilized (Heled and Drummond, 2014).
For each dataset, two independent runs of 5x10⁷ Markov chain Monte Carlo (MCMC) generations were executed, sampling every 5,000 generations. Mutation rates were estimated for both markers. Convergence of the posterior distribution for all runs (ESS values > 200 for each dataset) was determined using Tracer 1.7.1 (Rambaut et al., 2018). Log files and trees were combined using LogCombiner 2.5.2 (Drummond and Rambaut, 2007), trees were summarized using the maximum clade credibility (MCC) option in Tree Annotator 2.5.2 (Bouckaert et al., 2019), and the final tree was visualized in FigTree 1.4.4 (Rambaut, 2018).
The estimated mutation rates and time to the most recent common ancestor (tMRCA) were used to perform a Bayesian phylogeny considering only puma samples from concatenated sequences (n = 141; 901 pb) using BEAST 2.5.2 software (Bouckaert et al., 2019). For this dataset, two independent runs of 5x10⁷ MCMC generations were executed, sampling every 5,000 generations. Two separate partitions were employed: ND5 and CR, utilizing substitution models and mutation rates that were estimated for each marker in the calibrated phylogenies.
Genetic structure and phylogeography
Haplotype networks were constructed using the median-joining algorithm (Bandelt et al., 1999) using the PopART software (Leigh and Bryant, 2015). One network was created using haplotypes from the concatenated sequence dataset, while the other included haplotypes obtained for ND5 along with those obtained by Matte et al. (2013). The latter was conducted to integrate our data into a South America context. Finally, in order to polarize the ND5 haplotype network, a short sequence (240pb) from an ancient southern patagonian puma specimen (Puma concolor, GenBank ID: KU884292.1; Metcalf et al., 2016) was incorporated into the analyses.
To analyze the genetic structure and identify the possible existence of differentiated genetic groups, the concatenated sequence dataset was used to perform the clustering analyzes. The calculation was performed by testing the number of clusters (K) from 2 to 10, with five replicates for each K, through a Bayesian analysis using BAPS v6 (Corander et al., 2008). Additionally, an Analysis of Molecular Variance (AMOVA) was conducted using Arlequin 3.5 software (Excoffier and Lischer, 2010). The significance of the observed Ф-statistics was tested using the null distribution generated from 10,000 nonparametric random permutations of the data matrix variables. Population pairwise ФST values were also calculated using Arlequin 3.5, applying Bonferroni correction (Rice, 1989). Based on the subspecies proposed by Culver et al. (2000), three groups were considered in the AMOVA analysis: one in Patagonia corresponding to P. c. concolor, another in central Argentina corresponding to P. c. cabrerae, and a third group (hereafter referred to as the ‘buffer zone’) containing sequences from a 100 km strip on either side of the distribution boundary assigned to the subspecies. This area was arbitrarily defined to visualize better the patterns of puma variability in the southern part of its distribution.
Historical population dynamics
The demographic history of populations was studied using two different methods. First, Tajima’s D (Tajima, 1989), Fu’s Fs (Fu, 1997) and Fu and Li´s (Fu and Li, 1993) neutrality tests were carried out using Arlequin 3.5. The analysis was performed using 1000 iterations for the three data sets (ND5, CR, and concatenated sequences). Significant negative values of Tajima’s D and Fu’s Fs are indicative of an excess of low-frequency mutations and are consistent with a demographic expansion or purifying selection. Second, to estimate the shape of the population change over time, the Bayesian Skyline Plot (BSP) implemented in BEAST 2.5.2 (Bouckaert et al., 2019) was carried out only for the concatenated sequences dataset. The molecular evolution models for each locus were calculated using the Corrected Akaike Information Criterion (AICc) through the jModelTest software (Posada, 2008). Four independent runs of 5x10⁷ MCMC generations were executed, sampling every 5,000 generations. Skyline reconstruction was performed in Tracer 1.7.1 (Rambaut et al., 2018), and the median and 95% credibility interval were plotted as a time function.
Results
Genetic diversity
We obtained 162 and 180 sequences for ND5 and CR fragments, respectively (Table 2; Supplementary Table S1). The ND5 sequences showed 14 variable sites (10 unique polymorphisms, and four informative by parsimony) defining 10 haplotypes. For the CR set of sequences, 11 polymorphic sites (one unique polymorphism and 10 informative by parsimony) and 11 haplotypes were obtained. Furthermore, 22 variable sites (10 unique polymorphisms and 12 informative due to parsimony) and 17 haplotypes were obtained for the concatenated sequences dataset (n = 141) (Supplementary Table S4). The full set of mtDNA haplotypes generated for each locus (eleven for RC and ten for ND5) were deposited in GenBank under accession numbers: PP952688 to PP952689 and PP952691 to PP952698 for ND5 and PP952699 to PP952709 for CR sequences (Supplementary Table S1).
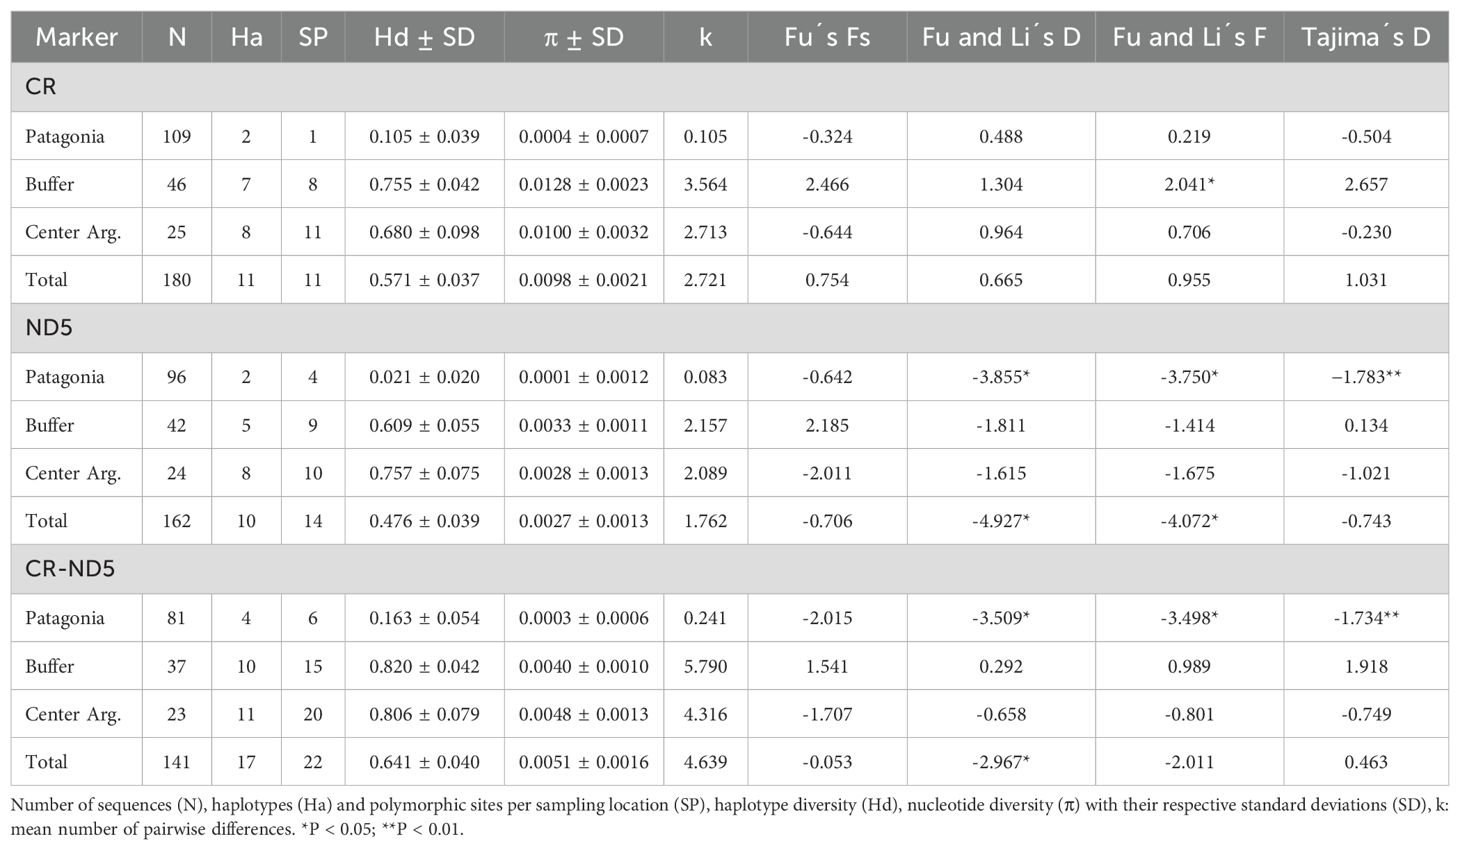
Table 2. Genetic diversity and neutrality test for P. concolor populations.
For the three sets of mitochondrial sequences, congruent values of genetic variability were observed (Table 2). Particularly for the concatenated sequences dataset, both the haplotype and nucleotide diversity were moderate (Hd = 0.641 ± 0.040 and π = 0.0051 ± 0.0016), with lower values in Patagonia (Hd = 0.163 ± 0.054 and π = 0.0003 ± 0.0006) and higher in central Argentina (Hd = 0.806 ± 0.079 and π = 0.0048 ± 0.0013). The presence of a high number of haplotypes in La Pampa and southern San Luis provinces stands out from the rest of the provinces (Supplementary Table S1).
Phylogenetic analysis
The phylogenetic relationships obtained from both ND5 and CR datasets, were highly congruent with each other. The different families and subfamilies of the superfamily Feloidea were recovered with high posterior probability values (Supplementary Figure S1) and the puma lineage was a very well-supported monophyletic clade with maximum posterior probability (=1) in both phylogenies.
Mutation rates estimated from the calibrated phylogenies were 0.0115 (SD: 0.0002) substitutions per site per million years for CR and 0.0190 (SD: 0.00007) for ND5. The tMRCA estimated for the puma lineage was 3.616 [3.385–3.870] and 3.623 [3.390–3.840] million years for ND5 and CR, respectively.
Using the mutation rate obtained for both molecular markers from the calibrated phylogenies and the tMRCA for the puma lineage, three independent Bayesian trees were made from the concatenated set of sequences, and a consensus tree was obtained for the puma lineage (Figure 2). Two monophyletic clades are distinguished with an estimated divergence time of 0.228 million years with a 95% CI [0.117–0.363 million years]. Clade I correspond mainly to individuals from Patagonia, while Clade II corresponds to those of central (Figure 2; Supplementary Table S1). The divergence time of the pumas that form clade I and Clade II are 0.046 million years with a 95% CI [0.010–0.094] and 0.172 million years with a 95% CI [0.068–0.231], respectively (Figure 2).
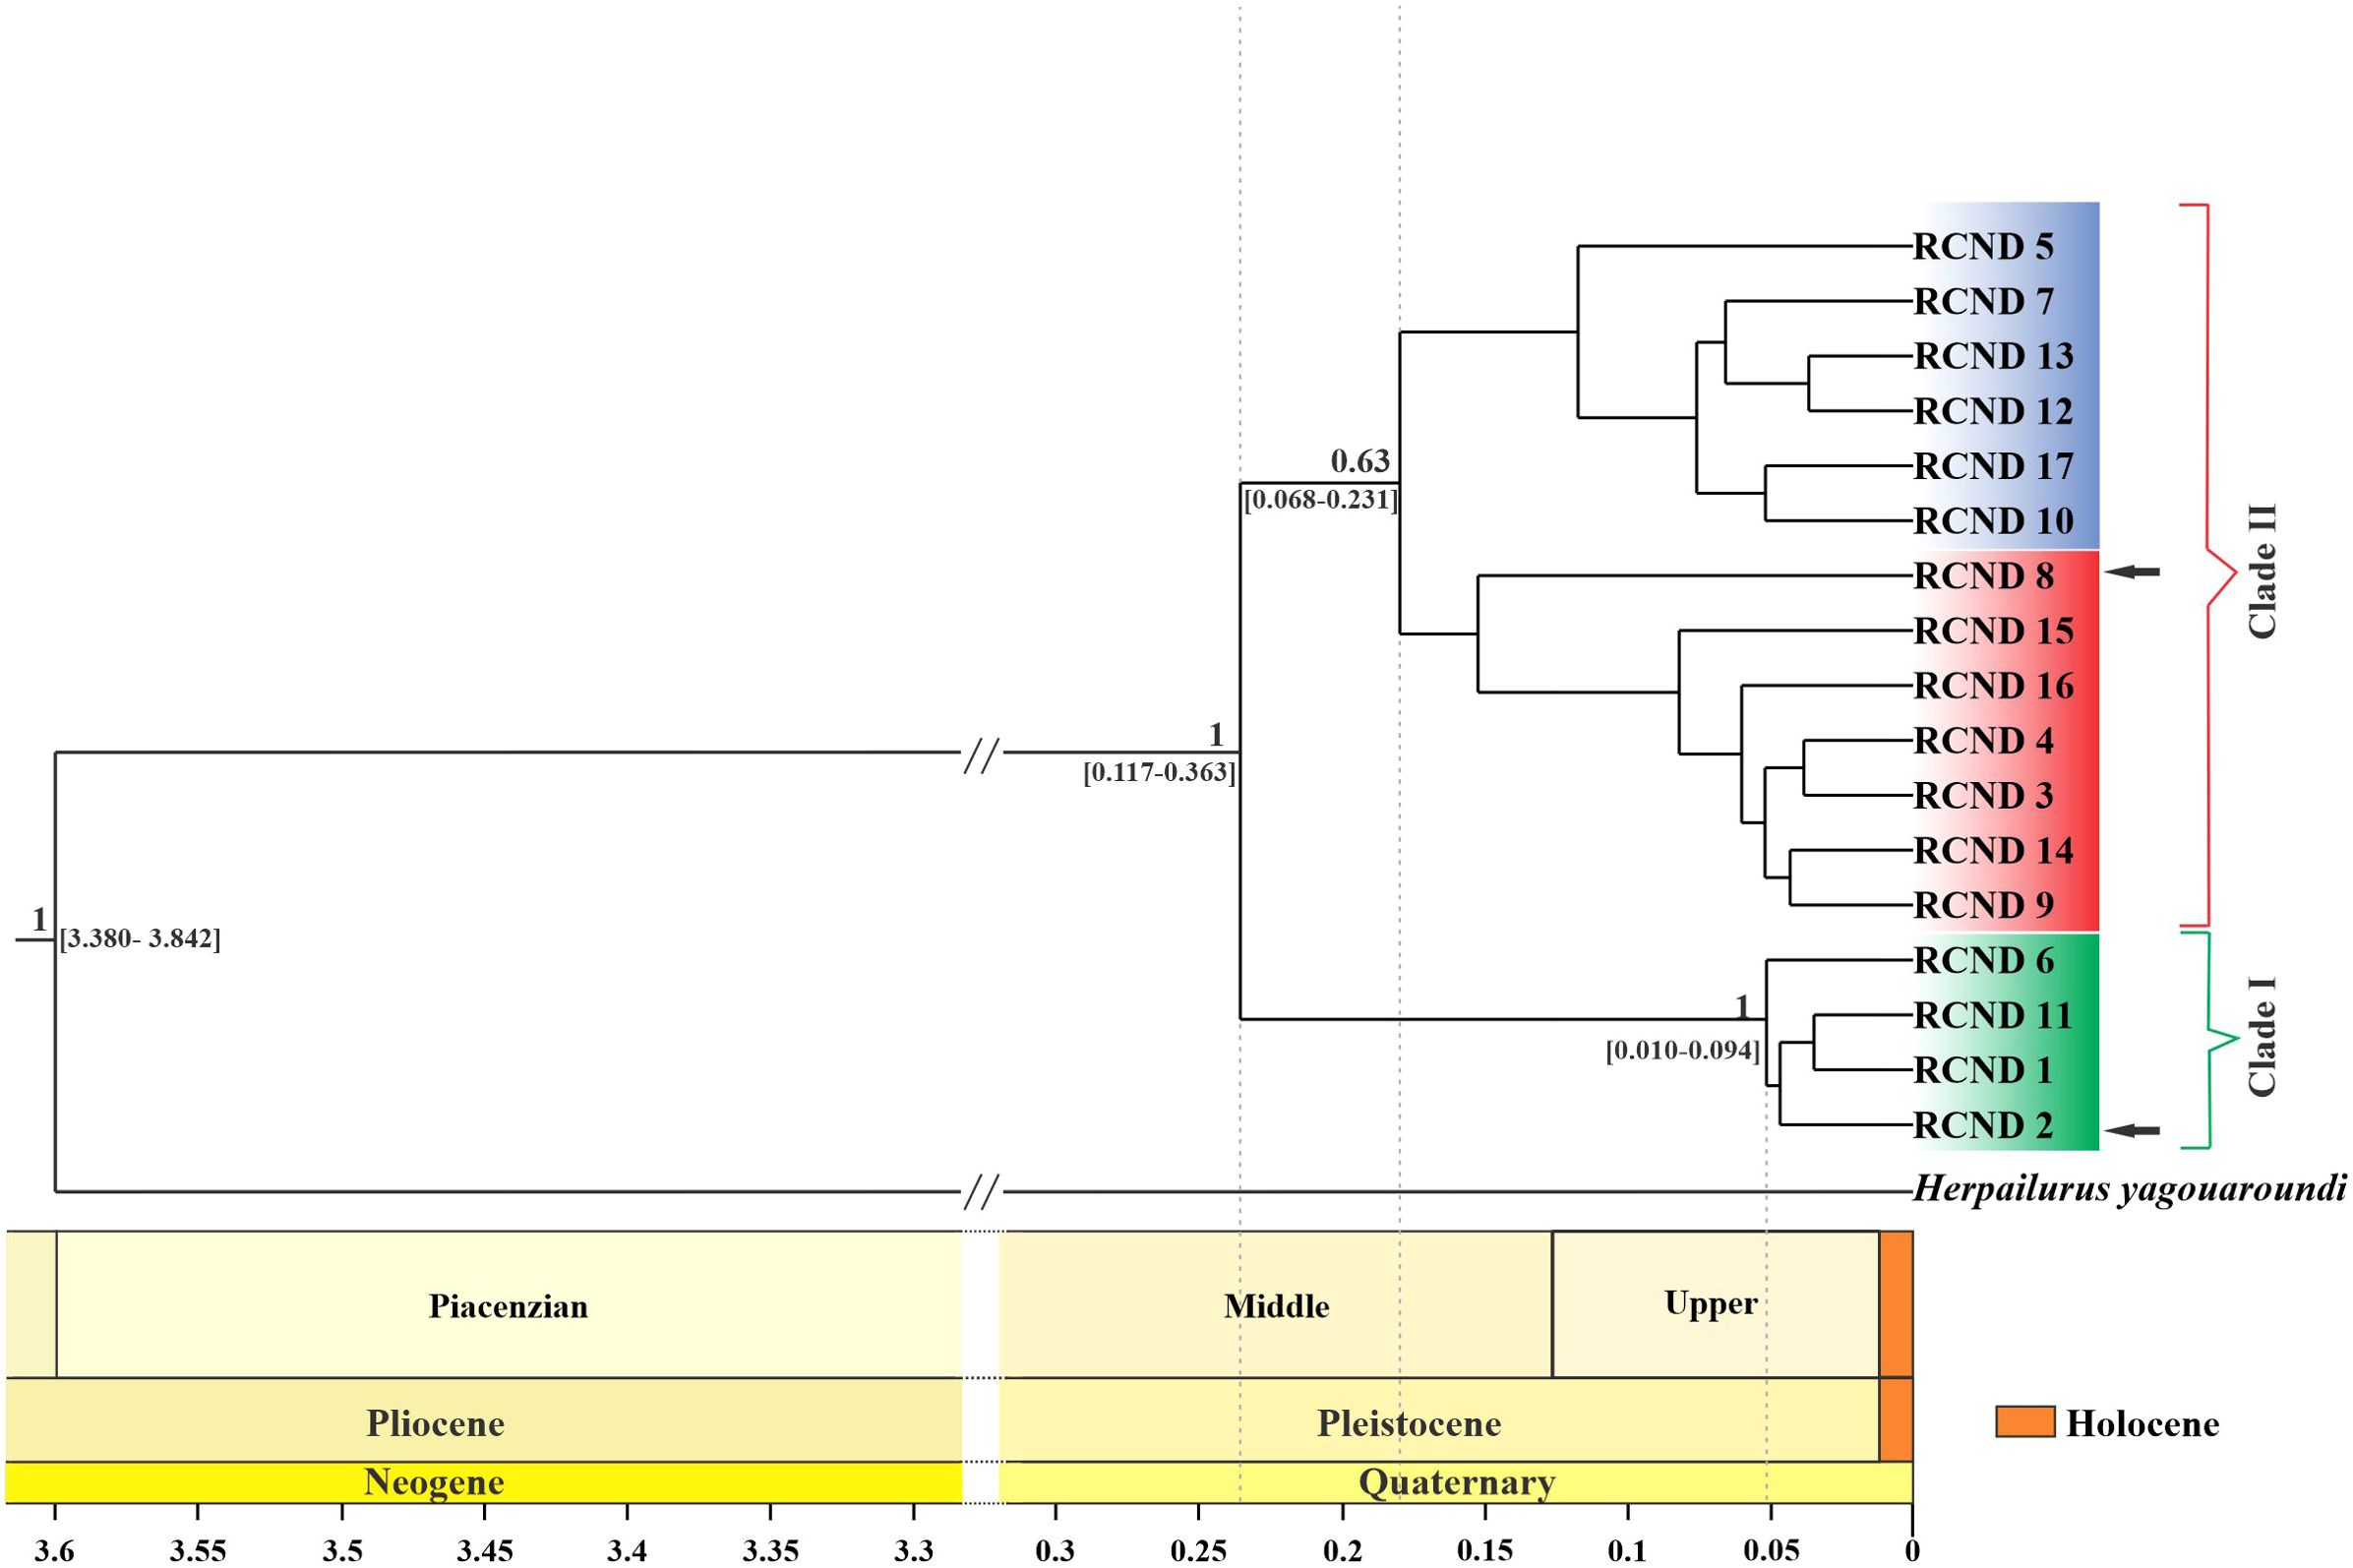
Figure 2. Bayesian consensus time-tree of Puma concolor based on concatenated mtDNA (ND5 and control region) sequences. Values above nodes correspond to posterior probabilities > 0.60. The age of the most recent common ancestor of P. concolor was estimated at 0.228 Ma (95% highest posterior density = 0.117 to 0.363 Ma). The green, red and blue boxes refer to clusters I, II and III, respectively. The black arrows mark haplotypes that belong to one clade but are also found in the biogeographic zone of the other clade.
Genetic structure and phylogeography
The two main groups recovered in the phylogenetic tree can be observed in the haplotype network obtained from the concatenated sequences (Figure 3A). It can be seen that there are seven haplotypes (RCND_4, RCND_5, RCND_7 and RCND-14 to 17) that are found only in the central region of the country. In the buffer zone, haplotypes from both central Argentina and Patagonia are found, and four haplotypes exclusive to that region (RCND_6 and RCND_11 to 13; Figure 3A). Only one shared haplotype was observed in the three regions analyzed (RCND_2).
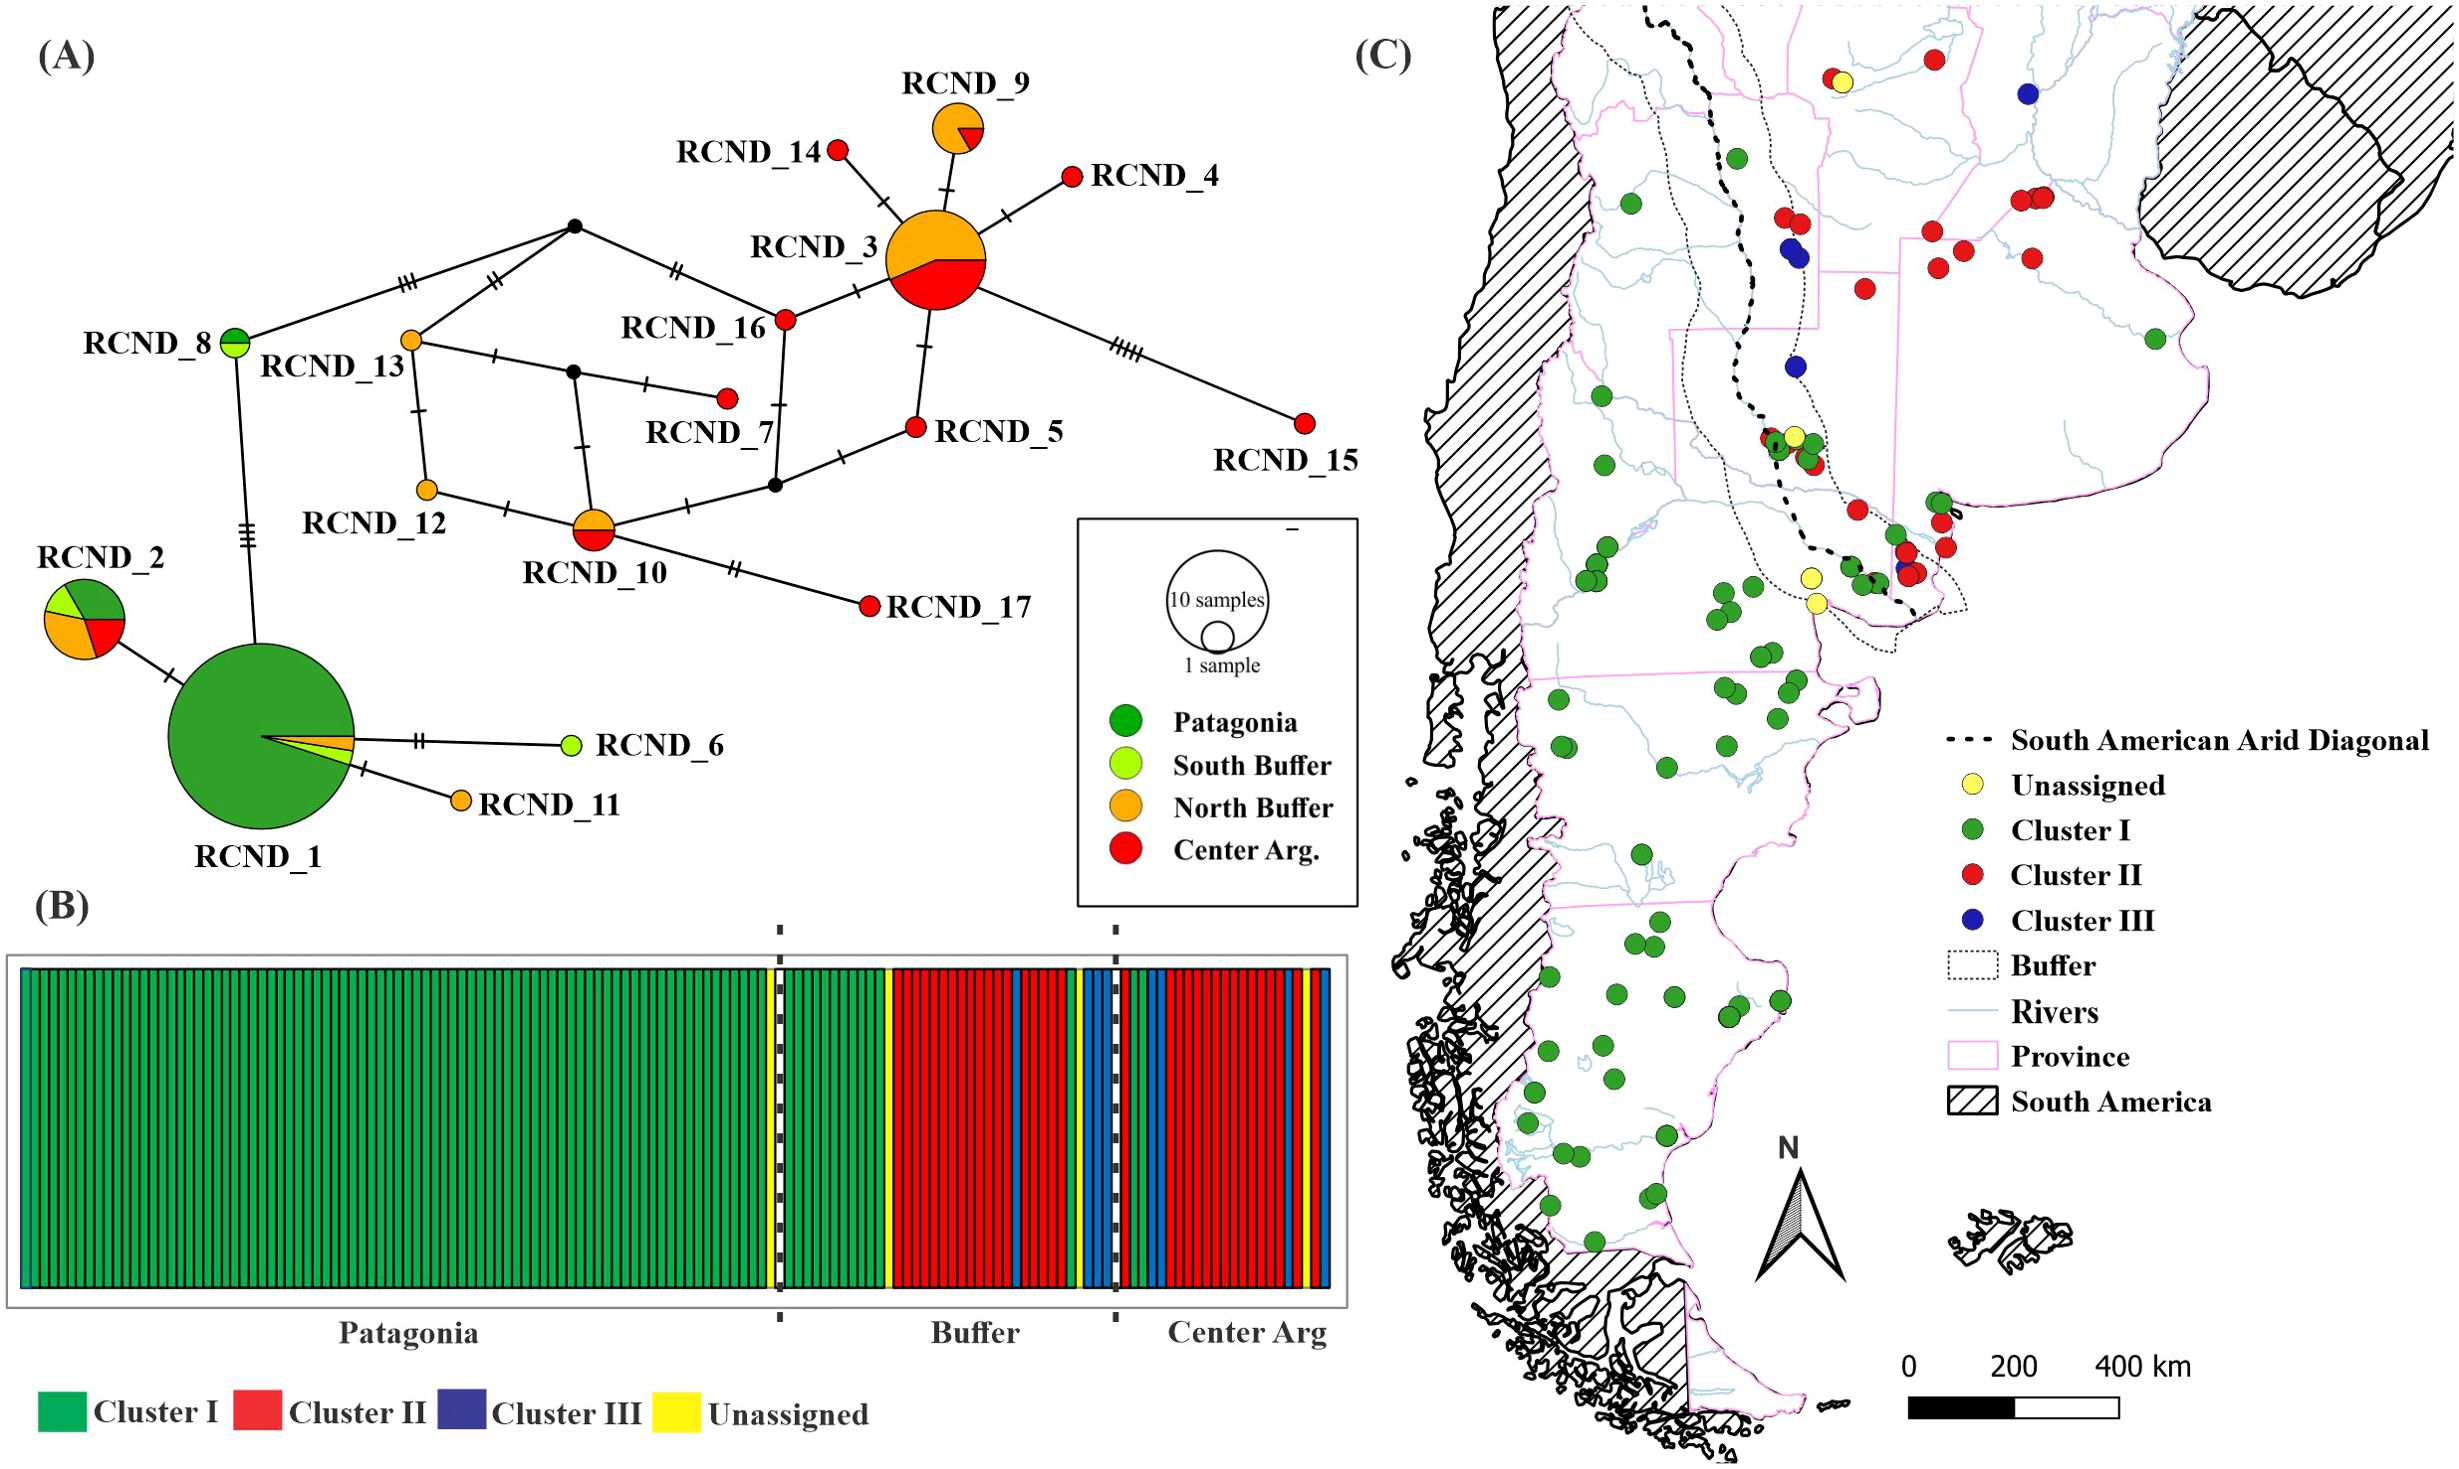
Figure 3. Phylogeography. (A) Haplotype network. (B) mtDNA genetic clusters obtained by BAPS (best K = 3, Log marginal likelihood = -323.583). (C) Distribution of the Clusters in the study area. Dotted line indicates South American Arid Diagonal.
In the network that groups the haplotypes for ND5 obtained in this work together with those obtained by Matte et al. (2013) (Supplementary Figure S2), is observed that Patagonia and central Argentina are separated by a number of mutations higher than the observed between each of these areas and the central haplotype of Brazil (ND_11; Supplementary Figure S2). By reducing the ND5 fragment to 240 bp to include the sample from the ancient puma specimen, 12 haplotypes were obtained. The ancient puma clustered together with individuals from central Brazil, central Argentina and one sample from Buffer zone (Supplementary Figure S3).
The Bayesian analysis of population clustering resulted in three genetic clusters and four individuals not assigned to any of them (Log marginal likelihood = -323.583; Figure 3B). While clusters II (n =33) and III (n = 8) are found exclusively in central Argentina, cluster I (n = 96) occupies all Patagonia and few localities in the buffer zone and central Argentina (Figure 3C). Besides, the pairwise ФST values showed a significant structuring between Patagonia and the other genetic clusters (Supplementary Table S5).
Historical population dynamics
For the entire study area, the expansion hypotheses was supporting from the concatenated loci with negative values for the neutrality tests of Fu (Fs = -0.053), Fu and Li’s F (-2.011), and Fu and Li’s D (-2.967), although only the last one was significant (p-value ≤ 0.05; Table 2). The Tajima test showed a positive but non-significant value for D (D = 0.463; P = 0.67). In the Patagonian region, negative values were observed for all tests, with only the Fu’s Fs being non-significant for the population expansion signal (Table 2).
Concerning the results for each locus, a similar situation was observed for ND5, with negative and significant values in Patagonia and globally. Still, no sign of expansion at any scale was observed for CR (Table 2).
The demographic scenario presented by the Bayesian Skyline Plot for all individuals denotes a demographic stability with a slight trend to increase near 7,000–8,000 years ago (Figure 4).
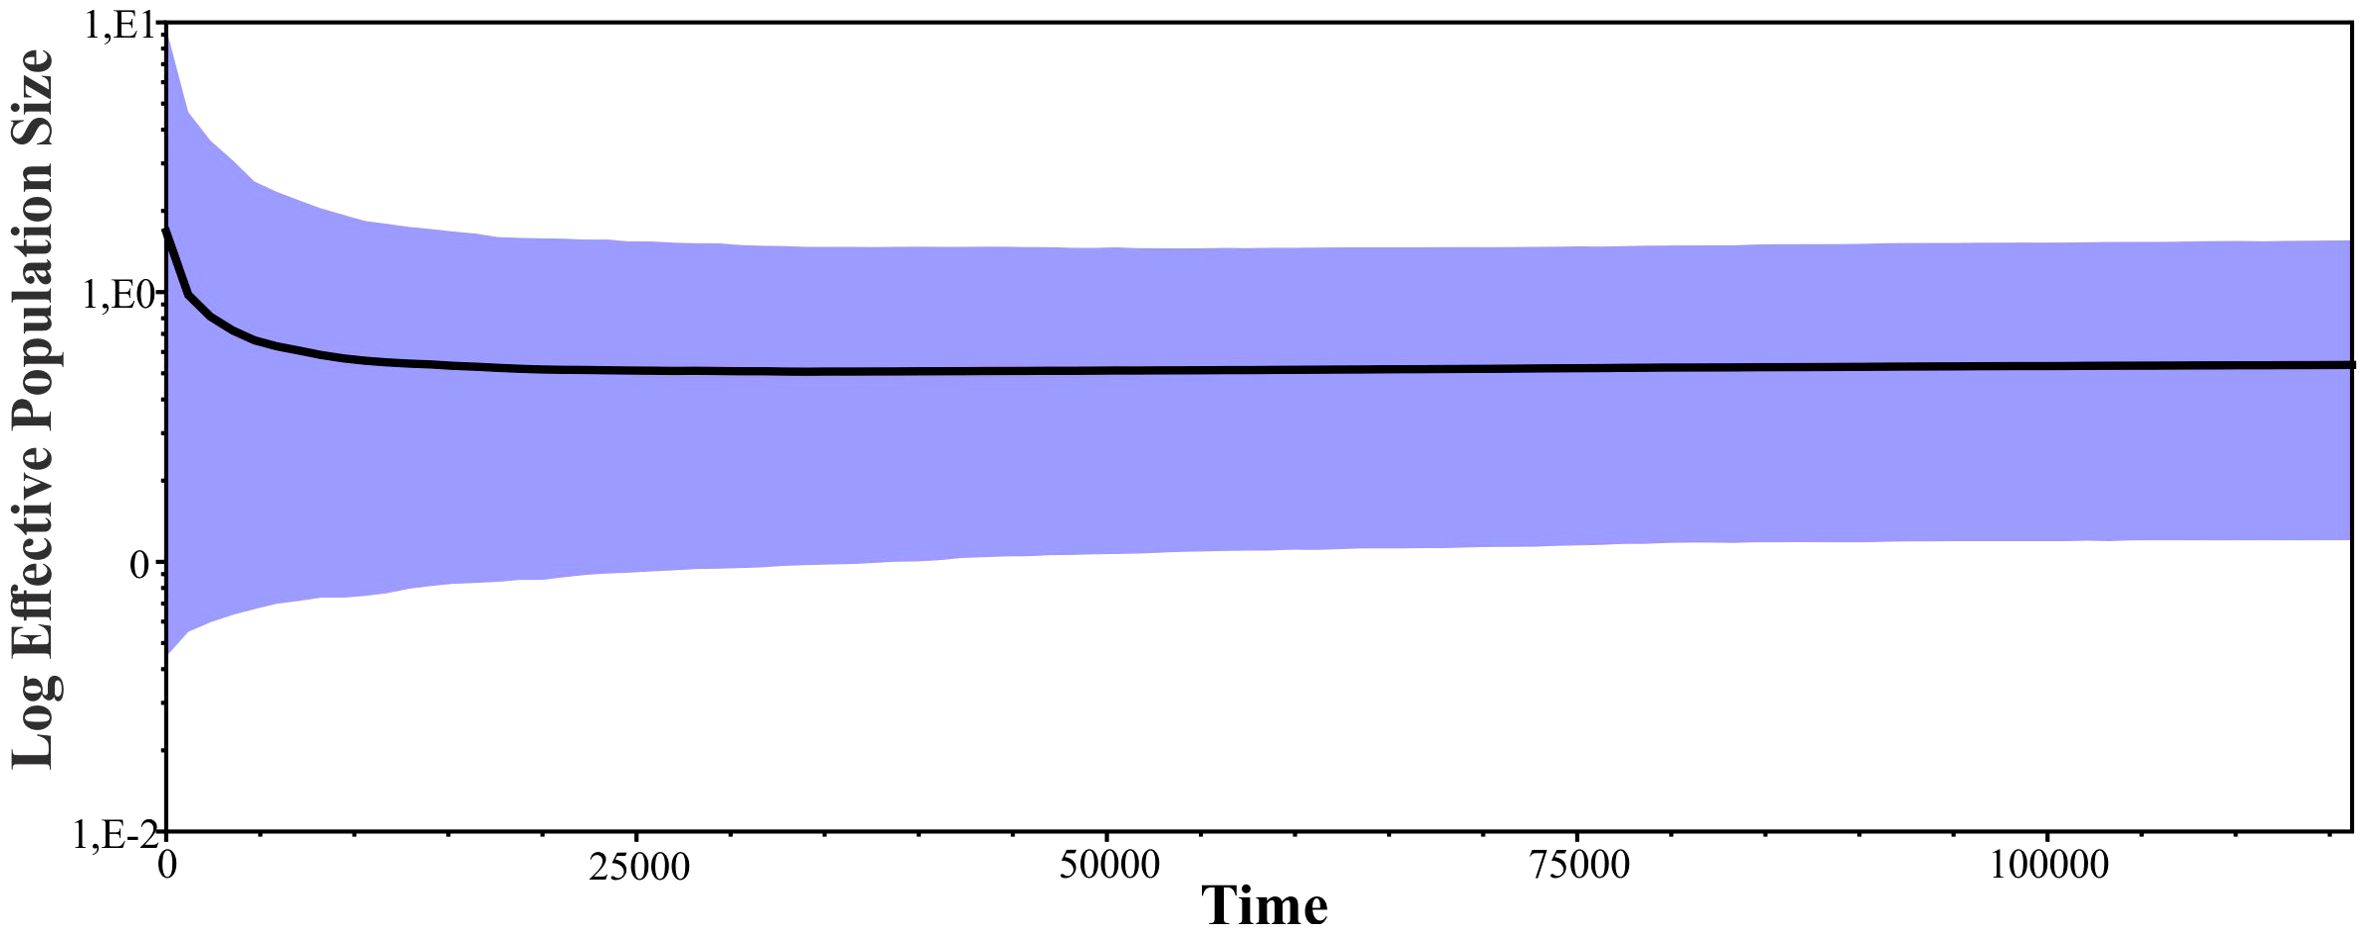
Figure 4. Bayesian Skyline Plot. Bold line indicates the mean of Ne (effective population size) through time and the colored areas represent the 95% highest posterior densities over the mean estimates along the coalescent history of the species.
Discussion
Starting from a representative sample of Patagonia and Central-Western Argentina, our work addresses for the first time the matrilineal history of the Puma in the region. Our results reveal the low genetic variability of the species throughout the south of its distribution, slight signs of expansion processes, as well as genetic differentiation between populations north and south of the South American Arid Diagonal.
Genetic diversity
The genetic variability found in this study was moderate compared to that reported for pumas (Matte et al., 2013) and other felines (Trigo et al., 2008; Gómez Fernández et al., 2020). Seventeen haplotypes (concatenated loci) were identified, while 22 were found in the sampling across all of South America by Matte et al. (Matte et al., 2013; ND5), and 11 haplotypes by Culver et al. (Culver et al., 2000; ND5, 16S, and ATPase-8), and Caragiulo et al. (Caragiulo et al., 2014; Cytochrome b, 12S, 16S, and ATPase-6), providing the potential of the marker used in this work for phylogenetic studies.
If we compare our results for concatenated loci with those obtained for Southwestern South America (SWSA, that includes our region called Patagonia and southern and northern Chile) by Matte et al. (2013) we can observe, that despite using two loci, the variability of haplotypes and nucleotides found (Hd = 0.163 ± 0.054 and π = 0.0003 ± 0.0006) is lower than Matte et al (Matte et al., 2013; Hd = 0.595 ± 0.073 and π = 0.00334 ± 0.00032). When comparing our results only for ND5, it can be seen that the variability is even lower. This difference can be explained by the variability contributed by the haplotypes from northern Chile (Matte et al., 2013), absent in our study.
This reduction in genetic variability can be attributed to several main factors, among them, species tend to be less variable at the edges of their distribution due to the founder effect and genetic drift, as was found for pumas in previous works (Culver et al., 2000; Matte et al., 2013). Similar results were reported for the Geoffroy’s cat, Leopardus geoffroyi, which shows greater variability in the center of its distribution than in peripheral areas (Gómez Fernández et al., 2020). On the other hand, Puma may have undergone a recent bottleneck as those detected in the north and central Patagonia mainly caused by intense human persecution (Gallo et al., 2020, 2021). In addition, it is necessary to consider that the desertification caused by the livestock activity (Del Valle et al., 1998; Aagesen, 2000; Oliva et al., 2016) could have led to a decrease in abundance and composition of plant species in Patagonia, a lower abundance of prey and ultimately a decline in biodiversity (Peri et al., 2016). This impoverishment of the Patagonian ecosystem could lead to a reduction in connectivity and gene flow between feline populations (Gallo et al., 2020, 2021).
In relation to the pumas of the central region of Argentina, our estimates of genetic variability (Ha = 11; Hd = 0.806 ± 0.079) were similar to those obtained by Matte et al. (2013) for Central-Southern South America (CSSA: central and northern Argentina, Uruguay, southern Bolivia and central-western Brazil; Ha = 6; Hd = 0.810 ± 0.078), even though our study region is approximately half of the study area covered by Matte et al. (2013). For this reason, we consider that it is necessary to expand sampling to the north of the country to be able to characterize the complete diversity in the south of the species distribution.
Phylogenetic analysis
Both phylogenies (ND5 and CR) using five calibration points based on fossil data (Table 1, Supplementary Figure S1), showed topologies and divergence times consistent with each other (confidence intervals broadly overlapping in all estimates) and comparable with those published in previous studies (Culver et al., 2000; Johnson et al., 2006). However, the estimated tMRCA for the puma lineage obtained from ND5 (3.616 [3.385–3.870]) and from CR (3.623 [3.390–3.840] million years) were lower than those previously reported: 4.2 million years (Culver et al., 2000) and 4.92 (3.86–6.92) (Johnson et al., 2006). Despite this, the divergence time for pumas obtained from the concatenated dataset (0.228 [0.117–0.363] million years) is similar to the estimate by both Matte et al. (2013) for South American pumas (0.211 [0.091–0.353] million years) or Culver et al. (2000) across the entire distribution (0.318 million years). Although, our results present more narrow confidence intervals, thereby confirming that the inclusion of several calibration points located adjacently on deep nodes of the phylogenetic tree allows greater precision in estimating divergence times (Zheng and Wiens, 2015; Caraballo and Rossi, 2018). Moreover, by obtaining similar divergence times and observing in the haplotype network for ND5 that the groups are well differentiated (Supplementary Figure S2), we can see that the separation of the phylogroups obtained in this work is as ancient as the diversification of all South American pumas.
Genetic structure and phylogeography
The diversification in two main clades observed in the Bayesian Tree (Figure 2), as well as in the haplotype network topology (Figure 3A), shows a high correspondence with the population groups defined north and south of the South American Arid Diagonal. Bruniard (1982) has proposed that this area, a transition zone between drier conditions towards the South and more humid towards the north, could be a divisor between ‘good’ and ‘poor’ niches for many species, and lead to the evolution of different adaptive forms in response to these environmental conditions. The Arid Diagonal has proven to be a distribution limit for some felid species such as Panthera onca (Seymour, 1989) and Herpailurus yagouaroundi (Luegos Vidal et al., 2017), but not for others as Leopardus geoffroyi (Gómez Fernández et al., 2020) or Leopardus colocola (Santos et al., 2018; Do Nascimento et al., 2020). This limit coincides with the one proposed by Culver et al. (2000) for the subspecies P. c. puma and P. c. cabrerae, although the Negro river, a geographical barrier proposed in that work, is not supported by our results or those reported by Gallo et al. (2021). In fact, there is evidence of this species’ ability as a swimmer, so inferences of this nature should be reviewed (Elbroch et al., 2010). Additionally, these phylogroups also match the boundaries between Puma c. hudsoni and Puma c. pearsoni proposed by Cabrera (1958), but not for the Patagonian subspecies (Puma c. araucana and Puma c. pearsoni). This might be a result of the limited number of samples available for the Patagonian Forests (the biogeographic region where Puma c. araucana is distributed, according to Cabrera (1958), or because we cannot genetically differentiate them with the molecular markers employed in this study.
The ND5 haplotype network, including the sample from the ancient puma specimen, indicates low genetic variation in the ND5 gene among modern pumas (Metcalf et al., 2016). However, these results are not robust due to the use of only a very small fragment of the gene. Despite this, the inclusion of this sample allowed us to polarize the network, showing that pumas from central Argentina (Figure 2) and central Brazil are older than those from Patagonia (Matte et al., 2013).
We did not find individuals belonging to clusters II and III (characteristic of central Argentina) below this diagonal; however, we found individuals from Cluster I (widely represented in the Patagonian Region) above it. These results are in coincidence with those obtained by Gallo et al. (2021) from microsatellite loci, who estimated that the migration rate from western to eastern populations was almost three times greater than in the opposite direction, which can be explained by the effect of anthropogenic disturbances on the puma’s dispersal capacity. It is noteworthy that of the 11 individuals from Cluster I found north of the Arid Diagonal, three of them (belonging to the haplotype RCND_2) are outside the Buffer zone, and only one was sampled in the Northeast of Buenos Aires province, and more than 800 km distant from the whole (Patagonian) group. This individual may have migrated from the south, traveling several kilometers in search of prey (Walker and Novaro, 2010), or it may have been an illegal movement of a Patagonian puma such as those that moved towards hunting reserves in La Pampa (Zanón Martínez et al., 2023). Consequently, it is imperative to improve sampling efforts in the region to substantiate these hypotheses.
Historical population dynamics
Although the expansion signals from the neutrality tests are not strongly supported by the Bayesian Skyline Plot, a slight trend of demographic expansion is seen around 7,000–8,000 years ago, after the Last Glacial Maximum (31–18 thousand years ago) and the Late Glacial (18–12 thousand years ago), which extended from Alaska to southern Chile (Late Pleistocene; Clapperton, 2000). These results would be consistent with those obtained for the Puma in South America (Matte et al., 2013) or North America (Culver et al., 2000) and for L. geoffroyi (Gómez Fernández et al., 2020). This expansion could be the result of the extinction of large carnivores and competitors, which coexisted with the puma in the late Pleistocene in Patagonia, such as the saber-toothed cat (Smilodon) and the Patagonian panther (Panthera onca mesembrina) (Turner and Anton, 1997; Borrero, 2009; Prieto et al., 2010; Prevosti and Martin, 2013; Metcalf et al., 2016; Prevosti and Forasiepi, 2018); as well as the expansion in Patagonia of their prey, such as Lama guanicoe, which shows signs of expansion between 8,000 to 10,000 years ago (Moscardi et al., 2020). This pattern of expansion in Patagonia, following the Last Glacial Maximum, has also been observed in human populations, which have been associated with the extinction of megafauna and the expansion of their main food source, Lama guanicoe (Metcalf et al., 2016; Perez et al., 2016; Moscardi et al., 2020).
Implications for conservation and management
Genetic approaches constitute a fundamental tool in determining taxonomic limits, mainly in cases where traditional taxonomy (based on morphological characters) does not allow identifying discontinuities in gene flow (Frankham et al., 2002). In this sense, our work constitutes a powerful tool that provides preliminary but strong guidance for decision makers.
Our results allow us to identify two major genetic groups, Patagonia and Central-West Argentina, whose geographic boundary partially corresponds with the South American Arid Diagonal. Although these clades recovered in the Bayesian tree cannot be formally defined as Evolutionarily Significant Units (ESUs) sensu Moritz (Moritz, 1994a, b) due to their lack of reciprocal monophyly, these phylogroups agree with those proposed by Culver et al. (2000) for the subspecies Puma c. puma and Puma c. cabrerae. Given that they show divergence on haplotype frequencies and significant genetic structure, they should be considered different Management Units (MU) (Moritz, 1994a). We consider it is necessary to preserve these MUs, which inhabit well-differentiated environments, and therefore could be carriers of important genetic variability from an adaptive point of view.
It is remarkable that in the region of the country where sport hunting represents a significant economic activity (Walker and Novaro, 2010) (see Figure 1), high variability and unique haplotypes were recorded. This may be due to potential trafficking of pumas from other provinces to supply the demands of hunting reserves. For this reason, it is essential to develop and implement management plans for puma populations, alongside strict control over hunting reserves (Zanón Martínez et al., 2016). By doing so, we would not only be protecting the region’s top carnivore but possibly also benefiting all species sharing the same habitat (Logan and Sweanor, 2001; Sergio et al., 2006), including the culpeo fox, one of the most persecuted species in Patagonia (Díaz-Ruiz et al., 2020), and the Pampas fox (Lycalopex gymnocercus), which also experiences significant hunting pressure (Porini and Ramadori, 2007). The presence and abundance of herbivores (Logan and Irwin, 1985; Turner et al., 1992) and plant communities (Schaefer et al., 2000) might benefit as well of the new conservation strategies.
This study also collected samples in the center and east of the Pampas ecoregion where pumas had not been recorded until ten years ago (Chimento and De Lucca, 2014; Nielsen et al., 2015). Based on our results from the maternal lineage, we cannot rule out any of the hypotheses proposed by Chimento and De Lucca (2014), regarding the origin of the pumas that recolonized the Center and East of the Pampean ecoregion, since the haplotypes found could originate either from the South of Buenos Aires or from Córdoba province. It cannot be excluded that these populations have always existed in the area but were not previously detected due to insufficient research.
In this sense, we highlight the need to increase sampling across understudied areas of the country and to implement the use of other markers such as microsatellites or SNPs in order to refine the population and demographic approaches. The use of more variable markers will allow us to elucidate the origin of the pumas that colonized (or recolonized) previously inhabited regions. Also, this would be useful to provide refined answers regarding the existence of illegal traffic of puma individuals in hunting reserves. On the other hand, the use of genomic approaches (e.g. Rad-seq SNPs) will allow us to test biogeographical hypotheses regarding the adaptive divergence of populations north and south of the arid diagonal.
Data availability statement
The original contributions presented in the study are publicly available. This data can be found here: NCBI GenBank, accession PP952688, PP952689, PP952691–PP952709.
Ethics statement
Ethical approval was not required for the study involving animals in accordance with the local legislation and institutional requirements because our work was based on the use of feces and tissue samples. Tissue samples were collected in the field (individuals run over or hunted) or from samples previously deposited in biological collections. Skin samples were mainly represented by material collected under the provincial legal hunting regimes of Santa Cruz, Neuquén, Chubut, and Río Negro province.
Author contributions
MMA: Conceptualization, Data curation, Formal analysis, Investigation, Methodology, Writing – original draft, Writing – review & editing. CF: Writing – review & editing. RM: Writing – review & editing. RT: Writing – review & editing. DA: Writing – review & editing. OG: Writing – review & editing. DC: Writing – review & editing. EP: Writing – review & editing. VZ: Writing – review & editing. AR: Writing – review & editing. JZ: Writing – review & editing. MLM: Writing – review & editing. JT: Writing – original draft, Writing – review & editing. AT: Writing – original draft, Writing – review & editing. GF: Conceptualization, Data curation, Formal analysis, Funding acquisition, Investigation, Methodology, Project administration, Resources, Supervision, Writing – original draft, Writing – review & editing.
Funding
The author(s) declare financial support was received for the research, authorship, and/or publication of this article. This work was supported by the Subsidios de Investigación Bianuales (SIB) (Expte0600/2019 and EXP-2093/2022) provided by the Universidad Nacional del Noroeste de la Provincia de Buenos Aires (UNNOBA) and the Spanish National Research Council (CSIC) through the programme Lincglobal 2021 (grant INCGLO0028). MMA, CF, RT, DA, DC, EP, VZ, JZ, JT and AT were funded by Argentine national funds through Consejo Nacional de Investigaciones Científicas y Técnicas (CONICET); MLM was funded by Buenos Aires province funds through Comisión de Investigaciones Científicas (CIC), AR was funded by Spanish National Research Council (CSIC) and GF was funded by Universidad Nacional del Noroeste de la Provincia de Buenos Aires (UNNOBA).
Acknowledgments
Authors thank the Dirección de Fauna y Flora Silvestre of Buenos Aires and Chubut provinces, and the Secretaría de Ambiente y Desarrollo Sustentable of Río Negro province for samples and collection permits. The colleagues of Centro de Bioinvestigaciones (CEBIO) for the support and discussions during the development of this study. A. Andrade, E. Furlan, L. Ali Moran, D. Kloster, B. Carpinetti, C. Allende, G, Buzetti, A. Lavore, M. Monteverde, E. Prodan, A. Gloazzo and M. Faillá for the help in obtain samples; A. Baricalla by bioinformatics support, D. A. Caraballo, C. S. Carnovale for the help with the calibration of the trees and E. Ibañez for help with feces extractions.
Conflict of interest
The authors declare that the research was conducted in the absence of any commercial or financial relationships that could be construed as a potential conflict of interest.
Publisher’s note
All claims expressed in this article are solely those of the authors and do not necessarily represent those of their affiliated organizations, or those of the publisher, the editors and the reviewers. Any product that may be evaluated in this article, or claim that may be made by its manufacturer, is not guaranteed or endorsed by the publisher.
Supplementary material
The Supplementary Material for this article can be found online at: https://www.frontiersin.org/articles/10.3389/fevo.2024.1436320/full#supplementary-material
References
Aagesen D. (2000). Crisis and conservation at the end of the world: sheep ranching in Argentine Patagonia. Environ. Conserv. 27, 208–215. doi: 10.1017/S0376892900000229
Anderson C. R., Lindzey F., Knopff K. H., Jalkotzy M., Boyce M. S. (2010). “Cougar management in North America” in Cougar: Ecology and Conservation,”. Eds. Hornocker M., Negri S. (University of Chicago Press, Chicago), 41–54.
Avise J. C. (1998). The history and purview of phylogeography: a personal reflection. Mol. Ecol. 7, 371–379. doi: 10.1046/j.1365-294x.1998.00391.x
Bandelt H. J., Forster P., Röhl A. (1999). Median-joining networks for inferring intraspecific phylogenies. Mol. Biol. Evol. 16, 37–48. doi: 10.1093/oxfordjournals.molbev.a026036
Barry J. C. (1987). “Larger carnivores (Catiidae, Hyaenidae, Felidae) from Laetoli.”, In Laetoli: A Pliocene site in northern Tanzania, eds Leakey M. D., Harris J. M. (Clarendon: Oxford.
Beier P. (2010). “A focal species for conservation planning,” in Cougar: Ecology and Conservation. Eds. Hornocker M., Negri S. (University of Chicago Press, Chicago), 177–190.
Bellati J., Von Thüngen J. (1990). “Lamb predation in Patagonian ranches,” in Proceedings 14th Vertebrate Pest Conference. Eds. Davis L. R., Marsh R. E. (University of California, Davis), 263–268.
Boom R., Sol C. J., Salimans M. M., Jansen C. L., Wertheim-van D. P. M., van der Noordaa J. (1990). Rapid and simple method for purification of nucleic acids. J. Clin. Microbiol. 28, 495–503. doi: 10.1128/jcm.28.3.495-503.1990
Borrero L. A. (2009). “The elusive evidence: the archaeological record of the South American extinct megafauna,” in American Megafaunal Extinctions at the End of the Pleistocene. Ed. Haynes G. (Springer, Amsterdam), 145–168.
Bouckaert R., Vaughan T. V., Barido-Sottani J., Duchêne S., Fourment M., Gavryushkina A., et al. (2019). BEAST 2.5: An advanced software platform for Bayesian evolutionary analysis. PloS Comput. Biol. 15, e1006650. doi: 10.1371/journal.pcbi.1006650
Brown A., Martinez Ortiz U., Acerbi M., Corcuera J. (2006). La Situación Ambiental Argentina (Buenos Aires: Fundación Vida Silvestre).
Bruniard E. D. (1982). La diagonal árida Argentina: un límite climático real. Rev. Geográfica. 95, 5–20.
Cabrera A. (1958). Dos félidos argentinos inéditos (Mammalia, Carnivora). Neotrópica III. 12, 70–72.
Caraballo D. A., Rossi M. S. (2018). Spatial and temporal divergence of the torquatus species group of the subterranean rodent Ctenomys. Contrib. Zool. 87, 11–24. doi: 10.1163/18759866-08701002
Caragiulo A., Dias-Freedman I., Clark J. A., Rabinowitz S., Amato G. (2014). Mitochondrial DNA sequence variation and phylogeography of Neotropic pumas. Mitochon. DNA. 25, 304–312. doi: 10.3109/19401736.2013.800486
Caro T. M., O´Doherty G. (1999). On the use of surrogate species in conservation biology. Conserv. Biol. 13, 805–814. doi: 10.1046/j.1523-1739.1999.98338.x
Chimento N., De Lucca E. (2014). El Puma (Puma concolor) recoloniza el Centro y el Este del Ecosistema de las Pampas. Hist. Natural. 4, 13–51.
Clapperton C. (2000). Interhemispheric synchroneity of Marine Oxygen Isotope Stage 2 glacier fluctuations along the American cordilleras transect. J. Quat. Sci. 15, 435–468. doi: 10.1002/(ISSN)1099-1417
Corander J., Marttinen P., Sirén J., Tang J. (2008). Enhanced Bayesian modelling in BAPS software for learning genetic structures of populations. BMC Bioinf. 9, 539. doi: 10.1186/1471-2105-9-539
Culver M., Hedrick P. W., Murphy K., O’Brien S., Hornocker M. G. (2008). Estimation of the bottleneck size in Florida panthers. Anim. Conserv. 11, 104–110. doi: 10.1111/j.1469-1795.2007.00154.x
Culver M., Johnson W. E., Pecon-Slattery J., O’Brien S. J. (2000). Genomic ancestry of the American Puma (Puma concolor). J. Hered. 91, 186–197. doi: 10.1093/jhered/91.3.186
De Angelo C., Llanos R., Guerisoli M., Varela D., Valenzuela A. E. J., Pía M. V., et al. (2019). “Puma concolor,” in Categorización 2019 de los mamíferos de Argentina según su riesgo de extinción (Lista Roja de los mamíferos de Argentina, Buenos Aires). Available at: http://cma.sarem.org.ar.
De Lucca E. R. (2010). Presencia del Puma (Puma concolor) y Conflicto con el Hombre en las pampas Argentina. Nót Faun. 48, 1–17.
De Lucca E. R. (2011). Presencia del Puma (Puma concolor) y Conflicto con el Hombre en el partido de Patagones, Buenos Aires, Argentina. Nót Faun. 67, 1–13.
Del Valle H. F., Elissalde N. O., Gagliardini D. A., Milovich J. (1998). Status of desertification in the Patagonian region: assessment and mapping from satellite imagery. Arid. Soil. Res. Rehabil. 12, 95.121. doi: 10.1080/15324989809381502
Díaz-Ruiz F., Rodríguez A., Procopio D., Zapata S., Zanón-Martínez J. I., Travaini A. (2020). Inferring species interactions from long-term monitoring programs: carnivores in a protected area from southern patagonia. Diversity 12, 319. doi: 10.3390/d12090319
Donadio E., Di Martino S., Heinonen S. (2022). Rewilding Argentina: lessons for the 2030 biodiversity targets. Nature 603, 225–227. doi: 10.1038/d41586-022-00631-4
Do Nascimento F. O., Cheng J., Feijó A. (2020). Taxonomic revision of the pampas cat Leopardus colocola complex (Carnivora: Felidae): an integrative approach. Zool. J. Linn. Soc 191, 575–611. doi: 10.1093/zoolinnean/zlaa043
Doyle J. J., Doyle J. L. (1987). A rapid DNA isolation procedure for small quantities of fresh leaf tissue. Phytochem. Bull. 19, 11–15.
Drummond A. J., Rambaut A. (2007). BEAST: Bayesian evolutionary analysis by sampling trees. BMC Evol. Biol. 7, 214. doi: 10.1186/1471-2148-7-214
Elbroch M. L., Saucedo C., Wittmer H. U. (2010). Swimming by pumas (Puma concolor) in Patagonia: rethinking barriers to puma movement. Stud. Neotrop. 45. 3, 187–190. doi: 10.1080/01650521.2010.532410
Excoffier L., Lischer H. E. L. (2010). Arlequin suite ver 3.5: A new series of programs to perform population genetics analyses under Linux and Windows. Mol. Ecol. Resour 10, 564–567. doi: 10.1111/j.1755-0998.2010.02847.x
Farris J. S., Kallersjo M., Kluge A. G., Bult C. (1995). Constructing a significance test for incongruence. Syst. Biol. 44, 570–572. doi: 10.2307/2413663
Frankham R., Ballou J. D., Briscoe D. A. (2002). Introduction to Conservation Genetics (Cambridge: Cambridge University Press). doi: 10.1017/CBO9780511808999
Fu Y. X. (1997). Statistical tests of neutrality of mutations against population growth, hitchhiking and background selection. Genetics 147, 915–925. doi: 10.1093/genetics/147.2.915
Fu Y. X., Li W. H. (1993). Statistical tests of neutrality of mutations. Genetics 133, 693–709. doi: 10.1093/genetics/133.3.693
Gallo O., Castillo D. F., Godinho R., Casanave. E. B. (2020). Genetic diversity, population structure, and immigration, in a partially hunted puma population of south-central Argentina. J. mammal. 101, 766–778. doi: 10.1093/jmammal/gyaa039
Gallo O., Castillo D. F., Godinho R., Casanave E. B. (2023). Assessing landscape connectivity for South-Central argentine pumas dispersing under genetic source-sink dynamics. Landscape Ecol. 38, 999–1012. doi: 10.1007/s10980-022-01585-8
Gallo O., Castillo D. F., Godinho R., Mac Allister M. E., Fernández G. P., Failla M., et al. (2021). Molecular data reveal a structured puma (Puma concolor) population in northern Patagonia, Argentina. Mamm. Biol. 101, 653–663. doi: 10.1007/s42991-021-00160-z
Gay S. W., Best T. L. (1995). Geographic variation in sexual dimorphism of the puma (Puma concolor) in North and South America. Southw. Natural. 40, 148–159.
Gill R. B. (2010). “To Save a Mountain Lion: Evolving Philosophy of Nature and Cougars,” in Cougar: Ecology and Conservation. Eds. Hornocker M., Negri S. (University of Chicago Press, Chicago), 5–16.
Gómez Fernández M. J., Fameli A., Rojo Gómez J., Pereira J. A., Mirol P. (2020). Phylogeographical spatial diffusion analysis reveals the journey of Geoffroy’s cat through the Quaternary glaciations of South America. Biol. J. Linn. Soc 129, 603–617. doi: 10.1093/biolinnean/blz207
Guerisoli M. M., Luengos Vidal E., Caruso N., Giordano A. J., Lucherini M. (2020). Puma-livestock conflicts in the Americas: a review of the evidence. Mammal. Review. 51, 228–246. doi: 10.1111/mam.12224
Guerisoli M. L. M., Luengos Vidal E., Franchini M., Caruso N., Casanave E. B., et al. (2017). Characterization of puma-livestock conflicts in rangelands of central Argentina. R. Soc Open Sci. 4, 170852. doi: 10.1098/rsos.170852
Gustafson K. D., Gagne R. B., Vickers T. W., Riley S. P. D., Wilmers C. C., Bleich V. C., et al. (2021). Multi-population puma connectivity could restore genomic diversity to at-risk coastal populations in California. Evol. App. 15, 286–299. doi: 10.1111/eva.13341
Hall T. (2004). BioEdit 6.0.7 (Department of Microbiology, North Carolina State University). Available at: http://www.mbio.ncsu.edu/BioEdit/bioedit.html.
Heled J., Drummond A. J. (2014). Calibrated birth–death phylogenetic time-tree priors for bayesian inference. Syst. Biol. 64, 369–383. doi: 10.1093/sysbio/syu089
Hostetler J. A., Onorato D. P., Jansen D., Oli M. K. (2013). A cat´s tale: the impact of genetic restoration on Florida panther population dynamics and persistence. J. Anim. Ecol. 82, 608–620. doi: 10.1111/1365-2656.12033
INDEC (2017). “Censo Nacional de la Actividad Minera (CENAM17): Resultados estadísticos 2016,” in Biogeographic variation of food habits and body size of the America puma, vol. 85 . Eds. J. A., Franklin W. L., Johnson W. E., Redford K. H. (Instituto Nacional de Estadistica y CensosIriarte, Buenos Aires), 185–190. Oecologia.
INDEC (2021). Censo Nacional Agropecuario 2018: resultados definitivos (Buenos Aires: Instituto Nacional de Estadistica y Censos).
Iriarte J. A., Franklin W. L., Johnson W. E., Redford K. H. (1990). Biogeographic variation of food habits and body size of the America puma. Oecologia 85, 185–190. doi: 10.1007/BF00319400
Jae-Heup K., Eizirik E., O’Brien S. J., Johnson W. E. (2001). Structure and patterns of sequence variation in the mitochondrial DNA control region of the great cats. Mitochondrion 14, 279–292. doi: 10.1016/s1567-7249(01)00027-7
Jansen D. D., Jenks J. A. (2011). Estimating body mass of pumas (Puma concolor). Wildl. Res. 38, 147–151. doi: 10.1071/WR10109
Jennings M. K., Lewison R. L., Vickers T. W., Boyce W. M. (2015). Puma response to the effects of fire and urbanization. J. Wildl. Manage. 80, 221–234. doi: 10.1002/jwmg.1018
Johnson W. E., Eizirik E., Pecon-Slattery J., Murphy W. J., Antunes A., Teeling E., et al. (2006). The late Miocene radiation of modern Felidae: a genetic assessment. Science 311, 73–77. doi: 10.1126/science.1122277
Johnson W. E., Onorato D. P., Roelke M. E., Land E. D., Cunningham M., Lucherini M., et al. (2010). Genetic restoration of the Florida panther. Science 329, 1641–1645. doi: 10.1126/science.1192891
Kitchener A. C., Breitenmoser-Würsten C., Eizirik E., Gentry A., Werdelin L., Wilting A., et al. (2017). A revised taxonomy of the Felidae. The final report of the Cat Classification Task Force of the IUCN/SSC Cat Specialist Group. Cat News Special. 11, 80.
LaRue M. A., Nielsen C. K. (2016). Population viability of recolonizing cougars in Midwestern North America. Ecol. Model. 321, 121–129. doi: 10.1016/j.ecolmodel.2015.09.026
Leigh J. W., Bryant D. (2015). Popart: full-feature software for haplotype networkconstruction. Methods Ecol. Evol. 6, 1110–1116. doi: 10.1111/2041-210X.12410
Llanos R., Andrade A., Travaini A. (2019). Puma and livestock in central Patagonia (Argentina): from ranchers’ perceptions to predator management. Hum. Dimens. Wildl. 25, 1–16. doi: 10.1080/10871209.2019.1668987
Llanos R., Travaini A., Montanelli S., Crespo E. (2014). Estructura de edades de pumas (Puma concolor) cazados bajo el sistema de remoción por recompensas en Patagonia, ¿Selectividad u oportunismo en la captura? Ecología Austral. 24, 311–319. doi: 10.25260/EA.14.24.3.0.8
Logan K. A., Irwin L. L. (1985). Mountain lion habitats in the Big Horn Mountains, Wyoming. Wildl. Soc Bull. 13, 257–262.
Logan K. A., Sweanor L. L. (2001). Desert Puma: Evolutionary Ecology and Conservation of an Enduring Carnivore (Washinton: Island Press).
Luegos Vidal E., Guerisoli M., Caruso N., Lucherini M. (2017). Updating the distribution and population status of jaguarundi Puma yagouaroundi (É. Geoffroy 1803) (Mammalia, Carnivora, Felidae), in the southernmost part of its distribution range. Check List 13, 75–79. doi: 10.15560/13.4.75
Martínez J. A., Rudolf J. C., Queirolo D. (2010). Puma concolor (Carnivora, Felidae) en Uruguay: situación local y contexto regional. Mastozool. Neotrop. 17, 153–159.
Matte E. M., Castilho C. S., Miotto R. A., Sana D. A., Johnson W. E., O’Brien S. J., et al. (2013). Molecular evidence for a recent demographic expansion in the puma (Puma concolor) (Mammalia, Felidae). Genet. Mol. Biol. 36, 586–597. doi: 10.1590/S1415-47572013000400018
Metcalf J. L., Turney C., Barnett R., Martin F., Bray S. C., Vilstrup J. T., et al. (2016). Synergistic roles of climate warming and human occupation in Patagonian megafaunal extinctions during the Last Deglaciation. Sci. Adv. 2, 1–8. doi: 10.1126/sciadv.1501682
Moritz C. (1994a). Defining ‘Evolutionarily significant units’ for conservation. Trends Ecol. Evol. 9, 373–375. doi: 10.1016/0169-5347(94)90057-4
Moritz C. (1994b). Applications of mitochondrial DNA analysis in conservation: A critical review. Mol. Ecol. 3, 401–411. doi: 10.1111/j.1365-294X.1994.tb00080.x
Moscardi B., Rindel D., Perez S. I. (2020). Changes in human diet and demography of Lama guanicoe in Patagonia during the Late Pleistocene-Holocene. J. Archaeolog. Sci. 115, 105098. doi: 10.1016/j.jas.2020.105098
Nielsen C., Thompson D., Kelly M., Lopez-Gonzalez C. A. (2015). Puma concolor. The IUCN Red List of Threatened Species 2015 T18868A97216466. doi: 10.2305/IUCN.UK.20154.RLTS.T18868A50663436.en. Accessed (April 25, 2024)
Novaro A. J., Walker R. S. (2005). “Human-induced changes in the effect of top carnivores on biodiversity in the Patagonian Steppe,” in Large Carnivores and the Conservation of Biodiversity. Eds. Ray J. C., Redford K. H., Steneck R. S., Berger J. (Island Press, Washington, DC), 268–288.
Oliva G., Gaitan J., Ferrante D. (2016). “Humans Cause Deserts: Evidence of Irreversible Changes in Argentinian Patagonia Rangelands,” in The end of desertification? Eds. Behnke R., Mortimore M. (Springer, Berlin), 363–386.
Oyarzabal M., Clavijo J., Oakley L., Biganzoli F., Tognetti P., Barberis I., et al. (2018). Unidades de vegetación de la Argentina. Ecol. Austral. 28, 40–63. doi: 10.25260/EA.18.28.1.0.399
Parera A. (2002). Los mamíferos de la Argentina y la región austral de Sudamérica (Buenos Aires: Editorial El Ateneo).
Peigne S. (2014). Proailurus, l’un des plus anciens Felidae (Carnivora) d’Eurasie : systématique et évolution. Bull. Soc. Hist. Nat. 135, 125–134.
Perez S. I., Postillone M. B., Rindel D., Gobbo D., Gonzalez P. N., Bernal V. (2016). Peopling time, spatial occupation and demography of Late Pleistocene-Holocene human population from Patagonia. Quat. Int. 425, 214–223. doi: 10.1016/j.quaint.2016.05.004
Peri P. L., Lencinas M. V., Bousson J., Lasagno R., Soler R., Bahamonde H., et al. (2016). Biodiversity and ecological long-term plots in Southern Patagonia to support sustainable land management: the case of PEBANPA network. J. Nat. Conserv. 34, 51–64. doi: 10.1016/j.jnc.2016.09.003
Porini G., Ramadori D. (2007). Knowledge estate about foxes management of economic interest in Argentine (Buenos Aires: Dirección Nacional de Fauna Silvestre).
Posada D. (2008). jModelTest: phylogenetic model averaging. Mol. Biol. Evol. 25, 1253–1256. doi: 10.1093/molbev/msn083
Prevosti F. J., Forasiepi A. M. (2018). Evolution of South American mammalian predators during the Cenozoic: Paleobiogeographic and paleoenvironmental contingencies (Switzerland: Springer Geology). doi: 10.1007/978-3-319-03701-1
Prevosti F. J., Martin F. M. (2013). Paleoecology of the mammalian predator guild of Southern Patagonia during the latest Pleistocene: ecomorphology, stable isotopes, and taphonomy. Quat. Int. 305, 74–84. doi: 10.1016/j.quaint.2012.12.039
Prieto A., Labarca R., Sierpe V. (2010). New evidence of the sabertooth cat Smilodon (Carnivora: Machairodontinae) in the late Pleistocene of southern Chilean Patagonia. Rev. Chil. Hist. Nat. 83, 299–307. doi: 10.4067/S0716-078X2010000200010
Rambaut A. (2018). FigTree. Version 1.4.4. Available online at: http://tree.bio.ed.ac.uk/software-/figtree/. Accessed Febrary 20, 2024.
Rambaut A., Drummond A. J., Xie D., Baele G., Suchard M. A. (2018). Posterior summarization in Bayesian phylogenetics using Tracer 1.7. Syst. Biol. 675, 901–904. doi: 10.1093/sysbio/syy032
Rice W. E. (1989). Analyzing tables of statistical testes. Evolution 43, 223–225. doi: 10.1111/j.1558-5646.1989.tb04220.x
Ripple W. J., Beschta R. L. (2006). Linking a cougar decline, trophic cascade, and catastrophic regime shift in Zion National Park. Biol. Conserv. 133, 397–408. doi: 10.1016/j.biocon.2006.07.002
Roelke M. E., Martenson J. S., O´Brien S. J. (1993). The consequences of demographic reduction and genetic depletion in the enfangered Florida panter. Curr. Biol. 3, 340–350. doi: 10.1016/0960-9822(93)90197-V
Rozas J., Ferrer-Mata A., Sánchez-DelBarrio J. C., Guirao-Rico S., Librado P., Ramos-Onsins S. E., et al. (2017). DnaSP 6: DNA sequence polymorphism analysis of large data sets. Mol. Biol. Evol. 34, 3299–3302. doi: 10.1093/molbev/msx248
Sambrook J., Russell D. W. (2006). Rapid isolation of yeast DNA. Cold Spring Harb. Protoc. 2006, 631–632. doi: 10.1101/pdb.prot093542
Santos A., Trigo T. C., Gomes de Oliveira T., Silveira L., Eizirik E. (2018). Phylogeographic analyses of the pampas cat (Leopardus colocola; Carnivora, Felidae) reveal a complex demographic history. Genet. Mol. Biol. 41, 273–287. doi: 10.1590/1678-4685-GMB-2017-0079
Saremi N. F., Supple M. A., Byrne A., Cahill J. A., Coutinho L. L., Dalén L., et al. (2019). Puma genomes from North and South America provide insights into the genomic consequences of inbreeding. Nat. Commun. 10, 4769. doi: 10.1038/s41467-019-12741-1
Schaefer R. J., Torres S. G., Bleich V. C. (2000). Survivorship and cause-specific mortality in sympatric populations of mountain sheep and mule deer. Calif. Fish. Game. 86, 127–135.
Sergio F., Newton I., Marchesi L., Pedrini P. (2006). Ecologically justifed charisma: preservation of top predators delivers biodiversity conservation. J. Appl. Ecol. 43, 1049–1055. doi: 10.1111/j.1365-2664.2006.01218.x
Seutin G., White B. N., Boag P. T. (1991). Preservation of avian blood and tissue samples for DNA analyses. Can. J. Zool. 69, 82–90. doi: 10.1139/z91-013
Stoneking M., Hedgecock D., Higuchi R. G., Vigilant L., Erlich H. A. (1991). Population variation of human mtDNA control region sequences detected by enzymatic amplification and sequence-specific oligonucleotide probes. Am. J. Hum. Genet. 48, 370–382.
Swofford D. L. (1998). PAUP*: Phylogenetic Analysis Using Parsimony (and Other Methods) (Sunderland, MA: Sinauer Associates).
Tajima F. (1989). Statistical method for testing the neutral mutation hypothesis by DNA polymorphism. Genetics 123, 585–595. doi: 10.1093/genetics/123.3.585
Tchaicka L., Eizirik E., Oliveira T. G., Candido F. Jr., Freitas T. R. O. (2007). Phylogeography and population history of the crab eating fox (Cerdocyon thous). Mol. Ecol. 16, 819–838. doi: 10.1111/j.1365-294X.2006.03185.x
Terborgh J., Feeley K., Silman M., Nunez P., Balukjian B. (2006). Vegetation dynamics of predator-free land-bridge islands. J. Ecol. 94, 253–263. doi: 10.1111/j.1365-2745.2006.01106.x
Terborgh J., Lopez L., Nuñez P., Rao V. M., Shahabuddin G., Orihuela G., et al. (2001). Ecological meltdown in predator-free forest fragments. Science 294, 1923–1926. doi: 10.1126/science.1064397
Thorne J. H., Cameron D., Quinn J. F. (2006). A conservation design for the Central Coast of California and the evaluation of mountain lion as an umbrella species. Natural Areas J. 26, 137–148. doi: 10.3375/0885-8608(2006)26[137:acdftc]2.0.co;2
Tseng Z. J., Wang X., Slater G. J., Takeuchi G. T., Li Q., Liu J., et al. (2014). Himalayan fossils of the oldest known pantherine establish ancient origin of big cats. Proc. R. Soc. B. 281, 20132686. doi: 10.1098/rspb.2013.2686
Trigo T. C., Freitas T. R. O., Kunzler G., Cardoso L., Silva J. C. R., Johnson W. E., et al. (2008). Inter-species hybridization among Neotropical cats of the genus Leopardus, and evidence for an introgressive hybrid zone between L. geoffroyi and L. tigrinus in southern Brazil. Mol. Ecol. 17, 4317–4333. doi: 10.1111/j.1365-294X.2008.03919.x
Turner A., Anton M. (1997). The Big Cats and Their Fossil Relatives (New York: Columbia University Press).
Turner J. W., Wolfe M. L., Kirkpatrick J. F. (1992). Seasonal mountain lion predation on a feral horse population. Can. J. Zool. 70, 929–934. doi: 10.1139/z92-132
van de Kerk M., Onorato D. P., Hostetler J. A., Bolker B. M., Oli M. K. (2019). Dynamics, persistence, and genetic management of the endangered Florida panther population. Wild. Mon. 203, 3–35. doi: 10.1002/wmon.1041
Walker S., Novaro A. (2010). “The world’s southernmost Pumas in Patagonia and the Southern Andes,” in Cougar, Ecology and Conservation. Eds. Hornocker M., Negri S. (University of Chicago Press, Chicago), 91–99.
Werdelin L., Yamaguchi N., Johnson W. E., O´Brien S. J. (2010). “Phylogeny and evolution of cats (Felidae).”, In Biology and Conservation of Wild Felids, eds Macdonald D. W., Loveridge A. L. (United Kingdom: Oxford University Press).
Xia X., Xie Z. (2001). DAMBE: software package for data analysis in molecular biology and evolution. J. Hered. 92, 371–373. doi: 10.1093/jhered/92.4.371
Xia X., Xie Z., Salemi M., Chen L., Wang Y. (2003). An index of substitution saturation and its application. Mol. Phylogenet. Evol. 26, 1–7. doi: 10.1016/S1055-7903(02)00326-3
Young S. P., Goldman E. A. (1946). “The puma, mysterious American cat,” (American Wildlife Institute, Washington, DC).
Zanón Martínez J. I., Iranzo E. C., Travaini A., McNitt D. C., Mansilla A. P., Llanos R., et al. (2023). Puma density, habitat use, and activity patterns across a mosaic landscape of ranches, game reserves, and a protected area in central Argentina. Eur. J. Wildl. Res. 69, 89. doi: 10.1007/s10344-023-01717-8
Zanón Martínez J. I., Kelly M. J., Mesa-Cruz J. B., Sarasola J. H., DeHart C., Travaini A. (2016). Density and activity patterns of pumas in hunted and non-hunted areas in central Argentina. Wildl. Res. 55, 716–730. doi: 10.1071/WR16056
Keywords: Puma concolor, Argentina, mitochondrial markers, phylogeography, historical demography, conservation genetics, management
Citation: Mac Allister ME, Figueroa CE, Mazzei R, Tintorelli RG, Acosta DB, Gallo O, Castillo D, Pinardi E, Zelada Perrone VD, Rodríguez A, Zanón Martínez JI, Merino ML, Túnez JI, Travaini A and Fernández GP (2024) Genetic diversity and diversification patterns of puma (Puma concolor) populations in the southern end of the species distribution. Front. Ecol. Evol. 12:1436320. doi: 10.3389/fevo.2024.1436320
Received: 21 May 2024; Accepted: 25 July 2024;
Published: 10 September 2024.
Edited by:
Karine Frehner Kavalco, Universidade Federal de Viçosa, BrazilReviewed by:
Francisco Juan Prevosti, Museo de Antropología y Ciencias Naturales de la UNLAR, CONICET, ArgentinaVictor Hugo Valiati, University of the Rio dos Sinos Valley, Brazil
Igor Rodrigues-Oliveira, Federal University of Minas Gerais, Brazil
Copyright © 2024 Mac Allister, Figueroa, Mazzei, Tintorelli, Acosta, Gallo, Castillo, Pinardi, Zelada Perrone, Rodríguez, Zanón Martínez, Merino, Túnez, Travaini and Fernández. This is an open-access article distributed under the terms of the Creative Commons Attribution License (CC BY). The use, distribution or reproduction in other forums is permitted, provided the original author(s) and the copyright owner(s) are credited and that the original publication in this journal is cited, in accordance with accepted academic practice. No use, distribution or reproduction is permitted which does not comply with these terms.
*Correspondence: Matias E. Mac Allister, bWFjYWxsaXN0ZXJtYXR5QGdtYWlsLmNvbQ==; Gabriela P. Fernández, Z2FicmllbGEuZmVybmFuZGV6QG5leG8udW5ub2JhLmVkdS5hcg==