 Han Wang1
 Yong Jia
 Jing Yuan
 Qiuyan Yuan
- 1Institute of Molecular Engineering and Applied Chemistry, Anhui University of Technology, Ma’anshan, China
- 2Department of Civil Engineering, Tongling University, Tongling, China
- 3Department of Civil Engineering, Manitoba University, Winnipeg, MB, Canada
In this paper, the original RSEI model (including greenness index, humidity index, heat index and dryness index) and their contribution rate (%) are used to evaluate the change of ecological environment. To study how natural and anthropogenic changes in ecological environment affect ecosystem function and how these factors interact, CASA model was used to estimate the correlation between the net primary productivity of vegetation (NPP), population density and land use. This could reveal the influence factors of ecological environment change in the Wanjiang River Basin from 2000 to 2022. The results show that the combing RSEI and CASA models can effectively show the spatial-temporal variation and spatial distribution of NPP of vegetation in Wanjiang Basin. During this period, RSEI of the basin showed an overall upward trend, and the RSEI increased by about 0.1/10 a. The vegetation productivity in most areas was gradually improved, the ecological environment was restored, and the ecological environment quality was gradually improved. The average annual NPP simulated by CASA was 266.81 g C·m-2·a-1. The variation trend of NPP in vegetation showed a slight decrease, but the overall NPP level was basically unchanged. There is a significant correlation between NPP and population density, a negative correlation between NPP and population density areas such as city centers, and a positive correlation between NPP and population density in areas with frequent agricultural activities. From 2010 to 2020, there is a significant positive correlation between population density and land use.
1 Introduction
Wanjiang River Basin is an important part of the Yangtze River Economic Belt and the mother river of Anhui Province. It has complex topographic features, changeable climate, and rich vegetation types. In recent years, the Wanjiang River takes the ecological protection of the basin as the priority and the green and efficient development as the lead, so it needs the support of research and technical means in the corresponding policy call. It is particularly important to protect the ecological environment and explore the influence of various factors on the ecological environment (Xiong et al., 2021). In conclusion, it needs to continuously strengthen environmental protection, develop environmental monitoring technologies, and establish evaluation systems, evaluate habitat indicators, and provide scientific evidence. At present, the emerging remote sensing and GIS technologies have the advantages of large monitoring range, wide space-time dimension, fast data processing speed, accurate mapping, etc., and are the best choice for ecological research technologies (Jing et al., 2020).
The ecological index (RSEI) based on remote sensing uses four environmental factors to reflect the regional ecological environment, in which the dryness index represents the pressure caused by human activities on the ecosystem (Xu, 2013; Shan et al., 2019; Jing et al., 2020). The index of ecological state before and after anthropogenic land surface change was measured by vegetation greening index. Surface temperature and humidity are used to represent surface moisture and surface heat indicators respectively (Jiang et al., 2022), reflecting the response of climate change to the change of ecosystem status. RSEI is based on the “Pressure-State-Correspondence” framework and Principal Component Analysis (PCA) to evaluate the ecological quality of a region. RSEI has been widely used to evaluate the ecological quality of environments, for example, Ji et al. studied the land use and ecological quality of the Beijing-Tianjin-Hebei region by using RESI in combination with MODIS data (Ji et al., 2023), Kang Senyuan in his study of carbon emissions in Chengdu City applied remote sensing ecological indices in combination with landscape pattern to evaluate the ecological quality of Chengdu City (Kang, 2024), Gong et al. used RSEI to study the spatial and temporal changes and driving factors of ecosystem quality in the Loess Plateau of Shanxi Province (Gong et al., 2023).Therefore, RSEI is conducive to the quantitative evaluation of changes in ecological environment quality on a regional scale (Ning et al., 2020). However, for the Wanjiang River Basin, due to the complexity and diversity of influencing factors, the indicators selected by RSEI are insufficient, and the evaluation results cannot truly and comprehensively reflect the ecological environment quality of the region (Jing et al., 2020; An et al., 2022; Yang et al., 2022). In order to meet the need of comprehensive consideration of ecosystem, this paper proposed an improved RSEI model based on the improved CASA model, introduced the net primary productivity of vegetation (NPP) index on the basis of the original model, and used the improved RSEI model to evaluate and analyze the ecological index of this basin from 2000 to 2022. In addition, this paper analyzed the temporal and spatial characteristics of this basin and the correlation with climate factors, population density and land use, and discussed the impact mechanism and factors on the ecological environment of the basin from different perspectives (An et al., 2022), which will help to reveal the characteristics of the impact factors and changes of the ecosystem in this region. It provides a feasible way for the construction of habitat civilization and green and low-carbon development in the Wanjiang River Basin (Hu and Xu, 2019; Boori et al., 2021; Zhang et al., 2021).
Factors affecting the ecological environment are mainly divided into natural and social factors (An et al., 2022). The net primary productivity of vegetation reflects the impact of natural evolution on the natural environment and is an important index to comprehensively reflect vegetation productivity and energy conversion rate, as well as an important ecological index to measure the carrying capacity of terrestrial ecosystem and evaluate its sustainable development (Yuan et al., 2006). The net primary productivity of vegetation refers to the net amount of organic carbon fixed by photosynthesis per unit area in a unit time, which is the total organic matter produced by plant photosynthesis minus the total organic matter consumed by plant respiration. There are many methods to evaluate the net primary productivity of vegetation, such as measured method and light energy utilization model (Givati et al., 2016; Hang et al., 2020), and each has its own advantages and disadvantages, so it is necessary to select appropriate methods according to different purposes and conditions. At present, Remote Sensing (RS) and Geographic Information System (GIS) technologies, combined with vegetation index, meteorological data, and soil data, are used to establish NPP estimation models of different scales. Dynamic monitoring and analysis of global or regional NPP is possible; Gao et al. explored the spatial-temporal pattern of NPP and its correlation with various related climate factors (Gao et al., 2017). Scientists measured and compared NPP of different types of vegetation communities or ecosystems by exploring the response and feedback mechanism of NPP to global change and using field observation data (Yuan et al., 2006; Zhang et al., 2011; Wang et al., 2017; Xi et al., 2022). The relationship between NPP and vegetation structure, climate, biome and other factors was revealed (Bondeau et al., 1999; Schloss et al., 1999; Yuan et al., 2006). Xi et al. improved the traditional Carnegie-Ames-Stanford Approach (CASA) model by using the data of the Chinese ecosystem research network. After comparing the NPP estimation accuracy of the two-leaf model and the optimized CASA model on relevant data, they selected the optimized CASA model with more advantages (Cao et al., 2017; Xi et al., 2022). Based on the NPP (Yuan et al., 2006; Zhang et al., 2011; Cao et al., 2017)of China’s land use data assessment and monitoring in the study area, the improved CASA model was adopted in this paper to estimate the net primary productivity of vegetation in the Wanjiang River Basin. The study of vegetation net primary productivity is of great significance for understanding the global carbon cycle, evaluating ecosystem services, and formulating sustainable development strategies (Luo et al., 2012; Vačkář et al., 2012).
The relationship between population density and land use reflects the impact of human activities on natural environment, resource allocation, ecological services, urban planning, and other aspects (Shan et al., 2019; Yuan et al., 2021). Gianni Guastella explored the relationship between land use and population density at urban scale and analyzed the impact of land use and population density on urban environment and society (Guastella and Pareglio, 2017; Venkatesh and Velkennedy, 2024). Baskaran Venkatesh et al. explored the significance and role of land use and population density on the realization of sustainable development goals (Venkatesh and Velkennedy, 2024). Venkatesh and Velkennedy studied the spatialization of main population data and the relationship between land use change and population change (Venkatesh and Velkennedy, 2024); Jiang et al. explored the spatial pattern of land use and population density (Jiang et al., 2022); Vačkář et al. explored the influencing factors of land use and population density (Vačkář et al., 2012). These studies show different perspectives and methods for the research on the correlation between land use and population density, and have achieved certain results and progress, which are of great significance for revealing the essential law of man-land relationship, improving land resource allocation, and promoting green construction (Vačkář et al., 2012; Yang et al., 2021). Using remote sensing data, this paper analyzes the dynamic attitude of land use, the average annual distribution of population density, and the population density of different regions to explore the correlation between population density and land use.
This paper takes the Wanjiang River Basin as the research area, Wanjiang River Basin is closely related to the Yangtze River Delta, the economy develops rapidly, and the prospect is broad. However, with the advancement of urban industrialization, environmental problems are becoming more and more severe. The reduction of cultivated land and forest land area and industrial pollution are not small challenges to the Wanjiang River basin. Therefore, meteorological data, Normalized Difference Vegetation Index (NDVI), land use and population density in this region were used in this paper. Image preprocessing, NPP estimation, NPP and population density trend analysis, correlation analysis and land use type transformation analysis were carried out to evaluate the ecological environment and influencing factors. The novelty of this study is that the improved RSEI model based on the optimized CASA model and the correlation coefficient method are used to reveal the relationship between NPP and population density, and between land use and population density in the Wanjiang River Basin. The improved RSEI model adds CASA’ NPP index based on the original, which makes the evaluation and analysis of each ecological index of the basin ecological environment more accurate. Compared with the traditional CASA model, the improved model is more in line with the actual situation and effectively improves the accuracy of the model. The method combining RSEI model with NPP index is rarely used in the Wanjiang River Basin. There is few research on the mechanism and degree of influencing factors on the ecological environment of the Wanjiang River Basin. Based on enriching the existing research content, this paper provides a new idea for the study of ecological environment quality, and the research results can provide a scientific basis for the ecological environment protection of the Wanjiang River Basin (Jiang et al., 2021; Zongfan et al., 2023).
In summary, RSEI was first used to evaluate the change of the ecological quality of the Wanjiang River Basin. Furthermore, the CASA model is used to reveal the impact of social and natural factors for the change of ecological quality. Thirdly, the results obtained by calculations, analyzing the relationship between NPP and population density and land use, and discussion of the similarly improved works of the RSEI are introduced in detail. Especially the annual average NPP of the Wanjiang River is estimated based on the improved CASA model, and the influence of natural evolution on the ecological environment of the Wanjiang River Basin is reflected by analyzing its spatial-temporal characteristics and correlations with climate factors, population density and land use.
2 Materials and methods
2.1 Study area
As shown in Figure 1, the Wanjiang River Basin mainly refers to the area along the Yangtze River on both sides of the Yangtze River, located in the central and southern part of Anhui Province, between 115°45′~119°38′east longitude and 29°33′~33°12′north latitude. Eight cities of the Wanjiang River Basin, including Chizhou City, Anqing City, Ma’anshan City, Hefei City, Xuancheng City, Tongling City, Wuhu City and Chuzhou City, are selected as the research area in this study, which are mainly located in the basin below Taihu Lake of the Yangtze River (Xu et al., 2023).
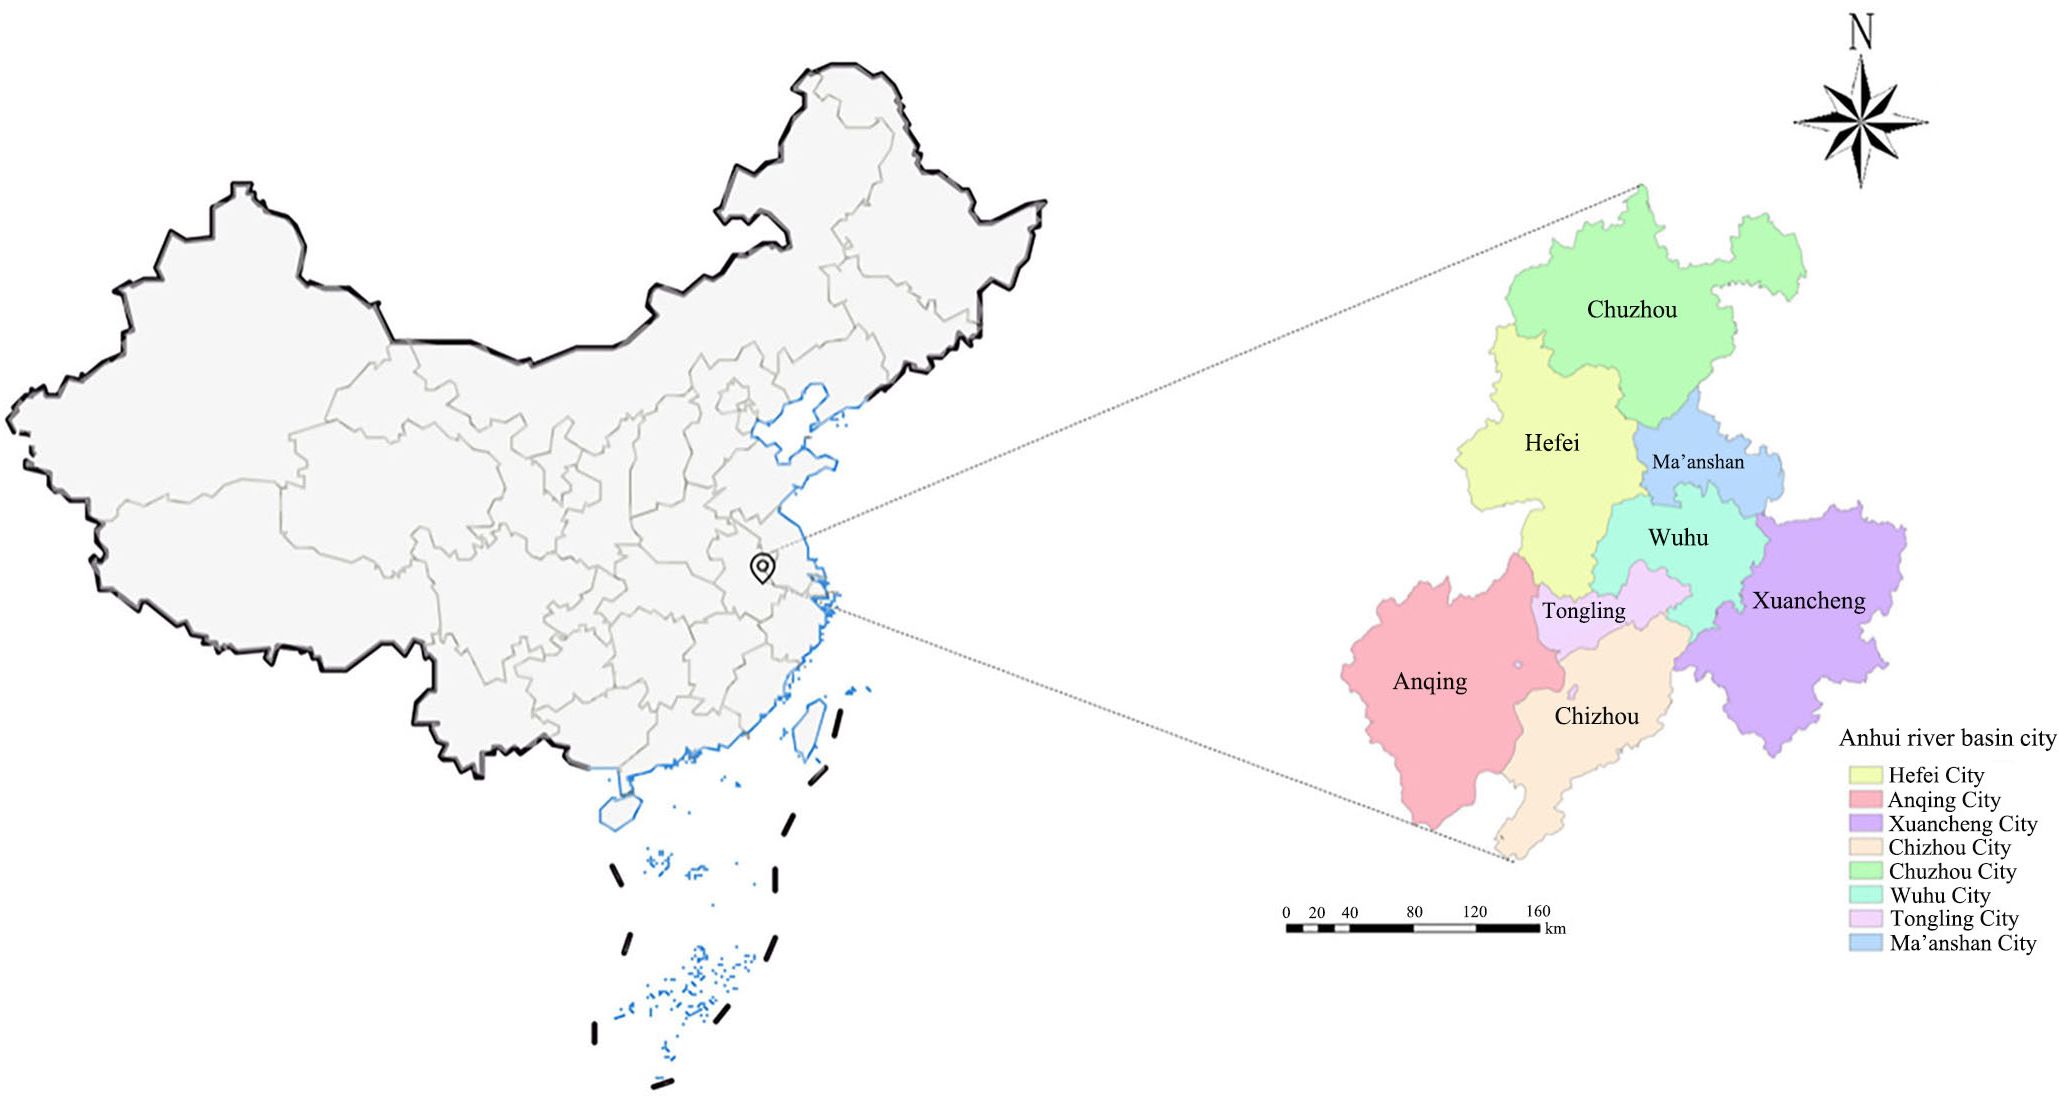
Figure 1. Location map of study area.
The basin area of Wanjiang is about 56,000 km2, accounting for 40.3% of Anhui Province. The terrain of the Wanjiang River Basin is mainly mountainous and hilly, with fewer plains, and the population is mainly concentrated in the riverbanks and plain areas. The region is rich in water resources, with numerous rivers, lakes, and reservoirs. Wanjiang River Basin is in the subtropical monsoon climate zone with distinct four seasons temperature. The average annual temperature is 15-17°C, with more rainfall, and the average annual precipitation is between 1000mm and 1600 mm (Ju et al., 2010).
2.2 Data sources
The specific data sources for this study are detailed in Table 1. All these data sources are publicly available from authoritative organizations and can be used for scientific research and analysis to provide a reliable data base. The study period is from 2000 to 2020, the data of 2004, 2007, 2010, 2013, and 2016 were selected as representative data for the calculation of NPP, the data of 2000, 2010, and 2020 were selected as representative data for the land use and population density in all areas of the Wanjiang River Basin, and the data of 2000, 2010, and 2020 were used as representative data for the RSEI and land use of the key areas of the Wanjiang River Basin (Table 1). 2010-2022 data as representative data (Table 1). The data were integrated and preprocessed to make the spatial resolution and coordinate system consistent with the other data, the spatial resolution of land use and population density was 30m×30m, and the spatial resolution of the rest of the data was 1km×1km.The RSEI remote sensing imagery data comes from the Earth Explorer (https://earthexplorer.usgs.gov/).
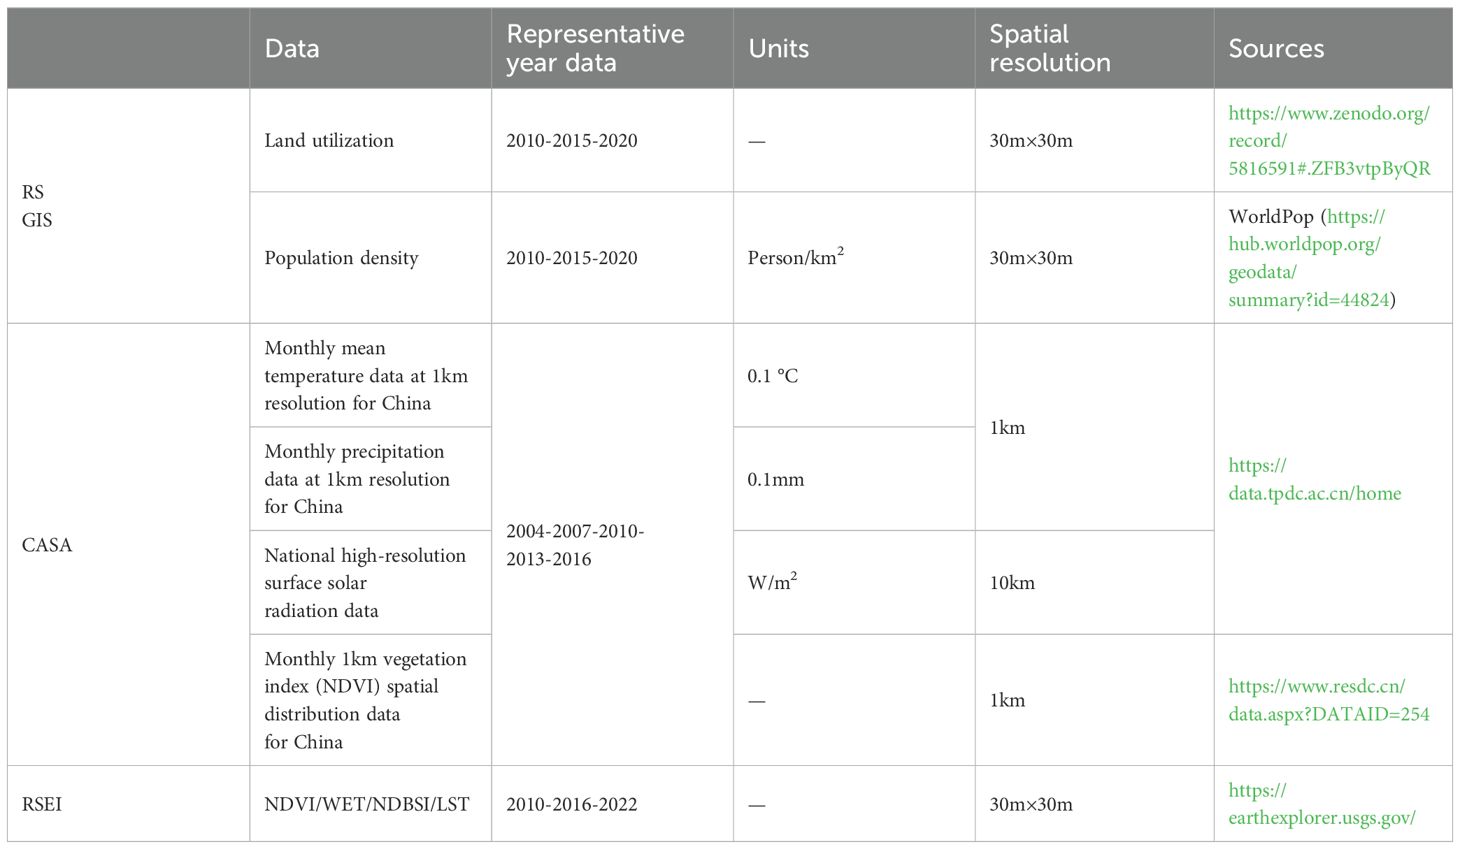
Table 1. Data sources.
2.3 RSEI evaluation model
RSEI is used to comprehensively reflect the ecological environment status of the study area (Yue et al., 2019; Jing et al., 2020). RSEI index is based on the integration of four indices closely related to human beings extracted from remote sensing images and principal component analysis, so it avoids artificial weighted calculation and is more reasonable. RSEI can visualize the ecological environment of the studied region, to intuitively feel the changes of ecological conditions. Specifically as in Equations 1, 2:
On the ENVI (Environment for Visualization of Images) 5.3 platform (https://www.envi.com), vegetation indices are typically used with the Normalized Difference Vegetation Index (NDVI), moisture indices are typically used with the Normalized Difference Water Index (NDWI), heat indices are typically used with the Land Surface Temperature (LST), and DNBSI is the average value of Normalized Difference Built-up and Heat indices. Difference Water Index (NDWI), the heat index usually uses Land Surface Temperature (LST), and DNBSI is the average value of Normalized Difference Built-up and Soil Index, and the indicator data used were all taken from the indicator data used were all taken from Earth Explorer (https://earthexplorer.usgs.gov/). The remote sensing image locations were targeted by selected area vector maps, and the row and column numbers of the desired data were selected and filtered by controlling the cloudiness within 20%. The remote sensing images of 2010, 2016, and 2022 were selected to do the study, in the principle of selecting less clouds, so the remote sensing image data were from Landsat 7, Landsat 8, and Landsat 9, and the data were preprocessed, including radiometric calibration, atmospheric correction, image fusion, image mosaicing, and image cropping. And the data were pre-processed, including radiometric calibration, atmospheric correction, image fusion, image mosaicing, and image cropping. Analyze the changes of each index, construct the remote sensing ecological index through index synthesis, principal component analysis, and finally get the RSEI, which is located between [0,1], and the larger value represents the better ecological environment quality.
2.4 NPP estimation based on improved CASA model
Zhu et al. proposed to improve the CASA model based on the previous ideas and optimized and improved the calculation methods of photosynthesis and respiration (Zhu et al., 2006). Analyzing the temporal and spatial characteristics and influencing factors of NPP is helpful to reveal the function and service value of vegetation ecosystem and provide scientific basis for ecological protection and restoration. In the original model, the calculation methods of photosynthesis and respiration are relatively simple, the influence of soil temperature on the carbon cycle of the ecosystem is ignored, the influence of vegetation type on the carbon cycle of the ecosystem is not fully considered, and the spatial resolution is low. By introducing more complex calculation methods, the influence of soil temperature on ecosystem carbon cycle and vegetation type factors, and improving the spatial resolution of the model, the accuracy of the CASA model is improved, making it more in line with the actual situation. The solar radiation data, vegetation type data, and NDVI data were imported into GIS and ENVI, and finally processed to obtain the raster data of the regional NPP. The NPP calculation formula for the improved CASA model is shown in Equations 3–7:
Where, APAR(x,t) represents the photosynthetically active radiation absorbed by pixel x in t month (g C·m-2·month-1), and ϵ(x,t) represents the actual light energy utilization rate of pixel x in t month (g C·MJ-1).
The equation for calculating APAR is:
Where PAR is photosynthetically active radiation and FPAR is photosynthetically active radiation absorption coefficient. FPAR calculations were modified to include surface reflectance and atmospheric correction factors:
The calculation of light energy use efficiency ϵ was modified, and the influence of soil temperature and vegetation type was introduced (Zhu et al., 2006):
Where, Tϵ1(x,t) and Tϵ2(x,t) represent the stress effects of low temperature and high temperature on light energy utilization, Wϵ(x,t) is the influence coefficient of water stress, and ϵmax is the maximum light energy utilization under ideal conditions.
2.5 NPP and population density change trend analysis
Unitary linear regression analysis based on pixel is a method to analyze the trend of land surface change by using remote sensing image data. For each raster pixel, a single linear regression model is used to fit its multi-year remote sensing index values to obtain its change slope and intercept, as well as the significance test results of the regression equation, to judge the surface change trend and confidence of the pixel (Zhang et al., 2011; Wu et al., 2022). This method is used to evaluate the data changes and is used to indicate the level of confidence in trend changes. In this study, the vegetation NPP and population density of each grid in the Wanjiang River Basin were analyzed every two years from 2004 to 2016.
Where θslpoe represents the change trend of the research object, and the unit is g C·m-2·a-1; i is the annual variable; Xi represents the value of the research object in the year i, and the unit is g C·m-2·a-1. When θslpoe>0, it indicates that the research object shows an improving growth trend, and when θslpoe<0, it indicates that the research object shows a decreasing trend.
2.6 Correlation analysis between NPP and population density
There is a correlation between population density and net primary productivity of vegetation, so correlation analysis is conducted to explore the close interaction degree between population density and NPP. According to the NPP value of each pixel in the study area and the spatial population density, Pearson correlation coefficient is used to represent the correlation between the NPP of each pixel and the population density. Specifically as in Equation 8 (Xi et al., 2022).
In this study, Rxy is the correlation coefficient of the research object; i is the annual variable; xi and yi are the values of year i respectively. and respectively are the corresponding average values; n is the study period.
2.7 Land use type analysis
Land use transfer matrix is a method to describe the quantitative relationship between different land use types in different periods (García et al., 2011). It can reflect the change trend and structure of land use in a region within a certain period and provide data basis and theoretical basis for land use change analysis and prediction (García et al., 2011). The mathematical expression is shown in Equation 9:
Where, i and j are the land use types before and after the transfer, respectively, and Sij is the area converted from class i to class j; n is the number of land use types.
2.8 Land Use Dynamic Index
Land Use Dynamicity reflects the change degree of land use type and its spatial distribution in a certain period. The dynamic attitude of land use can directly reflect the change situation of different land types, and the difference of scope and time span will present different results.
Single land use dynamic attitude is an indicator that reflects the rate of area change of a certain land use type within a certain time (Gu et al., 2023). It can help us analyze the increase or decrease of various land use types, as well as the cause and impact of the change. Specifically as in Equation 10:
Where T represents the duration of the study period. Ub and Ua are the area of the area before and after the time span, and the change of K value reflects the amount of mutual transformation of land use types.
The dynamic attitude of comprehensive land use can represent the overall land change in the study area (Liu et al., 2021). The formula is as in Equation 11:
Where LUi is the area of this type of land at the beginning of the study, ΔLUi-j is the area of the transformed land type, T is the selected period, and LC is the calculated dynamic attitude of comprehensive land use.
3 Results
3.1 RSEI model results
It was found that the mean value of the RSEI index in the study area of this paper showed an increasing trend from 2010 to 2022, indicating that the ecological environment in the study area has gradually become better. Combining the changes of the four indicators in the RSEI, from 2010 to 2022, the mean values of the humidity indicator and the greenness indicator have increased, and the mean value of the dryness indicator has decreased, which all improve the quality of the ecological environment to a certain extent, and although the increase of the mean value of the heat indicator can reduce the quality of the ecological environment, in general the three indicators are conducive to the improvement of the quality of the ecological environment, which is in line with the trend of the changes of the RSEI Index. This is consistent with the trend of RSEI index.
The changes of key areas in the Wanjiang River Basin in the past 12 years were compared and analyzed, and the spatial distribution of RSEI in three phases in 2010, 2016 and 2022 were shown in Figure 2. Overall, the ecological quality showed a process of first deterioration and then good; In 2010, the ecological quality was good in most areas of Wuhu City and Ma’anshan City, and the poor and poor areas appeared in a large area of Tongling City and existed along the Yangtze River. In 2016, the ecological quality deteriorated further, and the areas with poor ecological quality gradually increased, with the most significant changes in Wuhu City and Ma’anshan City. By 2022, the areas with excellent ecological quality will expand on a large scale. Except for the areas near the Yangtze River Basin, the green area will increase significantly, and the ecological environment quality will be significantly improved. The areas with excellent ecological quality and good ecological quality will expand significantly, especially in Tongling City.
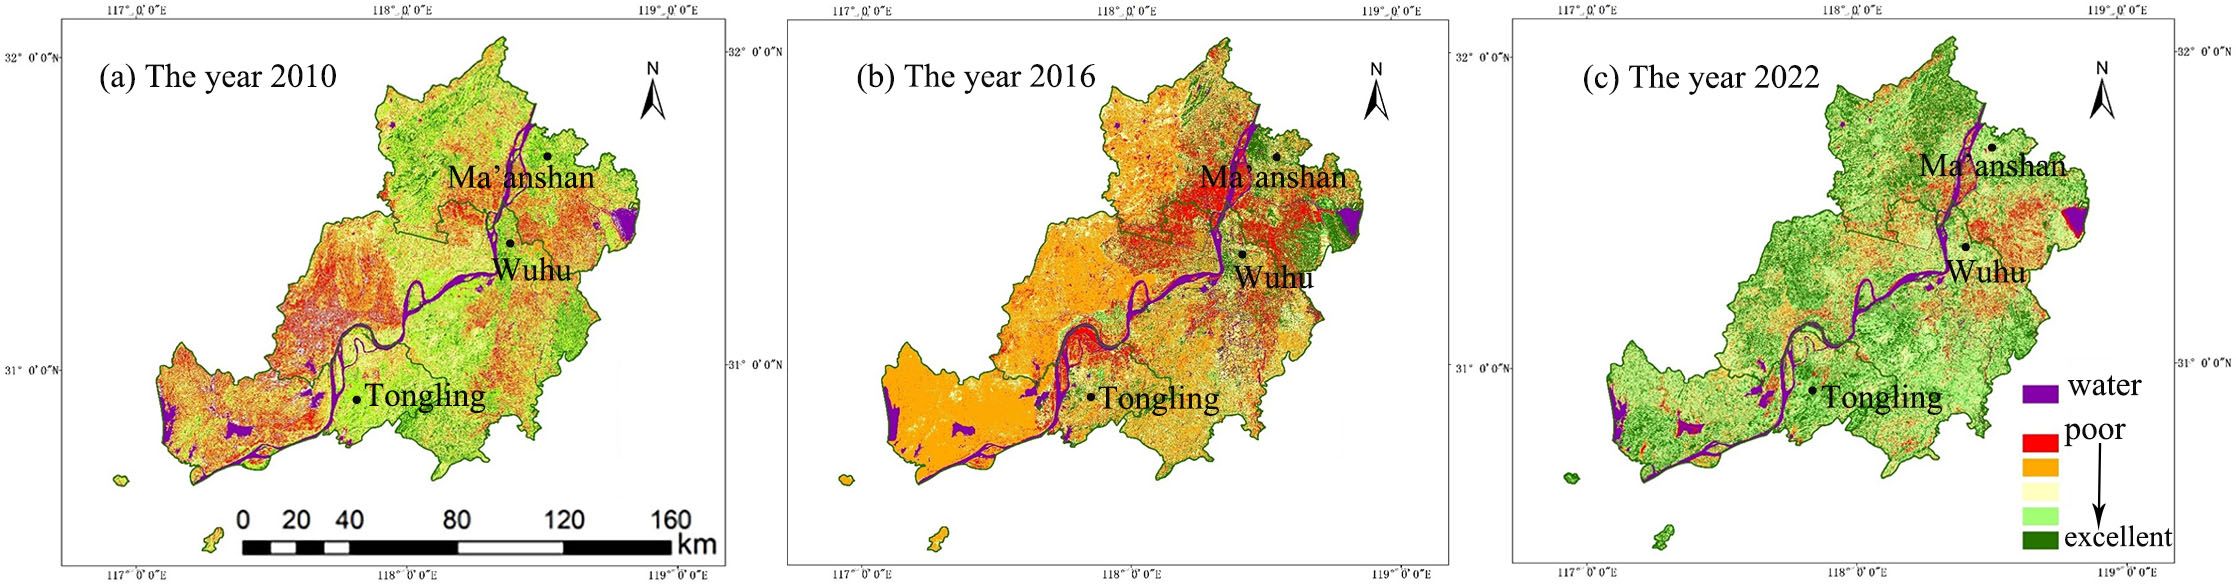
Figure 2. RSEI index classification map of remote sensing data in each period: (A) the year 2010; (B) the year 2016; (C) the year 2022.
Table 2 shows the area of RSEI of each grade and its percentage in key areas of the Wanjiang River Basin. In 2010, the ecological environment quality is mainly moderate and good, and by 2022, the ecological environment quality is good and excellent, accounting for 61.56%. It shows that from 2010 to 2022, the ecological environment quality has improved significantly, and the overall environmental quality is becoming more and more perfect.
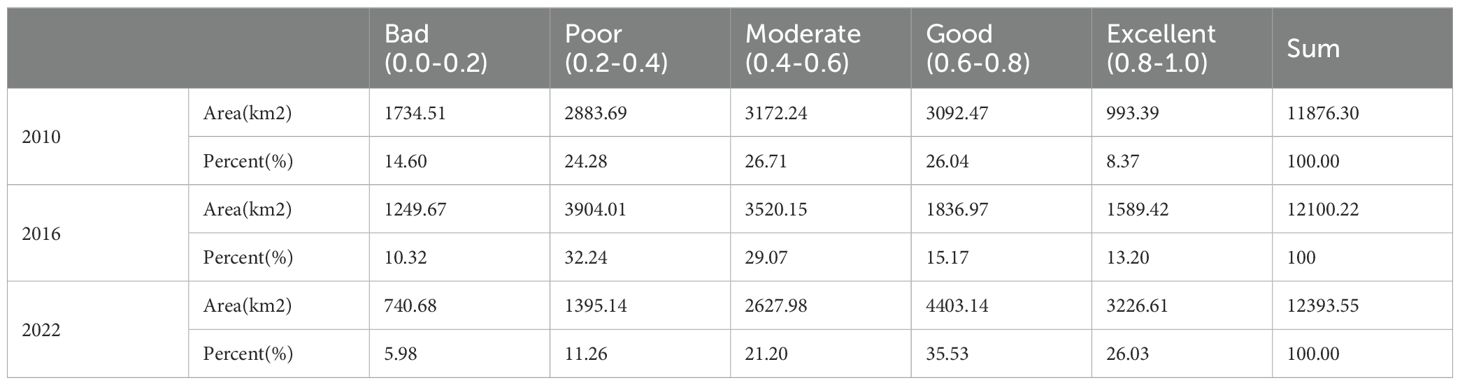
Table 2. Statistical for RSEI grade area and its percentage of remote sensing data in key areas of the wanjiang river basin from 2010 to 2022.
3.2 NPP estimation based on improved CASA models
3.2.1 NPP spatial distribution characteristics
The results of the five years from 2004 to 2016 are shown in Figure 3, from 2004 to 2016, the regional distribution of annual NPP in the Wanjiang River Basin varies greatly. It can be seen that the distribution pattern of the annual NPP in this Basin is lower in the north and higher in the south, southwest and southeast borders with the Yangtze River as the boundary. The main high-value areas are in the north of Anqing, Chizhou and the south of Xuancheng. The high-value areas of Chizhou and Xuancheng are connected into a belt, and the average annual NPP value of the whole Wanjiang River Basin is 274.36 g C·m-2·a-1 in this region. North of the Yangtze River is the middle and low NPP value area, and most of them are above and below the mean value, among which the NPP value in the downtown area of Hefei is obviously low, the lowest is 64.9g C·m-2·a-1. As a result of the analysis, the interannual variation of NPP in the Wanjiang River Basin from 2004 to 2016 was not significant, the overall NPP fluctuated but the amplitude was not obvious, with a fluctuation range of 16.01 g C·m-2·a-1. The average annual NPP ranged from 258.35 to 274.36 g C·m-2·a-1, with an average of 266.81 g C·m-2·a-1.

Figure 3. Spatial distribution of NPP in the study area.
3.3 Change trend analysis of vegetation NPP and population density
3.3.1 Spatial and temporal trends of NPP (gC/m2·a)
The spatial and temporal variation trend of net primary productivity of vegetation in the past five years was studied according to the single linear regression analysis. From the Figure 4A, it can be seen that the Slope ranges from -65.8504 to 52.9778. The green part of the Figure 4 represents a positive correlation, indicating that NPP shows an increasing trend year by year; On the contrary, the NPP of the red part shows a decreasing trend year by year.
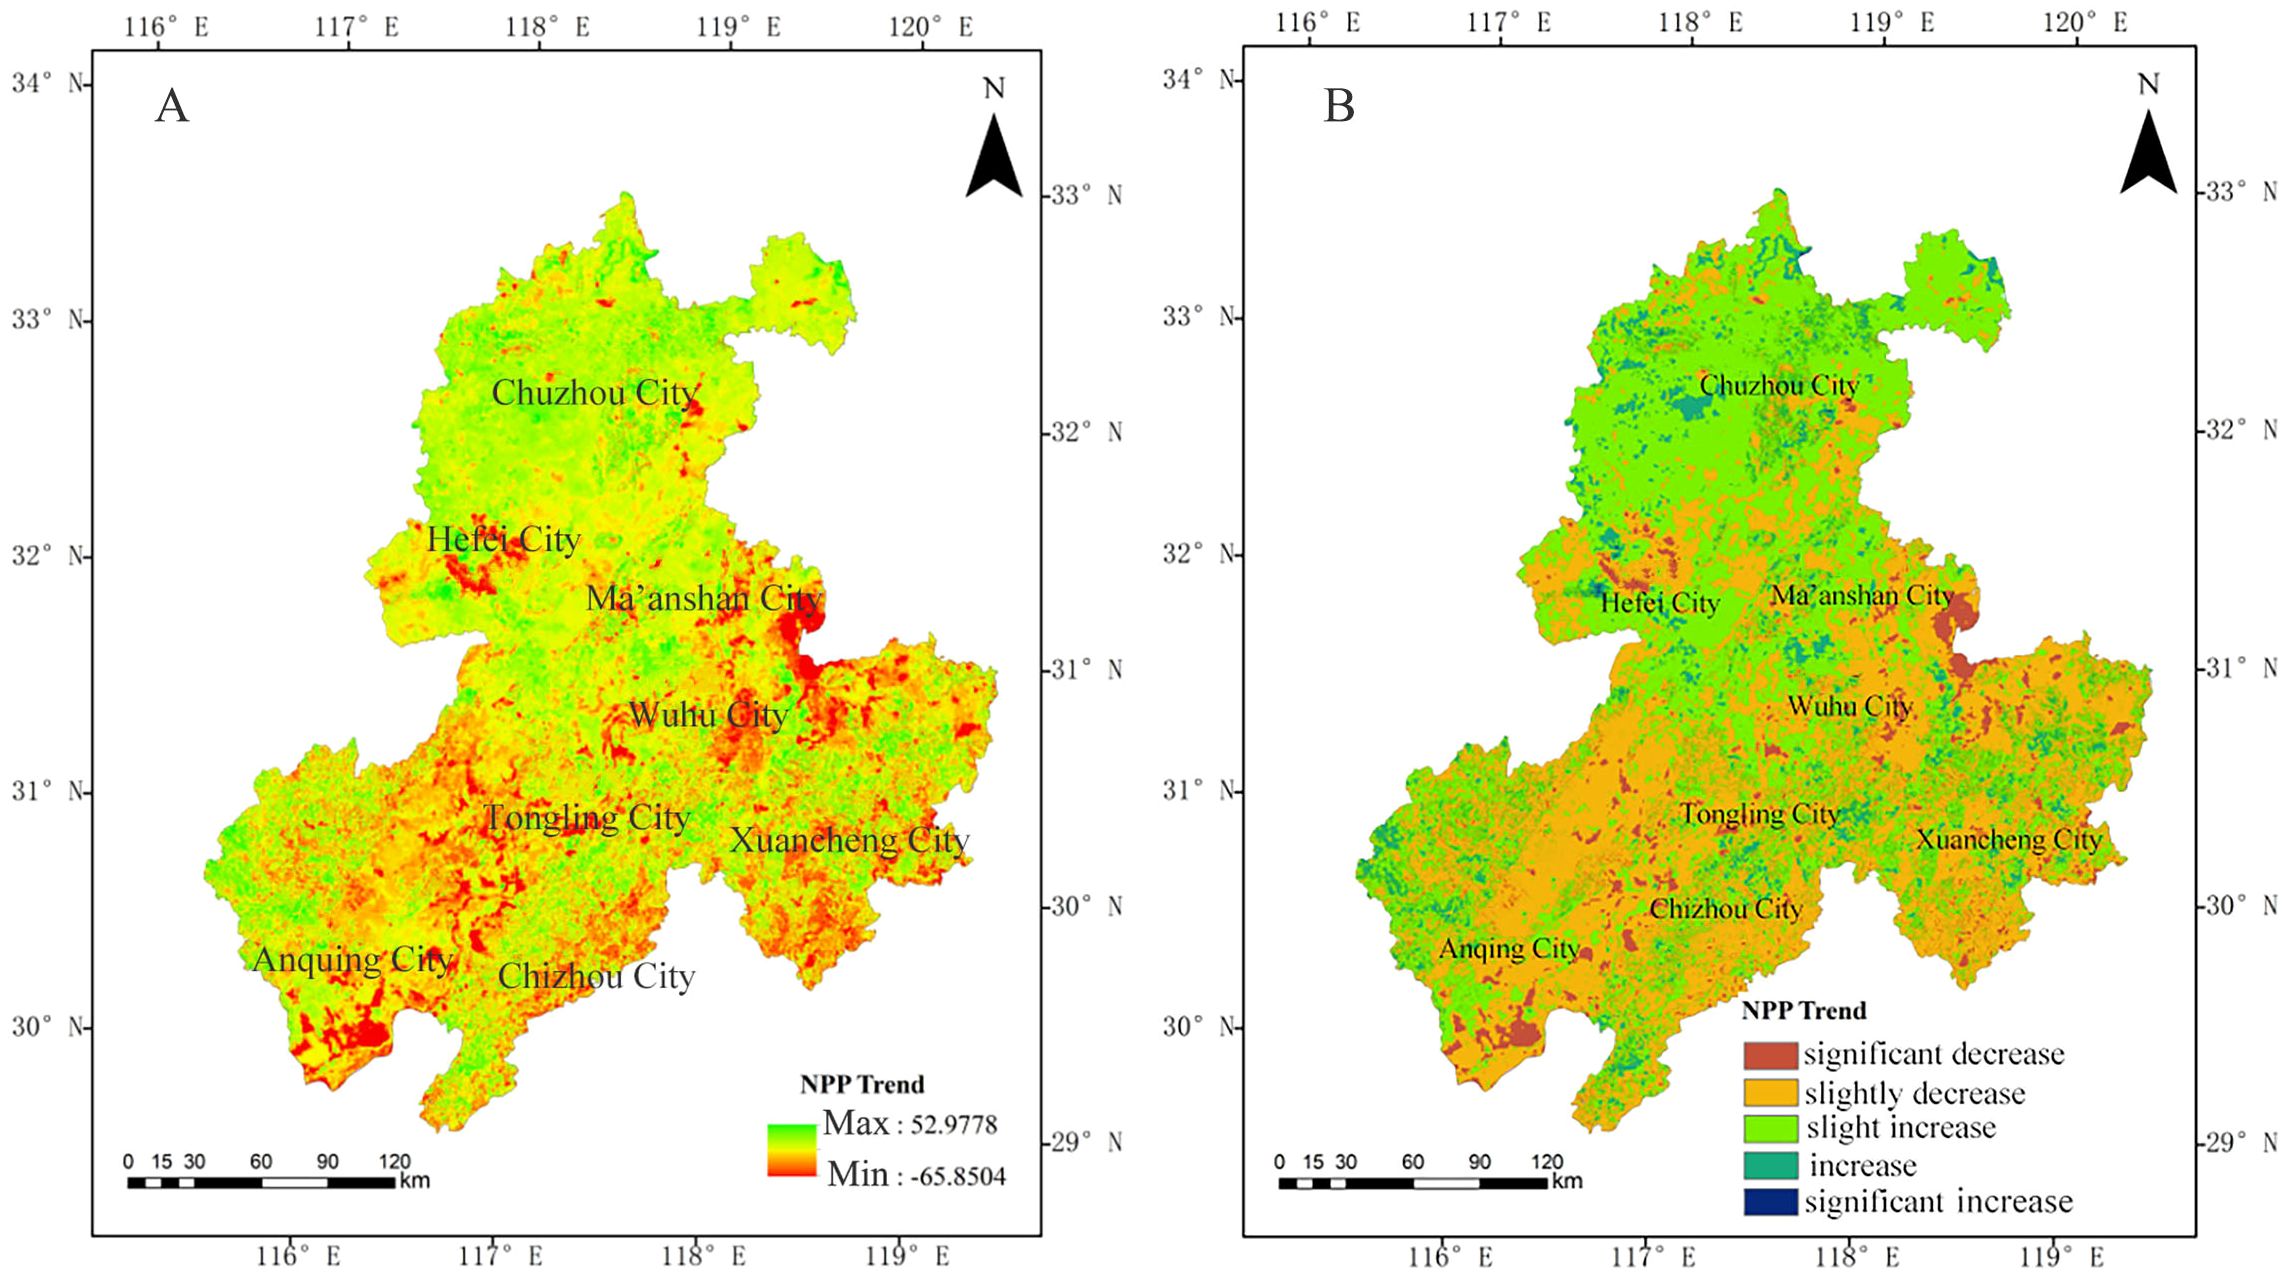
Figure 4. Spatial and temporal trends of NPP in the study area before and after reclassification: (A) before reclassification; (B) after reclassification.
As can be seen in Figure 4B, the total area of NPP growing in the Wanjiang River Basin is 399,995,800 pixels, accounting for about 49.9% of the total pixels of the grid, and the area of NPP increase slightly is 3513,704 pixels, accounting for about 43.9% of the Wanjiang River Basin. Most of them are densely distributed in the northern area of the Wanjiang River Basin near Chuzhou City. The area of NPP showed a significant growth trend of 19797 pixels, accounting for only about 0.024%. The area of the Wanjiang River Basin showed a decreasing trend of about 50.1%, and most of the area was distributed in the southwest, middle, and southeast of the Wanjiang River Basin, with a total of 40185978 pixels. The area of NPP decreased slightly accounted for 46.7% of the total area of the Wanjiang River Basin, while the area of NPP decreased significantly accounted for 3.4% of the total area, most of which were scattered in the boundary of the Wanjiang River Basin research area southeast of Ma ‘anshan, the southern area of Anqing City and the central area of Hefei City. The above data indicate that the variation trend of NPP of vegetation in the Wanjiang River Basin from 2004 to 2016 showed a slight decrease, but the overall NPP level remained basically unchanged. The vegetation growth environment in different regions may be improved or worsened, but the NPP in the Wanjiang River Basin has remained stable for many years.
3.3.2 Temporal and spatial trend analysis of population density
The population density changes trend of the Wanjiang River Basin from 2004 to 2016 is shown in Figure 5; Table 3 is obtained through statistical analysis. According to the calculation from Table 3, the area with a growing trend account for about 31.8% of the total area of the Wanjiang River Basin, and the area with a significant increase trend is mainly concentrated in the central area of Hefei city, accounting for about 1.96% of the total area of the Wanjiang River Basin research area. This is because Hefei, as a provincial capital city, has a developed economy, a high level of urbanization, a large population inflow, and is also a member of the Yangtze River Delta city cluster. The area with decreasing population density accounts for 68.2% of the total area of the Wanjiang River Basin, which is basically evenly distributed throughout the whole Wanjiang River Basin, which should consider the overall rural population transfer to urban areas, the urbanization of agricultural population and the hollowing out of rural areas. The area with a significant decreasing trend accounts for about 1.86% of the total area of Wanjiang River Basin, scattered in the Wanjiang River Basin. The temporal and spatial trends of population density in the Wanjiang River Basin partly reflect the general characteristics of population development in China, that is, the population growth rate is slowing down, the urbanization level is improving, and the population flow tends to be active. At the same time, some problems have also been exposed, such as unbalanced urbanization development and excessive concentration of a small number of densely populated areas.
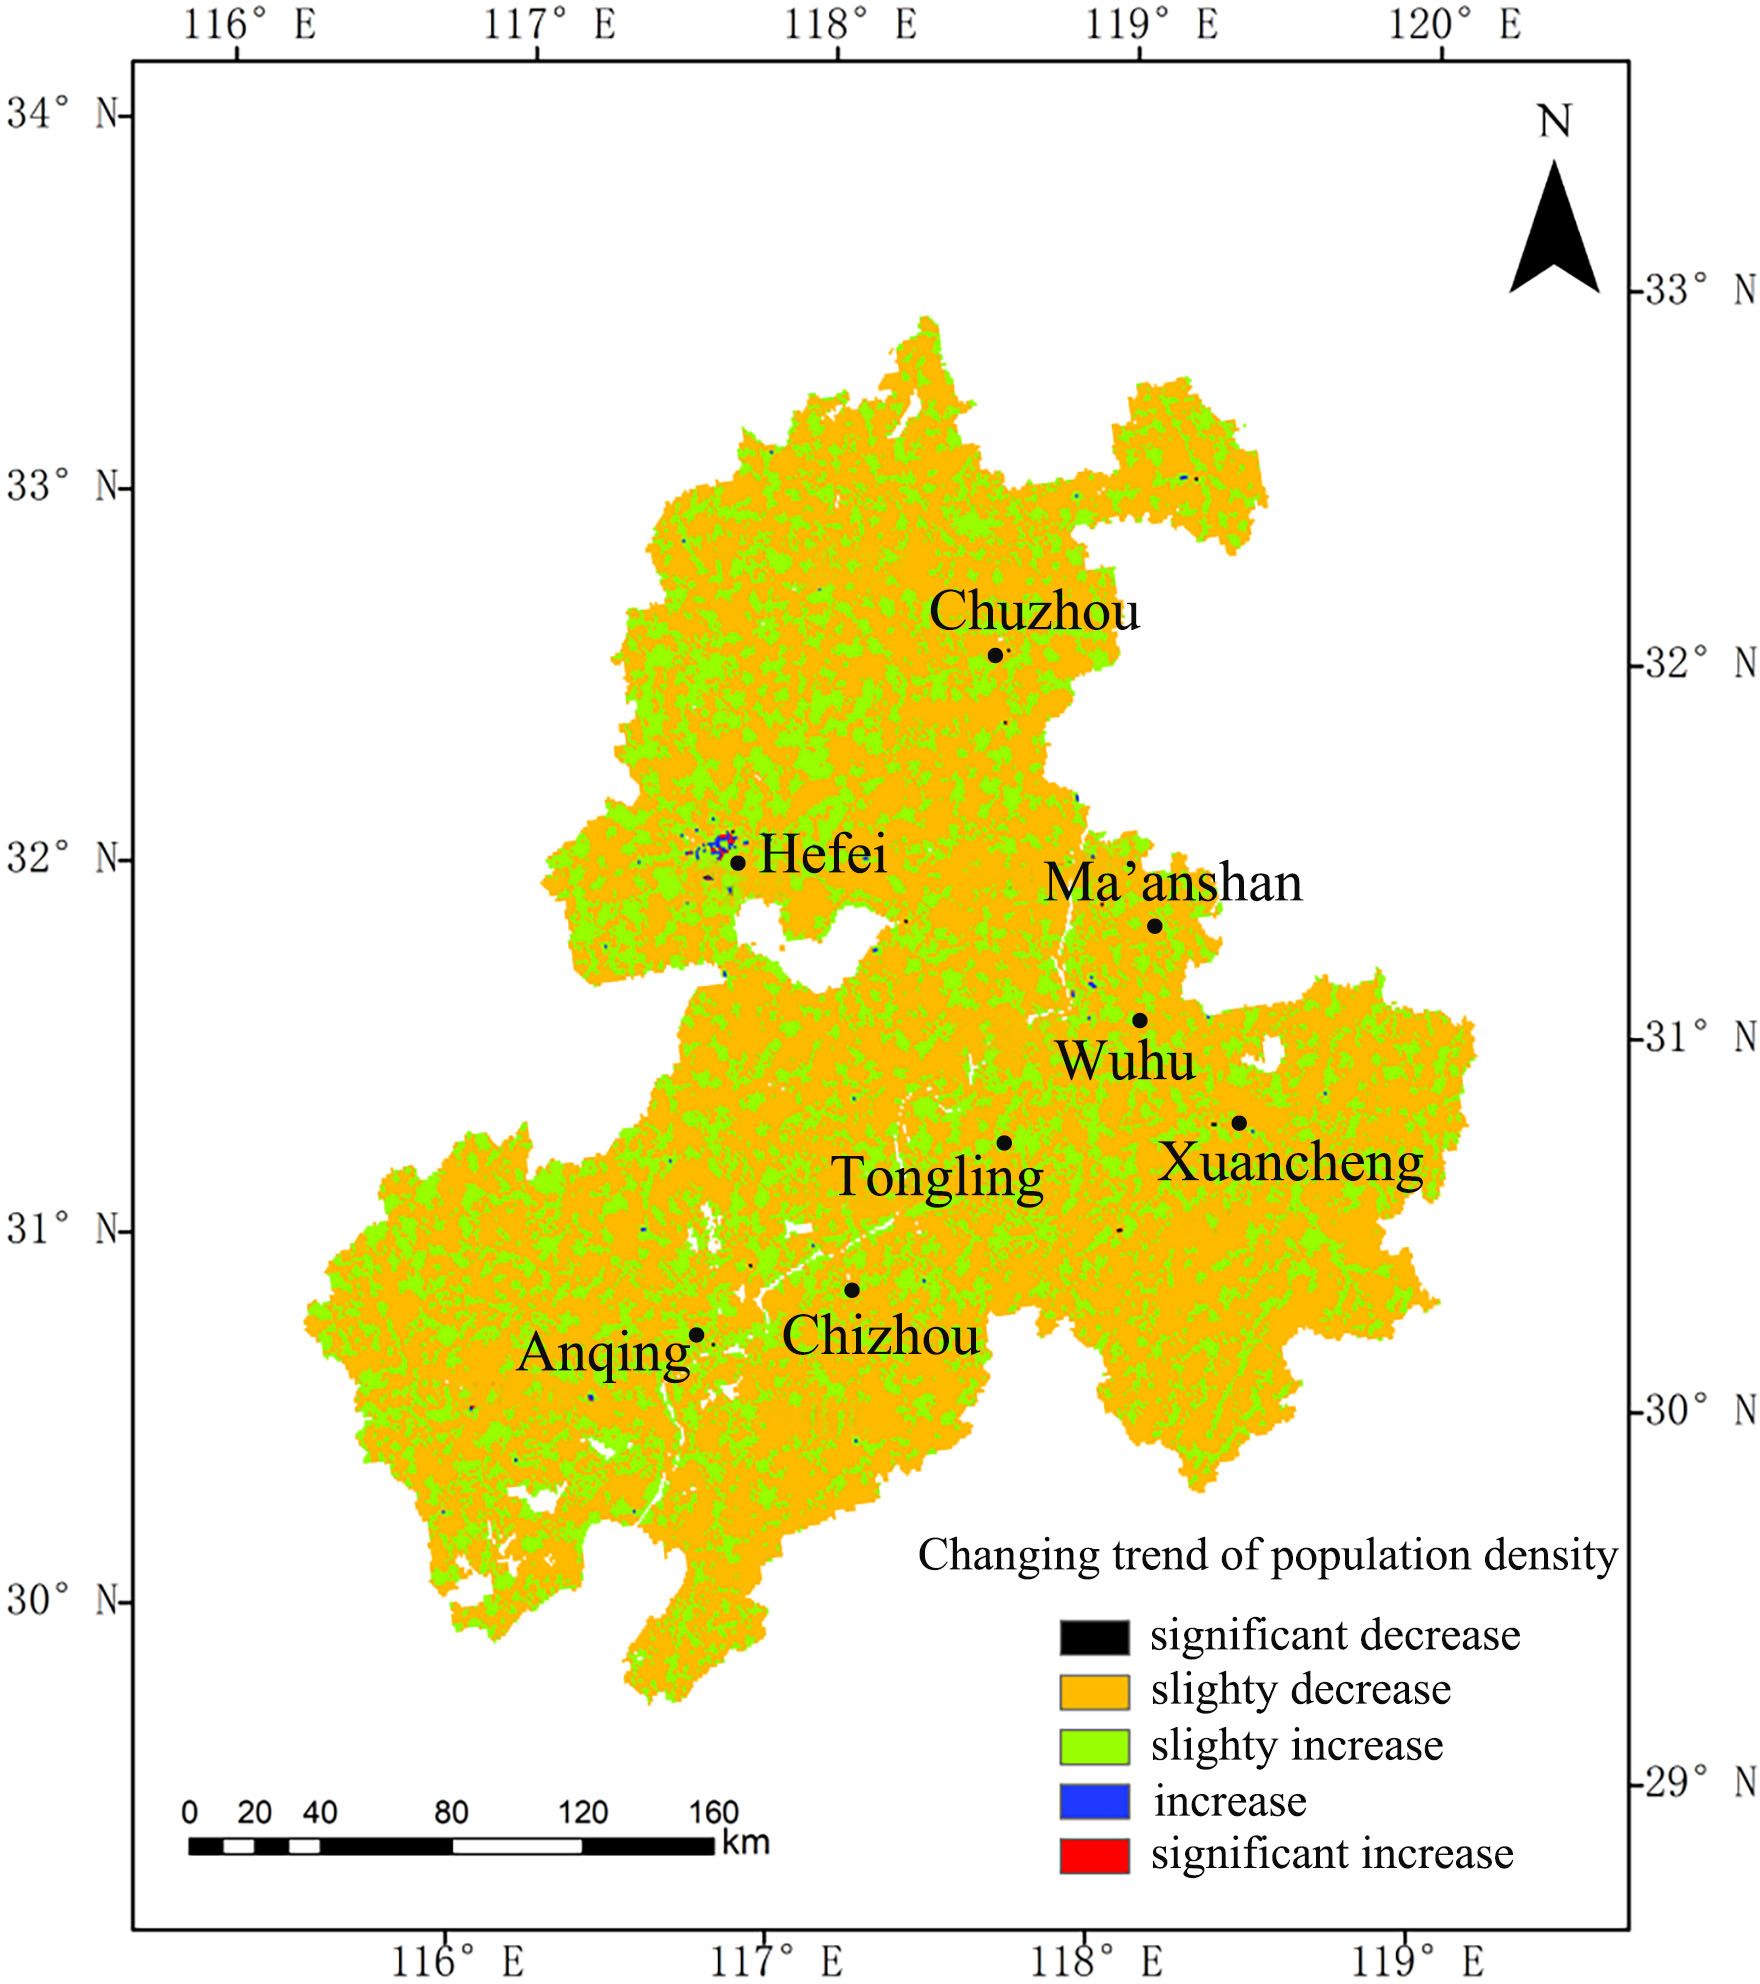
Figure 5. Trends in population density.
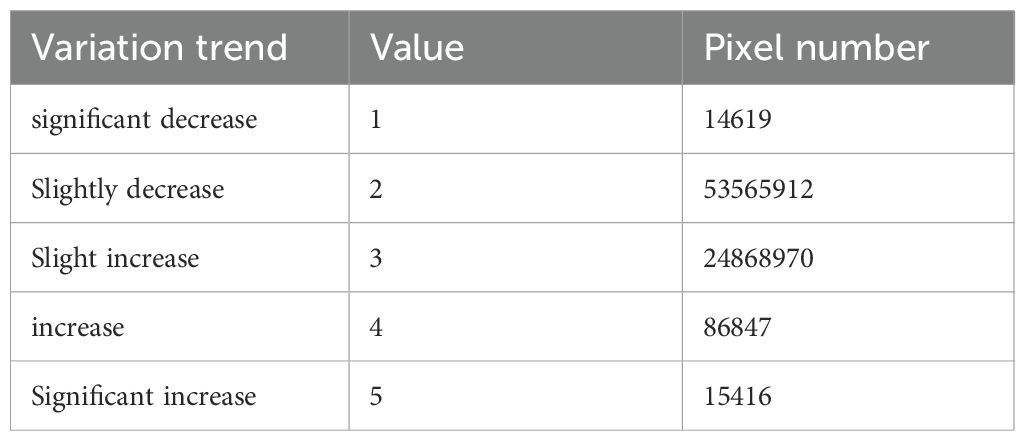
Table 3. Trends in population density from 2004 to 2016 in the study area.
3.4 Correlation analysis between NPP and population density
The spatial distribution of the correlation between NPP and population density in the Wanjiang River Basin from 2004 to 2016 based on pixel scale is shown in Figure 6. The correlation statistical analysis shows that the range of correlation coefficient between NPP and population density is close to -1~1, and the spatial average correlation coefficient is about 0.004. Through statistical analysis, the positive correlation area is about 35,120km2, accounting for 49.9% of the total basin area, which is basically the same as the negative correlation area. The area with significant positive correlation is about 18.3% of the total area of Wanjiang River Basin, and the area with significant negative correlation is about 17.4% of the total area of Wanjiang River Basin. The areas with significant negative correlation were mainly distributed in Hefei and Chuzhou, while the areas with significant positive correlation were distributed evenly in Chizhou and Xuancheng, Anqing City and Tongling City. These regions are mainly agricultural areas, and densely populated areas are usually places where agricultural production activities are more frequent. The climate in this region is warm and humid, and the terrain is quite undulating, which is the reason for the significant positive impact (Maloney et al., 2020).
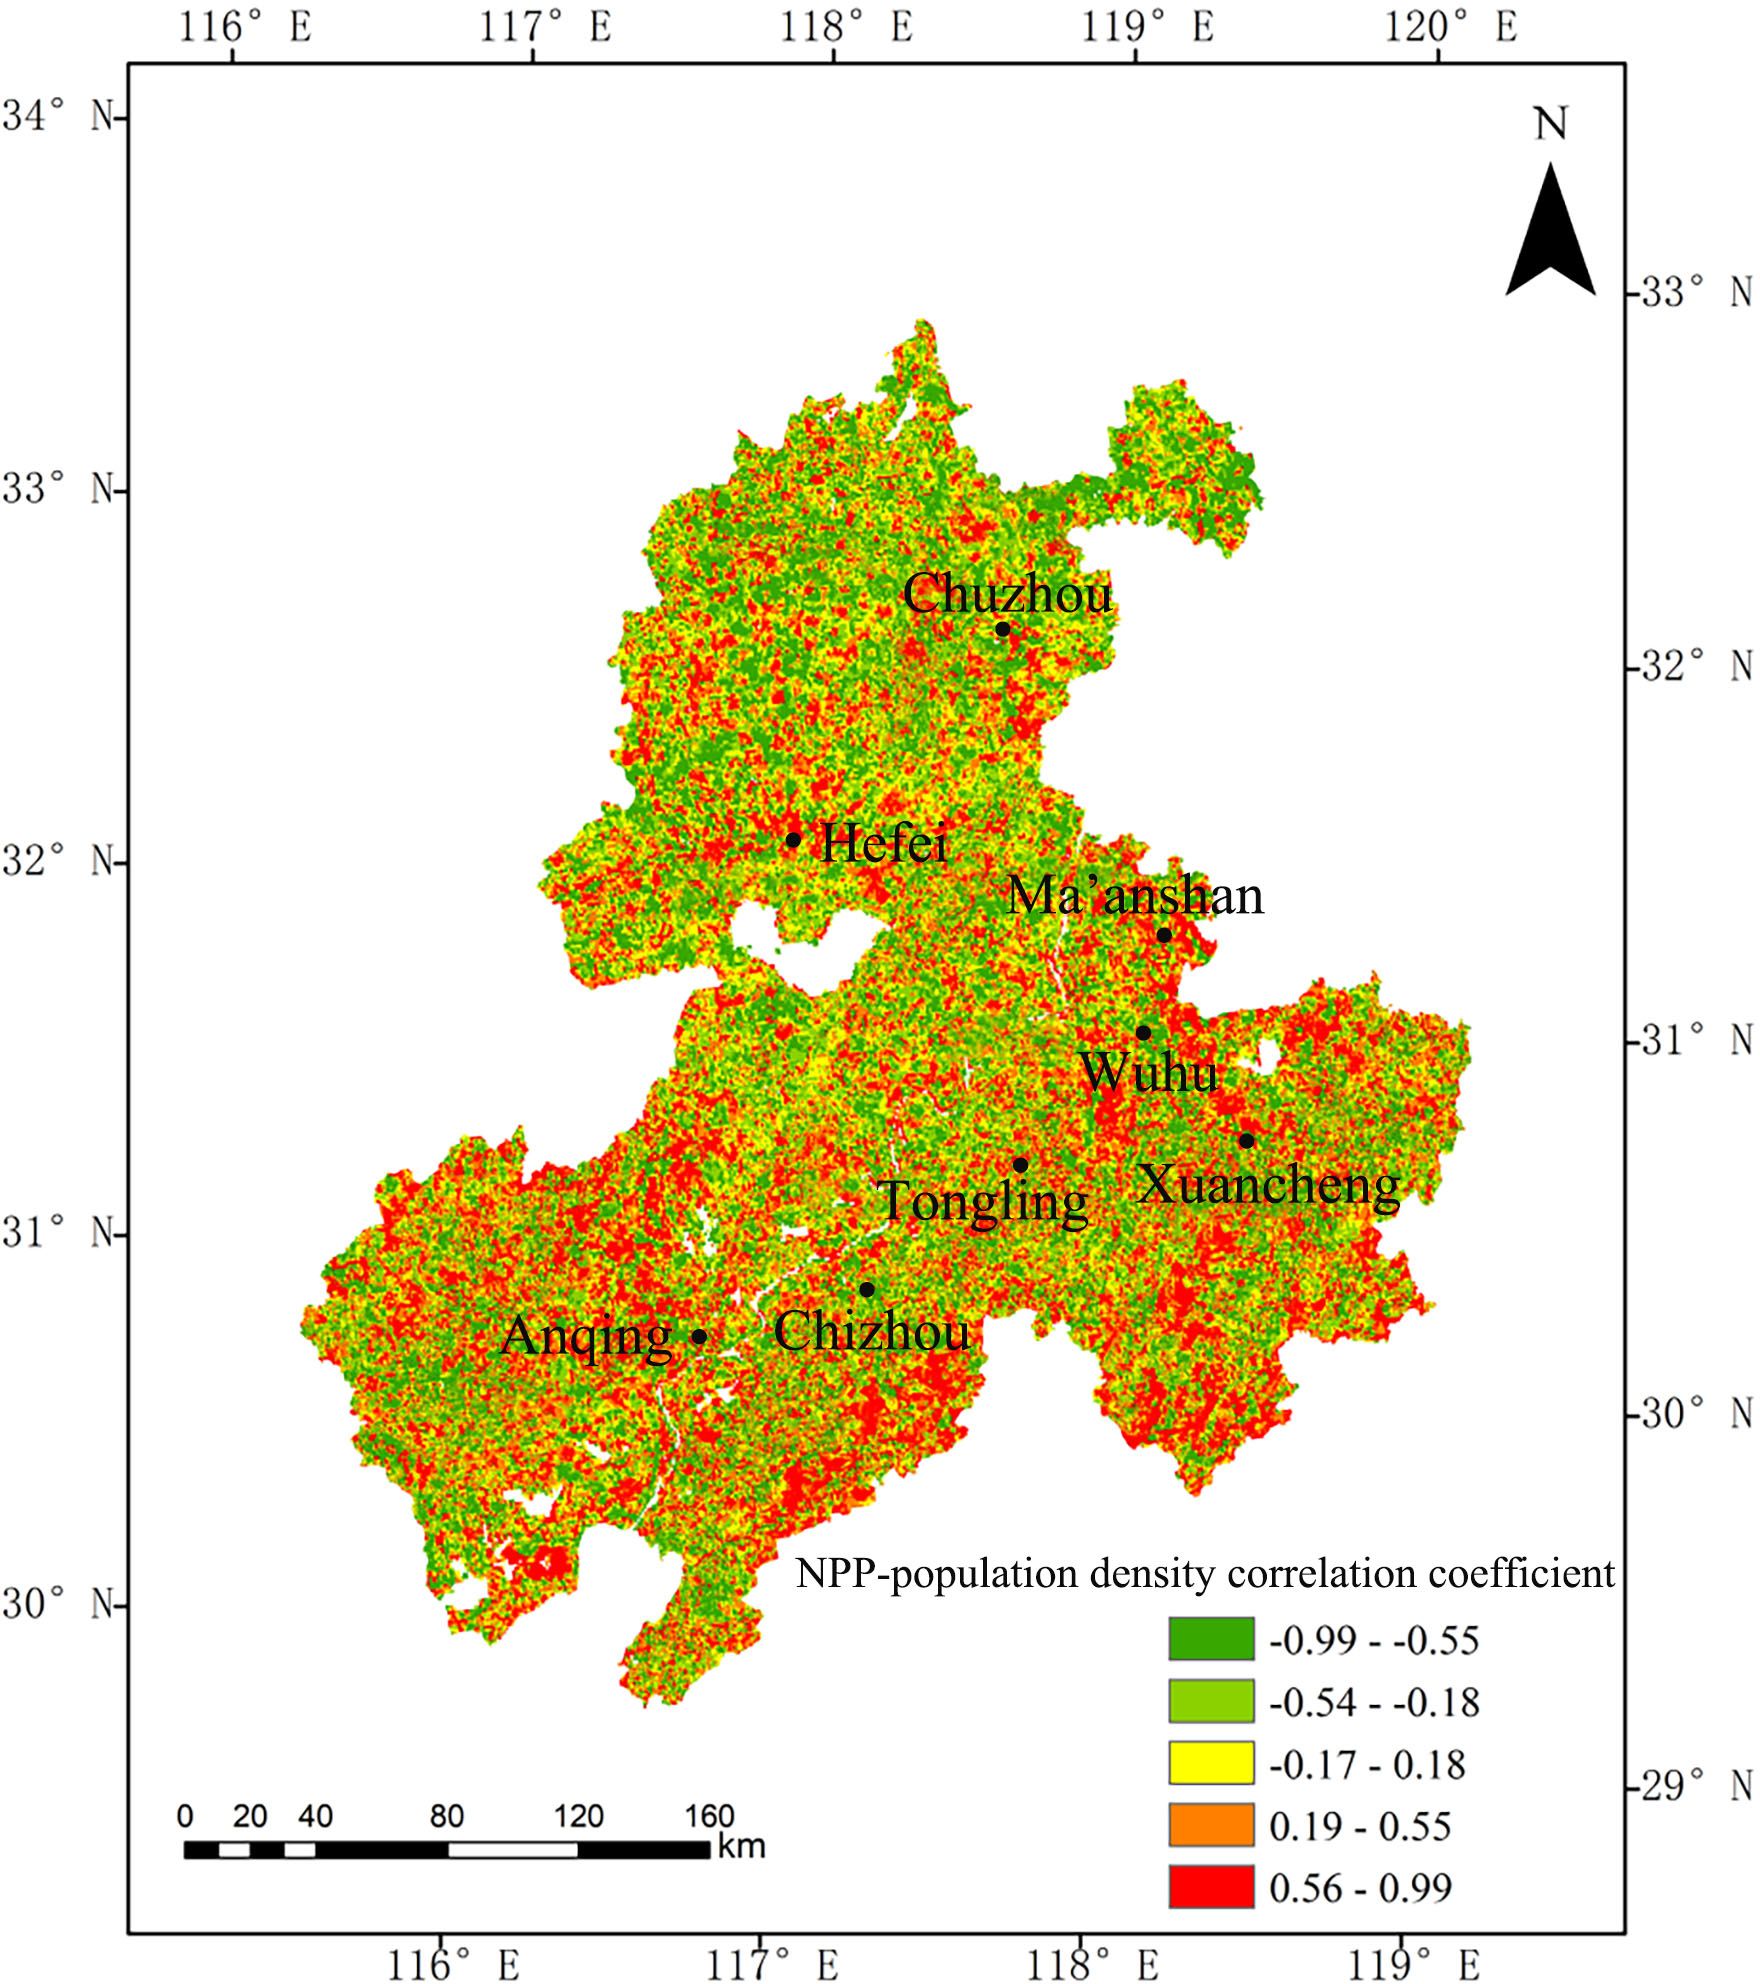
Figure 6. Spatial distribution of correlation coefficients between population density and NPP.
3.5 Correlation analysis of population density and land use
3.5.1 Analysis and results of land use
Previous studies on land use change indicated that in the process of rapid urbanization both at home and abroad, land use change would have a multi-faceted impact, including land cover change, urban hardening, soil infiltration capacity change, urban heat island and many other problems, thus affecting the quality of urban ecological environment to a certain extent. In order to explore whether the implementation of the planning has achieved the expected results and what impact it has on the society, economy and ecology of the city, this paper takes the key areas of the Wanjiang River Basin as an example, combines remote sensing data and land survey data, uses remote sensing and GIS spatial analysis technology to conduct quantitative analysis of land use, and scientifically evaluates the status quo of land use in the middle and later periods (Ju et al., 2010; Lei et al., 2010; Maloney et al., 2020).
According to China’s national standard “Classification of Land Use Status Quo”, the land use data were classified and divided into cultivated land, forest, shrub, grassland, water area, unused land and building land (Shan et al., 2019; Gu et al., 2023). As shown in Table 4, the building land area and forest area in key areas of the Wanjiang River Basin increased significantly during 2010-2022, mainly due to the great reduction of water area and cultivated land area, as well as the development and utilization of unused land. The urban expansion in key areas of the Wanjiang River Basin from 2010 to 2022 is mainly completed on cultivated land.
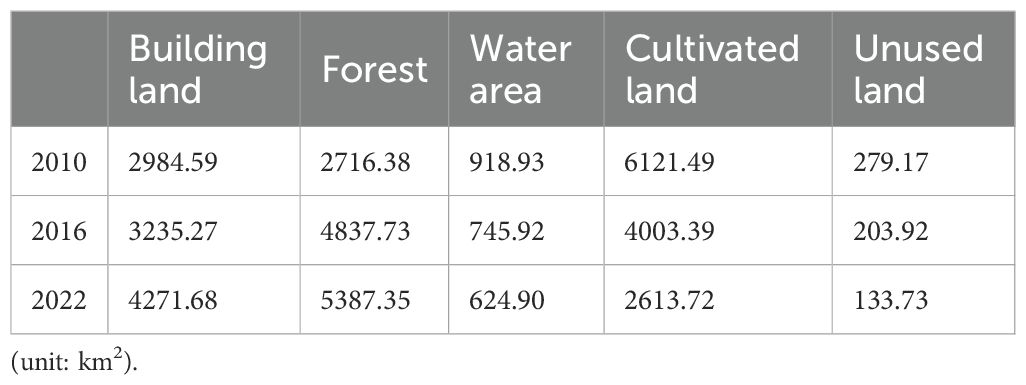
Table 4. Land use area of key areas in the study area from 2010 to 2022 based on remote sensing data for each period.
From the data in Table 4, the construction area increased by 1287.09km2, with a change rate of 43.12%. The total area of forest land increased by 2670.97km2, with a change rate of 98.32%. The area of water area cultivated land and unused land decreased, and the change rate of cultivated land and unused land was more than half.
3.5.2 Dynamic attitude analysis of land use
As can be seen from Figure 7, the spatial distribution changes of land use in the Wanjiang River Basin in 2010, 2015 and 2020 are not obvious from a macro perspective. Cultivated land is mainly distributed in the north of the Yangtze River, while forest land is mainly distributed in Anqing City, Chuzhou City and Xuancheng City. The building land is distributed in Hefei City and the areas along the river.
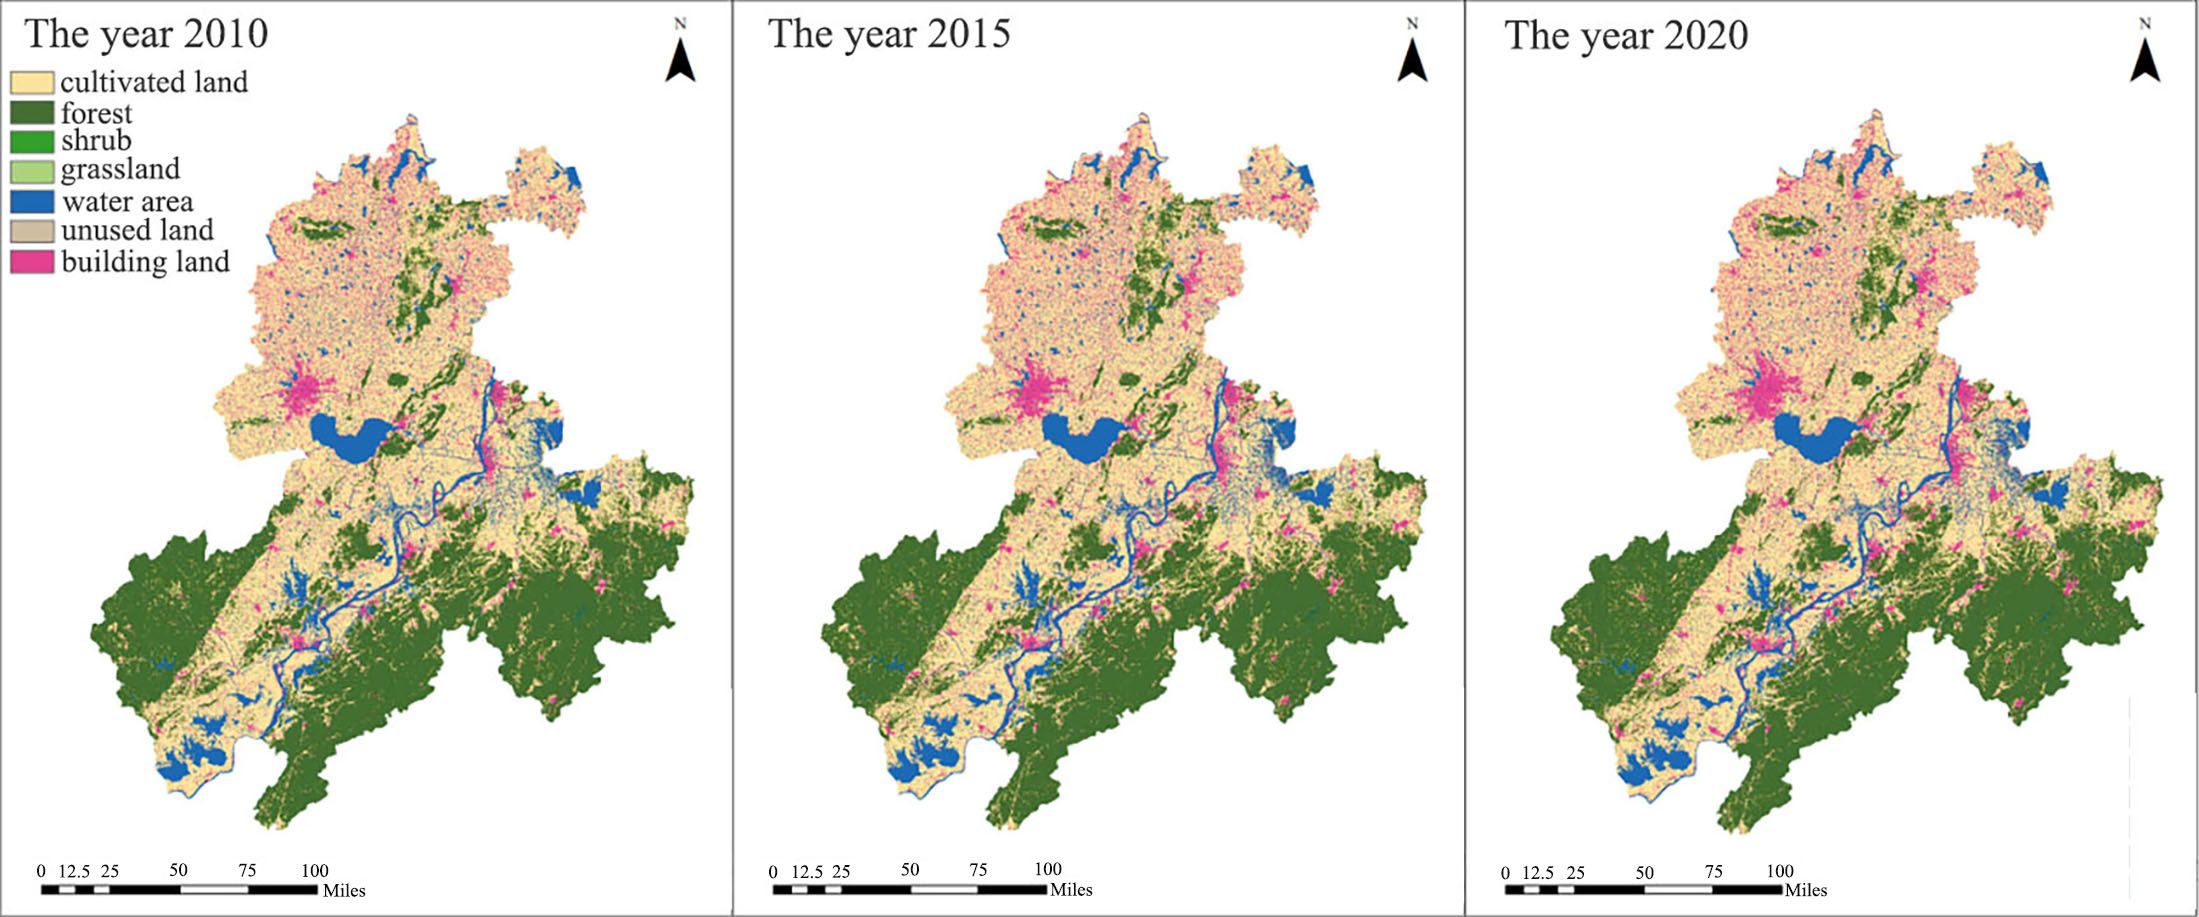
Figure 7. Spatial distribution of current land use.
ENVI, the Environment for Visualizing Images, is a banner product of ITT VIS Corporation in the United States. It is a fully functional remote sensing image processing system developed based on IDL interactive data language. It is an advanced tool for processing, analyzing, and displaying multispectral data, hyperspectral data, and radar data, and has been ranked number one by the U.S. Geographic Intelligence Agency (NIMA) remote sensing software for many years. The transfer area matrix of land use type can be used to calculate the transfer area matrix of land use type.
As can be seen from Table 5, from 2010 to 2020, the land type transfer area from high to low is cultivated land > forest > water area > building land > grassland > unused land > shrub. The cultivated land area decreased by 380.16 km2, the forest area decreased by 733.05 km2, and the building land increased by 1241.0717 km2. In the past ten years, due to the acceleration of urbanization, a large amount of building land has been transferred, and basically from cultivated land and forest.
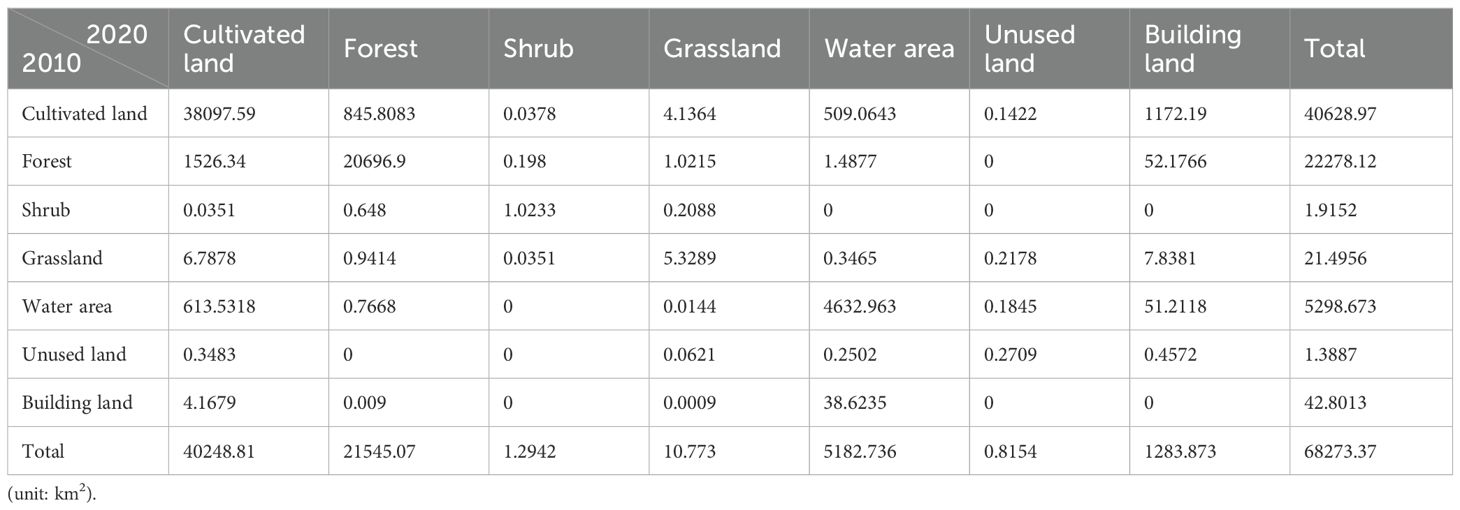
Table 5. Statistical results on land-use transfers in the study area from 2010 to 2020.
After calculating and excluding the unconverted land area, the land dynamic data at three time points were obtained and the Table 6 showed that from 2010 to 2015, only the building land and water area increased, and the conversion rate of building land was the largest. The area of other land types decreased in different amplitude, among which the largest reduction was the unused land. From 2015 to 2020, in addition to the overall construction land area increased, the rest of the land area decreased, among which the grassland area decreased the most.
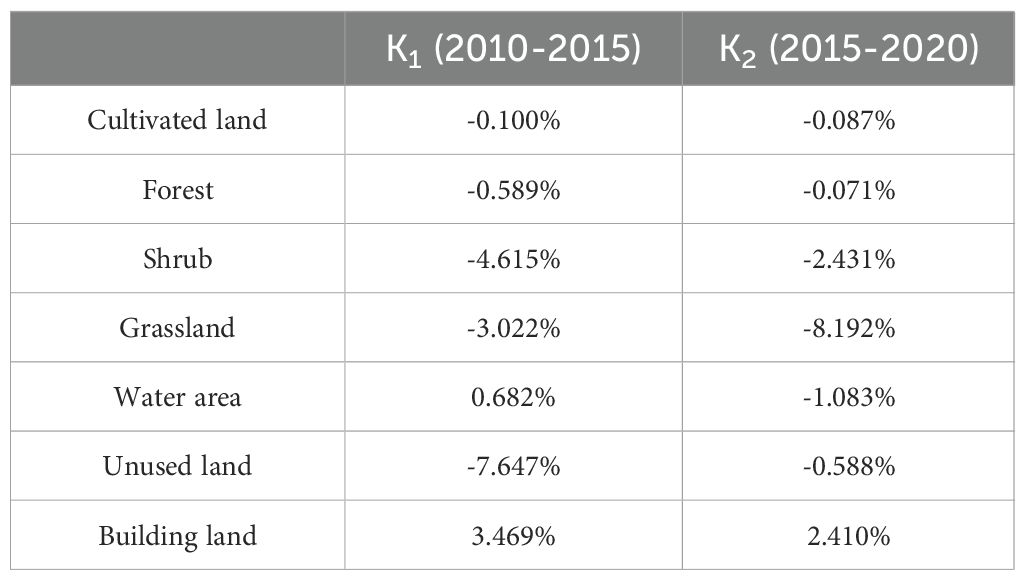
Table 6. Statistical results of land-use dynamics in the study area for 2010-2015 and 2015-2020.
Calculated by combining the land use dynamics, it can be seen that the degree of land use change from 2015 to 2020 has increased compared with that from 2010 to 2015, which means that the change of land use in Wanjiang River Basin will evolve more strongly with the development and time.
3.5.3 Effect of land use type on ecological environment quality
The change of land use type has a very important impact on the ecosystem, including a positive promoting effect on improving the ecological environment quality and a negative effect on reducing the ecological environment quality (Shan et al., 2019; Xiong et al., 2021; Rai et al., 2023). The transfer into of forest land and water area and the transfer out of cultivated land, building land and unused land are conducive to improving the ecological environment quality. The transfer out of forest land and water area, as well as the transfer into of cultivated land, building land and unused land will reduce the quality of ecological environment.
According to the above data analysis, the cultivated land area was the largest in 2010, and the cultivated land ecosystem is related to the development of biodiversity. The increase of cultivated land area means that the use of chemical fertilizers and pesticides is increasing, which further destroys the biodiversity and ecological environment balance of cultivated land area, resulting in the decrease of the annual RSEI index and the deterioration of ecological environment quality. From 2010 to 2020, in response to the policies of “green water and green mountains are golden mountains and silver mountains” and “returning farmland to forests”, the government has increased the area of forest land on a large scale, which directly affects the quality of ecological environment. The increase of green land area directly improves the ecological environment of urban areas and strengthens the ecological environment level of the whole Wanjiang River Basin region. At the same time, the increase of building land will inevitably occupy the area of cultivated land and forest land, which will have an impact on the urban ecological environment, and the water area will be slightly reduced, and the unused land area will be slightly increased. In conclusion, the increase of forest land is conducive to soil and water conservation, environment improvement, climate regulation, etc., and the ecological environment quality gradually becomes better from 2010 to 2020, which is consistent with the analysis results of remote sensing ecological index.
3.5.4 Average annual analysis of population density distribution
Population density images reflect the density of population distribution within an area (usually a country, province, city, etc.). Different colors represent different ranges of population density. By observing population density images, we can intuitively understand the changing trend of population distribution in a certain region, such as the impact of urbanization process on population density.
As shown in Figure 8, the average annual distribution of population density in the Wanjiang River Basin from 2010 to 2020 has significant characteristics. Areas with high population density are mainly concentrated in industrialized and urbanized areas, and other urban centers are only scattered, while areas with low population density are usually located in rural or remote areas.
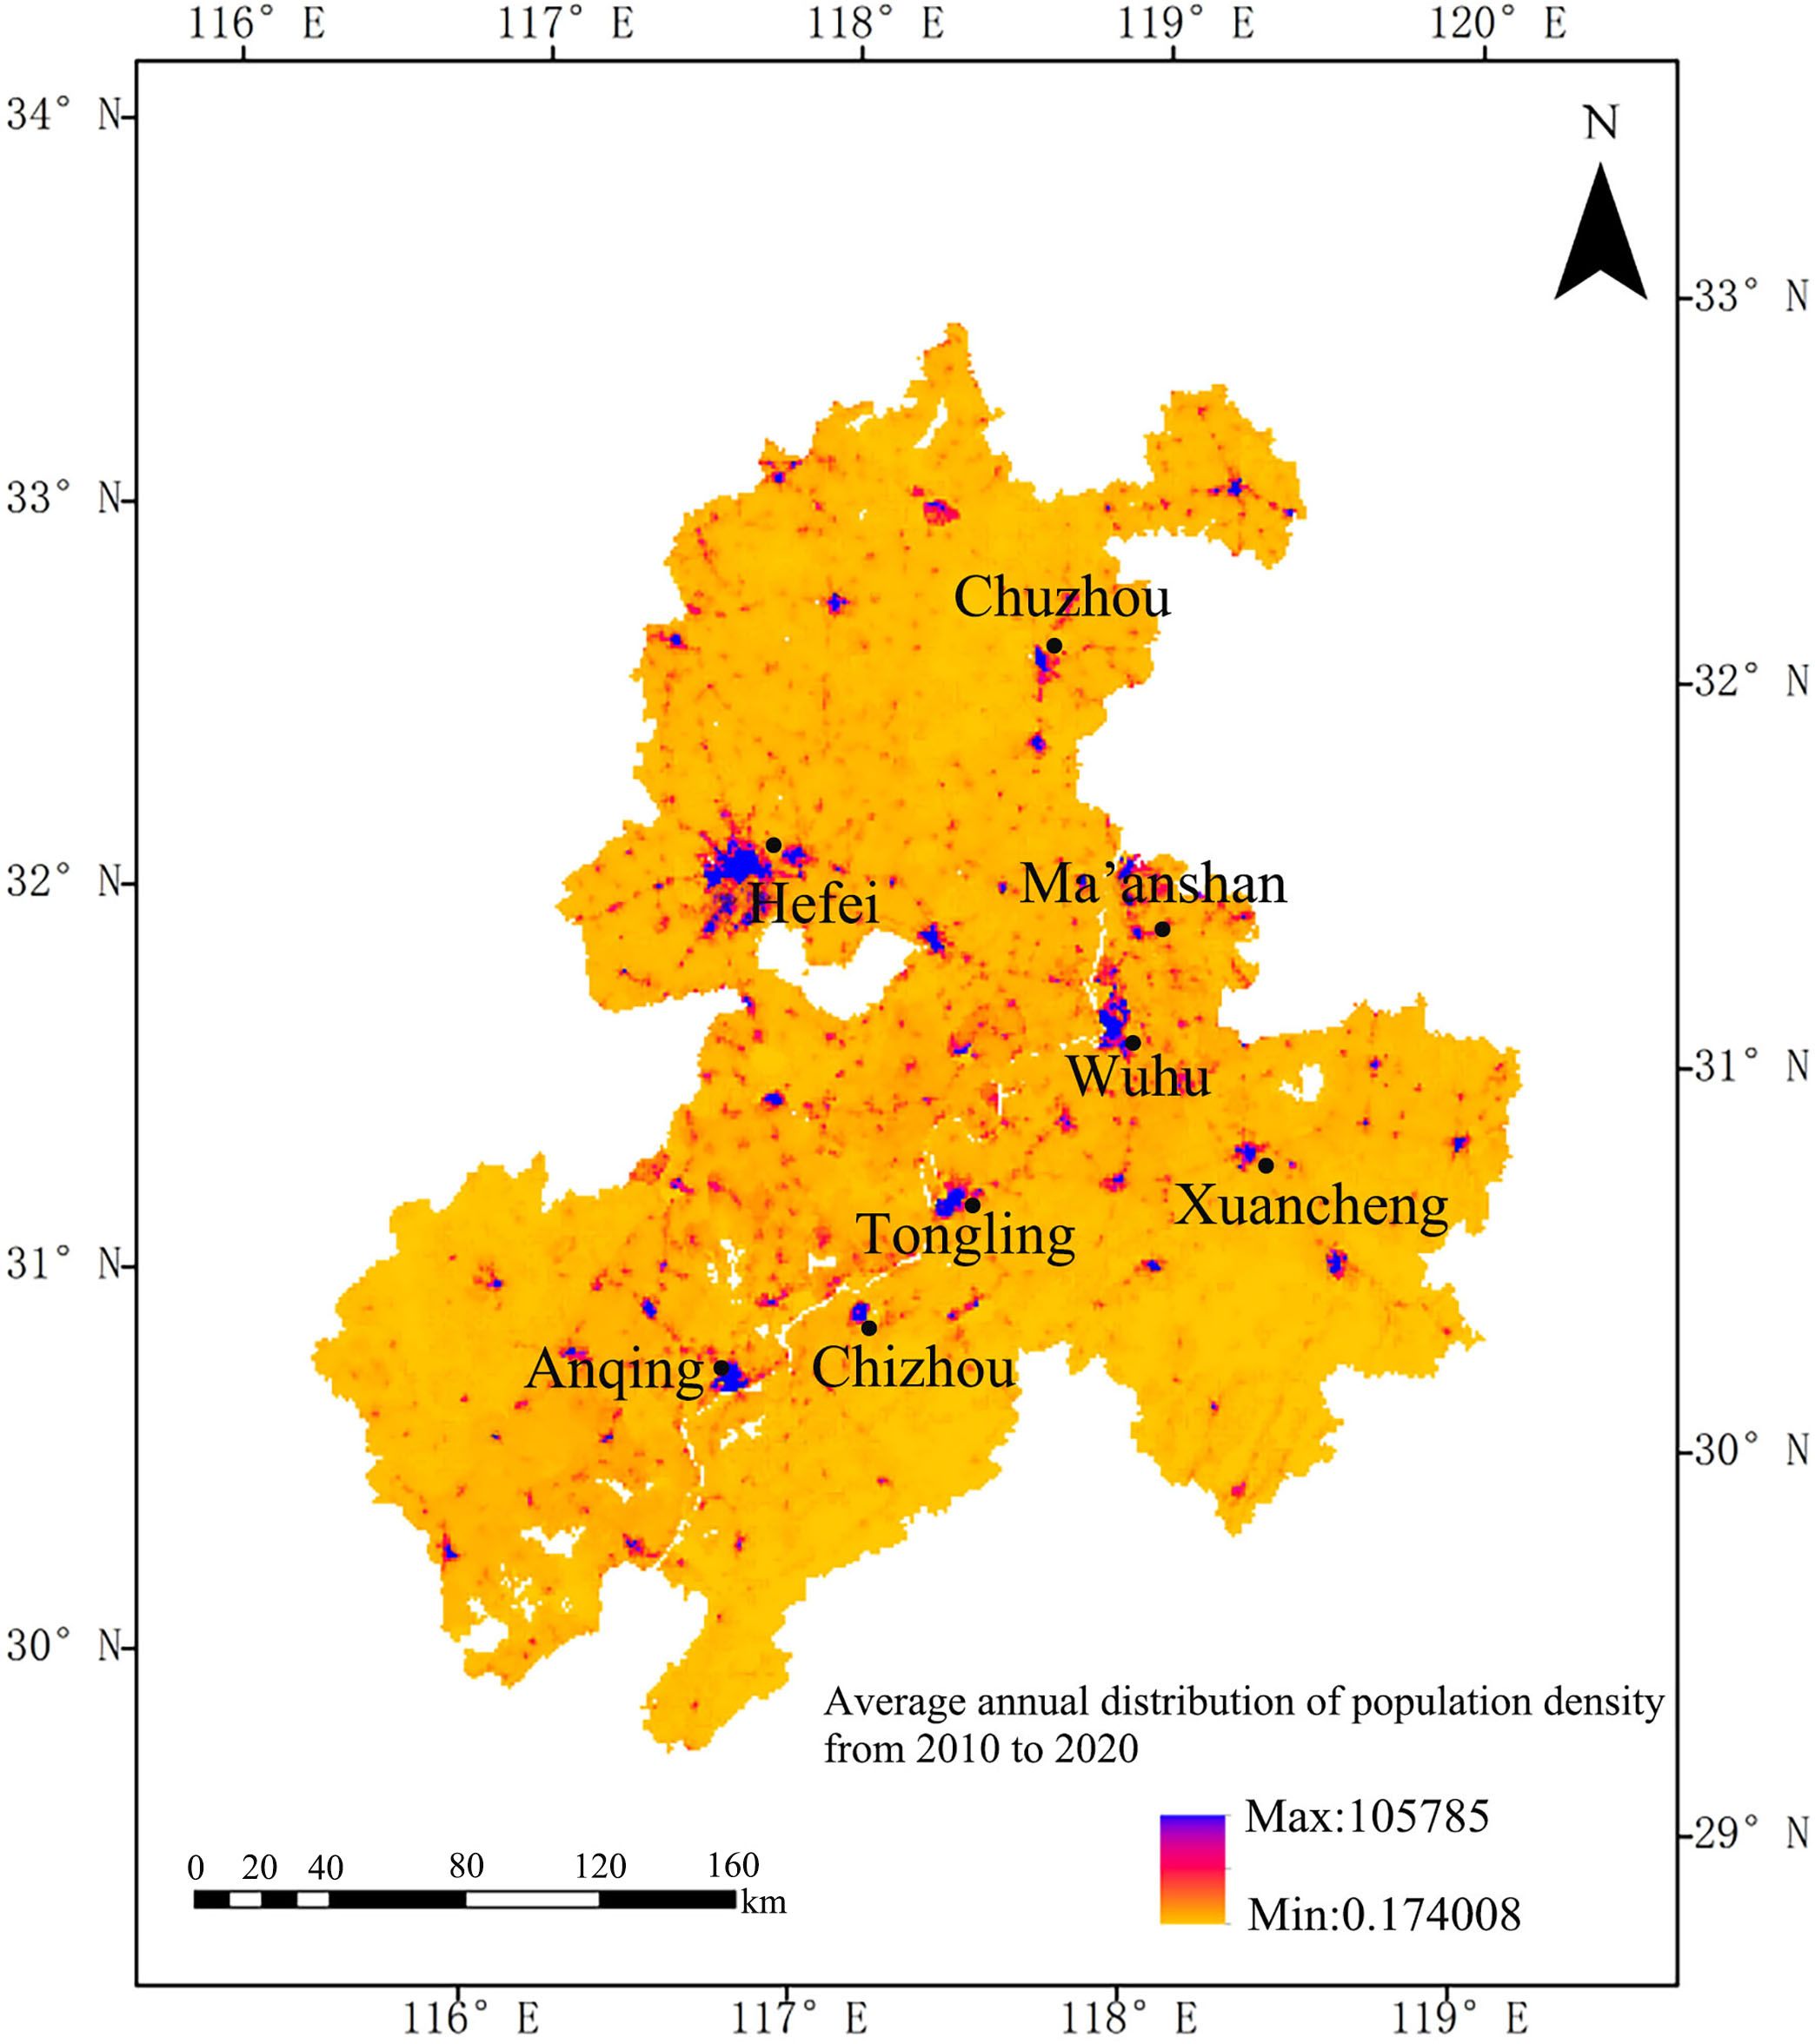
Figure 8. Average annual distribution of population density in the study area from 2010 to 2020.
3.5.5 Analysis of population density by class
The correlation coefficient method is used to study the processed population density data and land use data to ensure that the data from different sources maintain a uniform spatial reference and resolution. ArcMap was used to calculate the relevant population density values for major land use types, and grid calculator and Con function were used to generate a new grid layer for each land use type, as shown in Figure 9, which contained the population density values of various categories.
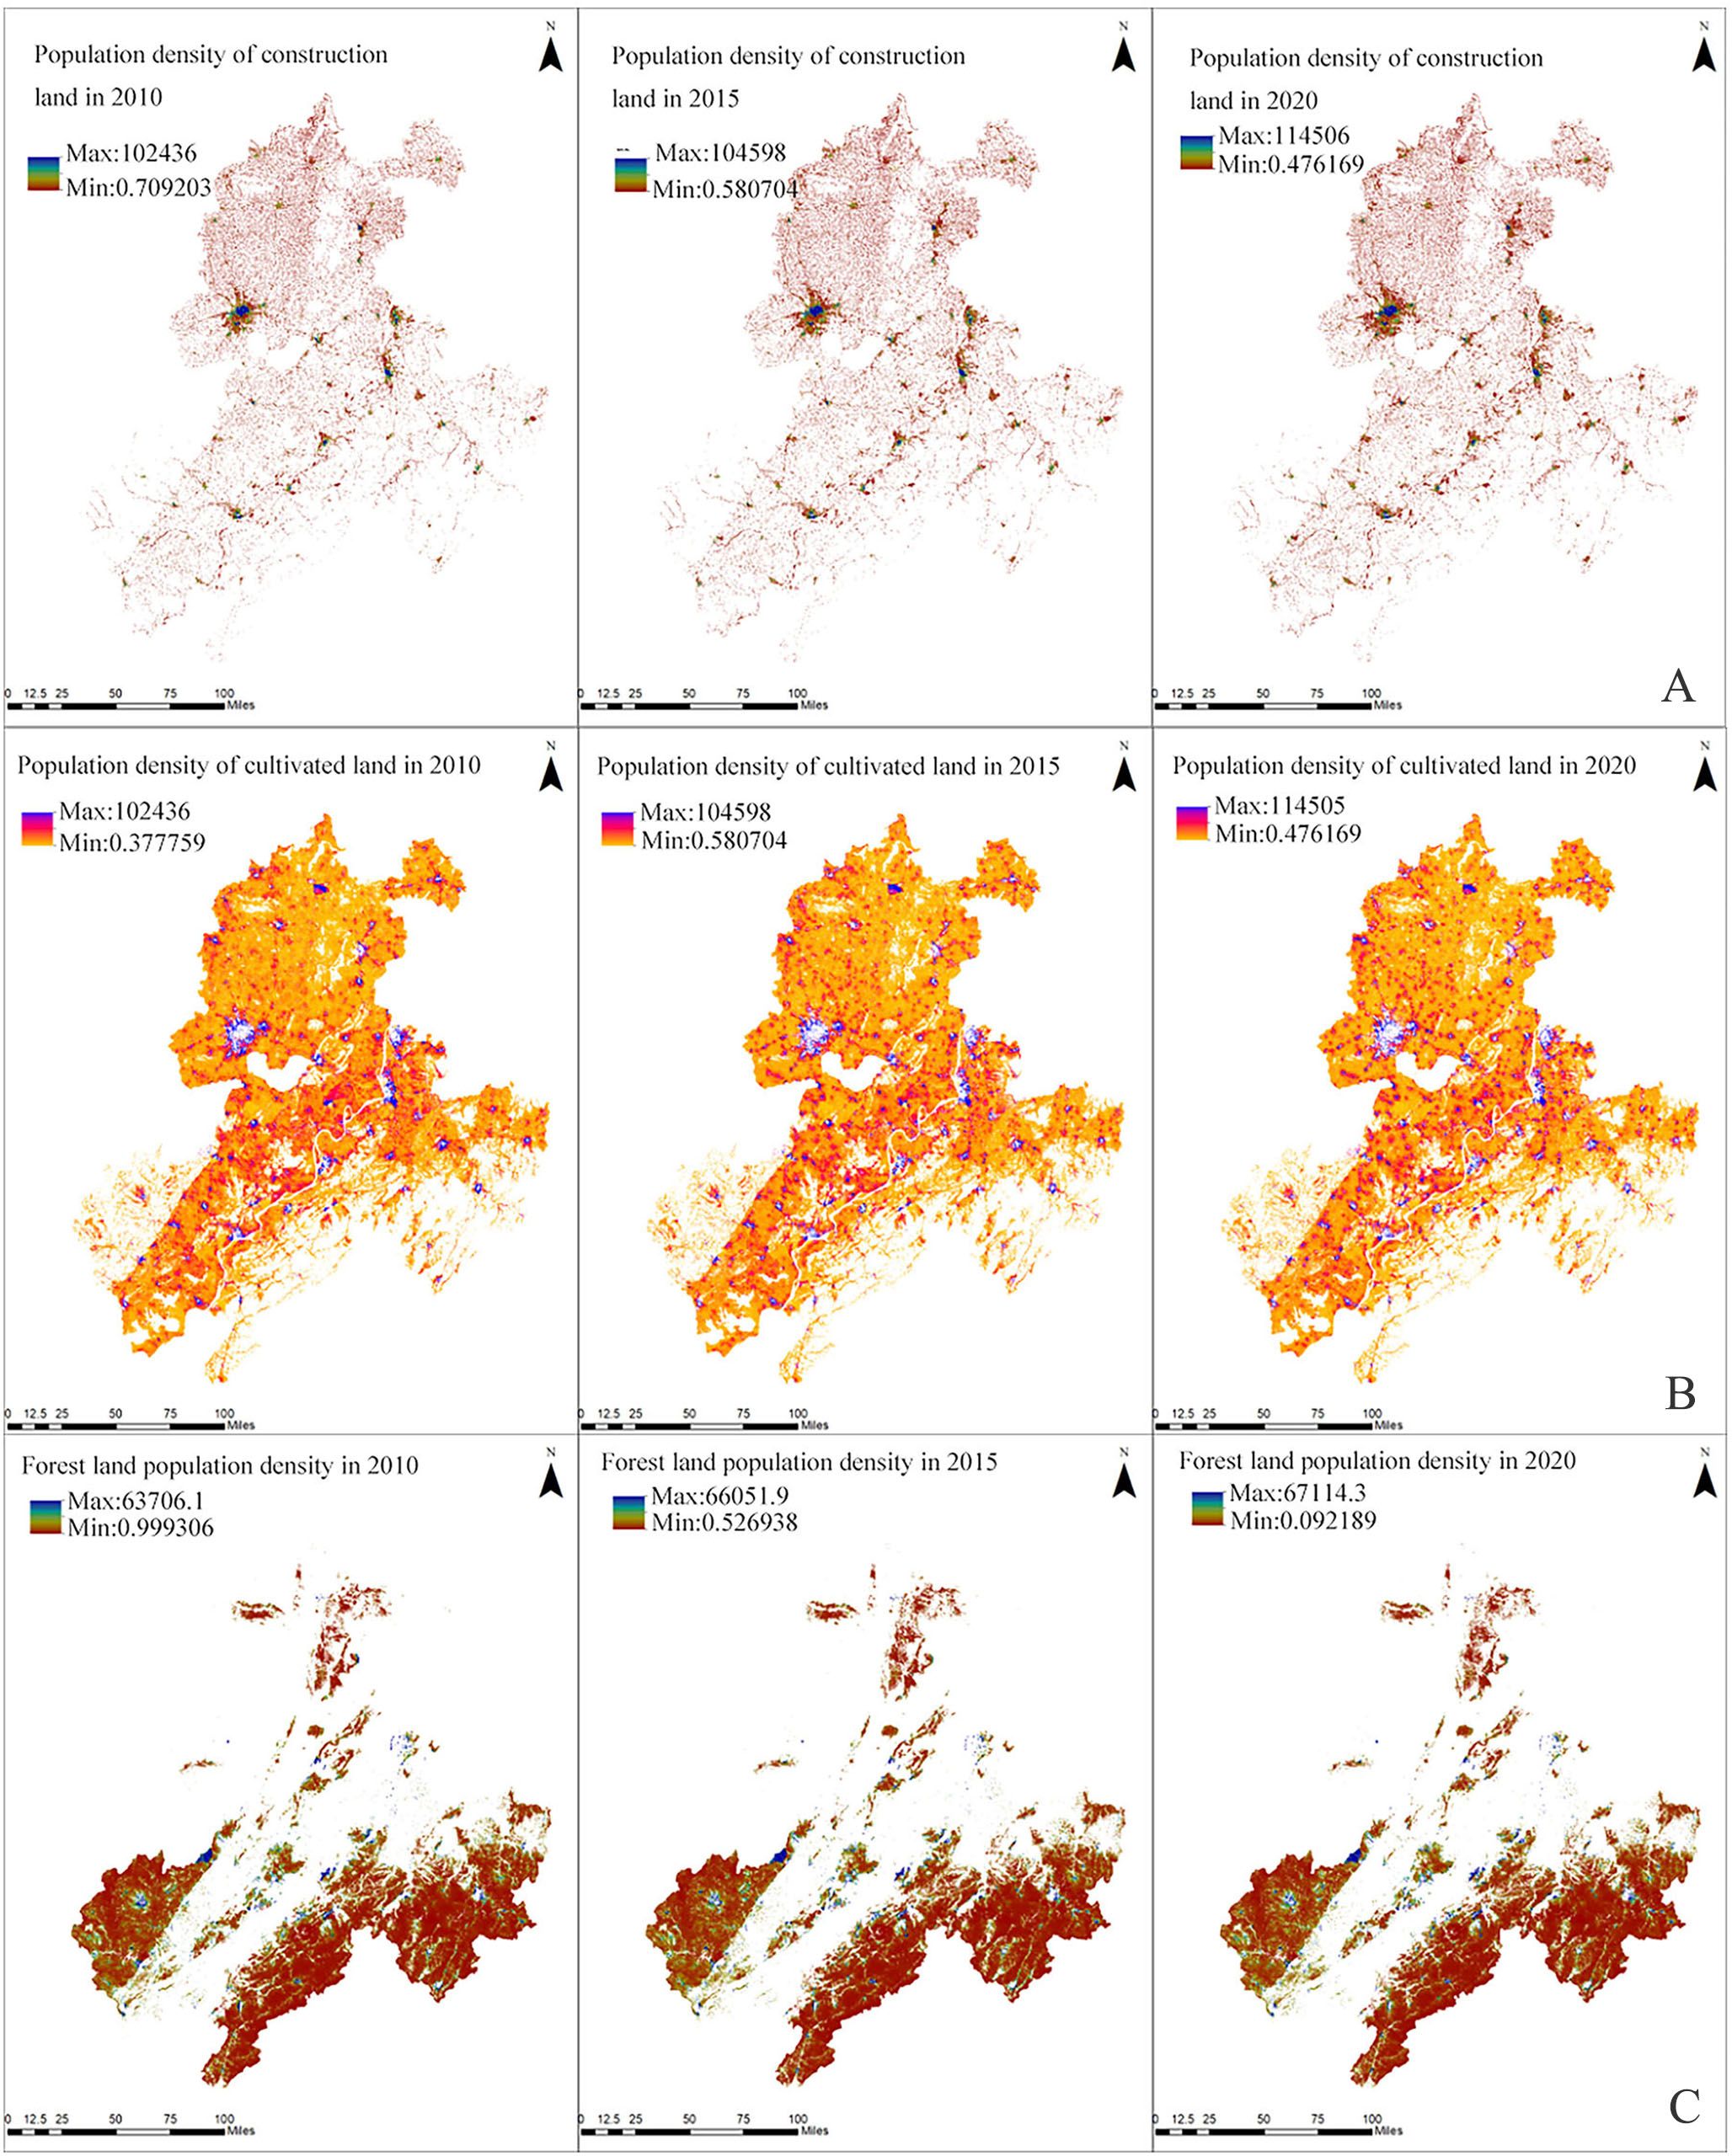
Figure 9. population density in Wanjiang River Basin in 2010, 2015 and 2020: (A) building land; (B) cultivated land; (C) forest land.
The population density of building land cultivated land and forest land within the study period were statistically analyzed respectively. After completing the sectional statistics, it can be seen that the population of cultivated land decreased segment by segment, the population of forest land decreased segment by segment, and the population of building land increased segment by segment.
According to Pearson correlation coefficient analysis, there is obvious mutual transformation between cultivated land area and building land area. The cultivated land area was positively correlated with the population density of cultivated land. There is a negative correlation between the building land area and the cultivated land population, which means that with the transformation of cultivated land into construction land, the population also gathers in cities and towns, and the cultivated land population decreases accordingly. The cultivated land population and the building land population both ebb and flow, but according to the current development situation analysis, more is the rural population to urban population transformation.
4 Discussion
Although the remote sensing ecological index has been proved to be the most effective method for monitoring environmental quality, there are still shortcomings in its application for regions with different characteristics, so many scholars have made corresponding improvements for different regions. For example, Wang Jie et al. proposed the aridity remote sensing ecological index in their study of Ulan Buh Desert, introducing salinity index and land degradation index, replacing the original dryness index, making it more suitable for application in desert areas (Wu et al., 2022); Bai et al. added SMI and CO2 to the original arid zone remote sensing eco-index to construct a revised arid zone remote sensing eco-index (RSEI), which expanded the applicability of RSEI in arid zones (Zongfan et al., 2023). Yuan et al. proposed an improved remote sensing eco-index, incorporating the fact that the atmospheric environment is highly affected by sand and dust, so the indicator characterizing the quality of the atmospheric environment was introduced (Yuan et al., 2021). When studying the Loess Plateau, Shi et al. proposed replacing the vegetation index with a fluorescence remote sensing ecological index constructed by using month-by-month synthesized solar-induced chlorophyll fluorescence data during the vegetation growth period as a monitoring index for the greenness factor in view of the arid and semi-arid characteristics of the region (Shi et al., 2023). Liu et al. proposed a new ecosystem evaluation method, GISEI, based on RSEI to evaluate and predict the ecological quality of the Xi’an region by using the respective advantages of remote sensing and GIS (Liu et al., 2021). All the above are the improvements of RSEI by researchers, and the novelty of this paper is the introduction of NPP index. Many scholars have also developed new remote sensing indices for the characteristics of the study area, for example, Yu et al. investigated the application of environmental ecological indices in urban ecology and created the Ecological Livability Index (EII), which includes greenness, temperature, dryness, humidity and atmospheric turbidity (Yu et al., 2024). Zhang et al. created the Urban Ecological Comfort Index (UECIIMP) to study the urban ecological environment, which consists of four remotely sensed indices, namely greenness, dryness, heat and atmospheric turbidity (Zhang et al., 2023). So future studies can improve on these newly developed remote sensing indices according to local characteristics.
5 Conclusions
This paper analyzed the RSEI data for the last 12 years to get the results of the changes in the quality of the ecological environment, and based on the climate data, NDVI, solar radiation and land use data from 2004 to 2016, this paper estimated the annual NPP in the Wanjiang River Basin according to the CASA model, and then analyzed the spatial distribution and change characteristics, and calculated the correlation coefficient between NPP and population density by using the single linear regression method to obtain the correlation spatial distribution data of the two. The land use data of 2010, 2015 and 2020 were selected, the transformation among different classes was obtained by calculating the dynamic attitude of land use, and the population density of each class was obtained by statistical analysis. Finally, the correlation between the area of each class and the population density was analyzed. The following conclusions are drawn:
From the results of the RSEI model in 2010, 2015 and 2020, it can be found that the mean values of the RSEI index in the study area are 0.166, 0.168 and 0.299 respectively, with an overall improvement and a rapid expansion of the areas with good ecological quality. From 2004 to 2016, the areas where the NPP was in an upward trend were centered in the northern part of the Anhui River Basin in Chuzhou and its surroundings, which indicates that the area has a good ecological environment and potential ecological service functions. Hefei, on the other hand, is in a slight downward trend. The distribution of population density in the Anhui River Basin is remarkable, concentrated in the center of Hefei City, along the river and other urban centers. The areas where NPP is negatively correlated with population density are concentrated in Hefei and Chuzhou, and the areas where it is positively correlated are evenly distributed. The analysis shows that population density has a certain impact on the level of NPP, and the areas with the largest population density growth in Hefei are also the areas with lower spatial distribution of NPP, and with the increase of population density, the NPP also shows a small downward trend. This reflects that Hefei pays attention to ecological protection in its development, but it still needs to be strengthened. There is a significant positive correlation between NPP and population density in places with more frequent agricultural production activities, such as Chizhou and Xuancheng. These areas have undulated terrain and a warm and humid climate, and these natural factors also have some positive impact on NPP and population distribution. The area of high ecological value such as cropland and forest land in the Anhui River Basin has been decreasing year by year, and the area of constructed land has been increasing significantly, leading to a decrease in vegetation cover and a lower NPP of vegetation. The area of construction land is negatively correlated with the area of cultivated land and the population of cultivated land in the Anhui River Basin. NPP in areas with extensive forested land area is perennially at a high level, and the growth rate is not obvious. Hefei City has a decrease in the area of cultivated green land, which leads to a decrease in the level of NPP. With the increase of population density, urban expansion and land development intensified the pressure on the ecological environment. These changes reflect the combined influence of natural and anthropogenic factors on the ecological environment of the Wanjiang region, and the trend of vegetation NPP change in the Wanjiang River basin shows a slightly decreasing level, but the overall NPP of the Wanjiang River basin has remained stable for many years, so the natural evolution has a lesser influence on the ecological environment of the Wanjiang River basin. The influence of anthropogenic factors on the ecological environment of the Anhui River Basin is mainly reflected in the increase in population density, urban development leading to an increase in building land, a decrease in arable land and forests, and the transfer of building land all from arable land and forests. The population of arable land decreases, the population of forest land decreases, and the population of construction land increases. Analysis of the current state of development shows that there has been a greater transfer of rural to urban populations, thus exposing the current problems in the Wanjiang River Basin, such as uneven urbanization development and over-concentration of a small number of densely populated areas.
Data availability statement
The original contributions presented in the study are included in the article/supplementary material. Further inquiries can be directed to the corresponding author.
Author contributions
HW: Methodology, Validation, Writing – original draft. YZ: Conceptualization, Investigation, Software, Writing – review & editing. YJ: Data curation, Writing – review & editing. JY: Funding acquisition, Project administration, Resources, Supervision, Writing – review & editing. QY: Formal analysis, Visualization, Writing – review & editing. QF: Writing – review & editing.
Funding
The author(s) declare financial support was received for the research, authorship, and/or publication of this article. The paper was partially supported by National Natural Science Foundation of China (42271301), Anhui University Excellent Research and Innovation Project (No. 2022AH010094).
Acknowledgments
Authors appreciate the reviewers for their invaluable comments which have led to significant improvement in the paper.
Conflict of interest
The authors declare that the research was conducted in the absence of any commercial or financial relationships that could be construed as a potential conflict of interest.
Publisher’s note
All claims expressed in this article are solely those of the authors and do not necessarily represent those of their affiliated organizations, or those of the publisher, the editors and the reviewers. Any product that may be evaluated in this article, or claim that may be made by its manufacturer, is not guaranteed or endorsed by the publisher.
References
An M., Xie P., He W., Wang B., Huang J., Khanal R. (2022). Spatiotemporal change of ecologic environment quality and human interaction factors in three gorges ecologic economic corridor, based on RSEI. Ecol. Indic. 141, 109090. doi: 10.1016/j.ecolind.2022.109090
Bondeau A., Kicklighter D. W., Kaduk J. (1999). Comparing global models of terrestrial net primary productivity (NPP): Importance of vegetation structure on seasonal NPP estimates. Glob. Change Biol. 5, 35–45. doi: 10.1046/j.1365-2486.1999.00005.x
Boori M. S., Choudhary K., Paringer R., Kupriyanov A. (2021). Spatiotemporal ecological vulnerability analysis with statistical correlation based on satellite remote sensing in Samara, Russia. J. Environ. Manage. 285, 112138. doi: 10.1016/j.jenvman.2021.112138
Cao W., Li R., Chi X., Chen N., Chen J., Zhang H., et al. (2017). Island urbanization and its ecological consequences: A case study in the Zhoushan Island, East China. Ecol. Indic. 76, 1–14. doi: 10.1016/j.ecolind.2017.01.001
Gao T., Xu B., Yang X., Deng S., Liu Y., Jin Y., et al. (2017). Aboveground net primary productivity of vegetation along a climate-related gradient in a Eurasian temperate grassland: spatiotemporal patterns and their relationships with climate factors. Environ. Earth Sci. 76, 1–10. doi: 10.1007/s12665-016-6158-4
García A. A., López E. G., Mendoza M. E. (2011). Three approaches to the assessment of spatio-temporal distribution of the water balance : the case of the Cuitzeo basin, Tres aproximaciones para estimación y distribución espacio-temporal del balance hídrico : el caso de la cuenca de Cuitzeo, Michoacán. Investig. Geográficas Boletín del Inst. Geogr. UNAM 34–55.
Givati A., Gochis D., Rummler T., Kunstmann H. (2016). Comparing one-way and two-way coupled hydrometeorological forecasting systems for flood forecasting in the mediterranean region. Hydrology 3, 19. doi: 10.3390/hydrology3020019
Gong C., Lyu F., Wang Y. (2023). Spatiotemporal change and drivers of ecosystem quality in the Loess Plateau based on RSEI: A case study of Shanxi, China. Ecol. Indic. 155, 111060. doi: 10.1016/j.ecolind.2023.111060
Gu L., Yan J., Li Y., Gong Z. (2023). Spatial–temporal evolution and correlation analysis between habitat quality and landscape patterns based on land use change in Shaanxi Province, China. Ecol. Evol. 13, 1–20. doi: 10.1002/ece3.10657
Guastella G., Pareglio S. (2017). Spatial analysis of urbanization patterns: the case of land use and population density in the Milan metropolitan area. Rev. Urban Reg. Dev. Stud. 29, 89–102. doi: 10.1111/rurd.12060
Hang X., Luo X.-C., Cao Y., Li Y.-C. (2020). [Ecological quality assessment and the impact of urbanization based on RSEI model for Nanjing, Jiangsu Province, China]. Ying yong sheng tai xue bao = J. Appl. Ecol. 31, 219–229. doi: 10.13287/j.1001-9332.202001.030
Hu X., Xu H. (2019). A new remote sensing index based on the pressure-state-response framework to assess regional ecological change. Environ. Sci. pollut. Res. 26, 5381–5393. doi: 10.1007/s11356-018-3948-0
Ji J., Jiang L., Sheng T., Chen Y., Zhang R. (2023). Study on the response relationship between land use and eco-environmental quality - a case study of Jing-Jin-Ji urban agglomeration. IOP Conf. Ser. Earth Environ. Sci. 1171. doi: 10.1088/1755-1315/1171/1/012067
Jiang F., Zhang Y., Li J., Sun Z. (2021). Research on remote sensing ecological environmental assessment method optimized by regional scale. Environ. Sci. pollut. Res. 28, 68174–68187. doi: 10.1007/s11356-021-15262-x
Jiang H., Fan G., Zhang D., Zhang S., Fan Y. (2022). Evaluation of eco-environmental quality for the coal-mining region using multi-source data. Sci. Rep. 12, 1–19. doi: 10.1038/s41598-022-09795-5
Jing Y., Zhang F., He Y., Kung H.-T., Johnson V. C., Arikena M. (2020). Assessment of spatial and temporal variation of ecological environment quality in Ebinur Lake Wetland National Nature Reserve, Xinjiang, China. Ecol. Indic. 110, 105874. doi: 10.1016/j.ecolind.2019.105874
Ju W., Gao P., Wang J., Zhou Y., Zhang X. (2010). Combining an ecological model with remote sensing and GIS techniques to monitor soil water content of croplands with a monsoon climate. Agric. Water Manage. 97, 1221–1231. doi: 10.1016/j.agwat.2009.12.007
Kang S. Y. (2024). Carbon emission analysis of Chengdu City based on landscape pattern and remote sensing ecological index [J]. J. Hunan Univ. Technol. 38(2), 75–84. doi: 10.3969/j.issn.1673-9833.2024.02.011
Lei H., Yang D., Lokupitiya E., Shen Y. (2010). Coupling land surface and crop growth models for predicting evapotranspiration and carbon exchange in wheat-maize rotation croplands. Biogeosciences 7, 3363–3375. doi: 10.5194/bg-7-3363-2010
Liu P., Zhang X., Ma C., Zhang H., Han R., Lu X. (2021). Ecological security assessment based on remote sensing and landscape ecology model. J. Sensors 2021. doi: 10.1155/2021/6684435
Luo S., Mao Q., Ma K., Wu J. (2012). A review of carbon cycling and sequestration in urban soils. Shengtai Xuebao/ Acta Ecol. Sin. 32, 7177–7189. doi: 10.5846/stxb201110091478
Maloney K. O., Krause K. P., Buchanan C., Hay L. E., McCabe G. J., Smith Z. M., et al. (2020). Disentangling the potential effects of land-use and climate change on stream conditions. Glob. Change Biol. 26, 2251–2269. doi: 10.1111/gcb.14961
Ning L., Jiayao W., Fen Q. (2020). The improvement of ecological environment index model RSEI. Arab. J. Geosci. 13. doi: 10.1007/s12517-020-05414-7
Rai M. K., Paudel B., Zhang Y., Nepal P., Khanal N. R., Liu L., et al. (2023). Appraisal of empirical studies on land-use and land-cover changes and their impact on ecosystem services in Nepal Himalaya. Sustain. 15. doi: 10.3390/su15097134
Schloss A. L., Kicklighter D. W., Kaduk J., Wittenberg U. (1999). Comparing global models of terrestrial net primary productivity (NPP): Comparison of NPP to climate and the Normalized Difference Vegetation Index (NDVI). Glob. Change Biol. 5, 25–34. doi: 10.1046/j.1365-2486.1999.00004.x
Shan W., Jin X., Ren J., Wang Y., Xu Z., Fan Y., et al. (2019). Ecological environment quality assessment based on remote sensing data for land consolidation. J. Clean. Prod. 239, 118126. doi: 10.1016/j.jclepro.2019.118126
Shi M., Lin F., Jing X., Li B., Shi Y., Hu Y. (2023). Ecological environment quality assessment of arid areas based on improved remote sensing ecological index—A case study of the loess plateau. Sustain. 15. doi: 10.3390/su151813881
Vačkář D., Chobot K., Orlitová E. (2012). Spatial relationship between human population density, land use intensity and biodiversity in the Czech Republic. Landsc. Ecol. 27, 1279–1290. doi: 10.1007/s10980-012-9779-3
Venkatesh B., Velkennedy R. (2024). Spatial assessment on influence of land use and population density in the achievement score of sustainable development target 11.1. Sustain. Dev. 32, 381–391. doi: 10.1002/sd.2665
Wang Q., Zhang T., Yi G. H., Chen T. T., Bie X. J., He Y. X. (2017). Tempo-spatial variations and driving factors analysis of net primary productivity in the Hengduan mountain area from 2004 to 2014. Shengtai Xuebao 37, 3084–3095. doi: 10.5846/stxb201602030248
Wu S., Gao X., Lei J., Zhou N., Guo Z., Shang B. (2022). Ecological environment quality evaluation of the Sahel region in Africa based on remote sensing ecological index. J. Arid Land 14, 14–33. doi: 10.1007/s40333-022-0057-1
Xi H., Feng Q., Cheng W., Si J., Yu T. (2022). Spatiotemporal variations of Alxa national public welfare forest net primary productivity in northwest China and the response to climate change. Ecohydrology 15. doi: 10.1002/eco.2377
Xiong Y., Xu W., Lu N., Huang S., Wu C., Wang L., et al. (2021). Assessment of spatial–temporal changes of ecological environment quality based on RSEI and GEE: A case study in Erhai Lake Basin, Yunnan province, China. Ecol. Indic. 125, 107518. doi: 10.1016/j.ecolind.2021.107518
Xu H. Q. (2013). A remote sensing urban ecological index and its application. Shengtai Xuebao/ Acta Ecol. Sin. 33, 7853–7862. doi: 10.5846/stxb201208301223
Xu X., Yuan J., Yu Q. (2023). A study on water rights allocation in transboundary rivers based on the transfer and inequality index of virtual water. Water 15, 2379. doi: 10.3390/w15132379
Yang X., Bai Y., Che L., Qiao F., Xie L. (2021). Incorporating ecological constraints into urban growth boundaries: A case study of ecologically fragile areas in the Upper Yellow River. Ecol. Indic. 124, 107436. doi: 10.1016/j.ecolind.2021.107436
Yang X., Meng F., Fu P., Wang Y., Liu Y. (2022). Time-frequency optimization of RSEI: A case study of Yangtze River Basin. Ecol. Indic. 141, 109080. doi: 10.1016/j.ecolind.2022.109080
Yu J., Li X., Guan X., Shen H. (2024). A remote sensing assessment index for urban ecological livability and its application. Geo-Spatial Inf. Sci. 27, 289–310. doi: 10.1080/10095020.2022.2072775
Yuan B., Fu L., Zou Y., Zhang S., Chen X., Li F., et al. (2021). Spatiotemporal change detection of ecological quality and the associated affecting factors in Dongting Lake Basin, based on RSEI. J. Clean. Prod. 302, 126995. doi: 10.1016/j.jclepro.2021.126995
Yuan J., Niu Z., Wang C. (2006). Vegetation NPP distribution based on MODIS data and CASA model - A case study of northern Hebei Province. Chin. Geogr. Sci. 16, 334–341. doi: 10.1007/s11769-006-0334-5
Yue H., Liu Y., Li Y., Lu Y. (2019). Eco-environmental quality assessment in China’s 35 major cities based on remote sensing ecological index. IEEE Access 7, 51295–51311. doi: 10.1109/ACCESS.2019.2911627
Zhang G., Kang Y., Han G., Sakurai K. (2011). Effect of climate change over the past half century on the distribution, extent and NPP of ecosystems of Inner Mongolia. Glob. Change Biol. 17, 377–389. doi: 10.1111/j.1365-2486.2010.02237.x
Zhang H., Liu Y., Li X., Feng R., Gong Y., Jiang Y., et al. (2023). Combing remote sensing information entropy and machine learning for ecological environment assessment of Hefei-Nanjing-Hangzhou region, China. J. Environ. Manage. 325, 116533. doi: 10.1016/j.jenvman.2022.116533
Zhang T., Yang R., Yang Y., Li L., Chen L. (2021). Assessing the urban eco-environmental quality by the remote-sensing ecological index: Application to Tianjin, North China. ISPRS Int. J. Geo-Information 10. doi: 10.3390/ijgi10070475
Zhu W., Pan Y., He H., Yu D., Hu H. (2006). Simulation of maximum light use efficiency for some typical vegetation types in China. Chin. Sci. Bull. 51, 457–463. doi: 10.1007/s11434-006-0457-1
Keywords: Wanjiang River Basin, net primary productivity (NPP) of vegetation, land use, population density, ecological assessment
Citation: Wang H, Zhang Y, Jia Y, Zhang Q, Yuan J and Yuan Q (2024) Influence factors of ecological environment in Wanjiang River Basin based on RSEI and CASA models. Front. Ecol. Evol. 12:1422712. doi: 10.3389/fevo.2024.1422712
Received: 24 April 2024; Accepted: 31 July 2024;
Published: 21 August 2024.
Edited by:
Fernanda Michalski, Universidade Federal do Amapá, BrazilCopyright © 2024 Wang, Zhang, Jia, Zhang, Yuan and Yuan. This is an open-access article distributed under the terms of the Creative Commons Attribution License (CC BY). The use, distribution or reproduction in other forums is permitted, provided the original author(s) and the copyright owner(s) are credited and that the original publication in this journal is cited, in accordance with accepted academic practice. No use, distribution or reproduction is permitted which does not comply with these terms.
*Correspondence: Jing Yuan, MTU0NDI3QHRsdS5lZHUuY24=